Abstract
Regional planning and development of urban agglomerations such as the Beijing-Tianjin-Hebei Region, the Yangtze River Delta, the Guangdong-Hong Kong-Macao Greater Bay Area and the Chengdu-Chongqing Twin Cities provide a good opportunity for fire rescue across administrative regions. This study is aimed at investigating the optimization technology of cross-regional synergistic deployment of fire stations. To achieve this aim, with the Yangtze River Delta integrated demonstration zone taken as the research object, urban fire risk was assessed by means of range standardization, iterative equations and expert scoring and weighting on the basis of population density, road density, water source distribution and urban POI data and urban remote sensing images. Besides, different fire response times were set with reference to the classified regional fire risk levels. Furthermore, the status of fire stations was evaluated based on the coverage-maximized model, and the cross-regional synergistic deployment of fire stations was optimized based on the facility point-minimized model. Finally, the deployment was tested using the maximized coverage rate. The following results were obtained: High-risk regions are mainly distributed in areas with dense population and high-rise buildings. The fire station coverage rates of single administrative regions are all lower than 80%; in contrast, 31 more regions are covered under cross-regional synergistic deployment. Based on the facility point minimization model and the maximum coverage model, on the basis of retaining the existing fire stations, when 17 new fire stations are built, 90% of the high-risk fire areas in the study area can be covered within 3 min, and the coverage of medium-risk areas and low-risk areas can be increased to 70%, which can better meet the fire risk prevention and control needs of the Yangtze River Delta integrated demonstration area.
1. Introduction
The healthy, sustainable and coordinated development of urban agglomerations has gradually become the leading force for sustainable economic and social development in China [1]. Two or more cities break through the constraints of administrative divisions, embracing the free flow and optimal allocation of development elements and resources between them. By doing so, an overall effect of complementary advantages and common prosperity is formed. However, the increasingly complex urban structure also brings new challenges to the layout of public emergency stations [2] such as fire stations and emergency centers [3]. The Yangtze River Delta region, as a pilot area for integrated development of super-large urban agglomerations [4], has unique advantages and actual needs in terms of industrial coordination [5], cross-regional policies [6], synergistic risk response [7], etc. It is meaningful to study the optimization technology of cross-regional synergistic deployment of fire stations in the region.
Scientific assessment of urban fire risk and construction of a reasonable mathematical model are important factors in the deployment of fire stations [8,9,10]. Kiran et al. [11] analyzed regional fire risk through small-area population prediction and found the firefighting force gap based on the coverage-maximized model. Shahrooz et al. [12] combined the location allocation model with the geographic information system (GIS) to re-plan the optimal location of fire stations, raising the coverage rate within a 5-min response time from 81% to 95%. After evaluating the similarity of disaster types, the exposure of disaster environment and the probability of disaster consequences, Liu [13] proposed the model and procedure of urban fire disaster risk assessment to determine the disaster risk level. Ming et al. [14] proposed a mixed integer linear programming model by taking vehicle coverage and time coverage as indicators. Besides, they demonstrated the relationship among vehicle coverage ratio, time coverage ratio, number of fire stations, number of fire trucks, FPTVC and total budget through case analysis and multiple sensitivity analysis on historical data in Hefei City. Wang et al. [15] proposed an ArcGIS-based method to determine the spatial distribution of urban fire risk according to the various POIs, historical fire accident data and expert judgment. Against the backdrop of big data, geographic information data can effectively transmit information such as the name, longitude and latitude coordinates and street address information of geographic entities, and then deploy fire stations through the “location-allocation” model. Based on 443,400 pieces of POI data and relevant data like road network, Wang et al. [16] evaluated the spatial distribution of fire risk within the Fifth Ring Road in Beijing City using the SAVEE model and the expert scoring method. In addition, they obtained the final optimization results of fire stations in the research area on the basis of coverage-maximized, facility point-minimized and impedance-minimized model algorithms. Based on 34,035 POI data in a district of Wuhan City, Jiang et al. [17] divided the city into flammable and explosive areas, vulnerable population areas, densely populated areas, key protected areas and general risk areas, and evaluated the appropriate areas for deploying fire stations using the analytic hierarchy process. Considering that the surface light intensity information recorded by nighttime light images can reflect the basic characteristics of human social and economic activities, Wang et al. [18] assessed the fire risk in Hefei City by combining the POI data and the NPP/VIIRS nighttime light image data. Meanwhile, the layout of fire stations is closely related to the specified fire response time. In the United States, it is stipulated that the layout of fire stations shall ensure that the driving time for occupational fire stations does not exceed 4 min [19] and the response times of volunteer fire stations vary according to different fire grades [20]. In the United Kingdom, the fire brigade area is divided into six categories, i.e., A, B, C, D, remote areas and special risk areas, according to a uniformly used risk grading method, and the response time is also determined according to the risk level. In China, the layout of fire stations mainly is stipulated in Standard for Construction of Urban Fire Stations [21], as follows: the location is determined according to the principle that fire trucks can reach the edge of the jurisdiction within 4 min. However, with the rapid construction and irregular expansion of cities, the layout of existing fire stations is faced with indirect problems such as insufficient fire fighting forces in high-risk fire areas like densely populated old urban areas [22] and redundant fire fighting forces in low-risk areas like new urban areas with scattered buildings [23]. Scholars all over the world have proposed different response times concerning varying risk levels. With Istanbul as the research object, Başar et al. [24] proposed a risk-based dynamic multi-coverage fire station location planning model which divided the response time into four levels: 5 min, 8 min, 10 min and 15 min. Such a model can scientifically and reasonably deploy firefighting forces. He et al. [25] proposed a method for evaluating the layout of urban fire stations which specified the response times of 3 min, 5 min, 8 min and 10 min in accordance with four assessed fire risk levels A, B, C and D, respectively. The evaluation results can be tested by three indicators, i.e., the response coverage rate, cross-response coverage rate and average response time of fire stations. Existing researches are primarily focused on the coverage of fire station planning and site optimization in a single city, while the research on the layout of fire stations across administrative boundaries in urban agglomerations is rarely reported.
This study proposes a method that integrates multi-city geographic information and expert scoring evaluation to comprehensively deploy fire stations. The method can effectively promote regional fire rescue coverage, shorten fire response time, reduce fire rescue costs, and decrease fire rescue losses. The research results are expected to provide a theoretical basis for the optimization of urban fire station location in the Yangtze River Delta integrated demonstration zone (YRDIDZ).
2. Selection of Research Area and Acquisition of Basic Data
2.1. YRDIDZ
The Yangtze River Delta is not only the most dynamic, economically advanced and urbanized area in China [26], but also an important intersection area of the Belt and Road Initiative and the Yangtze River Economic Belt. The integrated regional development of the Yangtze River Delta has become a national strategy [27]. Outline of the Integrated Regional Development of the Yangtze River Delta clearly identifies Qingpu District in Shanghai, Wujiang District in Jiangsu and Jiashan County in Zhejiang as the demonstration zone of green and integrated ecological development of the Yangtze River Delta, providing strong support for regional policy formulation and synergistic firefighting and rescue there. General Plan for Territorial Space of the Demonstration Zone of Green and Integrated Ecological Development of the Yangtze River Delta published in June 2020 proposed to integrate the “two districts and one county” whose total administrative area reaches over 2300 km2 for territorial space planning. In this study, the demonstration zone of green and integrated ecological development of the Yangtze River Delta is selected as the research area, and its geographical location is illustrated in Figure 1.
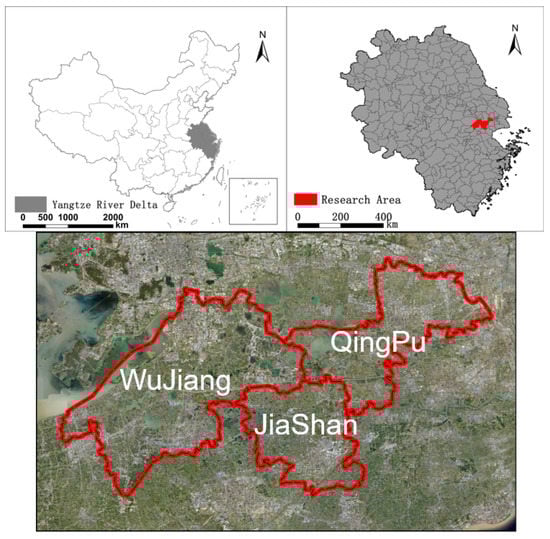
Figure 1.
Demonstration zone of green and integrated ecological development of the Yangtze River Delta.
2.2. Multi-Source Basic Data
Basic data of the research area include road network data, POI location data, spatial distribution data of fire stations, remote sensing image data of administrative areas and population density data. Among them, network road data come from Open Street Map, a geographic database of open roads. POI location data are retrieved by calling AMAP API through Python programming. Spatial distribution data of fire stations are obtained from the AMAP open platform, and the primary and secondary fire stations and the special service stations are selected through a comparison of fire fighting forces of urban fire stations. Remote sensing image data of administrative areas and population density data come from the AMAP image data and the spatial distribution of China’s population in 2020, respectively.
3. Regional Fire Risk Assessment and Fire Station Location Optimization Process
In this study, the layout of cross-regional fire stations was optimized with the aid of ArcGIS based on the assessment of regional fire risk and the evaluation of fire station layout. The optimization flowchart is presented in Figure 2. First, the POI points collected in the research area were classified according to different fire risk factors. Meanwhile, considering population density, road density and water source distance, the regions with fire risk were weighted on the ground of range standardization, iterative formula and expert scoring, and the fire risk in the research area was divided into three levels (high risk, medium risk and low risk) using the natural break method. Furthermore, the response time of fire stations was specified in accordance with the fire risk level, and the respective fire station coverage rates of Qingpu District, Wujiang District and Jiashan County and the overall fire station coverage rate of the YRDIDZ were investigated using the coverage-maximized model in ArcGIS. Finally, two optimization schemes were proposed according to the facility-minimized model, and their coverage rates were compared. In this way, an optimization strategy for the spatial distribution of fire stations was formulated for cities in the YRDIDZ.
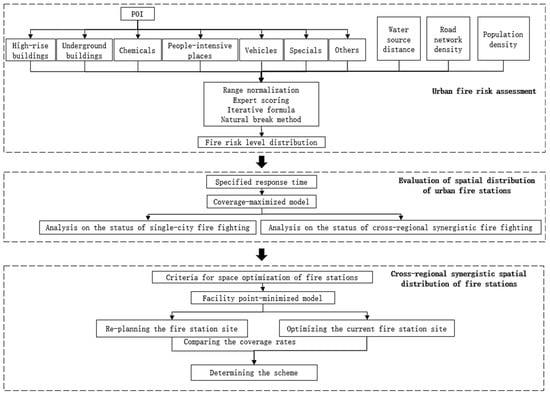
Figure 2.
Flowchart of spatial distribution optimization of urban fire stations.
3.1. Regional Fire Risk Assessment
3.1.1. Regional Fire Risk Assessment Indicators
- (1)
- Road density: It refers to the ratio of the total mileage of the road network to the area of the region in a certain region. Areas with complex roads are often accompanied by frequent population activities, and road density is positively correlated with the frequency of fires [28].
- (2)
- Population density: It refers to the number of people in a unit area [29], and it is positively correlated with the probability of fire occurrence.
- (3)
- Water source distance: When a fire occurs, water source is a favorable factor in fire rescue [30].
- (4)
- POI: It reflects both the nature of urban land and the density of urban buildings. According to Regulations on Fire Alarm and Emergency Rescue Grading (Trial) issued by Fire Department of Ministry of Public Security of China, fire alarms are divided into those for ordinary buildings, high-rise buildings, underground buildings, places with flammable and explosive dangerous goods, etc. According to the similarity criteria, all POIs are classified into seven categories: high-rise buildings, underground buildings, chemicals, people-intensive places, vehicles, specials and others. The specific classification is listed in Table 1.
 Table 1. Classification of fire risk distribution POI.
3.1.2. Weighted Normalization
Considering their different meanings and dimensions, the selected fire risk factor indicators are not directly applicable to urban fire risk assessment. Hence, it is necessary to standardize the indicators for the purpose of resolving the incomparability among indicators. The four primary indicators and seven secondary indicators selected in this study can be divided into positive factors and negative factors. The factors that promote the occurrence of urban fires are positive factors (including road density, population density and various POIs), which are standardized using Formula (1). Instead, the factor that conduces to urban firefighting is a negative factor (namely water source distance), which is calculated using Formula (2).
The range normalization method was adopted for indicator normalization. Its formulas are [31]:
where W is the standardized value; is the actual value of the indicator; is the maximum value of the indicator; is the minimum value of the indicator.
Considering that various factors influence the fire risk to varying extents, expert scoring is adopted to weight each indicator. The weighted standardized factors are substituted into iterative Formula (3) for pairwise operations until all factors are involved in the calculation.
where and are the standardized values of A and B after weighting; is the superimposed value of A and B after weighting.
3.1.3. Kernel Density Analysis
Kernel density analysis mainly aims to calculate the data aggregation status of the entire region based on the known point or line element data. The resultant continuous density surface can reflect the relative concentration of spatial distribution of element data [32]. Places with dense points correspond to high probability of occurrence of events, while those with sparse points are of low possibility. The formula for this general model is [33]
where is the kernel density calculation function at the spatial position s; h is the search radius; n is the number of elements whose distance from the spatial position s is smaller than or equal to h; k is the spatial weight function.
The natural break method is a grading method that can properly group approximate values by identifying intervals in the database for the purpose of maximizing data differentiation. After Kernel density analysis, a continuous density surface is formed in the research area. In this case, the application of the natural break method for classification is expected to identify the fire risk areas with obvious differences in fire risk levels.
3.2. Evaluation on Spatial Layout of Urban Fire Stations
3.2.1. Evaluation Criteria for Spatial Layout of Urban Fire Stations
The optimization of spatial layout of urban fire stations is analyzed primarily in the hope pf achieving efficient and reasonable allocation of fire rescue forces. In this study, it is put forward that the driving times for the in high-risk regions, medium-risk regions and low-risk regions in the YRDIDZ should be shorter than 3 min, 5 min and 8 min, respectively.
According to Article 47 of the Fire Prevention Law of the People’s Republic of China, fire engines and fire boats shall not be subjected to the restrictions of the speed, routes and directions of driving and navigating as well as direction signals while on their way to the execution of missions of fire extinguishment or removal of danger and rescue operations in other disasters and accidents. In this study, the driving speed of fire vehicles is set as 60 km/h.
3.2.2. Urban Road Data Processing
The roads obtained from Open Street Map belong to multi-level two-way ones, including non-motor vehicle lanes, pedestrian roads, crossing errors, and broken junctions. Motor vehicle roads such as trunk roads and branch roads are screened out, and two-way roads are converted into one-way roads by extracting the centerline in order to reduce invalid calculation. Moreover, road intersections, dead ends, overlaps and other errors are checked based on topology for modification.
3.2.3. Coverage-Maximized Model
The coverage-maximized model is one of the generally adopted methods for checking the coverage of fire stations, police stations and ERS monitoring centers in the “location-allocation” model. The model can make demand points fall within the service range of facility points to the maximum extent within the specified impedance. The model gives priority to the allocation of the nearest facility point, and it will not allocate other facility points when a facility point is able to serve the demand point. The formula for this general model is [34]:
where i is all the demand targets; j is all the potential facility locations; P is the number of facility points. If the facility point is allocated at Location j, then Xj equals 1; otherwise, it equals 0. If the demand point can be covered, then Yi equals 1; otherwise, it equals 0. ai is the allocation weight, and Formula (5) maximizes the coverage of demand; Formula (6) indicates whether a demand point is served by one or more facility points; Formula (7) indicates the number of facility points selected.
3.3. Optimization of Cross-Regional Synergistic Deployment of Cross-Regional Fire Stations
3.3.1. Facility Point-Minimized Model
The facility point-minimized model, whose scope of use is the same as that of the coverage-maximized model, ensures that all fire stations cover as many demand points as possible in a given time period while minimizing the total number of fire stations. The formula for this general model is [35]:
where Q is all the demand points; is the allocation weight. The purpose of Formula (10) is to minimize the number of necessary facilities, and Formula (11) is constrained to have at least one facility point.
3.3.2. Optimization Scheme
In the selection of a candidate location for a fire station, full consideration should be given to nearby facilities such as hospitals, schools, kindergartens, nurseries, theaters, shopping malls, sports venues and exhibition halls, as well as units with hazardous chemicals. On the premise of maximizing the coverage of high-risk regions in the research area, the distribution of newly built fire stations is explored and the coverage of medium- and low-risk regions is analyzed.
4. Status Analysis and Layout Optimization of Fire Stations
4.1. Results of Fire Risk Assessment
The ranges of primary and secondary indicators of urban fire risk are standardized. Subsequently, since different factors may exert varying effects on the fire risk, experts are invited to weight them according to the actual situation of urban fire risk in the research area (Table 2). Afterwards, the weighted indicators are brought into the iterative formula to calculate the fire risk distribution in the research area (Figure 3). Specifically, the research area is divided into 1935 regions which are then classified into three levels (163 high-risk regions, 539 medium-risk regions and 1233 low-risk regions) using the natural break classification method.
Table 2.
Fire risk indicators and weights.
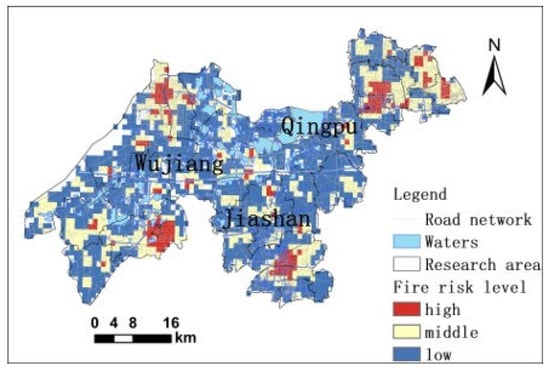
Figure 3.
Distribution of fire risk levels in the YRDIDZ.
From the perspective of spatial distribution, the northeast, northwest, southeast and southwest areas witness medium- and high-risk regions, that is, these regions are highly susceptible to fires. A large number of low-risk regions exist in the central area. From the perspective of risk level, high-risk regions are mainly concentrated in Yingpu Street and Xujing Town of Qingpu District, Wujiang Economic Development Zone and Oriental Silk Market of Wujiang District and Huimin Street of Jiashan County. These regions are densely populated and contain numerous high-rise buildings, hazardous chemical enterprises and underground buildings, featuring fire proneness, considerable fire losses and poor fire rescue conditions. Medium-risk regions mainly include the periphery of high-risk regions, the connecting zone of high-risk regions and some urban regions. Compared with high-risk regions, these regions contain fewer densely populated places and no large commercial buildings or complex underground buildings, but they are close to high-risk regions. This means that a fire occurring there is likely to trigger a fire in buildings in high-risk regions within a short time. Low-risk regions are concentrated on the periphery of cities, mostly at the junction of administrative areas where the population density is low and urbanization needs to be further strengthened. In addition, some low-risk regions are located near the lakes and waters.
The spatial trend of fire risk in the YRDIDZ is given in Figure 4. As can be observed from the projection plane, the fire risk points at multiple locations overtop the overall situation. On the whole, the risk trend is distributed in two lines: the east-west line and the north-south line, both of which are high at both ends and low in the middle. This further indicates that the four corners of the YRDIDZ is more prone to fires than the central area.
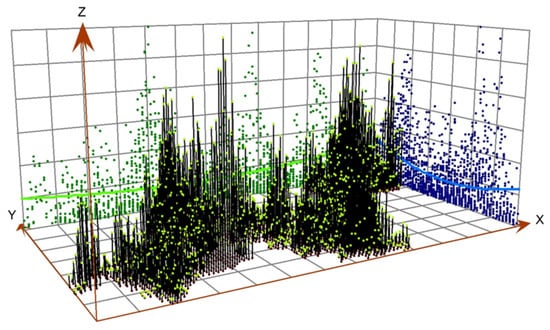
Figure 4.
Spatial trend of fire risk.
4.2. Analysis on the Status of Fire Stations
4.2.1. Analysis on the Status of Fire Stations in Single Administrative Areas
The service conditions of the existing fire stations in the research area are analyzed based on the coverage-maximized model, and the results are presented in Figure 5. Overall, Qingpu District boasts relatively remarkable coverage (75%), covering 403 of the 540 risk regions in the whole district. The overall coverage of Wujiang District and Qingpu County are poor (less than 60%), and the middle and north of Wujiang District and most areas of Qingpu District are lack of sufficient firefighting forces. From the perspective of fire risk, for high-risk regions, firefighting forces can hardly reach the fire site within 3 min in the case of a fire; for medium-risk regions, firefighting forces are well distributed in Qingpu District, while they require further improvement in Wujiang District and Jiashan County where the firefighting forces remain weak.
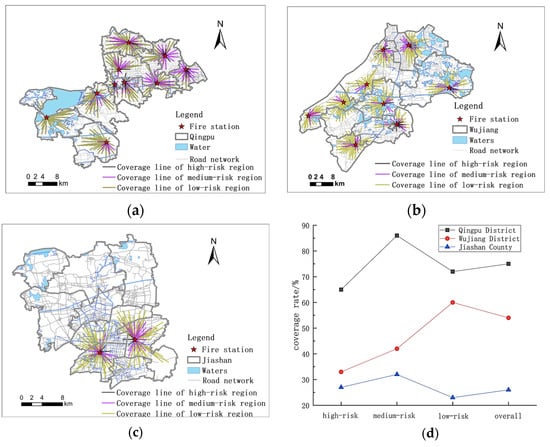
Figure 5.
Maximized coverage of fire stations in single administrative areas. (a) Maximized coverage in Qingpu District; (b) Maximized coverage in Wujiang District; (c) Maximized coverage in Jiashan County; (d) Coverage of fire stations in single administrative areas.
4.2.2. Analysis on the Status of Cross-Regional|Synergistic Firefighting
The YRDIDZ is taken as a whole for cross-regional synergistic firefighting. Under such a condition, the maximized coverage of the existing 21 fire stations is simulated (Figure 6). Overall, 1056 of the 1935 risk regions in the whole demonstration district can be covered, 31 more than the total number of covered risk regions in single administrative areas. With respect to risk coverage distribution, high-risk regions are well covered except for Xianghuaqiao Street, Wujiang Economic and Technological Development Zone, Oriental Silk Market, and parts of Xitang Town. Besides, two medium-risk regions (Zhenze Town and the north of Jiashan County) fail to be covered.
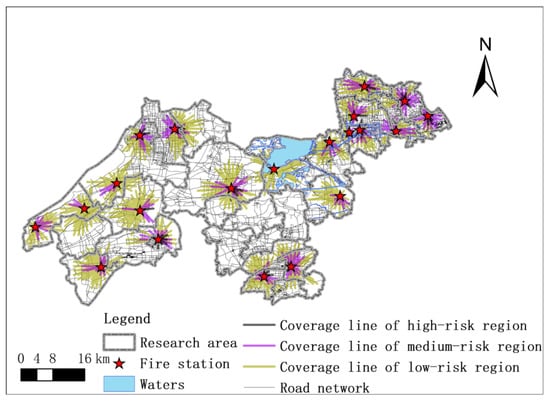
Figure 6.
Maximum coverage in the YRDIDZ.
Compared with single-city firefighting, cross-regional synergistic firefighting can improve the coverage at the junction of administrative areas and enhance regional firefighting capabilities in a small area. However, medium- and high-risk regions still pose considerable hidden dangers to cities. Once a fire occurs, it will cause greater loss of personnel and property.
4.3. Results of Spatial Layout Optimization of Fire Stations
To improve the coverage of high-risk regions, considering the economic factor, the minimum number and location of fire stations were calculated based on the facility point-minimized model. The calculation results show that: 26 new stations are needed to achieve full coverage of high-risk areas within 3 min (Figure 7), 5 new stations in Qingpu District, 15 new stations in Wujiang District, and 6 new seats in Jiashan County. At this time, the coverage of low-risk areas is 79% and 81% respectively. At the same time, there is a phenomenon that multiple fire stations are concentrated in Yingpu Street of Qingpu District, Wujiang Economic Development Zone and East Silk Market Fire High Risk Area. This will cause problems such as low utilization of fire stations and long-term idleness of fire equipment, resulting in waste of resources, which is contrary to the principle of our fire protection layout. Therefore, by viewing the number of service risk areas of each fire station, 7 additional points of fire stations with fewer services can be deleted, and 19 fire stations need to be built, a total of 40 fire stations.
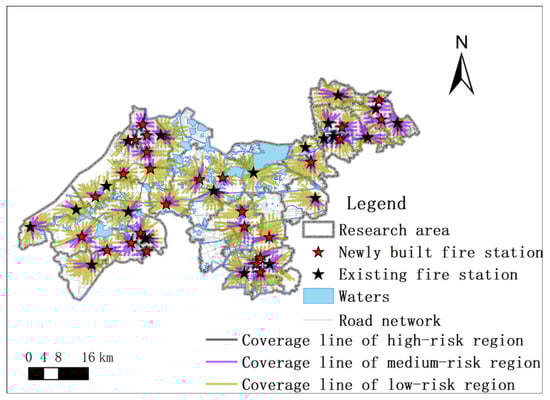
Figure 7.
Maximum coverage of fire stations.
In order to obtain the reasonable number and location of fire stations, the maximum coverage model is used to simulate the increase of 1–19 fire stations respectively. The simulation results are shown in Figure 8. When the number of fire stations is 38, that is, when 17 new fire stations are added, the coverage rate of high fire risk areas exceeds 90%, and the coverage rate of medium and low risk areas exceeds 70%, which can better meet the fire risk prevention and control needs of the Yangtze River Delta integration demonstration area. The specific distribution location is as shown in Figure 9, with 4 new fire stations in Qingpu District, 10 new fire stations in Wujiang District and 3 new fire stations in Jiashan County. It is noteworthy that since cities are continuously developing complex systems, their fire station distribution concerning fire risk also deserves continuous exploration.
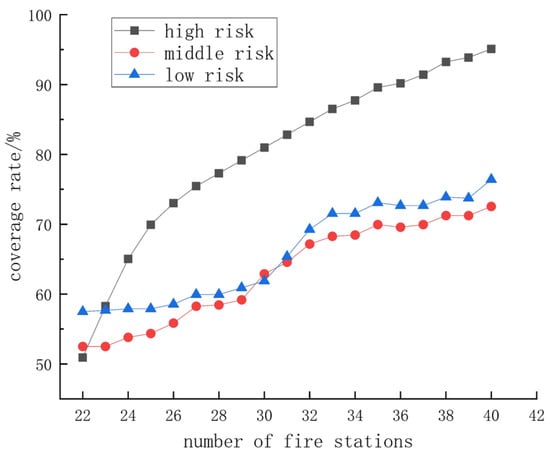
Figure 8.
Number of new fire stations coverage.
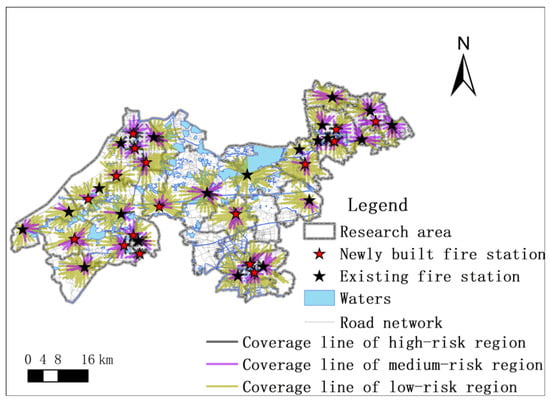
Figure 9.
Distribution of 17 new fire stations.
5. Conclusions
In this paper, a set of urban fire risk assessment system was established by taking population density, road density, water source distance and fire-based POI classification indicators as the evaluation indicators. With the aid of this system, the urban fire risk was assessed by means of expert scoring and weighting. Furthermore, the evaluation criteria for the spatial layout of fire stations were proposed considering the actual situation of the YR-DIDZ. Aiming at fully covering high-risk regions, the location of fire stations was calculated by introducing the location allocation model, and the optimization scheme was given under comprehensive consideration of factors such as construction cost and coverage. The main conclusions are as follows:
- (1)
- In the YRDIDZ, high-risk regions are mainly concentrated in Yingpu Street and Xujing Town of Qingpu District, Wujiang Economic Development Zone and Oriental Silk Market of Wujiang District and Huimin Street of Jiashan County; medium-risk regions mainly include the periphery of high-risk regions, the connecting zone of high-risk regions and some urban regions. The spatial trend of fire risk is distributed in two lines: the east-west line and the north-south line, both of which are high at both ends and low in the middle.
- (2)
- The overall coverage rate of fire stations in Qingpu District is 75% (65% for high-risk regions), while those in Wujiang District and Jiashan County are both lower than 60%. A total of 31 more regions are covered when the YRDIDZ is taken as a whole for cross-regional deployment of fire stations.
- (3)
- When adding 17 fire stations in the Yangtze River Delta integrated demonstration area, 90% of the high-risk fire areas can be covered within 3 min, and the coverage rate of low-risk areas can be increased to 70%, which can better meet the needs of fire risk prevention and control in the Yangtze River Delta integrated demonstration area.
Author Contributions
Conceptualization, S.T.; Methodology, W.W., J.Y., Z.J. and Z.D.; Software, Z.J.; Formal analysis, W.W., J.Y. and Z.J.; Resources, S.T., J.Y. and Z.D.; Data curation, Z.D.; Writing—original draft, K.G.; Writing—review & editing, K.G.; Project administration, W.W.; Funding acquisition, W.W. and S.T. All authors have read and agreed to the published version of the manuscript.
Funding
This work is supported by the Sponsored by Shanghai Rising-Star Program (20QB1401000), Science and Technology Program of Fire and Rescue Department of MEM (2020XFLR40), Guizhou Provincal Science and Technology Projects ([2020]4Y055, [2021] General 520, [2022] General 250), Key Research and Development Plan of Jiangxi Province (20212BBG73010).
Institutional Review Board Statement
Not applicable.
Informed Consent Statement
Not applicable.
Data Availability Statement
Data available on request due to restrictions eg privacy or ethical The data presented in this study are available on request from the corresponding author. The data are not publicly available due to [This study is the basis for subsequent research.].
Conflicts of Interest
The authors declare no conflict of interest.
References
- Huang, G.; Zhou, J. Measurement, spatiotemporal pattern and driving mechanism of social upgrading in China. Acta Geogr. Sin. 2021, 76, 3043–3060. [Google Scholar]
- Ferreira, T.M.; Vicente, R.; da Silva, J.A.R.M.; Varum, H.; Rui, M. Urban fire risk: Evaluation and emergency planning. J. Cult. Herit. 2016, 20, 739–745. [Google Scholar] [CrossRef]
- Dong, X. Research on Urban Fire Protection Planning Based on Fire Safety Assessment and GIS Technology. Ph.D. Thesis, University of Science and Technology of China, Hefei, China, 2018. [Google Scholar]
- Chen, W.; Liu, W.; Sun, W. The integrated development of Taihu Basin and the Yangtze Riverb Delta region: Status, challenges and strategies. J. Lake Sci. 2021, 33, 327–335. [Google Scholar]
- He, Y.; Sheng, M.; Lei, L.; Guo, K.; He, Z.; Cai, J.; Fang, H.; Zhang, X.; Liu, Y.; Zhang, Y. Driving factors and spatio-temporal distribution on NO2 and CO2 in the Yangtze River Delta. China Environ. Sci. 2022, 42, 3544–3553. [Google Scholar]
- Liu, Y.; Long, H.; Li, Y. Human geography research based on the new thinking of global rural-urban relationship. Acta Geogr. Sin. 2021, 76, 2869–2884. [Google Scholar]
- He, C.; Ren, Z.; Wang, W. “Dual circulation” and Beijing-Tianjin-Hebei high-quality coordinated development: From the division in the value chain and factor mobility perspective. Acta Geogr. Sin. A 2022, 77, 1339–1358. [Google Scholar]
- Ferreira, T.M.; Baquedano, P.; Graus, S.; Nochebuena, E.; Socarrás, T. Evaluación de riesgo de incendio urbano enel centro histórico de la ciudad de Guimarães. Inf. De La Constr. 2018, 70, e262. [Google Scholar] [CrossRef]
- Zhang, Y. Analysis on comprehensive risk assessment for urban fire: The case of Haikou City. Procedia Eng. 2013, 52, 618–623. [Google Scholar] [CrossRef][Green Version]
- Wu, J.; Hu, Z.; Chen, J.; Li, Z. Risk assessment of underground subway stations to fire disasters using Bayesian network. Sustainability 2018, 10, 3810. [Google Scholar] [CrossRef]
- Kiran, K.C.; Corcoran, J.; Chhetri, P. Spatial optimisation of fire service coverage: A case study of Brisbane, Australia. Geogr. Res. 2018, 56, 270–284. [Google Scholar]
- Shahparvari, S.; Fadaki, M.; Chhetri, P. Spatial accessibility of fire stations for enhancing operational response in Melbourne. Fire Saf. J. 2020, 117, 103149.1–103149.13. [Google Scholar] [CrossRef]
- Liu, H. Location and Allocation Optimization of Collaborative Fire Emergency Facilities under Hypercube Queuing Equilibrium. Ph.D. Thesis, Harbin Institute of Technology, Harbin, China, 2018. [Google Scholar]
- Ming, J.; Richard, J.P.P.; Zhu, J. A Facility Location and Allocation Model for Cooperative Fire Services. IEEE Access 2021, 9, 90908–90918. [Google Scholar] [CrossRef]
- Wang, K.; Yuan, Y.; Chen, M.; Wang, D. A POIs based method for determining spatial distribution of urban fire risk. Process Saf. Environ. Prot. 2021, 154, 447–457. [Google Scholar] [CrossRef]
- Wang, W.; Xu, Z.; Sun, D.; Lan, T. Spatial Optimization of Mega-City Fire Stations Based on Multi-Source Geospatial Data: A CaseStudy in Beijing. ISPRS Int. J. Geo-Inf. 2021, 10, 282. [Google Scholar] [CrossRef]
- Jiang, Y.; Lv, A.; Yan, Z.; Yang, Z. A GIS-Based Multi-Criterion Decision-Making Method to Select City Fire Brigade: A Case Study of Wuhan, China. ISPRS Int. J. Geo-Inf. 2021, 10, 777. [Google Scholar] [CrossRef]
- Wang, A.; Zhang, Q.; Lu, L.; Yu, H.; Huang, C. Urban fire risk assessment and planning response based on multi-source data. China Saf. Sci. J. 2021, 31, 148–155. [Google Scholar]
- NFPA 1710; Standard for the Organization and Deployment of Fire Suppression Operations Emergency Medical Operations and Special Operations to the Public by Career Fire Departments. NFP Association: Chicago, IL, USA, 2001.
- NFPA 1720; Standard for the Organization and Deployment of Fire Suppression Operations Emergency Medical Operations and Special Operations to the Public by Volunteer Fire Departments. NFP Association: Chicago, IL, USA, 2014.
- JB 152-2017; Construction Standard for Urban Fire Station. Ministry of Public Security of the People’s Republic of China: Beijing, China, 2011.
- Chen, Z.; Li, J.; Lu, F.; Li, Q. Optimizing location of fire stations and it’s enlightenments for Xiong an New Area. J. Saf. Sci. Technol. 2019, 15, 185–191. [Google Scholar]
- Li, H. Resilience Construction: Study on Ecological Space Optimization in the High-Density Built Environment. Ph.D. Thesis, Chongqing University, Chongqing, China, 2020. [Google Scholar]
- Başar, A.; Çatay, B.; Ünlüyurt, T. A multi-period double coverage approach for locating the emergency medical service stations in Istanbul. J. Oper. Res. Soc. 2011, 62, 627–637. [Google Scholar] [CrossRef]
- He, J.; Yang, J. Urban fire station layout assessment technology based on fire risk. Fire Sci. Technol. 2021, 40, 130–134. [Google Scholar]
- Ouyang, X.; Zhu, X. Spatio-temporal characteristics of urban land expansion in Chinese urban agglomerations. Acta Geogr. Sin. 2020, 75, 571–588. [Google Scholar]
- Deng, X.; Liang, L.; Wu, F.; Wang, Z.; He, S. Chinese balanced regional development strategy from the perspective of development geography. Acta Geogr. Sin. 2021, 76, 261–276. [Google Scholar]
- Sturtevant, B.R.; Cleland, D.T. Human and biophysical factors influencing modern fire disturbance in northern Wisconsin. Int. J. Wildland Fire 2007, 16, 398–413. [Google Scholar] [CrossRef]
- Uddin, M.S.; Warnitchai, P. Decision support for infrastructure planning: A comprehensive location–allocation model for fire station in complex urban system. Nat. Hazards 2020, 102, 1475–1496. [Google Scholar] [CrossRef]
- Nõlvak, H.; Truu, J.; Limane, B.; Truu, M.; Cepurnieks, G.; Bartkevičs, V.; Juhanson, J.; Muter, O. Microbial community changes in TNT spiked soil bioremediation trial using biostimulation, phytoremediation and bioaugmentation. J. Environ. Eng. Landsc. Manag. 2013, 21, 153–162. [Google Scholar] [CrossRef]
- Guo, Z.; Wei, W.; Pang, S.; Li, Z.; Zhou, J.; Jie, B. Spatio-temporal evolution and motivation analysis of ecological vulnerability in arid inland river basin based on SPCA and remote sensing index: A case study on the Shiyang River Basin. J. Ecol. 2019, 39, 2558–2572. [Google Scholar] [CrossRef]
- Zhu, R.; Liu, Q.; Huang, C.; Kang, B. Z-ACM: An approximate calculation method of Z-numbers for large data sets based on kernel density estimation and its application in decision-making. Inf. Sci. 2022, 610, 440–471. [Google Scholar] [CrossRef]
- Tang, G.; Yang, X. ArcGIS Geographic Information System Spatial Analysis Experiment Course, 2nd ed.; Science Press: Beijing, China, 2012. [Google Scholar]
- Church, R.; ReVelle, C. The maximal covering location problem. Pap. Reg. Sci. Assoc. 1974, 32, 101–118. [Google Scholar] [CrossRef]
- Toregas, C.; Swain, R.; ReVelle, C.; Bergman, L. The location of emergency service facilities. Oper. Res. 1971, 19, 1363–1373. [Google Scholar] [CrossRef]
Publisher’s Note: MDPI stays neutral with regard to jurisdictional claims in published maps and institutional affiliations. |
© 2022 by the authors. Licensee MDPI, Basel, Switzerland. This article is an open access article distributed under the terms and conditions of the Creative Commons Attribution (CC BY) license (https://creativecommons.org/licenses/by/4.0/).