Article

Simulation and Prediction of Land Use/Cover Changes Based on CLUE-S and CA-Markov Models: A Case Study of a Typical Pastoral Area in Mongolia

1
Department of Geography, School of Arts and Sciences, National University of Mongolia, Ulaanbaatar 14200, Mongolia
2
College of Geographical Science, Inner Mongolia Normal University, Hohhot 010022, China
3
Inner Mongolia Key Laboratory of Remote Sensing & Geography Information System, Hohhot 010022, China
*
Author to whom correspondence should be addressed.
Sustainability 2022, 14(23), 15707; https://doi.org/10.3390/su142315707
Submission received: 12 October 2022 / Revised: 17 November 2022 / Accepted: 21 November 2022 / Published: 25 November 2022

Abstract

:
Modeling and predicting land use/cover change (LUCC) and identifying its drivers have been a focus of research over the past few decades. In order to solve the problem of land resource degradation in typical pastoral areas, reveal the temporal and spatial evolution characteristics of LUCC, and the contradiction between man and land in sustainable development, we analyze the Gurvanbulag area of Bulgan province, Mongolia, where grassland degradation is relatively serious. The LUCC data in 2000, 2010 and 2019 were obtained through interpreting human-computer interaction. On this basis, the same binary logistic regression (BLR) results were input into the multi-criteria evaluation analytic hierarchy process (MCE_AHP) of CLUE-S and CA_Markov models. The Current Trends (CT) and Ecological Protection (EP) development scenarios were used to predict the temporal and spatial evolution characteristics of LUCC in 2030 and 2040. The results show: (1) both models can effectively simulate the LUCC in 2019, and the CLUE-S model was significantly better than the CA_Markov model. (2) From 2000 to 2019, the LUCC in this region was dominated by a decrease in water and the growth of grassland and other land, indicating that the region is at the risk of land resource degradation. (3) In a multi-scenario development study, by 2030 and 2040, both models predicted that the EP development scenario is more effective in protecting the local ecological environment and it is easier to achieve the sustainability of land resources, than the CT development scenario. Combined with local policy demands and the prediction results of restraining land resource degradation, CLUE-S was significantly higher than the CA_Markov model, indicating that in typical pastoral areas, the former is more in line with the need for sustainable development of the local ecological environment than the latter.

1. Introduction

Land use/cover change (LUCC) is closely related to sustainable development of humans. It is the concentrated expression and the most direct indication of the impact of human activities on the natural ecosystem on the earth’s surface [1,2]. It is important to understand the complex relationship between humans and the ecological environment. LUCC is a process of mutual transformation of land use/land cover (LULC) in a region, which corresponds to the transformation of local social and economic development stages [3]. Since the “International Geosphere-Biosphere Programme, IGBP” and the “International Human Dimensions Programme on Global Environmental Change, IHDP” listed LUCC as a core program for the study of international global change, studying and simulating the spatiotemporal characteristics and processes of LUCC has become one of the core research areas of human-earth relations [4,5]. The focus of LUCC research is to simulate and predict the temporal and spatial distribution characteristics of LUCC in a certain period in the future and to use various methods to comprehensively analyze the driving factors of LUCC in a region. With the deepening of LUCC research by scholars to measure, simulate, predict, and explain the interaction between LUCC and to explore the coupling relationship between humans and the environment from multiple spatial scales [6], various models are used to predict the future spatiotemporal evolution trend of LUCC. At present, the commonly used LUCC simulation and prediction models are the CA [7,8], Markov [9], CLUE-S [10,11], System dynamics [12], artificial neural network [13], FLUS [14] and SLEUTH [15] models. For more information on the model, please refer to [16].
Since the early 1990s, Mongolia has transitioned from a planned economic system to a market economic system and implemented the privatization of state-owned assets. Its government adopted the “1997–2000 State-Owned Assets Privatization Program” which made the private sector dominate the national economy [17]. This not only hastened the end of collective farms but further reduced the mobility of agricultural products, as certain development interest groups advocated for “privatization of public resources, price liberalization, reduction of state subsidies and expenditures, currency convertibility, and rapid introduction to markets”. This has resulted in the collapse of exports of agricultural products. As a result, people’s living standards across the country are lowered, posing a threat to food security [18]. In this case, pastoral areas composed of small administrative units (natural villages) lacking financial support from the central government and rapidly increasing numbers of livestock maintain their ecosystems with fewer land resources. In the absence of external investment, regional pastures are unable to maintain their diversity and stability, resulting in increasingly prominent contradictions in the relationship between man and land. Mongolia’s land-use planning system fails to address these issues, especially at the regional pasture level [18]. Using LUCC models to simulate and predict the temporal and spatial evolution of each LULC type and its driving mechanism in regional pastures, understanding its structure and future change trends, and making corresponding decisions in advance, play a critical role in the sustainable use and development of local land resources [19].
The driving factor-based LUCC simulation and prediction tool-mathematical model (CLUE-S, CA_Markov) has a strong ability to predict the spatiotemporal dynamic evolution trend of LULC in small areas, which is of great significance to multi-scenario studies of future land use. The Conversion of Land Use and its Effects at Small regional extent (CLUE-S) model is a typical spatially explicit, empirically based statistical model suitable for LUCC studies in small- and medium-scale areas. The model is based on systems theory and handles the competition between different LULC types, simulating multiple LULC types simultaneously. It explains better the processes that determine the evolution of the LULC spatial pattern and explores the spatiotemporal distribution characteristics of future multi-scenario LUCCs at different spatial scales. It is considered as an excellent mathematical model with a strong explanatory power for the LUCC process [20] and has been widely used in the simulation and prediction research of LUCC in various small and medium areas [21]. The CA_Markov model combines the variability characteristics of cellular automata (CA) model space with the time demand capability of the Markov model, thereby simulating the bottom-up space-time evolution of complex systems. Compared with traditional single land use simulation models, the CA_Markov model comprehensively considers comprehensive factors such as natural, human social, and economic influences, thereby improving its simulation accuracy [22]. Therefore, this model has been widely used in LUCC simulation and prediction research at different regional scales worldwide [23,24,25]. The dynamic changes of each LULC are predicted using the suitability atlas of each land type produced by multi-criteria evaluation analytic hierarchy process (MCE_AHP) based on logistic regression analysis using this model to solve the nonlinear motion and complexity of various influencing factors [26]. However, the above-mentioned study areas are all simulations and predictions of LUCC in cities with rapid economic development or high population density, whereas pastoral areas with relatively moderate economic development and low population density are rarely reported in the comparative studies of the two models.
In recent years, the amount of residential land and livestock in Bulgan province in central Mongolia has continued to grow. Local herders blindly pursue economic interests and ignore the rational use and distribution of land resources, resulting in serious imbalances in the ecosystem and the threat of land degradation (desertification). In the Gurvanbulag pastoral area, where the ecological environment is more sensitive in the southern part of the province, an increasing number of grassland, forest, and water-bodies (river, lake, wetland) are transformed into other land types (sandy, saline-alkali land) [27]. In this research, the pastoral area is studies using RS technology combined with driving factors, such as nature and social economy, to capture the future LUCC evolution trend in the pastoral area and to compare and analyze the simulation results of the two models. The prediction results of different scenarios are used to solve the problem of serious land degradation caused by overgrazing in pastoral areas that lack monitoring, and this can provide local decision-makers with a scientific basis for the sustainable use and development of land resources.

2. Study Area and Data Preprocessing

2.1. Study Area

The Gurvanbulag pastoral area of Mongolia’s Bulgan province is located in the central part of Mongolia, 306 km west of the capital Ulaanbaatar, with an area of approximately 2688 km², and an average elevation of 1097 m. The area experiences continental temperate grassland climate, with obvious seasonal changes.
The terrain of the study area is characterized by grassland and hills that are suitable for animal husbandry and agricultural development. Central Mongolia is a typical pastoral area [28]. According to the results of a survey report on grassland vegetation and soil in the area (2005–2014), the average biomass of public grasslands decreased from 1010 kg/ha to 440 kg/ha, and the humus content of alluvial sandy loam soil in river valleys was between 0.352 and 2.193%. This shows that the land in this area is seriously degraded, and that this degraded LULC type can easily be transformed into other land use type (sandy, saline-alkali land). Therefore, this pastoral area was selected as the study area (Figure 1).

2.2. Data Sources and Processing

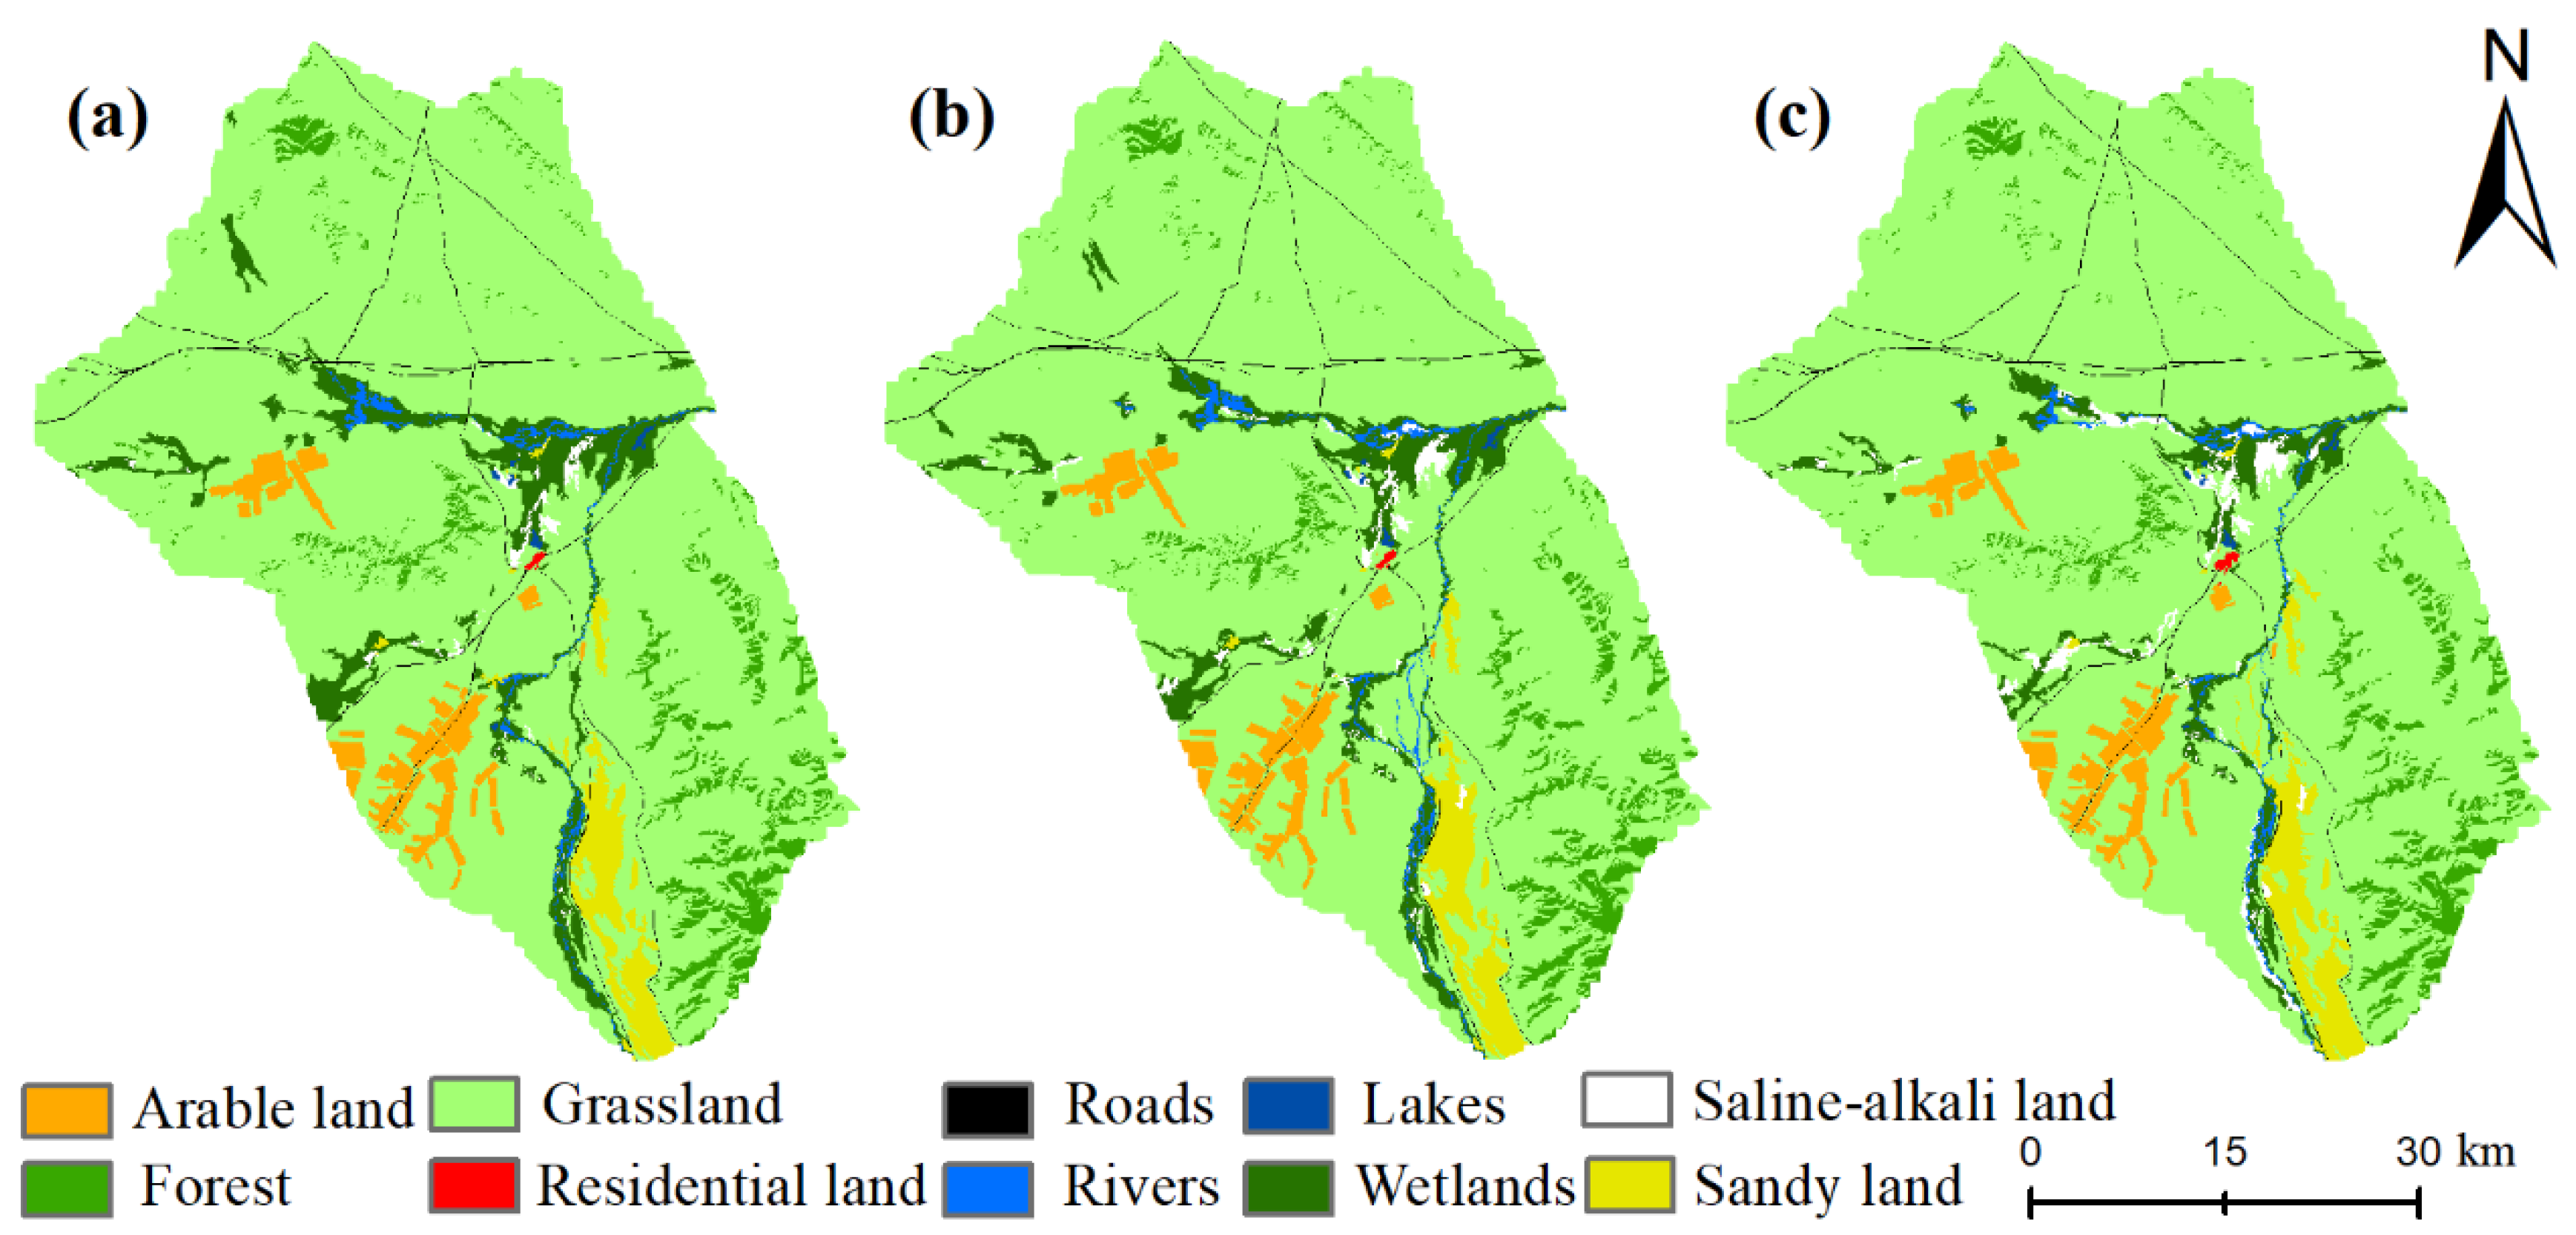
The data used in this study mainly come from four aspects: (1) landsat remote sensing image (30 m) data through radiometric calibration, atmospheric correction, image registration, and human-computer interaction interpretation in order to obtain the land use status map of the three phases (2000, 2010, and 2019). Combined with field investigation and random selection of dynamic maps, the interpretation accuracy was analyzed and evaluated by methods such as spot interpretation, and the overall accuracy of the interpretation accuracy in the three phases reached more than 90%. The classification of land use types was based on the “Land Use Status Classification 2017” as the standard, combined with the nature and characteristics of Mongolia’s land resources. Based on the ecosystem, the study area was divided into seven first-level types and five second-level types: arable land, forest, grassland, residential land, road, water (river, lake, wetland), and other land (sandy, saline-alkali land) (Figure 2). (2) The terrain data used in this study were SRTM (1arc-second) data. (3) The Gurvanbulag pastoral statistical yearbook data (2000, 2010, and 2014) and interpretation results were compared and analyzed, and the classification accuracy was adjusted to make it closer to the actual statistical data. (4) Meteorological (temperature, precipitation) data and social statistics (population density, livestock density) (Table 1).

3. Methodology

3.1. CLUE-S Model

The CLUE-S model is suitable for simulating small- and medium-scale LUCCs and has been specially developed for the spatial simulation of land-use change. The model includes a spatial and a non-spatial analysis module. Its simulated land use allocation is based on a combination of empirical analysis, spatial analysis, and dynamic modeling and is achieved through multiple iterations [29]. Figure 3 shows an overview of the information required to run the CLUE-S model.
Land use demands constrain simulations by defining the total changes in land use that should meet the requirements for all changes in a single pixel. In the CLUE-S model, this step is calculated independently from the CLUE-S model (nonspatial analysis module). Making corresponding land-use demand adjustments to the development demand rules for different future scenarios. Spatial policies and restrictions indicate that local policies, restrictions, and land tenure rights can affect LUCC patterns. This section usually refers to areas that restrict LULC-type transformation (nature reserves and construction land). The configuration of elasticity for land-use conversion (ELAS) indicates that the transition settings for specific land-use types determine the temporal dynamics of the simulation. In the past 20 years, there has been frequent mutual transfer between LULC types in the study area [27]. According to the relevant data from 2000–2019, the ELAS parameters of each land use type were adjusted to enable the model to be calibrated. According to the development needs of different scenarios (see Section 3.5), the ELAS parameters of each LULC type are defined (Table 2), and their relative elasticity ranges from 0 (easy to convert) to 1 (not convertible).
Location characteristics are predictions that land-use type conversion will occur at the location with the highest “preference” (location suitability) for different land-use types at that time. Location suitability represents the outcome of interactions between different actors and decision-making processes that lead to spatial land use allocations. It is a weighted average of suitability based on an empirical analysis of historical and current location “preferences” in response to location characteristics and suitability based on decision rules for different scenarios [30]. Binary logistic regression (BLR) analysis is typically used to illustrate the relationship between each land use type and its driving factors.
Finally, the CLUE-S model calculates the LUCC under the CT and EP development scenarios designed under the above constraints and applicability (land-use demand and location characteristics) through discrete time steps. The total probability of each grid cell i for each land use type u is calculated according to the following formula ( T P R O P i , u ):
T P R O P i , u = P i , u + E L A S u + I T E R u
where P i , u   is the applicability of location i to land-use type u , E L A S u is the transition elasticity of land-use type u , I T E R u is an iterative variable specific to land use type u that represents the relative competitiveness of land-use type u .

3.2. CA-Markov Model

The state of each variable in a cellular automata (CA) model is finite, and the rules for its state change are local at both time and space scales [26]. Therefore, the CA model has powerful spatial computing capabilities and can effectively simulate complex dynamic systems. The main components in this model are units, states, rules, and neighborhoods. It is a grid dynamic model that is discrete in terms of time, space, and area. A typical CA model can be expressed as:
S t + 1 = f S t ,    N
where S t and S t + 1 represent the set of finite and discrete states of CA at t and t + 1 , respectively; N   is the cell filter size; f is the transformation function which represents the cell transformation rule in the local space.
The Markov model uses the Markov process theory to predict the probability of occurrence of a certain event in the future, and is the transition probability matrix of the system from one LULC type to another at different times. It is mainly used in the prediction of geographical events with no aftereffects and is a spatial probability model [31]. The prediction formula for the probability of land-use change is:
S t + 1 = P i j S t
where S t and S t + 1 represent the land use status at times t and t + 1 ,   respectively, and P i j   is the land use conversion probability matrix, that is, the probability that the i land use type is converted to the j land use type, which can be obtained by the following formula:
P i j = M i j M i
and P i j is non-negative (0 ≤   P i j   ≤ 1),   j = 1 n P i j = 1 , i , j = 1 , 2 , 3 n where M i j is the area of the converted part of the land use type from the 𝑖 state to the j state, and M i is the initial area of the land use type i state.
The Markov model analyzes the characteristics of digital transformation in the spatial transformation of land-use types, without considering the influencing factors. The CA model has a strong ability to simulate the evolution of the spatial and temporal dynamics of a space system. Therefore, the CA-Markov model combines the advantages of Markov and CA models and can simulate and predict the temporal and spatial evolution of land use with high accuracy. In this study, the CA-Markov model was used to predict the evolution of land use types in the study area over the next 20 years, which not only brought into play the characteristics of the Markov model to analyze quantitative changes, but also used the characteristics of the CA model’s spatial simulation ability.

3.3. Suitability of Land Use

The formation of land-use patterns is generally affected by natural conditions, such as topography and meteorology. Human social and economic activities and the construction of regional infrastructure also play an important role in the spatial distribution of land use patterns. According to the previous correlation between the driving factors of land-use change and each LULC type, LUCC is affected by the distance variable [32]. Therefore, to follow the principles of accessibility, continuity, scientificity, applicability and representativeness of the driving factors, geographical conditions, distance to the transport line, point of interests (POI) and socioeconomic factors were selected. Geographical conditions include DEM, slope, aspect, and precipitation. The distance to the transport line factor is the distance to road. The POI data include distance to residential land and distance to water. Socioeconomic factors include population and livestock density. Through the selection of the above spatial factors, analyzing the impact of LULC changes in typical pastoral areas is of great significance for guiding rural development and sustainable use of land resources.

3.3.1. Logistic Regression Model Construction

An analytical model in a mathematical statistics-logistic regression model is widely used to explain the relationship between the driving factors of land use and the types of LULC [33]. The probability of converting a cell to different land uses was determined using BLR analysis in the CLUE-S model. Its expression is:
L o g    ( P i 1 P i ) = β 0 + β 1 X 1 , i + β 2 X 2 , i + + β n X n , i
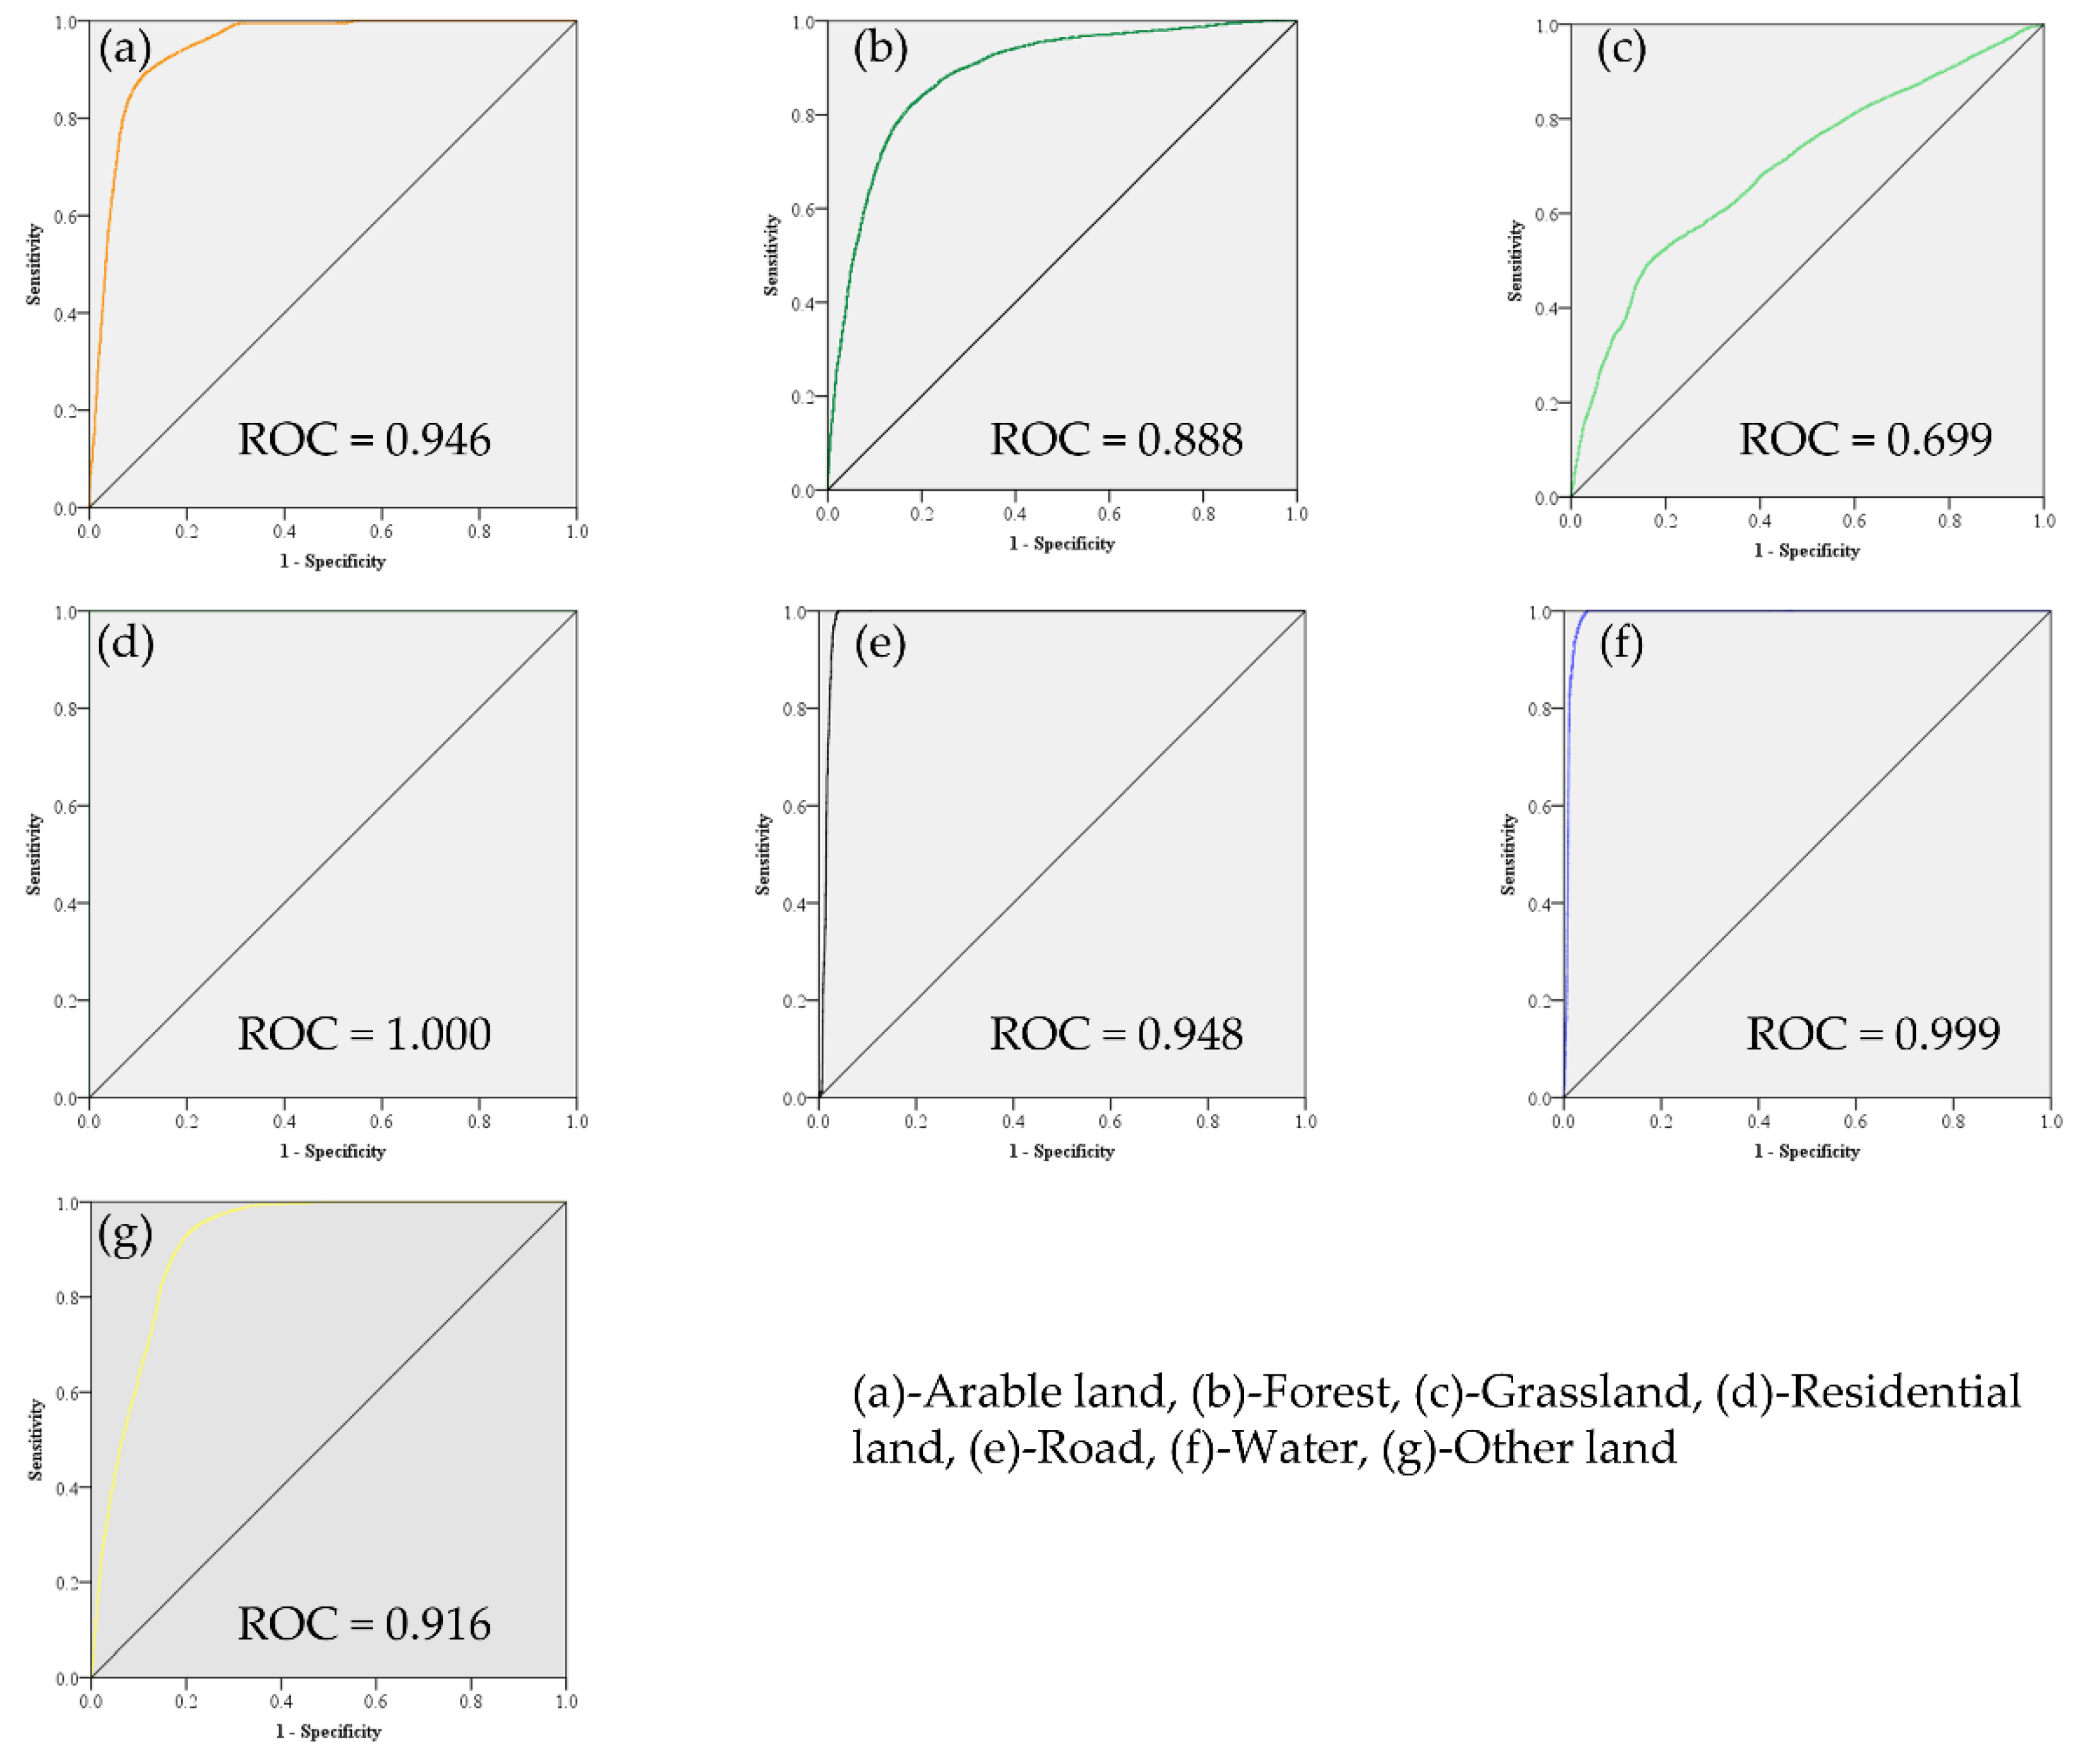
where P i is the probability that a certain type of land-use type i may appear on each grid unit, X n , i is the nth driving factor of the i grid, β n is the regression coefficient of the n -th driving factor. The receiver operating characteristic (ROC) curve was used to test the fit of the regression equation at different locations. Generally, when ROC > 0.7, the fit is considered good [34].

3.3.2. Multi-Criteria Evaluation Analytical Hierarchy Process (MCE_AHP) Method

In the CA_Markov model, the logistic regression analysis results in the CLUE-S model were used to determine the weight ratio of each factor to each LULC using the entropy method, and multi-criteria evaluation analytical hierarchy process (MCE_AHP) models were established to obtain the land use suitability atlas. Using the same logistic regression analysis results can better compare the simulation and prediction results of the two models (Figure 4).

3.4. Models Validation

The LUCC map for 2019 was simulated using the CLUE-S and CA_Markov models, and the accuracy was verified using the Kappa coefficient, showing the unity of the unit level and the similarity of the simulation. Next, the simulation accuracy of the model was compared and analyzed to obtain a model that is more suitable for the region and meets policy needs. The Kappa coefficient formula is as follows:
K = P 0 P c / 1 P c
where K is the kappa coefficient, P 0 is the proportion of the same unit, P c is the unit proportion of the expected change agreement.

3.5. Scenario Design

Local spatial policies, restrictions, and land ownership can affect and change the spatial pattern of LUCC, and these factors will affect the future development trend of LUCC in pastoral areas. Therefore, in this study, two development scenarios were designed to implement spatial policies and constraints based on the drivers of local policy needs and access. (1) The Current Trend (CT) development scenario can be said to be a natural development scenario model. It is a baseline scenario based on historical development trends. (2) Taking the policy of “Mongolian Sustainable Development Concept-2030” as the direction, combined with the policy of the study area on ecological environmental protection, an Ecological Protection (EP) development scenario for protecting ecological land is designed. Its purpose is to alleviate the problems of land resource degradation and ecological environment deterioration in the current study area. In this scenario model, the ecological land mainly represented by water (river, lake, wetland) is restricted in both models, so that it does not change to other land use types, to obtain which model can effectively protect and restore the ecological environment in this area according to local conditions.

4. Results

4.1. Land-Use Suitability

In the CLUE-S and CA_Markov models, BLR was used to analyze the correlation between each selected influencing factor and each LULC type, and the entropy weight method was used to calculate the weight ratio. From 2000 to 2010, arable land and other land types had the largest negative correlation with population density. Forest, road, water, and other land, were highly and negatively correlated with precipitation. Grassland, residential land, and population density had the highest positive correlations, among which grassland and precipitation also had a high positive correlation, indicating that in typical arid and semi-arid pastoral areas, grassland is mainly affected by population density and precipitation (Table 3).
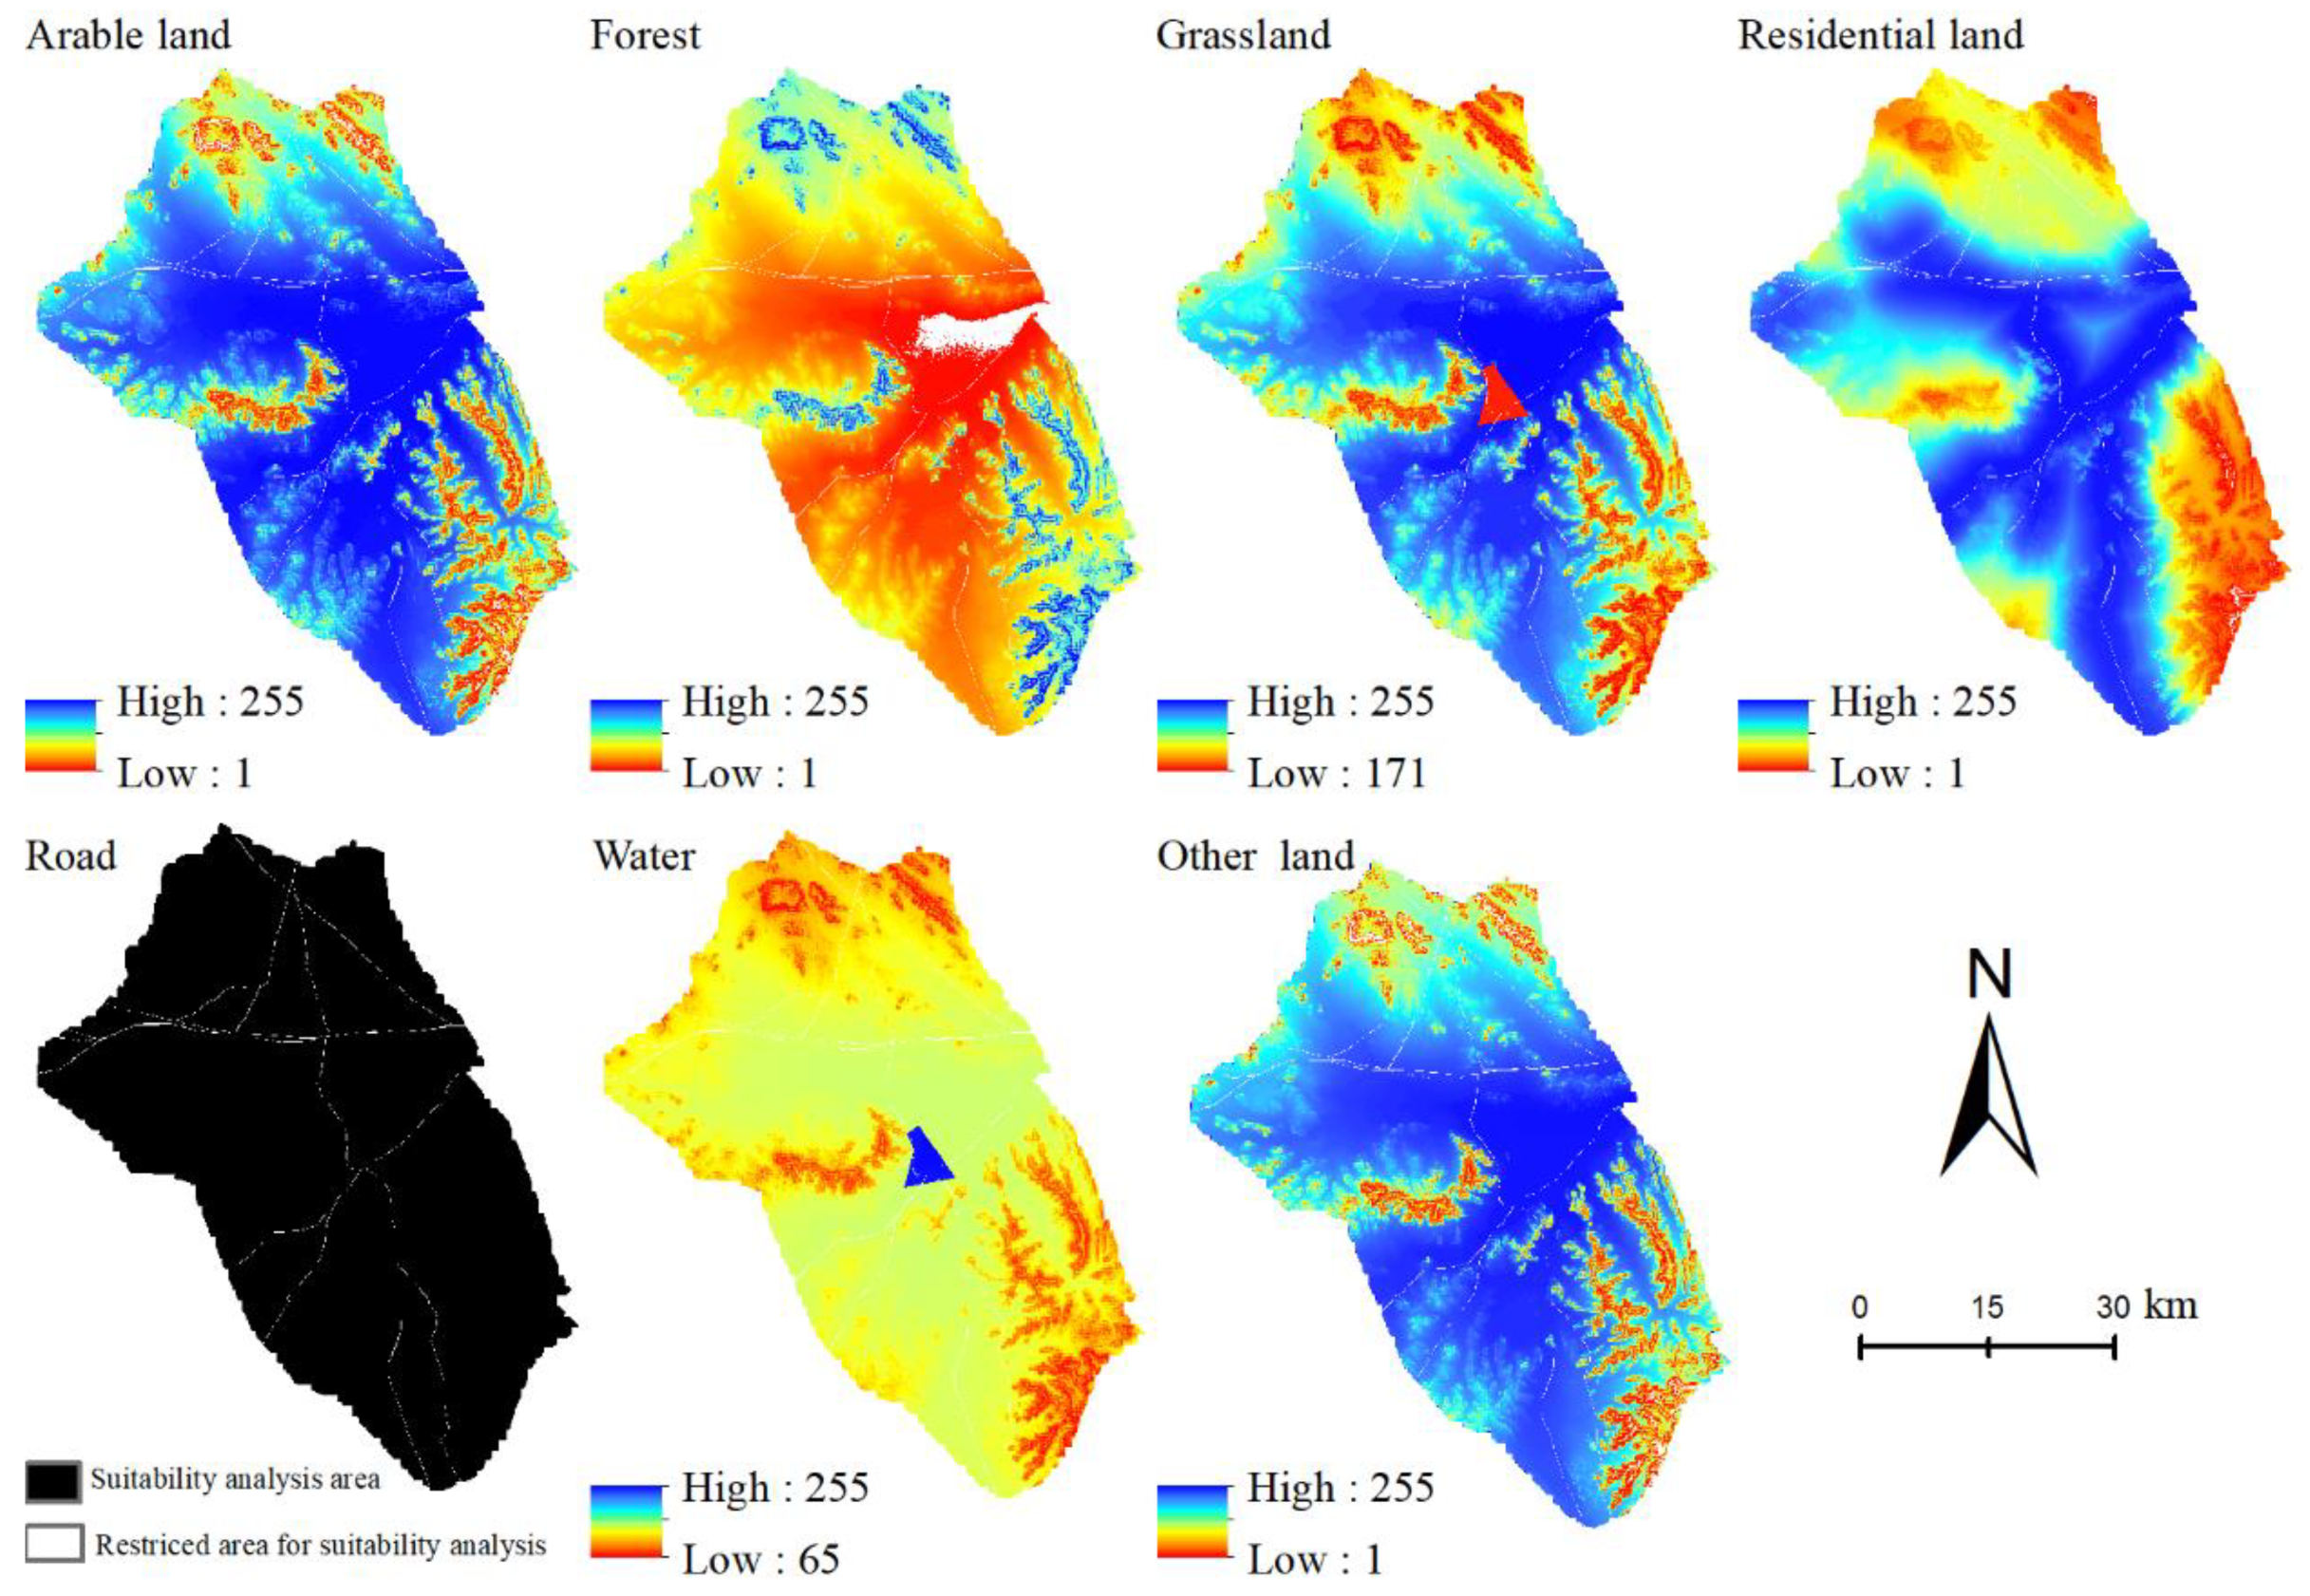
In terms of land use suitability, the CLUE-S model directly uses the BLR analysis results to input them into the main file. In the CA_Markov model, the spatial fuzzy standardization of each driving factor ranges from 1 (low) to 255 (high). The same BLR analysis results were determined using the entropy method to establish the weight ratio of each driving factor and input into the MCE_AHP module to obtain the land use suitability atlas of each LULC type (Figure 5).
In the verification of the BLR analysis results, except for grassland 0.699, the ROC values of the other LULC types were all greater than 0.8, indicating a high degree of fit (Figure 6). Both models could simulate land-use patterns in 2019.

4.2. Models Validation

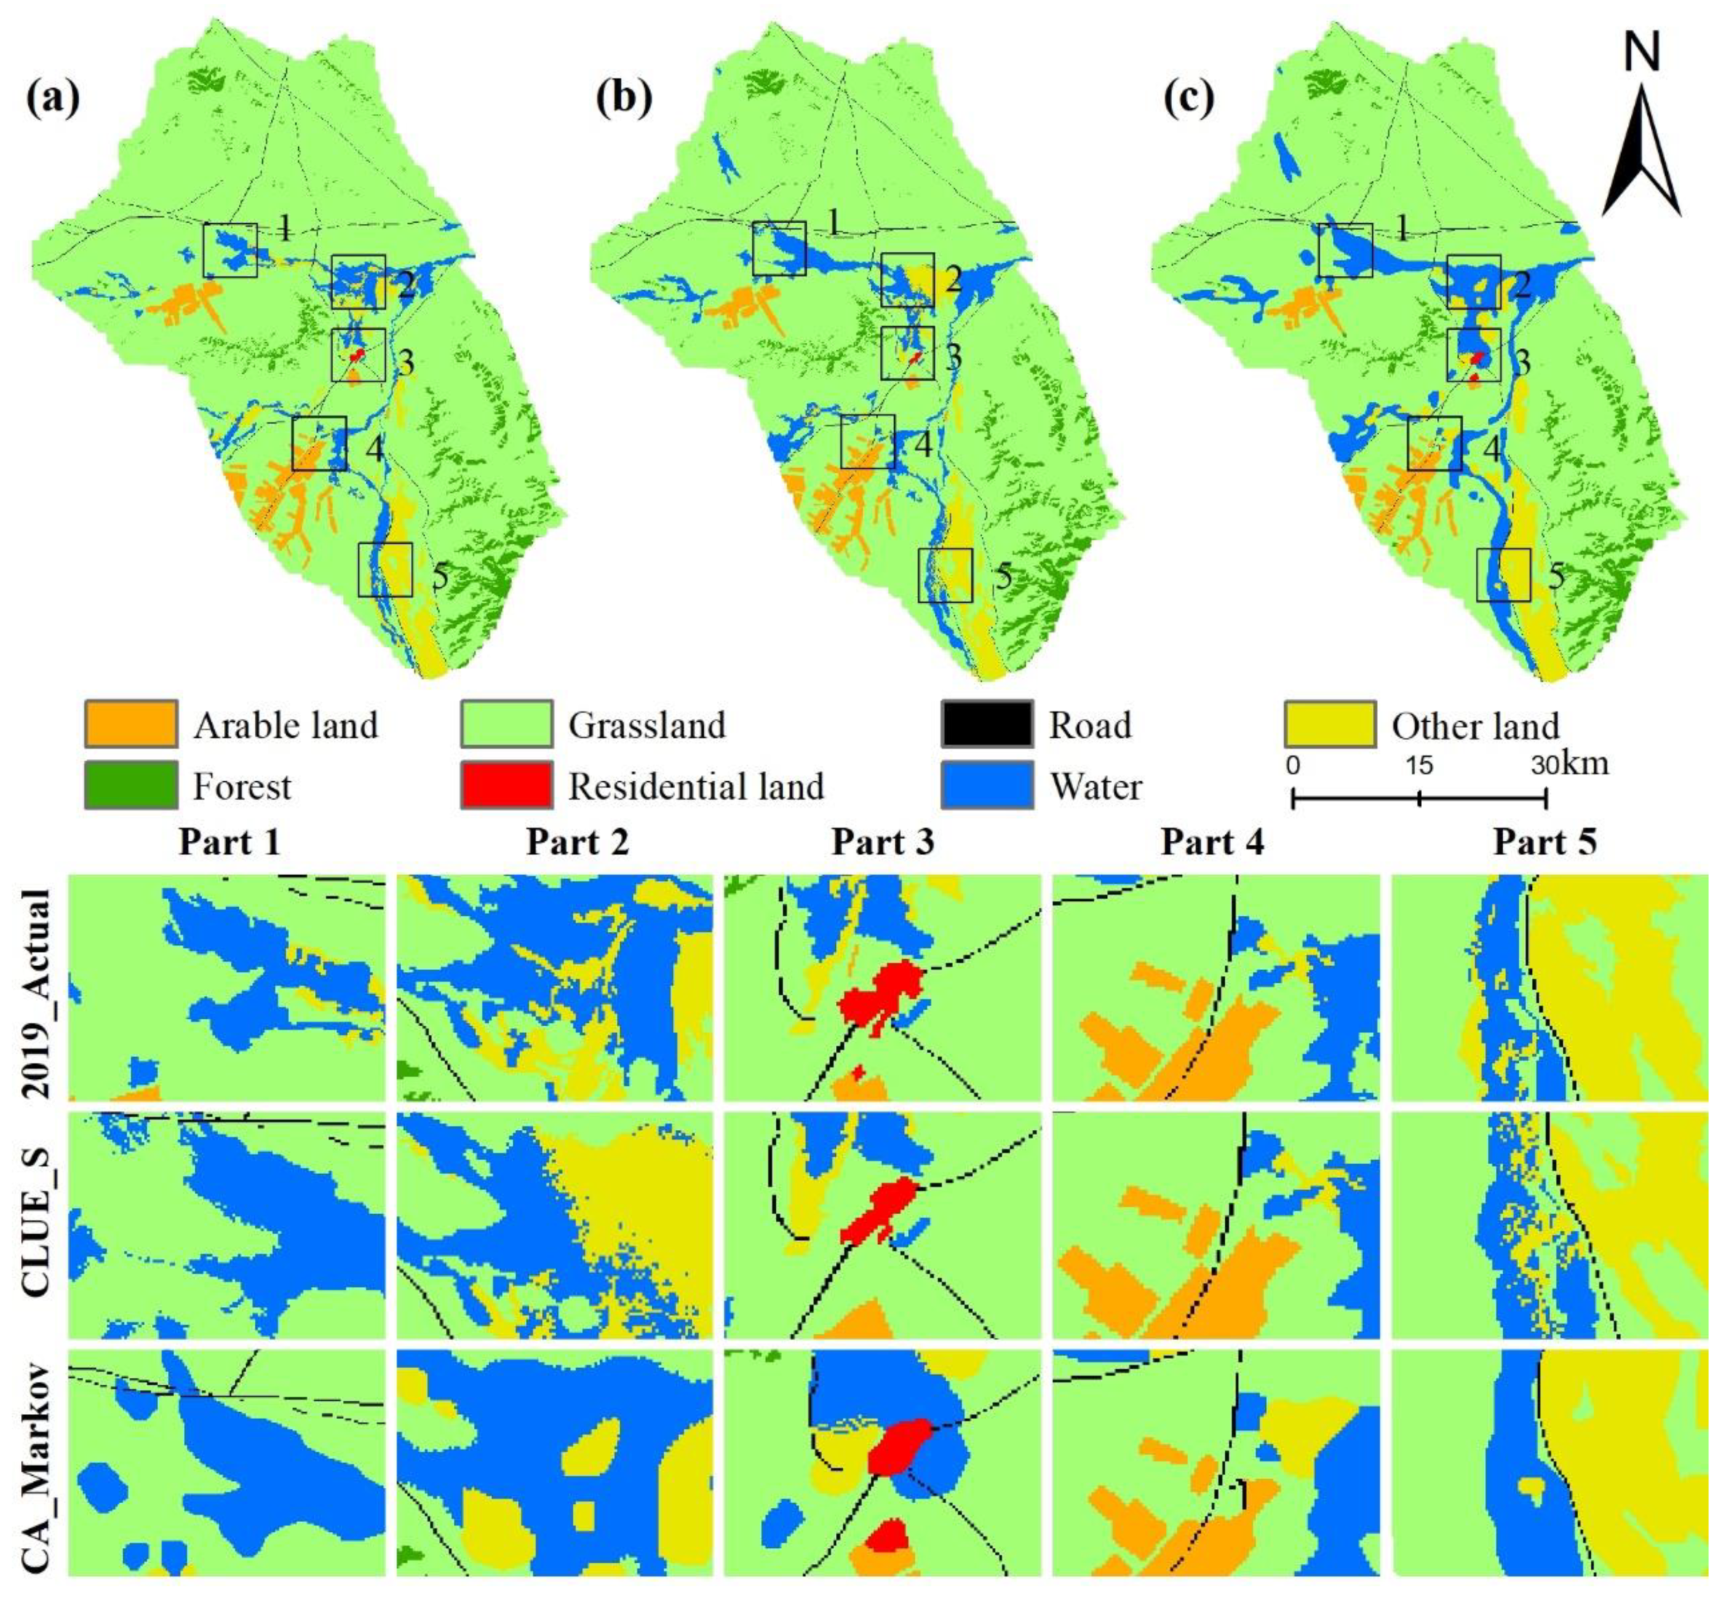
In order to verify the accuracy of the CLUE-S and CA_Markov model for simulating and predicting the future LUCC temporal and spatial patterns of typical pastoral areas in Gurvanbulag, two models were used to simulate the actual land use pattern in 2019 based on the land use change trend from 2000 to 2010 (Figure 7). The Kappa coefficient was used to verify the simulation results (Table 4).
In the simulation results of the two models, CA_Markov simulates a small amount of arable land as grassland compared with the CLUE-S model, but the errors of the two models are not significantly different. The Kappa coefficients were both greater than 0.9, indicating that the simulation results for arable land were excellent. forest, grassland, water, and other land simulations of LULC types had different degrees of error. The Kappa coefficient of each LULC reveals that CLUE-S is better than the simulation results of the CA_Markov model, indicating that the simulation results of the more widely distributed land types in CLUE-S are closer to the actual land-use map than the CA_Markov model. In the simulation results of residential land, CA_Markov model was closer to reality than the CLUE-S model, and the Kappa coefficient was also significantly higher than CLUE_S model, indicating that the spatial distribution was more concentrated and spontaneously expanding, and the CA_Markov model was significantly better than the CLUE-S model. From the overall average Kappa coefficient, both exceed 0.8, indicating that the simulation results are excellent, and CLUE-S is significantly better than the CA_Markov model.

4.3. Spatiotemporal Characteristics and Analysis of LUCC in the Study Area from 2000 to 2019

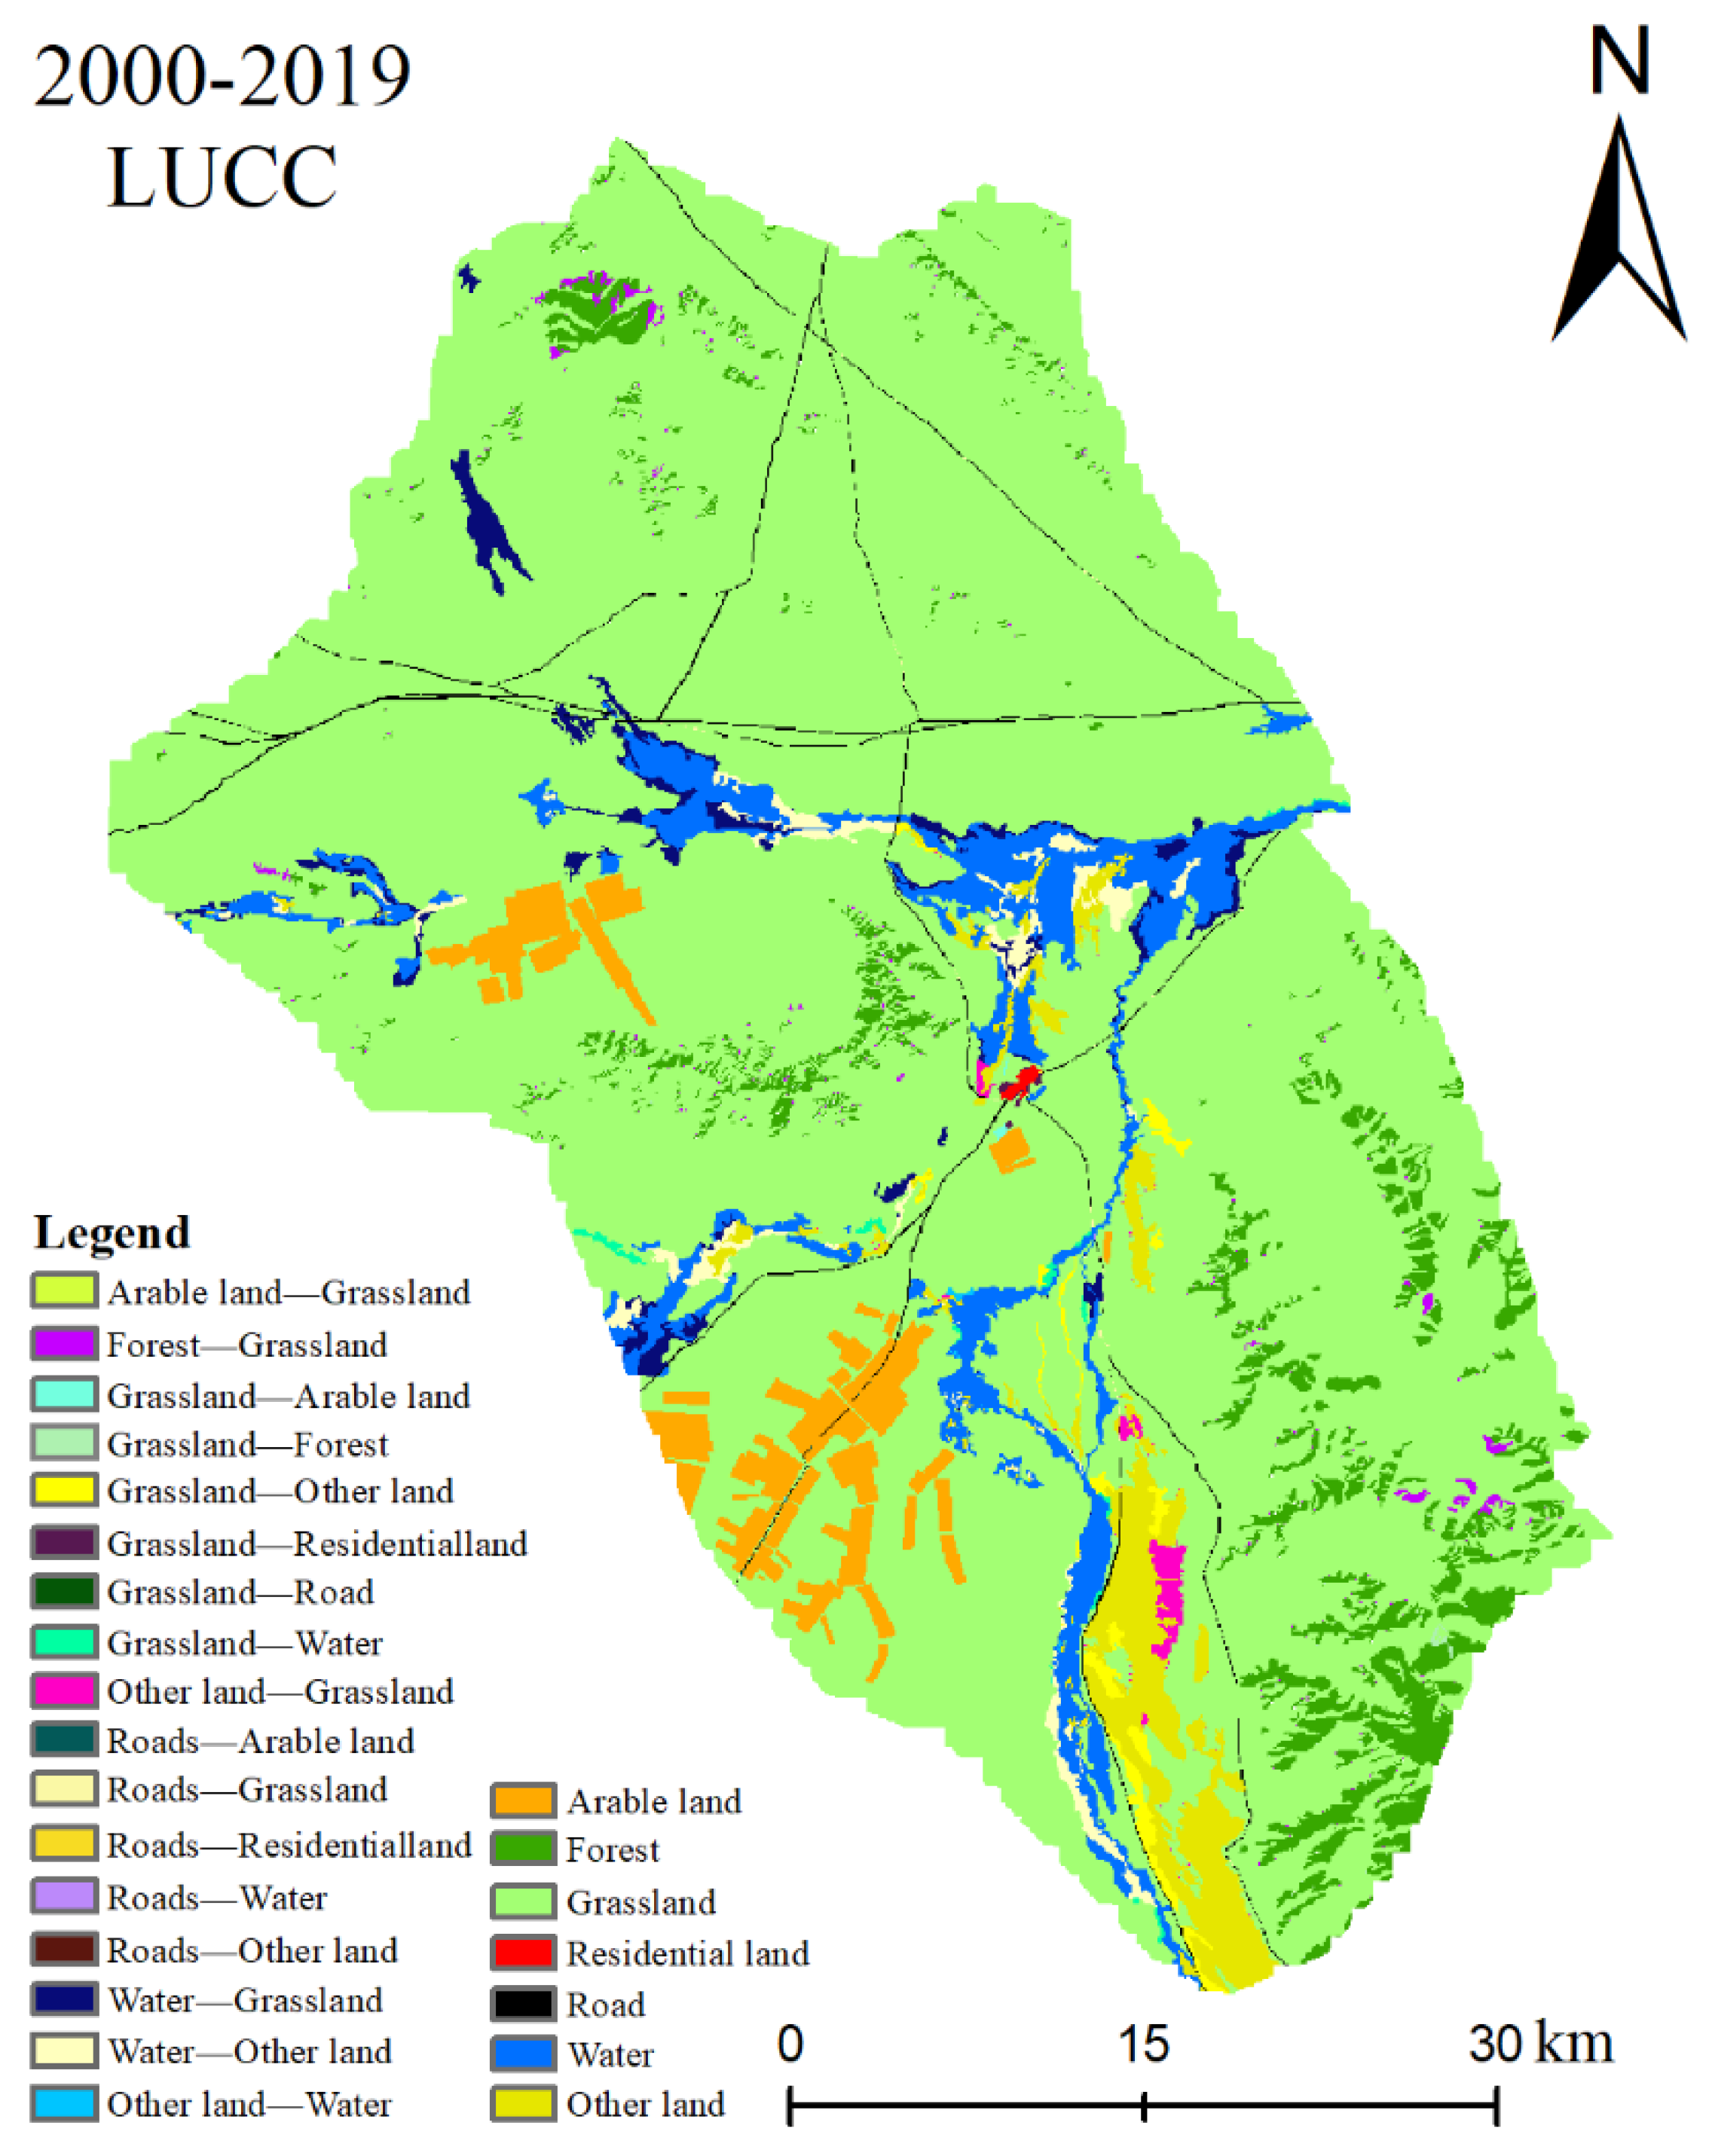
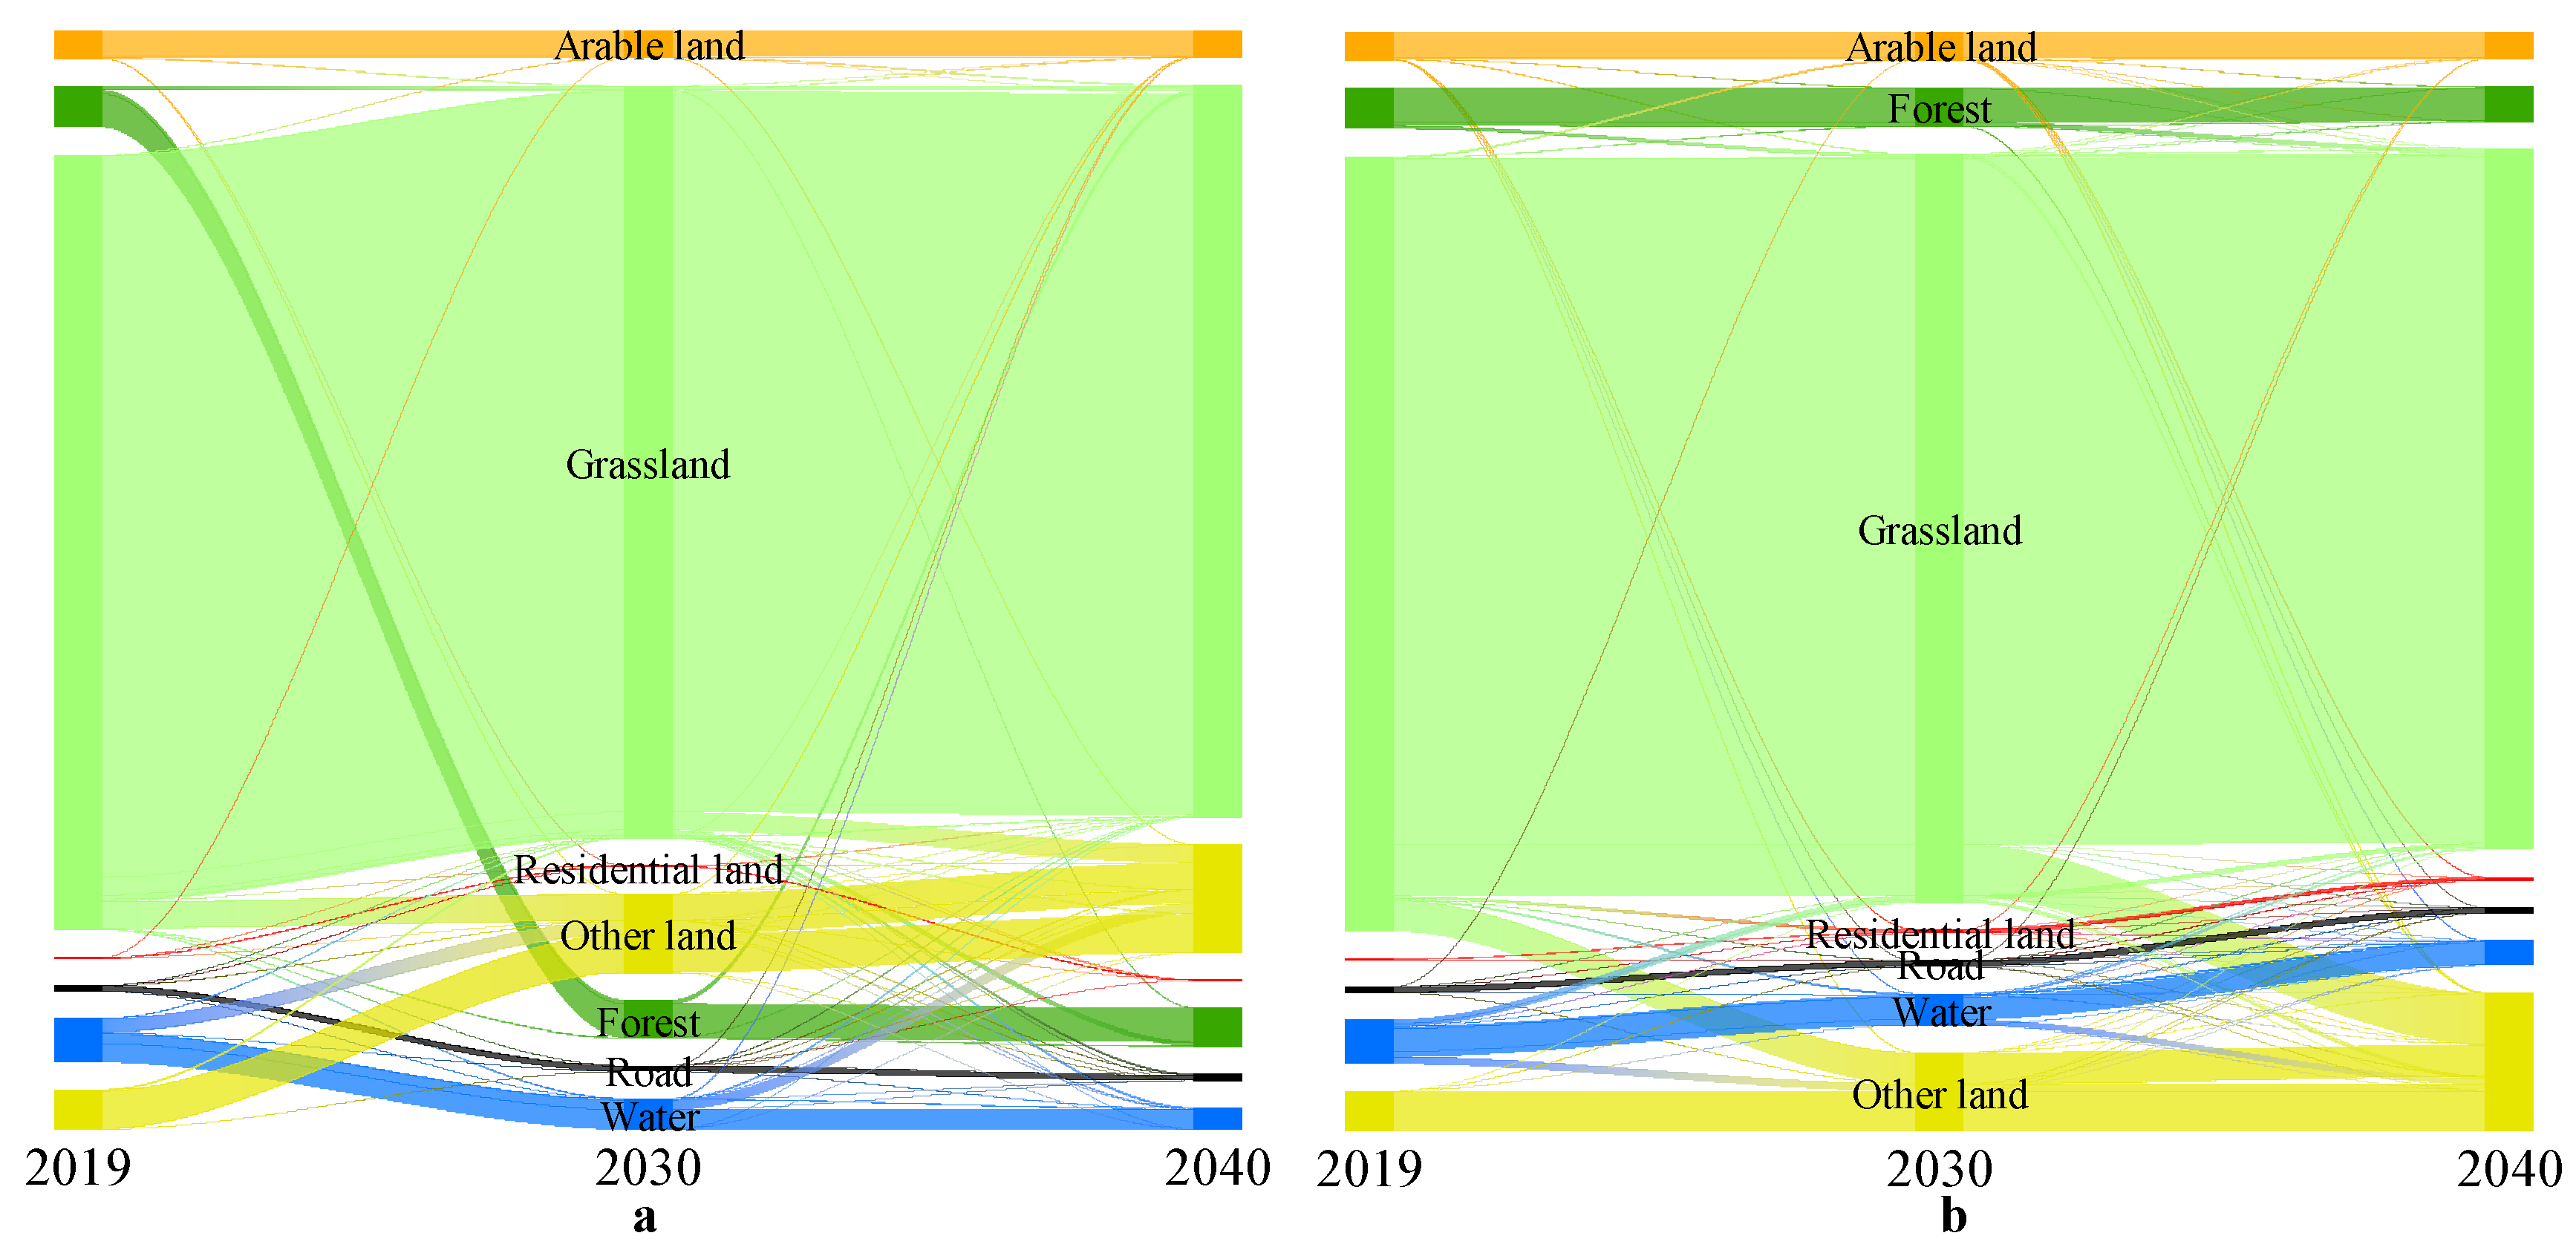
The dynamic changes in each LULC category from 2000–2019 are shown in Table 5, Figure 8 and Figure 9. In the entire study area, the arable land increased by 0.23 km², which may be because the study area is located in a typical pastoral area, the demand for arable land is low, and the total population is declining (see Table 1 for details). The forest area decreased by 4.79 km² and was mainly converted to grassland. This may be due to the increase in the number of livestock and the high latitude of the study area, with cold and long winters, making wood the main heating material. The grassland area increased by 26.81 km², mainly from the conversion of forest (9.11 km²), water (33.43 km²), and other land (6.12 km²). The residential land area increased by 0.59 km², mainly from the conversion of the surrounding grassland. The road area decreased by 0.51 km², mainly due to the shift to grassland. The water area decreased by 54.19 km², which was a type of LULC with the most serious area decrease. This may be related to the fact that the study area is located in a pastoral area, and domestic water for humans and livestock comes from surface water. The abrupt increase in the number of livestock, which increased from 166,600 to 326,700, was much larger than the pasture-carrying capacity. As a result, the water area was transformed into grassland (33.43 km2) and other land (25.48 km2). The other land area increased by 31.84 km², which is the LULC type with the largest area increase, mainly from grassland and water.
The above results show that, the LULC types transformed in the Gurvanbulag area mainly occurred in grassland, water, and other land. Among them, the water type has the most significant reduction in area, indicating that the local land degradation trend is serious, and it is urgent to formulate policies for the sustainable development of land resources.

4.4. Future Prediction of LUCC under Different Scenarios

4.4.1. Comparison and Analysis of Prediction Results of CLUE-S and CA_Markov Models under CT Development Scenario

Figure 10 and Figure 11 the temporal and spatial evolution trends of LULC predicted by the two models based on the CT development scenario during 2019–2030 and 2030–2040. From the above figures, it can be concluded that by 2030 and 2040, the prediction results of the two models for arable land are the same, with a small decrease. The areas of LULC types such as forest, grassland, and water also decreased to varying degrees, and the reduction degree of the above-mentioned types of LULC types predicted by the CLUE-S model was smaller than those predicted by the CA_Markov model. The areas of residential land and other land continue to increase, and the results predicted by the CA_Markov model are much larger than those predicted by CLUE-S. By 2030, the prediction results of the two models will be the same. By 2040, the prediction results of the CLUE-S model will show that the area of this type will increase by 2.73 km2, and the CA_Markov model will show a small decrease.
Further analysis of Figure 11 shows that under the CT development scenario, the LUCC in this area was mainly transformed from grassland and water to other land. This shows that land resources are continuously degraded; therefore, it is necessary to design EP development scenarios to protect and restore the ecological environment in combination with local sustainable development policies.

4.4.2. Comparison and Analysis of Prediction Results of CLUE-S and CA_Markov Models under EP Development Scenario

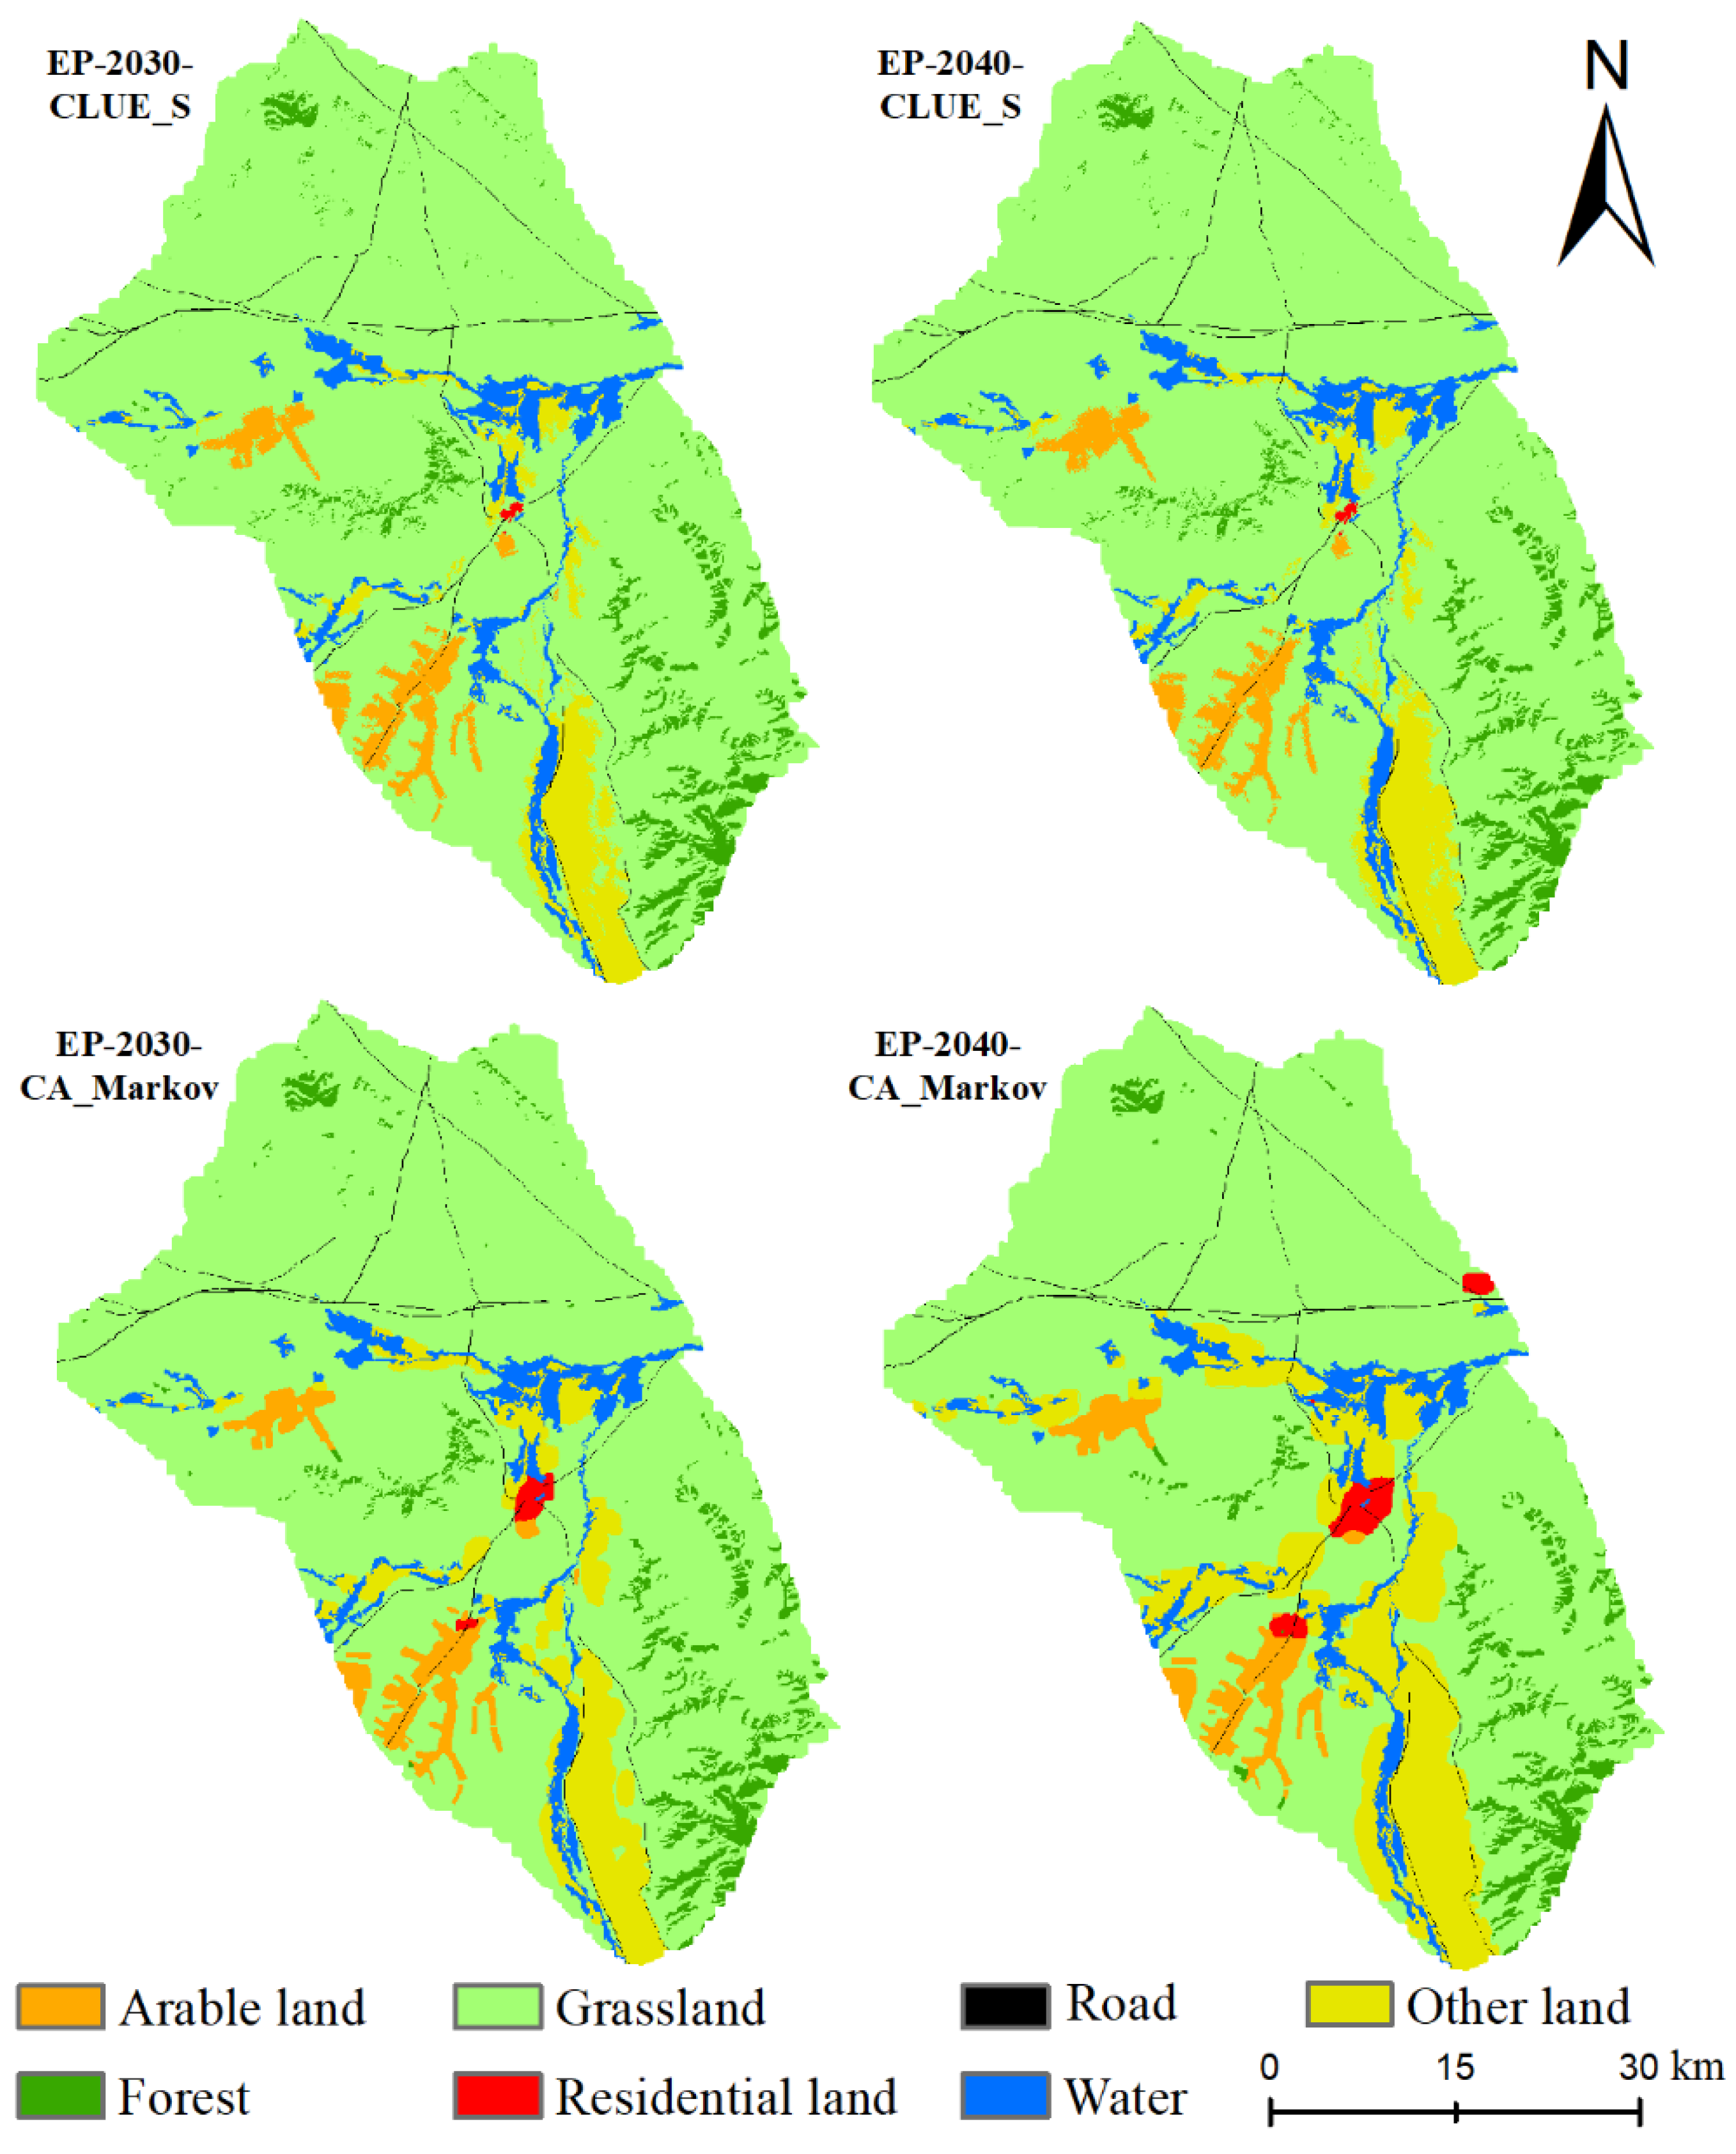
Figure 12 and Figure 13 the temporal and spatial evolution trends of LULC predicted by the two models based on the EP development scenario during 2019–2030 and 2030–2040. In this development scenario, to protect local water resources and the ecological environment, the water types were restricted in both models. In the future, 2030 and 2040, the two models show no difference in the prediction results of arable land, and both increase slightly. The area of LULC types, such as forest and grassland, continued to decrease, and the degree of decrease predicted by the CA_Markov model was more severe than that of the CLUE-S model, which was consistent with the CT development scenario. From 2030 to 2040, residential land showed an increasing trend in the prediction results of the two models, and the area prediction results of the CA_Markov model were significantly larger than those of the CLUE-S model. The difference in the type of road was not significant, and the area was the same in 2019 (Figure 8). The prediction results for other land types in the CLUE-S model were significantly smaller than those of the CA_Markov model.
Further analysis of Figure 13 shows that, under this development model, the local LUCC is mainly transformed from forest and grassland to other land. Among them, CLUE_S is superior to CA_Markov model in the prediction of land resource degradation risk represented by other land (sandy, saline-alkali land) use type.

5. Discussion

5.1. Comparison of Simulation Results between CLUE-S and CA_Markov Models

The differences in the model’s input land-use rules and influencing factors led to differences in the simulation and prediction results. For example, the CLUE-S model has more land use policies and parameter settings that limit the conversion area, whereas the CA_Markov model has different domain parameter-setting modules. In the LUCC simulation and prediction of typical pastoral areas in Gurvanbulag over the past 20 years (2000–2019), the same spatial resolution (80 × 80 m) and logistic regression results were used, combined with the accuracy verification of each LULC type and the average Kappa coefficient. Comparative analysis shows that the overall simulation and prediction results of the CLUE-S model are better than those of the CA_Markov model. Further analysis results show that, from the spatial distribution characteristics of the seven LULC types in the study area, the simulation of LULC types (forest, grassland, water, and other land), which are widely distributed in space, have a high degree of fragmentation and are more intensely transformed. The CLUE-S model is significantly better than the CA_Markov model. This is because, owing to the embedded logistic regression, the spatial module of the CLUE-S model is more likely to capture LULC types with a more dispersed spatial distribution than the neighborhood effects considered by the CA_Markov model in the simulation and prediction process of LUCC. Therefore, in the above-mentioned simulations of several LULC types, the CA_Markov model failed to exert its advantages. On the contrary, in residential land, which is characterized by spontaneous and nearest-neighbor development, neighborhood influence can play as an advantage. The kappa coefficient of this class simulation was higher than that of the CLUE-S model. This finding is consistent with the results of previous studies [34]. Each model has its unique characteristics and advantages, so many studies have simulated and predicted LUCC by coupling many models. As far as the typical pastoral area of Gurvanbulag is concerned, there are significantly more land types with extensive and scattered characteristics in spatial distribution than more concentrated types. The overall average Kappa coefficient of the CLUE-S model is significantly larger than that of the CA_Markov model, and the average Kappa coefficient of both exceed 0.8 (Table 4) indicating that both models can simulate the spatiotemporal patterns of LUCC in this region.
By comparing the simulation results of the above two models, it was found that selecting the optimal simulation and prediction model not only meets the policy requirements formulated by the local government, but also needs to fully understand the natural, social, and economic conditions and future development of the study area. This helps improve the simulation accuracy of the selected model.

5.2. Sustainable Development of Pastoral Land Use under Different Scenarios

Comparing the results under different development scenarios, we found that policy factors play a crucial role in LUCC in typical pastoral areas. In the 1990s, the Mongolian government switched from a planned economy to a market economy, which led to the massive privatization of livestock and severely overloaded local pastures [35]. This caused serious environmental problems, such as land degradation and desertification. Under the CT development scenario, the other land will continue to increase until 2030 and 2040, and the CA_Markov prediction was larger than that of the CLUE-S model. In the EP development scenario, although the other land use type will continue to increase in 2030 and 2040, its increased area is much smaller than that of the CT development scenario, indicating that under this development scenario land resources are more sustainable. The CLUE-S model’s prediction result for other land types is much smaller than that of the CA_Markov model, indicating that the CLUE-S model is more suitable than the CA_Markov model in typical pastoral areas, combined with local policy requirements and sustainable development of land resources.
There is a mechanism that cannot be ignored between land use change and policy. The “Mongolian Sustainable Development Concept-2030” formulated by the Mongolian National Assembly in 2016 mentioned that in 2014, 78.20% of Mongolia’s land area was affected by land degradation. Through policy adjustments, the degraded area will be reduced to 68.00% by 2030. In contrast, the Gurvanbulag pastoral area is located in the central area of the Selenga River Basin, an important part of the “China-Mongolia-Russia International Economic Corridor”. The concept of developing a green economy has been agreed upon among China, Mongolia, and Russia, and sustainable development has become the core concept of economic development in this region. In recent years, under the influence of global warming and human activities, the area of ecological land (forest, grassland, and water) in the Selenga Basin has continued to decrease and has been threatened by land degradation [36]. In this basin, the ecological, environmental, and water resource problems caused by the development and utilization of land resources have received extensive attention. Therefore, attention should be paid to the ecological strategic position of the typical pastoral area of Gurvanbulag in the “China-Mongolia-Russia International Economic Corridor,” and the transformation of ecological lands such as forest, grassland, and water (river, lake, and wetland) into other land (saline-alkali land, sandy land) should be reduced. Based on regional policy and existing problems, we suggest finding new kinetic energy in the economic development of typical pastoral areas, the government designating ecological protection areas, and formulating short- and long-term ecological land protection plans. It is important to ensure rational use of water resources and strive to achieve water and soil balance according to local conditions. Herdsmen should adjust the animal husbandry structure, appropriately reduce the number of goats and sheep, maintain stable land use, and adopt seasonal pastures to avoid excessive grazing. It is also necessary to carry out educational activities, such as resource protection for local herdsmen, improve the public’s awareness of ecological environment protection, and jointly realize the sustainable development of land resources in typical pastoral areas.

5.3. Limitations and Prospects

In this study, the integrated CLUE-S and CA_Markov models were used to describe the correlation between LUCC and driving factors in Gurvanbulag, a typical pastoral area in central Mongolia, from 2000 to 2019. Based on local policies and sustainable development strategies for land resources, different development scenarios (CT and EP) were designed to predict the land use status of the region in 2030 and 2040. In this study, three LUCC phases (2000, 2010, and 2019) were obtained from human-computer interaction interpretation. Although the accuracy reached more than 90%, the classification process of this method was complicated, the calculation time was too long, and subjective disadvantages such as discrimination were unavoidable. Artificial intelligence, deep learning, etc. have greatly improved the automation and accuracy of GIS-related information extraction and played an important role in information extraction from remote sensing images [37]. In the future, not only will the classification of deep learning in LULC types be explored, but also other models and driving factor analysis methods will be considered. In addition, simulating LUCC at the big data level is becoming more and more popular, so neural network technology should be combined with traditional LUCC simulation and prediction tools [38]. In the multi-scenario study, limited by data availability and objective factors, only CT and EP developmental scenarios were considered. In the future, after obtaining relevant data on the ecological minimum red line range and specific land-use planning in local pastoral areas, more policy-based multi-scenario simulation studies will be developed to approach the purpose of actual LUCC.
This study not only grasps the LUCC in a certain period in the typical pastoral areas in central Mongolia, but also provides ideas and methods for choosing which simulation and prediction models can adapt to local conditions. At the same time, the region has different land use resources, ethnic cultural backgrounds, and production and lifestyles, all of which play an important role in the future LUCC of the region. In order to grasp the LUCC of typical pastoral areas and improve the accuracy of its simulation and prediction, local policies should consider the contradiction between the herders’ economic income and the ecological environmental degradation and find a balance between the two. In addition, the optimal choice of the model needs to be based on local policies so that the simulation and prediction of land use are closer to the actual changes, to provide scientific data reference for better formulation of development strategies and the coordinated and sustainable development of typical pastoral areas.

6. Conclusions

Taking the Gurvanbulag area, a typical pastoral area in central Mongolia as an example, this study uses the CLUE-S and CA_Markov models to simulate the LUCC in 2019, and two (CT, EP) development scenarios are provided to predict the temporal and spatial evolution of LUCC in 2030 and 2040. The results show:
1.
Taking each LULC and the average Kappa coefficient as the standard, both models could effectively simulate the LUCC pattern in 2019, and the simulation results of the CLUE-S model were significantly better than those of the CA_Markov model. Further analysis showed that the core part of the CLUE-S model was the spatial analysis module, which is characterized by finding the correlation between each LULC type and each driving factor through logistic regression analysis and using a systematic method to spatially indicate the competitive relationship between each LULC type. Therefore, the model can capture a wider range of LULC types (grassland, water, and other land) that are more dispersed and intensely transformed. The core part of the CA_Markov model considers neighborhood features; therefore, the model is more suitable for the LULC types of the nearest-neighbor change. This is also why the kappa coefficient of residential land is higher than that of the CLUE-S model. To sum up, the CLUE_S model is slightly better than the CA_Markov model in the simulation results of LUCC in typical pastoral areas with relatively slow economic development and low population density.
2.
In the typical pastoral area of Gurvanbulag, from the LUCC situation from 2000 to 2019, the land types with increased area included arable land, grassland, residential land, and other land. Land types with decreasing areas included forest, road, and water. Further analysis of Figure 9 shows that LUCC in this area mainly occurs in the mutual transformation of three land types: grassland, water, and other land, among which grassland and other land increase by 26.81 km² and 31.84 km², respectively. The reduction in water is 54.19 km², which is the land type with the most serious reduction in the area, indicating that the region is at the risk of land resource degradation. It is imperative to formulate ecological environment protection and sustainable development policies.
3.
Under the CT development scenario of the multi-scenario development model, the LUCC in this region will be dominated by the reduction of water and the increase in grassland and other land by 2030 and 2040. This indicates that the region will remain at risk of land resource degradation. In the degradation of land resources represented by other land use types (sandy land, saline-alkali land), the prediction result of CLUE_S is smaller than that of CA_Markov model, indicating that the former is more effective than the latter in combining the needs of local policies for sustainable development. Under the EP development scenario, the LUCC in this region is dominated by the mutual transformation of grassland (decrease) and other land (increase), and the other land area predicted by the CLUE-S model is smaller than that predicted by the CA_Markov model. This shows that the CLUE-S model can better meet the development needs of local policies than the CA_Markov model, in terms of suppressing land degradation. In conclusion, compared with the unconstrained CT development scenario, the EP development scenario is easier to achieve sustainable development of typical pastoral areas.

Author Contributions

Conceptualization, C.S.; methodology, Y.B. (Yulong Bao) and C.S.; software, C.S. and Y.B. (Yulong Bao); formal analysis, C.S.; resources, Y.B. (Yulong Bao) and B.V.; data curation, C.S.; writing—original draft preparation, C.S.; writing—review and editing, C.S. and Y.B. (Yulong Bao); visualization, C.S.; supervision, Y.B. (Yulong Bao) and Y.B. (Yuhai Bao); project administration, Y.B. (Yulong Bao), B.V. and Y.B. (Yuhai Bao); funding acquisition, Y.B. (Yulong Bao). All authors have read and agreed to the published version of the manuscript.

Funding

This paper was funded by the International (Regional) Cooperation and Exchange Project (Grants No. 41961144019), the Inner Mongolia Natural Science Foundation General Project (Grants No. 2021MS04016), the Inner Mongolia Autonomous Region Major Science and Technology Project (Grants No. 2021ZD004503), and the Inner Mongolia Autonomous Region Key R&D and Achievement Transformation Program (Grants No. 2022YFSH0070).

Data Availability Statement

Not applicable.

Acknowledgments

The authors want to thank Inner Mongolia Normal University and the Mongolian Academy of Geography for the free download of the data and the Editor and anonymous reviewers for their careful reading and helpful comments which significantly helped in improving this paper.

Conflicts of Interest

The author declares no conflict of interest.

References

  1. Blumstein, M.; Thompson, J.R.; Nally, R.M. Land-use impacts on the quantity and configuration of ecosystem service provisioning in Massachusetts, USA. J. Appl. Ecol. 2015, 52, 1009–1019. [Google Scholar] [CrossRef]
  2. Hua, A.K. Application of Ca-Markov Model and Land Use/Land Cover Changes in Malacca River Watershed, Malaysia. Appl. Ecol. Environ. Res. 2017, 15, 605–622. [Google Scholar] [CrossRef]
  3. Aquilué, N.; De Cáceres, M.; Fortin, M.-J.; Fall, A.; Brotons, L. A spatial allocation procedure to model land-use/land-cover changes: Accounting for occurrence and spread processes. Ecol. Model. 2017, 344, 73–86. [Google Scholar] [CrossRef]
  4. Uhrqvist, O.; Lövbrand, E. Rendering global change problematic: The constitutive effects of Earth System research in the IGBP and the IHDP. Environ. Politics 2013, 23, 339–356. [Google Scholar] [CrossRef]
  5. Wang, Q.; Wang, H.; Chang, R.; Zeng, H.; Bai, X. Dynamic simulation patterns and spatiotemporal analysis of land-use/land-cover changes in the Wuhan metropolitan area, China. Ecol. Model. 2022, 464, 109850. [Google Scholar] [CrossRef]
  6. Li, D.; Wang, L. Sensitivity of Surface Temperature to Land Use and Land Cover Change-Induced Biophysical Changes: The Scale Issue. Geophys. Res. Lett. 2019, 46, 9678–9689. [Google Scholar] [CrossRef]
  7. Hamad, R.; Balzter, H.; Kolo, K. Predicting Land Use/Land Cover Changes Using a CA-Markov Model under Two Different Scenarios. Sustainability 2018, 10, 3421. [Google Scholar] [CrossRef] [Green Version]
  8. Zhou, L.; Dang, X.; Sun, Q.; Wang, S. Multi-scenario simulation of urban land change in Shanghai by random forest and CA-Markov model. Sustain. Cities Soc. 2020, 55, 102045. [Google Scholar] [CrossRef]
  9. Guan, D.; Zhao, Z.; Tan, J. Dynamic simulation of land use change based on logistic-CA-Markov and WLC-CA-Markov models: A case study in three gorges reservoir area of Chongqing, China. Environ. Sci. Pollut. Res. Int. 2019, 26, 20669–20688. [Google Scholar] [CrossRef]
  10. Verburg, P.H.; Neumann, K.; Nol, L. Challenges in using land use and land cover data for global change studies. Glob. Chang. Biol. 2011, 17, 974–989. [Google Scholar] [CrossRef]
  11. Zhou, R.; Zhang, H.; Ye, X.-Y.; Wang, X.-J.; Su, H.-L. The Delimitation of Urban Growth Boundaries Using the CLUE-S Land-Use Change Model: Study on Xinzhuang Town, Changshu City, China. Sustainability 2016, 8, 1182. [Google Scholar] [CrossRef] [Green Version]
  12. Santoso, E.B.; Aulia, B.U.; Desiana, T.A. Ecological Footprint Scenario Based on Dynamic System Model in Gerbangkertosusila Region. Int. Rev. Spat. Plan. Sustain. Dev. 2022, 10, 99–116. [Google Scholar] [CrossRef]
  13. Liao, G.; He, P.; Gao, X.; Lin, Z.; Huang, C.; Zhou, W.; Deng, O.; Xu, C.; Deng, L. Land use optimization of rural production–living–ecological space at different scales based on the BP–ANN and CLUE–S models. Ecol. Indic. 2022, 137, 108710. [Google Scholar] [CrossRef]
  14. Liu, X.; Liang, X.; Li, X.; Xu, X.; Ou, J.; Chen, Y.; Li, S.; Wang, S.; Pei, F. A future land use simulation model (FLUS) for simulating multiple land use scenarios by coupling human and natural effects. Landsc. Urban Plan. 2017, 168, 94–116. [Google Scholar] [CrossRef]
  15. Li, F.; Wang, L.; Chen, Z.; Clarke, K.C.; Li, M.; Jiang, P. Extending the SLEUTH model to integrate habitat quality into urban growth simulation. J Environ. Manag. 2018, 217, 486–498. [Google Scholar] [CrossRef] [Green Version]
  16. Ren, Y.; Lü, Y.; Comber, A.; Fu, B.; Harris, P.; Wu, L. Spatially explicit simulation of land use/land cover changes: Current coverage and future prospects. Earth-Sci. Rev. 2019, 190, 398–415. [Google Scholar] [CrossRef]
  17. Johnson, D.A.; Sheehy, D.P.; Miller, D.; Damiran, D. Mongolian rangelands in transition. Sci. Chang. Planétaires/Sécheresse 2006, 17, 133–141. [Google Scholar]
  18. Sneath, D. Land use, the environment and development in post-socialist Mongolia. Oxf. Dev. Stud. 2003, 31, 441–459. [Google Scholar] [CrossRef]
  19. Yang, Y.; Liu, Y.; Xu, D.; Zhang, S. Use of intensity analysis to measure land use changes from 1932 to 2005 in Zhenlai County, Northeast China. Chin. Geogr. Sci. 2017, 27, 441–455. [Google Scholar] [CrossRef]
  20. Huang, D.; Huang, J.; Liu, T. Delimiting urban growth boundaries using the CLUE-S model with village administrative boundaries. Land Use Policy 2019, 82, 422–435. [Google Scholar] [CrossRef]
  21. Wu, M.; Ren, X.; Che, Y.; Yang, K. A Coupled SD and CLUE-S Model for Exploring the Impact of Land Use Change on Ecosystem Service Value: A Case Study in Baoshan District, Shanghai, China. Environ. Manag. 2015, 56, 402–419. [Google Scholar] [CrossRef] [PubMed]
  22. Mokarram, M.; Pourghasemi, H.R.; Hu, M.; Zhang, H. Determining and forecasting drought susceptibility in southwestern Iran using multi-criteria decision-making (MCDM) coupled with CA-Markov model. Sci. Total Environ. 2021, 781, 146703. [Google Scholar] [CrossRef] [PubMed]
  23. Wang, R.; Derdouri, A.; Murayama, Y. Spatiotemporal Simulation of Future Land Use/Cover Change Scenarios in the Tokyo Metropolitan Area. Sustainability 2018, 10, 2056. [Google Scholar] [CrossRef] [Green Version]
  24. Nath, B.; Wang, Z.; Ge, Y.; Islam, K.; Singh, R.P.; Niu, Z. Land Use and Land Cover Change Modeling and Future Potential Landscape Risk Assessment Using Markov-CA Model and Analytical Hierarchy Process. ISPRS Int. J. Geo-Inf. 2020, 9, 134. [Google Scholar] [CrossRef] [Green Version]
  25. Mansour, S.; Al-Belushi, M.; Al-Awadhi, T. Monitoring land use and land cover changes in the mountainous cities of Oman using GIS and CA-Markov modelling techniques. Land Use Policy 2020, 91, 104414. [Google Scholar] [CrossRef]
  26. Fu, X.; Wang, X.; Yang, Y.J. Deriving suitability factors for CA-Markov land use simulation model based on local historical data. J Environ. Manag. 2018, 206, 10–19. [Google Scholar] [CrossRef]
  27. Dalantai, S.; Sumiya, E.; Bao, Y.; Otgonbayar, M.; Mandakh, U.; Batsaikhan, B.; Natsagdorj, B. Spatial-Temporal Changes of Land Degradation Caused by Natural and Human Induced Factors: Case Study of Bulgan Province in Central Mongolia. Int. Arch. Photogramm. Remote Sens. Spat. Inf. Sci. 2021, XLIII-B4-2021, 79–85. [Google Scholar] [CrossRef]
  28. Kakinuma, K.; Yanagawa, A.; Sasaki, T.; Rao, M.P.; Kanae, S. Socio-ecological Interactions in a Changing Climate: A Review of the Mongolian Pastoral System. Sustainability 2019, 11, 5883. [Google Scholar] [CrossRef] [Green Version]
  29. Wang, Q.; Liu, R.; Men, C.; Guo, L. Application of genetic algorithm to land use optimization for non-point source pollution control based on CLUE-S and SWAT. J. Hydrol. 2018, 560, 86–96. [Google Scholar] [CrossRef]
  30. Verburg, P.H.; Eickhout, B.; van Meijl, H.J. A multi-scale, multi-model approach for analyzing the future dynamics of European land use. Ann. Reg. Sci. 2008, 42, 57–77. [Google Scholar] [CrossRef] [Green Version]
  31. Gong Wenfeng, Y.L.; Wenyi, F. Land use change and forecast in Harbin based on CA-Markov. Chin. J. Agric. Eng. 2012, 28, 8. [Google Scholar] [CrossRef]
  32. Liu, S.; Yu, Q.; Wei, C. Spatial-Temporal Dynamic Analysis of Land Use and Landscape Pattern in Guangzhou, China: Exploring the Driving Forces from an Urban Sustainability Perspective. Sustainability 2019, 11, 6675. [Google Scholar] [CrossRef] [Green Version]
  33. Shu, B.; Zhang, H.; Li, Y.; Qu, Y.; Chen, L. Spatiotemporal variation analysis of driving forces of urban land spatial expansion using logistic regression: A case study of port towns in Taicang City, China. Habitat Int. 2014, 43, 181–190. [Google Scholar] [CrossRef]
  34. Zhai, Y.; Yao, Y.; Guan, Q.; Liang, X.; Li, X.; Pan, Y.; Yue, H.; Yuan, Z.; Zhou, J. Simulating urban land use change by integrating a convolutional neural network with vector-based cellular automata. Int. J. Geogr. Inf. Sci. 2020, 34, 1475–1499. [Google Scholar] [CrossRef]
  35. Baatar. Development Trend of Mongolian Agriculture and Animal Husbandry. World Agric. 1999, 16–18. [Google Scholar]
  36. Ren, Y.; Li, Z.; Li, J.; Ding, Y.; Miao, X. Analysis of Land Use/Cover Change and Driving Forces in the Selenga River Basin. Sensors 2022, 22, 1041. [Google Scholar] [CrossRef]
  37. Rafiei Sardooi, E.; Azareh, A.; Mesbahzadeh, T.; Soleimani Sardoo, F.; Parteli, E.J.R.; Pradhan, B. A hybrid model using data mining and multi-criteria decision-making methods for landslide risk mapping at Golestan Province, Iran. Environ. Earth Sci. 2021, 80, 487. [Google Scholar] [CrossRef]
  38. Basse, R.M.; Omrani, H.; Charif, O.; Gerber, P.; Bódis, K. Land use changes modelling using advanced methods: Cellular automata and artificial neural networks. The spatial and explicit representation of land cover dynamics at the cross-border region scale. Appl. Geogr. 2014, 53, 160–171. [Google Scholar] [CrossRef]
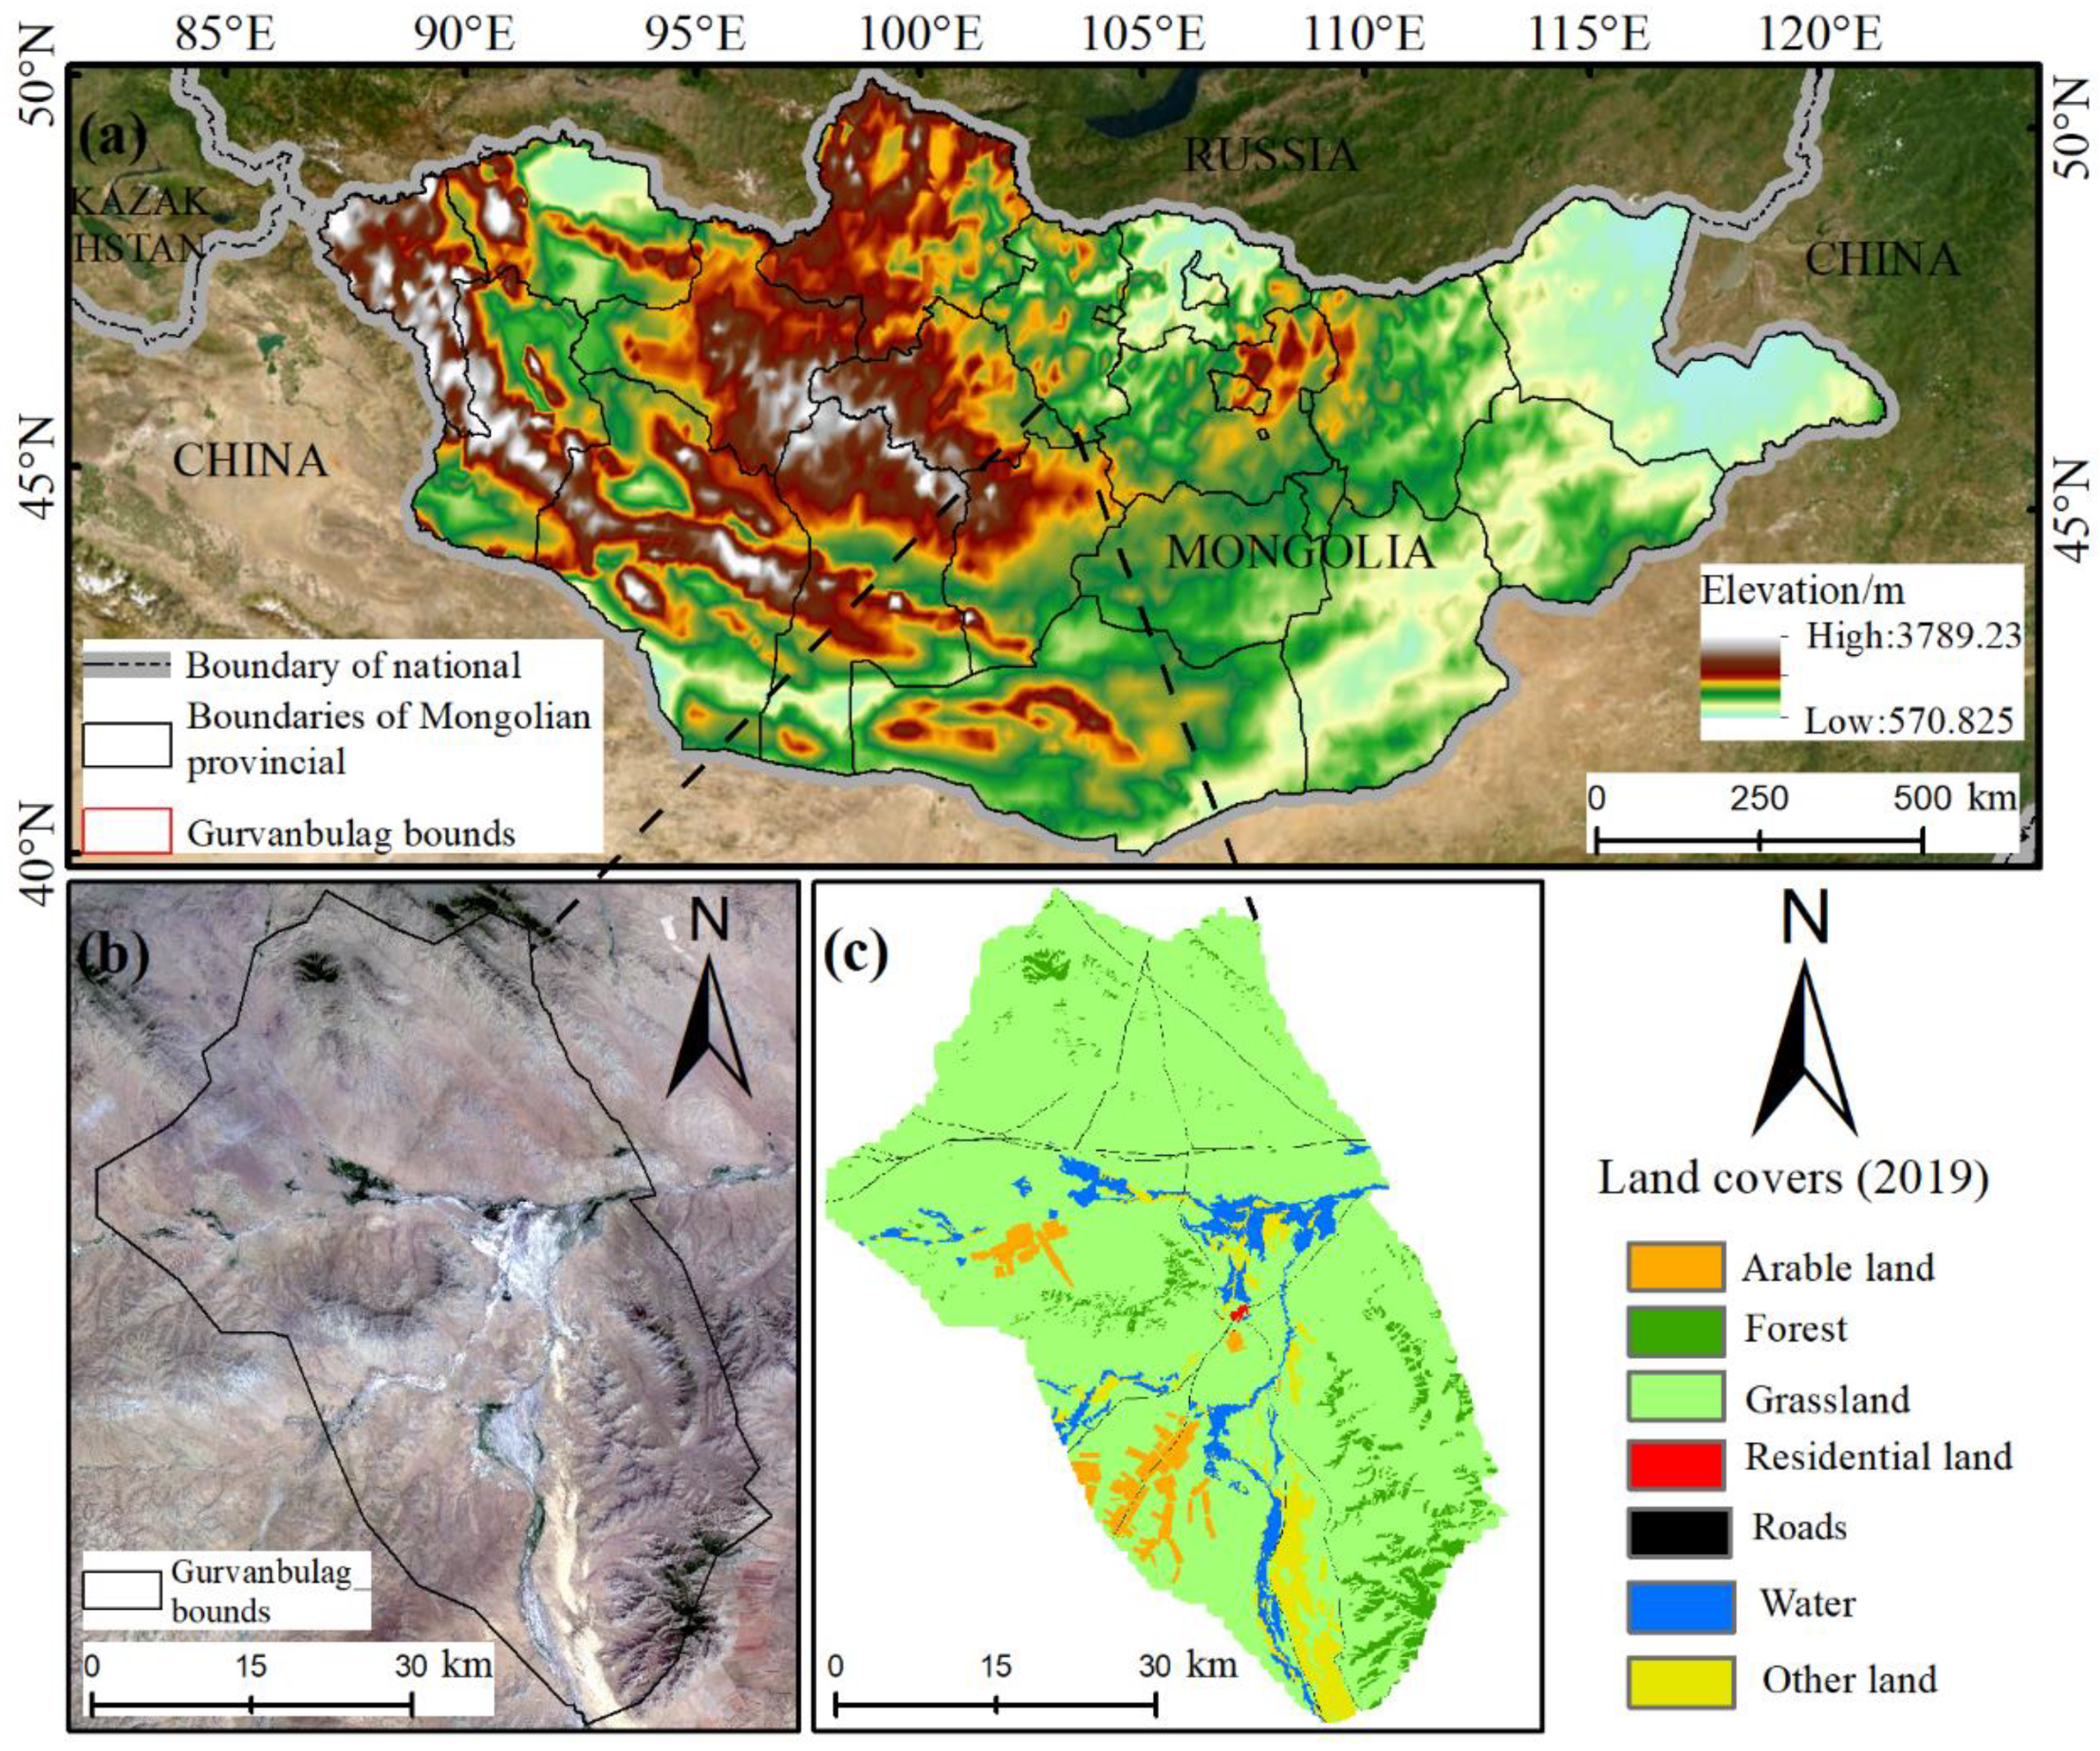
Figure 1. Location of the study area. (a) Mongolian provinces and borders of neighboring countries; (b) RGB image of Landsat OLI showing the study area; (c) LUCC map of the study area in 2019.
Sustainability 14 15707 g001
Figure 2. Land-use maps of Gurvanbulag for 2000 (a), 2010 (b) and 2019 (c).
Sustainability 14 15707 g002
Figure 3. Overview of information flow in the CLUE-S model.
Sustainability 14 15707 g003
Figure 4. Flowchart of the proposed method.
Sustainability 14 15707 g004
Figure 5. Suitability map of each land use type in 2010.
Sustainability 14 15707 g005
Figure 6. ROC curve of each driving factor in 2010.
Sustainability 14 15707 g006
Figure 7. The status of land use in 2019 (a) and simulation map of CLUE-S (b), and CA_Markov (c).
Sustainability 14 15707 g007
Figure 8. Mutual transformation of LULC types in Gurvanbulag from 2000–2019.
Sustainability 14 15707 g008
Figure 9. Schematic diagram of Sankey land use transfer from 2000–2019.
Sustainability 14 15707 g009
Figure 10. CLUE-S (a) and CA_Markov (b) models predict LUCC in 2030 and 2040, respectively, under the CT development scenario.
Sustainability 14 15707 g010
Figure 11. Simulated and predicted LULC maps in 2030 and 2040 by two models based on CT development scenarios.
Sustainability 14 15707 g011
Figure 12. CLUE-S (a) and CA_Markov (b) models predict LUCC in 2030 and 2040, respectively, under the EP development scenario.
Sustainability 14 15707 g012
Figure 13. Simulated and predicted LULC maps in 2030 and 2040 by two models based on EP development scenarios.
Sustainability 14 15707 g013
Table 1. List of data in this study and data sources.
CategoryDataYearData Resource
ImagesLandsat TM/OLI2000–2019https://earthexplorer.usgs.gov/ (accessed on 25 April 2020)
TerrainDEM/Aspect/Slope-https://earthexplorer.usgs.gov/ (accessed on 6 December 2020)
Statistical Yearbook dataActual land use area2000–2014Mongolian Institute of Geography
Weather station dataTemperature/Precipitation2000–2019Mongolian Institute of Geography
Social statisticsAverage population density/Average livestock density2000–20191212.mn
Table 2. Simulation and prediction of conversion elasticity of land use types under different scenarios.
ScenarioArableForestGrasslandResidential LandRoadWaterOther Land
2010–2019 0.60.60.110.80.10.1
2019–2030–2040CT0.60.60.110.80.10.1
EP0.60.80.310.810.1
Note: CT and EP represent Current Trends and Ecological Protection development scenarios, respectively.
Table 3. LULC constraints and weight ratios in 2010.
Driving
Factor
Arable LandForestGrasslandResidential LandRoadWaterOther Land
Dem0.005(−)0.071(+)0.006(−)-0.013(+)0.068(−)0.005(−)
Slope0.004(+)0.084(+)0.019(+)---0.009(−)
Aspect-0.006(+)----0.001(+)
Distance to
Residential
---0.044(−)---
Distance to
Road
----0.073(−)--
Distance to
Water
-----0.165(−)-
Population density0.889(−)-0.543(+)0.956(+)--0.739(−)
Livestock Density0.016(−)-0.029(−)---0.034(+)
Precipitation0.087(−)0.839(−)0.403(+)-0.913(−)0.769(−)0.212(−)
Note: “-” Indicates that the constraints are not included, “(−)” indicates a negative correlation, and “(+)” indicates a positive correlation.
Table 4. Comparison of Kappa coefficients of various LULC types simulated by CLUE-S and CA_Markov models in 2019.
LULC TypesCLUE-SCA_Markov
Arable land0.9958920.963588
Forest0.957160.90314
Grassland0.9208650.809894
Residential land0.666560.749774
Road11
Water0.712420.624952
Other land0.7143280.679071
Average Kappa0.8524610.818631
Table 5. Transition matrix of LULC change in the Gurvanbulge region from 2000 to 2019 (km²).
2019
2000
ArableForestGrasslandResidential
Land
RoadWaterOther LandAll
Arable78.81-0.27----79.08
Forest-112.539.11----121.64
Grassland0.464.322155.180.590.424.0013.172178.14
Residential
land
---1.02---1.03
Road0.04-0.840.0115.860.030.0416.81
Water--33.43-0.02118.9825.48177.92
Other land--6.12--0.7373.8180.66
All79.31116.852204.951.6216.30123.73112.502655.26
Note: “-” indicates the land use types that has not been converted.
Publisher’s Note: MDPI stays neutral with regard to jurisdictional claims in published maps and institutional affiliations.