Abstract
FPR reinforcing bars have emerged as a promising alternative to steel bars in construction, especially in corrosive environments. Literature includes several shear strength models proposed for FRP-RC members. This study presents a detailed evaluation of design shear models proposed by researchers and design codes. The evaluation was conducted through an extensive surveyed database of 388 FRP-RC beams without shear reinforcement tested in shear. Gene expression programming (GEP) has been utilized in this study to develop accurate design models for the shear capacity of slender and deep FRP-RC beams. Parameters used in the models are concrete compressive strength (f’c), section depth (d), section width (b), modular ratio (n), reinforcement ratio (ρf), shear span-to-depth ratio (a/d). The proposed model for slender beams resulted in an average tested-to-predicted ratio of 0.98 and a standard deviation of 0.21, while the deep beams model resulted in an average tested-to-predicted ratio of 1.03 and a standard deviation of 0.29. For deep beams, the model provided superior accuracy over all models. However, this can be attributed to the fact that the investigated models were not intended for deep beams. The deep beams model provides a simple method compared to the strut-and-tie method.
1. Introduction
Steel corrosion is one of the main challenges in steel-reinforced concrete structures, especially when exposed to harsh weather conditions. In addition, the rehabilitation cost of deteriorated reinforced concrete elements is considered significantly high [1]. As an alternative cost-effective solution, fiber-reinforced polymers (FRP) bars have emerged as a promising alternative to steel bars due to their high corrosion resistance, durability, and the strength-to-weight ratio [2]. FRP bars encompass aligned fibers made of carbon (CFRP), glass (GFRP), basalt (BFRP), or aramid (AFRP) and are recognized for their linear elastic behavior until failure with no yielding behavior. Generally, FRP bars have higher tensile strength than steel bars; however, they have a lower elastic modulus depending on the type of fibers.
In the last two decades, extensive research has been conducted to investigate the flexural and shear behavior of FRP-reinforced concrete (FRP-RC) elements. This research formed the basis of design provisions for FRP-RC structures such as ACI-440 and CSA-S806 [1]. However, FRP-RC members are not widely used in design and construction. This could be attributed to the lack of unified understanding and theories that describe the complex shear behavior of FRP-RC and the relatively high conservatism in the available models [3]. Several sophisticated approaches to model the shear behavior have been proposed [3]; however, due to their complexity, it is difficult to be adopted by design provisions. This led to the development of a simplified empirical design equation for design (ACI 318-19, EC). Unfortunately, these simplified approaches do not allow for an extension or development of the model to incorporate changes and advances in material technology (such as FRP bars). As a result, a new model is often required [3]. The distinctive properties of FRP bars compared to steel bars in terms of tensile strength and elastic modulus implies that the shear behavior of FRP-RC beams differs from steel-RC beams. In addition, the design and the behavior of deep beams significantly differ from slender beams. Therefore, the impact of the shear span ratio, FRP modulus of elasticity, and FRP strength on the predicted shear capacity of FRP-reinforced concrete beams without shear reinforcement should be addressed.
In recent years, development in data-driven machine learning approaches for investigating behavior, failure mode, and capacity of different RC elements has been witnessed. Alam et al., 2021 [4] used an experimental database to construct and test a hybrid model of Bayesian optimization algorithm-based support vector regression (BOA–SVR) for estimating the shear strength of FRP-RC beams without stirrups. The model revealed high prediction accuracy compared to artificial intelligence (AI) and code-based models. Solhmirzaei et al. (2020) [5] proposed a machine-learning framework to predict the failure mode and shear capacity of ultra-high performance concrete (UHPC) with steel fibers. The framework first utilizes classification algorithms such as a support vector machine (SVM), artificial neural networks (ANN), and k-nearest neighbor (k-NN), along with an extensive experimental database to predict the failure mode. Then, genetic expression programming (GEP) was utilized to provide a capacity model for each failure mode. The proposed framework yielded superior accuracy compared to several proposed models by other researchers and design provisions. Tarawneh et al. (2022) [1] utilized a comprehensive experimental database of 241 tested FRP-RC columns to construct a robust Bayesian-regularization-based ANN model. The model is then used to develop strength-interaction diagrams for eccentrically loaded FRP-RC columns and to locate the slenderness limit for GFRP and CFRP columns. Similarly, Eman et al. (2022) [6] utilized the SVM algorithm and comprehensive experimental database of FRP-RC beams in flexure to identify the failure mode and proposed a new failure mode rule. The trained model was used to evaluate the deformability of FRP-RC beams. The application of machine learning has been extended to a wide range of applications recently and provides great potential. Ghassan et al. [7] assessed the ability of several machine learning methods to develop a comprehensive shear capacity model for short steel links. The study utilized Extreme Gradient Boosting (XGBOOST), a Light Gradient Boosting Machine (LightGBM), and Artificial Neural Network (ANN) algorithms. The overall outcomes showed that the LightGBM outperformed the XGBOOST model. Moreover, the overstrength ratio predicted by the LightGBM showed an excellent performance compared to the Gene Expression and Finite Element-based models. The utilization of machine learning has been engineering management applications, where Alshboul et al. [8] developed a mathematical model to explore the balance of supply and demand under deflationary conditions for external green construction support and the accompanying spending adjustment processes. Tarawneh et al. [9] indicated that the reliability of the machine learning prediction model is higher than conventional regression models.
Although the ANN technique was efficiently utilized to predict the shear strength of FRP-RC beams without stirrups [10,11,12,13], GEP is recognized for its ability to develop reliable prediction models in the form of a mathematical model. GEP mimics Darwin’s evolution process in developing the mathematical model, as explained later. Murad et al. successfully applied GEP to developing predictive models for the shear strength of reinforced concrete columns subjected to biaxial cyclic loading [14] and flexural strength for FRP-reinforced beams [15].
This paper surveyed a large worldwide database of 388 slender and deep FRP-RC beams tested in shear. Beams were classified into slender and deep based on the shear span-to-depth ratio (a/d) of 2.5 as recommended by James K. Wight and Macgregor [16]. First, the surveyed database was used to evaluate several literature models and design provisions comprehensively. Secondly, the study utilizes the surveyed database and Gene Expression Programming (GEP) to develop a reliable and robust model for the shear strength of FRP-RC slender and deep beams. The importance of the study arises from: (1) The study utilizes an extensive database with a wide range of properties alongside GEP to generate shear models for FRP-RC beams. (2) There is no shear model or an adopted strut-and-tie method for deep FRP-RC beam. (3) Comparing the performance of several models to the developed models.
2. Existing Shear Strength Models
This section presents some of the existing design models proposed for the shear capacity of FRP-RC beams. A later section presents a statistical analysis of the accuracy of these design models. It should be noted that the discussed models were intended for slender beams; however, they will be tested for slender and deep beams in this study.
2.1. Shear Model by ACI 440-15
According to the ACI 440-15 [17], the design philosophy of FRP-RC for shear is similar to steel-RC beams taking into account the lower elastic modulus and the low transverse shear resistance. The lower elastic modulus will result in wider cracks and a smaller compression region compared to steel-RC. The ACI 440 requires multiplying the ACI 318-14 shear equation by the parameter 2.5 k as suggested by Tureyen and Frosh [18]. The suggested shear strength design (Vc) is as follows:
2.2. Shear Model by ACI 440-22
In 2022 a public draft for discussion has been released showing the expected changes in the ACI 440-22. The public draft shows the inclusion of the size effect factor and a lower limit for the shear capacity, as recommended by Nanni et al. [19]. The shear nonmail capacity is as follows:
2.3. Shear Model by Canadian Standard Code CAN/CSA S806 (2012)
In The Canadian code CSA S806 (2012) [20], shear design provisions are based on the equation proposed by Razaqpur and Isgor (2006) [21], where shear strength is calculated according to the following:
2.4. Shear Model by JSCE-97
According to JSCE-97 [22], the value of Vc is calculated following the expression presented in Equation (15). It is worth noting that Equation (21) accounts for the size effect and the axial stiffness of FRP reinforcement using the and factors.
2.5. Shear Model by Nehdi et al. (2007)
Nehdi et al. (2007) [23] collected a database of 168 specimens of FRP-RC beams with and without transverse reinforcement tested under shear load from published literature to develop an equation capable of predicting the shear strength of FRP-RC beams with or without transverse reinforcement using a machine-learning technique (genetic expression), The proposed model by Nehdi is presented in the following Equation
2.6. Shear Model by Hoult et al. (2008)
The shear model proposed by Hoult et al. [24] is a modification of the CSA shear provisions for steel-reinforced members, which are based on modified compression field theory by adjusting the term Es As to Efl Afl (Equation (25)). The proposed model was verified by a database of 398 specimens of FRP-RC beams tested under shear force.
2.7. Shear Model by Kara (2011)
Kara [25] compiled a database of 104 FRP-RC specimens with 91 beam specimens and 13 one-way slab specimens. All specimens had no transverse reinforcement and exhibited shear failure. To develop a shear model, Kara utilized a machine learning algorithm along with compiled database, as shown in Equation (27).
The constants in the Equation are:
2.8. Shear Model by Mari et al. (2013)
Based on the principles of structural mechanics and the experimentally observed behavior of RC beams at shear-flexural failure, Mari et al. [26] develop an equation with a compression chord model capable of predicting the shear strength of FRP-RC beams without transverse reinforcement. The accuracy of the Equation has been verified by comparison with a database of 144 specimens of FRP-RC beams under a shear test, such that:
2.9. Shear Model by Bažant and Yu (2005)
Bažant and Yu (2005) [27] developed a shear model for steel-reinforced beams using a database of 398 specimens. This Equation was proposed by ACI Committee 446 to update the current ACI 318 code and is given below.
2.10. Shear Model by ACI 318-19
According to the ACI 318-19 [28], for nonprestressed members and , Vc can be taken as (Equation (34)). The size effect factor, λs, is given by (Equation (35)), which identifies that the reduction in shear strength with depth begins at 250 mm.
2.11. Shear Model by Kaszubska et al. (2018)
Kaszubska et al. [29] developed an equation (Equation (11)) based on the modified compression field theory to assess FRP-RC beams with or without transverse reinforcement; this Equation was assessed with a database of 215 specimens under a shear test and compared with recent recommendations:
2.12. Shear Model by Ebid and Deifalla (2021)
In 2021, Ebid and Deifalla [30] collected a database of 533 FRP-RC beams with or without transverse reinforcement tested under a shear load to develop a new equation to predict the shear strength using a genetic programming technique; this Equation is given as follows
3. Surveyed Database
A worldwide experimental database of 388 FRP-RC beam specimens without shear reinforcement tested under shear force was surveyed. Two hundred eighty-eight specimens were classified as slender beams based on a shear-span-to-depth ratio of a/d > 2.5, and 100 specimens as deep beams with a/d < 2.5. All specimens were tested in a simple supporting configuration under a three-point or four-point load test, reinforced with different types of FRP bars; CFRP, GFRP, and BFRP. Parameters collected for each specimen are cross-sectional dimensions, effective depth, shear-span-to-depth ratio (a/d), concrete compressive strength (f′c), FRP type, reinforcement ratio (ρ), and modulus of elasticity of FRP bars (Ef). The range of the variables in the database is presented in Figure 1, and a summary of the collected database is listed in Table 1 and Table 2.
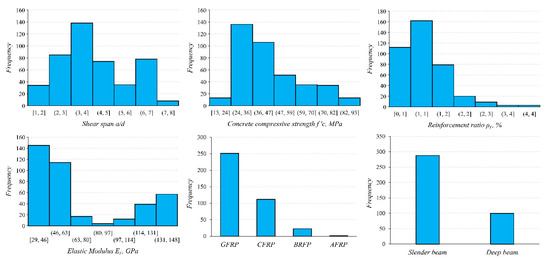
Figure 1.
Distribution of variables for the surveyed FRP-RC beams.

Table 1.
Summary of surveyed slender beams database.
Table 2.
Summary of surveyed deep beams database.
4. Performance of Shear Strength Models
The accuracy of the shear models discussed in the previous sections to predict the shear capacity of the FRP-RC beams was evaluated, as shown in Figure 2, Figure 3 and Figure 4. The graphical demonstration presents the experimental-to-predicted shear capacity (Vc test/Vc predicted) for each of the models discussed earlier with respect to the shear-span ratio and the concrete compressive strength. The conservatism and scatteredness for each method are presented using the average model error (Vc test/Vc predicted) and the standard deviation of each method. Results for slender beams (a/d < 2.5) are presented in Figure 2 and Figure 3, while Figure 4 shows the results of deep beams (a/d > 2.5).
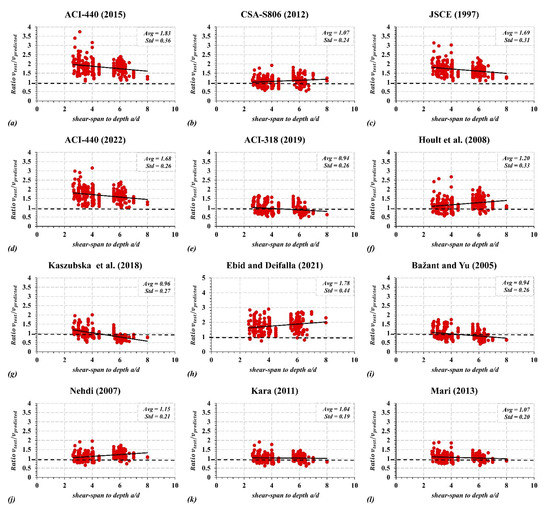
Figure 2.
Experimental-to-prediction shear capacity of slender FRP-RC beams with respect to shear-span to depth ratio a/d.
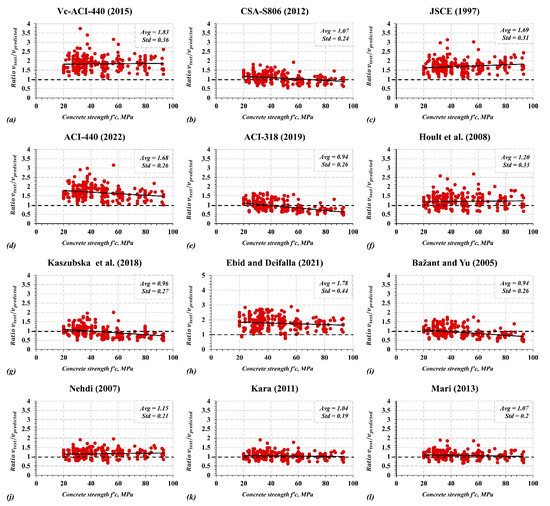
Figure 3.
Experimental-to-prediction shear capacity of slender FRP-RC beams with respect to the concrete compressive strength f′c.
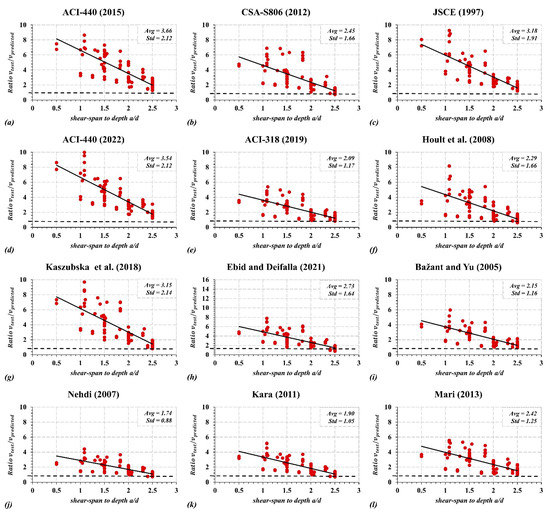
Figure 4.
Experimental-to-prediction shear capacity of deep FRP-RC beams with respect to shear-span to depth ratio a/d.
Compared with the other models, the ACI 318-19, the Bažant and Yu, Kara, and Mari et al. models demonstrate less scatteredness, as shown in Figure 2 and Figure 3. Interestingly, the ACI 318-19 model for steel-RC beams proposed by Danieal et al. performed better than the ACI 440 models proposed for FRP-RC beams, although it does not account for the axial stiffness of FRP bars. In contrast, JSCE, Ebid and Deifalla, Hoult et al., and ACI 440 (2015) models provided the highest scatteredness and standard deviation. In addition, Ebid and Deifalla, JSCE, and ACI 440 (2015) models underestimate shear capacity with an average shear capacity ratio (Vc test/Vc predicted) of 1.77, 1.69, and 1.83, respectively. Including the size effect in the ACI 440-22 and a minimum shear capacity has notably improved the prediction by reducing model error (Vc test/Vc predicted) and the standard deviation from 1.83 to 1.68 and from 0.37 to 0.34, respectively, highlighting the importance of including this effect. The ACI 440-22 changes improve the predictions for members with low reinforcement ratios.
The trend line in Figure 2 and Figure 3 demonstrate the prediction accuracy with respect to shear span ratio and concrete compressive strength. For instance, the flat trendline for the Kara and Mari models in Figure 2 and Figure 3 implies a consistent prediction accuracy for the range of concrete compressive strength and shear span-to-depth ratio. In contrast, the negative slope in the Kaszubska et al. model in Figure 2 and Figure 3 indicates an overestimation (unconservative) in the beam shear capacity as the concrete compressive strength and shear-span-to-depth increase. In addition, it can be noted that the models by Kara and Mari et al. produce flat trendlines and similar prediction performance. Generally, all models produce acceptable trendlines with respect to compressive strength except for the Kaszubska and ACI 318-19 models.
The normalized shear capacity (Vc test/Vc predicted) in Figure 4 shows that all selected models fail to present the behavior of deep beams. The steep negative slope trendlines in Figure 4 demonstrate a high underestimation of the shear capacity in the short shear-span-to-depth ratio. Ebid’s (2021) model resulted in an average normalized shear capacity (Vc test/Vc predicted) and standard deviation of 5.44 and 3.17, respectively, which are the highest among all models. In contrast, Nehdi’s (2007) model resulted in the lowest average Vc test/Vc predicted and standard deviation of 1.66 and 0.90, respectively.
5. Gene Expression Programming (GEP)
Holland proposed genetic algorithms (GAs) in the 1960s due to the development of computer systems and their applications in evolution theory [70]. The solution to a problem using GAs can be extended to other applications that include multiple parameters. Cramer (1985) [71] and Koza (1992) [72] developed genetic programming to tackle the problem of fixed-length solutions by constructing nonlinear entities of various sizes and forms. In 2001, the gene expression programming (GEP) technique that combines genetic programming (GP) with GAs was presented by Ferreira [73]. GEP introduced the evolution of the genome using expression trees that allow the implementation of multiple genes providing an efficient solution that can be easily read and expressed. The generated mathematical expression in GEP gives it an advantage over other machine learning methods, such as artificial neural networks (ANNs), that make it difficult to track the solution and are commonly referred to as Blackbox tools. In general, the high capabilities of machine learning stimulate researchers to utilize it to handle complex problems such as estimating seismic demands models for building [74], the axial capacity of FRP-RC columns [75], and developing surrogate models for holistic performance-based assessment [76].
The GEP process consists of five elements: (1) the function shape that includes the mathematical triggers required to use them. (2) The peripheral group consists of the symbolic characterization of variables. (3) Fitness function that evaluates chromosome performance compared to the rest of the population (chromosomes), such as squared medium root error (RMSE). (4) Control of variables. (5) Stopping criteria. Figure 5 shows the GEP algorithm used to generate the expression tree [14,15].
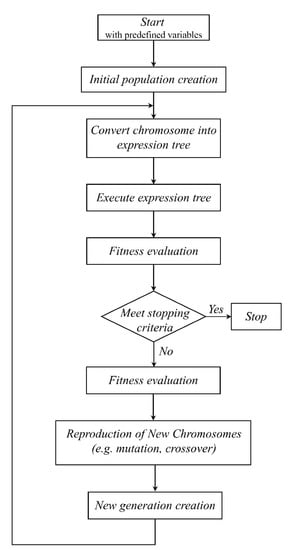
Figure 5.
Gene expression evolution algorithm.
The first step in the algorithm is to choose the five items mentioned earlier. The first functions are produced randomly using the specified function form and the terminals. The process is repeated for a certain number of generations or until a good classification rate has been found. The created functions are then performed and converted into a tree structure. After that, the results of the functions produced are evaluated by use of the fitness function; if the results are satisfactory, the process is terminated.
The final result is illustrated in the form of tree structures. These trees, known as GEP expression trees, allow the description of mathematical functions created in an easy-to-read format [14,15] (Figure 6).
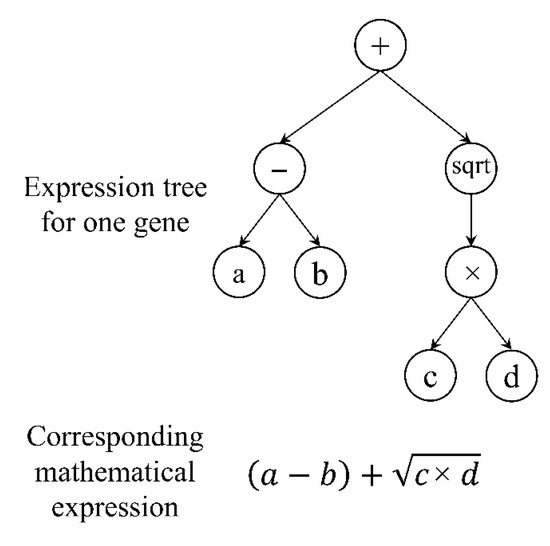
Figure 6.
Expression tree and corresponding mathematical expression.
6. Proposed Model
GEP machine learning is used as a powerful computational tool to develop a model shear capacity of FRP-RC beams without shear reinforcement by utilizing the compiled database. Different parameters are employed for developing the GEP prediction model; these parameters control the prediction model and the generalization capability. The utilized parameters for developing the GEP model are shown in Table 3. The selection of the parameters was based on multiple trials. In each trial, one variable varies while the others remain constant. Trials were compared based on the coefficient of variation (CoV) of the calculated-to-measured ratio. In addition, basic mathematical operations were selected in the function set to produce a simple model.
Table 3.
GEP selected parameters.
Following the procedure discussed in the previous section, the developed models for the shear capacity of slender and deep beams are shown in Equations (40) and (41). The prediction accuracy for the training and testing datasets for each model is shown in Figure 7. The selected variables in the GEP algorithms for the case of slender beams include concrete compressive strength (f’c), section depth (d), section width (b), modular ratio (n), and reinforcement ratio (ρf). In addition to the previous parameters, the deep beam model includes a shear span-to-depth ratio (a/d). The proposed model for slender beams resulted in an average tested-to-predicted ratio of 0.98 and a standard deviation of 0.21, while the deep beams model resulted in an average tested-to-predicted ratio of 1.03 and a higher standard deviation of 0.29 due to its complex behavior and the limited number of experimental data. To assess the accuracy of the proposed models and the consistency of the prediction with respect to other variables, the ratios of the test-to-predicted values were plotted for different variables, as shown in Figure 8 and Figure 9. The horizontal trendlines in Figure 8 and Figure 9 indicate consistent predictions over the entire range of the variables.
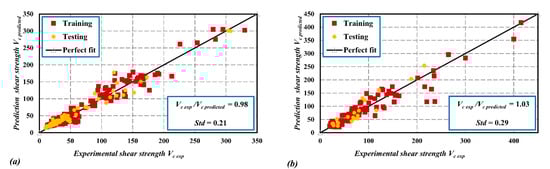
Figure 7.
Predicted vs. tested shear strength for (a) slender beam model, (b) deep beam model.
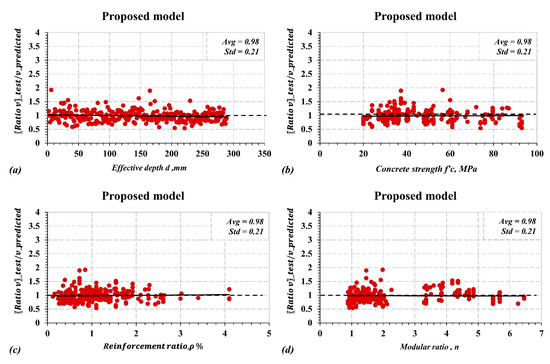
Figure 8.
Prediction accuracy (Vc test/Vc predicted) of the proposed model for slender beams with respect to (a) effective depth; (b) concrete compressive strength; (c) reinforcement ratio; (d) modular ratio.
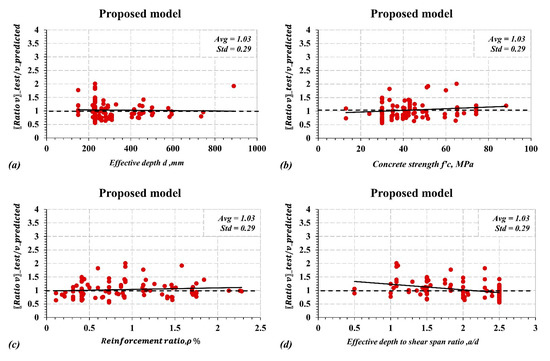
Figure 9.
Prediction accuracy (Vc test/Vc predicted) of the proposed model for deep beams with respect to: (a) effective depth; (b) concrete compressive strength; (c) reinforcement ratio; (d) effective depth-to-shear-span ratio.
The accuracy of the proposed GPE model compared to other models in the literature can be summarized in the bar charts in Figure 10 and Figure 11 in terms of the average tested-to-predicted ratios and standard deviation. Overall the proposed model demonstrates reasonable accuracy in predicting shear capacity compared to the model proposed by Mari 2013, Kara, 2011, Bažant and Yu 2005, and the ACI 318-19 models. However, the superiority of predicting shear strength is more prominent in the case of deep beams. This can be attributed to the fact that the design models were not intended for deep beams.
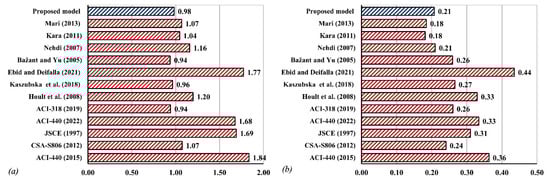
Figure 10.
Bar chart comparison between the existing and proposed model for slender beams based on (a) Average (Vc test/Vc predicted) (b) Standard deviation.
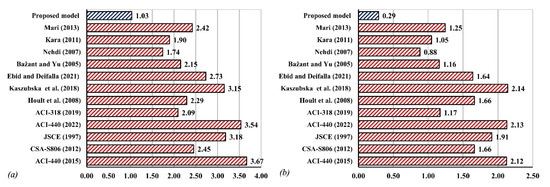
Figure 11.
Bar chart comparison between the existing and proposed model for deep beams based on (a) Average (Vc test/Vc predicted) (b) Standard deviation.
There are many factors behind this discrepancy, such as the complex interaction between FRP rebars and beams, the large extensibility of FRP rebars, which may affect the transferred shear forces throughout the beam section, and the inefficiency of various models for estimating the contribution of most significant parameters in the shear strength of FRP-RC beams. Therefore, this analysis indicates that GEP modeling is very effective in estimating the shear strength of FRP-RC beams, the efficiency of this model is obvious in Figure 8 and Figure 9, when the GEP model successfully mimics the complex interaction between the beam depth, width, reinforcement ratio, and concrete compressive strength, while the other models failed to accurately mimic this interaction as was shown in Figure 2, Figure 3 and Figure 4.
7. Conclusions
The study presents a machine learning procedure to develop a robust prediction model for the shear capacity of FRP-RC beams. A database of experimentally measured shear capacity of 388 FRP-RC beams was surveyed and utilized to evaluate the prediction accuracy of several existing models and to develop the proposed model. A statistical comparison between the prediction models was conducted based on the average (Vc test/Vc predicted) and the Standard deviation. The following conclusions can be drawn:
- For slender beams (a/d < 2.5), the ACI 318-19, Bažant and Yu, Kara, and Mari et al. models demonstrate less scatteredness compared to other models. Interestingly, the ACI 318 model resulted in high accuracy with an average Vc test/Vc predicted = 0.92 and a standard deviation of 0.24, although it was developed for steel-RC beams. In contrast, the Ebid and Deifalla, and ACI 440 (2015) models provided the highest scatteredness and standard deviation.
- Including the size effect in the ACI 440-22 (public draft) has notably improved the prediction by reducing model error (Vc test/Vc predicted) and the standard deviation from 1.82 to 1.66 and from 0.37 to 0.34, respectively, highlighting the importance of including this effect.
- Gene expression programming (GEP) has been utilized along with the compiled database to develop shear models for slender and deep beams. The proposed model yielded a superior accuracy over other models with an average Vc test/Vc predicted = 0.98 and a standard deviation of 0.21 for slender beams. For deep beams, the proposed model resulted in an average Vc test/Vc predicted = 1.03 and a standard deviation of 0.29. The proposed models are a function of concrete compressive strength, reinforcement ratio, effective depth, modular ratio, and shear span-to-depth ratio. In addition to the accuracy of the GEP models, the proposed models are much simpler than some of the design models, such as the JSCE and CSA S806 models.
Author Contributions
Conceptualization, A.T., A.A. (Abdullah Alghosson), E.S. and Y.M.; Methodology, A.T., E.S. and Y.M.; Formal analysis, M.A.-R. and A.A. (Ahmad Aldiabat); Investigation, G.A.; Data curation, M.A.-R. and A.A. (Ahmad Aldiabat); Writing—original draft, A.T.; Writing—review & editing, A.A. (Abdullah Alghosson), E.S., G.A., Y.M., M.A.-R. and A.A. (Ahmad Aldiabat); Supervision, A.T., A.A. (Abdullah Alghosson) and G.A. All authors have read and agreed to the published version of the manuscript.
Funding
This research received no external funding.
Data Availability Statement
The data that support the findings of this study are available from the corresponding author upon reasonable request.
Conflicts of Interest
The authors declare no conflict of interest.
References
- Tarawneh, A.; Almasabha, G.; Murad, Y. ColumnsNet: Neural Network Model for Constructing Interaction Diagrams and Slenderness Limit for FRP-RC Columns. J. Struct. Eng. 2022, 148, 04022089. [Google Scholar] [CrossRef]
- Almasabha, G.; Tarawneh, A.; Saleh, E.; Alajarmeh, O. Data-Driven Flexural Stiffness Model of FRP-Reinforced Concrete Slender Columns. J. Compos. Constr. 2022, 26, 04022024. [Google Scholar] [CrossRef]
- Guadagnini, M.; Pilakoutas, K.; Waldron, P. Shear resistance of FRP RC beams: Experimental study. J. Compos. Constr. 2006, 10, 464–473. [Google Scholar] [CrossRef]
- Alam, M.S.; Sultana, N.; Hossain, S.Z. Bayesian optimization algorithm based support vector regression analysis for estimation of shear capacity of FRP reinforced concrete members. Appl. Soft Comput. 2021, 105, 107281. [Google Scholar] [CrossRef]
- Solhmirzaei, R.; Salehi, H.; Kodur, V.; Naser, M.Z. Machine learning framework for predicting failure mode and shear capacity of ultra high performance concrete beams. Eng. Struct. 2020, 224, 111221. [Google Scholar] [CrossRef]
- Saleh, E.; Tarawneh, A.N.; Naser, M.Z. Failure mode classification and deformability evaluation for concrete beams reinforced with FRP bars. Compos. Struct. 2022, 292, 115651. [Google Scholar] [CrossRef]
- Almasabha, G.; Alshboul, O.; Shehadeh, A.; Almuflih, A.S. Machine Learning Algorithm for Shear Strength Prediction of Short Links for Steel Buildings. Buildings 2022, 12, 775. [Google Scholar] [CrossRef]
- Alshboul, O.; Shehadeh, A.; Almasabha, G.; Mamlook, R.E.A.; Almuflih, A.S. Evaluating the impact of external support on green building construction cost: A hybrid mathematical and machine learning prediction approach. Buildings 2022, 12, 1256. [Google Scholar] [CrossRef]
- Tarawneh, A.; Almasabha, G.; Alawadi, R.; Tarawneh, M. Innovative and reliable model for shear strength of steel fibers reinforced concrete beams. Structures 2021, 32, 1015–1025. [Google Scholar] [CrossRef]
- Bashir, R.; Ashour, A. Neural network modelling for shear strength of concrete members reinforced with FRP bars. Compos. Part B: Eng. 2012, 43, 3198–3207. [Google Scholar] [CrossRef]
- Lee, S.; Lee, C. Prediction of shear strength of FRP-reinforced concrete flexural members without stirrups using artificial neural networks. Eng. Struct. 2014, 61, 99–112. [Google Scholar] [CrossRef]
- Jumaa, G.B.; Yousif, A.R. Predicting shear capacity of FRP-reinforced concrete beams without stirrups by artificial neural networks, gene expression programming, and regression analysis. Adv. Civ. Eng. 2018, 2018, 5157824. [Google Scholar] [CrossRef]
- Naderpour, H.; Haji, M.; Mirrashid, M. Shear capacity estimation of FRP-reinforced concrete beams using computational intelligence. Structures 2020, 28, 321–328. [Google Scholar] [CrossRef]
- Murad, Y.Z. Predictive model for bidirectional shear strength of reinforced concrete columns subjected to biaxial cyclic loading. Eng. Struct. 2021, 244, 112781. [Google Scholar] [CrossRef]
- Murad, Y.; Tarawneh, A.; Arar, F.; Al-Zu’bi, A.; Al-Ghwairi, A.; Al-Jaafreh, A.; Tarawneh, M. Flexural strength prediction for concrete beams reinforced with FRP bars using gene expression programming. Structures 2021, 33, 3163–3172. [Google Scholar] [CrossRef]
- Wight, J.K.; MacGregor, J.G. Reinforced Concrete; Pearson Education: London, UK, 2016. [Google Scholar]
- American Concrete Institute. Guide for the Design and Construction of Structural Concrete Reinforced with Fiber-Reinforced Polymer (FRP) Bars. (ACI 440.1 R-15); American Concrete Institute: Farmington Hills, MI, USA, 2015. [Google Scholar]
- Tureyen, A.K.; Frosch, R.J. Shear Tests of FRP Reinforced Concrete Beams without Stirrups. ACI Struct. J. 2002, 99, 427–434. [Google Scholar]
- Nanni, A.; de Luca, A.; Zadeh, H.J. FRP Reinforced Concrete Structures—Theory, Design and 33 Practice; CRC Press: Boca Raton, FL, USA, 2014; 400p, ISBN 978-0-415-77882-4. [Google Scholar]
- Canadian Standards Association. Design and Construction of Building Components with Fibre-Reinforced Polymers (No. 2); Canadian Standards Association: Toronto, ON, Canada, 2002. [Google Scholar]
- Wu, Z.; Wang, X.; Iwashita, K.; Sasaki, T.; Hamaguchi, Y. Tensile fatigue behaviour of FRP and hybrid FRP sheets. Compos. Part B Eng. 2010, 41, 396–402. [Google Scholar] [CrossRef]
- Japan Society of Civil Engineers. Recommendations for Design and Construction of Concrete Structures Using Continuous Fiber Reinforcing Materials; JSCE: Tokyo, Japan, 1997. [Google Scholar]
- Nehdi, M.; El Chabib, H.; Saïd, A.A. Proposed shear design equations for FRP-reinforced concrete beams based on genetic algorithms approach. J. Mater. Civ. Eng. 2007, 19, 1033–1042. [Google Scholar] [CrossRef]
- Hoult, N.A.; Sherwood, E.G.; Bentz, E.C.; Collins, M.P. Does the use of FRP reinforcement change the one-way shear behavior of reinforced concrete slabs? J. Compos. Constr. 2008, 12, 125. [Google Scholar] [CrossRef]
- Kara, I.F. Prediction of shear strength of FRP-reinforced concrete beams without stirrups based on genetic programming. Adv. Eng. Softw. 2011, 42, 295–304. [Google Scholar] [CrossRef]
- Mari, A.; Cladera, A.; Oller, E.; Bairan, J. Shear design of FRP reinforced concrete beams without transverse reinforcement. Compos. Part B Eng. 2014, 57, 228–241. [Google Scholar] [CrossRef]
- Bazant, Z.P.; Yu, Q. Designing against size effect on shear strength of reinforced concrete beams without stirrups: I. Formulation. J. Struct. Eng. (N. Y.) 2005, 131, 1877. [Google Scholar] [CrossRef]
- ACI Committee 318. Building Code Requirements for Structural Concrete (ACI 318-19); American Concrete Institute: Farmington Hills, MI, USA, 2019; p. 988. [Google Scholar]
- Kaszubska, M.; Kotynia, R.; Barros, J.A.; Baghi, H. Shear behavior of concrete beams reinforced exclusively with longitudinal glass fiber reinforced polymer bars: Experimental research. Struct. Concr. 2018, 19, 152–161. [Google Scholar] [CrossRef]
- Ebid, A.M.; Deifalla, A. Prediction of shear strength of FRP reinforced beams with and without stirrups using (GP) technique. Ain Shams Eng. J. 2021, 12, 2493–2510. [Google Scholar] [CrossRef]
- Razaqpur, A.G.; Isgor, B.O.; Greenaway, S.; Selley, A. Concrete contribution to the shear resistance of fiber reinforced polymer reinforced concrete members. J. Compos. Constr. 2004, 8, 452–460. [Google Scholar] [CrossRef]
- El-Sayed, A.; El-Salakawy, E.; Benmokrane, B. Shear strength of one-way concrete slabs reinforced with fiber-reinforced polymer composite bars. J. Compos. Constr. 2005, 9, 147–157. [Google Scholar] [CrossRef]
- Issa, M.A.; Ovitigala, T.; Ibrahim, M. Shear behavior of basalt fiber reinforced concrete beams with and without basalt FRP stirrups. J. Compos. Constr. 2016, 20, 04015083. [Google Scholar] [CrossRef]
- El Refai, A.; Abed, F. Concrete contribution to shear strength of beams reinforced with basalt fiber-reinforced bars. J. Compos. Constr. 2016, 20, 04015082. [Google Scholar] [CrossRef]
- Tomlinson, D.; Fam, A. Performance of concrete beams reinforced with basalt FRP for flexure and shear. J. Compos. Constr. 2015, 19, 04014036. [Google Scholar] [CrossRef]
- Khaja, M.N.; Sherwood, E.G. Does the shear strength of reinforced concrete beams and slabs depend upon the flexural reinforcement ratio or the reinforcement strain? Can. J. Civ. Eng. 2013, 40, 1068–1081. [Google Scholar] [CrossRef]
- Abdul-Salam, B. Behaviour of Shear Critical FRP Reinforced Concrete One-Way Slabs. Ph.D. Thesis, Université de Sherbrooke, Sherbrooke, QC, Canada, 2014. [Google Scholar]
- Razaqpur, A.G.; Shedid, M.; Isgor, B. Shear strength of fiber-reinforced polymer reinforced concrete beams subject to unsymmetric loading. J. Compos. Constr. 2011, 15, 500–512. [Google Scholar] [CrossRef]
- Chang, K.; Seo, D. Behavior of one-way concrete slabs reinforced with GFRP bars. J. Asian Archit. Build. Eng. 2012, 11, 351–358. [Google Scholar] [CrossRef]
- Ashour, A.F.; Kara, I.F. Size effect on shear strength of FRP reinforced concrete beams. Compos. Part B Eng. 2014, 60, 612–620. [Google Scholar] [CrossRef]
- Ashour, A.F. Flexural and shear capacities of concrete beams reinforced with GFRP bars. Constr. Build. Mater. 2006, 20, 1005–1015. [Google Scholar] [CrossRef]
- Tariq, M.; Newhook, J.P. Shear testing of FRP reinforced concrete without transverse reinforcement. In Proceedings of the Annual Conference of the Canadian Society for Civil Engineering, Moncton, NB, Canada, 4–7 June 2003; pp. 1330–1339. [Google Scholar]
- Kim, C.H.; Jang, H.S. Concrete Shear Strength of Normal and Lightweight Concrete Beams Reinforced with FRP Bars. J. Compos. Constr. 2014, 18, 04013038. [Google Scholar] [CrossRef]
- El-Sayed, A.K.; Soudki, K.; Kling, E. Flexural behaviour of self-consolidating concrete slabs reinforced with GFRP bars. In Proceedings of the 9th International Symposium on Fiber Reinforced Polymer Reinforcement for Reinforced Concrete Structures, Sydney, Australia, 13–15 July 2009; pp. 13–15. [Google Scholar]
- Zhao, W.; Maruyama, K.; Suzuki, H. Shear behavior of concrete beams reinforced by FRP rods as longitudinal and shear reinforcement. In Proceedings of the Rilem Proceedings, Ghent, Belgium, 23–25 August 1995; Chapman & Hall: London, UK, 1995; p. 352. [Google Scholar]
- Alkhrdaji, T.; Wideman, M.; Belarbi, A.; Nanni, A. Shear strength of GFRP RC beams and slabs. In Proceedings of the International Conference, Composites in Construction-CCC, Porto, Portugal, 10–12 October 2001; pp. 409–414. [Google Scholar]
- Deitz, D.H.; Harik, I.E.; Gesund, H. One-way slabs reinforced with glass fiber reinforced polymer reinforcing bars. Spec. Publ. 1999, 188, 279–286. [Google Scholar]
- Duranovic, N.; Pilakoutas, K.; Waldron, P. Tests on concrete beams reinforced with glass fibre reinforced plastic bars. Non-Met. (FRP) Reinf. Concr. Struct. 1997, 2, 479–486. [Google Scholar]
- Matta, F.; El-Sayed, A.K.; Nanni, A.; Benmokrane, B. Size Effect on Concrete Shear Strength in Beams Reinforced with Fiber-Reinforced Polymer Bars. ACI Struct. J. 2013, 110, 617–628. [Google Scholar]
- Yost, J.R.; Gross, S.P.; Dinehart, D.W. Shear strength of normal strength concrete beams reinforced with deformed GFRP bars. J. Compos. Constr. 2001, 5, 268–275. [Google Scholar] [CrossRef]
- Alam, M.S. Influence of Different Parameters on Shear Strength of FRP Reinforced Concrete Beams without Web Reinforcement. Ph.D. Thesis, Memorial University of Newfoundland, St. John’s, NL, Canada, 2010. [Google Scholar]
- Olivito, R.S.; Zuccarello, F.A. On the shear behaviour of concrete beams reinforced by carbon fibre-reinforced polymer bars: An experimental investigation by means of acoustic emission technique. Strain 2010, 46, 470–481. [Google Scholar] [CrossRef]
- Bentz, E.C.; Massam, L.; Collins, M.P. Shear strength of large concrete members with FRP reinforcement. J. Compos. Constr. 2010, 14, 637–646. [Google Scholar] [CrossRef]
- Gross, S.P.; Yost, J.R.; Dinehart, D.W.; Svensen, E.; Liu, N. Shear strength of normal and high strength concrete beams reinforced with GFRP bars. In Proceedings of the High Performance Materials in Bridges, Kona, HI, USA, 29 July–3 August 2003; pp. 426–437. [Google Scholar]
- Ali, I.; Thamrin, R.; Abdul, A.A.S.; Noridah, M. Diagonal shear cracks and size effect in concrete beams reinforced with glass fiber reinforced polymer (GFRP) bars. Appl. Mech. Mater. 2014, 621, 113–119. [Google Scholar]
- Nakamura, H.; Higai, T. Evaluation of shear strength of concrete beams reinforced with FRP. Doboku Gakkai Ronbunshu 1995, 1995, 89–100. [Google Scholar] [CrossRef]
- Swamy, N.; Aburawi, M. Structural implications of using GFRP bars as concrete reinforcement. In Proceedings of the 3rd International Symposium, FRPRCS. Sapporo, Japan, 14–16 October 1997; Volume 3, pp. 503–510. [Google Scholar]
- Liu, R. Precast Concrete Bridge Deck Panels Reinforced with Glass Fiber Reinforced Polymer Bars; The University of Utah: Salt Lake City, UT, USA, 2011. [Google Scholar]
- Farahmand, F. Shear Behaviour of Concrete Beams Reinforced with Glass Fibre Reinforced Plastic. Struct. Eng. Div. Dep. Civ. Geol. Eng. Univ. Manit. 1996, 234–345. [Google Scholar]
- Gross, S.P.; Dinehart, D.W.; Yost, J.R.; Theisz, P.M. Experimental tests of high-strength concrete beams reinforced with CFRP bars. In Proceedings of the 4th International Conference on Advanced Composite Materials in Bridges and Structures (ACMBS-4), Calgary, AB, Canada, 20–23 July 2004; quoted from Razaqpur and Isgor. 2006. [Google Scholar]
- Maruyama, K.; Zhao, W.J. Flexural and shear behaviour of concrete beams reinforced with FRP rods. Corros. Corros. Prot. Steel Concr. 1994, 1330–1339. [Google Scholar]
- Caporale, A.; Luciano, R. Indagine sperimentale e numerica sulla resistenza a taglio di travi di calcestruzzo armate con barre di GFRP. In Proceedings of the XXXVIII Convegno Nazionale AIAS, Torino, Italy, 9–11 September 2009. [Google Scholar]
- Kilpatrick, A.E.; Easden, L. Shear capacity of GFRP reinforced high strength concrete slabs. Dev. Mech. Struct. Mater. 2005, 1, 119–124. [Google Scholar]
- Kilpatrick, A.E.; Dawborn, R. Flexural Shear Capacity of High Strength Concrete Slabs Reinforced with Longitudinal GFRP Bars; FIB: Naples, Italy, 2006; pp. 1–10. [Google Scholar]
- Zeidan, M.; Barakat, M.A.; Mahmoud, Z.; Khalifa, A. Evaluation of concrete shear strength for FRP reinforced beams. In Proceedings of the Structures Congress 2011, Las Vegas, NV, USA, 14–16 April 2011; pp. 1816–1826. [Google Scholar]
- Andermatt, M.F.; Lubell, A.S. Behavior of concrete deep beams reinforced with internal fiber-reinforced polymer-experimental study. ACI Struct. J. 2013, 110, 585. [Google Scholar]
- Abed, F.; El-Chabib, H.; AlHamaydeh, M. Shear characteristics of GFRP-reinforced concrete deep beams without web reinforcement. J. Reinf. Plast. Compos. 2012, 31, 1063–1073. [Google Scholar] [CrossRef]
- Thomas, J.; Ramadass, S. Parametric study of shear strength of concrete beams reinforced with FRP bars. J. Inst. Eng. (India) Ser. A 2016, 97, 273–284. [Google Scholar] [CrossRef]
- Omeman, Z.; Nehdi, M.; El-Chabib, H. Experimental study on shear behavior of carbon-fiber-reinforced polymer reinforced concrete short beams without web reinforcement. Can. J. Civ. Eng. 2008, 35, 1–10. [Google Scholar] [CrossRef]
- Holland, J.H. Genetic algorithms. Sci. Am. 1992, 267, 66–73. [Google Scholar] [CrossRef]
- Cramer, N.L. A representation for the adaptive generation of simple sequential programs. In Proceedings of the First International Conference on Genetic Algorithms, Pittsburgh, PA, USA, 24–26 June 1985; pp. 183–187. [Google Scholar]
- Koza, J.R. Evolution of subsumption using genetic programming. In Proceedings of the First European Conference on Artificial Life; MIT Press: Cambridge, MA, USA, 1992; pp. 110–119. [Google Scholar]
- Ferreira, C. Gene expression programming: A new adaptive algorithm for solving problems. arXiv 2001, arXiv:cs/0102027. [Google Scholar]
- Soleimani-Babakamali, M.H.; Esteghamati, M.Z. Estimating seismic demand models of a building inventory from nonlinear static analysis using deep learning methods. Eng. Struct. 2022, 266, 114576. [Google Scholar] [CrossRef]
- Cakiroglu, C.; Islam, K.; Bekdaş, G.; Kim, S.; Geem, Z.W. Interpretable Machine Learning Algorithms to Predict the Axial Capacity of FRP-Reinforced Concrete Columns. Materials 2022, 15, 2742. [Google Scholar] [CrossRef] [PubMed]
- Esteghamati, M.Z.; Flint, M.M. Developing data-driven surrogate models for holistic performance-based assessment of mid-rise RC frame buildings at early design. Eng. Struct. 2021, 245, 112971. [Google Scholar] [CrossRef]
Publisher’s Note: MDPI stays neutral with regard to jurisdictional claims in published maps and institutional affiliations. |
© 2022 by the authors. Licensee MDPI, Basel, Switzerland. This article is an open access article distributed under the terms and conditions of the Creative Commons Attribution (CC BY) license (https://creativecommons.org/licenses/by/4.0/).