Article

Economic Enhancement of Wind–Thermal–Hydro System Considering Imbalance Cost in Deregulated Power Market

by
Jayanta Bhusan Basu
1,
Subhojit Dawn
2,*,
Pradip Kumar Saha
3,
Mitul Ranjan Chakraborty
1 and
Taha Selim Ustun
4,*
1
Department of Electrical Engineering, Siliguri Institute of Technology, Darjeeling 734009, India
2
Department of Electrical & Electronics Engineering, Velagapudi Ramakrishna Siddhartha Engineering College, Vijayawada 520007, India
3
Department of Electrical Engineering, Jalpaiguri Government Engineering College, Jalpaiguri 735102, India
4
Fukushima Renewable Energy Institute, AIST (FREA), Koriyama 963-0298, Japan
*
Authors to whom correspondence should be addressed.
Sustainability 2022, 14(23), 15604; https://doi.org/10.3390/su142315604
Submission received: 21 October 2022 / Revised: 4 November 2022 / Accepted: 10 November 2022 / Published: 23 November 2022

Abstract

:
Studying the property of the combination of renewable energy sources in the existing power systems is of great importance, and especially in the case of deregulated systems. The uncertainty of renewable sources is the largest barrier to integrating renewable-energy-producing units into the existing electrical infrastructure. Due to its uncertainty, integrating wind power into an existing power system requires extra consideration. In this work, the impacts of wind farm (WF) integration and a pumped hydroelectric storage system (PHES) on the electric losses, voltage profiles, generation costs, and system economy in a deregulated power market were studied. A comparative study was performed to determine the impact of wind farm integration on regulated and deregulated environments. Four locations in India were chosen at random for this work, and we used the real-time statistics for the actual wind speeds (AWSs) and forecasted wind speeds (FWSs) for each chosen location. To determine the system economy, surplus charge rates and deficit charge rates were developed to evaluate the imbalance cost resulting from the mismatch between the predicted and actual wind speeds. Considering the effect of the imbalance cost, the system profit/day varies by an average of 1.6% for the locations studied. Because of the reorganization of the power system, consumers constantly look for reliable and affordable power that is also efficient. As a result, the system security limit may be breached, or the system may run in a dangerous state. Lastly, in this paper, an economic risk analysis is presented with the help of heuristic algorithms (i.e., artificial bee colony algorithm (ABC) and moth–flame optimization algorithm (MFO)), along with sequential quadratic programming (SQP), and the way in which the PHES is used to compensate for the deviation in the WF integration in the real-time electricity market is also presented. The value at risk (VaR) and conditional value at risk (CVaR) were used as the economic risk analysis tools. According to the work, with the increase in the wind generation, the system risk improves. The results show that, as the wind generation increases by three times, there is an improvement in the risk coefficient values by 1%. A modified IEEE 14-bus test system was used for the validation of the entire work.

1. Introduction

Electrical energy is essential for both social and economic growth [1]. Due to its enormous importance, state agencies have historically owned and run the power sector. The deregulation and reform of the power supply business over the past three to four decades has been one of the most significant international energy developments. Following the introduction of deregulation, the conventional monopolistic structure of the electrical industry was replaced by competition between generation companies (GENCOs), transmission companies (TRANSCOs), and distribution companies (DISCOs) to improve the social benefit and maximize the efficiency in the generation of power. The adoption of environmentally friendly power sources is one of the factors that has helped the power sector to transition from a monopolistic industry to one of competition [2]. Renewable energy has the potential to play a significant role in the world’s energy supply because it can optimize energy structures, close the gap between the supply and demand, and most importantly, protect the environment [3]. Reduced carbon emissions from wind energy production are a crucial component in the move away from fossil fuels. Many power plant developers are keen to invest their money in setting up wind farms due to the lack of requirements for the fuel and other advantages. As a result, wind energy has risen to the top spot over the past few decades as the source of electrical energy with the highest annual growth rate worldwide.
A very accurate control mechanism has to be created for the excess capacity because, in a deregulated system, the generation and transmission of resources are employed more efficiently. Energy storage technology can be crucial in this, enabling the utility to maximize the use of resources. Among other performance advantages, energy storage technologies have the potential to enhance the system dependability, dynamic stability, power quality, transmission capacity, and area protection.
In order to address the various concerns about the incorporation of renewable energy sources, and particularly in wind power and energy storage systems, the deregulated system has been the focus of the research [4]. Woo [5] indicated that the capacity shortage is one of the major obstacles that is faced by deregulated systems. Integrating renewable energy generation is a feasible solution. McGovern [6] explored the impact of deregulation and the scope for independent power producers (IPPs) to set up plants. Talati [7] showed how end users will benefit the most from the deregulation process.
Distributed generators based on renewables will be the new trend in the newly reorganized environment, as massive generating implementation takes a lot of time and money. Deregulation makes it possible to build the infrastructure for transmission lines, which makes it possible to use renewable energy sources in far-flung geographic areas. Jaiswal [8] displayed the need for renewable energy in place of fossil fuels to develop, sustain, and protect the environment by finding solutions to issues such as aging infrastructure, restrictive government regulations, etc. Deshmukh [9] looked into the circumstances at hand, made predictions about the use of renewable energy in many fields, including the production of electricity, and also concentrated on reducing the usage of fossil fuels. Nieh [10] showed how renewable energy could be successfully included in the deregulated power market, and the author also proposed some solutions to the problems that are emerging from the integration of renewable sources that can reduce the risk.
The continuous growth in renewable energy generation, and particularly from solar and wind, has affected the power system in various ways. Graf [11] has found that the major factor behind the changes is the near-zero marginal cost of production of renewables; as a result, thermal generation, which has positive marginal costs, is slowly being replaced. The provision of clean energy is at the core of all the measures because the energy sector accounts for 75% of the global greenhouse gas emissions. Within the next ten years, wind deployment is expected to double to reduce global warming [12]. Chompoo-inwai [13] discussed the impact of connecting wind farms to the transmission system of a utility company. M.M. Rashidi [14] investigated how implementing hybrid systems made of wind turbines might increase the system reliability. Chinmoy [15] reviewed the investment, policies, performance, and social benefits of the integration of wind energy plants in a deregulated electricity market. The study also discusses regional aggregation and proposes a depiction of the risk from massive wind integration. Liu [16] has suggested an ANN-based model to estimate the day-ahead wind power and LMP information.
For exploiting the maximum benefit of integrating renewable distributed generation units, the optimal sizing and placement of these units are very essential. The installation of distributed generation units might result in a number of possible advantages for the quality and dependability of the delivered power. In order to fully enjoy these advantages, it is crucial to optimally locate distributed generation units with the right size. To address the issue, Abdmouleh [17] examined contemporary optimization techniques and analyzed the factors—environmental, economic, technological, technical, and regulatory—that have contributed to the rise in the interest in the integration of renewable generation, and summarized the difficulties to be solved.
Patil [18] studied the importance of deregulation in terms of the system generation cost, bus voltage profile, and importantly, locational marginal pricing (LMP), which is the main parameter that is responsible for determining the profit. One of the most crucial challenges in the deregulated electricity market is contingency. The most popular methods for minimizing the contingencies in contemporary power systems are generator rescheduling or FACTS-device integration. Yu [19] devised an optimization model to analyze the locations of FACTS devices to optimize the social welfare in deregulated power networks while taking into account the real power losses.
For the purpose of managing congestion and enhancing social welfare, Nabavi [20] suggested an appropriate placement and size of the TCSC based on GA. Sharma [21] suggested a GSA-based optimization method for placing TCSCs in the best possible locations based on LMP. The ideal position for FACTS devices should be determined while minimizing the system costs, overloads, and real power losses, according to Balamurugan [22]. A method for choosing the best location for the TCSC based on the lowest production and device costs was proposed by Besharat [23]. Mithulananthan [24] proposed a method for estimating the financial benefit of using FACTS for congestion management and protecting the investment in FACTS in a deregulated power market.
To facilitate the smooth integration of renewable energy sources, distribution networks are rapidly incorporating energy storage systems to take advantage of their technical, financial, and environmental benefits. Das [25] discusses the hurdles for ESS development and implementation, the optimal ESS sizing, placement, and operation, as well as the contributions of ESSs to energy security and society. Rehman [26] found PHESs to be a well-established and commercially acceptable technology that is suitable for from small to massive energy storage. PHESs play a crucial role in overcoming the inherent uncertainty of wind and solar power. Pérez-Díaz [27] described the current trends in the operation of PHESs, and the main challenges that it faces.
Connolly [28] identified the maximum feasible profit that is achievable from PHESs by investigating various realistic operating strategies. Parastegari [29] presented the optimal scheduling of wind firms and PHESs in the deregulated market. Dawn [30] examined the effects of pumped hydropower storage systems and wind farms in a competitive power market with congested transmission infrastructures. The value at risk (VaR) and profits were compared for joint operations and uncoordinated operations. Murage [31] investigated the benefits of the optimal integration of wind power with a PHES in Kenya. Using metaheuristic algorithms, Singh [32] examined the financial risk of a power system that incorporated wind and a PHES. With 95% and 99% confidence levels, respectively, the value at risk (VaR) and conditional value at risk (CVaR) were computed.
Das [33] investigated how a wind farm and flexible AC transmission systems (FACTS) might affect a transmission line that is overcrowded. The bus sensitivity factors (BSFs) of the WF and PHES were used to determine where they should be placed. Dhillon [34] researched different optimization methods that were used to schedule wind–PHES-integrated systems in a deregulated setting. Karhinen [35] examined the long-term profitability of the PHES as a function of the wind power penetration.
The literature review reveals that research has been performed on several components of deregulated systems that are combined with wind power and energy storage [36]. However, just a few issues required investigation in this regard: (a) What are the technological and economic effects of integrating wind energy into regulated and deregulated electricity systems? (b) How does the profit in a deregulated power system respond to the imbalance costs? (c) How does the discrepancy between the predicted and actual wind speeds affect the profits in deregulated power systems? What is the impact of demand-side bidding (DSB) on an electrical system? All of these issues are thoroughly investigated in this study, along with all of the questions that they raise.
This paper compares and contrasts regulated and deregulated systems while incorporating wind energy into them. To evaluate the effects of the wind speed uncertainty on the wind-integrated electrical system, the effect of the imbalance costs on the profits were studied for four locations based on the forecasted and actual wind speeds for a day. A pumped storage hydro plant (PHES) was used to minimize the negative impacts of the imbalance cost in the hybrid system. The comparative studies of the system risk with and without the placement of the PHES are also depicted here using the artificial bee colony algorithm (ABC) and moth–flame optimization algorithm (MFO), along with sequential quadratic programming (SQP).

2. Mathematical Modeling

The mathematical formulations of the pumped hydroelectric storage system, value at risk (VaR), and conditional value at risk (CVaR) are presented in this section. This model comprises a 24 h data set from hourly FWSs and AWSs. A PHES is taken into account across the entire period to maintain the uncertainties in the wind power at a constant level because wind generation is highly uncertain due to the variable wind speed. It was anticipated that the WF would provide the bidding power in the proposed power problem in accordance with the agreement between the market participants. To make up for this power, the PHES system would work.

2.1. Wind Speed Data

The actual and forecasted wind speeds for four places in India (Siliguri, Kolkata, Mumbai, and Delhi) were recorded to conduct the analysis. The FWS data of 12 July 2022 was collected on 8 July 2022, and the AWS data of 12 July 2022 was collected on 13 July 2022 [37]. The collected data were for a height of 10 m. In India, the typical hub height is 120 m for the wind turbines used. As such, the wind speed at the desired height was to be determined. The recorded wind speed data for the selected places are shown in Table 1.
The wind speed at 120 m was calculated using the following power law equation [38]:
W h W o = ( h h o ) α
where ‘ W h ’ is the wind speed at height ‘ h ’; ‘ W o ’ is the wind speed at height ‘ h o ’; ‘ α ’ is the Hellman coefficient. The considerations for this work were h = 120   m and h o = 10   m . Table 2 displays the calculated AWSs and FWSs at the desired height of 120 m.

2.2. Estimation of Wind Power, Generation, and Cost Studies

The wind power available in a swept area of a wind turbine (a) (m2) that is perpendicular to a wind stream moving at speed (v) (m/s) with an air density (ρ) (kg/m3) and having a turbine efficiency of η is calculated and expressed as follows [39]:
P w = 1 2 ρ a η v 3
For this work, the considered parameters were as follows: ρ = 1.225 kg / m 3 ; a radius of the turbine rotor of 40 m; η = 0.49 . From Table 1, it can be seen that the database delivered a wind speed variation from 1.67 m/s to 6.67 m/s in the selected locations. Table 3 provides the wind power generation and costs for the selected locations for the various wind speeds in the database. The investment cost for the wind generation was considered to be 3.75 $/MWh, and 50 wind turbines were considered for the parallel operation.

2.3. Pumped Hydroelectric Storage (PHES) System

Depending on the need for power, the pumped hydroelectric storage (PHES) system can either release or store electrical energy. When the demand is strong, it can operate in the generating mode; when the demand is low, it can operate in the pumping mode. For the optimum operation of a PHES, the major variables for consideration are the volume or capacity of the upper reservoir, and the difference in the heights of the upper and lower reservoirs [40]. Figure 1 displays the basic constructional details of the PHES system.

2.3.1. Generating Mode

This is also referred to as the discharging mode of the PHES. Here, the PHES generates power to meet the power demand in crest hours. The generated power from the PHES can be calculated as follows:
E G = ρ g H V G η G
where ‘ρ’ is the water density; ‘g’ is the acceleration; ‘H’ is the height of the head; ‘ V G ’ is the volumetric water flow rate in the generation mode; ‘ η G ’ is the overall efficiency of the plant for power generation.

2.3.2. Pumping Mode

This is termed as the charging mode of the PHES. The PHES consumes power during periods of low demand. The energy consumed in the pumping mode is deliberate, as follows:
E P = ρ g H V P η P
where ‘ρ’ is the water density; ‘g’ is the acceleration due; ‘H’ is the height of the head; ‘VP’ is the volumetric water flow rate in the pumping mode; ‘ η P ’ is the overall efficiency of the plant for the pumping mode of the operation.

2.4. Locational Marginal Pricing (LMP)

As shown in Figure 2, LMP uses applicable transmission congestion and energy prices to account for and determine the delivered energy price at a certain place. This technique is also known as ‘Nodal Pricing’ because it calculates the market-clearing prices at various nodes or points on a transmission grid. Locational marginal pricing is the primary factor in charge of managing the social benefit [41].

2.5. Power Pool

In a deregulated market, the GENCOs participate by offering the maximum generation and cost function to the pool, whereas the DISCOs participate by drawing the maximum demand and price function from the pool. The ISO determines the power generation and demand for all the buses that optimize the social welfare [42].
Consider
P G p = [ P G i p ; i = 1 , 2 , 3 , N G ]
as the vector of the real power generation in the power pool, and
P D p = [ P D j p ; j = 1 , 2 , 3 , N D ]
as the vector of the real power demand in the power pool.
Moreover, consider the vector of the overall active power generation and demand as follows:
P G T = [ P G i T ; i = 1 , 2 , 3 , N G ]
P D T = [ P D j T ; j = 1 , 2 , 3 , N D ]
where N G and N D are the total generators and loads present in the system, respectively.

2.6. Value at Risk (VaR) and Conditional Value at Risk (CVaR)

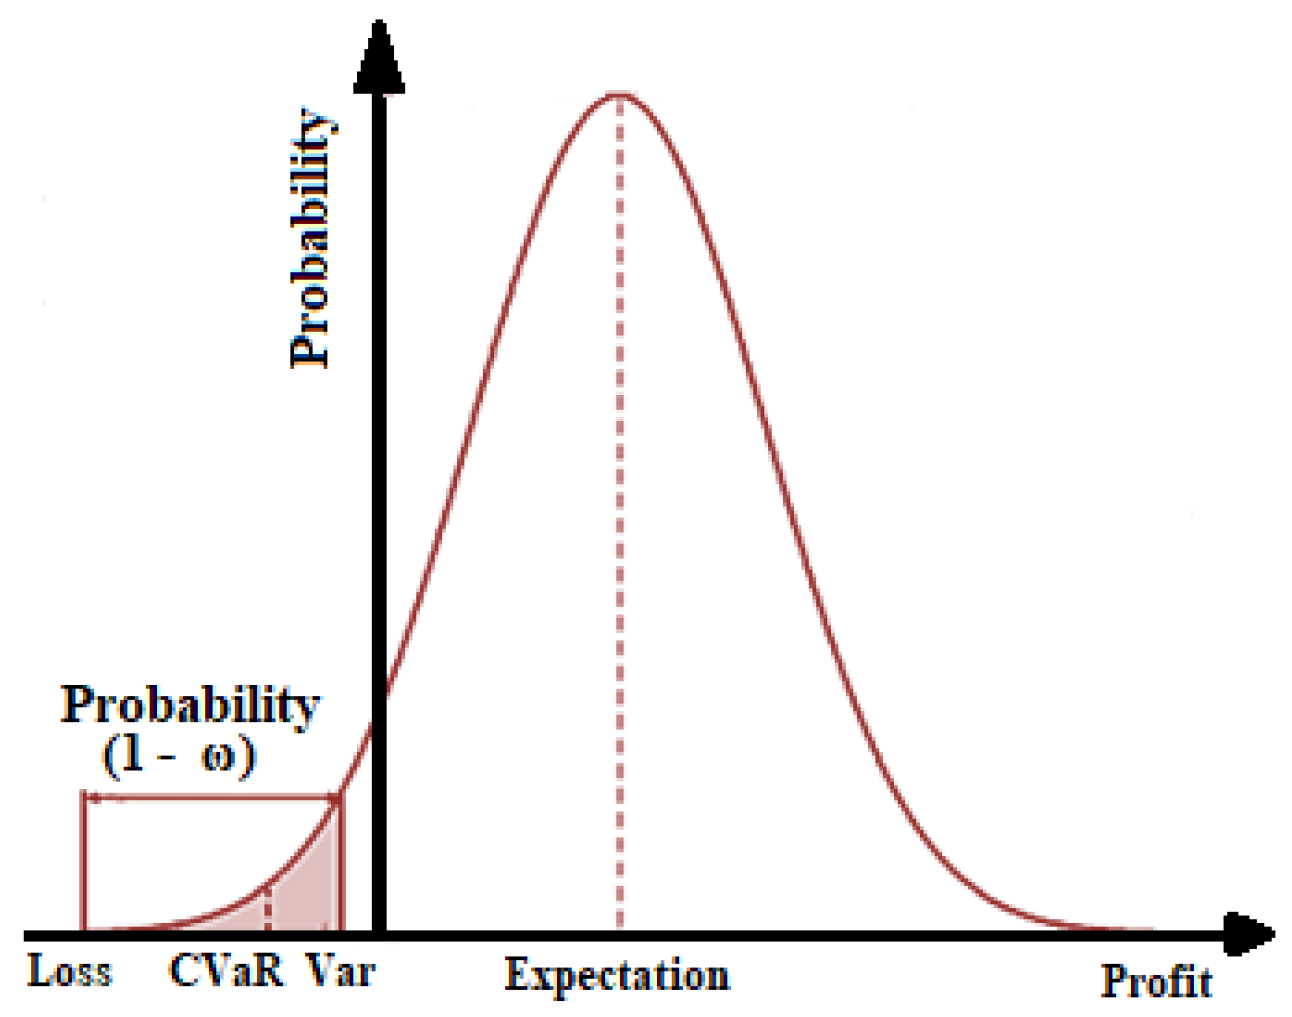
The need for risk management is growing in importance in today′s cutthroat marketplace. The risk management area has given significant prominence to the VaR and CVaR approaches. These tools are based on probabilistic analysis and the confidence level of assurance. For exploring the VaR and CVaR values, the confidence levels are generally 95%, 98%, and 99%. Thus, with a loss quantity of (1 − ω) percentile, the VaR depicts the least amount of loss, but the CVaR shows the normal loss mechanism in the lesser tail of the loss distribution (as shown in Figure 3).
Here, ω is the confidence level, g(x,y) is the loss associated with the decision vector (Q), which is selected from a subset (x) of R ˙ , the random vector (y) in R ˙ . The probability of g(x,y) is denoted by p(y), which does not exceed a threshold value of ζ [43]:
ψ ( x , ζ ) = g ( x , y ) ζ p ( y ) d y
The formulations of the assurance level based on the risk parameters are as follows:
ζ ω ( x ) = m i n { ζ R ˙ : ψ ( x , ζ ) }
φ ω ( x ) = 1 1 ω [ ( j = 1 j ω p j ω ) a j ω + j = j ω T p j a j ]
Here, T is the trial number composed under many conditions, and the loss points are ordered as follows:
a 1 < a 2 < a 3 …… < a T

3. Objective Function

Considering a system that has ‘NB’ buses, ‘NTL’ transmission lines, ‘ND’ demands, and ‘NG’ generators, the primary goal of the suggested approach is to investigate the effects of the discrepancy between the predicted and actual wind speeds on the hybrid wind–thermal–electrical system in a double-auction market. The revenue, surplus charge rate, deficit charge rate, imbalance cost, and investment cost of the wind power are assessed to determine the overall system profit.
The objective of this work is to maximize the social welfare and financial gain while minimizing the generation costs and system risk in the event of cost imbalances. The concept of the imbalance cost must be considered for the performance analysis of any renewable integrated power system. However, to the best of the authors’ knowledge, very few researchers have considered this concept. The positive imbalance cost produces a higher system profit, and the negative imbalance cost produces lower profit due to the simultaneous presence of reward and penalty in the system, which are applied to generation companies by the system operators. In this work, the first objective function is the maximization problem, and the second objective function is the minimization problem. Mathematically, the objective functions are presented as follows:
  • First Part of Objective Function:
P n ( t ) = T R n ( t ) + I C n ( t ) T G C n ( t )
where P n ( t ) is the total profit of the nth unit at time (‘t’); T R n ( t ) is the total revenue; I C n ( t ) is the imbalance cost; T G C n ( t ) is the total generation cost (for both the thermal and wind generation). This objective is the maximization problem. Equation (12) has three parts: the system revenue, imbalance cost, and generation cost. In a deregulated power market, the imbalance cost plays a key role in maximizing the social welfare in a wind–thermal power station. The system revenue, imbalance cost, and generation cost can be determined as follows:
T R n ( t ) = i = 1 N G P A i ( t ) L M P i ( t )
I C n ( t ) = i = 1 N G ( S R ( t ) + D R ( t ) ( P F i ( t ) P A i ( t ) ) 2 ) ( P A i ( t ) P F i ( t ) )
T G C n ( t ) = G C n ( t ) + W G C n ( t )
where P A i ( t ) and P F i ( t ) are the generated power at the ith generation bus with the actual and forecasted wind speeds, respectively; S R ( t )   and   D R ( t ) are the surplus and deficit charge rates, respectively; W G C n ( t ) is the wind power generation cost; G C n ( t ) is the thermal power generation cost. The system generation cost is calculated as follows:
G C n ( t ) = i = 1 N G ( a n + b n P A i ( t ) + C n P A i 2 ( t ) )
Here, ‘ a n ’, ‘ b n ’, and ‘ C n ’ are the generation cost coefficients.
The wind-generated power is computed based on the forecasted wind speed, and it is committed in a day-ahead market arrangement. In reality, the actual wind speed data will differ from the predicted wind speed data, and then the PHES is used to mitigate this difference in the power for its operation to compensate for the difference. However, the discrepancy between the predicted and actual wind speeds can result in imbalance costs. Equation (14) represents the expression of the imbalance cost. The deficit charge rate and excess charge rate are calculated as follows:
D R ( t ) = ( 1 + λ ) L M P i ( t ) , S R ( t ) = 0    when    P F i ( t ) > P A i ( t )
S R ( t ) = ( 1 λ ) L M P i ( t ) , D R ( t ) = 0    when    P F i ( t ) < P A i ( t )
S R ( t ) = D R ( t ) = 0    when    P F i ( t ) = P A i ( t )
where ‘ L M P i ( t ) ’ is the locational marginal pricing, and ‘λ’ is the imbalance cost coefficient. The value of ‘λ’ lies between zero and one. For this study, the value was considered as 0.9.
  • Second Part of Objective Function:
M i n .   ζ ω ( x ) = m i n { ζ R ˙ : ψ ( x , ζ ) }
M i n .   φ ω ( x ) = 1 1 ω [ ( j = 1 j ω p j ω ) a j ω + j = j ω T p j a j ]
Equations (20) and (21) are the functions of the VaR and CVaR, respectively. This is the minimization problem. It is noticeable that the VaR and CVaR are inversely correlated with the system risk, which implies that the system risk will be at its highest or lowest values if the VaR and CVaR have the lowest or highest negative values, respectively. Therefore, moving from the left tail to the right tail of the graph (shown in Figure 3), or increasing the values of the VaR and CVaR in a positive direction, is necessary to minimize the system risk. Minimizing the cost of the system generation is one of this work’s primary objectives. The values of the VaR and CVaR are the largest at the rightmost tail of the curve when the system profit is the maximum and the system generation cost is minimal. As a result, the relationship between the system generation cost and the VaR and CVaR is inverse. However, the social welfare is negatively correlated with the system-generating costs, which means that the social welfare increases when the generation costs are minimized, and vice versa. As a result, it may be said that the VaR and CVaR are directly related to the social welfare.
  • Constraints for thermal power plant:
The optimal power flow problem was solved with the following constraints.
i = 1 N G P G i + W G P l o s s P D = 0
where P G i is the power generation at the ith generation unit; W G is the power generated by the wind farm; P l o s s is the transmission loss; P D is the power demand.
P l o s s = j = 1 N T L G j [ | V i | 2 + | V j | 2 2 | V i | | V j | c o s ( δ i δ j ) ]
where G j is the line conductance of the line connected between the ith and jth buses; | V i | , | V j | are the voltage magnitudes of the ith and jth buses, respectively; δ i , δ j are the voltage angles of the ith and jth buses, respectively.
The power flow equation is as follows:
P i k = 1 N B | V i V k Y i k | s i n ( θ i k δ i + δ k ) = 0
Q i + k = 1 N B | V i V k Y i k | s i n ( θ i k δ i + δ k ) = 0
where P i , Q i are the injected active and reactive power in the ith bus, respectively; | V i | , | V k | are the voltage magnitudes of the ith and kth buses, respectively; δ i , δ k are the voltage angles of the ith and kth buses, respectively; Y i k , θ i k are the magnitude and angle of the element of the ith row and kth column, respectively, of the bus admittance matrix.
V i M I N V i V i M A X   i = 1 , 2 , 3 …… N B
φ i M I N φ i φ i M A X   i = 1 , 2 , 3 …… N B
T L l T L l M A X   l = 1 , 2 , 3 …… N T L
P G i M I N P G i P G i M A X   i = 1 , 2 , 3 …… N B
Q G i M I N Q G i Q G i M A X   i = 1 , 2 , 3 …… N B
where V i M I N , V i M A X are the lower and upper voltage limits of the ith bus, respectively; φ i M I N , φ i M A X are the lower and upper phase angle limits of the voltage at the ith bus, respectively; T L l , T L l M A X are the actual and maximum line flow limits of the lth line, respectively; P G i M I N , P G i M A X are the lower and upper limits of the active power of the ith bus, respectively; Q G i M I N , Q G i M A X are the minimum and maximum limits of the reactive power of the ith bus, respectively.
  • Constraints for operation of PHES Plant:
P p u m p ( t ) = P W p u m p ( t ) + P G p u m p ( t )
P p u m p m i n P p u m p ( t ) P p u m p m a x
P g e n m i n P g e n ( t ) P g e n m a x
E | V | ( t + 1 ) = E | V | ( t ) + [ P p u m p ( t ) . η P P g e n ( t ) η G ]
E | V | m i n E | V | ( t ) E | V | m a x
where P p u m p ( t ) is the total pumping load of the PHES; P g e n ( t ) is the power generated by the PHES in the generating mode; P p u m p m i n , P p u m p m a x are the minimum and maximum pumping limits, respectively; P g e n m i n , P g e n m a x are the minimum and maximum generating limits, respectively; E | V | is the energy level of the PHES plant in MWh; E | V | m i n , E | V | m a x are the minimum and maximum energy levels of the PHES, respectively.

4. Proposed Methodology

The method for evaluating the societal benefit and system risk in a wind–PHES-integrated deregulated electricity system is proposed in this study. The method considers the effects of the discrepancy between the predicted and actual wind speeds for scenarios lasting 24 h.
Each case’s deficit and surplus charge rates were determined, and the overall imbalance cost was determined in accordance with these results. Figure 4 shows the flowchart outlining the suggested approach. This method uses the predicted wind speed to determine the profit for GENCOs. By rescheduling generators and utilizing the constraints (Equations (22)–(30)), the optimal power flow problem was resolved while minimizing the cost of the system’s generation. Additionally, after the wind generators were installed, the unbalance cost and profit for each wind speed were calculated. In the flowchart, ‘Hr’ is the hour number, ‘PTot’ is the total profit, and ‘P’ is the profit for one hour.
The approach for assessing and minimizing the risk using a PHES is indicated in Figure 5. After solving the optimal power flow problem at every stage, the MVA flows for each hour of operation, LMP, and system losses were collected. Based on these, the CVaR and VaR were calculated considering 95% confidence levels. The analysis of the system was carried out for a 24 h scheduling period. The PHES was considered to reduce the imbalance between the wind power generation and contractual power. It was also assumed that the PHES’s initial capacity was sufficient to mitigate any worse imbalance that might emerge over its 24 h of operation.

5. Results and Discussion

In this work, a modified IEEE 14-bus test system was taken to examine the effect of the proposed method. The modified IEEE 14-bus system has 14 buses, 5 generators (connected at bus numbers 1, 2, 3, 6, and 8), 20 transmission lines, and 10 loads. The test system data were taken from Ref. [44]. First, the SQP was used to solve the optimal power flow problem, and then some metaheuristic optimization techniques were used for the comparative studies. The study was conducted considering the following systems:
  • A regulated system;
  • A deregulated system with single-bus demand-side bidding;
  • A deregulated system with double-bus demand-side bidding.
The system performance under the above conditions is detailed below.

5.1. System Performance without Wind Placement

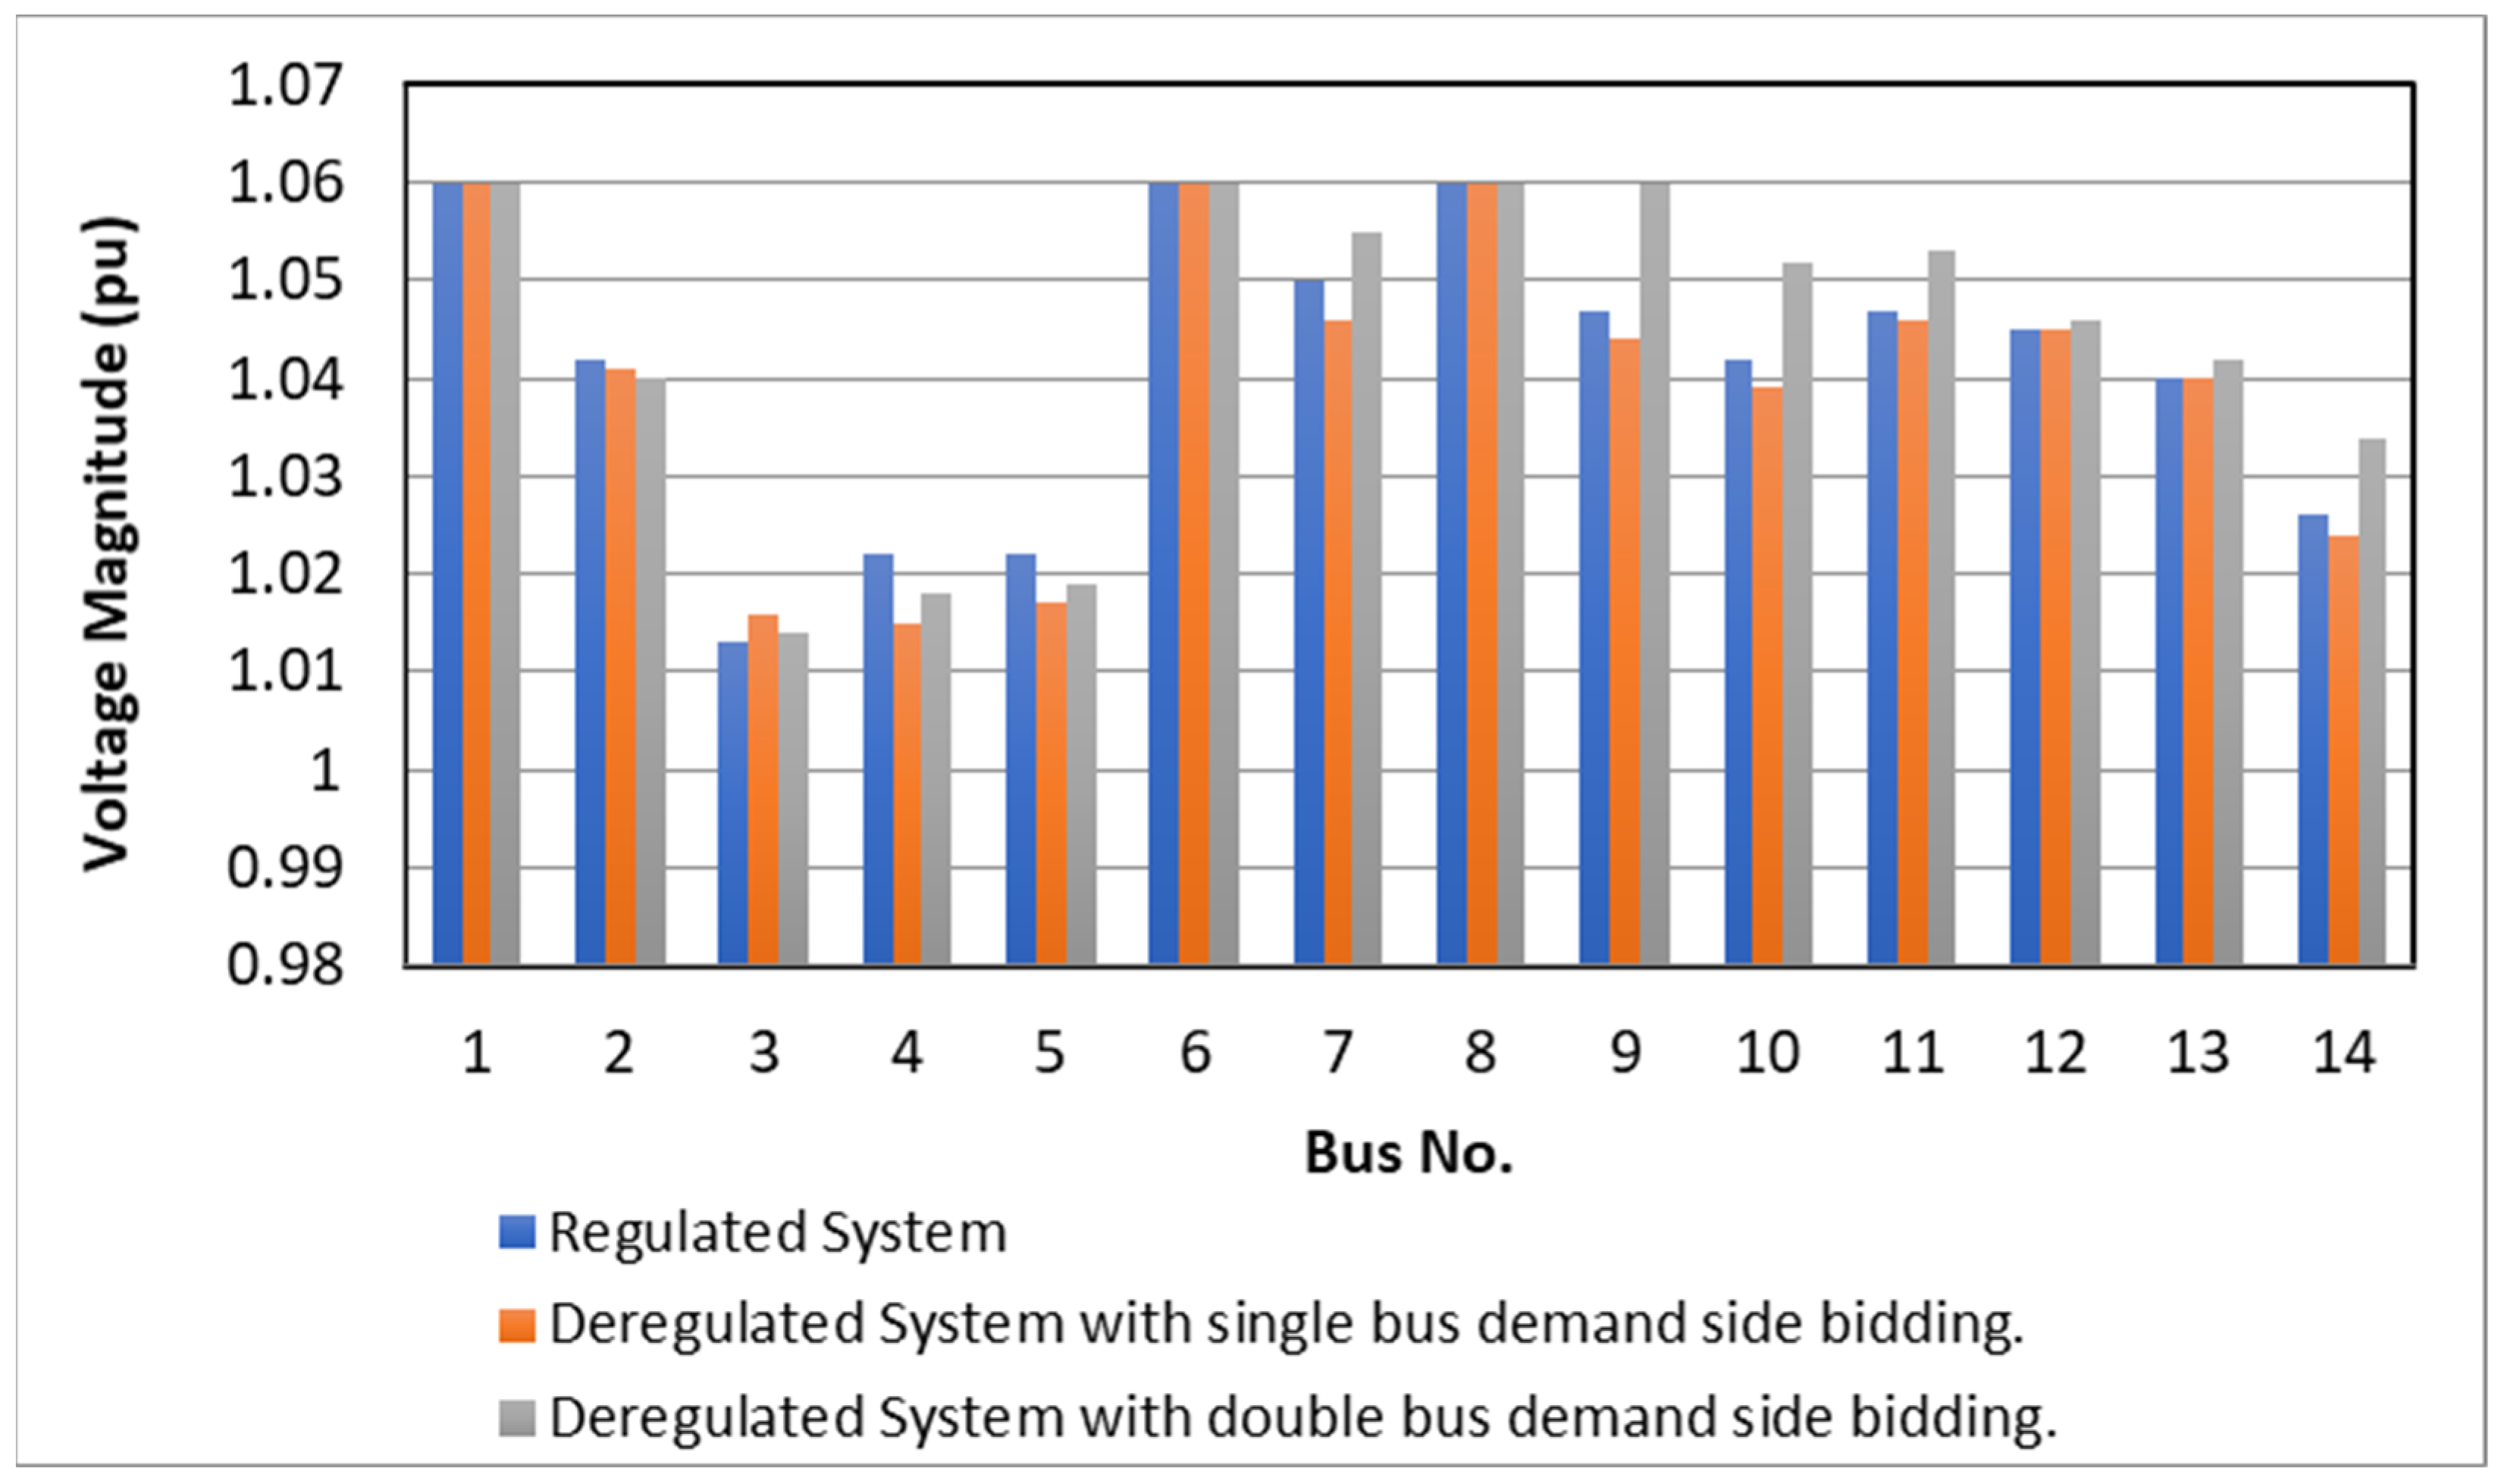
First, the optimal power flow was figured out for a modified IEEE 14-bus system without the placement of a wind generator. The generation costs, system revenues, and profits can be observed in Table 4, along with the generation capacities for all the generators, and the LMP for the generator buses. It was observed that demand-side bidding reduced the generation cost of the system. Demand-side bidding indicates the creation of a deregulated environment in the existing power system. The increase in the demand-side bidding minimizes the system generation cost, which directly indicates the benefit for power consumers. A comparative study of the bus voltages in regulated and deregulated power environments can be seen in Figure 4. Demand-side bidding (DSB) was conducted at bus number 5 for the single-bus DSB and at bus numbers 5 and 9 for the double-bus DSB for the modified IEEE 14-bus system. In this study, the generation- and demand-side biddings were both taken into consideration to provide the load and generation sides with flexibility. Figure 6 displays the single-line diagram of the modified IEEE 14-bus system with the bidding representation.
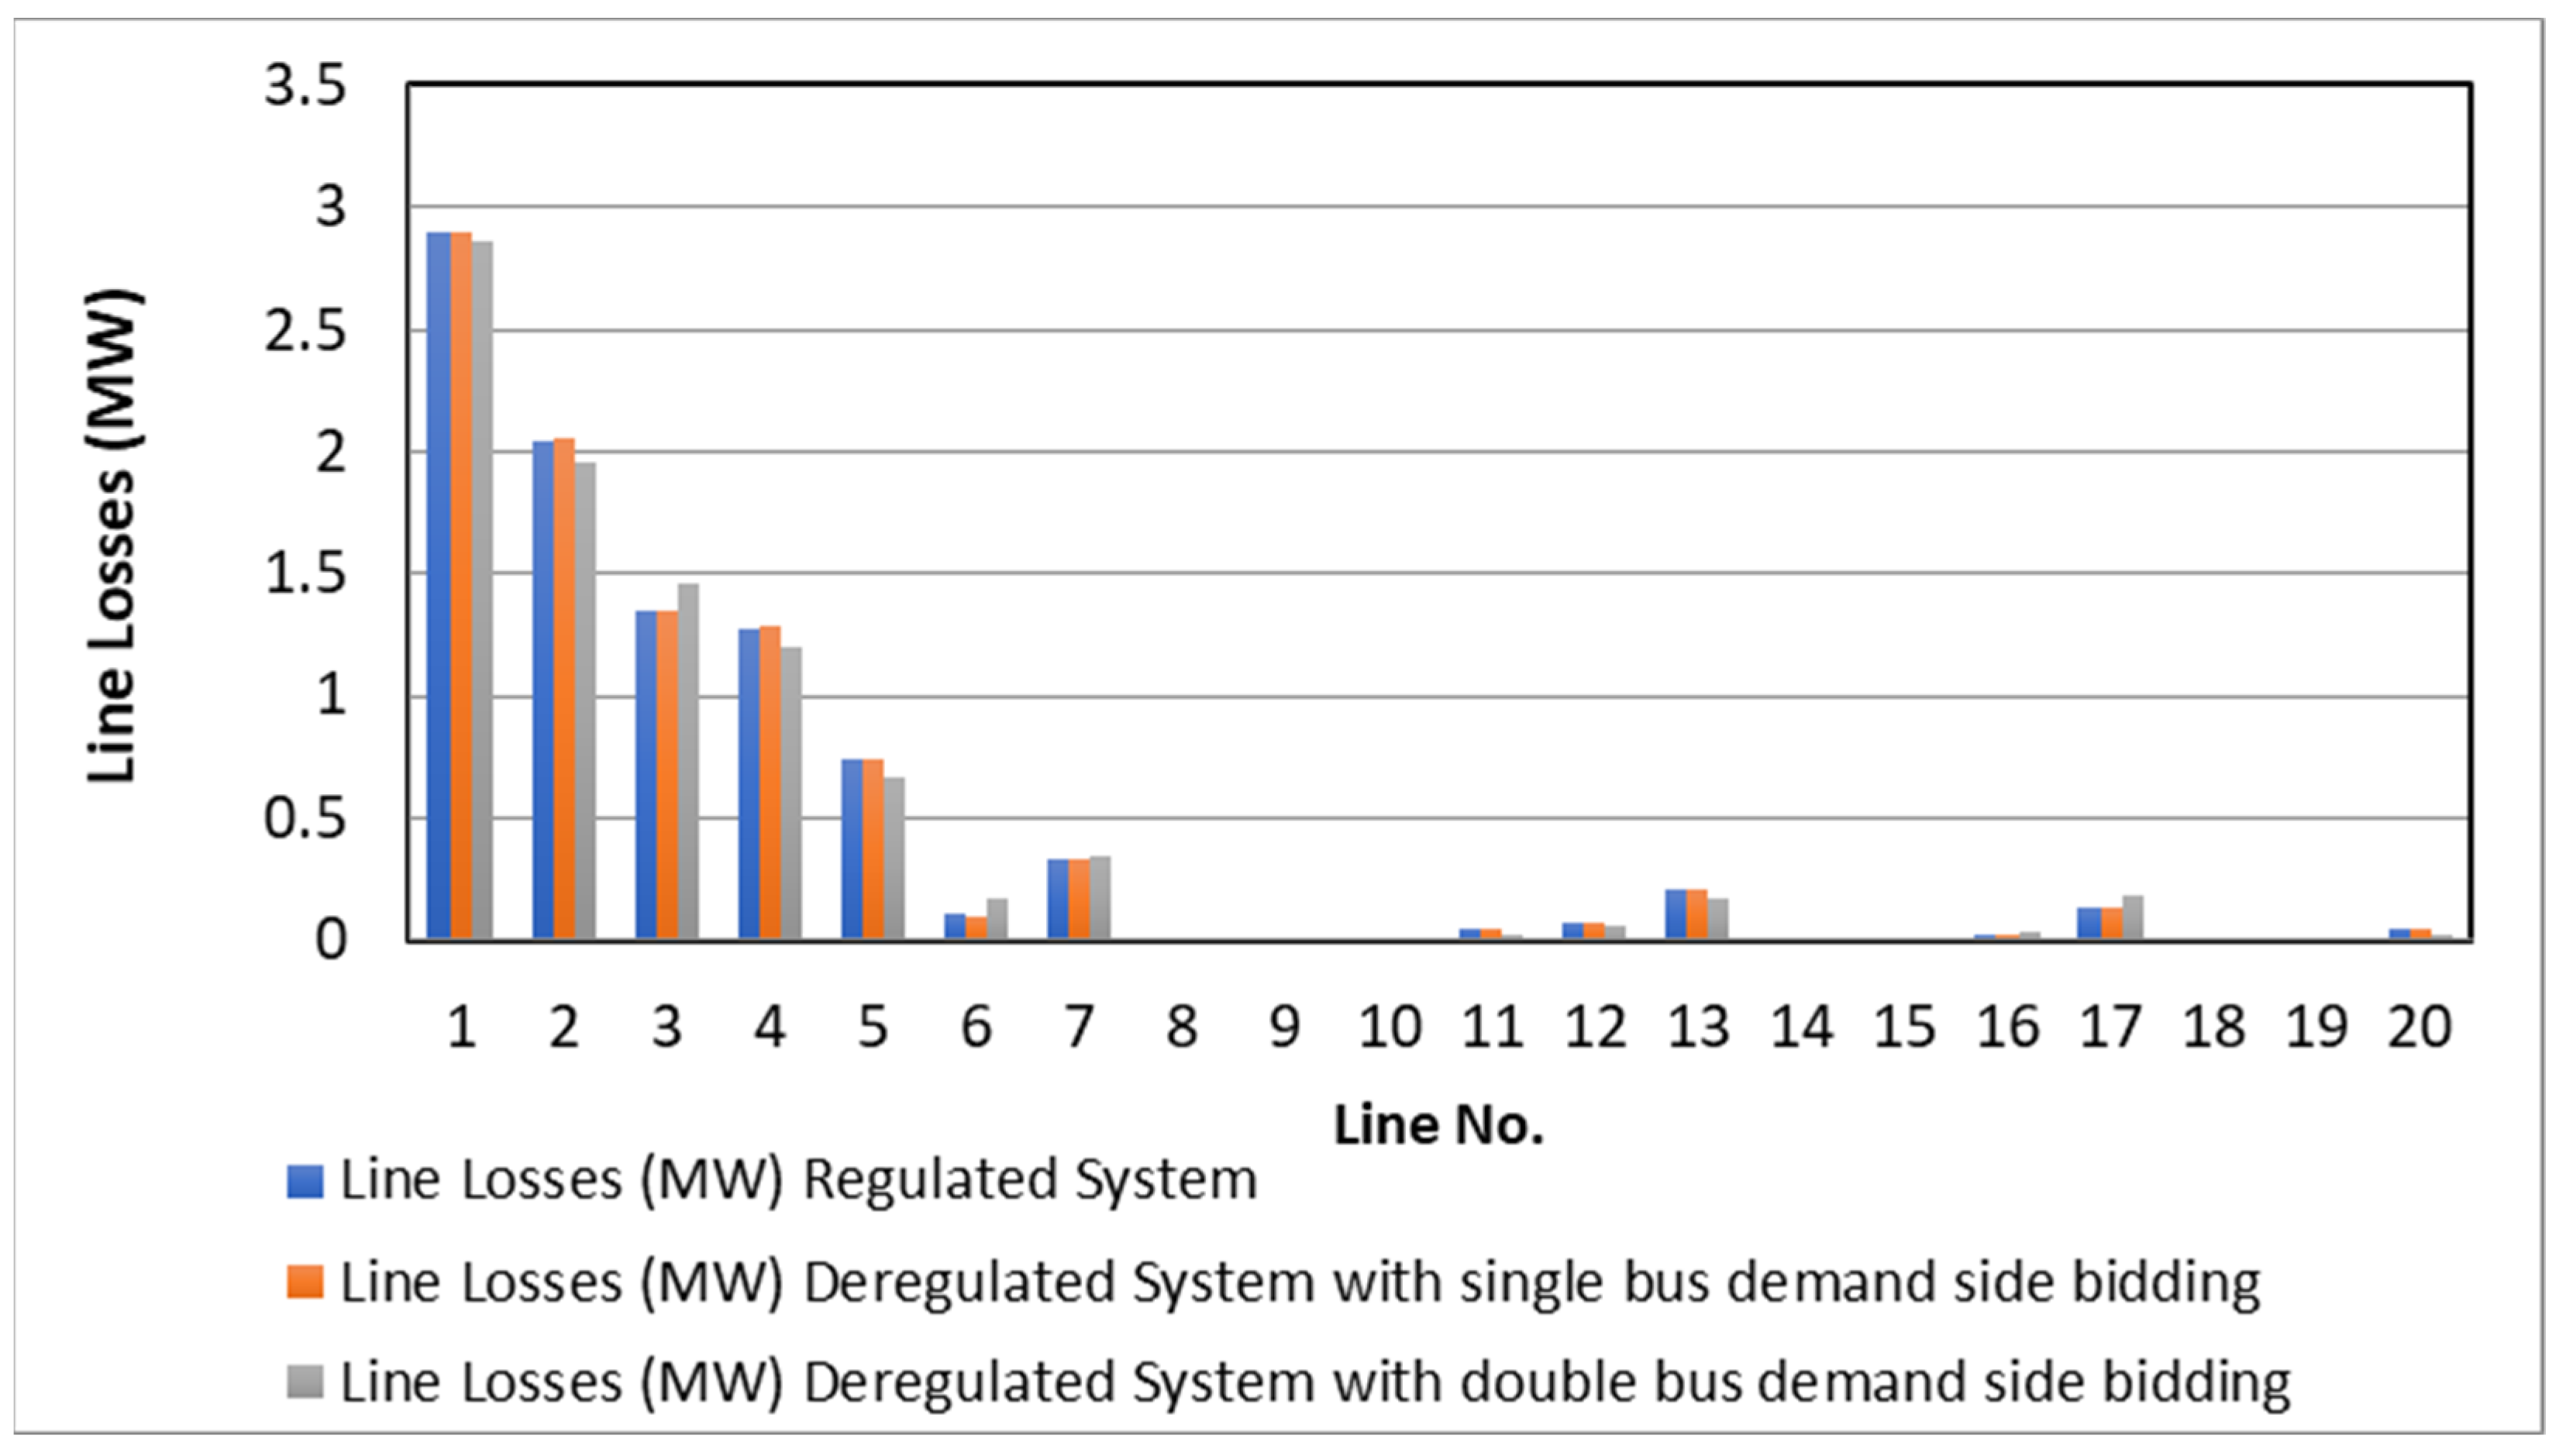
If we compare the results recorded in Table 4, it may be observed that, as more buses are covered under DSB, the generation cost decreases, while an improvement can be seen in the LMP. The voltage magnitude and transmission-line losses in different cases are shown in Figure 7 and Figure 8. Both the figures indicate greater improvement after the double-bus demand-side bidding.
In the deregulated power environment, both generator-side and demand-side bidding were performed. Thus, the process of scheduling the power was also changed as compared with the regulated system. Due to the huge competition in the electricity market, power consumers always take advantage in terms of economics. The power quality was also improved due to the presence of multiple generation companies in the system. For these reasons, improvements in the system voltage profile and transmission-line losses were seen after the conversion of the system to the deregulated system.

5.2. System Performance with Wind Placement without Considering Imbalance Cost

After the placement of the wind generator at bus number 4, the optimal power flow was solved using SQP. The wind generator placement was performed randomly. The thermal generation cost was calculated, along with the wind investment cost for measuring the total generation cost. By using the formula stated in Equation (13), the revenue cost was measured. The revenue cost and total generation cost for the double-bus demand-side bidding with different considered wind speeds can be seen in Table 5. A declination in the total generation cost and an increment in the profit can be observed as the wind speed increases.
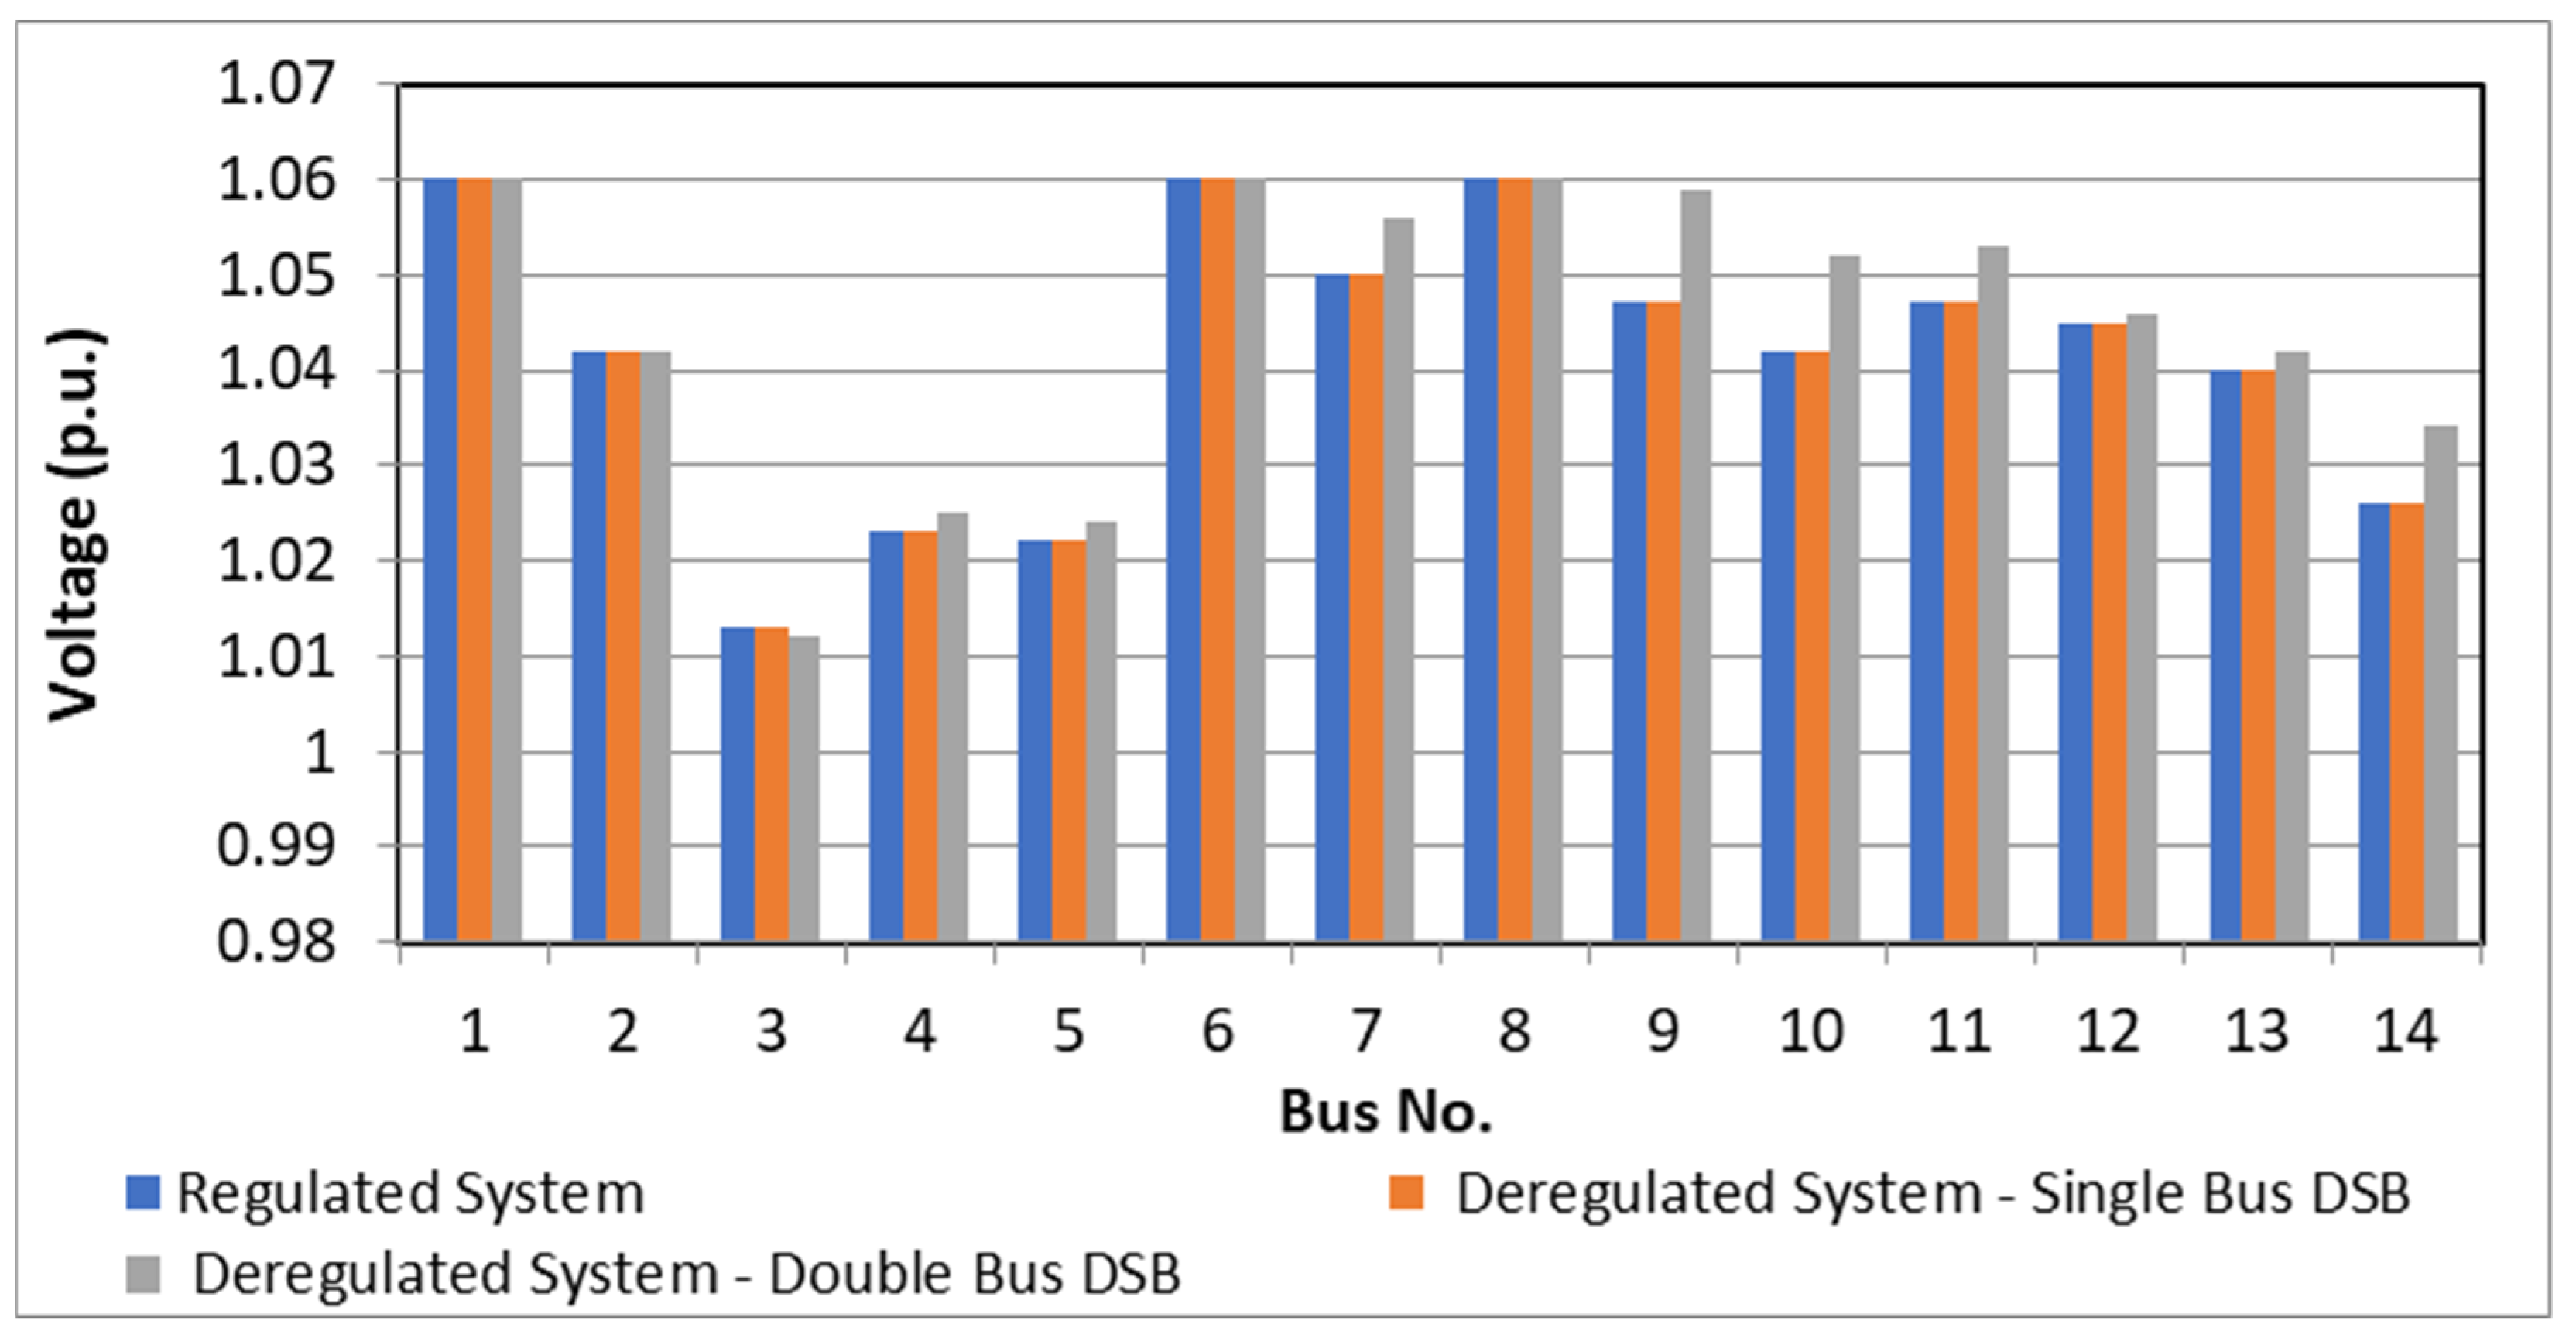
The comparison analyses of the system generating costs and profits with various wind speeds are shown in Figure 9 and Figure 10. It should be noted that the maximum wind power installation in the system provides the minimum generation cost and maximum profit. The wind power integration in deregulated power systems provides benefits in terms of the system voltage profile and transmission losses of the lines. The bus voltages always try to stay near to the 1 p.u. of every bus in the system under stable conditions, and they are displayed in Figure 11. The results displayed in Figure 11 are shown for the integration of the maximum valued wind power in the system (i.e., wind power based on a wind speed of 6.67 m/s).
The system generation cost is inversely proportional to the social benefit. The minimization of the generation cost tends to maximize the social welfare, and the maximization of the generation cost provides minimum social welfare. Here, we can see that the incorporation of the wind farms into the system provides lower generation costs, which indicates the maximization of the social benefits.

5.3. System Performance with Wind Placement Considering Imbalance Cost

In the previous step, the concept of the imbalance cost was not considered. We consider it now to verify the accessibility of the proposed methodology. To assess the impact of the uncertainties in the wind speed on the profit in a wind-integrated electrical system, the following cases were considered in this work:
  • Calculation of individual generation and LMP for all generator buses;
  • Calculation of imbalance cost;
  • Calculation of overall system profit.
The details of the steps associated with this part are as follows:

5.3.1. Calculation of Individual Generation and LMP for All Generator Buses

In this instance, the wind generator was deployed at bus number 4, and the sequential quadratic programming approach was used to solve the OPF for each piece of wind speed data while accounting for all the limitations described in Equations (22) and (30). The generation cost of the thermal system was revised in each situation as a result of the generation rescheduling. In Table 5, it can be seen that, with the increase in the wind speed/wind power, the thermal generation quantities decreased, as did the LMP for the maximum locations in the system. As a result, as the wind power increased, the cost of producing thermal electricity decreased in every instance.

5.3.2. Calculation of Imbalance Cost

The formulas from Equations (14) and (17)–(19) were used to compute the imbalance cost for any variation in the predicted and actual wind speeds. The system’s imbalance cost is a result of the discrepancy between the data on the projected and actual wind speeds. The highest discrepancy between the predicted and actual wind speeds corresponds to the maximum imbalance cost (−ve). We obtain a deficit charge rate when the predicted wind speed is significantly lower than the actual wind speed, and a surplus charge rate when the predicted wind speed is significantly higher than the actual wind speed. Calculating the overall imbalance cost requires the use of the deficit charge rate and surplus charge rate. When there is no discrepancy between the predicted and actual wind speeds, the imbalance cost is zero. Table 6 displays the system’s 24 h interval imbalance cost for each of the chosen sites. A “−ve” imbalance cost means that the ISO is penalizing GENCOs for a shortage of power supply, while a “+ve” imbalance cost means that the ISO is rewarding GENCOs for a surplus of power supply.

5.3.3. Calculation of Overall System Profit

The revenue cost and generating cost are the two main factors that determine an electrical system’s profitability at any given time. To introduce the imbalance cost phenomena for the system’s profit calculation, we took into consideration the predicted and actual wind speeds in this work. For a modified IEEE 14-bus system for the deregulated electricity market setting, Figure 12, Figure 13, Figure 14 and Figure 15 display the profit values for 24 h intervals for all of the chosen locations. The expense of the imbalance needs to be minimized to maximize the profit once a wind generator has been installed in a modified IEEE 14-bus system, taking into account both the predicted and actual wind speed data.

5.3.4. Profit Comparison after Installing Wind Turbine Considering AWS and FWS

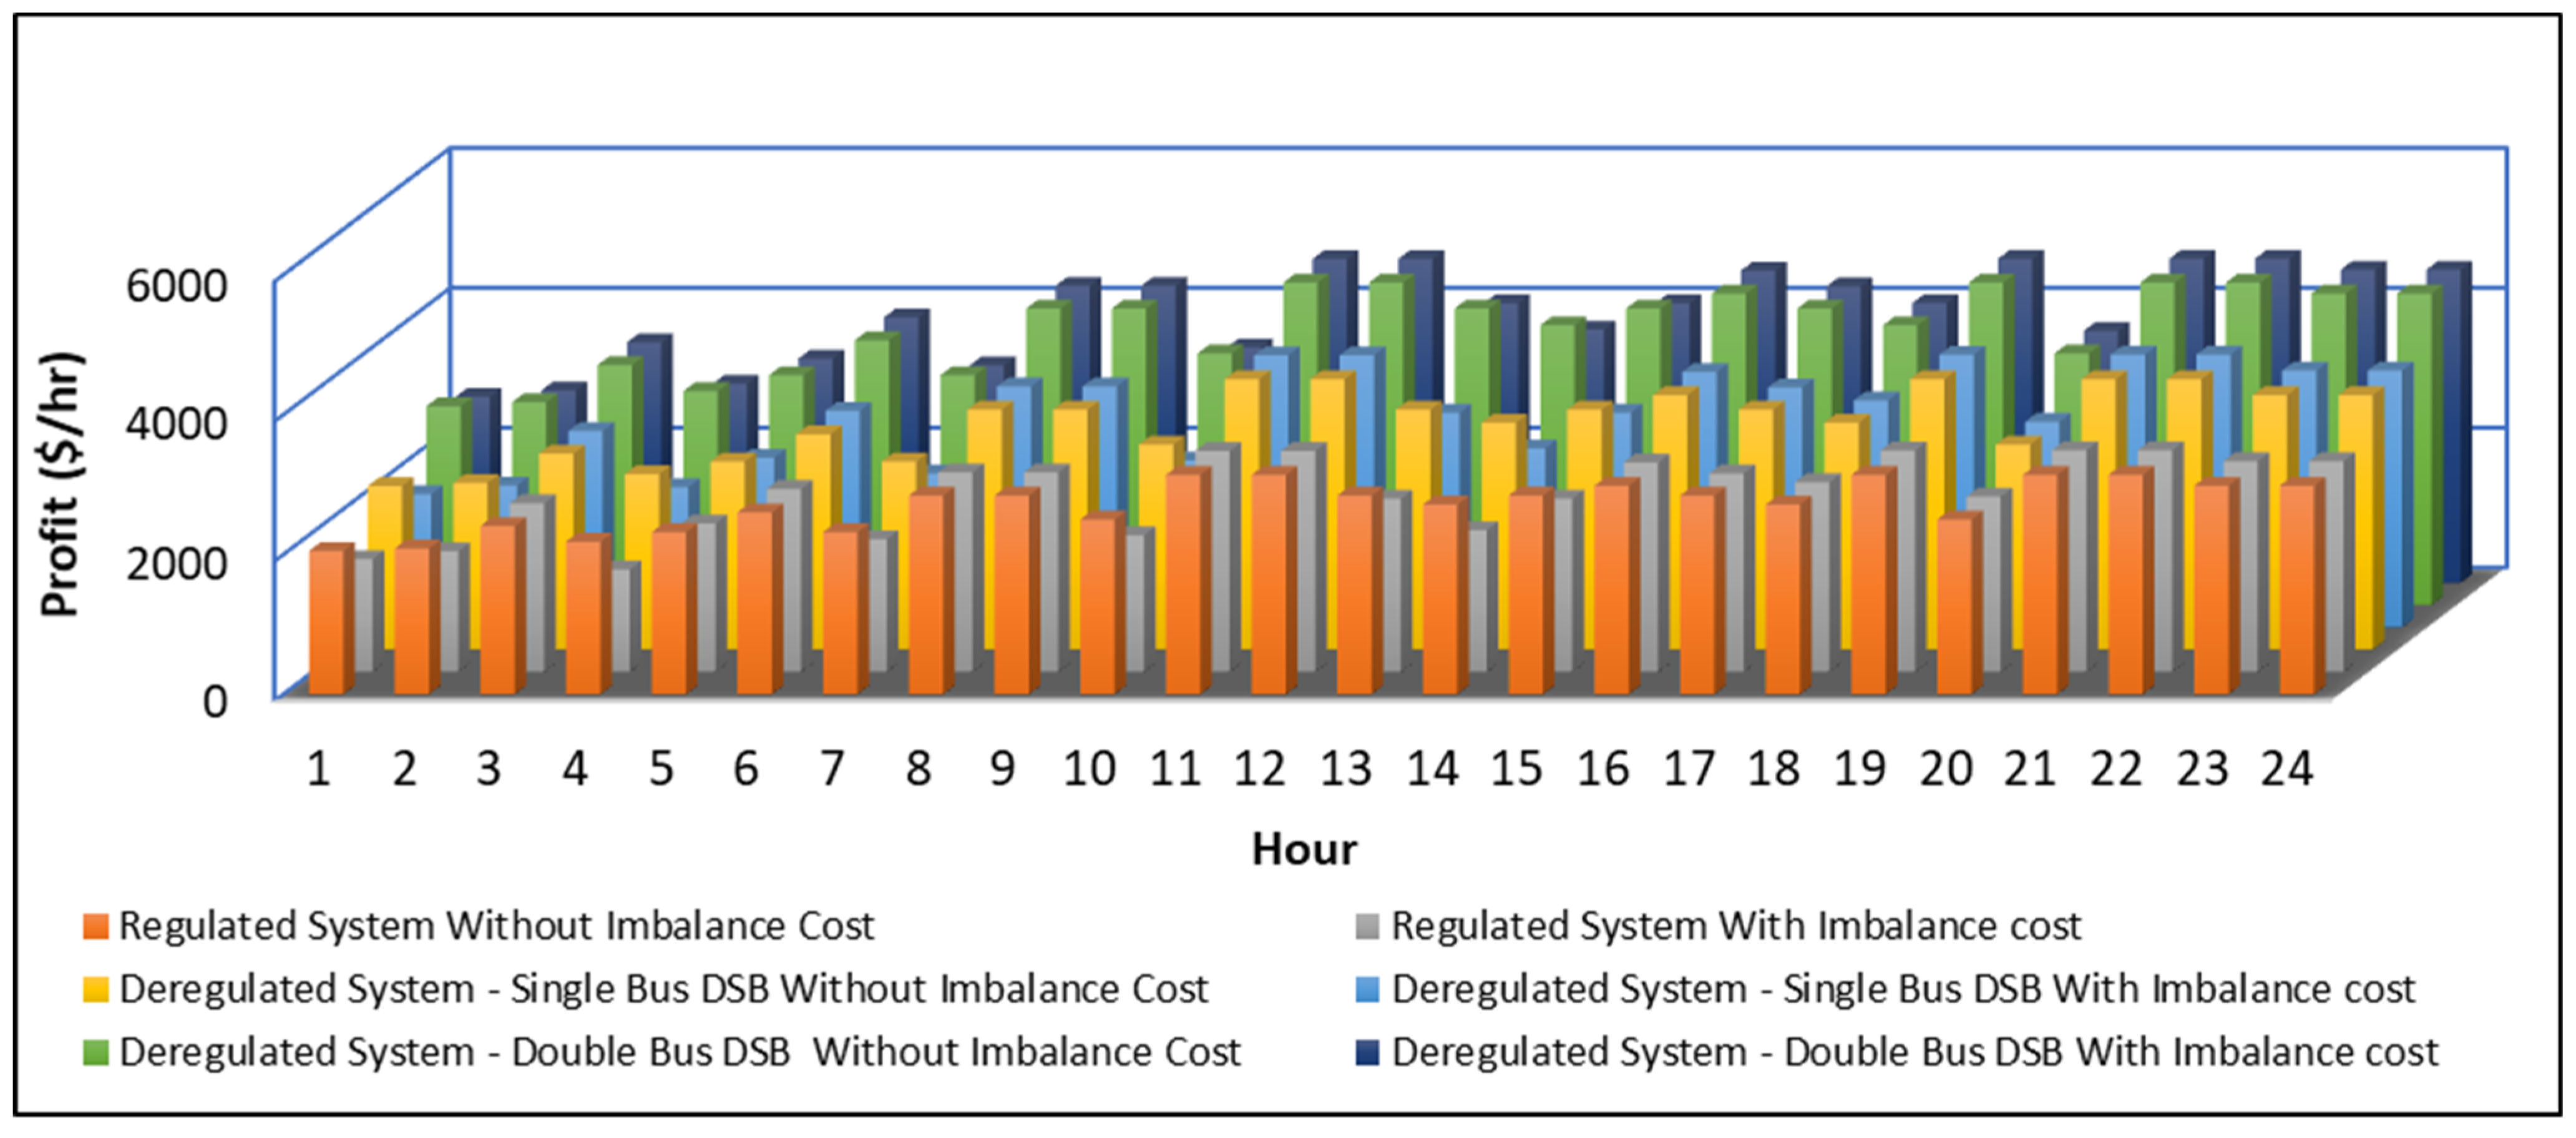
The overall outcomes and conclusions drawn from the suggested methodology are summarized in this case. Figure 16 illustrates the comparative analysis for the profit while taking into account various circumstances for all the chosen locations. The results show that the profit is maximized for every location in the event of a “Deregulated System—Double Bus DSB with the wind without Imbalance Cost,” but that the profit decreases for every location when there is an imbalance cost. Because wind flow is unpredictable, it is necessary to predict the wind speed before entering into any agreements with the other market participants in a deregulated electricity market. The profit may be reduced if there is a discrepancy between the FWS and AWS; however, conversely, the wind speed prediction increases the system’s security and flexibility when using wind energy. The comparative studies on the total profits for 24 h for all the selected places are depicted in Figure 16. There is a clear indication of the adverse effect of the imbalance cost on the system profit.
Figure 17 compares the average profits for various instances in the modified IEEE 14-bus system after taking the imbalance costs into account. In the event of a “Deregulated System—Double Bus DSB with the wind with Imbalance Cost”, the maximum average profit was achieved (with $4578.739/h) in the case of Mumbai due to the majority of instances in which the actual wind speed exceeded the predicted one. For Siliguri, the minimum average profit is visible, which is $2008.910/h under the same condition. This is a result of the significant discrepancy in the wind speed predictions.

5.4. System Performance with Placement of Wind Farm and PHES System

The system economic studies following the integration of the PHES into the deregulated wind-integrated power system are presented in this section. It is fairly evident from the previous section that the unfavorable impact of the imbalance costs lowers the system profit. The problem of the imbalance cost can be solved by installing a PHES system. During the off-peak load period and in the more actual wind power availability cases, the PHES works in the charging mode, and at other times, the PHES operates in the discharging mode. In this situation, the PHES can inject some extra power into the system and reduce the discrepancy between the actual and anticipated wind power schedules. A fixed generation capacity with 2 MW of the PHES system was placed at bus number 9. The bus was selected for the PHES placement based on the logic of the maximum load connected to this particular bus. To verify the competencies and applicability of the presented method, different optimization algorithms (i.e., ABC and MFO) were used along with SQP. The controlling parameters of the MFO and ABC algorithms were collected from [31,40]. Table 7 and Figure 18 display the average hourly profits with the different optimization techniques for Siliguri and Delhi.
According to the findings, the placement of PHESs alongside wind farms yields higher system profits than the profits obtained in wind-incorporated electrical systems without PHESs. The key originality of this paper is that it is the first use of the MFO optimization technique for this kind of economic problem. For all the consideration conditions, MFO offers the best results among the three optimization strategies applied in terms of system profit maximization. Thus, it can be concluded that the PHES placement and the application of MFO techniques maximize the system profit in the presence of an imbalance cost.

5.5. System Risk Analysis with Placement of wind Farm and PHES System

System risk analysis plays an important role in the secure operation of an electrical system. If any faults have occurred in the system, then the fault needs to be removed from the system very quickly; otherwise, there is the chance of system failure. Here, the system risk was measured based on the LMP of every bus in the system with the risk analysis tools (i.e., VaR and CVaR). All the risk data were calculated with a confidence level of 95%. Table 8 and Figure 19 show the system risk with different optimization techniques for Delhi under different system conditions. It can be seen that, with the use of MFO algorithms, a maximum number of wind farms can operate with the least amount of system risk. After the PHES system was installed in a deregulated environment, the system risk was reduced. This was due to the minimization of the load on the grid through the provision of power locally.

6. Conclusions

This paper examines the effects of wind speed uncertainties on a hybrid power system that integrates wind and pumped hydroelectric storage. The study examines the effects of incorporating a wind farm (WF) with a pumped hydroelectric storage (PHES) system on the electric losses, voltage profiles, generation costs, and system economy in both regulated and deregulated environments. The modified IEEE 14-bus system was used with the suggested methodology in four places in India. The test results show the efficiency of the suggested strategy in terms of generating the greatest profits in particular locations in India. It can be seen that the addition of wind power significantly improved the LMP of the system. This work also evaluated and addressed the effects of the discrepancy between the expected and actual wind speeds on a wind-integrated power system. The idea of power utilization in deficit and surplus is also presented. The simulation takes into account the 24 h fluctuations in the wind speed. The ABC, MFO, and SQP optimization methods were used to find the best power flow solution and compute the profit. When the ABC, MFO, and SQP optimization methods were applied to two locations and the outcomes were compared, it could be seen that MFO performs better in terms of the average profit value. Additionally, it is implied that this would also be true for the other two locations. In the last part, a risk analysis study was conducted using the analysis tools (i.e., VaR and CVaR) with confidence levels of 95% in the integrated wind and pumped hydroelectric storage system. The system risk was measured based on the LMP of every bus in the system using the ABC, MFO, and SQP algorithms. It is clear that MFO performs better in terms of the risk coefficient value, which shows that the system risk decreases as the wind generation increases. This happens as the wind farm meets part of the local load requirement, which results in a reduction in the load demand from the grid. The primary originality of this paper is that it is the first use of the MFO algorithm in this kind of research. The paper primarily focuses on the effect of the short-term wind speed uncertainty. Future work may consider long-term wind data uncertainty by incorporating considerable changes into the methodology used.

Author Contributions

Conceptualization, J.B.B. and S.D.; methodology, J.B.B., S.D., and M.R.C.; software, J.B.B.; validation, P.K.S. and T.S.U.; formal analysis, S.D. and T.S.U.; investigation, J.B.B. and M.R.C.; resources, J.B.B. and S.D.; data curation, P.K.S. and T.S.U.; writing—original draft preparation, J.B.B. and M.R.C.; writing—review and editing, S.D., P.K.S., and T.S.U.; visualization, S.D.; supervision, P.K.S. and T.S.U.; project administration, T.S.U.; funding acquisition, T.S.U. All authors have read and agreed to the published version of the manuscript.

Funding

This research received no external funding.

Conflicts of Interest

The authors declare no conflict of interest.

References

  1. Singh, S.; Chauhan, P.; Aftab, M.A.; Ali, I.; Hussain, S.M.S.; Ustun, T.S. Cost Optimization of a Stand-Alone Hybrid Energy System with Fuel Cell and PV. Energies 2020, 13, 1295. [Google Scholar] [CrossRef] [Green Version]
  2. Ustun, T.S.; Hashimoto, J.; Otani, K. Impact of Smart Inverters on Feeder Hosting Capacity of Distribution Networks. IEEE Access 2019, 7, 163526–163536. [Google Scholar] [CrossRef]
  3. Nadeem, F.; Aftab, M.A.; Hussain, S.M.S.; Ali, I.; Tiwari, P.K.; Goswami, A.K.; Ustun, T.S. Virtual Power Plant Management in Smart Grids with XMPP Based IEC 61850 Communication. Energies 2019, 12, 2398. [Google Scholar] [CrossRef] [Green Version]
  4. Basu, J.B.; Dawn, S.; Saha, P.K.; Chakraborty, M.R.; Ustun, T.S. A Comparative Study on System Profit Maximization of a Renewable Combined Deregulated Power System. Electronics 2022, 11, 2857. [Google Scholar] [CrossRef]
  5. Woo, C.; King, M.; Tishler, A.; Chow, L. Costs of electricity deregulation. Energy 2006, 31, 747–768. [Google Scholar] [CrossRef]
  6. McGovern, T.; Hicks, C. Deregulation and restructuring of the global electricity supply industry and its impact upon power plant suppliers. Int. J. Prod. Econ. 2004, 89, 321–337. [Google Scholar] [CrossRef]
  7. Talati, S.; Bednarz, J. Deregulation and opportunities for industrial customers. IEEE Trans. Ind. Appl. 1998, 34, 1378–1386. [Google Scholar] [CrossRef]
  8. Jaiswal, K.K.; Chowdhury, C.R.; Yadav, D.; Verma, R.; Dutta, S.; Jaiswal, K.S.; SelvaKumar, K.K. Renewable and sustainable clean energy development and impact on social, economic, and environmental health. Energy Nexus 2022, 7, 100118. [Google Scholar] [CrossRef]
  9. Deshmukh, K.G.; Sameeroddin, M.; Abdul, D.; Sattar, M.A. Renewable energy in the 21st century: A review. Mater. Today Proc. 2021. [Google Scholar] [CrossRef]
  10. Nieh, R.; Lai, L.L.; Rajkumar, N.; Lu, Y.; Tang, G. Renewable Energy in Deregulated Power Market. IFAC Proc. Vol. 2003, 36, 1173–1178. [Google Scholar] [CrossRef]
  11. Graf, C.; Marcantonini, C. Renewable energy and its impact on thermal generation. Energy Econ. 2017, 66, 421–430. [Google Scholar] [CrossRef]
  12. Kiunke, T.; Gemignani, N.; Malheiro, P.; Brudermann, T. Key factors influencing onshore wind energy development: A case study from the German North Sea region. Energy Policy 2022, 165, 112962. [Google Scholar] [CrossRef]
  13. Chompoo-Inwai, C.; Lee, W.-J.; Fuangfoo, P.; Williams, M.; Liao, J. System Impact Study for the Interconnection of Wind Generation and Utility System. IEEE Trans. Ind. Appl. 2005, 41, 163–168. [Google Scholar] [CrossRef]
  14. Rashidi, M.M.; Mahariq, I.; Murshid, N.; Wongwises, S.; Mahian, O.; Nazari, M.A. Applying wind energy as a clean source for reverse osmosis desalination: A comprehensive review. Alex. Eng. J. 2022, 61, 12977–12989. [Google Scholar] [CrossRef]
  15. Chinmoy, L.; Iniyan, S.; Goic, R. Modeling wind power investments, policies and social benefits for deregulated electricity market—A review. Appl. Energy 2019, 242, 364–377. [Google Scholar] [CrossRef]
  16. Liu, M.; Quilumba, F.L.; Lee, W.-J. Dispatch Scheduling for a Wind Farm with Hybrid Energy Storage Based on Wind and LMP Forecasting. IEEE Trans. Ind. Appl. 2014, 51, 1970–1977. [Google Scholar] [CrossRef]
  17. Abdmouleh, Z.; Gastli, A.; Ben-Brahim, L.; Haouari, M.; Al-Emadi, N.A. Review of optimization techniques applied for the integration of distributed generation from renewable energy sources. Renew. Energy 2017, 113, 266–280. [Google Scholar] [CrossRef]
  18. Patil, G.S.; Mulla, A.; Ustun, T.S. Impact of Wind Farm Integration on LMP in Deregulated Energy Markets. Sustainability 2022, 14, 4354. [Google Scholar] [CrossRef]
  19. Yu, Z.; Lusan, D. Optimal placement of FACTs devices in deregulated systems considering line losses. Int. J. Electr. Power Energy Syst. 2004, 26, 813–819. [Google Scholar] [CrossRef]
  20. Nabavi, S.M.H.; Hosseinipoor, N.A.; Hajforoosh, S. Social Welfare Maximization by Optimal Locating and Sizing of TCSC for Congestion Management in Deregulated Power Markets. Int. J. Comput. Appl. 2010, 6, 16–20. [Google Scholar] [CrossRef]
  21. Sharma, A.; Jain, S.K. Gravitational search assisted algorithm for TCSC placement for congestion control in deregulated power system. Electr. Power Syst. Res. 2019, 174, 105874. [Google Scholar] [CrossRef]
  22. Balamurugan, K.; Muthukumar, K. Differential Evolution algorithm for contingency analysis-based optimal location of FACTS controllers in deregulated electricity market. Soft Comput. 2018, 23, 163–179. [Google Scholar] [CrossRef]
  23. Besharat, H.; Taher, S.A. Congestion management by determining optimal location of TCSC in deregulated power systems. Int. J. Electr. Power Energy Syst. 2008, 30, 563–568. [Google Scholar] [CrossRef]
  24. Mithulananthan, N.; Acharya, N. A proposal for investment recovery of FACTS devices in deregulated electricity markets. Electr. Power Syst. Res. 2007, 77, 695–703. [Google Scholar] [CrossRef]
  25. Das, C.K.; Bass, O.; Kothapalli, G.; Mahmoud, T.S.; Habibi, D. Overview of energy storage systems in distribution networks: Placement, sizing, operation, and power quality. Renew. Sustain. Energy Rev. 2018, 91, 1205–1230. [Google Scholar] [CrossRef]
  26. Rehman, S.; Al-Hadhrami, L.M.; Alam, M.M. Pumped hydro energy storage system: A technological review. Renew. Sustain. Energy Rev. 2015, 44, 586–598. [Google Scholar] [CrossRef]
  27. Pérez-Díaz, J.I.; Chazarra, M.; García-González, J.; Cavazzini, G.; Stoppato, A. Trends and challenges in the operation of pumped-storage hydropower plants. Renew. Sustain. Energy Rev. 2015, 44, 767–784. [Google Scholar] [CrossRef]
  28. Connolly, D.; Lund, H.; Finn, P.; Mathiesen, B.; Leahy, M. Practical operation strategies for pumped hydroelectric energy storage (PHES) utilising electricity price arbitrage. Energy Policy 2011, 39, 4189–4196. [Google Scholar] [CrossRef] [Green Version]
  29. Parastegari, M.; Hooshmand, R.-A.; Khodabakhshian, A.; Forghani, Z. Joint operation of wind farms and pump-storage units in the electricity markets: Modeling, simulation and evaluation. Simul. Model. Pract. Theory 2013, 37, 56–69. [Google Scholar] [CrossRef]
  30. Dawn, S.; Gope, S.; Das, S.S.; Ustun, T.S. Social Welfare Maximization of Competitive Congested Power Market Considering Wind Farm and Pumped Hydroelectric Storage System. Electronics 2021, 10, 2611. [Google Scholar] [CrossRef]
  31. Murage, M.W.; Anderson, C. Contribution of pumped hydro storage to integration of wind power in Kenya: An optimal control approach. Renew. Energy 2014, 63, 698–707. [Google Scholar] [CrossRef]
  32. Singh, N.K.; Koley, C.; Gope, S.; Dawn, S.; Ustun, T.S. An Economic Risk Analysis in Wind and Pumped Hydro Energy Storage Integrated Power System Using Meta-Heuristic Algorithm. Sustainability 2021, 13, 13542. [Google Scholar] [CrossRef]
  33. Das, A.; Dawn, S.; Gope, S.; Ustun, T.S. A Strategy for System Risk Mitigation Using FACTS Devices in a Wind Incorporated Competitive Power System. Sustainability 2022, 14, 8069. [Google Scholar] [CrossRef]
  34. Dhillon, J.; Kumar, A.; Singal, S. Optimization methods applied for Wind–PSP operation and scheduling under deregulated market: A review. Renew. Sustain. Energy Rev. 2014, 30, 682–700. [Google Scholar] [CrossRef]
  35. Karhinen, S.; Huuki, H. Private and social benefits of a pumped hydro energy storage with increasing amount of wind power. Energy Econ. 2019, 81, 942–959. [Google Scholar] [CrossRef]
  36. Das, S.S.; Das, A.; Dawn, S.; Gope, S.; Ustun, T.S. A Joint Scheduling Strategy for Wind and Solar Photovoltaic Systems to Grasp Imbalance Cost in Competitive Market. Sustainability 2022, 14, 5005. [Google Scholar] [CrossRef]
  37. Database: World Temperatures-Weather around the World. Available online: www.timeanddate.com/weather/ (accessed on 12 July 2022).
  38. Bataineh, K.M.; Dalalah, D. Assessment of wind energy potential for selected areas in Jordan. Renew. Energy 2013, 59, 75–81. [Google Scholar] [CrossRef]
  39. Boyle, G. (Ed.) Renewable Energy: Power for a Sustainable Future, 3rd ed.; Oxford University Press and Open University: Oxford, UK, 2012. [Google Scholar]
  40. Ma, T.; Yang, H.; Lu, L.; Peng, J. Pumped storage-based standalone photovoltaic power generation system: Modeling and techno-economic optimization. Appl. Energy 2015, 137, 649–659. [Google Scholar] [CrossRef]
  41. Orfanogianni, T.; Gross, G. A General Formulation for LMP Evaluation. IEEE Trans. Power Syst. 2007, 22, 1163–1173. [Google Scholar] [CrossRef]
  42. Tiwari, P.K.; Sood, Y.R. An Efficient Approach for Optimal Allocation and Parameters Determination of TCSC With Investment Cost Recovery Under Competitive Power Market. IEEE Trans. Power Syst. 2013, 28, 2475–2484. [Google Scholar] [CrossRef]
  43. Das, A.; Dawn, S.; Gope, S.; Ustun, T.S. A Risk Curtailment Strategy for Solar PV-Battery Integrated Competitive Power System. Electronics 2022, 11, 1251. [Google Scholar] [CrossRef]
  44. MATPOWER—A MATLAB Power System Simulation Package, Version 5.1. Available online: https://matpower.org/download/ (accessed on 16 July 2022).
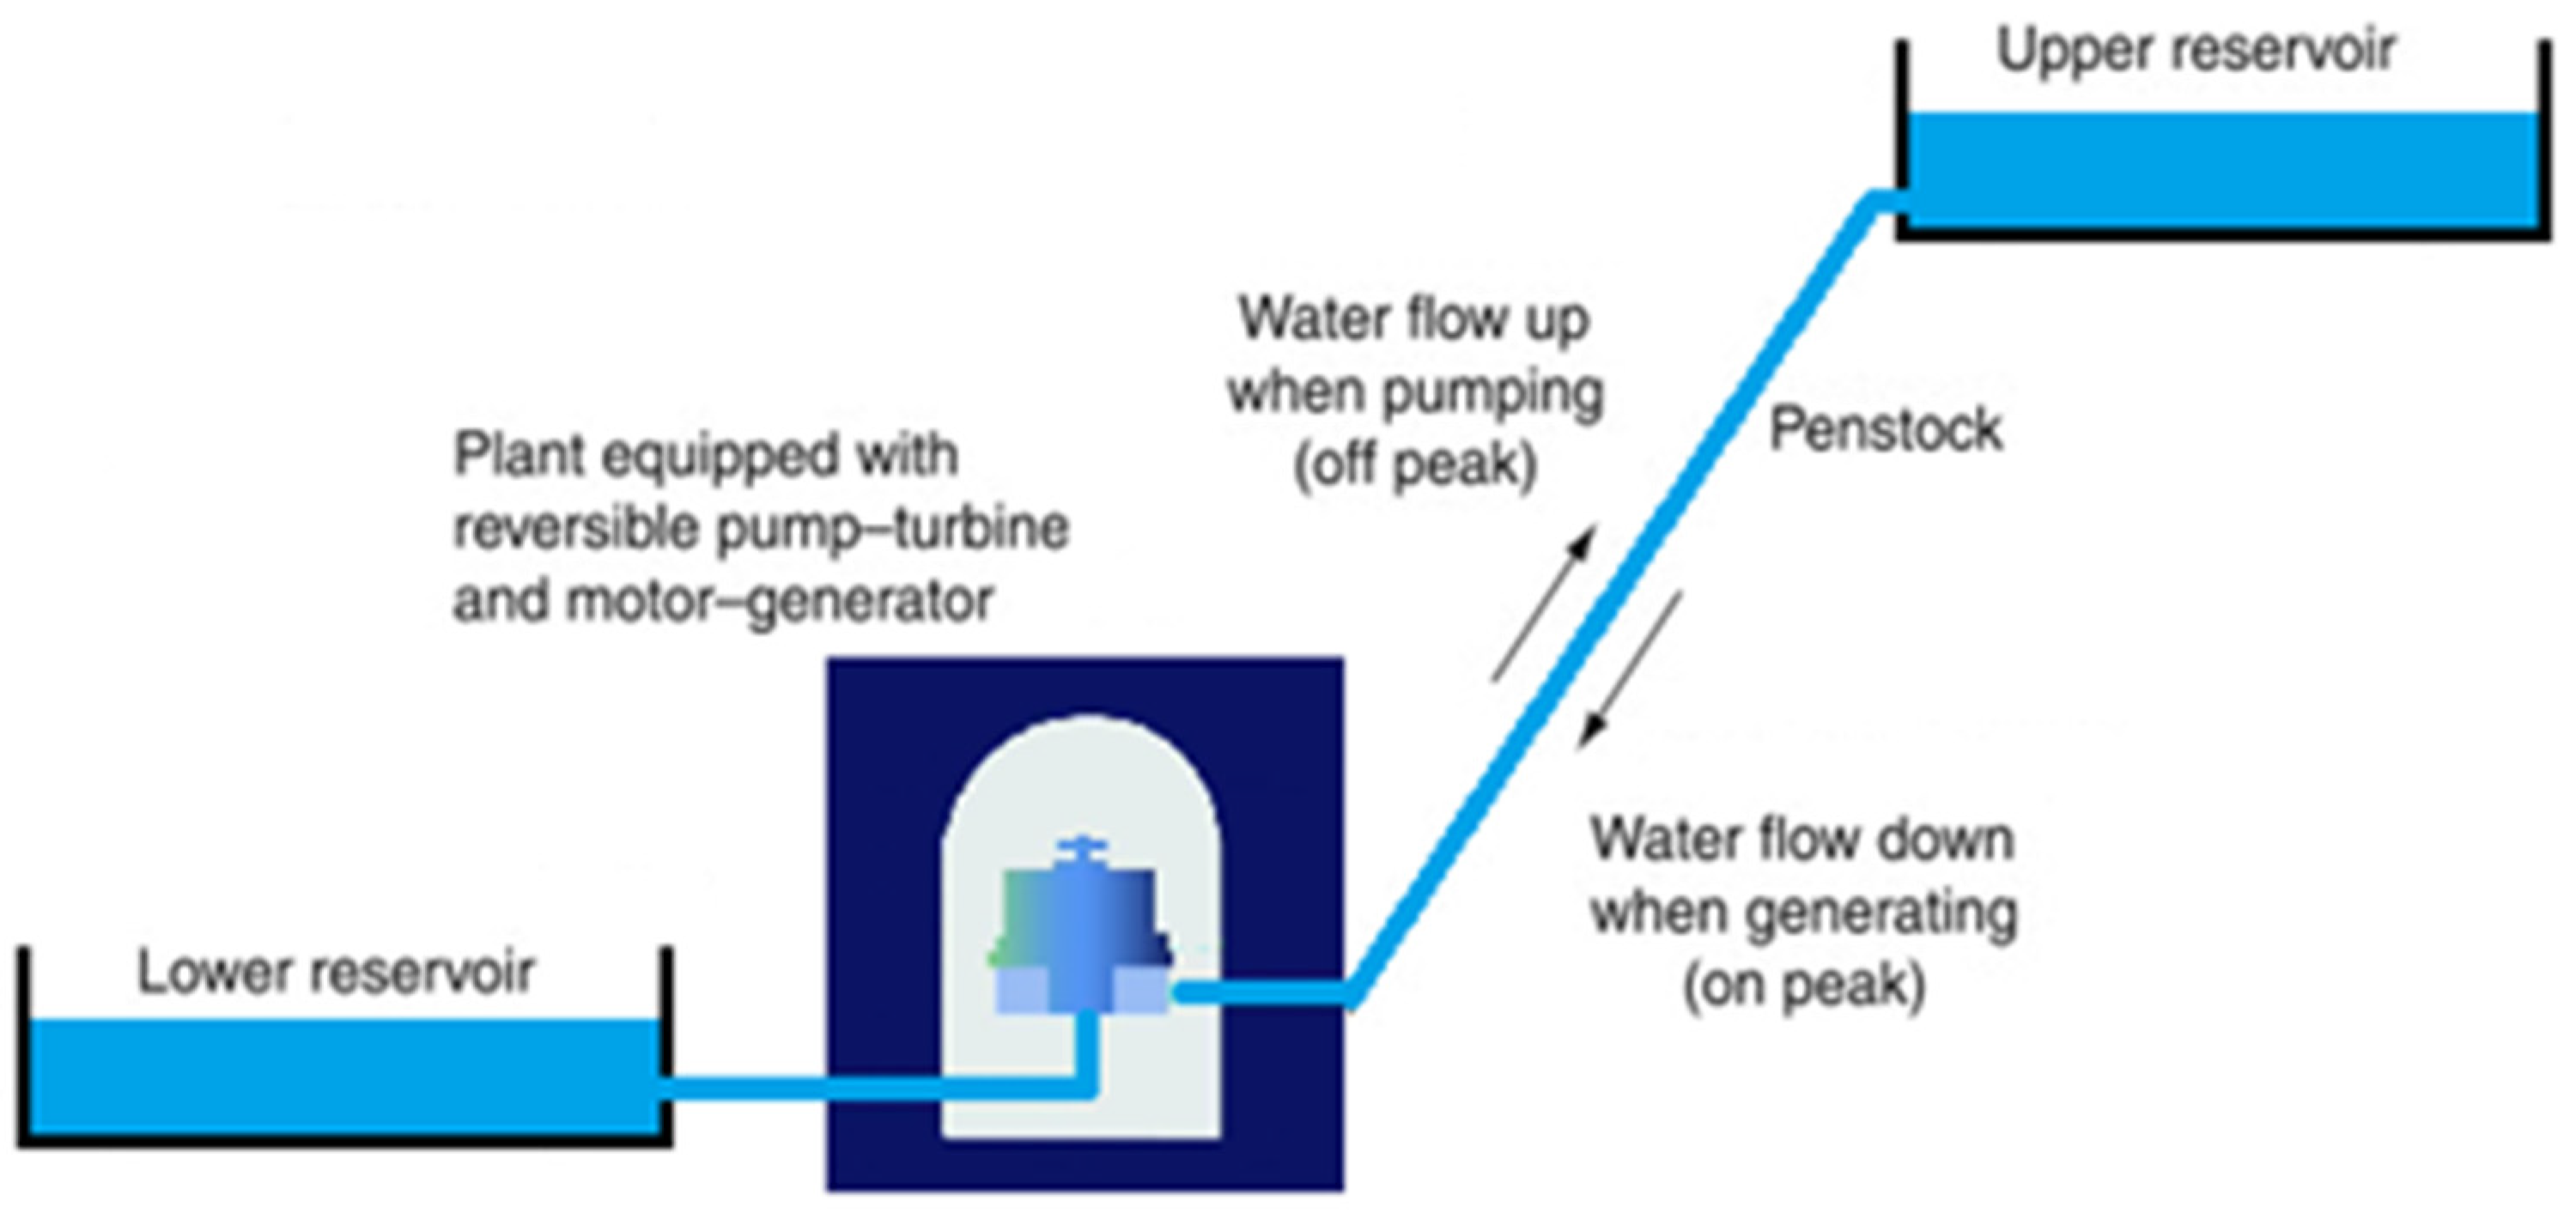
Figure 1. Structure of PHES.
Sustainability 14 15604 g001
Figure 2. Estimation of LMP.
Sustainability 14 15604 g002
Figure 3. CVaR and VaR representation.
Sustainability 14 15604 g003
Figure 4. Flowchart for calculating profit.
Sustainability 14 15604 g004
Figure 5. Flowchart for risk assessment.
Sustainability 14 15604 g005
Figure 6. Single-line diagram of modified IEEE 14-bus system.
Sustainability 14 15604 g006
Figure 7. Comparative study of bus voltages for different cases.
Sustainability 14 15604 g007
Figure 8. Comparative study of line losses for different cases.
Sustainability 14 15604 g008
Figure 9. Comparative study of system generation costs with different wind speeds.
Sustainability 14 15604 g009
Figure 10. Comparative study of system profits with different wind speeds.
Sustainability 14 15604 g010
Figure 11. Bus voltage profiles with wind speed of 6.67 m/s.
Sustainability 14 15604 g011
Figure 12. Comparison of profits/hour for Siliguri considering imbalance cost.
Sustainability 14 15604 g012
Figure 13. Comparison of profits/hour for Kolkata considering imbalance cost.
Sustainability 14 15604 g013
Figure 14. Comparison of profits/hour for Mumbai considering imbalance cost.
Sustainability 14 15604 g014
Figure 15. Comparison of profits/hour for Delhi considering imbalance cost.
Sustainability 14 15604 g015
Figure 16. Comparison of profits/day for all selected places considering imbalance cost.
Sustainability 14 15604 g016
Figure 17. Comparison of average profits among different places.
Sustainability 14 15604 g017
Figure 18. Average hourly profits using various optimization approaches for Siliguri and Delhi.
Sustainability 14 15604 g018
Figure 19. System risk with different optimization techniques for Delhi under different system conditions.
Sustainability 14 15604 g019
Table 1. Forecasted and actual wind data at 10 m height (in m/s) [37].
HourSiliguriKolkataMumbaiDelhi
FWSAWSFWSAWSFWSAWSFWSAWS
12.502.783.332.225.565.001.941.94
22.502.223.332.505.286.672.501.94
32.221.943.333.895.005.002.782.50
41.941.943.893.064.726.112.503.33
51.941.943.893.614.176.112.503.89
62.222.223.894.443.616.112.502.78
72.221.944.173.613.614.612.783.06
81.941.674.725.003.616.112.781.94
92.501.944.725.003.895.562.782.50
102.501.944.724.174.176.672.503.61
112.222.504.725.565.006.672.503.61
122.502.504.725.565.836.112.782.78
131.942.505.285.006.115.003.062.50
141.942.225.284.725.005.003.614.17
151.941.945.285.005.006.673.333.33
161.941.945.005.285.005.562.783.61
172.221.945.005.004.725.562.503.33
182.221.944.724.724.724.722.504.72
191.941.944.175.564.445.002.785.28
201.942.223.894.174.174.723.064.17
212.781.943.615.564.175.563.062.50
222.782.223.615.564.175.003.061.94
232.502.783.615.284.444.173.062.50
242.222.783.615.284.726.673.062.78
Table 2. Calculated forecasted and actual wind speeds at 120 m height (in m/s).
HourSiliguriKolkataMumbaiDelhi
FWSAWSFWSAWSFWSAWSFWSAWS
13.573.964.753.177.927.132.772.77
23.573.174.753.577.539.513.572.77
33.172.774.755.557.137.133.963.57
42.772.775.554.366.738.723.574.75
52.772.775.555.155.948.723.575.55
63.173.175.556.345.158.723.573.96
73.172.775.945.155.156.583.964.36
82.772.386.737.135.158.723.962.77
93.572.776.737.135.557.923.963.57
103.572.776.735.945.949.513.575.15
113.173.576.737.927.139.513.575.15
123.573.576.737.928.328.723.963.96
132.773.577.537.138.727.134.363.57
142.773.177.536.737.137.135.155.94
152.772.777.537.137.139.514.754.75
162.772.777.137.537.137.923.965.15
173.172.777.137.136.737.923.574.75
183.172.776.736.736.736.733.576.73
192.772.775.947.926.347.133.967.53
202.773.175.555.945.946.734.365.94
213.962.775.157.925.947.924.363.57
223.963.175.157.925.947.134.362.77
233.573.965.157.536.345.944.363.57
243.173.965.157.536.739.514.363.96
Table 3. Calculated wind power costs for different wind speeds.
Wind Speed at 10 m Height (m/s)Wind Speed at 120 m Height (m/s)Wind Power with 50 Turbines (MW)Wind Gen Cost with 50 Turbines ($/h)
1.672.381.013.799
1.942.771.616.032
2.223.172.409.004
2.503.573.4212.820
2.783.964.6917.586
3.064.366.2423.407
3.334.758.1030.389
3.615.1510.3038.637
3.895.5512.8748.257
4.175.9415.8359.353
4.446.3419.2172.033
4.726.7323.0486.401
5.007.1327.35102.563
5.287.5332.17120.624
5.567.9237.52140.690
5.838.3243.43162.866
6.118.7249.94187.258
6.679.5164.83243.112
Table 4. Revenue and generation costs for regulated and deregulated systems without placement of wind generator.
System DetailsParameterGenerator 1
(Bus No. 1)
Generator 2
(Bus No. 2)
Generator 3
(Bus No. 3)
Generator 4
(Bus No. 6)
Generator 5
(Bus No. 8)
Regulated systemGeneration (MW)194.3336.7228.7408.49
LMP ($/MWh)36.72438.3640.57539.73440.17
Generation cost ($/h)8081.530
Revenue cost ($/h)10,052.323
Profit ($/h)1970.793
Deregulated system with single-bus demand-side biddingGeneration (MW)194.3336.7228.7508.49
LMP ($/MWh)36.72438.3640.57539.73440.17
Generation cost ($/h)7777.780
Revenue cost ($/h)10,051.925
Profit ($/h)2274.145
Deregulated system with double-bus demand-side biddingGeneration (MW)192.0336.2922.5300.02
LMP ($/MWh)36.52638.14440.45139.50439.794
Generation cost ($/h)6597.930
Revenue cost ($/h)9310.490
Profit ($/h)2712.560
Table 5. Generation and LMP for deregulated system with double-bus DSB after placement of wind generator.
Sl. No.Wind Speed
(m/s)
Generator 1
(Bus No. 1)
Generator 2
(Bus No. 2)
Generator 3
(Bus No. 3)
Generator 4
(Bus No. 6)
Generator 5
(Bus No. 8)
Generation (MW)LMP ($/MWh)Generation (MW)LMP ($/MWh)Generation (MW)LMP ($/MWh)Generation (MW)LMP ($/MWh)Generation (MW)LMP ($/MWh)
11.67191.9236.51636.2738.13322.2340.4450.0039.4850.0039.781
21.94191.8536.51136.2538.12722.0540.4410.0039.4730.0039.773
32.22191.7636.50336.2438.11921.8140.4360.0039.4580.0039.763
42.50191.6536.49336.2238.10821.5040.4300.0039.4390.0039.750
52.78191.5136.48136.1938.09521.1240.4220.0039.4150.0039.733
63.06191.3436.46636.1638.07920.6540.4130.0039.3860.0039.713
73.33191.1336.44836.1238.05920.1040.4020.0039.3510.0039.689
83.61190.8936.42736.0738.03619.4340.3890.0039.3090.0039.660
93.89190.636.40336.0238.00918.6640.3730.0039.2610.0039.627
104.17190.2736.37435.9637.97817.7740.3550.0039.2060.0039.589
114.44189.936.34235.8937.94316.7640.3350.0039.1420.0039.545
124.72189.4736.30635.8137.90315.6140.3120.0039.0710.0039.496
135.00188.9936.26435.7237.85814.3240.2860.0038.9900.0039.440
145.28188.1536.19235.5637.7812.0740.2410.0038.8710.0039.332
155.56186.7636.07235.3037.658.3640.1670.0038.6960.0039.142
165.83185.2235.94035.0137.5064.2640.0850.0038.5030.0038.933
176.11183.2835.77334.6537.3250.0339.9620.0038.2660.0038.677
186.67169.9934.62932.0636.0280.0038.4840.0036.8070.0037.145
Table 6. Imbalance cost (in $/h) calculations for all considered locations.
HourSiliguriKolkataMumbaiDelhi
Regulated SystemDeregulated-System Single-Bus DSBDeregulated-System Double-Bus DSBRegulated SystemDeregulated-System Single-Bus DSBDeregulated-System Double-Bus DSBRegulated SystemDeregulated-System Single-Bus DSBDeregulated-System Double-Bus DSBRegulated SystemDeregulated-System Single-Bus DSBDeregulated-System Double-Bus DSB
14.3504.3252.106−435.565−434.861−183.762−760.981−760.982−640.0600.0000.0000.000
2−77.993−77.294−32.894−357.474−357.477−150.83961.45161.47461.582−138.618−138.683−58.308
3−60.610−61.373−25.4097.7117.5027.3070.0000.0000.000−96.958−96.197−41.070
40.0000.0000.000−714.471−504.751−214.20228.82128.85024.77410.36310.3367.207
50.0000.0000.000−194.940−263.848−82.77435.60635.63427.74213.40813.24413.169
60.0000.0000.00017.63817.8069.19738.65038.99729.9874.3504.3252.106
7−60.610−61.373−25.409−419.666−488.577−178.24726.94827.55715.9905.0055.0182.549
8−45.478−44.715−20.13813.33113.3486.44438.65038.99729.987−235.621−234.923−99.392
9−138.618−138.683−58.30813.33113.3486.44432.80032.85724.207−96.958−96.197−41.070
10−138.618−138.683−58.308−543.402−544.945−231.72972.56872.60967.22311.72111.23310.140
113.6613.6231.69524.01824.05219.71664.84564.86763.85311.72111.23310.140
120.0000.0000.00024.01824.05219.7168.2648.2608.1120.0000.0000.000
136.0216.0012.957−361.487−361.487−241.609−1.686−1.687−1.564−215.100−215.102−91.133
142.9372.9661.316−686.405−686.329−380.1980.0000.0000.00011.68612.7528.259
150.0000.0000.000−361.487−361.487−241.60964.84564.86763.8530.0000.0000.000
160.0000.0000.00013.68713.68710.04519.51419.51417.55910.1959.6068.474
17−60.610−61.373−25.4090.0000.0000.00024.01824.05219.71610.36310.3367.207
18−60.610−61.373−25.4090.0000.0000.0000.0000.0000.00031.19131.19721.771
190.0000.0000.00030.79530.82622.95921.32521.31511.08235.39035.42125.930
202.9372.9661.3168.2168.3374.68120.62920.65510.16316.24916.24913.206
21−235.621−234.923−99.39233.76334.10425.26830.79530.82622.959−215.100−215.102−91.133
22−174.978−173.515−73.97233.76334.10425.26826.73126.77014.502−353.817−353.882−149.472
234.3504.3252.10633.29533.67222.936−253.389−255.623−108.063−215.100−215.102−91.133
247.0747.0173.71533.29533.67222.93667.77567.81865.128−118.106−118.866−50.052
Table 7. Average hourly profits with different optimization techniques for Siliguri and Delhi.
Average Hourly Profit ($/h)
Optimization TechniqueConditionsSiliguriDelhi
Regulated SystemDeregulated-System Double-Bus DSBRegulated SystemDeregulated-System Double-Bus DSB
SQPWith WF2008.9102827.3102183.9273151.654
With WF and PHES2010.682830.382185.273154.68
ABCWith WF2009.5102827.9672184.6573152.428
With WF and PHES2011.6872831.2342186.8213155.921
MFOWith WF2009.7152828.1842184.8353152.709
With WF and PHES2011.8342831.3682186.9343155.825
Table 8. System risk with various optimization methods for Delhi under various system scenarios.
Sl. No.Wind PowerVaRCVaR
With Wind Farm Using SQPWith Wind Farm–PHES System Using SQPWith Wind Farm–PHES System Using ABCWith Wind Farm–PHES System Using MFOWith Wind Farm Using SQPWith Wind Farm–PHES System Using SQPWith Wind Farm–PHES System Using ABCWith Wind Farm–PHES System Using MFO
110.3 MW−0.3617−0.3515−0.3425−0.3319−0.5619−0.5426−0.5316−0.5216
28.1 MW−0.3646−0.3534−0.3448−0.3339−0.5663−0.5486−0.5374−0.5257
33.42 MW−0.365−0.3547−0.3459−0.3342−0.567−0.5491−0.5365−0.5268
Publisher’s Note: MDPI stays neutral with regard to jurisdictional claims in published maps and institutional affiliations.