Article

Solute Geochemistry and Water Quality Assessment of Groundwater in an Arid Endorheic Watershed on Tibetan Plateau

1
Bureau of Qinghai Environmental Geological Prospecting, Xi’ning 810007, China
2
Key Laboratory of Geo-Environment of Qinghai Province, Xi’ning 810007, China
3
Qinghai 906 Engineering Survey and Design Institute Co., Ltd., Xi’ning 810007, China
4
Faculty of Geosciences and Environmental Engineering, Southwest Jiaotong University, Chengdu 611756, China
5
Faculty of Engineering, Payam Noor University, Tehran P.O. Box 76169-14111, Iran
6
Department of Disaster Management, Alagappa University, Karaikudi 630002, India
*
Authors to whom correspondence should be addressed.
Sustainability 2022, 14(23), 15593; https://doi.org/10.3390/su142315593
Submission received: 23 September 2022 / Revised: 8 November 2022 / Accepted: 17 November 2022 / Published: 23 November 2022

Abstract

:
Understanding groundwater geochemistry is crucial for water supply in arid regions. The present research was conducted in the arid Mo river watershed on the Tibetan plateau to gain insights into the geochemical characteristics, governing processes and quality of groundwater in arid endorheic watersheds. A total of 28 groundwater samples were collected from the phreatic and confined aquifers for hydrochemical analysis. The results showed that the groundwater was slightly alkaline in all aquifers of the watershed. The phreatic groundwater samples (PGs) and confined groundwater samples (CGs) had the TDS value in the ranges of 609.19–56,715.34 mg/L and 811.86–2509.51 mg/L, respectively. PGs were salter than CGs, especially in the lower reaches. Both the PGs and CGs were dominated by the Cl-Na type, followed by the mixed Cl-Mg·Ca type. The toxic elements of NO2 (0.00–0.20 mg/L for PGs and 0.00–0.60 mg/L for CGs), NH4+ (0.00–0.02 mg/L for PGs and 0.00–0.02 mg/L for CGs) and F (0.00–4.00 mg/L for PGs and 1.00–1.60 mg/L for CGs) exceeded the permissible limits of the Chinese guidelines at some sporadic sites. Water–rock interactions, including silicates weathering, mineral dissolution (halite and sulfates) and ion exchange, were the main contributions to the groundwater chemistry of all aquifers. The geochemistry of PGs in the lower reach was also greatly influenced by evaporation. Agricultural sulfate fertilizer input was responsible for the nitrogen pollutants and salinity of PGs. All CGs and 73.91% of PGs were within the Entropy-weighted water quality index (EWQI) of below 100 and were suitable for direct drinking purposes. Precisely 8.70 and 17.39% of PGs were within the EWQI value in the range of 100–150 (medium quality and suitable for domestic usage) and beyond 200 (extremely poor quality and not suitable for domestic usage), respectively. The electrical conductivity, sodium adsorption ratio, sodium percentage and permeability index indicated that groundwater in most parts of the watershed was suitable for irrigation, and only a small portion might cause salinity, sodium or permeability hazards. Groundwater with poor quality was mainly distributed in the lower reaches. CGs and PGs in the middle-upper reaches could be considered as the primary water resources for water supply. Agricultural pollution should be paid more attention to safeguard the quality of groundwater.

1. Introduction

Although our earth is called the “blue planet”, as more than 70% of its surface is covered by water, most of the water is salty and not suitable for various usages of human society and continental ecosystems [1,2]. Freshwater is considered one of the most important natural resources supporting the sustainable development of a human community and has been treated as the strategic natural resource for national development by many counties over the world [3,4]. Our world is experiencing unprecedented, drastic climate change and facing serious and complex environmental challenges [5,6,7,8,9]. Among all of the environmental challenges, water shortage is the most widespread and profound across the world [10]. This challenge is much more severe in arid and semiarid regions where there is a significantly poorer endowment of water resources [7,11,12]. Groundwater is an invaluable water resource for various usages such as municipal, industrial and agricultural purposes for many people in the world, particularly in water-scarce regions [13,14,15]. Groundwater has been a crucial water resource supporting the development of human communities and ecosystems worldwide [16,17,18]. Thus, a deep understanding of groundwater endowment and its suitability is essential for the scientific and rational utilization of groundwater resources and for maintaining the sustainable development of groundwater [19].
The availability of groundwater is dependent on two major aspects, including quantity and quality [20]. Quantity is the first factor being considered in groundwater resource exploration and utilization. Vast works and research have been conducted in terms of groundwater quantity and the yield of aquifers worldwide [21,22]. A lot of hydrogeological achievements have been obtained during this process and supported the exploitation of many potential groundwater reservoirs across the world [3,23,24,25]. Aside from the water quantity, the chemical quality of groundwater also significantly determines the availability of groundwater resources [26]. It is widely known that water is fundamental to life, and water quality determines the health of flora and fauna [27,28]. Access to clean groundwater resources is related to the preservation of the health and sustainability of earth systems, including human and animal communities and ecosystems [8]. Therefore, revealing the hydrogeochemical mechanisms and quality of groundwater resources is significantly important for guaranteeing the availability of quality groundwater.
It is widely known that water in nature is not pure and contains many substances. The chemical substances of groundwater originate from numerous sources [18,29]. Initially, the chemicals in groundwater are brought by the recharge of water into the aquifers from external sources [30]. The chemical substances in recharge waters make up the fundamental framework of groundwater hydrochemistry and quality. After water enters the aquifers, various hydrogeochemical processes occur in groundwater which further changes its composition [31,32]. Water–rock interactions are the predominant substances contributing to groundwater quality [14,33]. This contribution varies spatially due to the various lithologies and hydrogeological conditions of the aquifers [10]. The residence time of groundwater in the aquifers is an important factor in determining the degree of water–rock interactions [34,35]. Additionally, the hydrodynamic of groundwater is also reported to affect the hydrogeochemical processes and finally regulate the composition and quality of groundwater [36]. The climatic factors, particularly the strong evaporation in arid regions, can greatly influence groundwater chemistry and are reportedly responsible for the salinity of phreatic groundwater in many parts of the world [17,37].
Aside from the natural processes, anthropogenic disturbances to groundwater chemistry have become more and more significant due to the rapid growth of world populations and intensive human activities in the past decades [38,39,40]. The most important and direct influence induced by human communities on groundwater quality is the direct input of pollutants into aquifers, which pollutes the clean water beneath the ground surface [7,41]. The hydrogeological environment has become more and more complex as the overlay of natural and anthropogenic mechanisms [42,43]. In order to ensure the safety of the water supply, the mechanisms of groundwater chemistry should be distinguished, and then corresponding measures in water environment protection and groundwater exploitation should be conducted [14,44].
Arid and semiarid regions are important parts of the earth and account for more than 40% of the global land [45]. These regions contain a large number of world populations, cities and agricultural lands [12,31,35,46]. The conflict of water resources is much more significant in these regions due to the scarcity of water resources [10,39]. The special climatic features in these regions, such as rare precipitation and strong evaporation, create poor water endowment and complex hydrogeochemical conditions. Endorheic watersheds are more special in arid and semiarid regions since the chemical salts in water cannot leave the watersheds but accumulate in the water of rivers, underground reservoirs and tail lakes [34,47]. The strong evaporation and accumulation of chemical salts would further aggravate the water crisis in these arid and semiarid watersheds [48,49]. The available freshwater resource is limited in small endorheic watersheds due to the short distance of groundwater evolution from freshwater in the headwater region to salty water in the tail lake region [29]. Thus, focusing on groundwater chemistry and its availability is significantly important for ensuring the long-term sustainable utilization of water resources for small endorheic watersheds [50]. Although a great number of research works have been conducted regarding groundwater availability with both quantity and quality aspects, research concerned with small endorheic watersheds is rare [51,52,53].
The present research takes a typical arid endorheic watershed, namely the Mo river watershed on the Tibetan plateau, as an example to gain insights into the hydrogeochemical characteristics, governing processes and quality of groundwater in small arid endorheic watersheds. The results and findings could provide useful references and scientific support for the utilization and management of groundwater resources in hyper-arid endorheic watersheds worldwide.

2. Materials and Methods

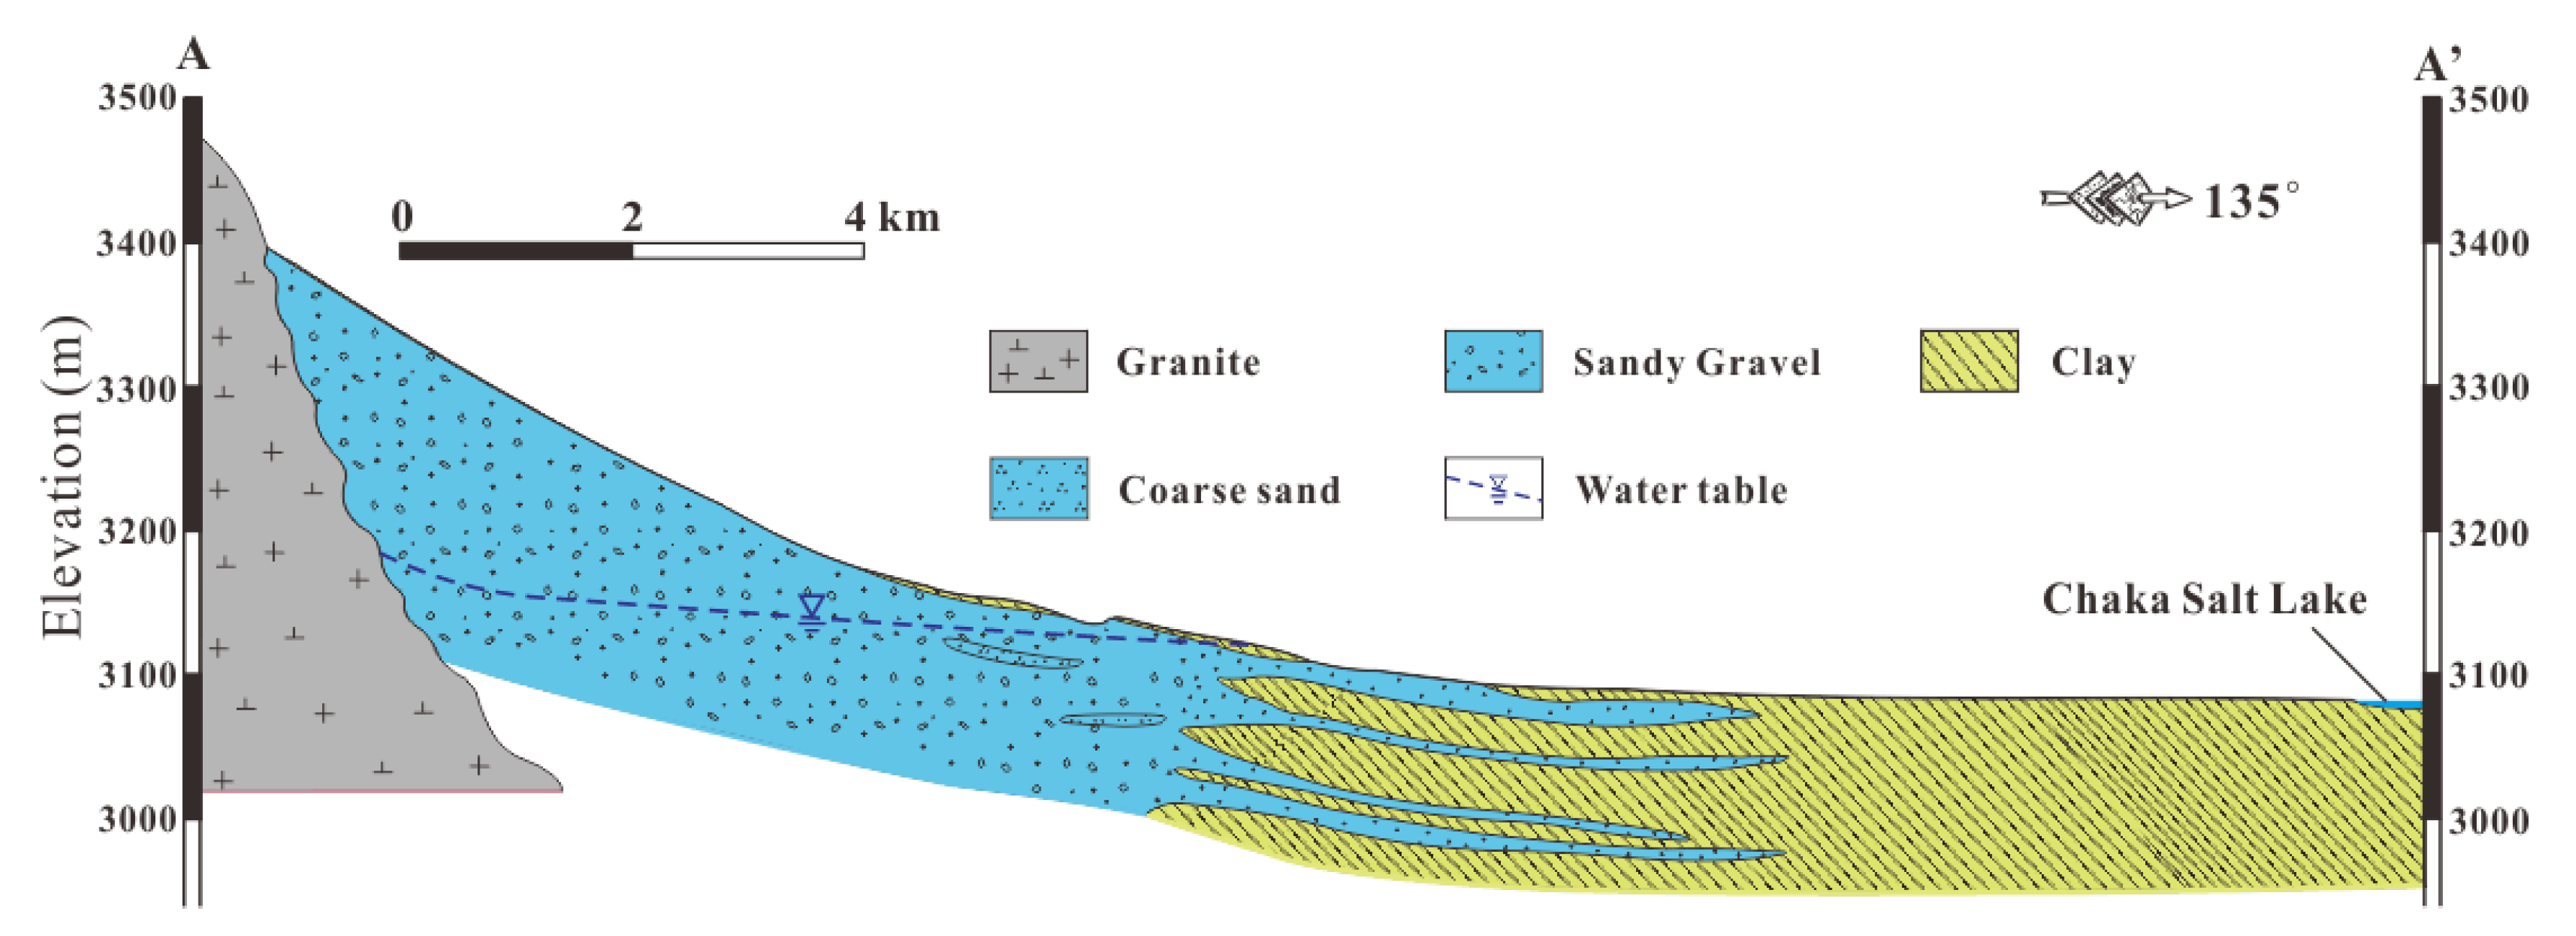
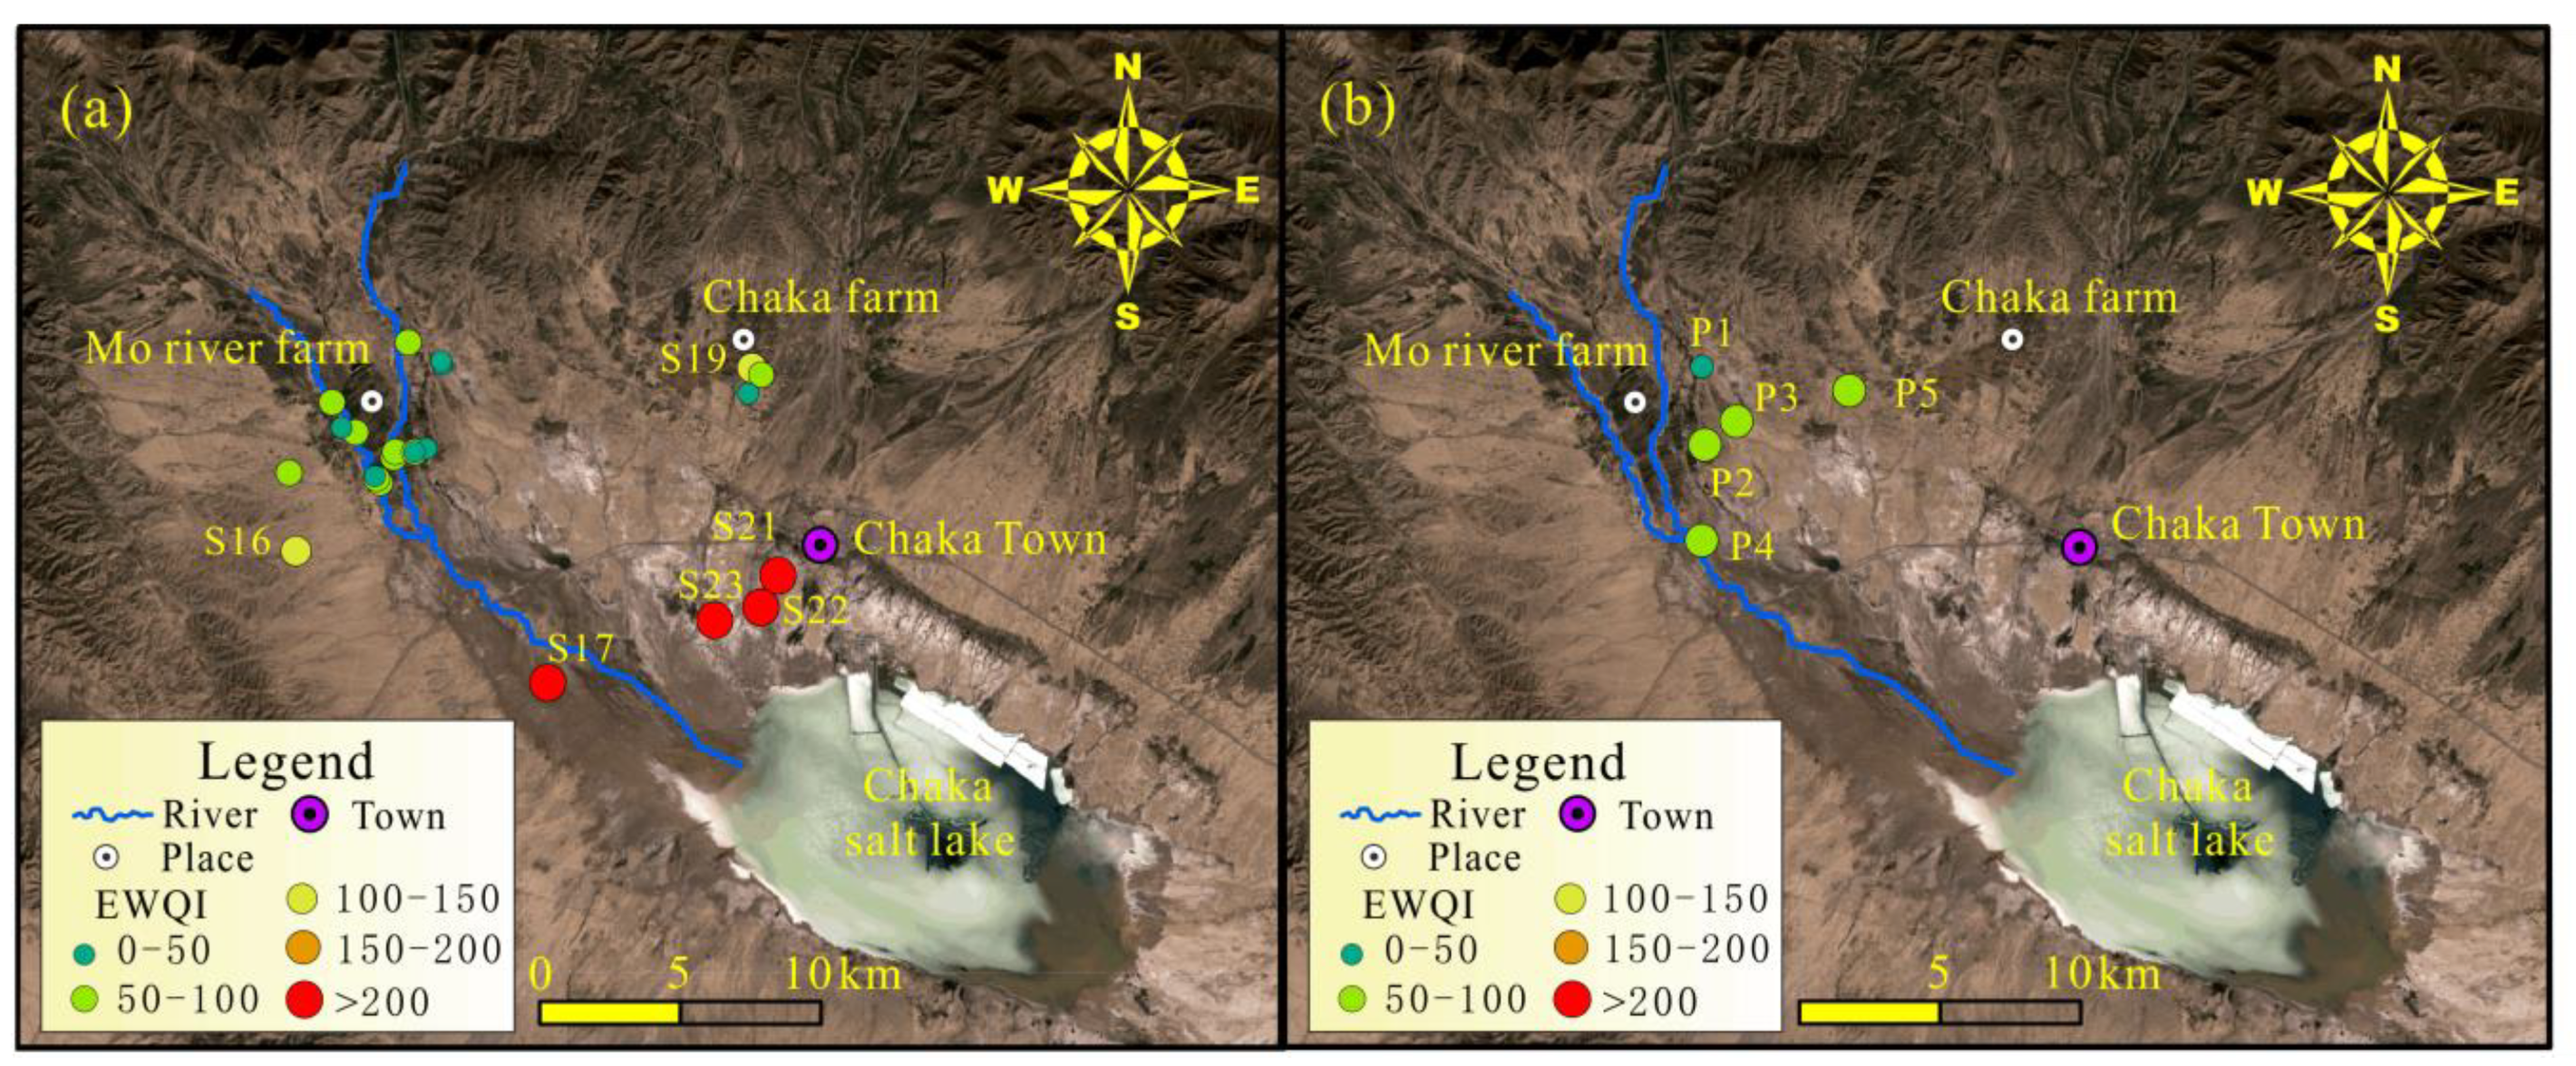
2.1. Description of the Study Area

The Chaka basin is one of the most significantly arid basins located in the northern Tibetan plateau (Figure 1). The present watershed, i.e., the Mo river watershed, is the largest watershed in this basin. The study area extends between 36°37′51.92″ N and 36°57′18.67″ N latitudinally and between 98°45′16.16″ E and 99°15′03.36″ E longitudinally, covering an area of 1593.98 km2. The Mo river is the largest river running through the watershed. It originates from the northwest mountainous area of the Chaka basin and ends at the center of the basin. Chaka salt lake, enjoying a reputation as the “sky mirror”, is the tail lake of the watershed [29]. All surface and groundwater in the watershed finally discharge into the Chaka salt lake. As a result, the Mo river watershed is an endorheic watershed. This watershed features a semi-desert arid continental climate. The annual average temperature is 2.9 °C. The precipitation is limited and less than 200 mm per year, as most of the precipitation occurs during the wet season from May to September. The evaporation is significantly strong and reaches about ~2500 mm per year. Due to the scarcity of local precipitation, river water in the watershed is also not developed. As a result, human societies and ecosystems in the watershed are heavily dependent on groundwater resources.
The Chaka basin is a closed fault basin that was fundamentally formed during the Cenozoic era. It is bounded by the Nanshan mountains in the north and the Ela mountains in the south and presents in the shape of a long strip in the NW direction. The lithology of the basin ranges from Paleozoic bedrocks to Quaternary deposits. The Mo river watershed is a typical part of the Chaka basin. The pre-Quaternary strata are mainly distributed in the upper reaches of the mountainous area and dominated by the Paleozoic and Triassic metamorphic rocks. The strata in the basin are predominantly Quaternary deposits with various lithologies. The lithologies of the Quaternary deposits in the basin vary from gravel in the piedmont to fine sand and clay in the lower reaches (Figure 2). Groundwater in the basin mainly occurs in the Quaternary aquifers. Due to the spatial variation of Quaternary deposits lithology, the Quaternary aquifers in the basin vary from a single thick phreatic aquifer in the piedmont to a semi-confined aquifer in the middle reaches, and finally, the multiple layers of phreatic-confined aquifers in the basin center. The groundwater of the basin predominantly originated from the leakage of river water at the piedmont. The lateral flow from the bedrock at the mountain pass also contributes some groundwater to the Quaternary aquifers. The contribution of local precipitation to the Quaternary aquifers in the basin is limited. Groundwater naturally discharges through springs and flows laterally into the Chaka salt lake. With the rapid development of the watershed, human pumping has become one of the dominant ways groundwater discharges into the watershed. Groundwater exploration is mainly concentrated in the Mo river and Chaka farms, and Chaka town (Figure 1c).

2.2. Sampling and Analytical Techniques

A total of 28 groundwater samples were collected from the Mo river watershed during the months of June and July of 2022. These groundwater samples were sampled from 23 phreatic wells and five confined boreholes. The depths of phreatic boreholes are in the range of 40–160 m and are mostly greater than 100 m in the middle-upper area of the watershed and within 60 m in the lower reach of the watershed. All confined boreholes have greater depth and range from 120–195 m. In order to eliminate the influence of stagnant waters in the representative groundwater samples, the wells and boreholes were pumped for more than three volumes. Water temperature, pH and electrical conductivity (EC) were monitored in situ, and the sampling strategy was conducted after these in-situ monitoring parameters were stable. The sample containers consisted of 2.5 L high-density polyethylene bottles and were thoroughly washed at least three times using the targeted groundwater before sampling. The groundwater samples were stored at 4 °C and sent to the laboratory for analysis within two days.
The in-situ parameters (pH, EC) of groundwater were determined in the field with the aid of a portable multiparameter device (Multi350i/SET, Munich, Germany). The major cations of Ca2+, Mg2+, Na+ and K+ and toxic elements (Cu, Pb, As, Al, Fe, Mn, Zn, Cr, etc.) were measured using the inductively coupled plasma-mass spectrometry (Agilent 7500ce ICP-MS, Tokyo, Japan). Ions, including NH4+, Cl, SO42−, NO3, NO2 and F, were analyzed by ion chromatography (Shimadzu LC-10ADvp, Kyoto, Japan). The HCO3 was determined by acid-base titration. The gravimetric analysis was conducted to obtain the total dissolved solids (TDS) of groundwater. The accuracy of groundwater analysis was checked using the ionic charge balance error percentage (%ICBE). The results showed that all groundwater samples had an %ICBE of ± 5%, implying the hydrogeochemical data of groundwater were reliable and could be used for research.

3. Results and Discussion

3.1. General Chemistry of Groundwater

The physicochemical parameters of phreatic and confined groundwater sampled from the study area are statistically presented in Table 1. The measured pH values varied from 7.42 to 8.66 in the phreatic aquifers and between 7.78 and 8.52 in the confined aquifers, suggesting that groundwater in the watershed was of a slightly alkaline nature regardless of the depth. The phreatic groundwater samples had a wider range of EC than confined groundwater samples. The EC values of phreatic groundwater ranged from 1033.50 to 44,205.00 μS/cm, and the confined groundwater ranged from 1309.00 to 3608.10 μS/cm. The TDS values also showed a similar state at different depths. The TDS values were in the range of 609.19–56,715.34 mg/L for phreatic groundwater and 811.86–2509.51 mg/L for confined groundwater. All of the above suggests that the phreatic groundwater in the watershed is saltier in nature than the confined groundwater.
Among the major cations, Na+ is the predominant ion in both phreatic and confined aquifers, with concentrations ranging from 85.00 to 18,610.00 mg/L (averaging 2012.05 mg/L) and from 145.25 to 635.29 mg/L (averaging 197.46 mg/L), respectively. Ca2+ ranks second regardless of the depth and is in a range of 50.84–1102.20 mg/L (averaging 160.48 mg/L) for phreatic groundwater and 76.55–160.32 mg/L (averaging 100.52 mg/L) for confined groundwater. Mg2+ ranks third in both phreatic and confined aquifers, followed by K+. Phreatic groundwater has an Mg2+ concentration in the range of 18.95–1358.37 mg/L (averaging 135.53 mg/L) and a K+ concentration in the range of 1.50–68.81 mg/L (averaging 13.51 mg/L). The confined groundwater samples show an Mg2+ concentration varying between 41.07 and 80.68 mg/L (averaging 100.52 mg/L) and a K+ concentration varying between 4.50 and 17.02 mg/L (averaging 8.26 mg/L). For all major cations, phreatic groundwater shows greater variation in ion concentrations than confined groundwater, according to the standard deviation values of each parameter.
Among the major anions, Cl was the dominant ion in both phreatic and confined aquifers. Its concentration varied from 172.29 to 31,550.50 mg/L (averaging 3177.79 mg/L) for the phreatic groundwater samples and ranged between 232.55 and 1153.54 mg/L (averaging 485.95 mg/L) for the confined groundwater samples. SO42− ranked second with a concentration ranging from 33.62 to 3866.42 mg/L (averaging 595.96 mg/L) for the phreatic groundwater samples and varied between 180.59 and 379.44 mg/L (averaging 248.80 mg/L) for the confined groundwater samples. HCO3 was the lowest ion in all aquifers. It had a concentration in the range of 137.91–634.61 mg/L (averaging 278.44 mg/L) for the phreatic groundwater and 146.45–335.41 mg/L (averaging 244.08 mg/L) for the confined groundwater. The major anions also showed greater variation in the phreatic aquifers than that in the confined aquifers.
Nitrogen, fluoride and other toxic element concentrations (Cu, Pb, As, Al, Fe, Mn, Zn, Cr, etc.) were determined in phreatic and confined aquifers. Overall, most toxic elements (Cu, Pb, As, Al, Fe, Mn, Zn, Cr, etc.), except nitrogen and fluoride, had relatively low concentrations and were even below the detection limits; thus, they were not included in the following analysis. For nitrogen, the concentration of all nitrogen pollutants in phreatic groundwater was higher than that in confined groundwater. The NO3 concentration in phreatic groundwater varied from 0.92 to 37.30 mg/L (averaging 17.12 mg/L), and confined groundwater ranged between 4.00 and 16.00 mg/L (averaging 9.20 mg/L). All collected phreatic and confined groundwater samples tested for NO3 concentrations were below the permissible limits of 50 mg/L, as determined by the WHO guidelines [55]. The NO2 and NH4+ in phreatic aquifers were in the range of 0.00–0.20 mg/L (averaging 0.01 mg/L) and 0.00–0.02 mg/L (averaging 0.07 mg/L), respectively. Additionally, NO2 and NH4+ in confined aquifers were in the range of 0.00–0.60 mg/L (averaging 0.02 mg/L) and 0.00–0.02 mg/L (averaging 0.08 mg/L), respectively. Both phreatic and confined aquifers were found with NO2 and NH4+ pollutants exceeding the permissible limits of 0.02 and 0.2 mg/L determined by the Chinese guideline [54] at some sampling locations. The F in phreatic and confined groundwater was in the range of 0.00–4.00 mg/L (averaging 0.48 mg/L) and 1.00–1.60 mg/L (averaging 1.27 mg/L), respectively.

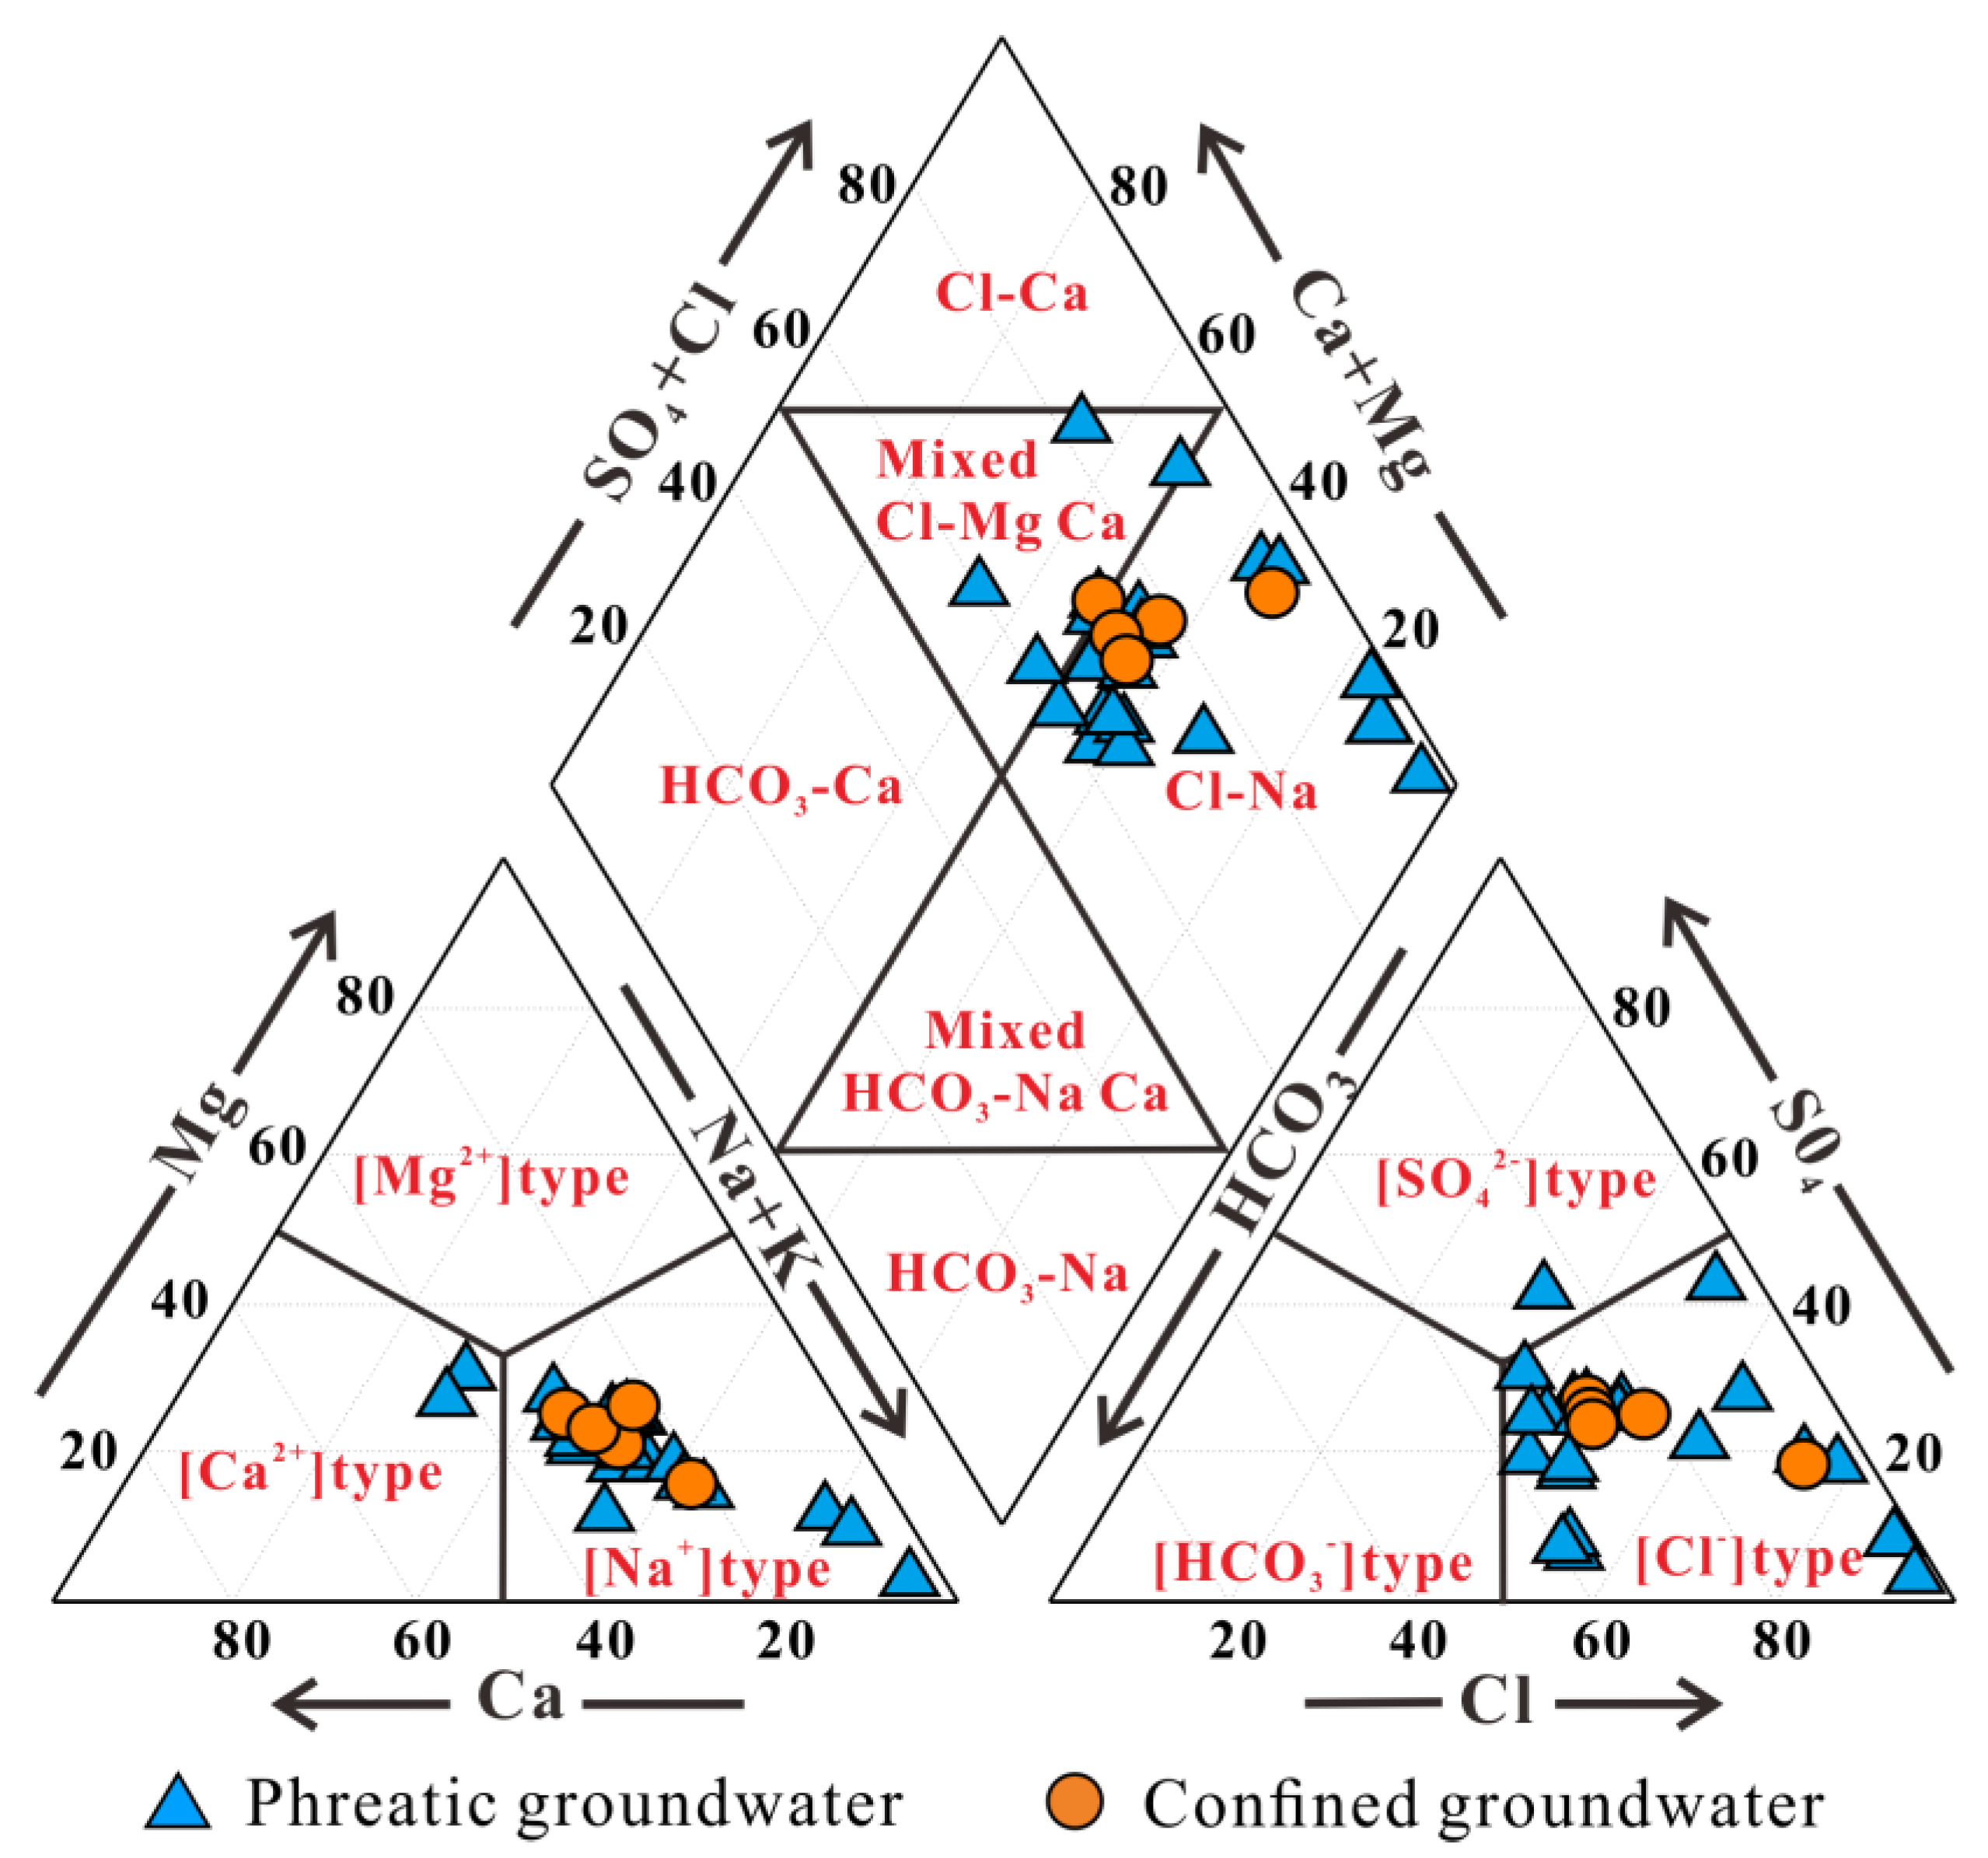
3.2. Hydrogeochemical Facies

The overall hydrochemical characteristics of groundwater can be illustrated by the hydrogeochemical facies [42], which could be graphically represented by the Piper trilinear diagram. The Piper trilinear diagram involves two triangles below and one diamond above. The two lower triangles are used to separate the cations and anions of water and represent their dominant ions. The diamond is used to map the combination of cations and anions and reveals the hydrogeochemical facies of water [35,56,57]. Six hydrogeochemical facies, including HCO3-Ca, mixed HCO3-Na·Ca, HCO3-Na, mixed Cl-Mg·Ca, Cl-Ca and Cl-Na, are categorized by the Piper trilinear diagram.
As presented in Figure 3, all collected groundwater samples except two phreatic groundwater samples are observed plotting in the [Na+] type dominance in the lower left of the Piper trilinear diagram, suggesting that Na+ is the predominant cation of groundwater in most sites of the watershed regardless of the sampling depth. The other two phreatic groundwater samples are situated in the [Na+] type dominance of the lower left trilinear, indicating Ca2+ is the dominant cation in these two groundwater samples. For the anions, all confined groundwater samples and almost all phreatic groundwater samples are situated in the [Cl] type dominance in the lower right of the Piper trilinear diagram, indicating Cl is the dominant anion for both phreatic groundwater and confined groundwater. Only one phreatic groundwater is observed plotting in the [SO42−] type dominance, and SO42− is the predominant anion. The diamond of the Piper trilinear diagram shows that all groundwater in the watershed plot from the mixed Cl-Mg·Ca type dominance to the Cl-Na type dominance. It can be seen that most of the collected groundwater samples, regardless of the depth, belonged to the Cl-Na type, and only a small part of phreatic (26.09%) and confined (20%) groundwater samples were mixed Cl-Mg·Ca type water. Overall, groundwater in phreatic aquifers is salty to some degree in terms of the hydrogeochemical facies, and confined groundwater is presented as fresher in nature compared to phreatic groundwater.

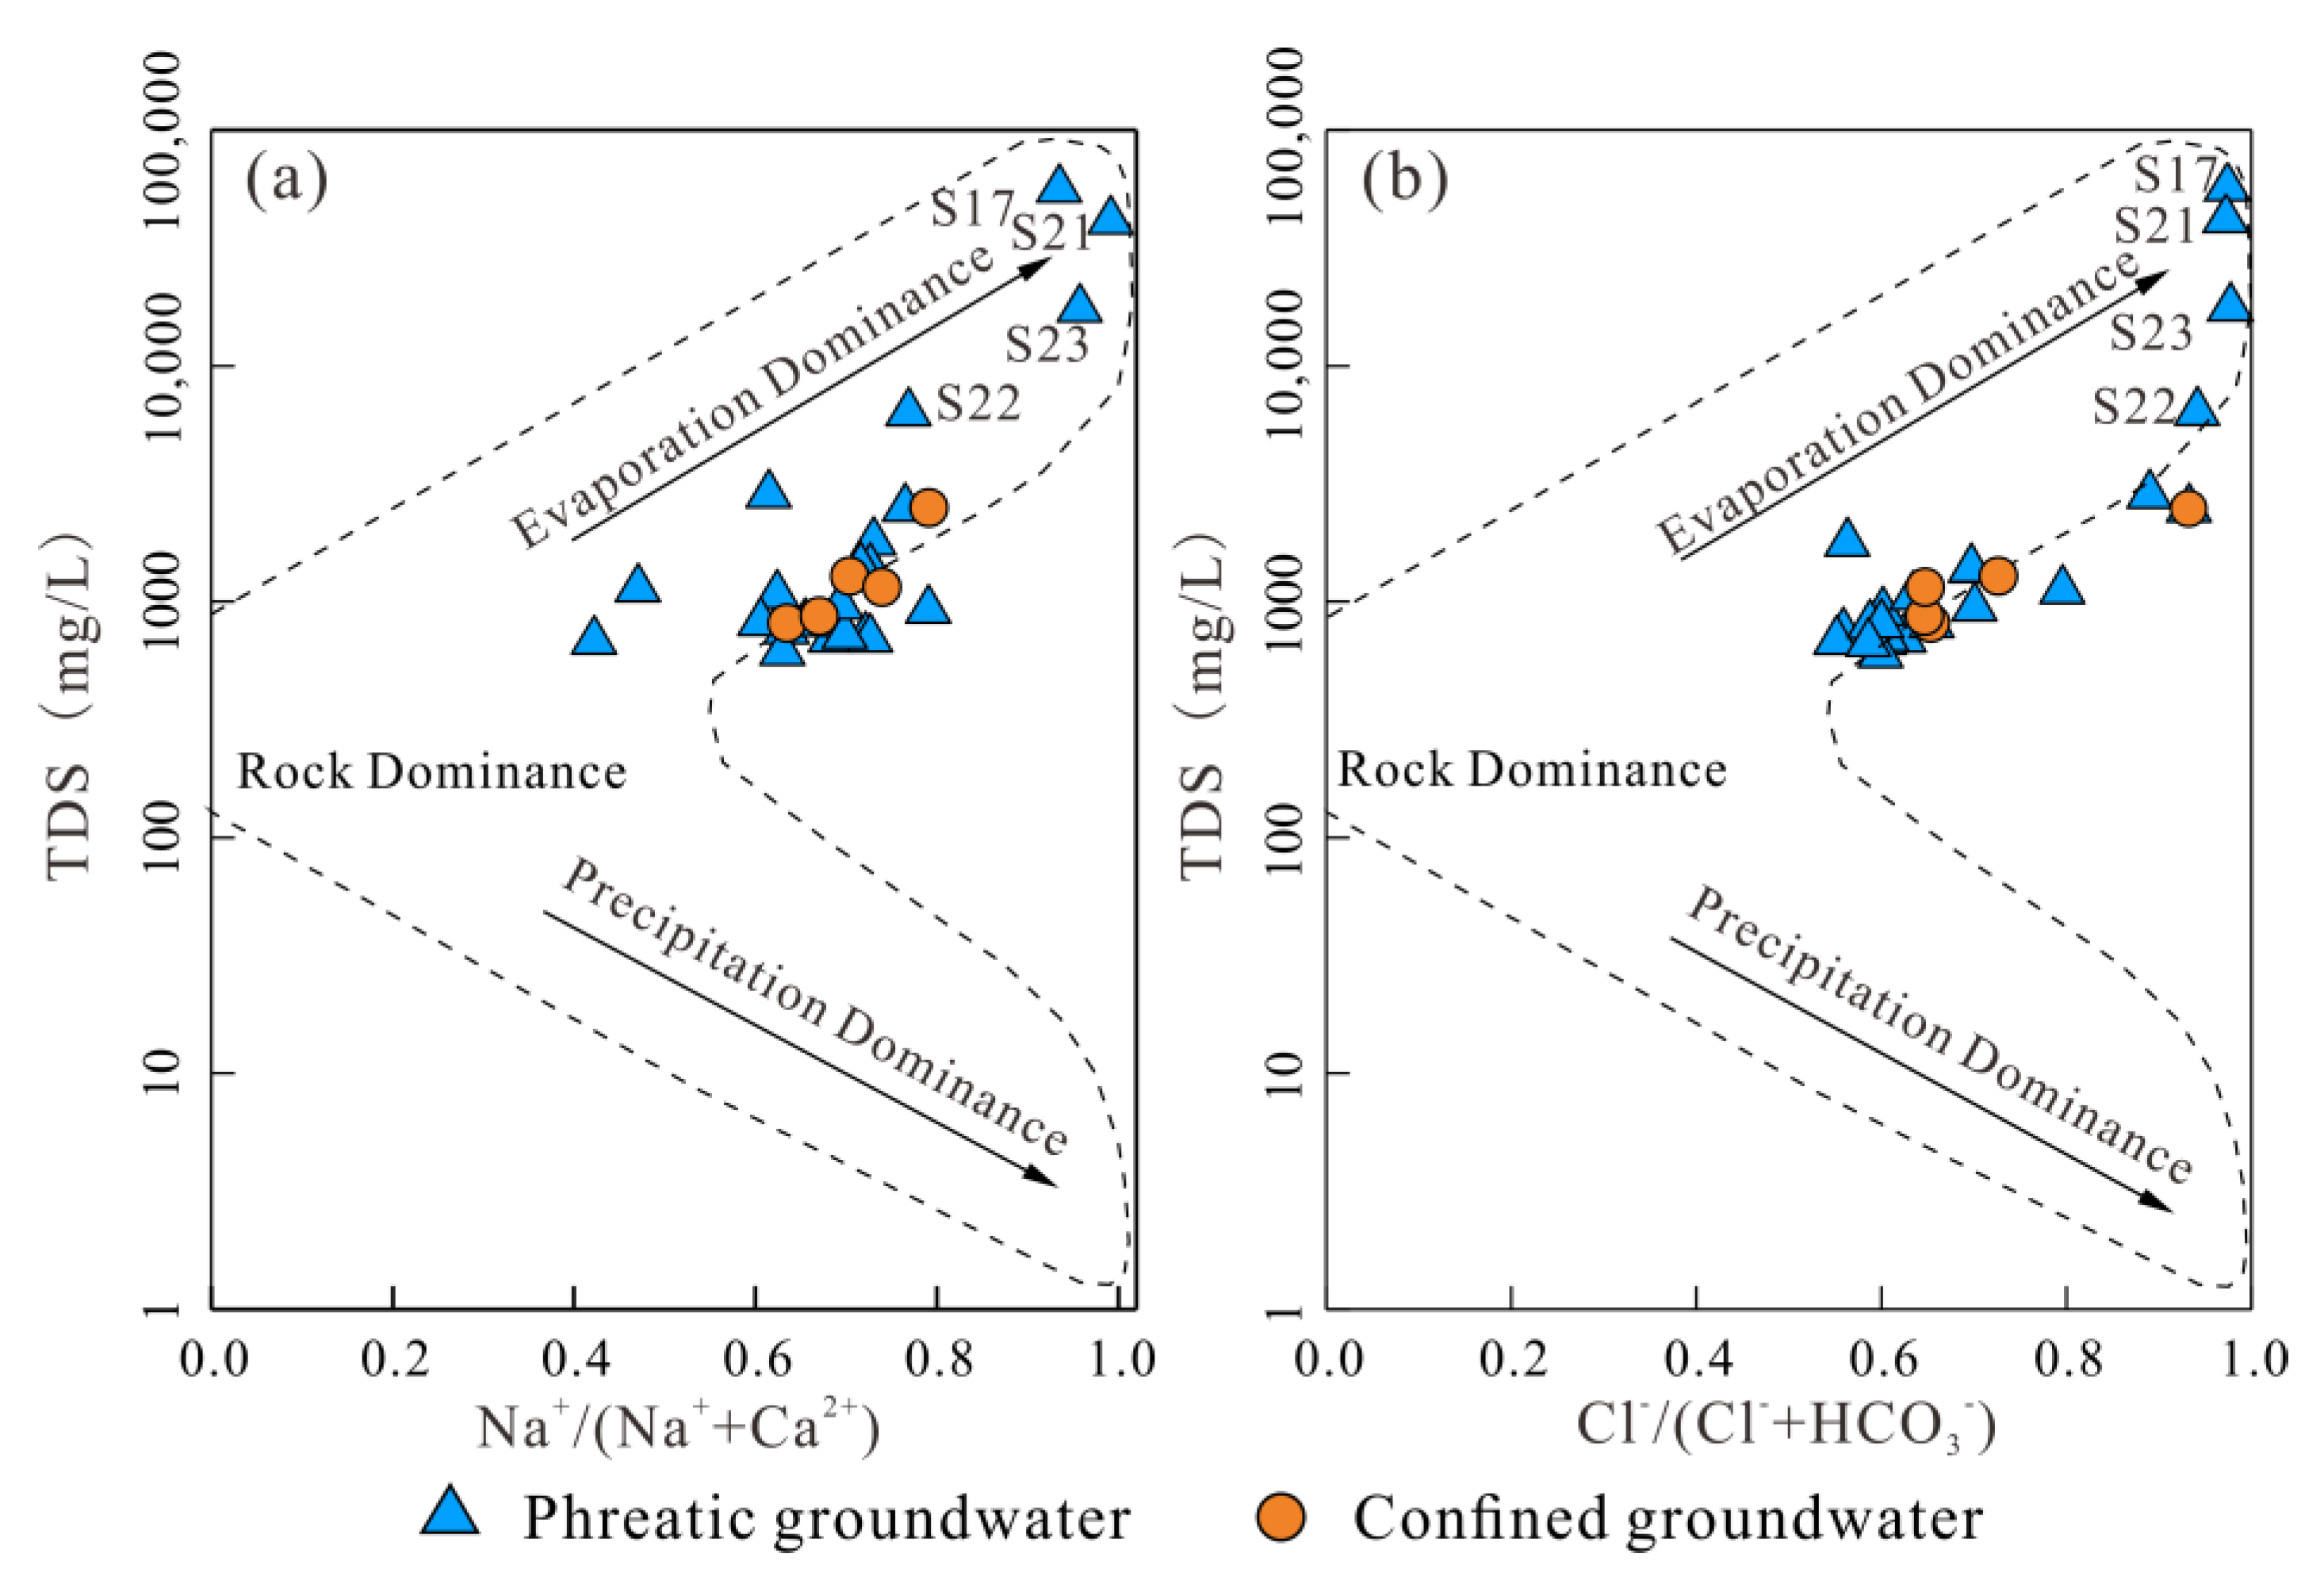
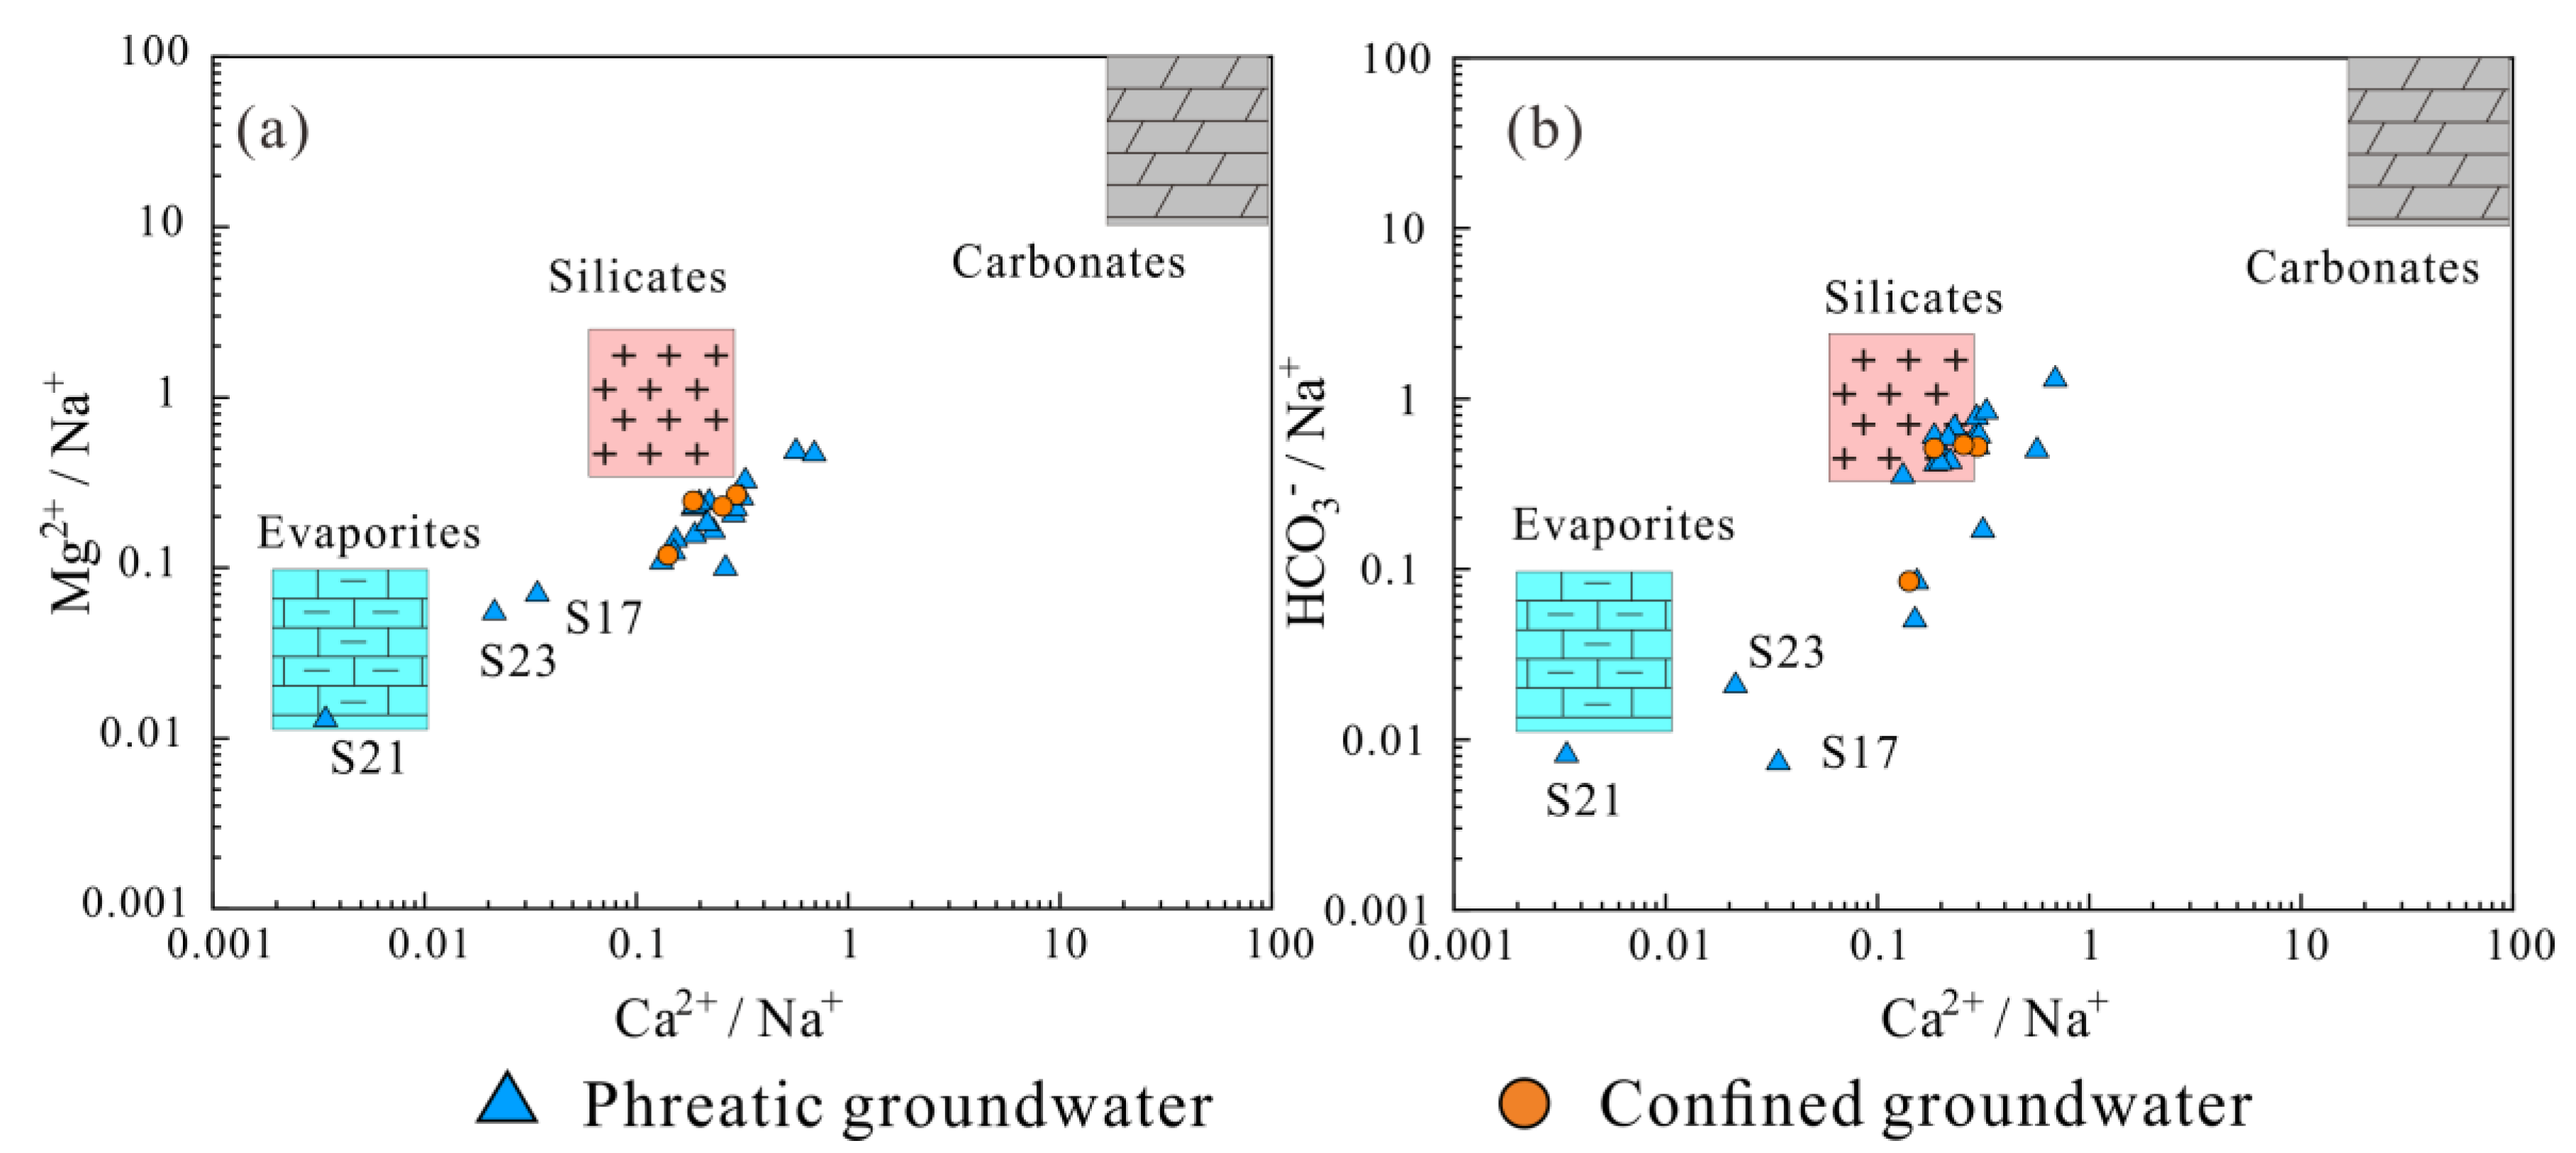
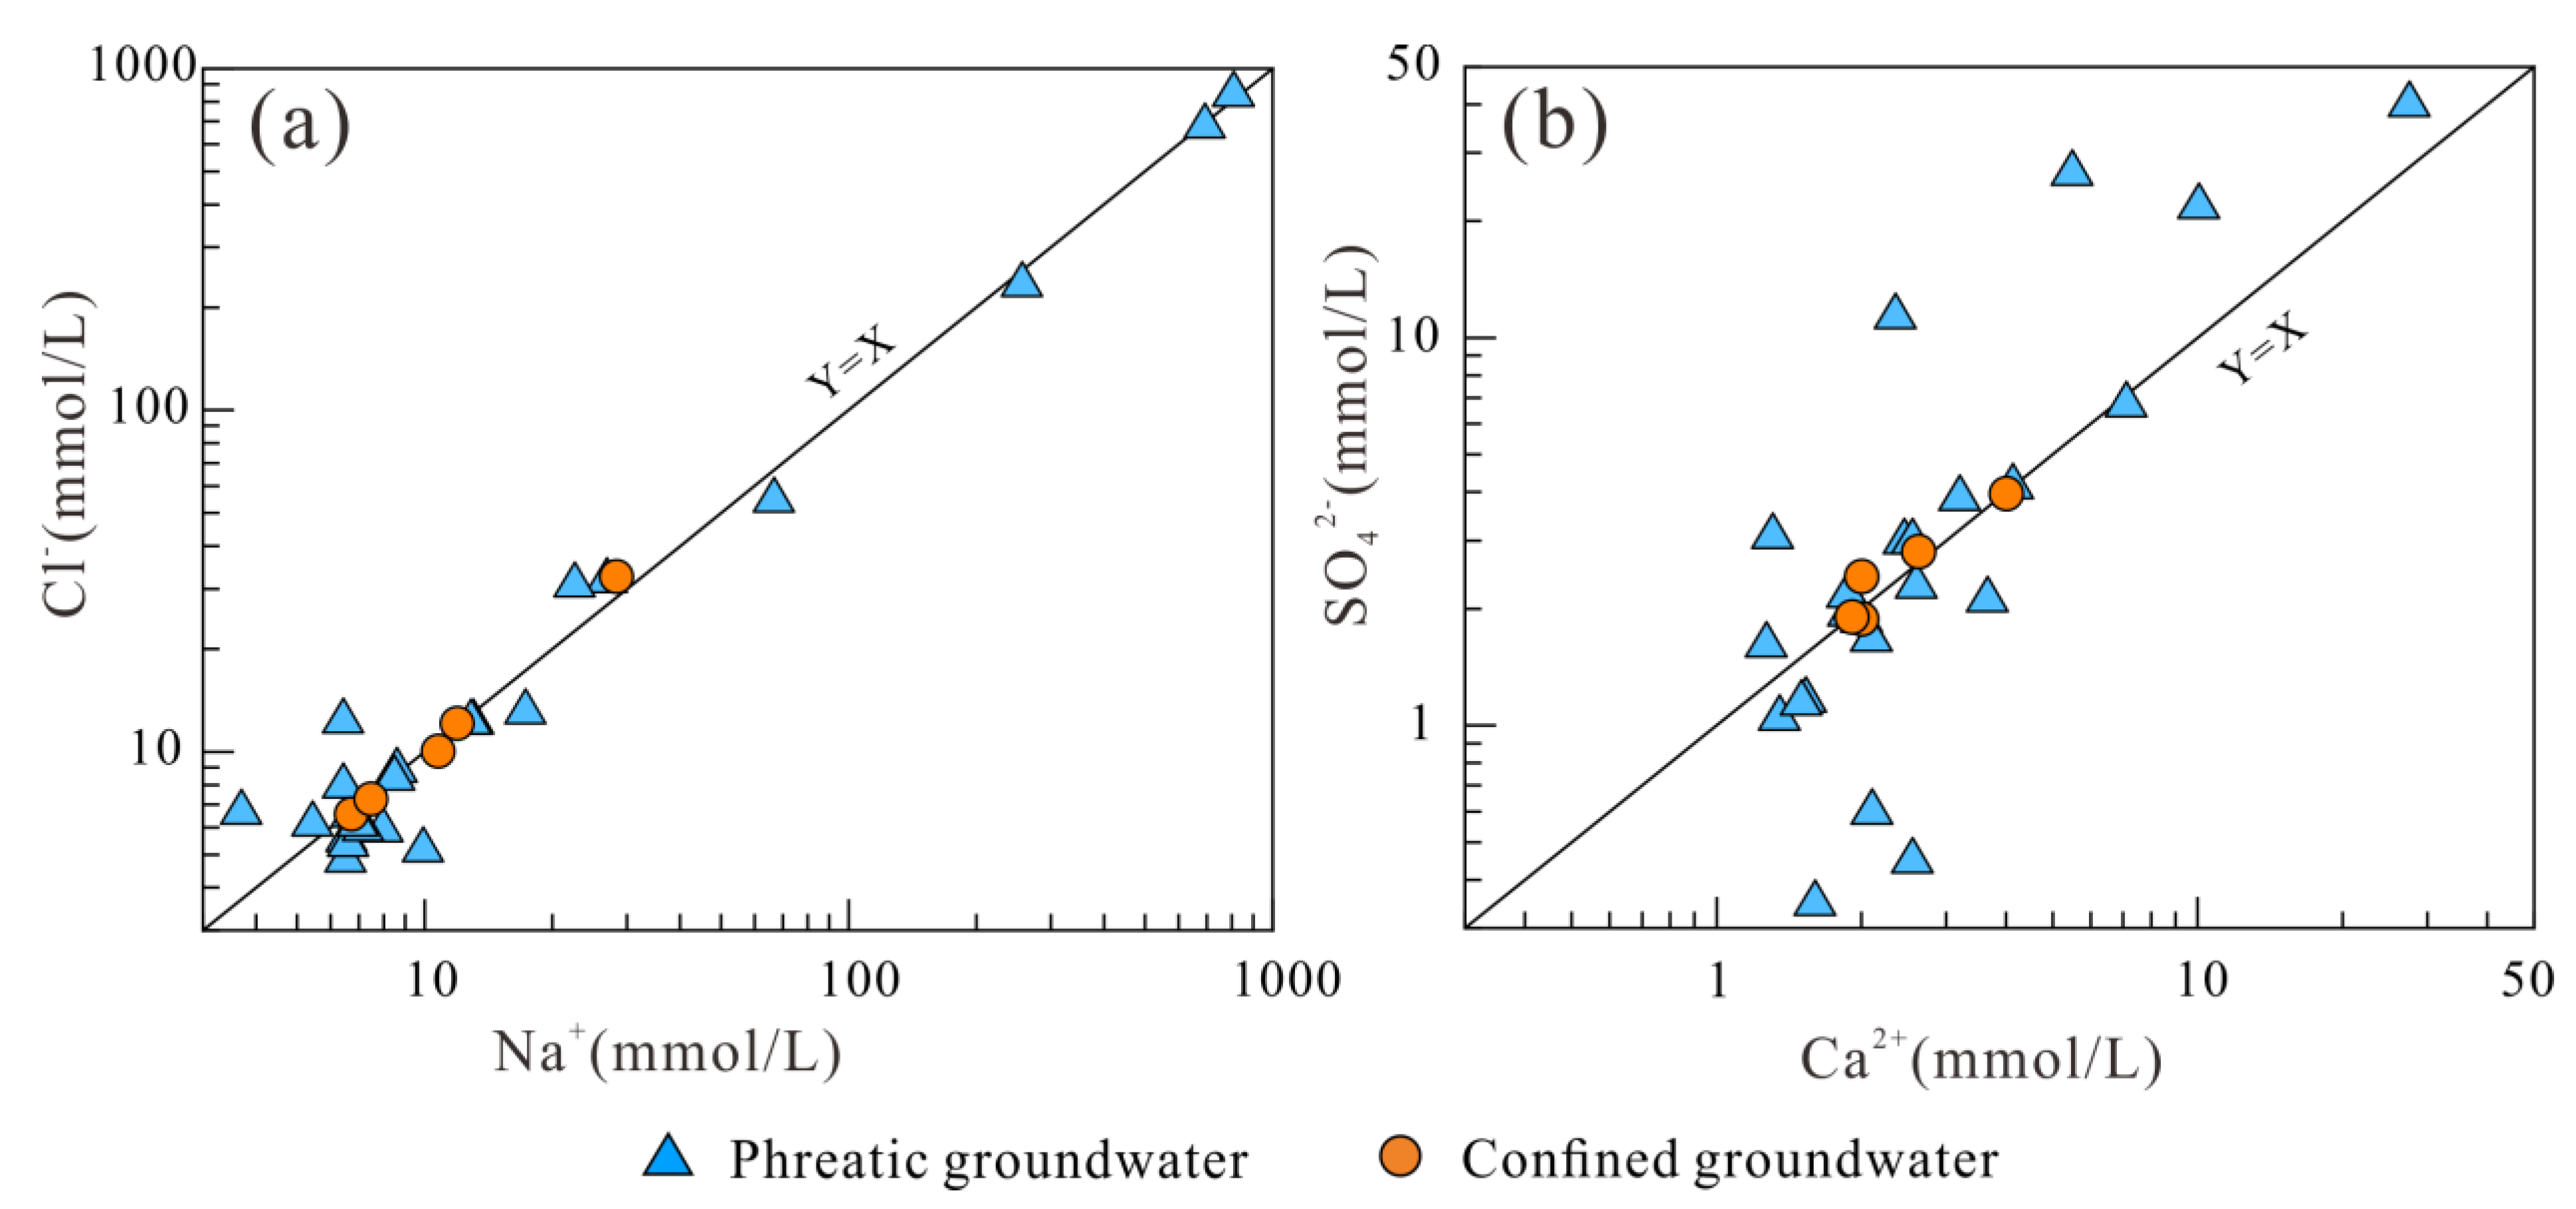
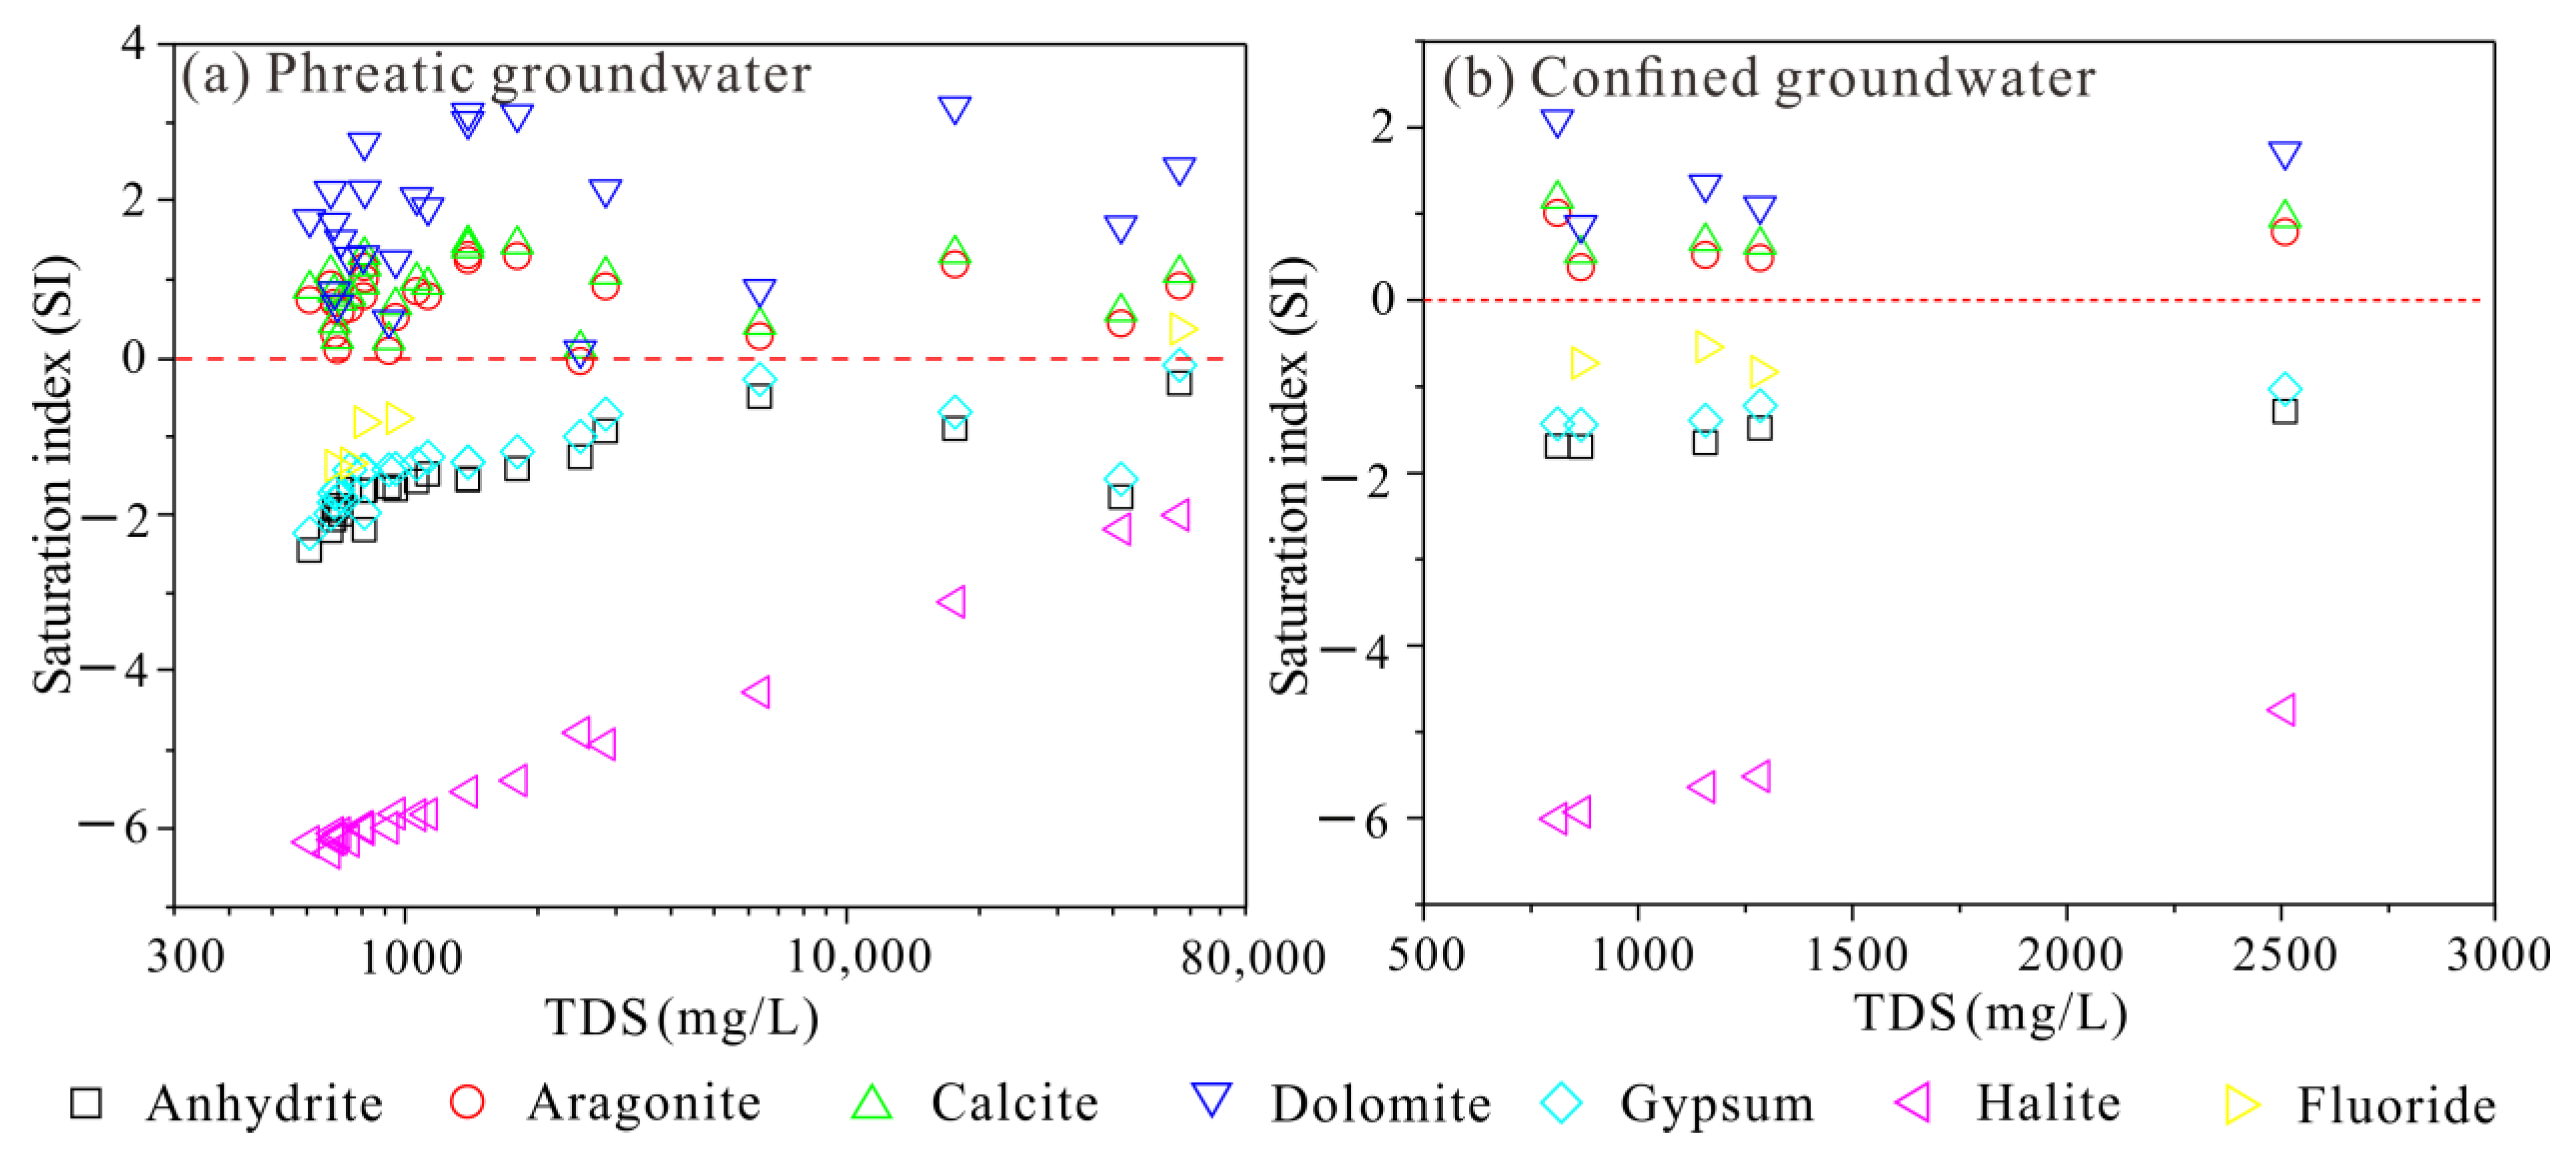
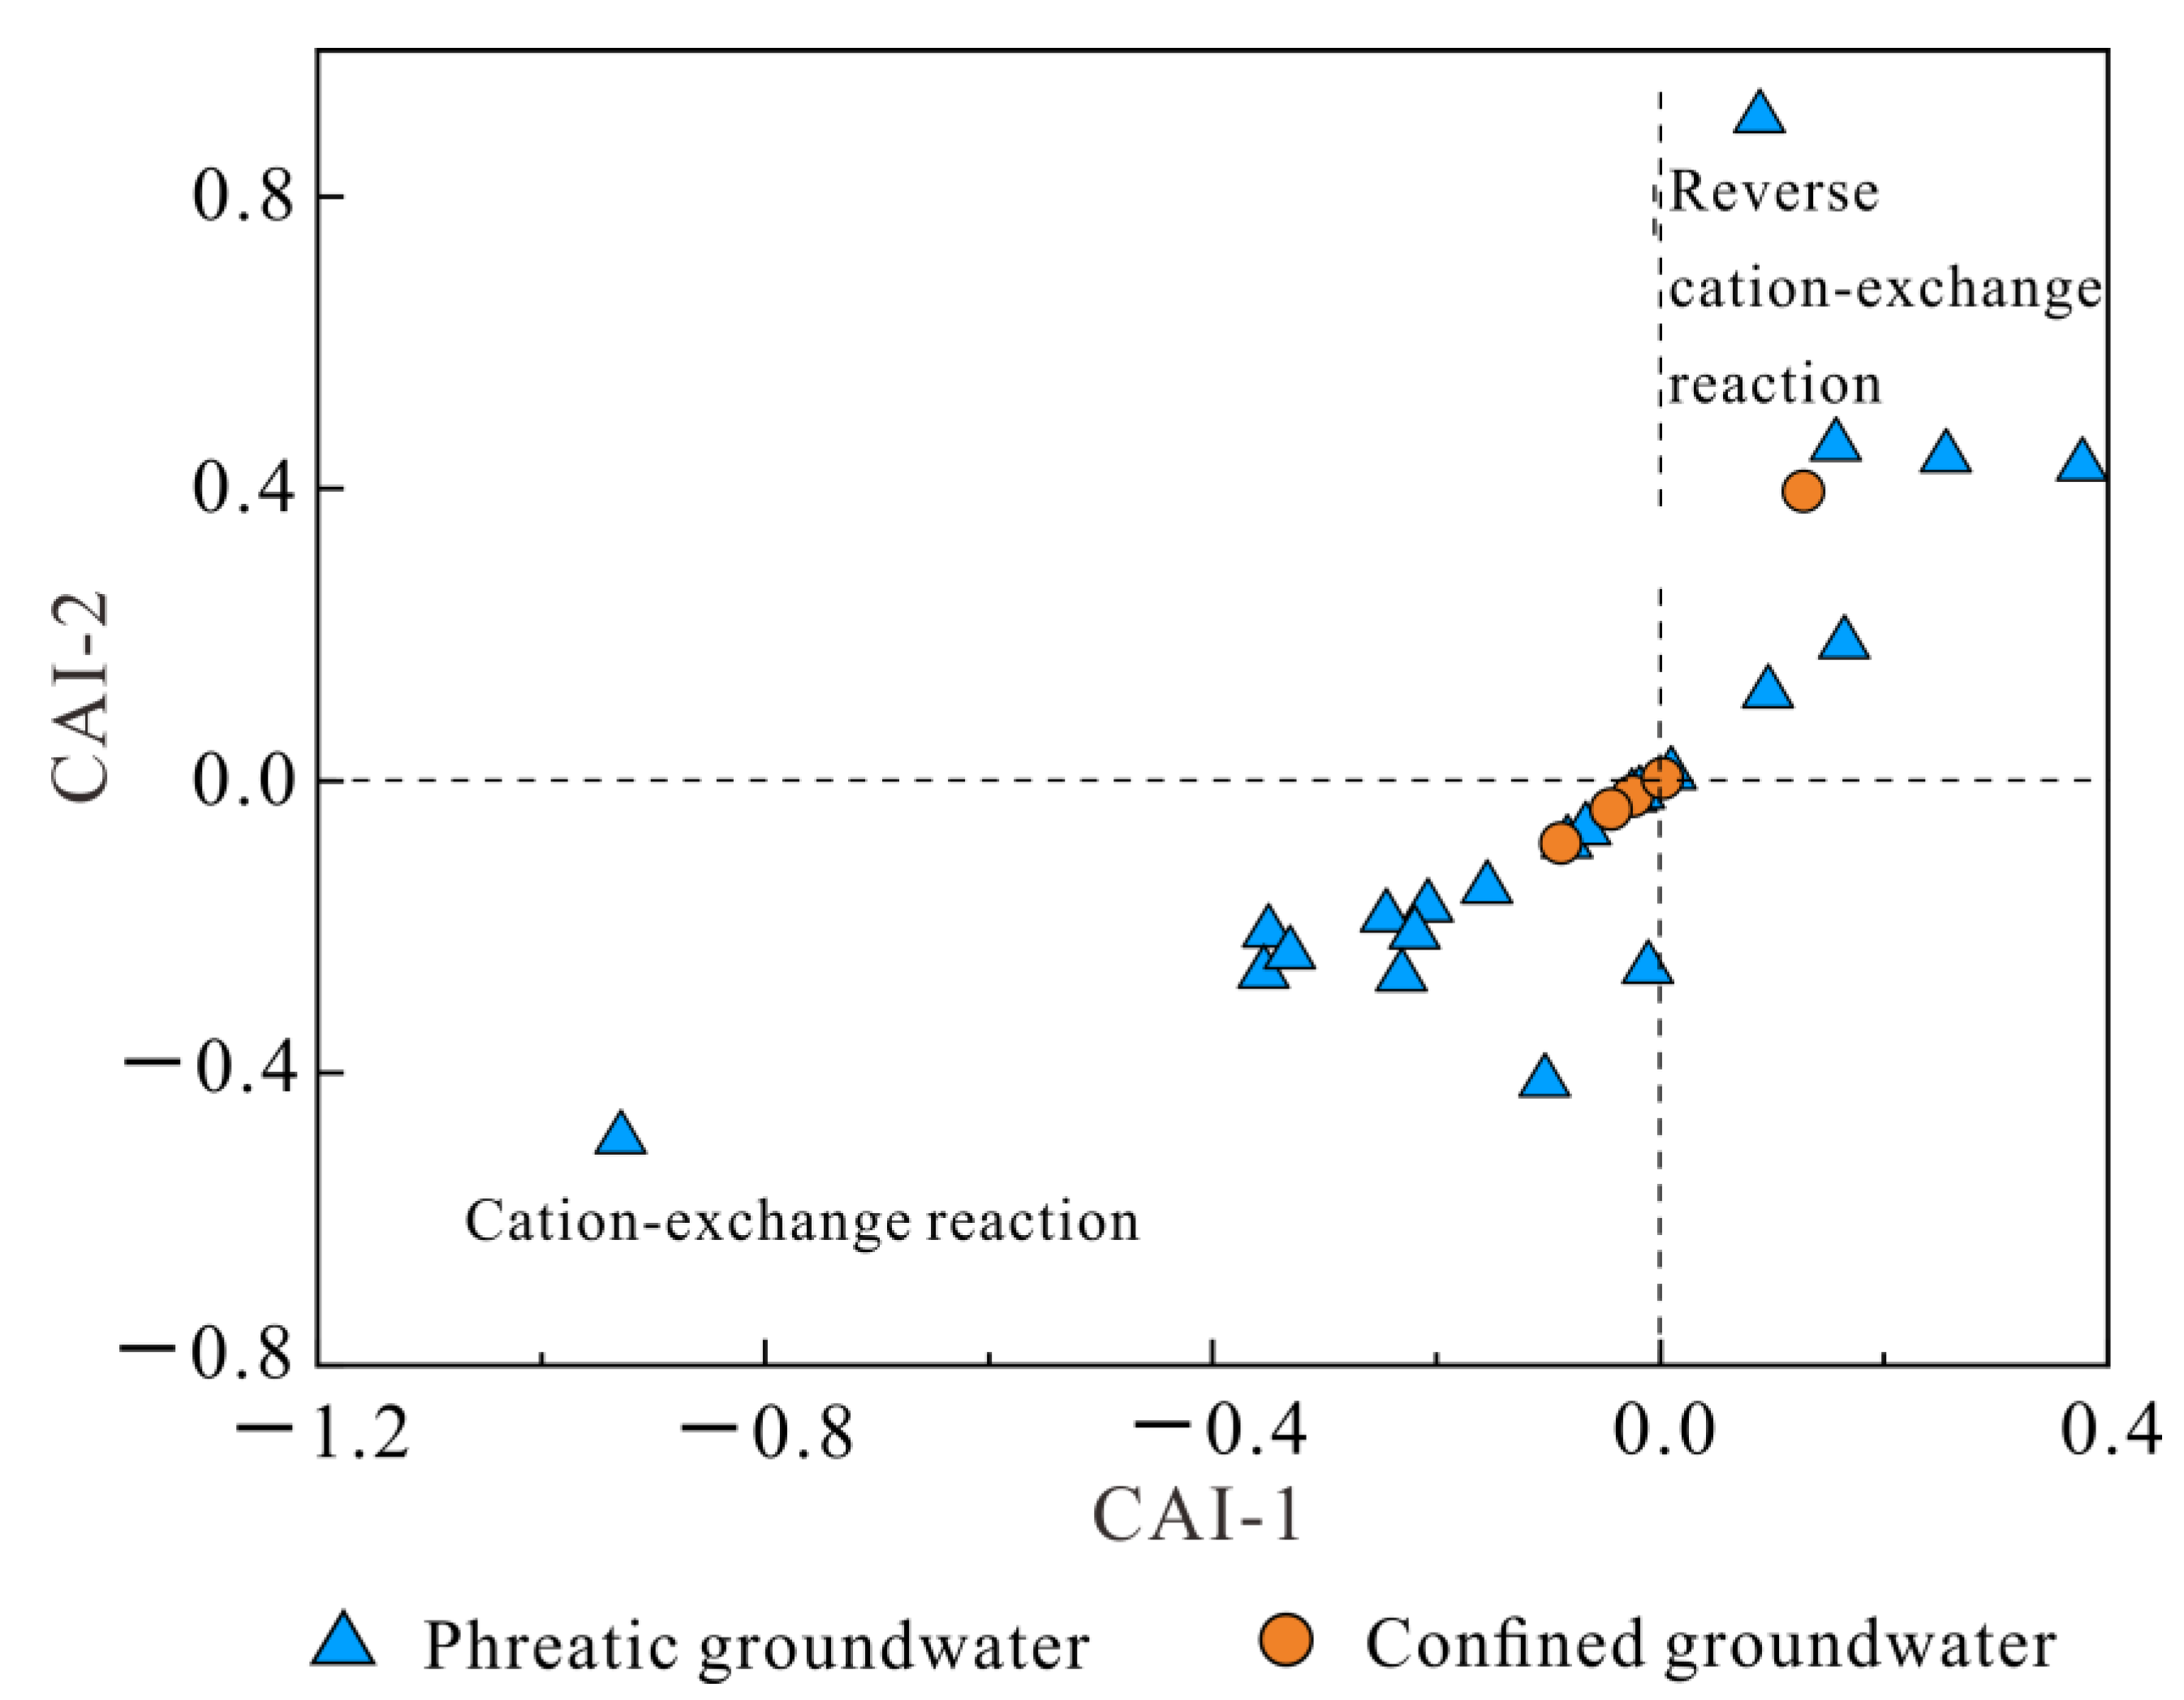
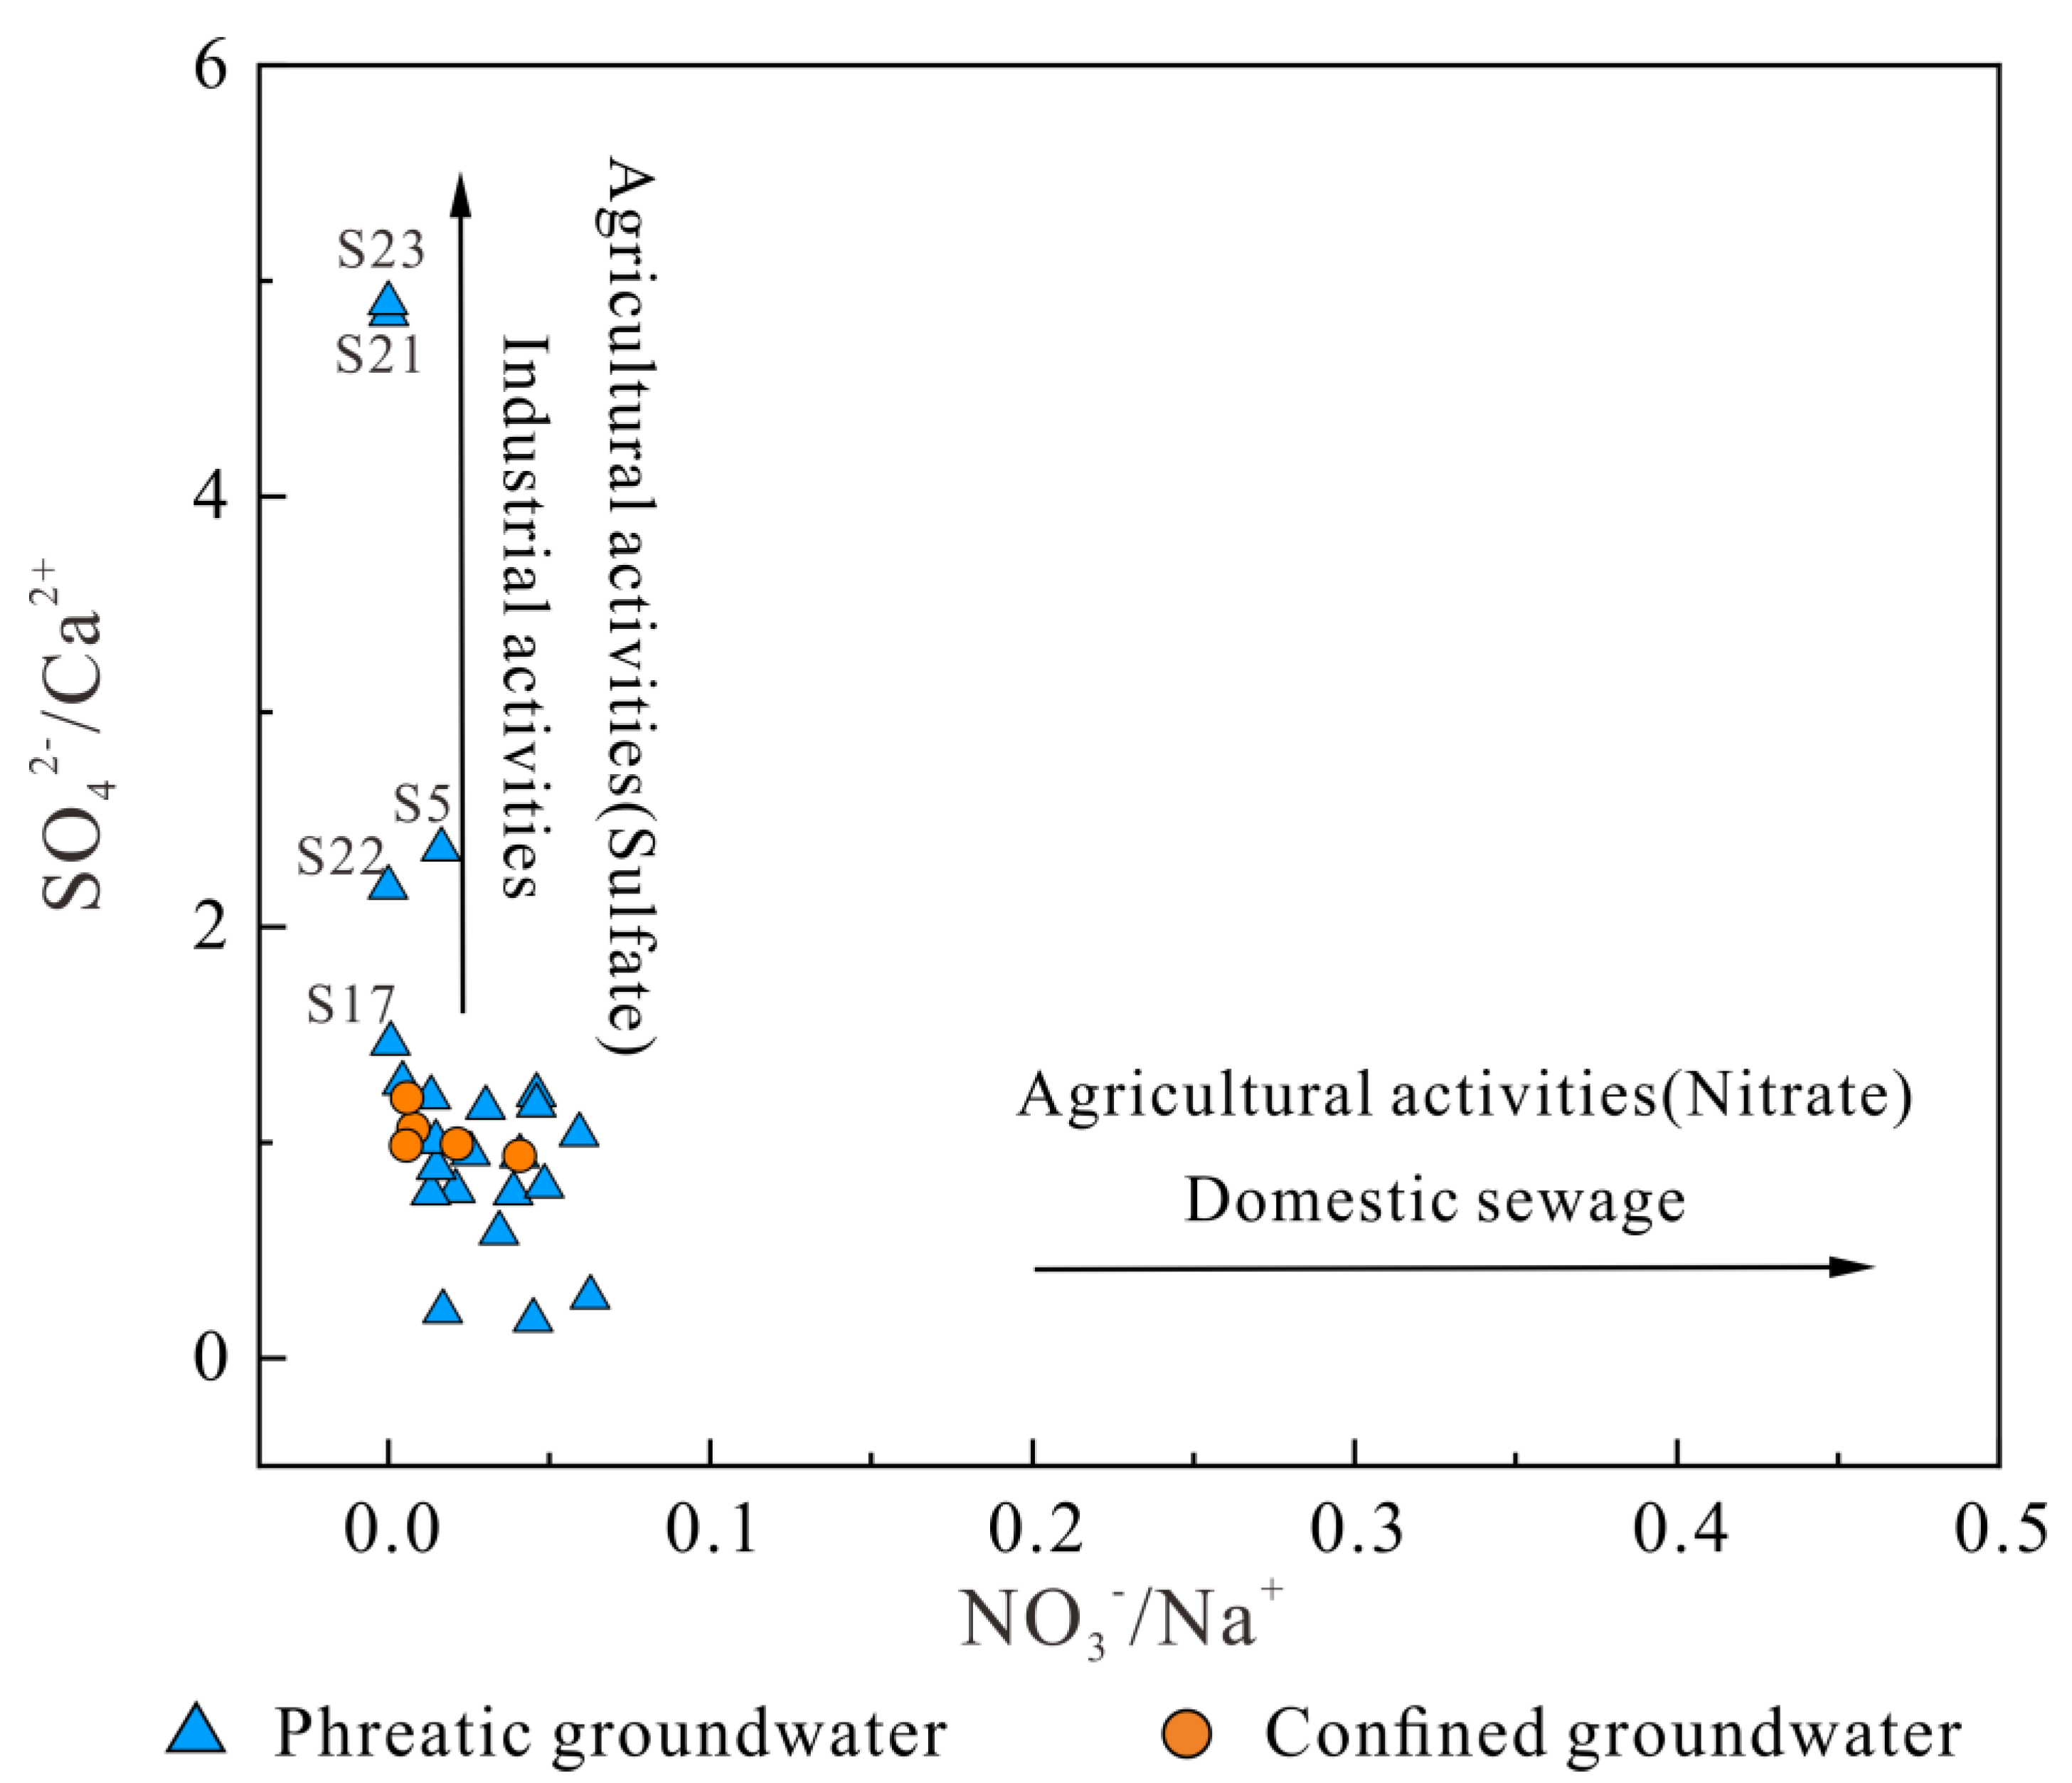
3.3. Hydrogeochemical Mechanisms Governing Groundwater Chemistry

Generally, the solutes in groundwater are mainly originated from natural sources. Principally, the hydrogeochemical composition of groundwater is governed by three natural factors, i.e., precipitation, water–rock interactions and evaporation. These three main natural mechanisms governing groundwater geochemistry can be virtually illustrated by the Gibbs diagrams, which are constructed by the TDS versus Na+/(Na++Ca2+) and Cl/(Cl+HCO3) [58].
As shown in Figure 4, all groundwater samples, regardless of the sampling depth, displayed an evaporative trend in both of the two sub-Gibbs diagrams, implying that recharge water had experienced significant evaporation effects during the recharging process. This is in accordance with hyper-arid climate features in the study area. Specifically, all sampled confined groundwater samples are plotted in the rock dominance of both these two sub-Gibbs diagrams, suggesting that water–rock interactions are the predominant mechanism regulating the hydrogeochemical composition of groundwater in the confined aquifers of the Mo river watershed after the water enters the aquifers. For phreatic groundwater, most of the samples are situated in the rock dominance. This implies that the hydrochemistry of phreatic groundwater in the watershed is also dominantly governed by the water–rock interaction. Some phreatic groundwater samples (S17, S21, S22 and S23) are observed plotting in the evaporation dominance, indicating evaporation is the main process regulating the hydrogeochemical composition of phreatic groundwater in some sites (S17, S21, S22 and S23). In fact, these evaporation-governed samples (S17, S21, S22 and S23) are located in the lower reaches of the Mo river watershed. All of these four groundwater samples are from shallow, buried depths and are easily affected by the strong evaporation in the arid climatic condition of the watershed. As a result of the strong evaporation, the collected phreatic groundwater samples in the lower reaches of the Mo river watershed are with relatively high salinity and a TDS value beyond thousands of milligrams per liter.
As mentioned above, water–rock interactions are the predominant processes regulating the hydrogeochemical composition of both phreatic and confined groundwater samples in the watershed. There are various rocks and minerals existing in nature that are potentially involved in the water–rock interaction processes. In fact, not all of the rocks and minerals in nature would be involved in the interactions. The involved rocks/minerals in a specific aquifer are determined by the existing rocks/minerals and the hydrogeochemical conditions of aquifers along the groundwater flow path. To further illustrate the rocks and minerals involved in the water–rock interactions, the end-member diagrams that are constructed by the Ca2+/Na+ versus Mg2+/Na+ and HCO3/Na+ [59] were introduced in the present research. These end-member diagrams separate into three dominances, i.e., the evaporite, silicate and carbonate dominances, and can be used to virtually identify the main rock types (Figure 5) involved in the water–rock interactions. As shown in Figure 5, all confined groundwater samples and most of the phreatic groundwater samples are located in and around the silicate dominance, indicating that silicate weathering (Equation (1)) is the predominant source of solutes for groundwater regardless of the depth in the Mo river watershed. A small portion of the phreatic groundwater samples was observably situated in and around the evaporite dominance, suggesting that evaporite dissolution is the dominant source for the major ions of phreatic groundwater at some locations. No phreatic or confined groundwater was situated in or around the carbonate dominance, implying carbonate dissolution is not the main process contributing to groundwater chemistry in the watershed.
2 NaAlSi 3 O 8 + 2 CO 2 + 11 H 2 O Al 2 Si 2 O 5 OH 4 + 4 H 4 SiO 4 + 2 Na + + 2 HCO 3
In order to further determine the contribution of specific evaporites and silicates, the correlation matrix and scatter plots are employed in the present research. It can be seen from Figure 6a and Table 2 that a significant positive correlation exists between Cl and Na+ for both phreatic and confined groundwater, with a correlation coefficient of 0.71 and 0.99, respectively. This suggests a high possibility of halite dissolution contributing to the major ions (Cl and Na+) in the hydrogeochemical components of groundwater in phreatic and confined aquifers of the watershed. The mineral saturation status was simulated to confirm the potential contribution of halite dissolution further. As shown in Figure 7, all collected phreatic and confined groundwater samples had a halite saturation index below zero, confirming the contribution of halite dissolution to major ion contents in phreatic and confined aquifers. The SO42− and Ca2+ ions were observed to have a significant positive correlation for both phreatic groundwater samples (with a correlation coefficient of 0.70) and confined groundwater samples (with a correlation coefficient of 0.97) (Figure 6b and Table 2). This implies that the dissolution of gypsum and anhydrite is the potential contribution of SO42− and Ca2+ to phreatic and confined groundwater, as evidenced by the saturation index of gypsum (less than zero) and anhydrite (less than zero) (Figure 6). Significant positive correlations were also found between SO42− and Na+, Mg2+ and K+ for phreatic groundwater, suggesting that the dissolution of other sulfates, including Na2SO4, MgSO4 and K2SO4, could contribute to major ions in the phreatic groundwater if these minerals exist in the aquifers. For confined groundwater, significant positive correlations are also found between SO42−, Na+ and Mg2+, implying the potential contribution of sulfate (Na2SO4 and MgSO4) dissolution. It should be noted that all groundwater samples, regardless of the sampling depth, were observed and plotted along the 1:1 line of Cl/Na+ and SO42−/Ca2+ (Figure 6). This evidenced the aforementioned conclusion that water had experienced evaporation during its recharge process. As discussed in the end-member diagram, only several phreatic groundwater samples (S17, S21 and S23) are located in the evaporite dominance. Thus, although the dissolution of evaporites (halite and sulfates) could contribute solutes to both phreatic and confined groundwater in the whole watershed, they are dominated only in the lower reaches adjacent to the Chaka salt lake.
The mineral saturation status simulation results also presented that the carbonates, including aragonite, calcite and dolomite, were within a saturation index greater than zero in both phreatic and confined aquifers (Figure 7), confirming the conclusion drawn from end-member diagrams that the dissolution of carbonates is not the significant contribution of groundwater solutes in phreatic and confined aquifers of the watershed (Figure 5). The results of the hydrogeochemical simulation showed that all collected confined groundwater samples and almost all phreatic groundwater samples (except one) had a fluoride mineral saturation index below zero (Figure 7), suggesting that the dissolution of fluoride minerals is one of the dominant processes regulating the hydrogeochemical composition of both phreatic and confined groundwater. This is the reason that some collected phreatic and confined groundwater samples are with relatively high fluoride content and even exceed the permissible limit of 1 mg/L (Table 1).
Aside from the silicate weathering and evaporite dissolution, the ion exchanges are usually important processes contributing to groundwater solutes, especially in sedimentary aquifers. The ion processes can be revealed by the chloro-alkaline indices. The chloro-alkaline indices of CAI-1 and CAI-2 can be obtained by Equations (2) and (3). The combination of these two chloro-alkaline indices can be used to reveal the ion exchange processes occurring in aquifers. If these two indices are below zero, then the cation-exchange reaction (Equation (4)) is the dominant reaction occurring in the aquifer. However, if both CAI-1 and CAI-2 are positive, a reverse cation-exchange reaction (Equation (5)) is implied. As shown in Figure 8, most of the phreatic groundwater samples and confined groundwater samples are situated in the left lower dominance of the diagram and with both CAI-1 and CAI-2 below zero, implying that the cation-exchange reaction (Equation (4)) is one of the dominant processes regulating the hydrogeochemical composition of groundwater in phreatic and confined aquifers at most of the sites in the Mo river watershed. In addition, several collected phreatic groundwater samples and one confined groundwater sample had positive CAI-1 and CAI-2 values, suggesting the occurrence of reverse cation-exchange reactions at these sites.
C A I 1 = C l N a + + K + C l
C A I 2 = C l N a + + K + S O 4 2 + C O 3 2 + H C O 3 + N O 3
Ca 2 +   or   Mg 2 + + 2 NaX   solids 2 Na + + CaX 2   or   MgX 2   solids
2 Na + + CaX 2   or   MgX 2   solids Ca 2 +   or   Mg 2 + + 2 NaX   solids
Apart from natural sources, groundwater hydrochemical solutes can be originated from anthropogenic sources, such as domestic effluents, industrial sewages and agricultural fertilizers. NO3 is one of the most common indicators of groundwater solutes in human societies. Generally, the geological limit of NO3 in nature is within 10 mg/L. Any water with a NO3 concentration beyond this limit is regarded as anthropogenic pollution. As presented in Table 1, both phreatic and confined groundwaters were found with a NO3 concentration exceeding this geological limit at some sites, indicating that the anthropogenic inputs contribute some chemicals to both phreatic and confined aquifers. Additionally, the maximum NO3 concentration in phreatic aquifers (37.3 mg/L) was higher than that in confined aquifers (16.00 mg/L). This vertical distribution trend of NO3 concentrations also confirmed the external inputs of chemicals into phreatic and confined aquifers.
To further illustrate the specific anthropogenic factors influencing groundwater chemistry, the relationship between the molar ratios of NO3/Na+ and SO42−/Ca2+ was determined. As shown in Figure 9, no phreatic and confined groundwater is plotted in the lower right dominance region of the diagram, indicating that the groundwater in the watershed is out of the significant influence of domestic sewage and agricultural nitrogen fertilizers. Some phreatic groundwater samples are situated in the upper left dominance of the diagram, implying the potential influence of industrial wastes or agricultural sulfate fertilizers. The land use and cover showed there are no industrial areas but agricultural lands and human settlements in the watershed. Thus, the agricultural application of sulfate fertilizers rather than nitrite fertilizers in the middle reaches of the watershed is an important source of chemicals in groundwater. This was evidenced by the correlation matrix, in which TDS showed no significant relation with NO3 but SO42− (Table 2).

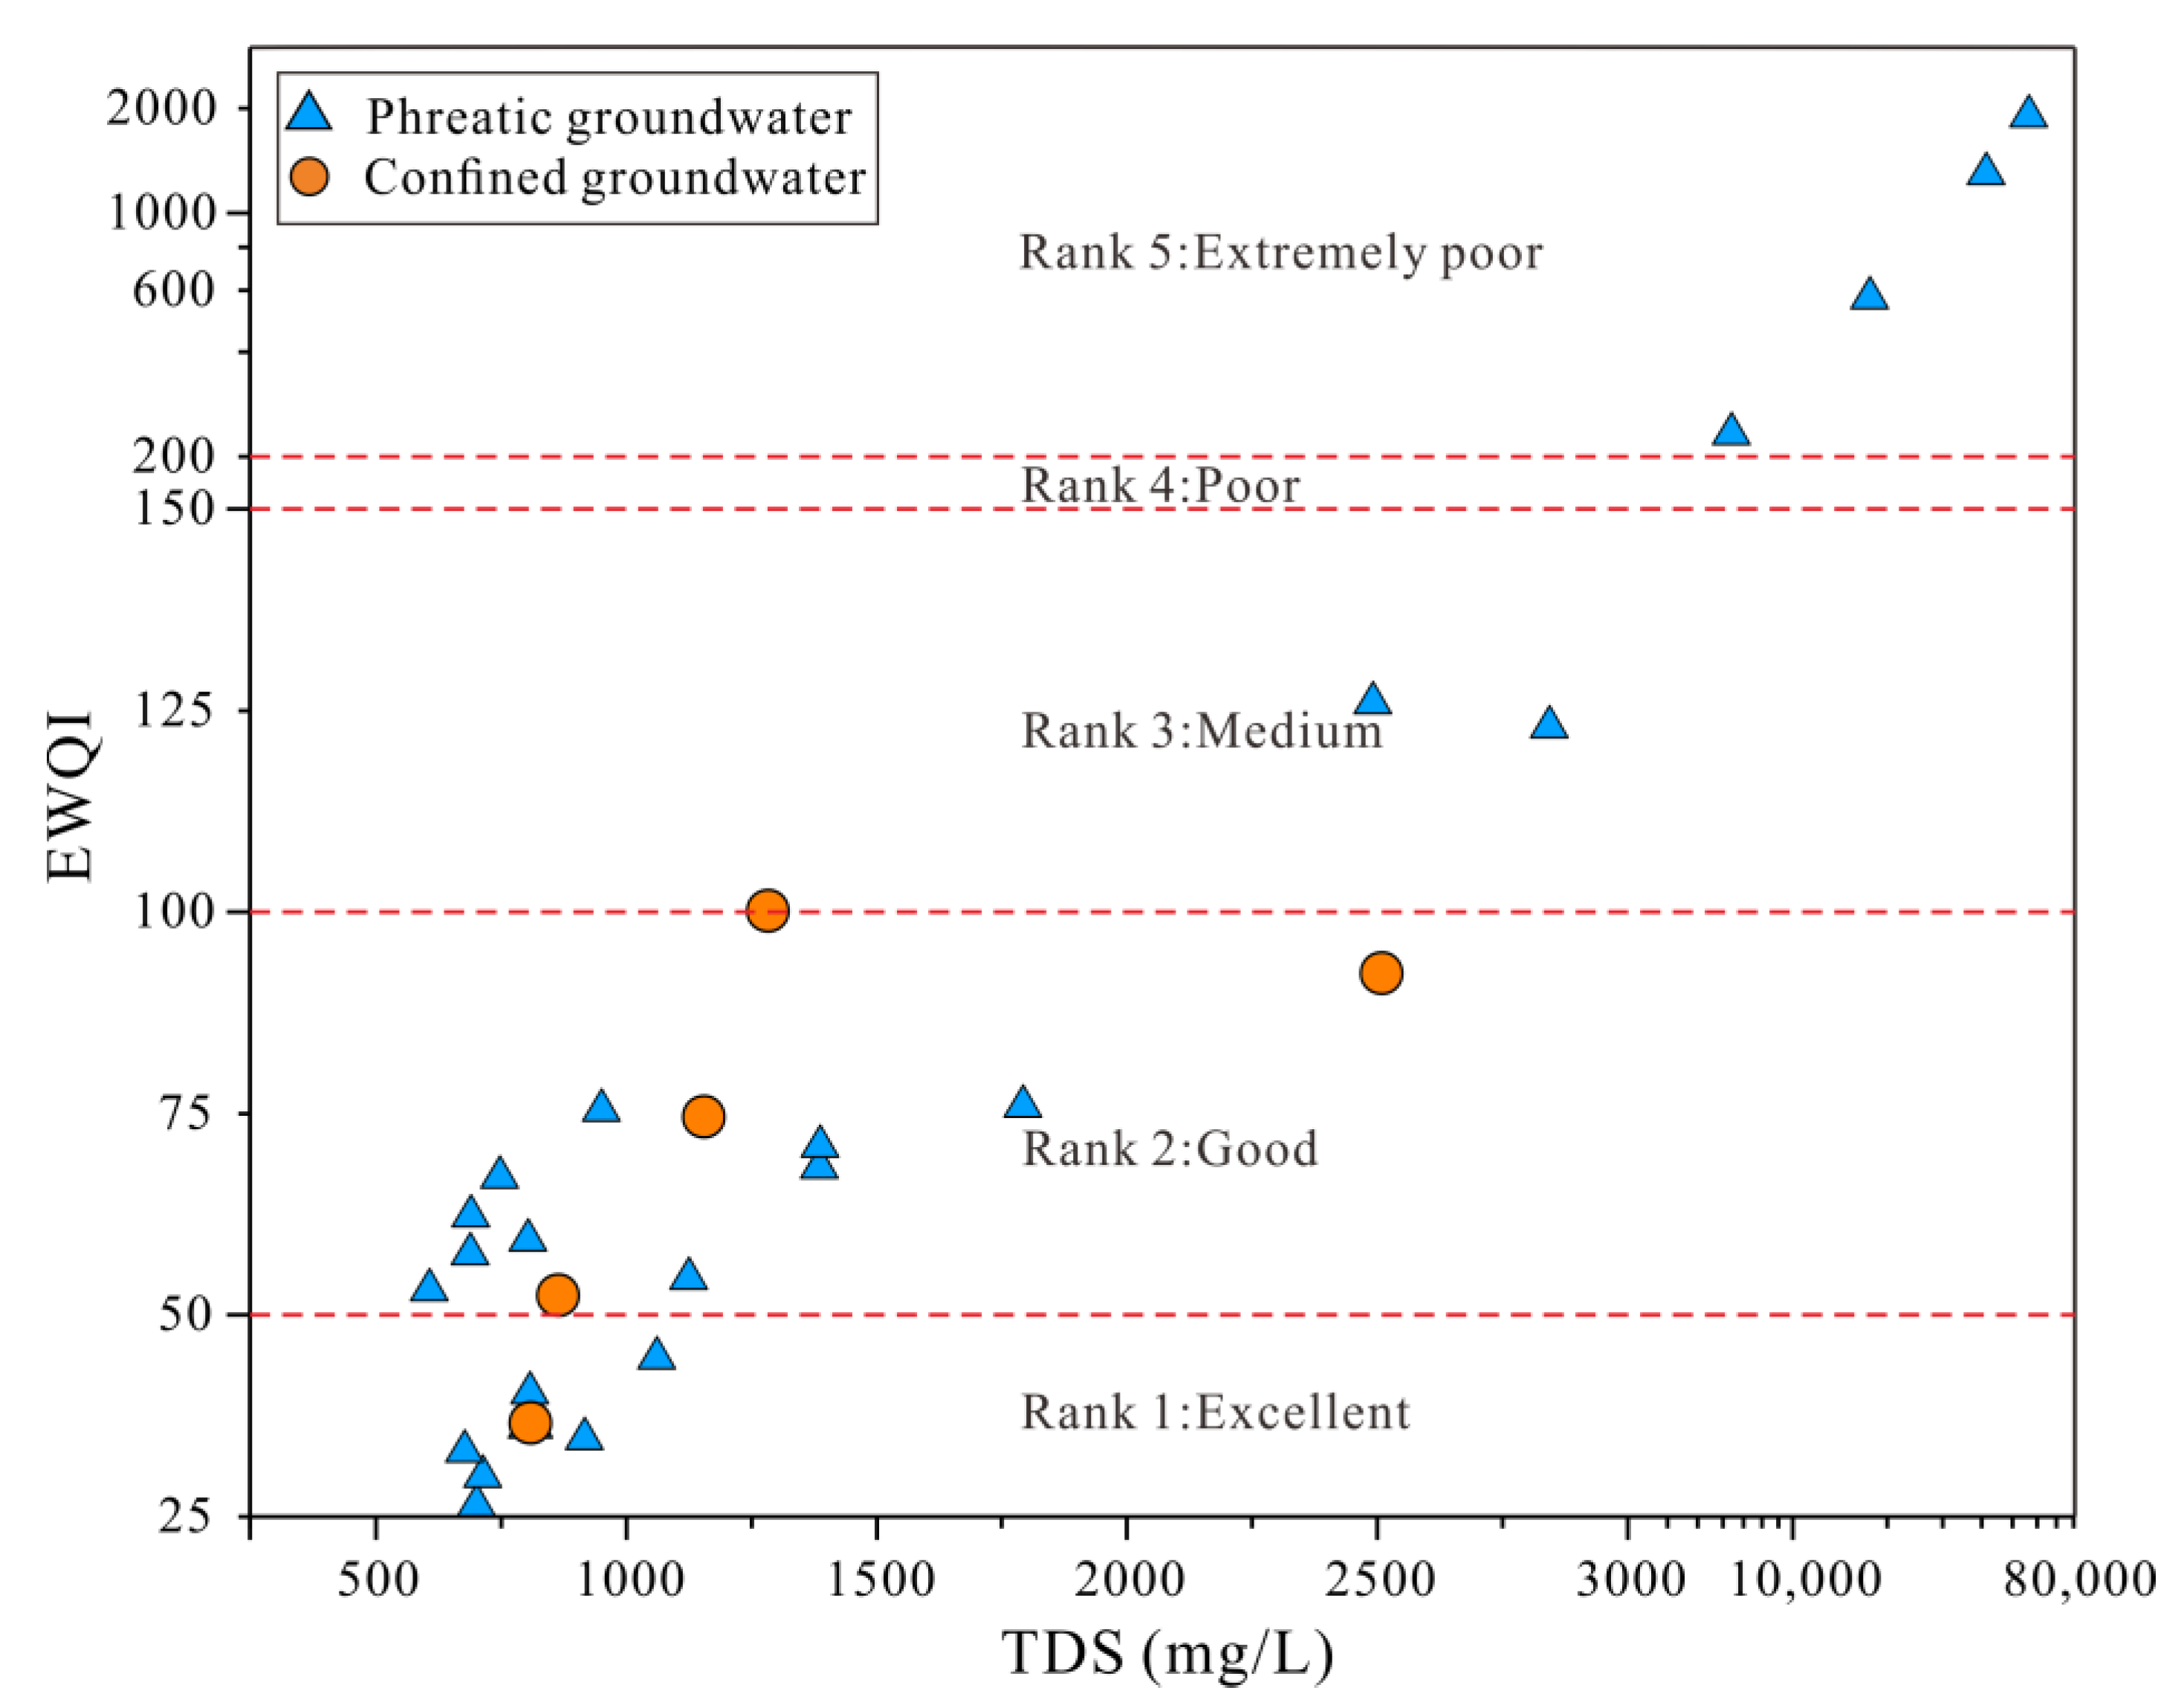
3.4. Groundwater Quality Assessment

3.4.1. Drinking Purposes

Groundwater is the only water resource for domestic usage in the study area due to the shortage of precipitation and surface water. Understanding the quality and suitability of groundwater for domestic purposes is essential for the residents’ health and sustainable development of the study area. The quality of groundwater for domestic usage can be comprehensively revealed by the Entropy-weighted water quality index (EWQI) approach. The EWQI is an improved water quality assessment method based on the water quality index (WQI). It avoids the subjective issues in the assignment of hydrogeochemical parameters’ weights involved in the assessment. Entropy weight is introduced to replace the empirical weight in the water quality assessment. The Entropy weight can avoid the loss of valuable information on water hydrochemistry during the groundwater quality appraisal. As a result, much more accurate results can be obtained by the EWQI than the traditional WQI. The procedure of the EWQI assessment can be conducted according to the following Equations (6)–(12) [60,61]. All of the hydrogeochemical parameters listed in Table 1 were considered in the EWQI assessment for the present research. The permissible quality of drinking water recommended by the WHO [55] and Chinese guidelines [54] is listed in Table 1.
Y = y 11 y 12 y 1 n y 21 y 22 y 2 n y m 1 y m 2 y m n
y i j = x i j ( x i j ) min ( x i j ) max ( x i j ) min
w j = 1 e j i = 1 n ( 1 e j )
e j = 1 ln m i = 1 m ( P i j × ln P i j )
P i j = y i j i m y i j
q j = C j S j × 100
E W Q I = j = 1 m ( w j × q j )
where xij represents the value of the sample i’s jth hydrogeochemical parameter. (xij)min and (xij)max are the minimum and maximum values of the jth hydrogeochemical parameter, respectively.
The EWQI assessment results of the collected phreatic and confined groundwater samples are presented in Figure 10. It can be seen that the EWQI values of groundwater, especially in confined aquifers, had a relatively wide range and varied from less than 30 to more than 1000. This indicates that groundwater in the Mo river watershed has a large variation in groundwater quality. Specifically, the collected confined groundwater samples had relatively low EWQI values. All of the EWQI values of the confined groundwater samples were below 100. According to the water quality classification based on EWQI values, water quality can be classified into five categories, i.e., excellent quality (EWQI ≤ 50), good quality (50 < EWQI ≤ 100), medium quality (100 < EWQI ≤ 150), poor quality (150 < EWQI ≤ 200) and extremely poor quality (> 200). Thus, the collected confined groundwater samples are within qualities ranging from excellent to good and suitable for drinking purposes. For phreatic groundwater, about 73.91% of samples were within an EWQI value below 100, suggesting excellent to good water quality. Two phreatic groundwater samples (accounting for 8.70%) were observed situating in the medium quality category with an EWQI in the range of 100–150, indicating suitable domestic usage but not for direct drinking. Four phreatic groundwater samples (accounting for 17.39%) had an EWQI value exceeding 200 and belonged to the extremely poor groundwater category.
The distributions of groundwater quality in various aquifers are presented in Figure 11. As shown in Figure 11a, most of the collected phreatic groundwater samples in the watershed are of excellent or good quality. It can be seen that the phreatic groundwater of relatively good quality is dominantly distributed in the middle-upper reaches of the watershed. The two medium-quality groundwater samples are located on the southwestern margin of the basin and the Chaka farm. All of the extremely poor-quality phreatic groundwater samples are situated in the lower parts of the watershed and adjacent to the Chaka salt lake. The phreatic groundwater samples that presented a worse quality trend are in the upper to lower reaches of the watershed. All of the medium and extremely poor -quality phreatic groundwater samples are featured with high salinity. The relatively poor quality of phreatic groundwater in the watershed is ascribed to the high salinity rather than the high concentration of potentially toxic elements. Although the middle-lower reaches have worse groundwater quality than the upper reach, all collected confined groundwater samples are of excellent or good quality based on the EWQI values (all less than 100) (Figure 11b). Overall, the confined groundwater at all sampling sites and the phreatic groundwater in the middle-upper reaches of the watershed are of relatively good water quality and are suitable for various domestic usages. Contrastingly, phreatic groundwater in the lower reaches adjacent to the salt lake is not suitable for domestic purposes due to the high salinity.

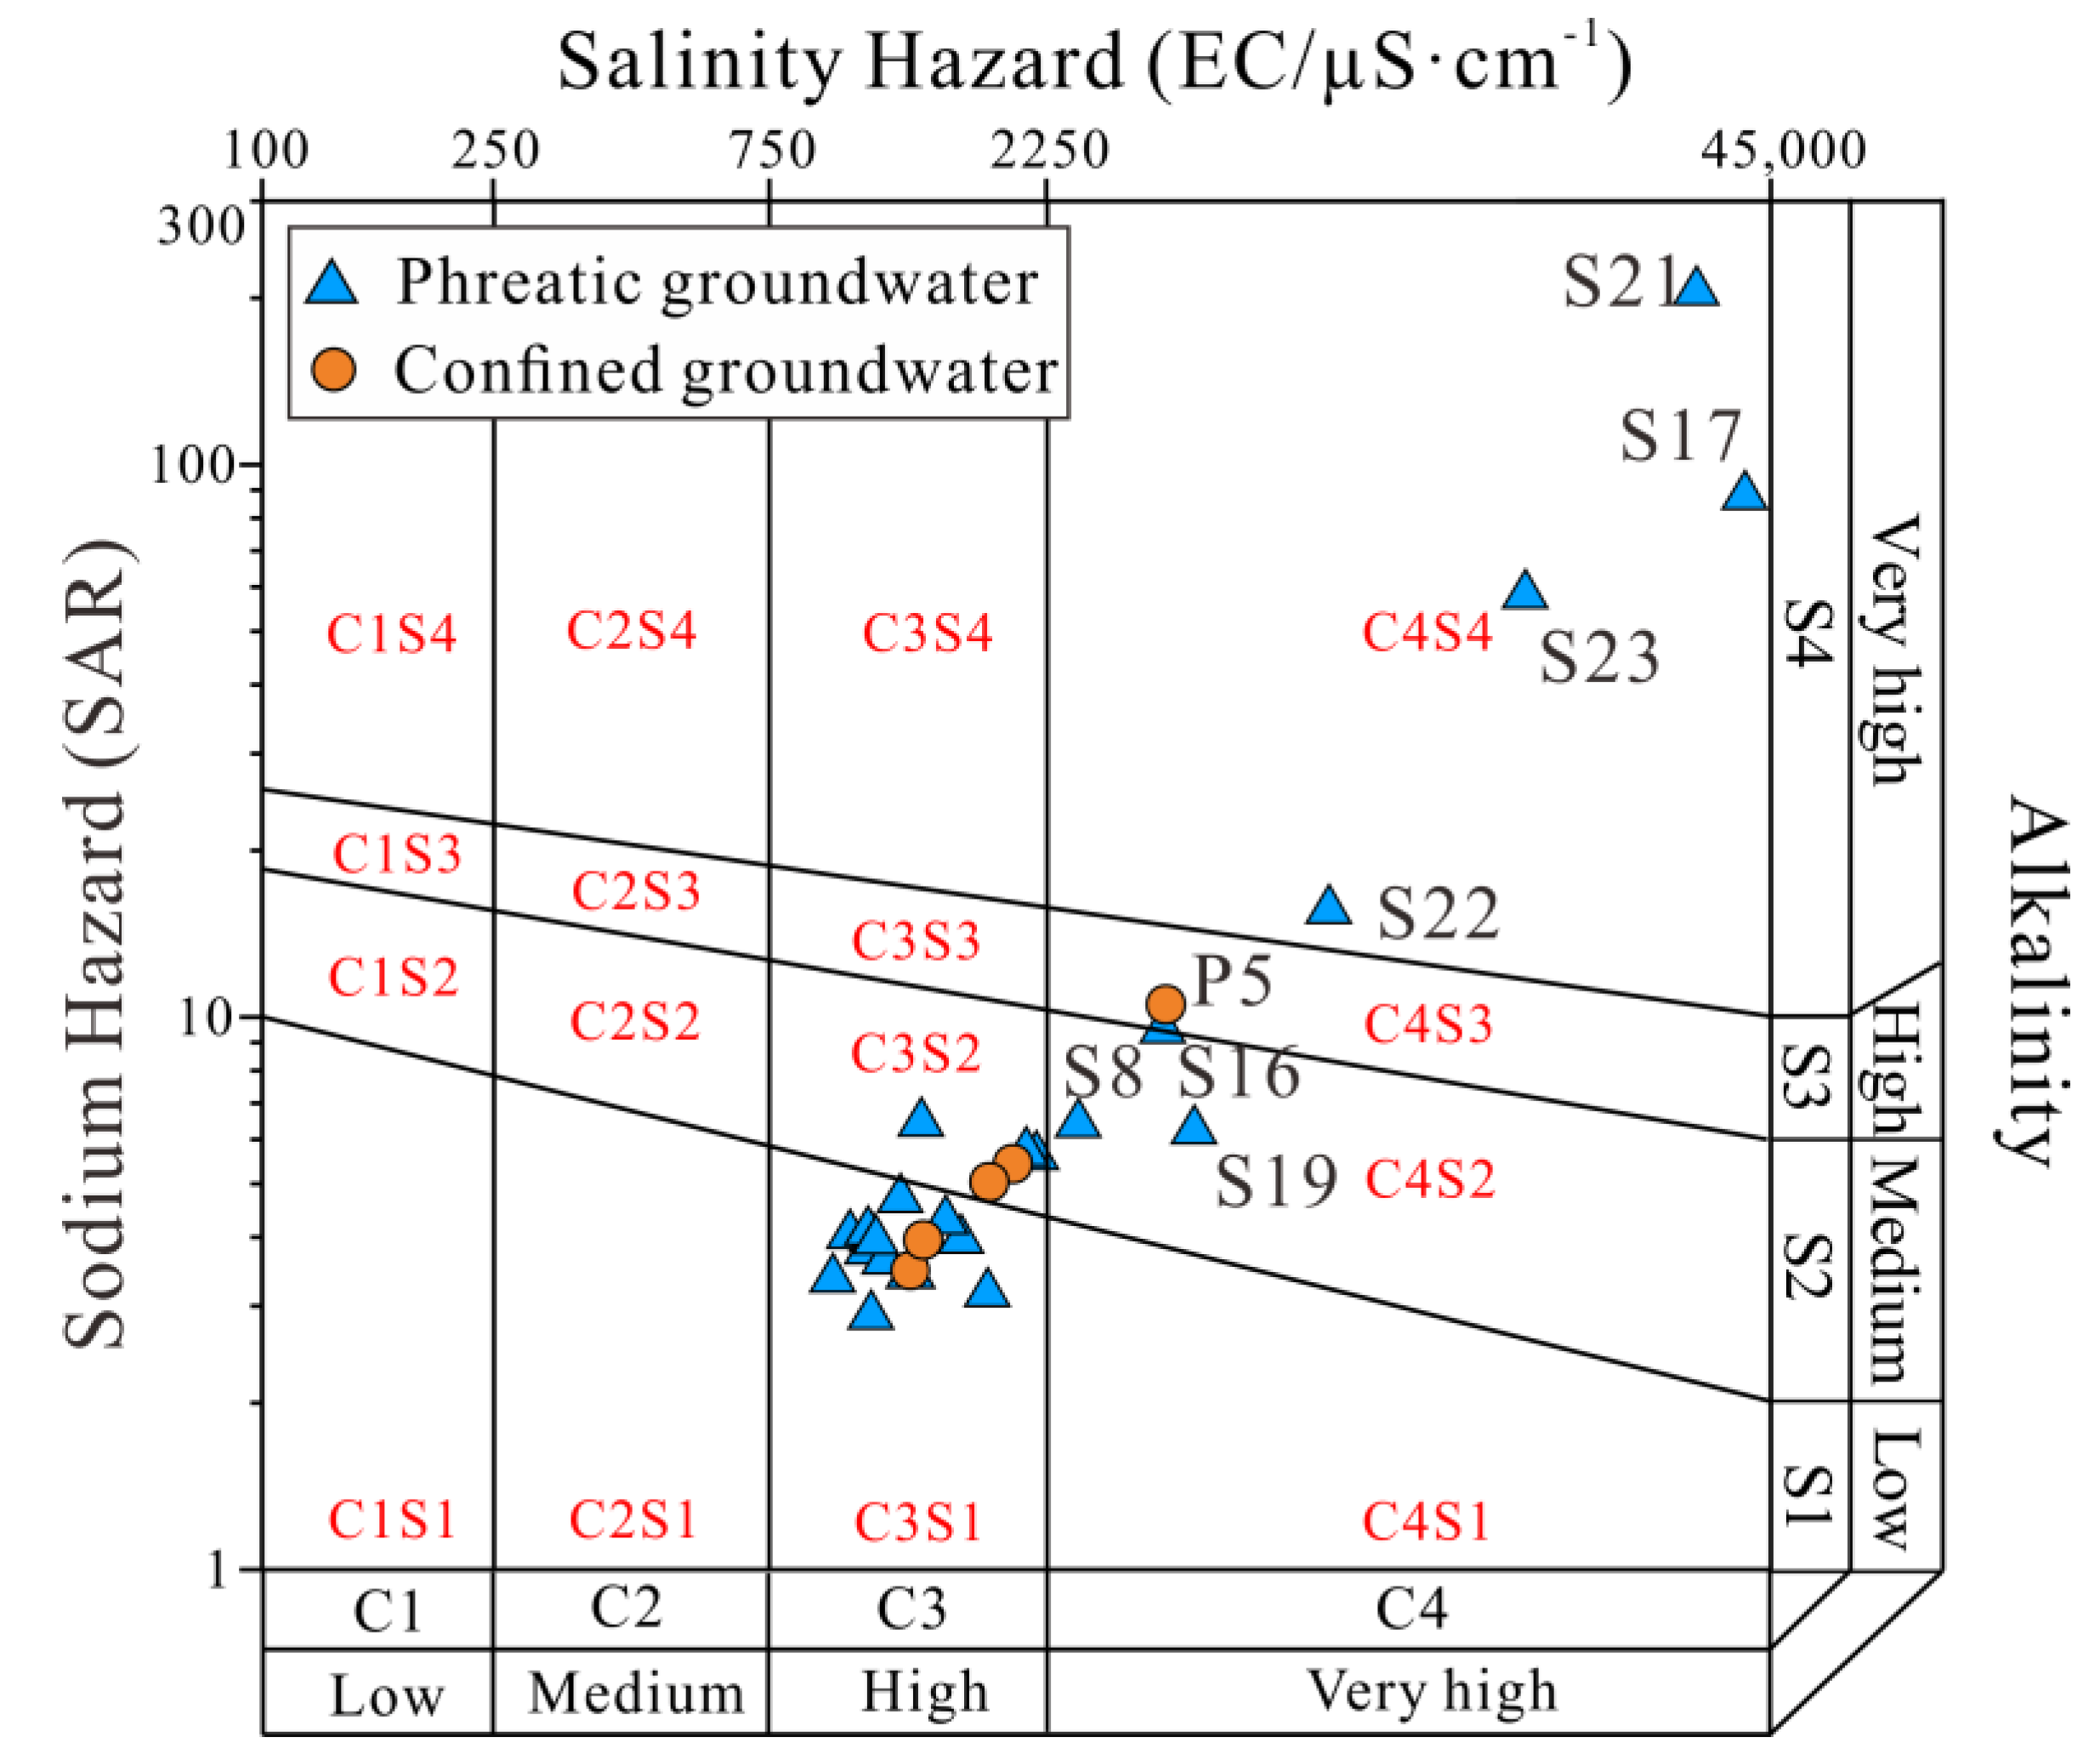
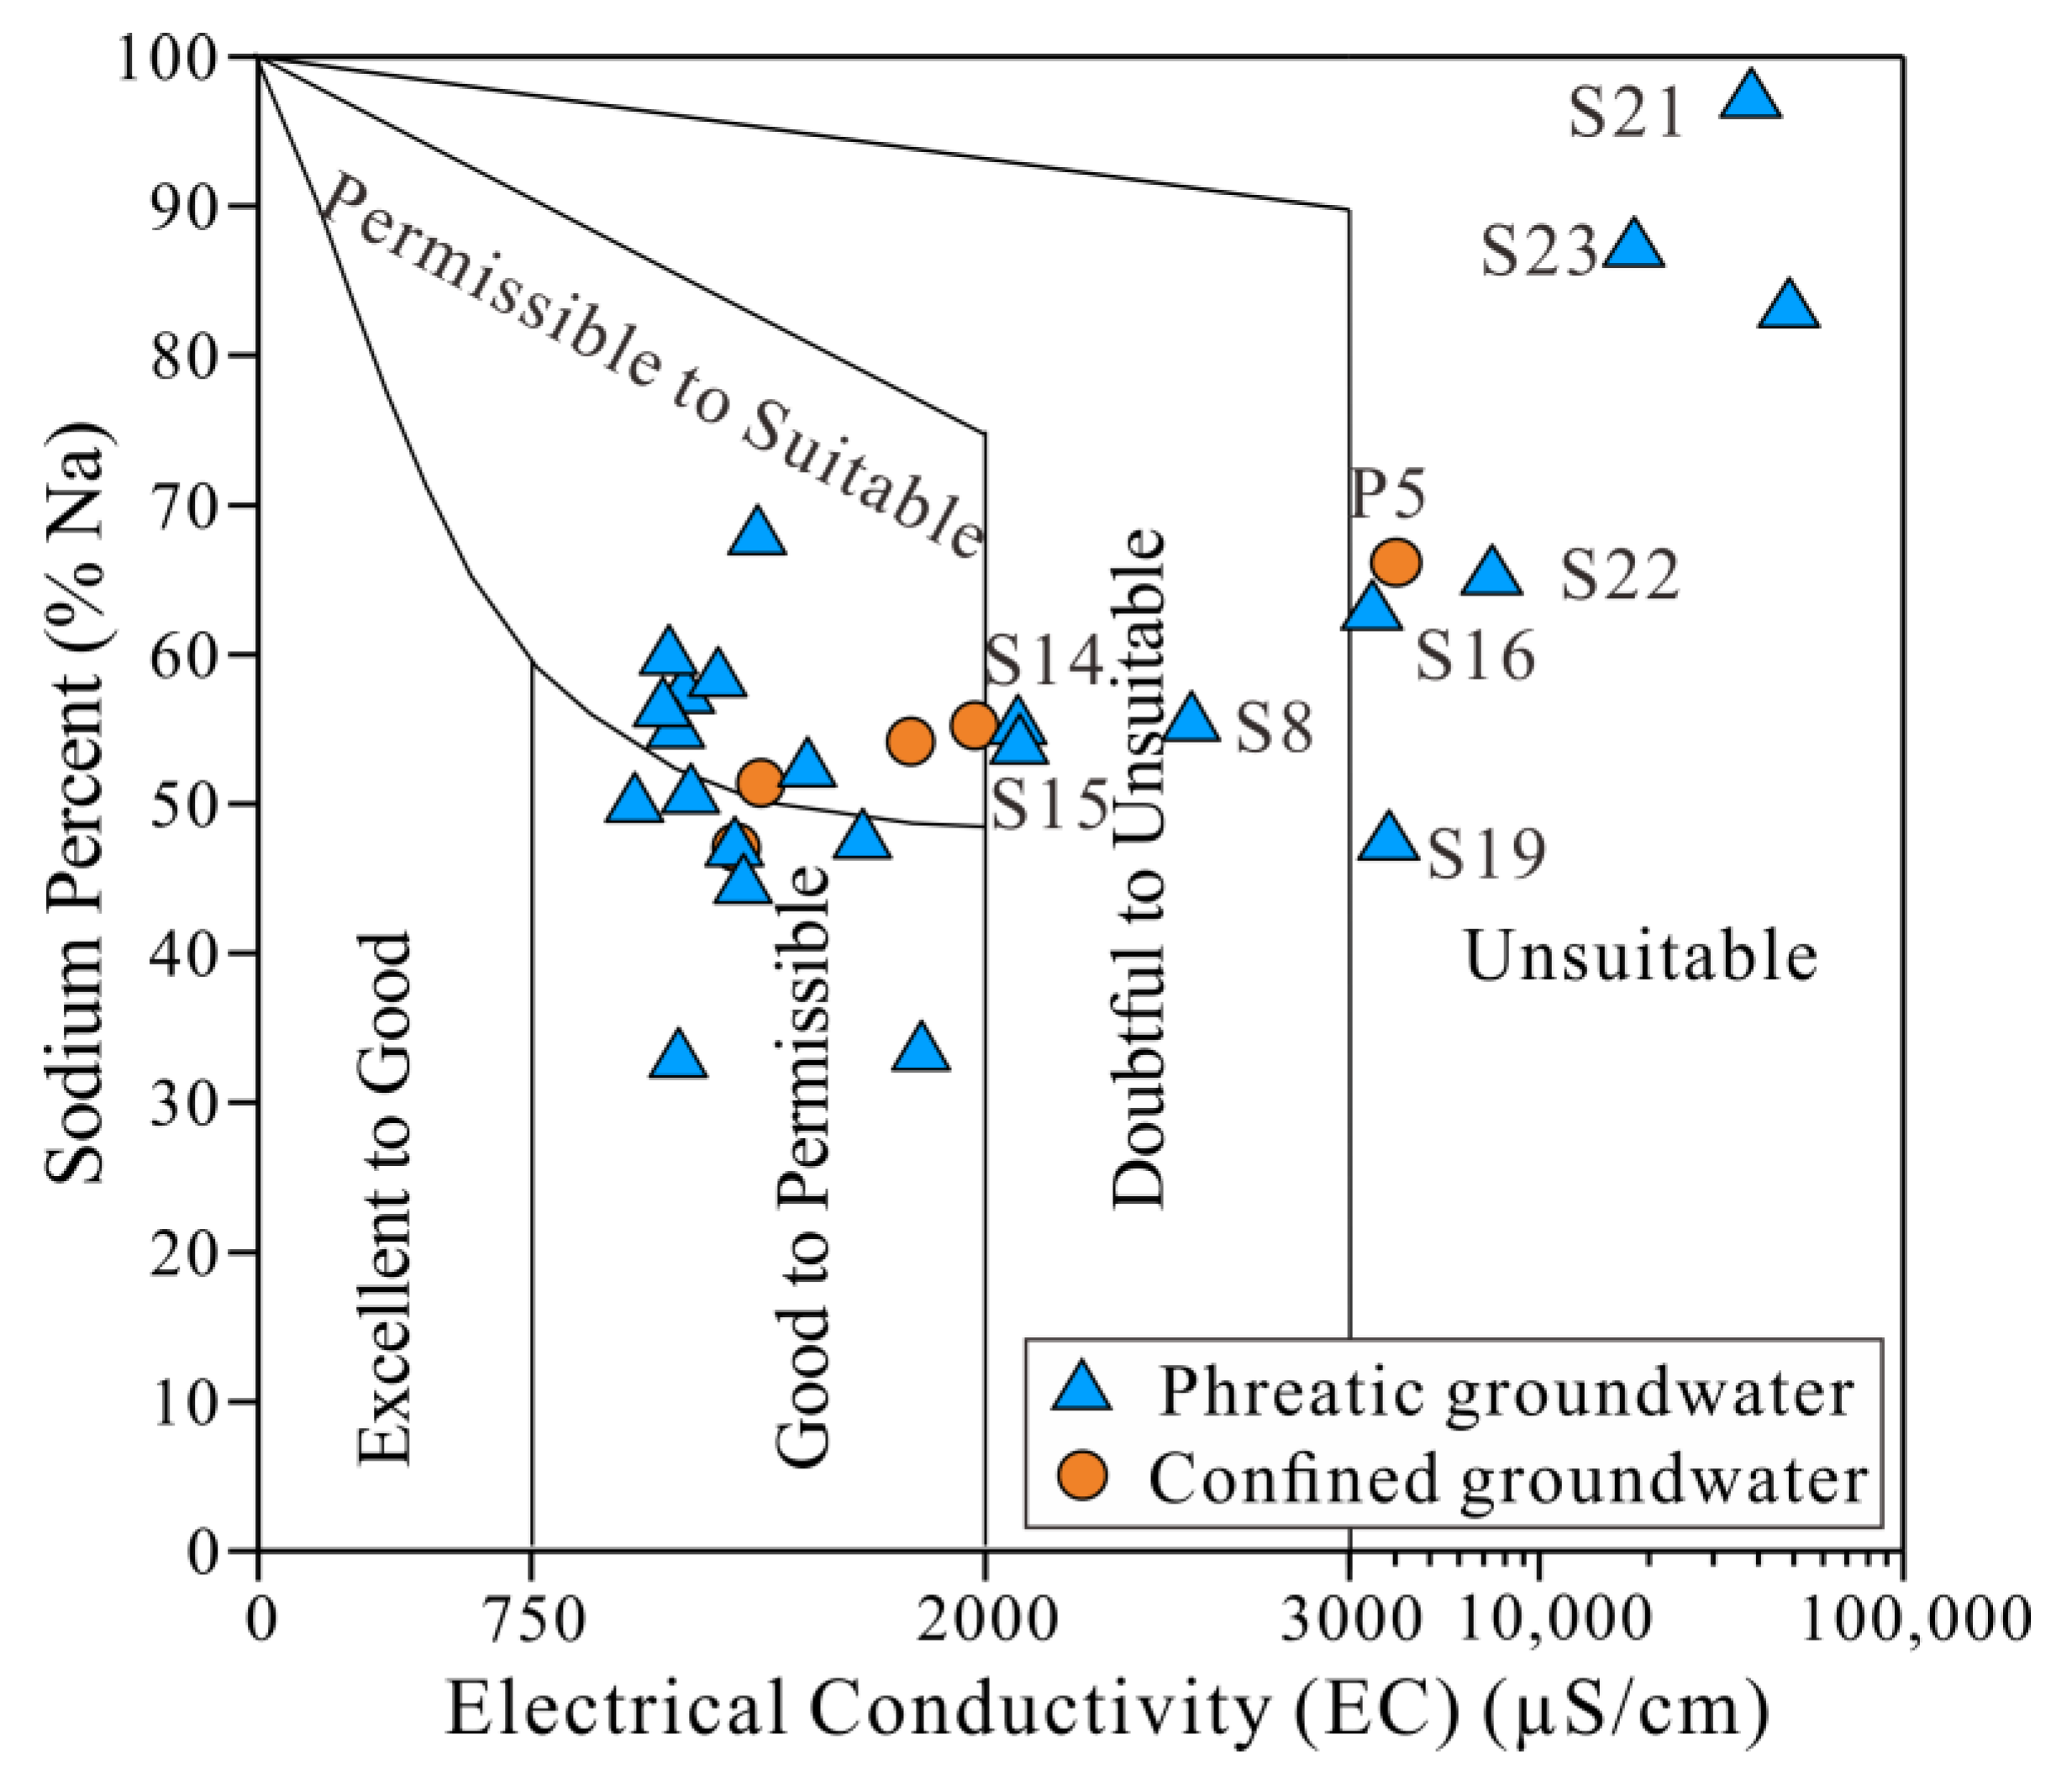
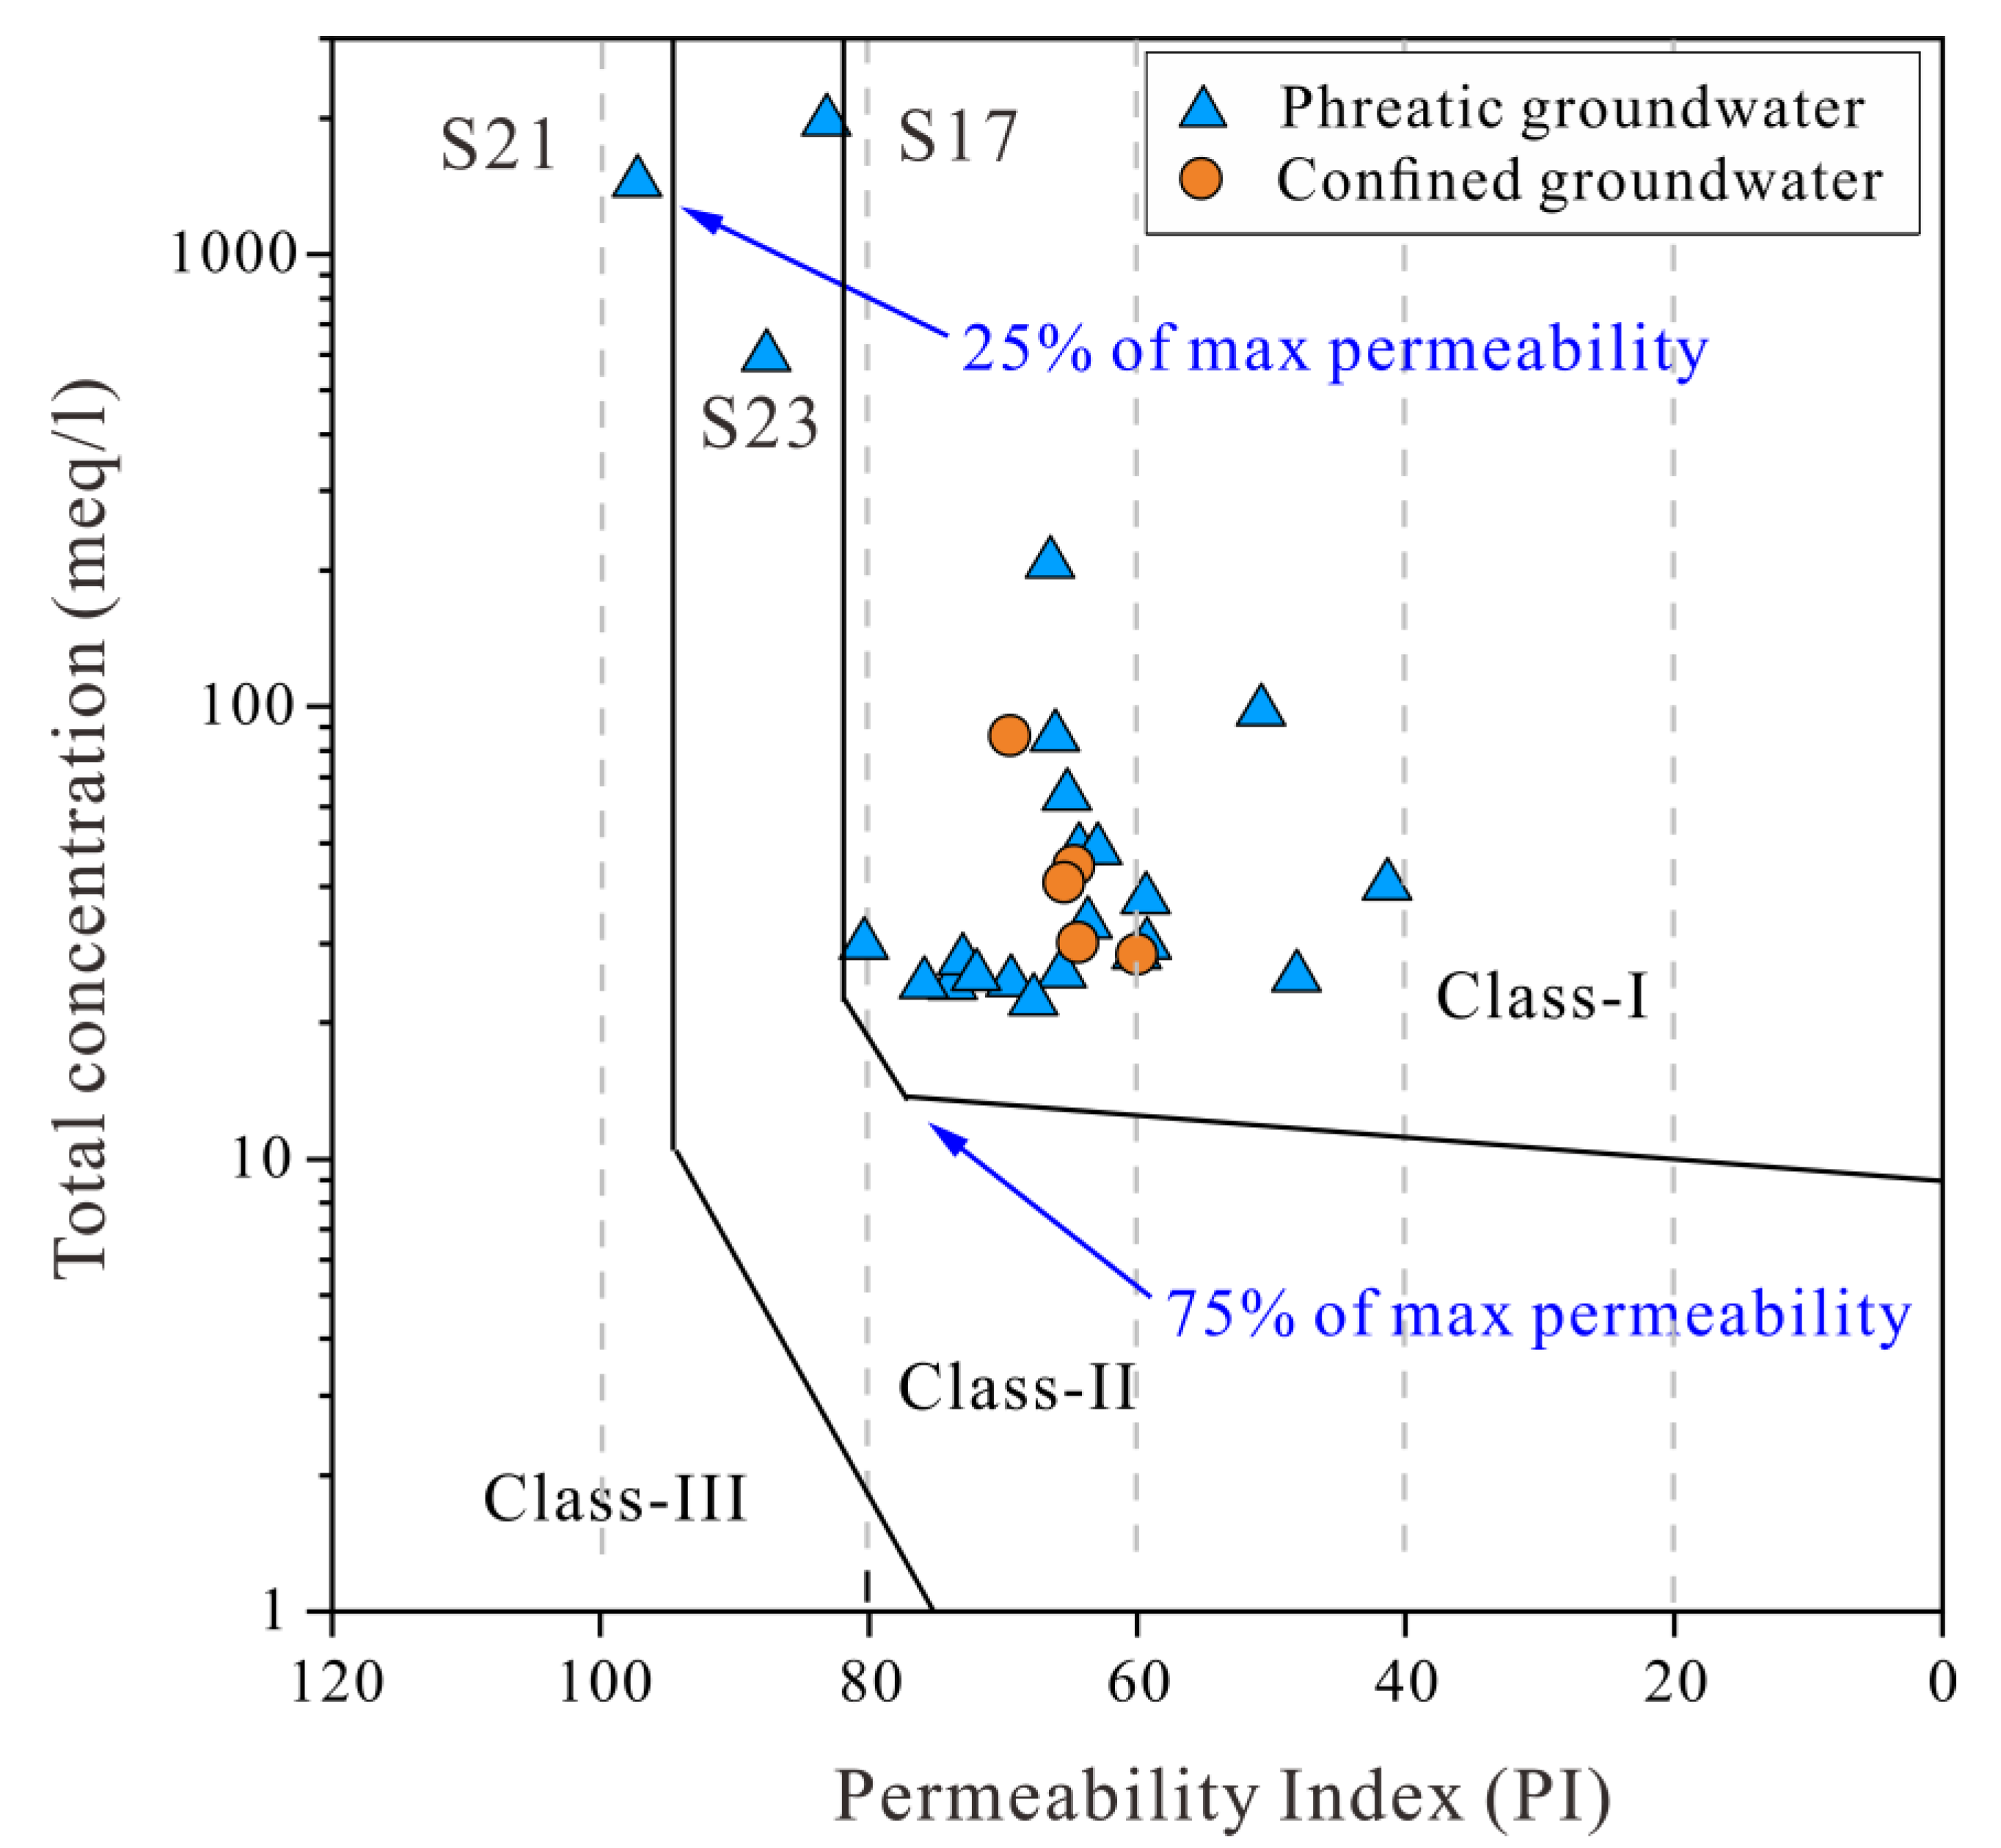
3.4.2. Irrigation Purposes

As shown in Figure 1a, there are two continuously distributed farmlands in the study area, i.e., the Mo river and the Chaka farms. Due to the scarcity of local precipitation, all farmlands in the basin need to be irrigated by human beings. All of the agricultural irrigation waters are solely dependent on the exploitation of groundwater resources rather than surface water due to the shortage of surface water. Thus, the irrigation quality of groundwater is critical to the sustainable development of agriculture in the basin.
Irrigation water with high content of salinity would pose negative effects on the growth of agricultural plants by weakening their capacities to uptake nutrients and water [46]. The rich ions, such as Na+ and Ca2+, in irrigation waters would lead to a change in soil structure and result in compact and dry soil, reducing the production of agricultural plants [29,62]. The EC, sodium adsorption ratio (SAR), sodium percentage (%Na) and permeability index (PI), together with the Wilcox and USSL charts, were employed in the present research to illustrate the irrigation quality of phreatic and confined groundwater in the watershed. The SAR, %Na and PI can be obtained by the following equations [12,28,35,46].
S A R = N a + C a 2 + + M g 2 + 2
% N a = N a + C a 2 + + M g 2 + + N a + + K +
P I = N a + + H C O 3 C a 2 + + M g 2 + + N a + × 100 %
The EC is an integrated parameter representing the salt content in water. The EC values of the collected phreatic and confined groundwater samples were in the range of 1033.50–44,205.00 μS/cm (averaging 5932.70 μS/cm) and 1309.00–3608.10 μS/cm (averaging 2011.00 μS/cm), respectively (Table 1). Generally, water quality can be classified into three categories, i.e., no restriction (EC < 700 μS/cm), slight-to-moderate restriction (700–3000 μS/cm), and severe degree of restriction to irrigation (>3000 μS/cm) [63]. According to this criterion, no sampled phreatic and confined groundwater falls into the none restriction category. Approximately 73.91% of the collected phreatic groundwater samples belonged to the slight-to-moderate restriction classification (700–3000 μS/cm), and 23.09% of the phreatic samples were considered as the tolerant class (>3000 μS/cm). For confined groundwater, only one sample had an EC slightly exceeding the limit of 3000 μS/cm and fell into the tolerant class. All other confined groundwater samples (80%) belonged to the slight-to-moderate restriction classification (700–3000 μS/cm). Overall, most of the phreatic and confined groundwater samples are relatively good quality for irrigation in terms of salinity.
The sodium adsorption ratio (SAR) is a widely used parameter to represent the potential hazard of alkali/sodium to agricultural plants. The values of SAR for the collected phreatic and confined groundwater samples varied from 1.78 to 206.01 and between 3.44 and 10.45, respectively. According to the irrigation criterion recommended by USSL, water with a SAR value < 10, 10–18, 18–26 or ≥ 26 is considered excellent, good, fair and unsuitable for irrigation, respectively [64]. For phreatic groundwater, approximately 82.61% of samples had a SAR value of less than 10, indicating excellent quality for irrigation. One sample (4.35%) was found with a SAR value in the range of 10–18, suggesting good irrigation quality. About 13.04% of the phreatic groundwater samples had a SAR value greater than 26, implying an unsuitable quality for irrigation.
The Wilcox chart constructed by the EC and SAR is an integrated and useful approach to illustrate the water quality for irrigation usage. It divides the potential salinity hazard of irrigation water into four categories, including low salinity hazard (C1), medium salinity hazard (C2), high salinity hazard (C3) and very high salinity hazard (C4). The sodium hazard of irrigation water is also classified into four categories, i.e., low sodium hazard (S1), medium sodium hazard (S2), high sodium hazard (S3) and very high sodium salinity hazard (S4). As shown in Figure 12, most of the collected phreatic and confined groundwater samples are situated in the C3S1 and C3S2 dominances, indicating low to medium sodium and high salinity hazards. Three phreatic groundwater samples (13.04%) are plotted in the C4S2 category, suggesting medium sodium hazard and very high salinity hazard. One confined groundwater, but no phreatic groundwater, is plotted in the C4S3 dominance, indicating both high sodium and very high salinity hazard risks. In addition, four phreatic groundwater samples fall in the C4S4 category, implying the existing risks of very high sodium and very high salinity hazards.
Sodium percentage (%Na) is another useful and robust parameter representing the sodium hazard of irrigation water to soil structure [46,65]. The phreatic groundwater samples had a relatively large variation of %Na ranging from 32.75 to 96.84% with a mean of 57.18%. The collected confined groundwater samples had %Na values varying from 46.88 to 65.80%, with an average of 54.57%, and presented with a relatively small range of %Na. The USSL chart constructed by the EC and sodium percent was introduced to illustrate the suitability of groundwater for irrigation in terms of the %Na. As shown in Figure 13, most of the collected phreatic and confined groundwater samples are situated in the good-to-permissible category and permissible-to-suitable category, indicating it is safe for irrigation in terms of the potential sodium hazard. Three phreatic groundwater samples were plotted in the doubtful-to-unsuitable category. Six phreatic groundwater samples (S16, S19, S21, S22 and S23) and one confined groundwater (P5) fell into the unsuitable category. Groundwater samples situated in these two categories have a potential sodium hazard if used for irrigation and are, therefore, not suitable for irrigation. Groundwater samples with relatively poor quality for irrigation in terms of sodium percentage are also mainly distributed in the lower reach of the watershed, especially the phreatic groundwater adjacent to the salt lake. Groundwater, regardless of the depth in the middle-upper reaches of the watershed, had relatively good quality for irrigation and would not potentially pose a sodium hazard to the soil.
Permeability index (PI) is an effective and widely used parameter assessing the possibility of irrigation water destroying the permeability of the soil. The PI values of the collected phreatic groundwater samples varied from 41.27 to 97.18 with a mean of 67.45, and the confined groundwater samples ranged from 59.94 to 69.40 with an average of 64.73. The Doneen chart constructed by the PI and the total concentration of ions was employed in the present research. Three classifications, i.e., Class-I (good), Class-II (doubtful) and Class-III (unsuitable) of irrigation water quality, can be identified from this chart. As presented in Figure 14, most of the phreatic groundwater samples (86.96%) and all confined groundwater samples were plotted in Class-I, indicating they are good for agricultural irrigation. Two phreatic groundwater samples (S17 and S23) fell into Class-II, and one phreatic groundwater sample (S21) belonged to Class-III, suggesting doubtful and unsuitable for irrigation, respectively. All of the poor irrigation-quality groundwater samples are distributed adjacent to the salt lake. Groundwater in the middle-upper reaches of the watershed, regardless of the depth, had good irrigation quality and would not pose permeability damages to soil structure.

4. Conclusions

Groundwater is essential for the development of the socio-economy and eco-environment in many parts of the world, especially in arid and semiarid regions. Groundwater geochemistry is the key factor determining its suitability for various purposes and greatly influences the health of water consumers. The present research takes the Mo river watershed on the Tibetan plateau as an example to gain insights into the geochemistry, governing mechanisms and quality of groundwater in arid endorheic watersheds. The main findings are as follows:
Groundwater, regardless of the depth in the Mo river watershed, is slightly alkaline. Phreatic groundwater (TDS in the range of 609.19–56,715.34 mg/L) is presented as much saltier than confined groundwater (TDS in the range of 811.86–2509.51 mg/L) in the watershed. Na+ and Cl are the dominant ions for groundwater in both phreatic and confined aquifers. The hydrogeochemical facies of both phreatic and confined groundwater are of Cl-Na type, followed by the mixed Cl-Mg·Ca type. Toxic elements of NO2, NH4+ and F- are beyond the permissible limits of the Chinese guidelines.
The chemical compositions of groundwater, regardless of the depth, are controlled by water–rock interactions in nature. The main rocks involved in the water–rock interactions are silicates and evaporites in both phreatic and confined aquifers. Most groundwater sample compositions are mainly contributed by silicate weathering. Only a small portion of phreatic groundwater samples was dominantly contributed by the dissolution of evaporites (such as halite, gypsum, anhydrite and sulfates). Fluoride mineral dissolution was the reason that groundwater in some locations had relatively high fluoride content. The cation-exchange reaction occurred in most sites for both phreatic and confined groundwater. The reverse cation-exchange reaction also occurred at a few locations. Aside from the natural hydrogeochemical processes, anthropogenic inputs of agricultural sulfate fertilizers have significantly influenced the hydrochemistry of groundwater in the farmlands in the middle reaches of the watershed.
Most groundwater samples, regardless of the depth, had relatively good quality. All confined groundwater samples and most of the phreatic groundwater samples had an EWQI value within 100, and could be used for direct drinking purposes. About 8.70% of phreatic groundwater samples had an EWQI value in the range of 100–150 and were suitable for domestic usage. In addition, 17.39% of phreatic groundwater samples had an EWQI value beyond 200 and were not suitable for various domestic purposes. The EC, SAR, %Na and PI suggested that most of the groundwater samples, regardless of the depth, were of relatively good irrigation quality. Only a small number of phreatic groundwater samples may cause salinity, sodium or permeability hazards to the soil. The relatively poor-quality groundwater samples were mainly located in the lower parts of the watershed. Thus, phreatic groundwater in the middle-upper reaches and confined groundwater of the whole watershed are the primary water resources for domestic and irrigational usage. The present research can provide references for understanding the characteristics, genesis and quality distribution of groundwater in arid and semiarid regions and benefit the rational utilization of groundwater resources.

Author Contributions

Conceptualization: F.W., Y.X. and S.W.; Methodology: H.Y., K.L. and Y.Z.; Formal analysis: F.W., X.C., W.W., Z.Q., K.L., F.B.B. and V.S.; Investigation: S.W., X.C., Z.Q., K.L., H.Y. and L.W.; Data curation: F.W., S.W., L.W., Z.Q., K.L. and H.Y.; Software: F.W., H.Y., Y.Z., K.L. and Z.Q.; Writing-original draft: F.W.; Writing-review and editing: Y.X., F.B.B. and V.S.; Supervision: F.W., X.C., Y.X., W.W. and S.W. All authors have read and agreed to the published version of the manuscript.

Funding

This research was funded by the Key Lab of Geo-environment of Qinghai Province (grant number 2021KJ011, 2021KJ00102), the Natural Science Foundation of China (grant number 42007183), the Natural Science Foundation of Sichuan Province (grant number 2022NSFSC1084), the Fundamental Research Funds for the Central Universities (grant number 2682021ZTPY063) and the Student Research Training Program of Southwest Jiaotong University (grant number 2022174).

Data Availability Statement

The raw data supporting the conclusions of this article will be made available by the authors without undue reservation upon request.

Acknowledgments

The authors appreciate the editors and reviewers for their critical comments and suggestions, which greatly helped us improve the present manuscript.

Conflicts of Interest

The authors declare that the research was conducted in the absence of any commercial or financial relationships that could be construed as potential conflicts of interest.

References

  1. Avci, H.; Dokuz, U.E.; Avci, A.S. Hydrochemistry and groundwater quality in a semiarid calcareous area: An evaluation of major ion chemistry using a stoichiometric approach. Environ. Monit. Assess. 2018, 190, 641. [Google Scholar] [CrossRef]
  2. Zhang, Q.; Xu, P.; Qian, H. Groundwater Quality Assessment Using Improved Water Quality Index (WQI) and Human Health Risk (HHR) Evaluation in a Semi-arid Region of Northwest China. Expo. Health 2020, 12, 487–500. [Google Scholar] [CrossRef]
  3. Banadkooki, F.B.; Xiao, Y.; Malekinezhad, H.; Hosseini, M.M. Optimal allocation of regional water resources in an arid basin: Insights from Integrated Water Resources Management. J. Water Supply Res. Technol.-Aqua 2022, 71, 910–925. [Google Scholar] [CrossRef]
  4. Yin, S.; Gu, X.; Xiao, Y.; Wu, W.; Pan, X.; Shao, J.; Zhang, Q. Geostatistics-based spatial variation characteristics of groundwater levels in a wastewater irrigation area, northern China. Water Supply 2017, 17, 1479–1489. [Google Scholar] [CrossRef]
  5. Xiao, Y.; Liu, K.; Zhang, Y.; Yang, H.; Wang, S.; Qi, Z.; Hao, Q.; Wang, L.; Luo, Y.; Yin, S. Numerical investigation of groundwater flow system and its evolution under the climate change in the arid Golmud river watershed on Tibetan Plateau. Front. Earth Sci. 2022, 10, 943075. [Google Scholar] [CrossRef]
  6. Díaz-Alcaide, S.; Martínez-Santos, P. Review: Advances in groundwater potential mapping. Hydrogeol. J. 2019, 27, 2307–2324. [Google Scholar] [CrossRef]
  7. Hao, Q.; Xiao, Y.; Chen, K.; Zhu, Y.; Li, J. Comprehensive Understanding of Groundwater Geochemistry and Suitability for Sustainable Drinking Purposes in Confined Aquifers of the Wuyi Region, Central North China Plain. Water 2020, 12, 3052. [Google Scholar] [CrossRef]
  8. Barbieri, M.; Barberio, M.D.; Banzato, F.; Billi, A.; Boschetti, T.; Franchini, S.; Gori, F.; Petitta, M. Climate change and its effect on groundwater quality. Environ. Geochem. Health 2021. [Google Scholar] [CrossRef]
  9. Zhao, W.; Lin, Y.-z.; Zhou, P.-p.; Wang, G.-c.; Dang, X.-y.; Gu, X.-f. Characteristics of groundwater in Northeast Qinghai-Tibet Plateau and its response to climate change and human activities: A case study of Delingha, Qaidam Basin. China Geol. 2021, 4, 377–388. [Google Scholar] [CrossRef]
  10. Gu, X.; Xiao, Y.; Yin, S.; Hao, Q.; Liu, H.; Hao, Z.; Meng, G.; Pei, Q.; Yan, H. Hydrogeochemical Characterization and Quality Assessment of Groundwater in a Long-Term Reclaimed Water Irrigation Area, North China Plain. Water 2018, 10, 1209. [Google Scholar] [CrossRef]
  11. Li, P. Meeting the environmental challenges. Hum. Ecol. Risk Assess. 2020, 26, 2303–2315. [Google Scholar] [CrossRef]
  12. Adimalla, N. Groundwater Quality for Drinking and Irrigation Purposes and Potential Health Risks Assessment: A Case Study from Semi-Arid Region of South India. Expo. Health 2019, 11, 109–123. [Google Scholar] [CrossRef]
  13. Cui, W.; Hao, Q.; Xiao, Y.; Zhu, Y.; Li, J.; Zhang, Y. Combining river replenishment and restrictions on groundwater pumping to achieve groundwater balance in the Juma River Plain, North China Plain. Front. Earth Sci. 2022, 10, 902034. [Google Scholar] [CrossRef]
  14. Li, P.; He, X.; Li, Y.; Xiang, G. Occurrence and Health Implication of Fluoride in Groundwater of Loess Aquifer in the Chinese Loess Plateau: A Case Study of Tongchuan, Northwest China. Expo. Health 2019, 11, 95–107. [Google Scholar] [CrossRef]
  15. Yao, R.; Yan, Y.; Wei, C.; Luo, M.; Xiao, Y.; Zhang, Y. Hydrochemical Characteristics and Groundwater Quality Assessment Using an Integrated Approach of the PCA, SOM, and Fuzzy c-Means Clustering: A Case Study in the Northern Sichuan Basin. Front. Environ. Sci. 2022, 10, 907872. [Google Scholar] [CrossRef]
  16. Li, S.; Su, H.; Li, Z. Hydrochemical characteristics and groundwater quality in the thick loess deposits of China. Environ. Sci. Pollut. Res. 2022, 29, 8831–8850. [Google Scholar] [CrossRef]
  17. Li, C.; Gao, X.; Li, S.; Bundschuh, J. A review of the distribution, sources, genesis, and environmental concerns of salinity in groundwater. Environ. Sci. Pollut. Res. 2020, 27, 41157–41174. [Google Scholar] [CrossRef]
  18. Keesari, T.; Roy, A.; Pant, D.; Sinha, U.K.; Kumar, P.V.N.; Rao, L.V. Major ion, trace metal and environmental isotope characterization of groundwater in selected parts of Uddanam coastal region, Andhra Pradesh, India. J. Earth Syst. Sci. 2020, 129, 205. [Google Scholar] [CrossRef]
  19. Subba Rao, N.; Gugulothu, S.; Das, R. Deciphering artificial groundwater recharge suitability zones in the agricultural area of a river basin in Andhra Pradesh, India using geospatial techniques and analytical hierarchical process method. Catena 2022, 212, 106085. [Google Scholar] [CrossRef]
  20. Xiao, Y.; Liu, K.; Hao, Q.; Li, Y.; Xiao, D.; Zhang, Y. Occurrence, controlling factors and health hazards of fluoride-enriched groundwater in the lower flood plain of Yellow River, Northern China. Expo. Health 2022, 14, 345–358. [Google Scholar] [CrossRef]
  21. Hao, Q.; Lu, C.; Zhu, Y.; Xiao, Y.; Gu, X. Numerical investigation into the evolution of groundwater flow and solute transport in the Eastern Qaidam Basin since the Last Glacial Period. Geofluids 2018, 2018, 9260604. [Google Scholar] [CrossRef]
  22. Nag, S.; Roy, M.B.; Roy, P.K. Study on the functionality of land use land cover over the evaluation of groundwater potential zone: A fuzzy AHP based approach. J. Earth Syst. Sci. 2022, 131, 146. [Google Scholar] [CrossRef]
  23. Ntona, M.M.; Busico, G.; Mastrocicco, M.; Kazakis, N. Modeling groundwater and surface water interaction: An overview of current status and future challenges. Sci. Total Environ. 2022, 846, 157355. [Google Scholar] [CrossRef]
  24. Khorchani, H.; Kamel, S. Modeling of groundwater yield by the electrical method case of the Triassic sandstone aquifer (Tataouine South-Eastern Tunisia). J. Water Supply Res. Technol.-Aqua 2021, 70, 600–618. [Google Scholar] [CrossRef]
  25. Marinović, V.; Stevanović, Z. Karst groundwater quantity assessment and sustainability: The approach appropriate for river basin management plans. Environ. Earth Sci. 2019, 78, 362. [Google Scholar] [CrossRef]
  26. Yin, S.; Xiao, Y.; Gu, X.; Hao, Q.; Liu, H.; Hao, Z.; Meng, G.; Pan, X.; Pei, Q. Geostatistical analysis of hydrochemical variations and nitrate pollution causes of groundwater in an alluvial fan plain. Acta Geophys. 2019, 67, 1191–1203. [Google Scholar] [CrossRef]
  27. Adimalla, N.; Manne, R.; Zhang, Y.; Xu, P.; Qian, H. Evaluation of groundwater quality and its suitability for drinking purposes in semi-arid region of Southern India: An application of GIS. Geocarto Int. 2022, 1–12. [Google Scholar] [CrossRef]
  28. Li, Y.; Li, P.; Cui, X.; He, S. Groundwater quality, health risk, and major influencing factors in the lower Beiluo River watershed of northwest China. Hum. Ecol. Risk Assess. 2021, 27, 1987–2013. [Google Scholar] [CrossRef]
  29. Luo, Y.; Xiao, Y.; Hao, Q.; Zhang, Y.; Zhao, Z.; Wang, S.; Dong, G. Groundwater geochemical signatures and implication for sustainable development in a typical endorheic watershed on Tibetan plateau. Environ. Sci. Pollut. Res. 2021, 28, 48312–48329. [Google Scholar] [CrossRef]
  30. Ray, R.K.; Syed, T.H.; Saha, D.; Sarkar, B.C.; Reddy, D.V. Recharge mechanism and processes controlling groundwater chemistry in a Precambrian sedimentary terrain: A case study from Central India. Environ. Earth Sci. 2017, 76, 136. [Google Scholar] [CrossRef]
  31. Rajmohan, N.; Masoud, M.H.Z.; Niyazi, B.A.M. Impact of evaporation on groundwater salinity in the arid coastal aquifer, Western Saudi Arabia. Catena 2021, 196, 104864. [Google Scholar] [CrossRef]
  32. Venkatramanan, S.; Chung, S.Y.; Selvam, S.; Lee, S.Y.; Elzain, H.E. Factors controlling groundwater quality in the Yeonjegu District of Busan City, Korea, using the hydrogeochemical processes and fuzzy GIS. Environ. Sci. Pollut. Res. 2017, 24, 23679–23693. [Google Scholar] [CrossRef]
  33. Liu, R.-p.; Zhu, H.; Liu, F.; Dong, Y.; El-Wardany, R.M. Current situation and human health risk assessment of fluoride enrichment in groundwater in the Loess Plateau: A case study of Dali County, Shaanxi Province, China. China Geol. 2021, 4, 487–497. [Google Scholar] [CrossRef]
  34. Xiao, Y.; Shao, J.; Frape, S.; Cui, Y.; Dang, X.; Wang, S.; Ji, Y. Groundwater origin, flow regime and geochemical evolution in arid endorheic watersheds: A case study from the Qaidam Basin, northwestern China. Hydrol. Earth Syst. Sci. 2018, 22, 4381–4400. [Google Scholar] [CrossRef] [Green Version]
  35. Wang, S.; Xie, Z.; Wang, F.; Zhang, Y.; Wang, W.; Liu, K.; Qi, Z.; Zhao, F.; Zhang, G.; Xiao, Y. Geochemical Characteristics and Quality Appraisal of Groundwater From Huatugou of the Qaidam Basin on the Tibetan Plateau. Front. Earth Sci. 2022, 10, 874881. [Google Scholar] [CrossRef]
  36. Ma, R.; Zhang, B.; Zhou, X. The effects of climate change and groundwater exploitation on the spatial and temporal variations of heavy metal content in maize in the Luan River catchment of China. Environ. Sci. Pollut. Res. 2019, 27, 1035–1052. [Google Scholar] [CrossRef]
  37. Manikandan, E.; Rajmohan, N.; Anbazhagan, S. Monsoon impact on groundwater chemistry and geochemical processes in the shallow hard rock aquifer. Catena 2020, 195, 104766. [Google Scholar] [CrossRef]
  38. Mthembu, P.P.; Elumalai, V.; Brindha, K.; Li, P. Hydrogeochemical Processes and Trace Metal Contamination in Groundwater: Impact on Human Health in the Maputaland Coastal Aquifer, South Africa. Expo. Health 2020, 12, 403–426. [Google Scholar] [CrossRef]
  39. Yin, S.; Xiao, Y.; Han, P.; Hao, Q.; Gu, X.; Men, B.; Huang, L. Investigation of Groundwater Contamination and Health Implications in a Typical Semiarid Basin of North China. Water 2020, 12, 1137. [Google Scholar] [CrossRef] [Green Version]
  40. Li, H.-x.; Han, S.-b.; Wu, X.; Wang, S.; Liu, W.-p.; Ma, T.; Zhang, M.-n.; Wei, Y.-t.; Yuan, F.-q.; Yuan, L.; et al. Distribution, characteristics and influencing factors of fresh groundwater resources in the Loess Plateau, China. China Geol. 2021, 4, 509–526. [Google Scholar] [CrossRef]
  41. Gu, X.; Xiao, Y.; Yin, S.; Liu, H.; Men, B.; Hao, Z.; Qian, P.; Yan, H.; Hao, Q.; Niu, Y.; et al. Impact of Long-Term Reclaimed Water Irrigation on the Distribution of Potentially Toxic Elements in Soil: An In-Situ Experiment Study in the North China Plain. Int. J. Environ. Res. Public Health 2019, 16, 649. [Google Scholar] [CrossRef] [Green Version]
  42. Xiao, Y.; Hao, Q.; Zhang, Y.; Zhu, Y.; Yin, S.; Qin, L.; Li, X. Investigating sources, driving forces and potential health risks of nitrate and fluoride in groundwater of a typical alluvial fan plain. Sci. Total Environ. 2022, 802, 149909. [Google Scholar] [CrossRef]
  43. Jiang, W.; Liu, H.; Sheng, Y.; Ma, Z.; Zhang, J.; Liu, F.; Chen, S.; Meng, Q.; Bai, Y. Distribution, Source Apportionment, and Health Risk Assessment of Heavy Metals in Groundwater in a Multi-mineral Resource Area, North China. Expo. Health 2022, 14, 807–827. [Google Scholar] [CrossRef]
  44. Jiang, W.; Sheng, Y.; Liu, H.; Ma, Z.; Song, Y.; Liu, F.; Chen, S. Groundwater quality assessment and hydrogeochemical processes in typical watersheds in Zhangjiakou region, northern China. Environ. Sci. Pollut. Res. 2022, 29, 3521–3539. [Google Scholar] [CrossRef]
  45. Jin, X.; He, C.; Zhang, L.; Zhang, B. A Modified Groundwater Module in SWAT for Improved Streamflow Simulation in a Large, Arid Endorheic River Watershed in Northwest China. Chin. Geogr. Sci. 2018, 28, 47–60. [Google Scholar] [CrossRef] [Green Version]
  46. Xiao, Y.; Liu, K.; Yan, H.; Zhou, B.; Huang, X.; Hao, Q.; Zhang, Y.; Zhang, Y.; Liao, X.; Yin, S. Hydrogeochemical constraints on groundwater resource sustainable development in the arid Golmud alluvial fan plain on Tibetan plateau. Environ. Earth Sci. 2021, 80, 750. [Google Scholar] [CrossRef]
  47. Xiao, Y.; Shao, J.; Cui, Y.; Zhang, G.; Zhang, Q. Groundwater circulation and hydrogeochemical evolution in Nomhon of Qaidam Basin, northwest China. J. Earth Syst. Sci. 2017, 126, 26. [Google Scholar] [CrossRef]
  48. Zhu, G.; Zhang, Y.; Ma, H.; Wan, Q.; Zhang, Z.; Sang, L.; Liu, Y.; Xu, Y. Effects of a chain of reservoirs on temporal and spatial variation in water chemistry within an endorheic basin. Ecol. Indic. 2021, 125, 107523. [Google Scholar] [CrossRef]
  49. Wu, C.; Wu, X.; Qian, C.; Zhu, G. Hydrogeochemistry and groundwater quality assessment of high fluoride levels in the Yanchi endorheic region, northwest China. Appl. Geochem. 2018, 98, 404–417. [Google Scholar] [CrossRef]
  50. Grizard, P.; Schmitt, J.-M.; Goblet, P. Hydrogeology of an arid endorheic basin (Tsagaan Els, Dornogobi, Mongolia): Field data and conceptualization, three-dimensional groundwater modeling, and water budget. Hydrogeol. J. 2019, 27, 145–160. [Google Scholar] [CrossRef]
  51. Huang, F.; Ochoa, C.G.; Chen, X.; Zhang, D. Modeling oasis dynamics driven by ecological water diversion and implications for oasis restoration in arid endorheic basins. J. Hydrol. 2021, 593, 125774. [Google Scholar] [CrossRef]
  52. Gao, G.; Shen, Q.; Zhang, Y.; Pan, N.; Ma, Y.; Jiang, X.; Fu, B. Determining spatio-temporal variations of ecological water consumption by natural oases for sustainable water resources allocation in a hyper-arid endorheic basin. J. Clean. Prod. 2018, 185, 1–13. [Google Scholar] [CrossRef]
  53. Ndehedehe, C.E.; Ferreira, V.G.; Onojeghuo, A.O.; Agutu, N.O.; Emengini, E.; Getirana, A. Influence of global climate on freshwater changes in Africa’s largest endorheic basin using multi-scaled indicators. Sci. Total Environ. 2020, 737, 139643. [Google Scholar] [CrossRef]
  54. GB/T 14848-2017; Standards for Groundwater Quality. General Administration of Quality Supervision (GAQS): Beijing, China, 2017.
  55. WHO. Guidelines for Drinking-Water Quality, 4th ed.; World Health Organization: Geneva, Switzerland, 2017. [Google Scholar]
  56. Xiao, Y.; Yin, S.; Hao, Q.; Gu, X.; Pei, Q.; Zhang, Y. Hydrogeochemical appraisal of groundwater quality and health risk in a near-suburb area of North China. J. Water Supply Res. Technol.-Aqua 2020, 69, 55–69. [Google Scholar] [CrossRef]
  57. Qu, S.; Wang, G.; Shi, Z.; Xu, Q.; Guo, Y.; Ma, L.; Sheng, Y. Using stable isotopes (δD, δ18O, δ34S and 87Sr/86Sr) to identify sources of water in abandoned mines in the Fengfeng coal mining district, northern China. Hydrogeol. J. 2018, 26, 1443–1453. [Google Scholar] [CrossRef]
  58. Zhang, Y.; Li, X.; Luo, M.; Wei, C.; Huang, X.; Xiao, Y.; Qin, L.; Pei, Q. Hydrochemistry and Entropy-Based Groundwater Quality Assessment in the Suining Area, Southwestern China. J. Chem. 2021, 2021, 5591892. [Google Scholar] [CrossRef]
  59. Zhang, Y.; Dai, Y.; Wang, Y.; Huang, X.; Xiao, Y.; Pei, Q. Hydrochemistry, quality and potential health risk appraisal of nitrate enriched groundwater in the Nanchong area, southwestern China. Sci. Total Environ. 2021, 784, 147186. [Google Scholar] [CrossRef]
  60. Xiao, Y.; Liu, K.; Hao, Q.; Xiao, D.; Zhu, Y.; Yin, S.; Zhang, Y. Hydrogeochemical insights into the signatures, genesis and sustainable perspective of nitrate enriched groundwater in the piedmont of Hutuo watershed, China. Catena 2022, 212, 106020. [Google Scholar] [CrossRef]
  61. Zhang, Y.; He, Z.; Tian, H.; Huang, X.; Zhang, Z.; Liu, Y.; Xiao, Y.; Li, R. Hydrochemistry appraisal, quality assessment and health risk evaluation of shallow groundwater in the Mianyang area of Sichuan Basin, southwestern China. Environ. Earth Sci. 2021, 80, 576. [Google Scholar] [CrossRef]
  62. Qu, S.; Duan, L.; Shi, Z.; Liang, X.; Lv, S.; Wang, G.; Liu, T.; Yu, R. Hydrochemical assessments and driving forces of groundwater quality and potential health risks of sulfate in a coalfield, northern Ordos Basin, China. Sci. Total Environ. 2022, 835, 155519. [Google Scholar] [CrossRef]
  63. Mahammad, S.; Islam, A.; Shit, P.K. Geospatial assessment of groundwater quality using entropy-based irrigation water quality index and heavy metal pollution indices. Environ. Sci. Pollut. Res. 2022. [Google Scholar] [CrossRef]
  64. USSL. Diagnosis and Improvement of Saline and Alkali Soils; Agriculture Handbook; United States Department of Agriculture: Washington, DC, USA, 1954. [Google Scholar]
  65. Qu, S.; Shi, Z.; Liang, X.; Wang, G.; Han, J. Multiple factors control groundwater chemistry and quality of multi-layer groundwater system in Northwest China coalfield—Using self-organizing maps (SOM). J. Geochem. Explor. 2021, 227, 106795. [Google Scholar] [CrossRef]
Figure 1. Location map of (a) the Tibetan Plateau, (b) the Chaka basinand (c) the Mo River watershed and sampling sites.
Sustainability 14 15593 g001
Figure 2. Hydrogeological cross-section of the study area along the A–A’.
Sustainability 14 15593 g002
Figure 3. Piper trilinear diagram of groundwater samples in the study area.
Sustainability 14 15593 g003
Figure 4. Gibbs diagram illustrating the natural principle mechanisms governing groundwater chemistry. (a) TDS versus Na+/(Na++Ca2+); (b) TDS versus Cl/(Cl+HCO3).
Sustainability 14 15593 g004
Figure 5. End-member diagrams representing the main rock type involved in the water–rock interactions. (a) Mg2+/Na+ versus Ca2+/Na+; (b) HCO3/Na+ versus Ca2+/Na+.
Sustainability 14 15593 g005
Figure 6. Scatter plots of (a) Cl versus Na+ and (b) SO42− versus Ca2+ of groundwater in the Mo river watershed.
Sustainability 14 15593 g006
Figure 7. Plots of TDS versus minerals’ saturation index for (a) phreatic groundwater and (b) confined groundwater.
Sustainability 14 15593 g007
Figure 8. Plots of chloro-alkaline indices CAI-1 versus CAI-2 for phreatic and confined groundwater.
Sustainability 14 15593 g008
Figure 9. Plots of molar ratio NO3/Na+ versus molar ratio SO42−/Ca2+ for phreatic and confined groundwater in the study area.
Sustainability 14 15593 g009
Figure 10. Plots of TDS versus EWQI values of phreatic and confined groundwater.
Sustainability 14 15593 g010
Figure 11. Distribution of groundwater quality in the (a) phreatic and (b) confined aquifers based on the EWQI assessment.
Sustainability 14 15593 g011
Figure 12. Wilcox chart presenting the water quality for irrigation purposes.
Sustainability 14 15593 g012
Figure 13. USSL chart presenting the water quality for irrigation usage.
Sustainability 14 15593 g013
Figure 14. Doneen chart illustrating the irrigation quality of groundwater.
Sustainability 14 15593 g014
Table 1. Summary statistics for the physicochemical parameters of groundwater in the study area.
IndexUnitMinMaxMeanSD *Guideline% of the Sample Exceeding the Guideline
Phreatic groundwaterpH/7.428.667.980.316.5–8.5 **8.70%
ECμs/cm1033.5044,205.005932.7011,271.57/
TDSmg/L609.1956,715.346246.7814,213.901000 **47.83%
K+mg/L1.5068.8113.5114.44/
Na+mg/L85.0018,610.002012.054972.36200 **43.48%
Ca2+mg/L50.841102.20160.48221.6275 ***69.57%
Mg2+mg/L18.951358.37135.53277.3350 ***47.83%
Clmg/L172.2931,550.503177.798061.68250 **56.52%
SO42−mg/L33.623866.42595.96960.04250 **43.48%
HCO3mg/L137.91634.61278.4496.42/
NO3mg/L0.9237.3017.1211.6250.0 ***0%
NO2mg/L0.000.080.010.020.02 **8.70%
NH4+mg/L0.000.200.070.090.2 **17.93%
Fmg/L0.004.000.481.031.0 **13.04%
Confined groundwaterpH/7.788.528.050.326.5–8.5 **20%
ECμs/cm1309.003608.102011.00934.77/
TDSmg/L811.862509.511325.94690.321000 **60%
K+mg/L4.5017.028.265.25/
Na+mg/L145.25635.29295.11197.46200 **60%
Ca2+mg/L76.55160.32100.5235.3775 ***100%
Mg2+mg/L41.0780.6856.7716.2150 ***60%
Clmg/L232.551153.54485.95381.41250 **80%
SO42−mg/L180.59379.44248.8081.83250 **40%
HCO3mg/L146.45335.61244.0871.03/
NO3mg/L4.0016.009.204.6050.0 ***0%
NO2mg/L0.000.060.020.030.02 **40%
NH4+mg/L0.000.200.080.080.2 **20%
Fmg/L1.001.601.270.311.0 **60%
* Standard deviation; ** Chinese guideline [54]; *** WHO guideline [55].
Table 2. Correlation matrix of groundwater physicochemical parameters in the study area.
pHTDSK+Na+Ca2+Mg2+ClSO42−HCO3NO2NO3NH4+F
Phreatic
groundwater
pH1.00
TDS−0.071.00
K+0.190.671.00
Na+−0.170.870.481.00
Ca2+−0.170.770.780.561.00
Mg2+−0.080.900.850.690.851.00
Cl−0.080.870.860.710.860.961.00
SO42−−0.170.950.550.910.700.780.741.00
HCO3-0.420.210.170.270.200.240.280.121.00
NO20.110.30−0.190.200.250.200.180.200.341.00
NO30.000.240.030.290.280.160.260.240.260.131.00
NH4+−0.23−0.27−0.420.03−0.41−0.34−0.33−0.12−0.26−0.11−0.291.00
F−0.120.08−0.370.19−0.08−0.18−0.200.20−0.080.260.310.581.00
Confined
groundwater
pH1.00
TDS0.151.00
K+0.660.841.00
Na+0.150.990.841.00
Ca2+0.220.980.850.971.00
Mg2+0.040.920.710.920.841.00
Cl0.210.990.870.990.980.901.00
SO42−0.050.980.760.980.970.930.971.00
HCO3−0.68−0.60−0.84−0.60−0.69−0.29−0.66−0.491.00
NO20.86−0.150.37−0.15−0.03−0.39−0.07−0.26−0.671.00
NO3−0.59−0.08−0.46−0.10−0.030.02−0.150.100.54−0.621.00
NH4+−0.86−0.28−0.72−0.29−0.28−0.14−0.35−0.120.76−0.770.901.00
F0.84−0.110.65−0.07−0.680.54−0.25−0.240.74−0.50−0.50−0.501.00
The bolded values represent a significant relation.
Publisher’s Note: MDPI stays neutral with regard to jurisdictional claims in published maps and institutional affiliations.

