Article

Assessment of 3D Geoportals of Cities According to CityGML Standard Guidelines

by
Klaudia Maciąg
1 and
Przemysław Leń
2,*
1
Faculty of Civil and Environmental Engineering and Architecture, Rzeszow University of Technology, 12 Powstańców Warszawy Avenue, 35-959 Rzeszow, Poland
2
Faculty of Environmental Engineering and Geodesy, University of Life Sciences in Lublin, 13 Akademicka Street, 20-950 Lublin, Poland
*
Author to whom correspondence should be addressed.
Sustainability 2022, 14(23), 15578; https://doi.org/10.3390/su142315578
Submission received: 7 October 2022 / Revised: 18 November 2022 / Accepted: 21 November 2022 / Published: 23 November 2022

Abstract

:
Along with the development of three-dimensional computer graphics, methods of collecting and making 3D spatial data available became a significant issue covering the interoperability of data derived from multiple sources. Between 2006 and 2008, the Open Geospatial Consortium designed a CityGML model as a proposal for a uniform classification, graphic representation, construction, and storage of 3D objects. A considerable part of three-dimensional visualisations, now gaining popularity, make use of solutions based on the CityGML standard, with which they are compatible to various degrees. The survey involved a comprehensive analysis of sixteen generally accessible 3D geoportals of cities in Europe, Asia, and North America in terms of their broad-sense functionality as well as technical and thematic compatibility with the assumptions of CityGML standards. The level of realisation of various features related to the provided spatial data services was evaluated, taking into account elements that the present-day world literature deems to be particularly desirable. The analysis resulted in an elaborate ranking of websites according to 21 criteria. The most common objects and features of the analysed geoportals were also detailed. In addition, the authors presented several solutions to improve the quality of three-dimensional geoportals of cities by implementing external data from various sources.

1. Introduction

Present-day urbanisation processes can be modelled based on the smart city concept. This term refers to activities aimed at sustainable development using high technologies for spatial development. Technological solutions facilitating the construction of a smart city include the Internet of Things (IoT), Artificial Intelligence (AI), machine learning, collecting and analysing data in real-time (big data), and cloud computing [1,2,3,4,5]. With time, the concept of a smart city departed from its classical meaning, strictly related to the development of technology, and is now oriented at the quality of life and the needs of city residents in which city authorities play a key role. In 2014, the International Organization for Standardization issued ISO 37120–a standard defining the efficiency of actions allowing a comparison of changes in development over time and between respective units [6].
The development of computer graphics was accompanied by the emergence of the first virtual three-dimensional models of cities that were only a visual reflection of reality. The economic profitability of creating such models and the increasing awareness of the potential options for interdisciplinary visualisation applications (such as 3D cadastre, spatial planning, crisis management, tourism, navigation, and environmental protection) gave rise to works on developing visualisation technologies. Three-dimensional models were used for collecting, analysing, and transforming spatial data, thus extending the existing scope of capabilities offered by two-dimensional data. The world leader in setting standards for spatial data services is OGC (Open Geospatial Consortium) [7,8,9,10,11].
Next to issues related to creating models of cities, OGC is also interested in adapting CityGML and IFC (used in BIM—Building Information Modelling) formats to ensure the maximum compatibility and interoperability of data. These measures are particularly significant for the efficient management of data. They are applied, among other areas, to 3D cadastre using BIM technology as a carrier of a considerable volume of data [9,12,13,14,15]. A highly useful tool is ADE (Application Domain Extension), thanks to which the CityGML model can be expanded for the special needs of spatial modelling, including the three-dimensional cadastre [16,17].
The CityGML data model consists of five extension modules responsible for modelling aspects. These modules can be linked to any eleven thematic modules representing respective categories of three-dimensional objects in the urban space (marked in red): Construction, Building, Bridge, Tunnel, CityFurniture, CityObjectGroup, LandUse, Relief, Transportation, Vegetation, and WaterBody [18,19].
A key element in designing three-dimensional models of cities is a representation of the most essential elements of the urban space, such as buildings, tunnels, bridges, roads, water bodies, vegetation, and terrain. The conceptual data model of CityGML allows classifying such objects and representing them later concerning various factors, for instance, semantics, 3D geometry, 3D topology, and changes in time [20]. Three-dimensional representation of objects can occur at various levels of detail included in the concept of LoD (Level of Detail). Figure 1 shows five levels of detail according to LoD classification, represented graphically according to CityGML 2.0.
The level LoD0 are two-dimensional buildings superimposed on a three-dimensional terrain model. The level of detail of LoD1 denotes bodies of buildings of known metric geometry and height but without modelled roofs. By contrast, LoD2 represents buildings with geometry and height specifications of LoD1, plus modelled roofs and objects such as dormers. Next, the LoD3 standard features additional modelling of thematic surfaces: windows and doors. Finally, the highest LoD4 comprises models with a modelled interior, usually architectural models [18].
The new conceptual model of CityGML 3.0 is considerably different from CityGML 2.0 in terms of its approach to the concept of LoD. It classifies objects not based on the geometry type but rather according to object semantics. According to the conceptual model of CityGML 3.0, every object, both outside and inside a building, can have different spatial representations at four levels of detail (LoD0-LoD3) using geometries such as points, curves, surfaces, and solids, as well as MultiPoint, MultiCurve, MultiSurface, and MultiSolid, and composites such as CompositeCurve, CompositeSurface, and CompositeSolid [18,19,21,22].
This paper aims to evaluate selected generally accessible 3D geoportals of cities in terms of the representation of three-dimensional objects and available features. The analysis took into account the level of realisation of respective assumptions of the CityGML 3.0 standard and additional objects and functionalities described in the world literature as particularly useful from the user’s point of view. The survey assessed the quality and quantity of presented data and tools available to users.

2. Materials and Methods

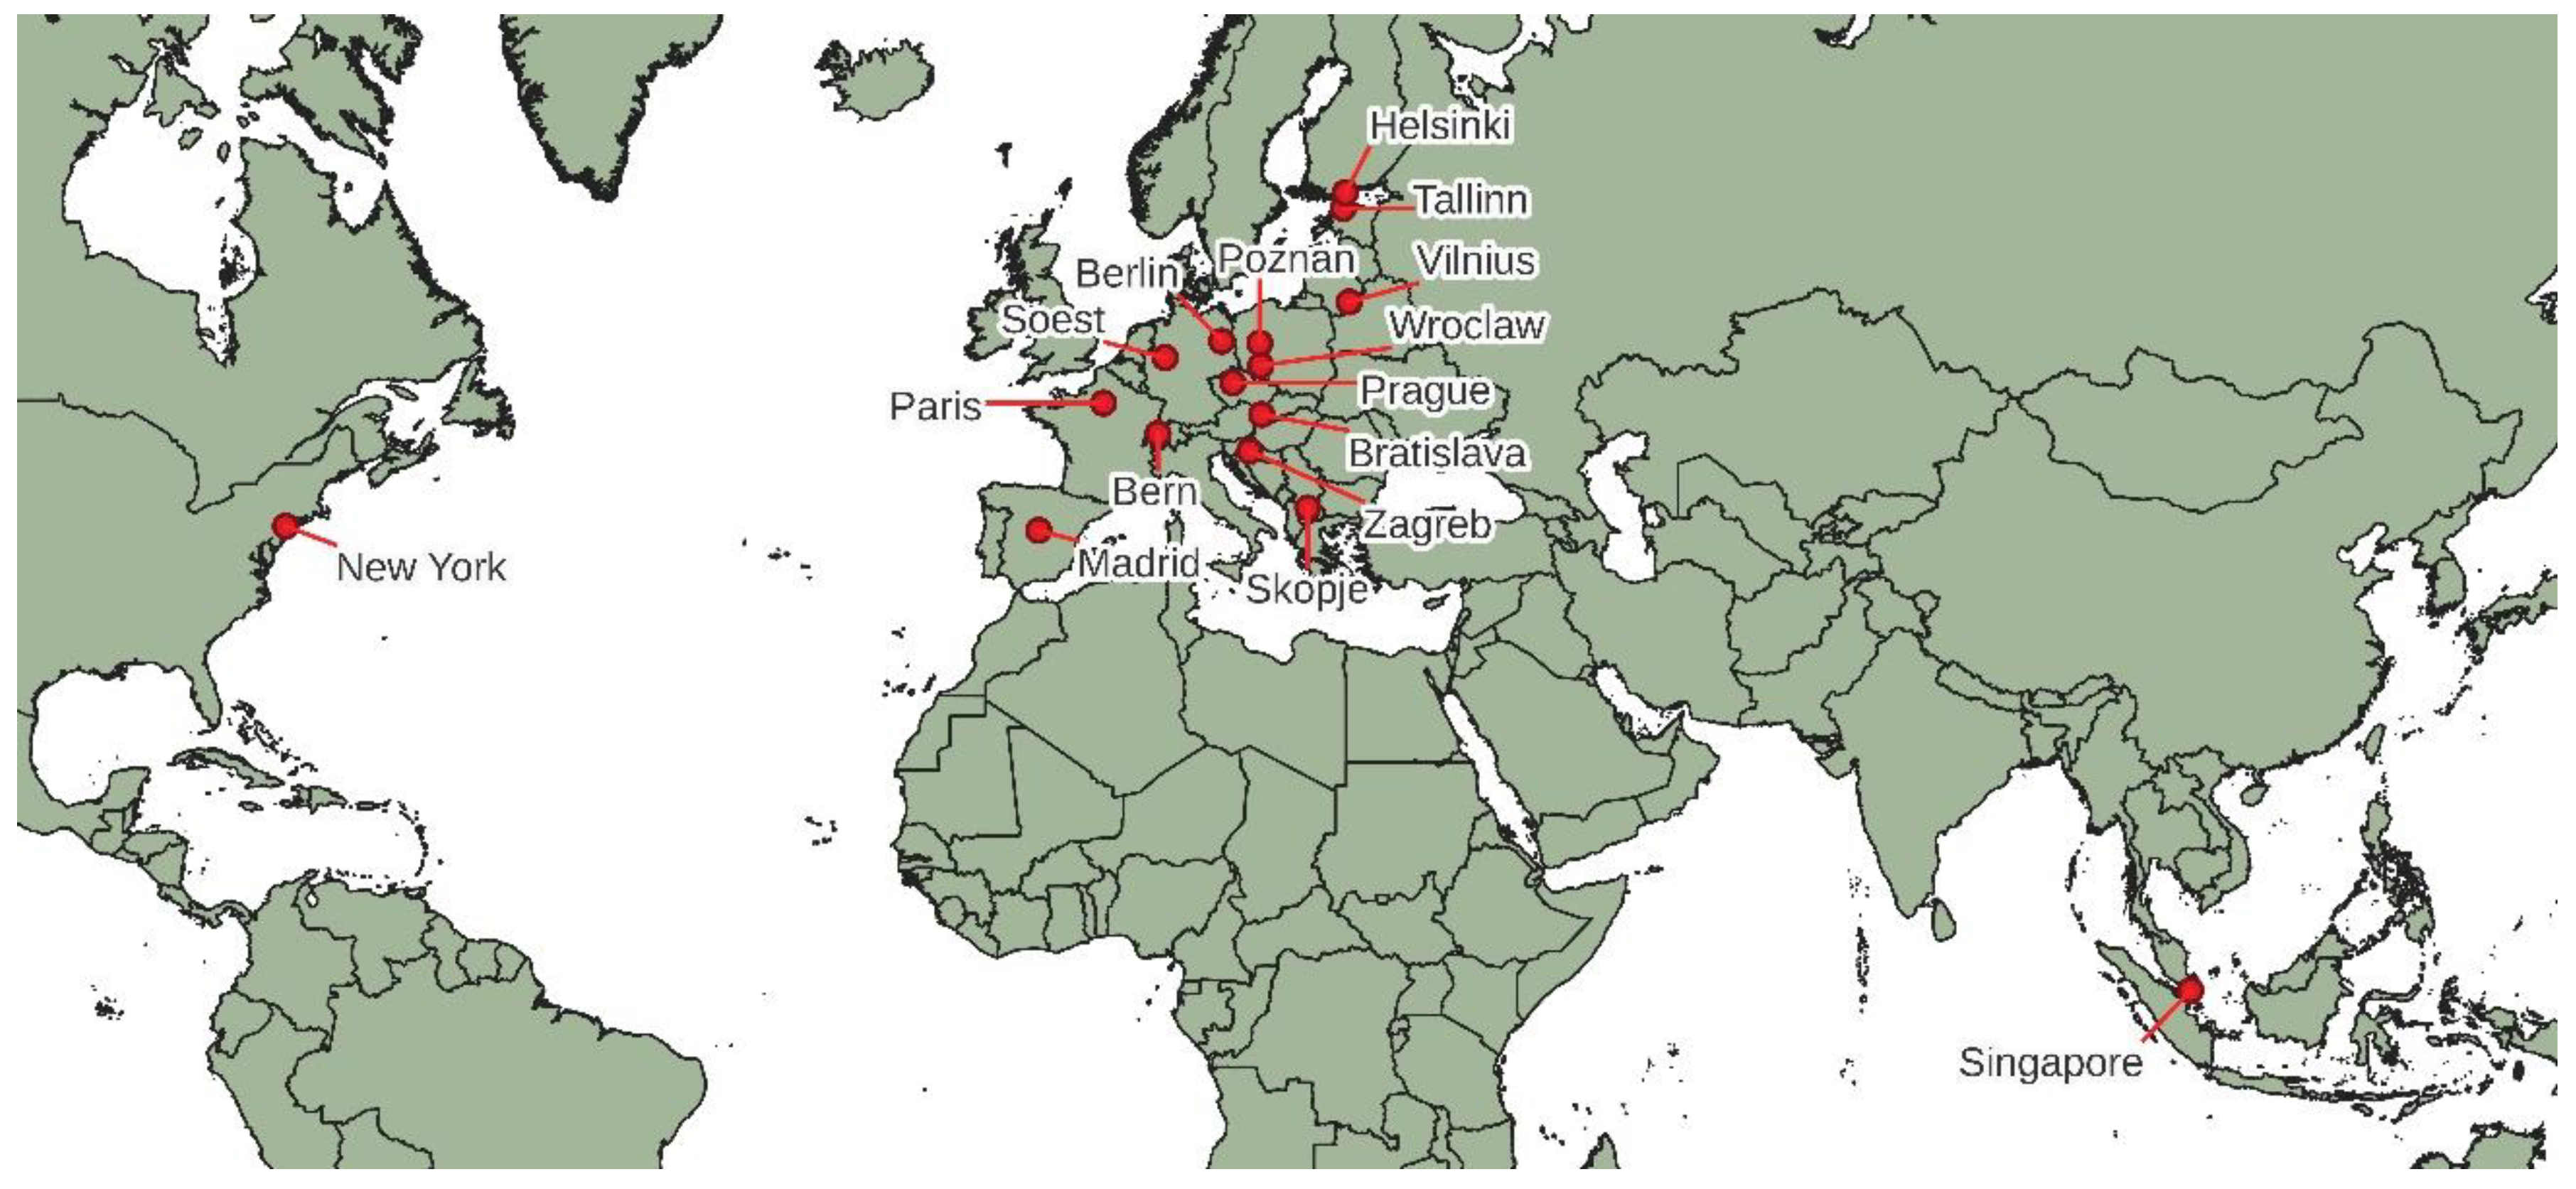
Spatial information services presenting three-dimensional data were selected for the survey. First, the spatial information services of all capital cities in Europe (except the Russian Federation and the Republic of Belarus) were analysed. Out of the 44 examined capital cities, 11 cities with three-dimensional geoportals put into general use were selected. The study area was expanded by four additional geospatial data services maintained for New York, Singapore, Soest, Poznań, and Wrocław. The above-mentioned geoportals were specifically mentioned in the world literature due to their special technical qualities and usability [23,24,25,26,27,28,29,30]. The list of evaluated geoportals, including their www addresses is presented in Table 1, and Figure 2 illustrates their spatial location.
The website assessment categories were selected based on three-dimensional objects and functionalities characteristic of the CityGML 3.0 standard, available to users. The evaluation was made by assigning a relevant score from 0 to 1, where 0 meant that an element was absent; 0.5 meant that an element was partially present, and 1 denoted an element realised in full on the website.
First, a group of construction engineering structures, including buildings, was evaluated and assigned a score for each level of detail (LoD1-LoD3). This also applied to tunnels and bridges. Next, the availability of transportation network elements, such as carriageways, pavements, curbs, and car parks, was examined. These objects were included in the proposals for CityGML 3.0 as an extension that would be particularly useful to users of spatial information systems [23,24]. The assessment also covered elements of spatial planning, visualisation of watercourses and water bodies, vegetation, and additional elements of the city infrastructure (e.g., monuments). Other elements available in 3D geoportals that were subject to evaluation were features facilitating the use of websites, such as export/import of data, the possibility to connect Web Map Service (WMS), and a dynamiser feature making it possible to view data for selected dates and times. An important assessment criterion was lighting, constituting a natural lighting model useful for solar potential analyses [3]. In addition, we checked for the presence of photo textures, mesh, and point clouds as spatial data viewing services. The last issue subject to analysis was the presence of elements making the IoT [19,47]. Apart from comparing geoportals as a tabular summary, the number of occurrences of respective elements in the whole study sample was analysed.

3. Results

The analysis covered 16 geoportals of cities on three continents, looking for occurrences of 21 elements selected as criteria for assessing geoportals’ quality understood as technological advancement, availability of respective thematic layers, and websites’ compliance with CityGML 3.0. The outcome of the analysis’s ranking of the analysed geoportals with scores assigned for respective criteria is presented in Table 2. One of the selected criteria, the tunnels visualization, did not occur in any analysed geoportals and it has not been presented in the table.
The survey shows (Table 2) that the 3D geoportal of Poznań scored the highest (10.5 points). The website provides LoD3 visualisation of buildings for the city hall and the neighbouring tenement houses and LoD2 visualisation (allowing export) of all the elements. The geoportal allows using the IoT technology in respect of public transport, availability of car parks, information on air quality, and data from the so-called bicycle counters detecting bicycle traffic at a selected location in the city. The website can be connected with external WMS services. The thematic section “Spatial planning” contains, among other functionalities, the feature of viewing information on the development of parks and squares, including detailed data on trees and shrubs. An interesting solution is the LoD3 visualisation of designs prepared by the Municipal Urban Planning Department. In addition, the Local Zoning Plan and the Study of Spatial Development Conditions and Directions can be viewed in 2D and 3D versions, extended by analysing the solar potential and noise maps. The geoportal also allows viewing point clouds for vegetation, bridges, and viaducts. A useful element of the geoportal is the representation of BIM elements for the Old Town Market Square area and underground utilities in St Martin Street.
The geoportal of Zagreb scored eight-and-a-half points, which puts it second. This website features an elaborate visualisation of vegetation with 38 species of trees. In addition, the geoportal of Zagreb contains multiple data layers with various content and technical specification, including point clouds and meshes. The LoD2 visualisation of buildings, bridges, dynamic water surfaces, and three-dimensional vegetation models contribute to a high visual quality of the geoportal.
The Vilnius 3D geoportal, which obtained seven-and-half points, has third place in the ranking. The web service provides the general visualisation of buildings in a LoD2 standard and, for selected buildings, in a LoD3 standard. In addition, bridges and vegetation have been visualised. An extensive part of the geoportal is the information about spatial planning. The geoportal allows displaying the 3D model with natural lighting and shading specific to a particular date. It is also possible to display the scene with selected weather conditions. An interesting additional feature is the calculation and visualization of the solar potential for the city area.
The fourth highest score (seven points) was that of New York’s geoportal. The website differs from other study objects in the presence of modelled surface objects such as carriageways, pavements, curbs, and car parks. These objects have an elaborate description of attributes in the 3DCityDB database structure, allowing detailed geometrical and thematic data such as the object’s surface, length and height, speed limits, snow removal priority, and suitability for bicycle traffic.
Another highly evaluated website is the geoportal of Wrocław, which also scored seven points. Its distinguishing feature is the modelling of bridges; however, their representation is considerably simplified.
The geoportal of Bern comes fifth in the ranking. Its visualisation represents bridges and selected elements of the municipal infrastructure (such as bus and tram stops) in considerable detail. Bridges are also modelled in the geoportal of Prague, which, similar to the geoportal of Singapore, scored six points in the ranking. In analysing the geoportal of Singapore, attention was paid to the outstanding modelling of street furniture, including textures and the presence of IoT elements. Next in the ranking, with a score of five points, were the geoportals of Berlin, Helsinki, and Soest. The geoportal of Soest stands out from other websites as it shows fencing. The geoportal of Tallinn was ranked eighth with four-and-a-half points. Three-and-a-half points were awarded to the geoportal of Bratislava, providing a LoD1 and partly LoD2 visualisation of buildings with textures and representation of vegetation. Second to last in the ranking were the spatial information services of Paris and Skopje. The geoportal of Paris presents a LoD1 visualisation of buildings and allows overlaying of two-dimensional thematic layers regarding, among other things, spatial planning on the three-dimensional terrain model. By contrast, the geoportal of Skopje scored points for the LoD2 visualisation of buildings and the presence of layers carrying spatial planning data. The lowest position in the ranking is that of the geoportal of Madrid, which scored one-and-a-half points for the LoD2 visualisation of selected buildings, including textures.
The survey outcomes were used to determine the number of spatial information services in which respective functionalities, making the assessment criteria, were observed. The number of elements noted is presented in Table 3.
Our survey demonstrated that buildings, modelled in the LoD2 standard, are the most common element found in fifteen out of sixteen analysed geoportals. In order to compare four geoportals containing LoD1 visualisation of buildings, only a small part of the historic old town in two of the analysed cities was modelled at LoD3. The second most common element is ex aequo, textures (for instance, on the walls of buildings), and the visualisation of natural lighting, which can be observed on eight analysed websites. The third place refers to the representation of vegetation and was found in seven analysed geoportals. Spatial planning data and mesh visualization occur in six geoportals. Five study objects contained WMS, bridge visualization, and export/import features. Water bodies and other elements of the city infrastructure were noted on four websites. Three geoportals offer a feature of dynamic viewing of data in time and present point clouds. The elements of IoT are incorporated into two websites. One occurrence of criteria, such as the visualisation of pavements, curbs, carriageways, and car parks, was noted. In contrast, none of the sixteen analysed geoportals featured 3D visualisations of tunnels although they are one of the basic CityGML objects.
From the user’s point of view, a significant model quality criterion is aesthetics. Visual quality can be constituted by, among other things, the above-analysed elements, the presence or absence of which directly impact the model’s visual perception. Such elements include, in particular: high LoD, representation of water bodies and water courses, presence of textures, modelling of vegetation, and visualisation of street furniture. Providing a mesh as a realistic reflection of the image of a considerable part of objects can also be expedient. However, in problem areas where it was difficult to generate a correct mesh due to the limited precision of input data (photogrammetric sources and laser scanning), the final visual reception deteriorated. In addition, it should be highlighted that a mesh is not a modelled object and has considerably fewer applications than classified objects described by attributes.
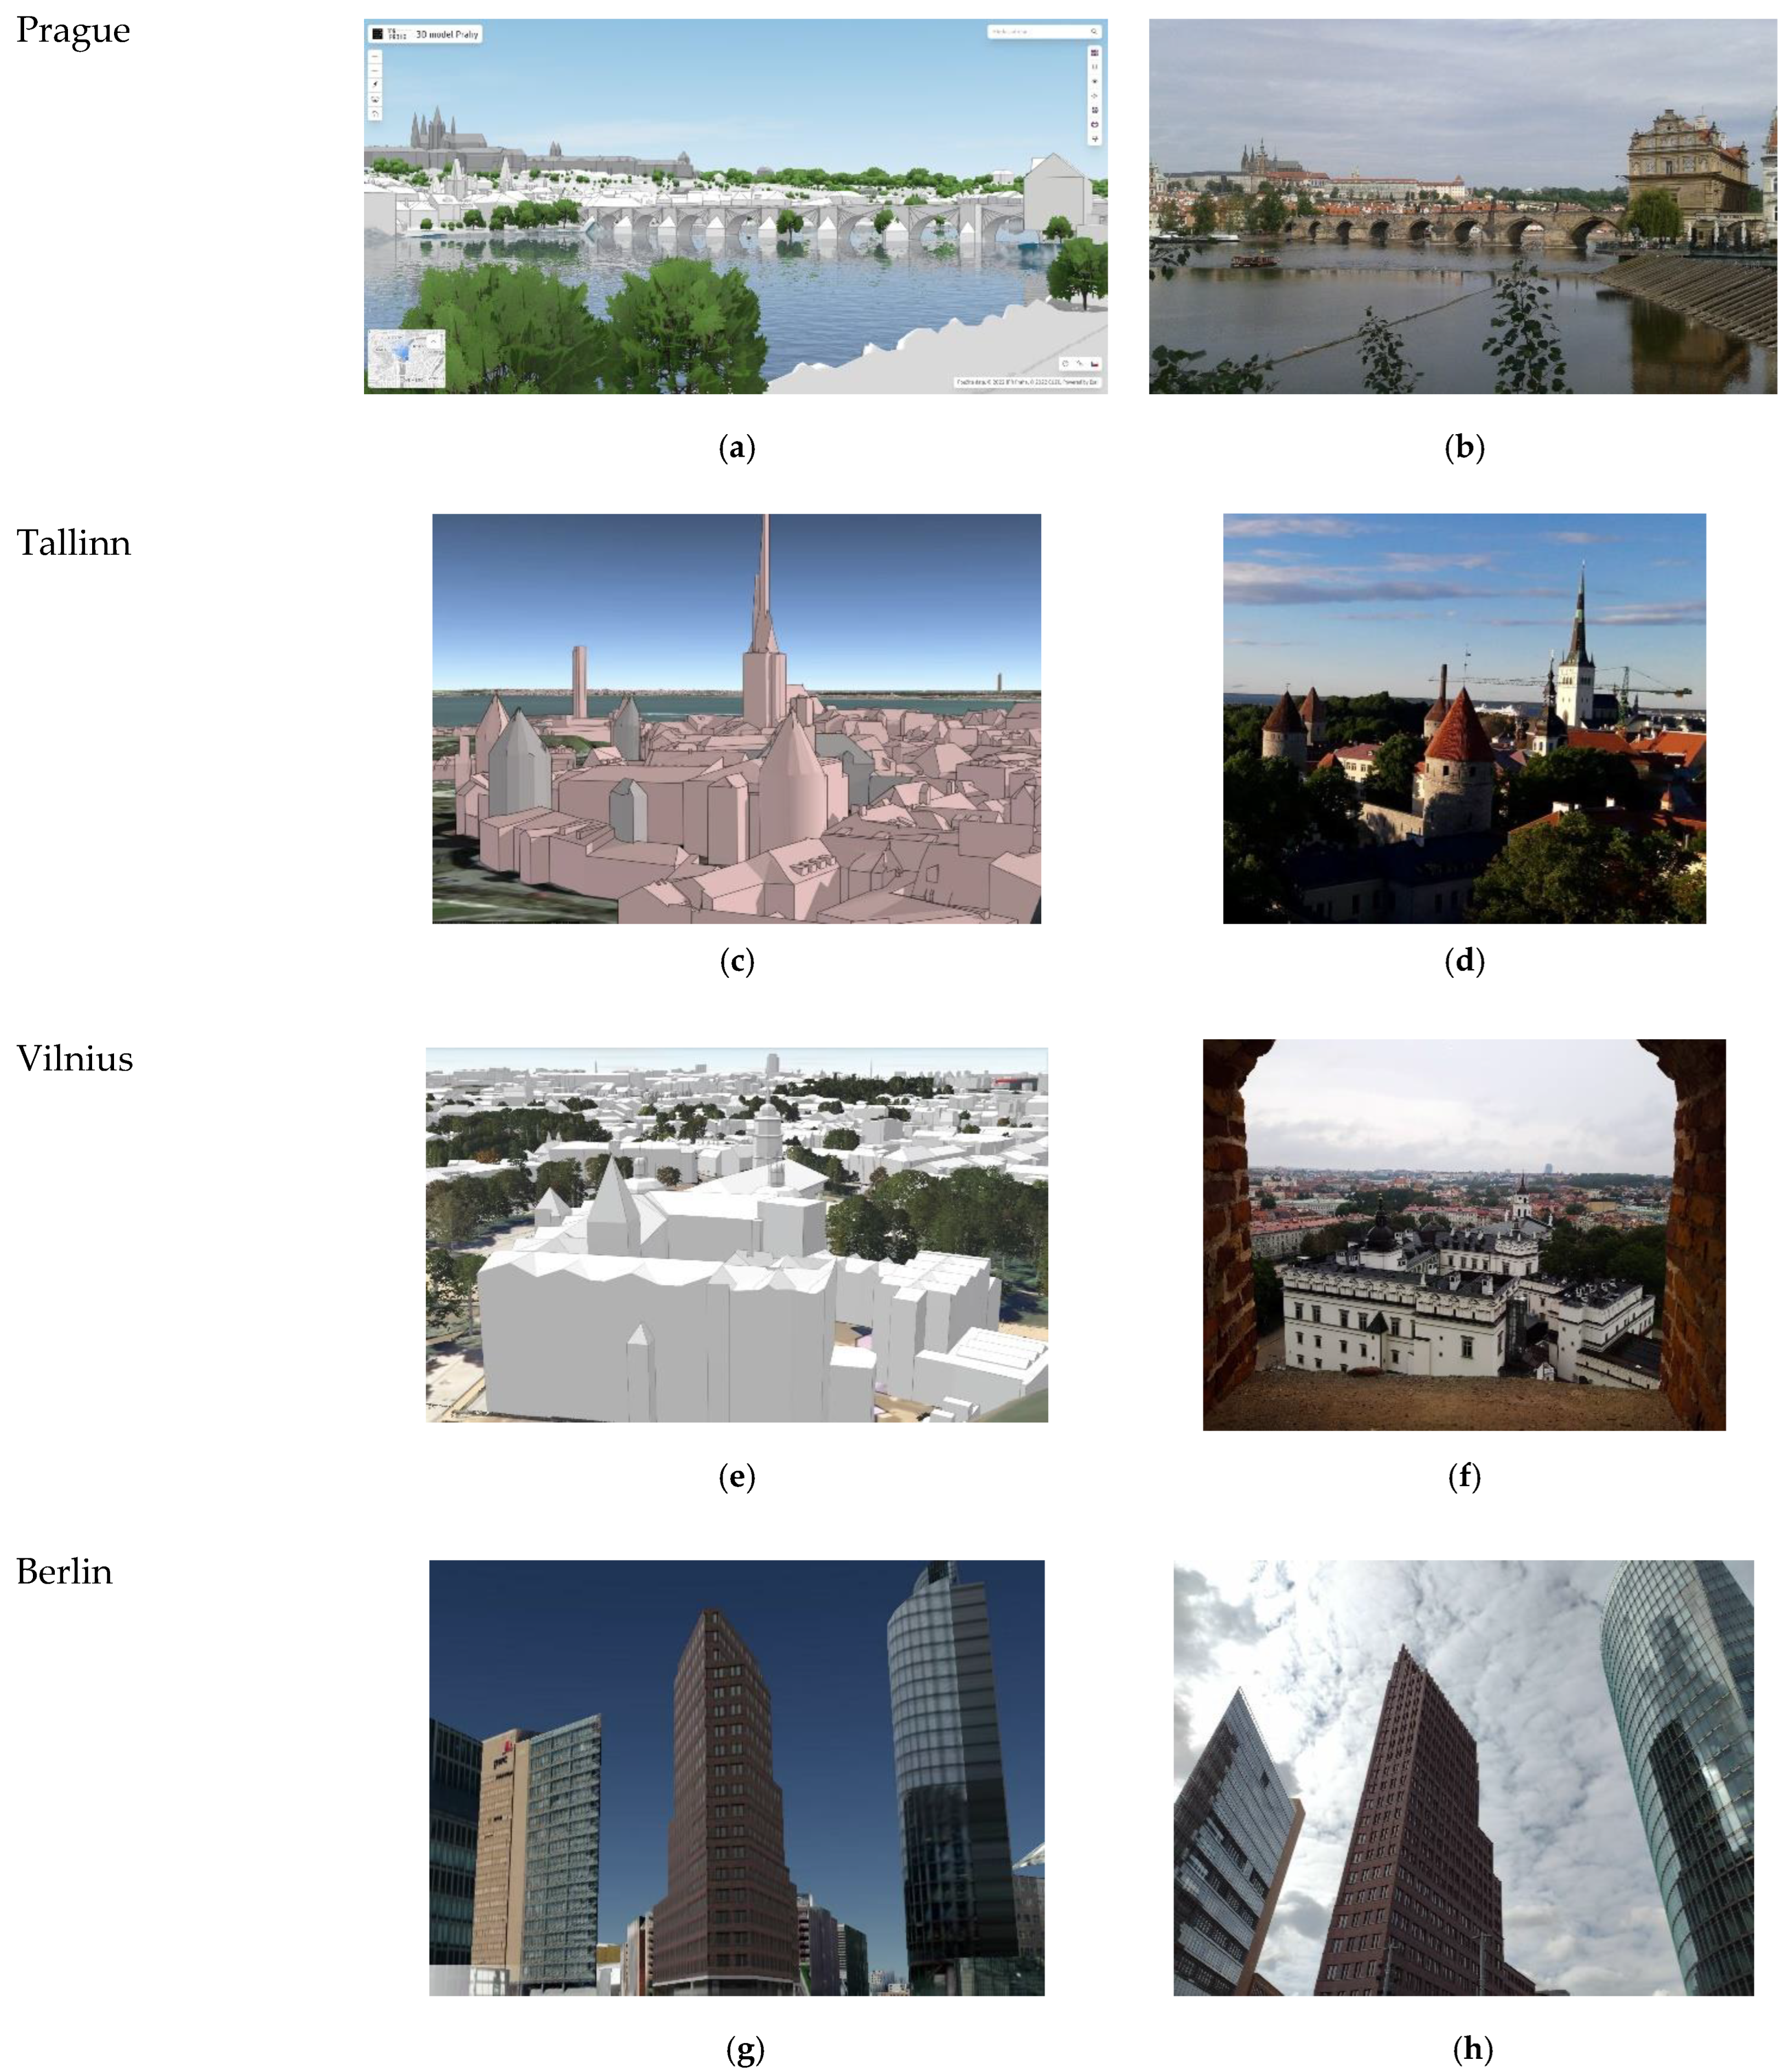
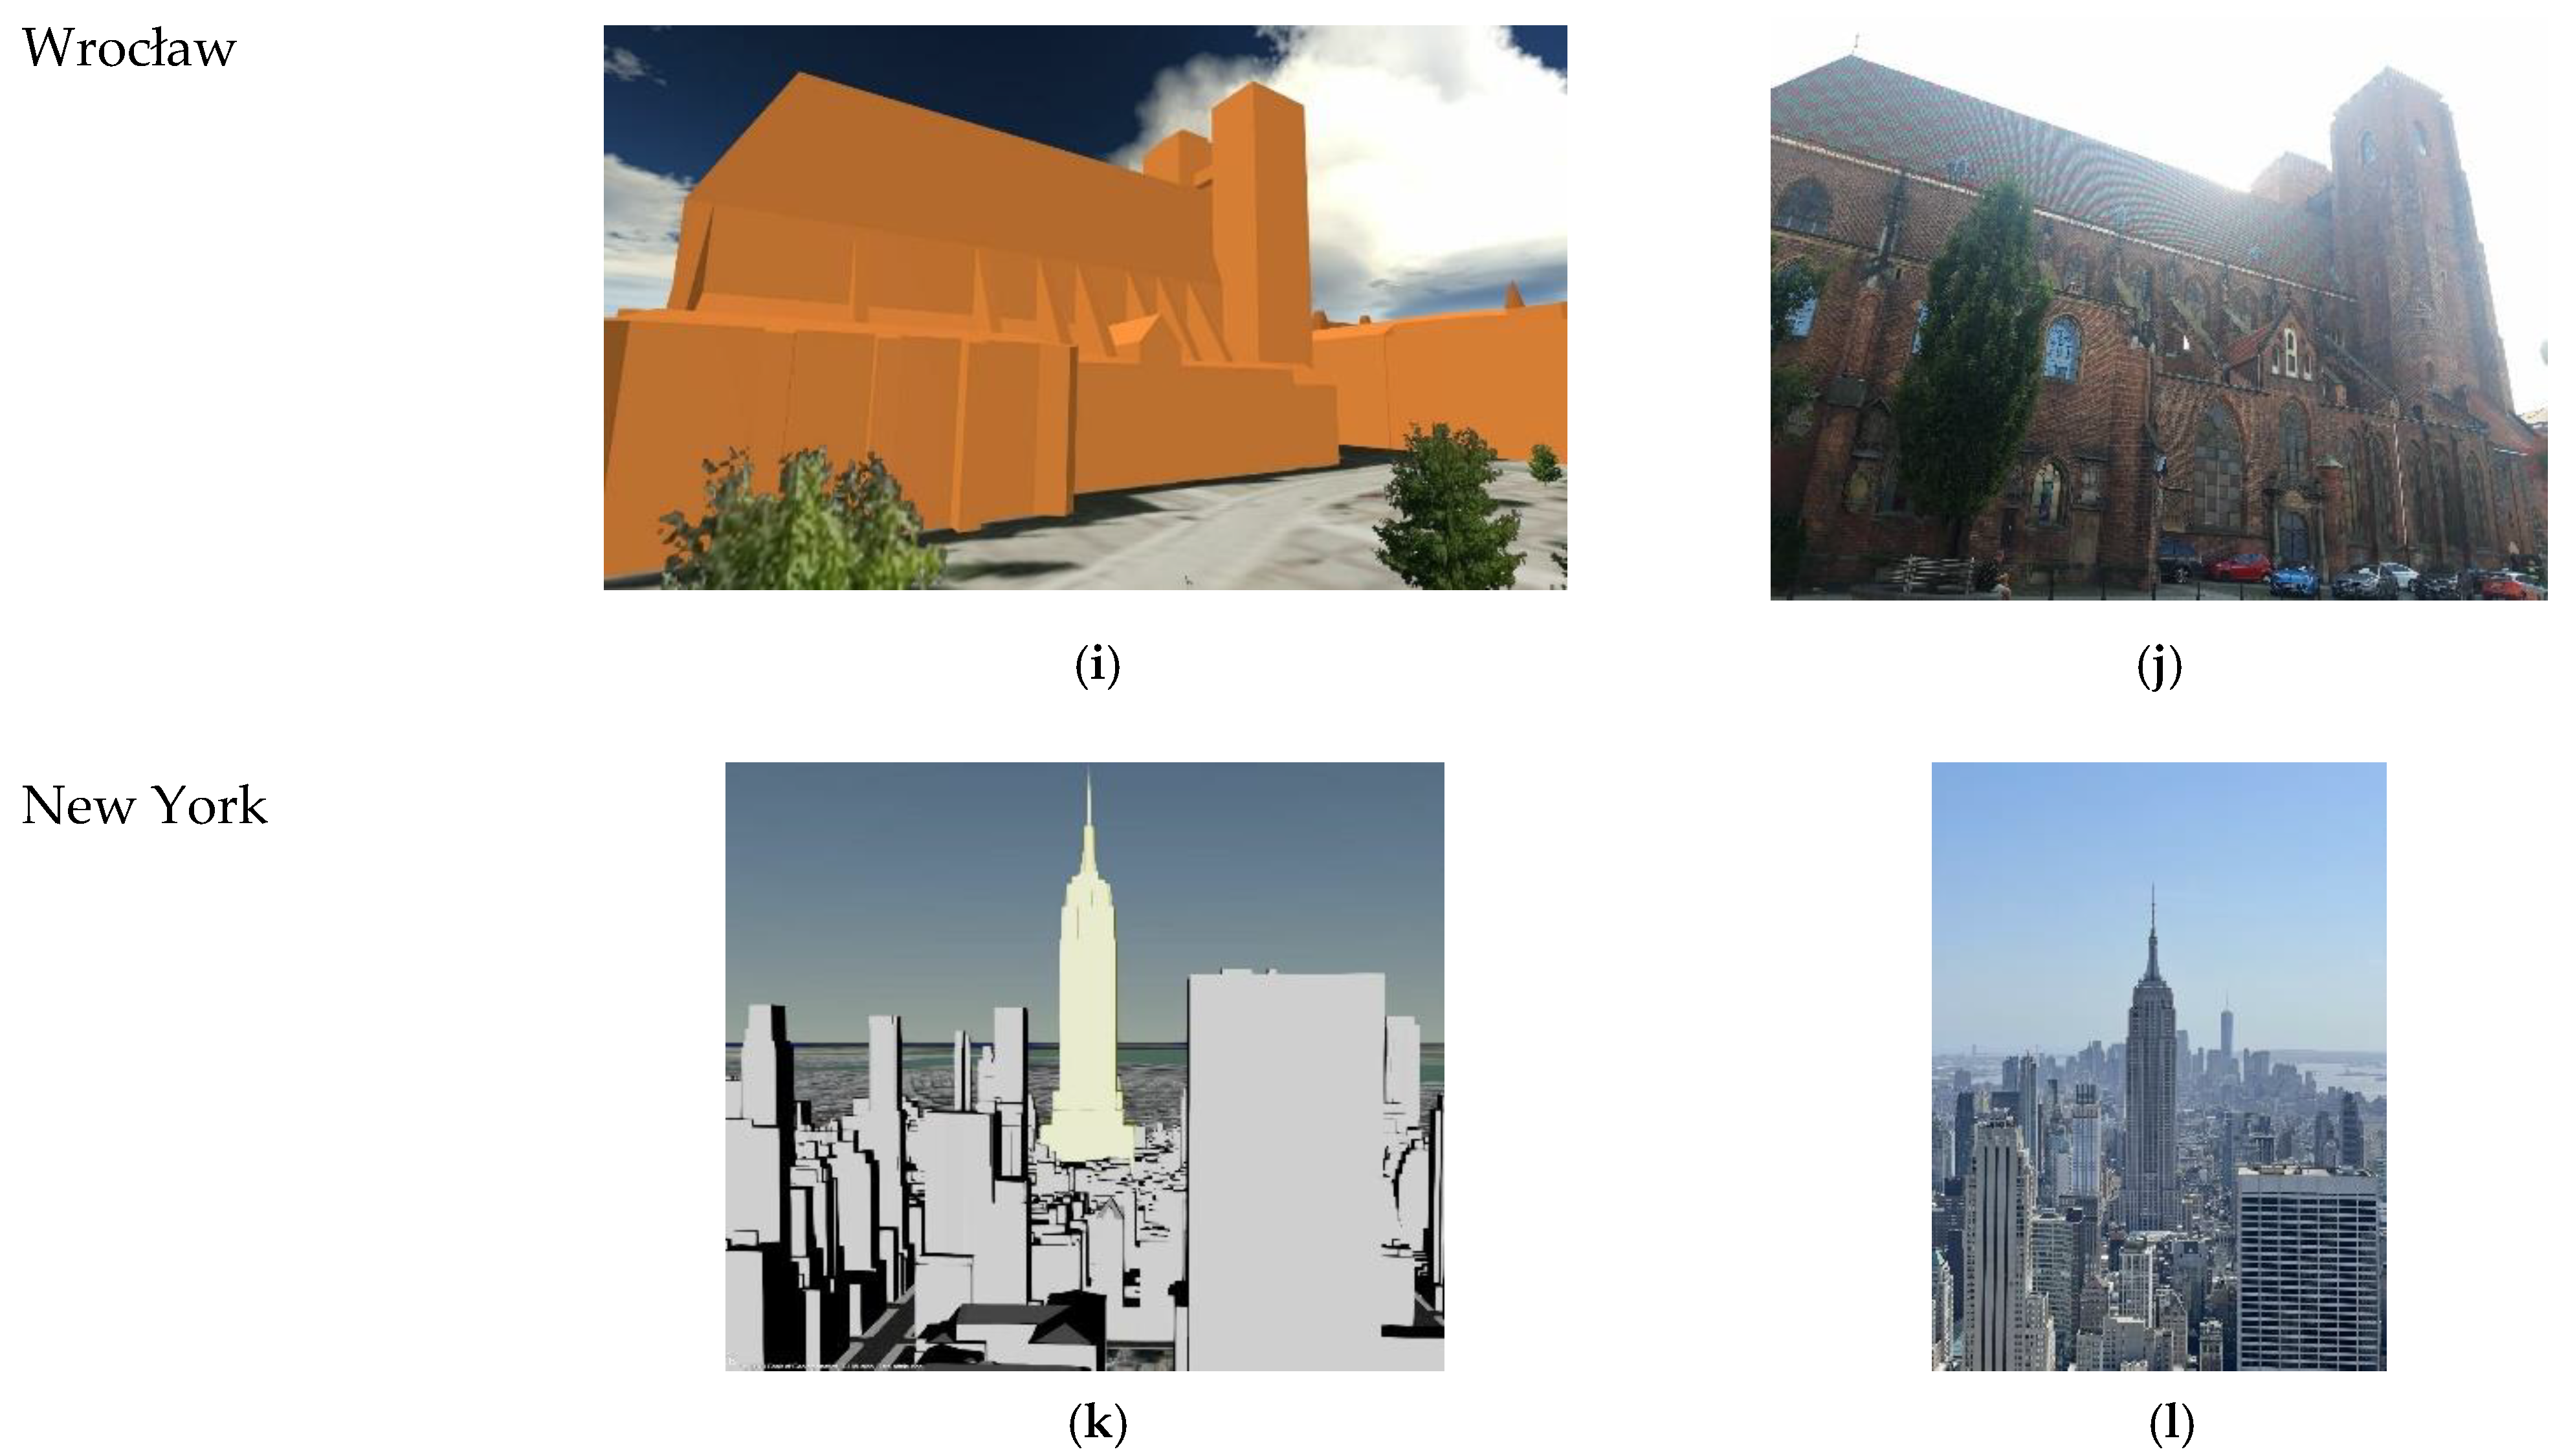
Figure 3 compare the views of selected geoportals with photographic images of respective objects of architecture.
The photographs were compared with the corresponding landmarks shown in the geoportals to see that the best visual reception was that of highly detailed models supplemented by building structure textures. The geoportals of Berlin and Vilnius were recognised for their high degree of realism, which was deemed to enhance their aesthetic value. The presentation of vegetation and a realistic representation of the water surface in the spatial information system of Prague was also appreciated.

4. Discussion

The diversity of model structures, the scope of information presented, and the features of 3D geoportals indicate the various directions of spatial data services development. The variety of the analysed objects in terms of content, technological advancement, and compliance with the latest CityGML 3.0 standard can also imply that the idea of interoperability and compatibility of spatial data is not sufficiently developed.
A good solution that could potentially extend the functionality of city spatial information systems can be to implement the existing two-dimensional data representing topographical objects such as trees, carriageways, pavements, and street furniture in three-dimensional visualisations. In order to make the information resources uniform, in the countries of the European Union, the content of websites can be expanded using the existing spatial data in compliance with the regulations of the INSPIRE directive [48]. The developed standards contain several guidelines for storing and presenting data on objects found in geodesic resources and elsewhere. The proposed solutions assumed that various objects are presented with detailed attributes such as speed limits and the number of lanes, etc. Adding such information can considerably expand the model’s applicability. For example, a visualisation containing detailed information on the transportation network can be used for creating an automotive navigation system based on a three-dimensional representation of space.
Gathering various three-dimensional spatial data on one website considerably facilitates the acquisition and processing of information. An elaborate model of graphical and descriptive data of land, buildings, and infrastructure elements can provide a basis for creating a so-called three-dimensional cadastre. Such a system can be designed thanks to a uniform data collection and storage standard CityGML 3.0 measures to ensure compatibility with IFC formats for BIM data. In addition, the ADE module makes it possible to add any content to the model [17].
Another category of spatial data desired in city spatial information systems is data on the quality of air acquired for a considerable number of cities in the world. This is particularly important in the context of environmental protection and measures to improve air quality. The 3D models of cities, presenting so-called smog data, can be automatically updated thanks to IoT sensors.
Similar solutions can be applied to data on the position of public transport vehicles. Public transport companies increasingly often allow tracking of the means of public transport on interactive maps available on their websites. Such data can power 3D models of cities, creating a space where information is generally accessible to residents, tourists, city authorities, and investors. The information provided as open data in the 3D geoportals of cities significantly impacts the efficiency of activities taken under the smart city concept.

5. Conclusions

The survey provided information on the functionality and technological advancement of the existing three-dimensional geoportals of selected cities of the world. The resulting experience shows clear differences in the broad-sense quality of respective spatial information services.
Some geoportals (e.g., those maintained for Poznań, New York, Wrocław, and Prague) were found to offer a wide range of information, including high-tech improvements (such as data from IoT sensors) and a worthwhile visual representation of objects. A specific standard is the LoD2 presentation of the models of buildings with (partial or full) photo textures.
Concurrently, many analysed websites provide a small scope of spatial data with limited visualisation options. The quality of some geoportals materially differs from the standards of CityGML 3.0 and their previous versions. Moreover, spatial visualisation for some categories of objects is relatively rare, and this group includes bridges and tunnels.
The observed inconsistency of the examined geoportals with global standards can imply that the concept of interoperability of spatial information has not been sufficiently implemented and that the development of the idea of open data has been limited. Thus, initiatives promoting integration and presentation of spatial information within the smart city concept, broadly, as a complex multifunctional tool providing several benefits to entities managing urban space and its inhabitants should be considered reasonable.

Author Contributions

Conceptualization, K.M.; methodology, K.M.; validation, P.L.; formal analysis, K.M.; investigation, K.M.; resources, K.M.; data curation K.M.; writing—original draft preparation, K.M.; writing—review & editing, P.L.; visualization, K.M.; supervision; project administration, K.M. All authors have read and agreed to the published version of the manuscript.

Funding

This research received no external funding.

Institutional Review Board Statement

Not applicable.

Informed Consent Statement

Not applicable.

Data Availability Statement

Not applicable.

Conflicts of Interest

The authors declare no conflict of interest.

References

  1. Śledziewska, K.; Włoch, R. Gospodarka Cyfrowa. Jak Nowe Technologie Zmieniają Świat; Forum Odpowiedzialnego Biznesu: Warszawa, Poland, 2020. [Google Scholar] [CrossRef]
  2. Ahlgren, B.; Hidell, M.; Ngai, E.C.H. Internet of Things for Smart Cities: Interoperability and Open Data. IEEE Internet Comput. 2016, 20, 52–56. [Google Scholar] [CrossRef]
  3. Biljecki, F.; Dehbi, Y. Raise the roof: Towards generating LOD2 models without aerial surveys using machine learning. ISPRS Ann. Photogramm. Remote Sens. Spat. Inf. Sci. 2019, 4, 27–34. [Google Scholar] [CrossRef] [Green Version]
  4. Kemeç, A. Analysis of smart city global research trends with network map technique. Manag. Res. Pract. 2022, 14, 46–59. [Google Scholar]
  5. Kolbe, T.; Moshrefzadeh, M.; Donaubauer, A.; Chaturvedi, K. The Data Integration Challenge in Smart City Projects; Technical Report; Lehrstuhl für Geoinformatik: München, Germany, 2020. [Google Scholar] [CrossRef]
  6. Mazur, Z.; Mazur, H.; Mendyk-Krajewska, T. Udostępnianie i wykorzystywanie danych otwartych. Èkon. Probl. Usł. 2017, 1, 211–221. [Google Scholar] [CrossRef] [Green Version]
  7. Yao, Z.; Nagel, C.; Kunde, F.; Hudra, G.; Willkomm, P.; Donaubauer, A.; Adolphi, T.; Kolbe, T.H. 3DCityDB—A 3D geodatabase solution for the management, analysis, and visualization of semantic 3D city models based on CityGML. Open Geospat. Data Softw. Stand. 2018, 3, 1–26. [Google Scholar] [CrossRef] [Green Version]
  8. Hijazi, I.H.; Krauth, T.; Donaubauer, A.; Kolbe, T. 3DCityDB4BIM: A system architecture for linking BIM server and 3D CityDB for BIM-GIS-integration. ISPRS Ann. Photogramm. Remote Sens. Spat. Inf. Sci. 2020, 4, 195–202. [Google Scholar] [CrossRef]
  9. Arroyo Ohori, K.; Biljecki, F.; Kumar, K.; Ledoux, H.; Stoter, J. Modeling Cities and Landscapes in 3D with CityGML. In Building Information Modeling; Springer: Cham, Switzerland, 2018; pp. 199–215. [Google Scholar] [CrossRef] [Green Version]
  10. Ledoux, H.; Biljecki, F.; Dukai, B.; Kumar, K.; Peters, R.; Stoter, J.; Tom, C. 3dfier: Automatic reconstruction of 3D city models. J. Open Source Softw. 2021, 6, 2866. [Google Scholar] [CrossRef]
  11. Akahoshi, K.; Ishimaru, N.; Kurokawa, C.; Tanaka, Y.; Oishi, T.; Kutzner, T.; Kolbe, T.H. I-Urban revitalization: Conceptual modeling, implementation, and visualization towards sustainable urban planning using CityGML. ISPRS Ann. Photogramm. Remote Sens. Spat. Inf. Sci. 2020, 4, 179–186. [Google Scholar] [CrossRef]
  12. Vilgertshofer, S.; Amann, J.; Willenborg, B.; Borrmann, A.; Kolbe, T. Linking BIM and GIS Models in Infrastructure by Example of IFC and CityGML. In Proceedings of the ASCE International Workshop on Computing in Civil Engineering 2017, Seattle, WA, USA, 25–27 June 2017; pp. 133–140. [Google Scholar] [CrossRef] [Green Version]
  13. Stoter, J.; Ho, S.; Biljecki, F. Considerations for a contemporary 3D cadastre for our times. Int. Arch. Photogramm. Remote Sens. Spat. Inf. Sci. 2019, 4, 81–88. [Google Scholar] [CrossRef] [Green Version]
  14. Lim, J.; Tauscher, H.; Biljecki, F. Graph transformation rules for IFC-TO-CityGML attribute conversion. ISPRS Ann. Photogramm. Remote Sens. Spat. Inf. Sci. 2019, 4, 83–90. [Google Scholar] [CrossRef] [Green Version]
  15. Biljecki, F.; Lim, J.; Crawford, J.; Moraru, D.; Tauscher, H.; Konde, A.; Adouane, K.; Lawrence, S.; Janssen, P.; Stouffs, R. Extending CityGML for IFC-sourced 3D city models. Autom. Constr. 2021, 121, 103440. [Google Scholar] [CrossRef]
  16. Ates Aydar, S.; Stoter, J.; Ledoux, H.; Demir Ozbek, E.; Yomralioglu, T. Establishing a national 3D geo-data model for building data compliant to CityGML: Case of Turkey. Int. Arch. Photogramm. Remote Sens. Spat. Inf. Sci. 2016, 49, 7–86. [Google Scholar] [CrossRef]
  17. Biljecki, F.; Kumar, K.; Nagel, C. CityGML Application Domain Extension (ADE): Overview of developments. Open Geospat. Data, Softw. Stand. 2018, 3, 13. [Google Scholar] [CrossRef] [Green Version]
  18. Kolbe, T.H.; Kutzner, T.; Smyth, C.S.; Nagel, C.; Roensdorf, C.; Heazel, C. OGC 20-010 OGC City Geography Markup Language (CityGML) Part 1: Conceptual Model Standard. 2021. Available online: https://docs.ogc.org/is/20-010/20-010.html (accessed on 1 August 2022).
  19. Kutzner, T.; Chaturvedi, K.; Kolbe, T.H. CityGML 3.0: New Functions Open Up New Applications. PFG 2020, 88, 43–61. [Google Scholar] [CrossRef] [Green Version]
  20. Chaturvedi, K.; Kolbe, T.H. A requirement analysis on extending semantic 3D City models for supporting time-dependent properties. ISPRS Ann. Photogramm. Remote Sens. Spat. Inf. Sci. 2019, 4, 19–26. [Google Scholar] [CrossRef] [Green Version]
  21. Konde, A.; Tauscher, H.; Biljecki, F.; Crawford, J. Floor plans in CityGML. ISPRS Ann. Photogramm. Remote Sens. Spat. Inf. Sci. 2018, 4, 25–32. [Google Scholar] [CrossRef] [Green Version]
  22. Löwner, M.O.; Gröger, G.; Benner, J.; Biljecki, F.; Nagel, C. Proposal for a new LoD and multi-representation concept for CITYGML. ISPRS Ann. Photogramm. Remote Sens. Spat. Inf. Sci. 2016, 4, 3–12. [Google Scholar] [CrossRef]
  23. Beil, C.; Ruhdorfer, R.; Coduro, T.; Kolbe, T. Detailed Streetspace Modelling for Multiple Applications: Discussions on the Proposed CityGML 3.0 Transportation Model. ISPRS Int. J. Geo-Inf. 2020, 9, 603. [Google Scholar] [CrossRef]
  24. Beil, C.; Kolbe, T.H. Combined modelling of multiple transportation infrastructure within 3D city models and its implementation in CityGML 3.0. ISPRS Ann. Photogramm. Remote Sens. Spat. Inf. Sci. 2020, 4, 29–36. [Google Scholar] [CrossRef]
  25. Geoforum. Available online: https://geoforum.pl/news/29209/model-3d-poznania-gotowy-do-pobrania (accessed on 1 August 2022).
  26. Ciupa, S. Poznań w praktycznym modelu 3D. Przegląd Komunal. 2019, 4, 66–68. [Google Scholar]
  27. Kreisel, W.; Marsden, P.; Reeh, T. Die Landschaft Interpretieren: Interdisziplinäre Ansätze; ZELTForum-Göttinger Schriften Zu Landschaftsinterpretation und Tourismus; Göttingen University: Göttingen, Germany, 2021. [Google Scholar] [CrossRef]
  28. Lach, R.; Nawrocki, K.; Padee, A.; Zbyszewski, B.; Lessaer, S.; Sobieraj, L. A Shift from 2-D design Paradigm of XIX-Century to 3D/CityGML, BIM, 3D Printing and some of Smarter Cities in Poland. REAL CORP 2012 SMART ME UP! How to Become and Stay a Smart City, and does this improve Quality of Life? In Proceedings of the 21st International Conference on Urban Planning, Regional Development and Information Society, Hamburg, Germany, 22–24 June 2016; pp. 1015–1028. [Google Scholar]
  29. Tao, W. Interdisciplinary urban GIS for smart cities: Advancements and opportunities. Geo-spatial Inf. Sci. 2013, 16, 25–34. [Google Scholar] [CrossRef]
  30. Soon, K.H.; Khoo, V.H.S. Citygml modelling for singapore 3d national mapping. ISPRS Int. Arch. Photogramm. Remote Sens. Spat. Inf. Sci. 2017, 42, 37–42. [Google Scholar] [CrossRef] [Green Version]
  31. Berlin 3D–Downloadportal. Available online: http://www.businesslocationcenter.de/berlin3d-downloadportal/?lang=en#/export (accessed on 1 August 2022).
  32. Trojrozmerný Model Budov. Available online: http://www.archinfo.sk/diskusia/blog/architektura-vseobecne/magistrat-bratislavy-zverejnil-prve-styri-3d-mapove-aplikacie-zachytavajuce-mesto.html (accessed on 1 August 2022).
  33. 3D-Stadtmodell Bern. Available online: https://map.bern.ch/3d-stadtmodell/ (accessed on 1 August 2022).
  34. Helsingin 3D-Kaupunkimallit. Available online: http://kartta.hel.fi/3d/#/ (accessed on 1 August 2022).
  35. VISOR 3D Comunidad de Madrid. Available online: http://idem.madrid.org/visor/3D/ (accessed on 1 August 2022).
  36. NYC Detailed Road Model. Available online: http://linkd.pl/pffs4 (accessed on 1 August 2022).
  37. Géoportail. Available online: http://www.geoportail.gouv.fr/plan/75056/paris (accessed on 1 August 2022).
  38. Poznań. Available online: http://sip.poznan.pl/model3d/#/legend (accessed on 1 August 2022).
  39. 3D Model Prahy. Available online: http://app.iprpraha.cz/apl/app/model3d/ (accessed on 1 August 2022).
  40. One Map 3.0. Available online: http://www.onemap3d.gov.sg/main/ (accessed on 1 August 2022).
  41. 3D Smart City–Skopje. Available online: https://gdi-sk.maps.arcgis.com/apps/Styler/index.html?appid=98d55ddd1bb64d8a8b787b2fa5634580&fbclid=IwAR2uoINqSvoDaRJ5xSmAAMsutRQHJ93OlbTUHeYMK7_9IiFSB3yOCxpvtZM (accessed on 1 August 2022).
  42. 3D-Stadtmodell der Stadt Soest. Available online: https://soest.virtualcitymap.de/#/ (accessed on 1 August 2022).
  43. Maa-Amet 3D. Available online: http://3d.maaamet.ee/kaart/ (accessed on 1 August 2022).
  44. 3D Vilnius. Available online: https://3d.vilnius.lt/scenos/3d-miesto-maketas (accessed on 27 October 2022).
  45. System Informacji Przestrzennej Wrocławia. Available online: http://gis.um.wroc.pl/imap3d/ (accessed on 1 August 2022).
  46. ZG3D: 3D Model Grada Zagreba. Available online: https://zagreb.gdi.net/zg3d/?fbclid=IwAR0lLigxq8bqGukHXp_WhCepDmCMSTJE3CiVIDOPN4MoWua2UxT0UlP7JZY (accessed on 1 August 2022).
  47. Santhanavanich, T.; Coors, V. CityThings: An integration of the dynamic data to the 3D city model. Environ. Plan. B Urban Anal. City Sci. 2021, 48, 417–432. [Google Scholar] [CrossRef]
  48. European Parliament; Council of the European Union. Directive 2007/2/EC of the European Parliament and of the Council of 14 March 2007 Establishing an Infrastructure for Spatial Information in the European Community (INSPIRE); Publications Office of the European Union: Luxembourg, 2007. [Google Scholar]
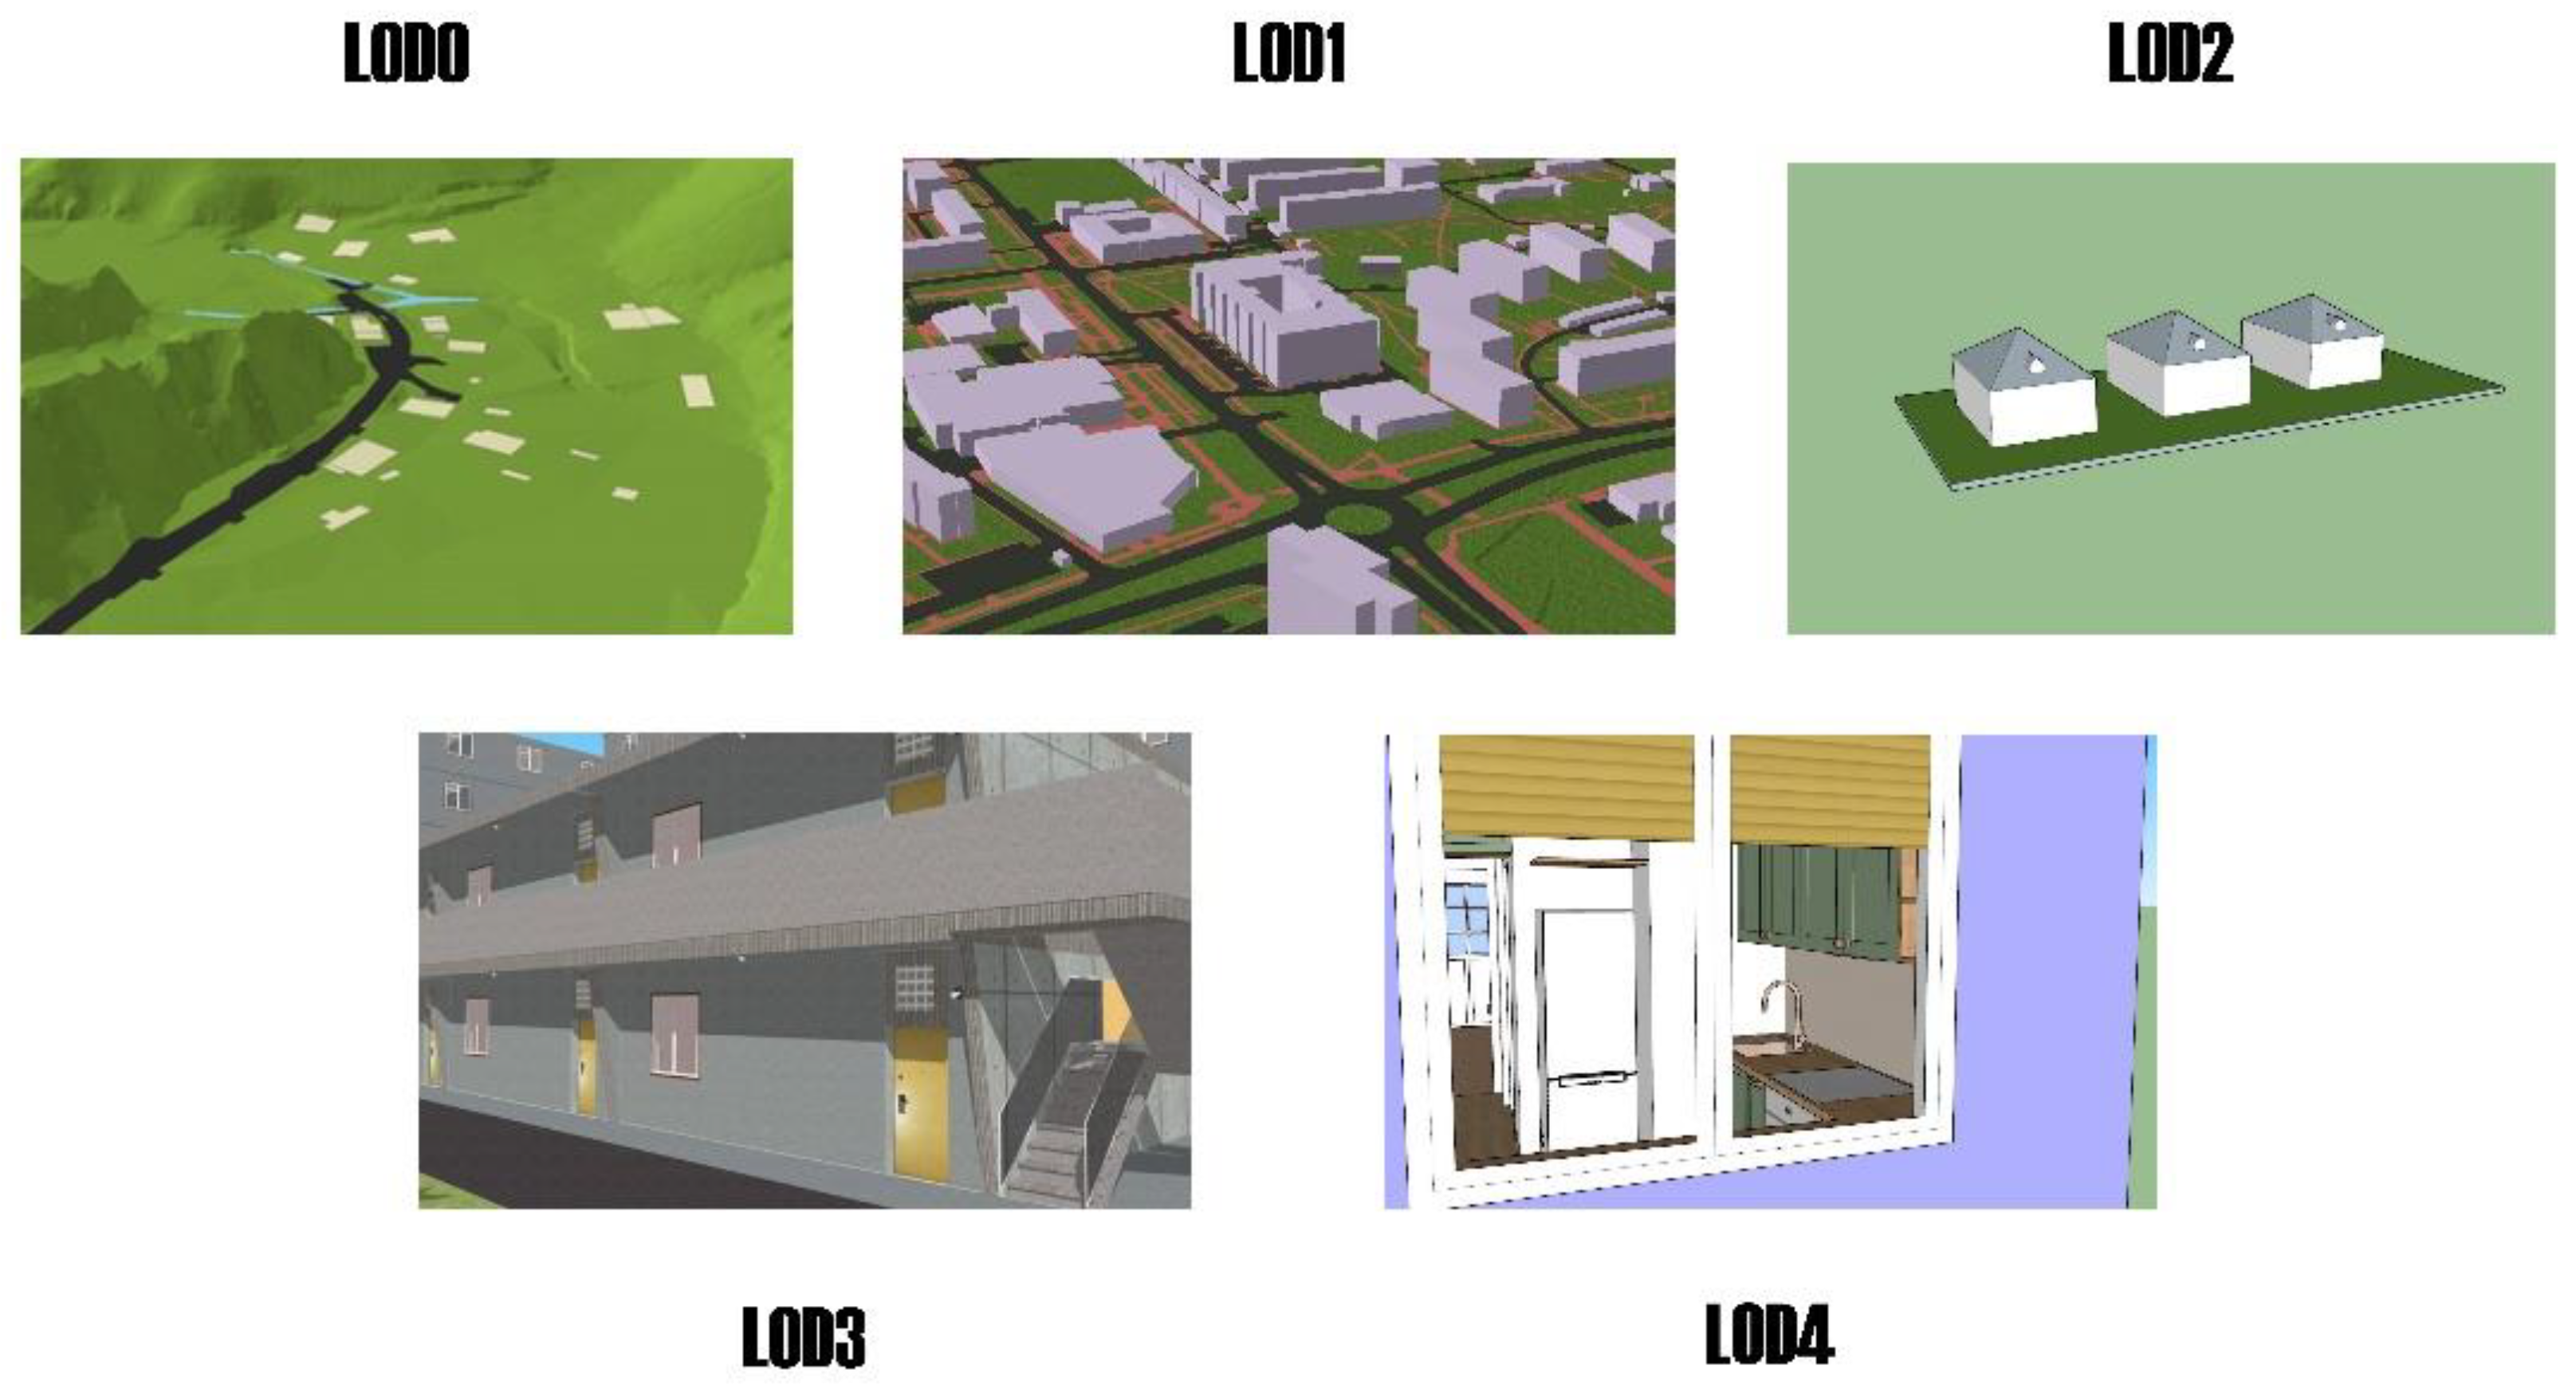
Figure 1. Level of Detail classification for CityGML 2.0. Source: own elaboration.
Sustainability 14 15578 g001
Figure 2. Location of the analysed city geoportals on the world map. Source: own elaboration.
Sustainability 14 15578 g002
Figure 3. The views of selected geoportals compared with photographic images of respective objects of architecture. (a) Charles Bridge in Prague. Source: 3D model of Prague; (b) Image of the Charles Bridge in Prague. Source: own elaboration; (c) A panorama of Tallinn. Source: Maa-amet 3D; (d) A picture of the panorama of Tallinn. Source: own elaboration; (e) The Cathedral Basilica of St Stanislaus and St Ladislaus of Vilnius Source: 3D Vilnius; (f) Image of the Cathedral Basilica of St Stanislaus and St Ladislaus of Vilnius Source: own elaboration; (g) Buildings of Berlin. Source: Berlin 3D–Download portal; (h) Picture of buildings in Berlin. Source: own elaboration; (i) Cathedral of St Mary Magdalene in Wrocław. Source: The Spatial Information System of Wrocław; (j) Image of the Cathedral of St Mary Magdalene in Wrocław. Source: own elaboration; (k) Empire State Building. Source: NYC Detailed Road Model; (l) Picture of the Empire State Building. Source: own elaboration.
Sustainability 14 15578 g003aSustainability 14 15578 g003b
Table 1. List of evaluated geoportals. Source: own elaboration.
No.ContinentCountryCityLinks to Geoportals
1EuropeGermanyBerlinhttps://www.businesslocationcenter.de/berlin3d-downloadportal/?lang=en#/export (accessed on 1 August 2022) [31]
2EuropeSlovakiaBratislavahttps://www.archinfo.sk/diskusia/blog/architektura-vseobecne/magistrat-bratislavy-zverejnil-prve-styri-3d-mapove-aplikacie-zachytavajuce-mesto.html (accessed on 1 August 2022) [32]
3EuropeSwitzerlandBernhttps://map.bern.ch/3d-stadtmodell/ (accessed on 1 August 2022) [33]
4EuropeFinlandHelsinkihttps://kartta.hel.fi/3d/#/ (accessed on 1 August 2022) [34]
5EuropeSpainMadridhttps://idem.madrid.org/visor/3D/ (accessed on 1 August 2022) [35]
6North AmericaUSANew Yorkhttps://linkd.pl/pffs4 (accessed on 1 August 2022) [36]
7EuropeFranceParishttps://www.geoportail.gouv.fr/plan/75056/paris (accessed on 1 August 2022) [37]
8EuropePolandPoznańhttp://sip.poznan.pl/model3d/#/legend (accessed on 1 August 2022) [38]
9EuropeCzech RepublicPrague https://app.iprpraha.cz/apl/app/model3d/ (accessed on 1 August 2022) [39]
10AsiaSingaporeSingaporehttps://www.onemap3d.gov.sg/main/ (accessed on 1 August 2022) [40]
11EuropeNorth MacedoniaSkopjehttps://gdi-sk.maps.arcgis.com/apps/Styler/index.html?appid=98d55ddd1bb64d8a8b787b2fa5634580&fbclid=IwAR2uoINqSvoDaRJ5xSmAAMsutRQHJ93OlbTUHeYMK7_9IiFSB3yOCxpvtZM (accessed on 1 August 2022) [41]
12EuropeGermanySoesthttps://soest.virtualcitymap.de/#/ (accessed on 1 August 2022) [42]
13EuropeEstoniaTallinnhttps://3d.maaamet.ee/kaart/ (accessed on 1 August 2022) [43]
14EuropeLithuaniaVilniushttps://3d.vilnius.lt/scenos/3d-miesto-maketas (accessed on 27 October 2022) [44]
15EuropePolandWrocławhttps://gis.um.wroc.pl/imap3d/ (accessed on 1 August 2022) [45]
16EuropeCroatiaZagrebhttps://zagreb.gdi.net/zg3d/?fbclid=IwAR0lLigxq8bqGukHXp_WhCepDmCMSTJE3CiVIDOPN4MoWua2UxT0UlP7JZY (accessed on 1 August 2022) [46]
Table 2. Ranking and scoring of 3D geoportals of selected cities. Source: own elaboration.
Ranking of the Analysed Geoportals with Scores Assigned for Respective Criteria
Ranking PositionCityLoD1LoD2LoD3TexturesBridgesWalkwaysCurbsRoadwaysCar ParksVegetationOther Elements of the Urban SpaceWaterbodySpatial PlanningPoint CloudMeshExport FormatsWMSDynamiserNatural LightIoTTotal Points
1Poznań010.51000001101111100110.5
2Zagreb010010000101110.5010108.5
3Vilnius010.5010000100101001107.5
4New York010001111000000011007
4Wrocław110010000101000010107
5Bern01001000011100.50000106.5
6Prague010010000101100000106
6Singapore010100000010000001116
7Berlin010100000000001110005
7Helsinki010100000000001100105
7Soest010100000010001100005
8Tallinn1100.500000000000100104.5
9 Bratislava10.50100000100000000003.5
10Paris100000000000100000002
10Skopje010000000000100000002
11Madrid00.50100000000000000001.5
Table 3. The number of occurrences of the examined elements in three-dimensional geoportals of cities. Source: own elaboration.
The Number of Occurrences of the Examined Elements in Three-Dimensional Geoportals of Cities
ElementsNumber of Occurrences
LoD215
textures8
natural light8
vegetation7
spatial planning6
mesh6
bridges5
export formats5
WMS5
LoD14
other elements of the urban space4
waterbody4
point cloud3
dynamizer3
LoD32
IoT2
walkways1
curbs1
roadways1
car parks1
tunnels0
Publisher’s Note: MDPI stays neutral with regard to jurisdictional claims in published maps and institutional affiliations.