Article

Study on the Optimal Volume Fracturing Design for Horizontal Wells in Tight Oil Reservoirs

1
Petroleum Engineering College, Xi’an Shiyou University, Xi’an 710065, China
2
Oil Recovery Plant No.12, PetroChina Changqing Oilfield Company, Qingyang 745400, China
3
Oil and Gas Engineering Research Institute of Jilin Oilfield, Songyuan 138000, China
*
Authors to whom correspondence should be addressed.
Sustainability 2022, 14(23), 15531; https://doi.org/10.3390/su142315531
Submission received: 19 October 2022 / Revised: 12 November 2022 / Accepted: 18 November 2022 / Published: 22 November 2022
(This article belongs to the Special Issue Numerical Analysis of Rock Mechanics and Crack Propagation)

Abstract

:
The application of horizontal well volume fracturing technology is an important method for enhancing oil recovery in tight oil reservoirs. However, the influence mechanism of the fracture placement scheme (FPC) on postfracturing productivity is still unclear. Based on the theory of the black oil model, combined with the reservoir stimulation characteristics of horizontal well volume fracturing in tight oil reservoirs, this paper established a postfracturing reservoir production simulation model. History fitting was used to verify the accuracy of the production model simulations. A series of numerical simulations was carried out to study the influence mechanisms of the fracture parameters and FPC on productivity. The simulation results show that compared with the fracture conductivity, the fracture length and number are the main parameters affecting tight oil reservoir productivity. Selecting a reasonable fracture length and number can realize the economical and efficient production of tight oil reservoir volume fracturing. Compared with the traditional fracture equal-length scheme, an FPC with an uneven fracture length can increase the cumulative oil production of oil wells. Under the condition of the same total fracture length, the scheme with a staggered distribution of long fractures and short fractures has the largest cumulative oil production over five years. A reasonable well spacing can greatly reduce the impact of interwell interference on postfracturing dual branch horizontal well productivity. When dual branch horizontal well fractures are alternately distributed, the postfracturing productivity is higher. The production simulation model established in this paper provides a method to accurately evaluate the productivity of horizontal wells after volume fracturing, which can provide guidance for the optimization of hydraulic fracturing operation parameters.

1. Introduction

As one of the most important methods for increasing production in unconventional reservoirs, hydraulic fracturing technology has been used in more than 80% of oil and gas wells since its successful implementation in the Hugoton Oilfield, Kansas, USA, in 1947 [1]. Unconventional tight oil reservoirs are widely distributed with strong heterogeneity and low permeability and porosity; therefore, efficient exploitation can be achieved only by means of horizontal well volume fracturing technology. Ma et al. [2] carried out a volume fracturing test on 17 vertical and six horizontal wells in the Sulige Gas Field. Compared with that of unfractured wells, the average daily production of vertical wells increased by 46%, and that of horizontal wells increased by 6 t. Yu et al. [3] carried out volume fracturing on 12 horizontal wells in the Chang 7 tight oil reservoir, and the stimulated reservoir volume around the treated wells was 4.9 times greater than that induced by conventional fracturing. Zhao et al. [4] implemented stimulated reservoir volume (SRV) fracturing on a well (Well 325) in a tight sandstone reservoir. The average daily oil production of the well was 7.1 times higher than that of the unfractured well and 3.5 times higher than that of the steady-state well. Wang et al. [5] carried out large-scale volume fracturing tests of horizontal wells in ultralow permeability tight reservoirs in the Ordos Basin. It is predicted that the final recovery rate will increase from 5.3 to 12.3% in this area. The above production examples have shown that horizontal well volume fracturing technology can greatly increase the oil and gas production, and the development of this technology will have important implications for oilfield production.
Horizontal well volume fracturing technology can realize reservoir volume reformation by fracturing complex fracture networks in reservoirs to greatly improve reservoir permeability and oil and gas recovery [6]. Ma et al. and Mayerhofer et al. [7,8] first proposed the concept of SRV fracturing by studying the results of the microseismic monitoring and fracturing of Barnett shale. Shale gas production has increased from 2% of total natural gas production in the United States in 2000 to 40% in 2012, and has become one of the three key technologies in North America for achieving a “shale gas revolution” [9]. After studying its international application, the volume fracturing technology for tight oil reservoirs has been successfully applied in many oil and gas fields in China, such as the Sulige Gas Field, the Xinjiang Oilfield, and the Shengli Oilfield [2,10,11]. The field fracturing results show that the larger the stimulated volume of the tight oil reservoir after fracturing is, the higher the tight oil productivity. Volume fracturing parameters have an important effect on fracture network shape and productivity. Optimizing the volume fracturing scheme is of great significance for guiding reservoir fracture network fracturing and ensuring the effective development of tight oil reservoirs [12,13,14].
At present, the volume fracturing technology of horizontal wells in tight oil reservoirs is mainly aimed at optimizing the fracture parameters and fracture placement scheme (FPC). Fracture parameter aspects: By developing a first-order discrete fracture network (DFN) model for predicting fracture geometry, Bazan et al. [15] investigated the effects of fracture parameters and interfracture interference on fracture geometries and well production. Roussel and Sharma [16] established a horizontal well fracturing numerical model of the stress interference induced by fractures. The simulation results of this model show that stress interference increases with increasing fracture number and is affected by the fracturing sequence. Jabbari and Zeng [17] optimized fracture parameters by combining a numerical simulation method and the proper cash flow model. Yu and Sepehrnoori [18] proposed a project to obtain the optimal gas production by optimizing the uncertain factors. Studies have found that fracture conductivity has a significant effect on productivity and that the fracture spacing has a more important influence on productivity than that of fracture half-length at the early stage of production. Al-Fatlawi et al. [19] established an equivalent simplified homogeneous reservoir simulation model to optimize the fracture number and half-length with net present value (NPV) as the objective function. Shirbazo et al. [20] studied the influence of hydraulic fracture parameters on horizontal well productivity and assumed that the fracture stages and conductivity have a significant influence on production improvement. Zhao et al. [21] studied the effect of cluster and stage spacing on horizontal well production and proposed an optimization scheme to obtain the maximum capacity. Kolawole et al. [22] investigated the impact of construction parameters and fracture parameters on the hydraulic fracturing process and suggested an efficient hydraulic fracturing design method to achieve the maximum recovery. Wang et al. [23] applied the finite element numerical simulation method to optimize the half-length and stage of fracture of three types of reservoirs in the Ma 18 block of the Aihu Oilfield. The aforementioned studies have demonstrated that fracturing parameters have an important influence on the productivity of horizontal wells after fracturing. However, these studies did not consider the effect of induced branch fractures around artificial fractures, and most production models only consider the effect of artificial fractures on reservoir production after fracturing.
FPC aspects: By using three gradient-based optimization algorithms, Holt [24] optimized the layout and the number of hydraulic fractures along a horizontal wellbore. The results show that ensemble-based optimization (EnOpt) is feasible. Wilson and Durlofsky [25] used a generalized pattern search algorithm to optimize the locations of fractures along horizontal wellbores. Jahandideh and Jafarpour [26] developed a heterogeneous geology model and investigated whether fractures should be placed at the most brittle sections of the reservoir. Safari et al. [27] developed a fracture-propagation model to study the relationship between final recovery and the communication between wells by adjusting the horizontal well spacing. Shahkarami and Wang [28] optimized the horizontal well spacing using a commercial reservoir simulator. He et al. [29] proposed a semianalytical methodology for diagnosing the locations of underperforming hydraulic fractures and found that the total production contribution mainly comes from the fractures at both ends of the horizontal wellbore, so fractures occurred in the form of a spindle shape. Peshcherenko et al. [30] built a hydraulic fracture development model for determining the best fracture placement characteristics. Deng et al. [31] presented a new automatic integrated optimization algorithm with NPV as the objective function. The simulation results show that the optimum fracture placement is a spindle-like placement, the NPV of which is much higher than that of uniform fracture placement. Most of the above-mentioned studies were based on conventional FPC to simulate postfracturing productivity and optimize parameters. However, with the development of horizontal well infill fracturing technology, the influence of fractures’ competitive propagation pattern on postfracturing productivity cannot be ignored. The effect of complex fracture placement scheme on productivity under the competitive propagation of fractures is worth studying.
The aforementioned studies have demonstrated that the volume fracturing technology of horizontal wells plays a major role in improving the recovery rate of tight oil reservoirs. However, how to optimize the design of a volume fracturing scheme is still unclear. Therefore, aiming at the reservoir stimulation characteristics of horizontal well volume fracturing in tight oil reservoirs, based on the theory of the black oil model, this paper first established a postfracturing reservoir production simulation model. Then, well data from tight oil reservoirs in the Changqing Oilfield, China, were used for history fitting. The fitting results verified the accuracy of the model in postfracturing production simulation. Finally, based on the model, the influence mechanisms of the fracture parameters and FPC on the productivity of tight oil reservoirs after volume fracturing were analyzed.

2. Numerical Model Establishment

2.1. Basic Governing Equation

Based on the basic theory of the black oil model, WellWhiz3.3 software is used to analyse the postfracturing productivity with different FPCs. The black oil model is the most widely used mathematical model in reservoir numerical simulations. It can be used to simulate and analyse the motion law of two systems of black oil containing nonvolatile components and dissolved gas containing volatile components in the reservoir [32,33]. Its basic assumptions are as follows [34,35]: (1) The fluid in the reservoir is at a constant temperature and in thermodynamic equilibrium; (2) Only oil, gas and water phases exist in the reservoir, and each fluid obeys Darcy’s law; (3) The oil and gas phases reach equilibrium instantaneously; (4) Only the water component exists in the water phase; (5) The fluid and the rock in the reservoir are compressible; and (6) The reservoir has heterogeneity.
The governing equations for the black oil formulation are [36]:
t ϕ S o B o = k k r o B o μ o p o g ρ o z q o t ϕ S w B w = k k r w B w μ w p w g ρ w z q w t ϕ S g B g + R s S o B o = k k r g B g μ g p g g ρ g z q g + R s k k r o B o μ o p o g ρ o z R s q o
The domain Ω has the boundary conditions Ω. Here, Bl, Sl, krl, μl, ρl, ql, and pl denote the formation volume factor, saturation, relative permeability, viscosity, density, well volumetric rate and pressure of phase l, respectively, where l = o, w, g (i.e., oil, gas and water). The tensor k is the permeability field, ϕ denotes the porosity, g is the formation volume factor, the reservoir depth is denoted by z, and Rs describes the solubility of gas in oil.
Saturations are constrained by:
S o + S w + S g = 1
The three phase pressures pw, po, and pg are related by two independent capillary pressure relations.
p c g o = p g p o S o , S g , S w
p c w o = p w p o S o , S g , S w

2.2. Production Model Establishment and Validation

2.2.1. Production Model Estabilshment

As shown in Figure 1a, a large number of microfractures induced by volume fracturing around the main fractures can greatly increase the permeability of this reservoir area and provide dominant flow channels for oil and gas. As shown in Figure 1b, a specified range of high permeability areas is set around the main fractures of the reservoir to simulate the effect of volume fracturing in tight oil reservoirs. The brown area (Figure 1b) is the reservoir matrix area that is not stimulated by volume fracturing, and the blue area is the stimulated area around the main fracture where the permeability is higher than that of the reservoir matrix.
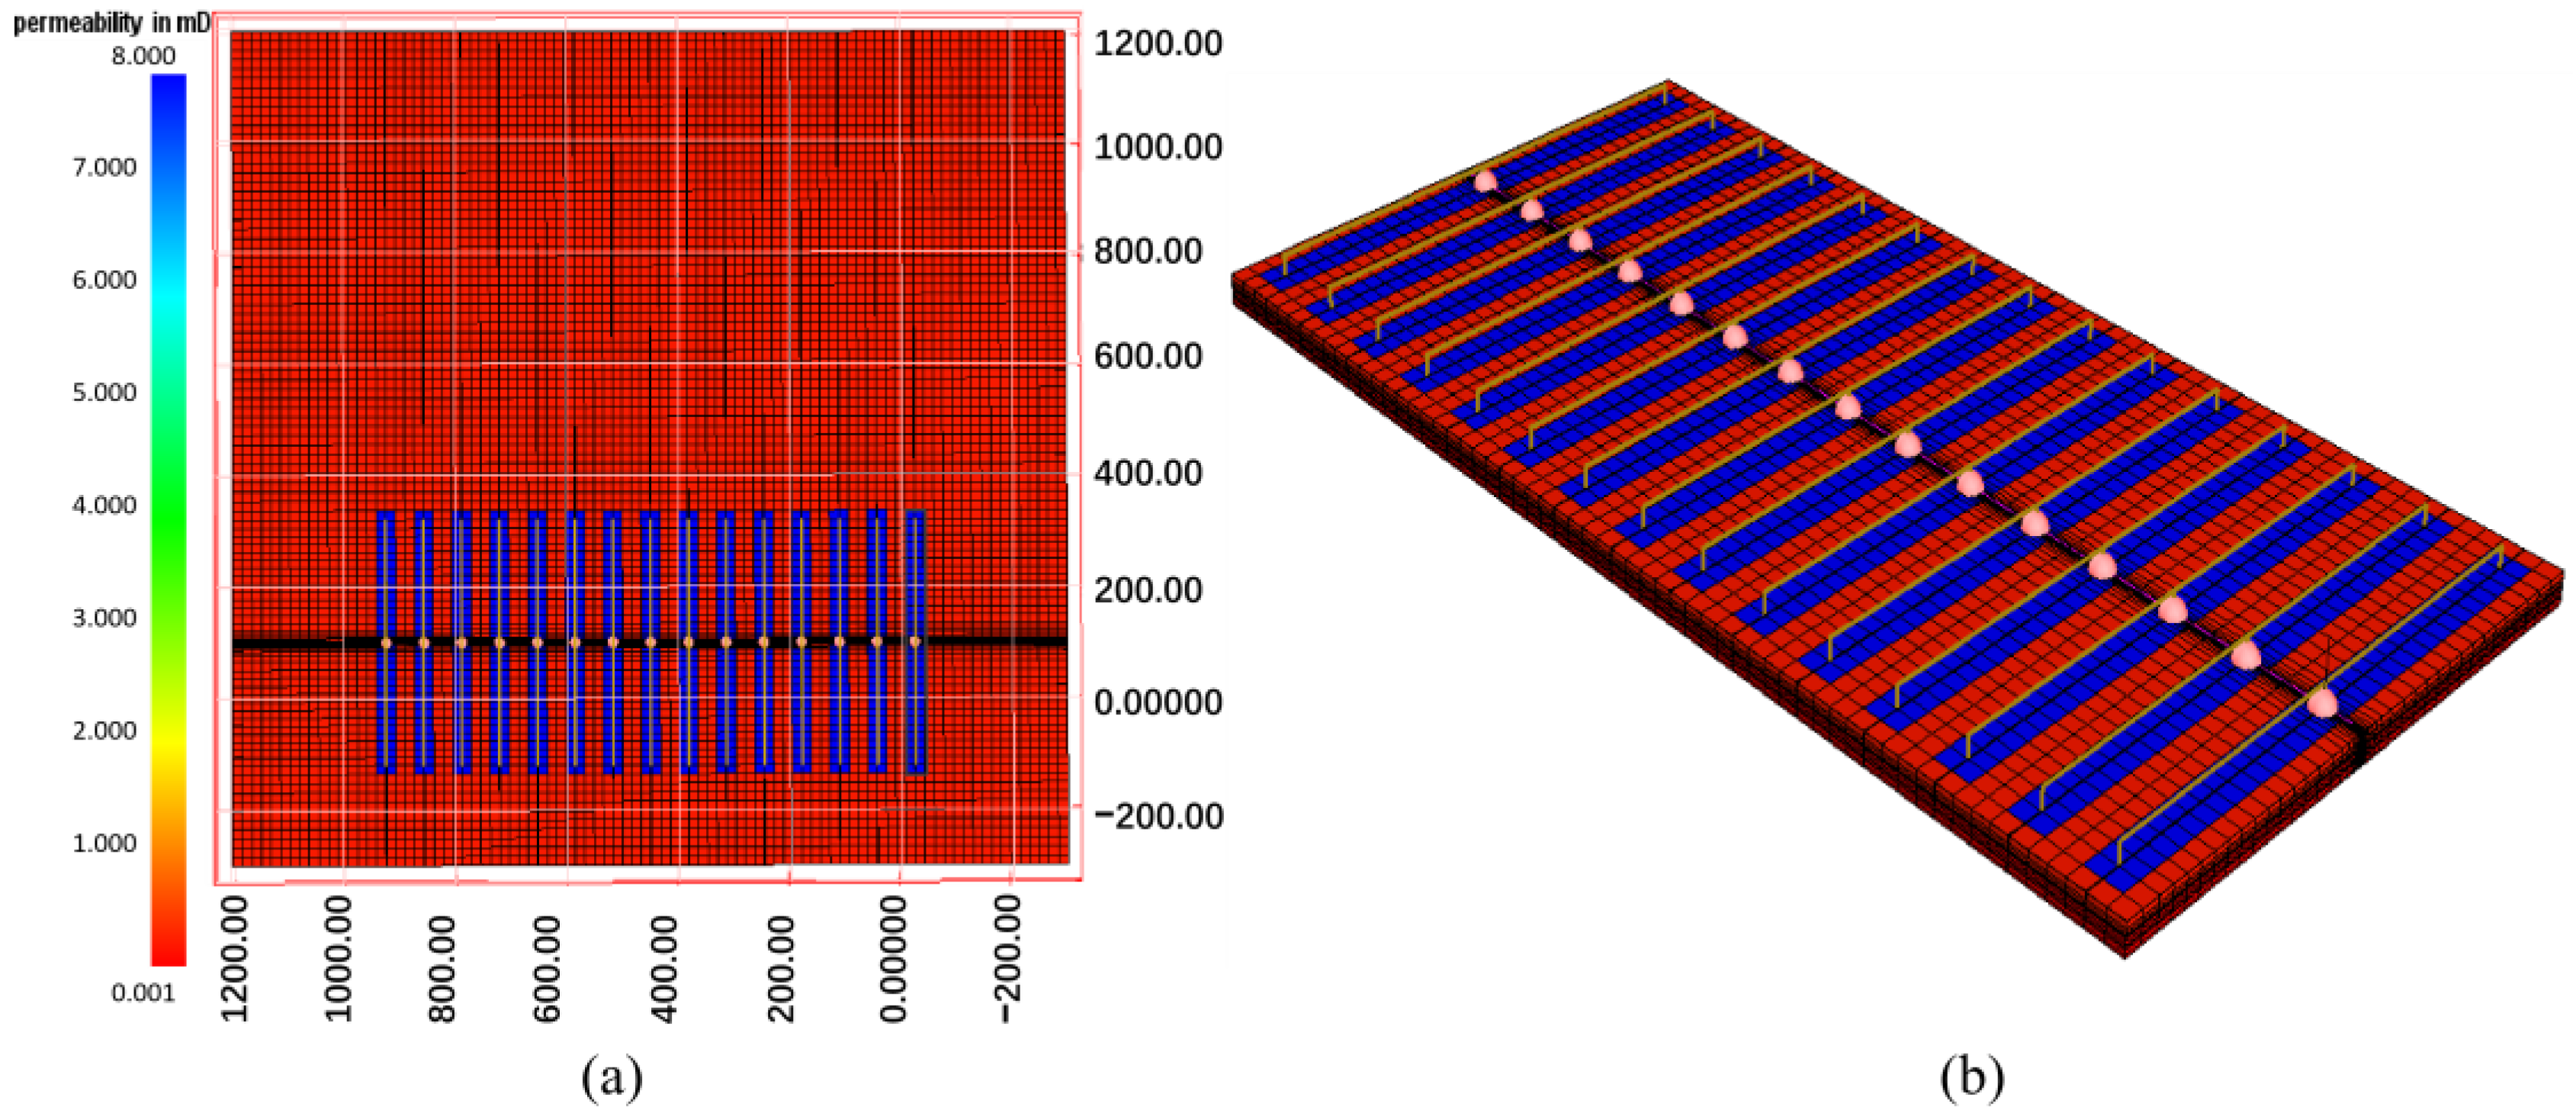
In this paper, we take the Z-2 well region of the tight oil reservoir in the Changqing Oilfield, China, as the research object to study the optimal FPC design. As shown in Figure 2, combined with the basic physical property data of this region, a reservoir production simulation model of well JW-1 is established by WellWhiz fracturing simulation software. A mesh encryption method is applied to simulate artificial fractures, and a local mesh encryption method is used to improve the simulation accuracy around the wellbore and fractures. The blue area in Figure 2 corresponds to the stimulated area in Figure 1b, and the red area corresponds to the area where the reservoir is not stimulated. The bandwidths w and b of the blue area are 25 m and 15 m, respectively, which are determined by the statistical average of the microseismic monitoring results in the region. Based on the basic assumptions of the black oil model, we assumed that the reservoir is at a constant temperature, so the simulations were conducted at a temperature of 59 °C.

2.2.2. Production Model Validation

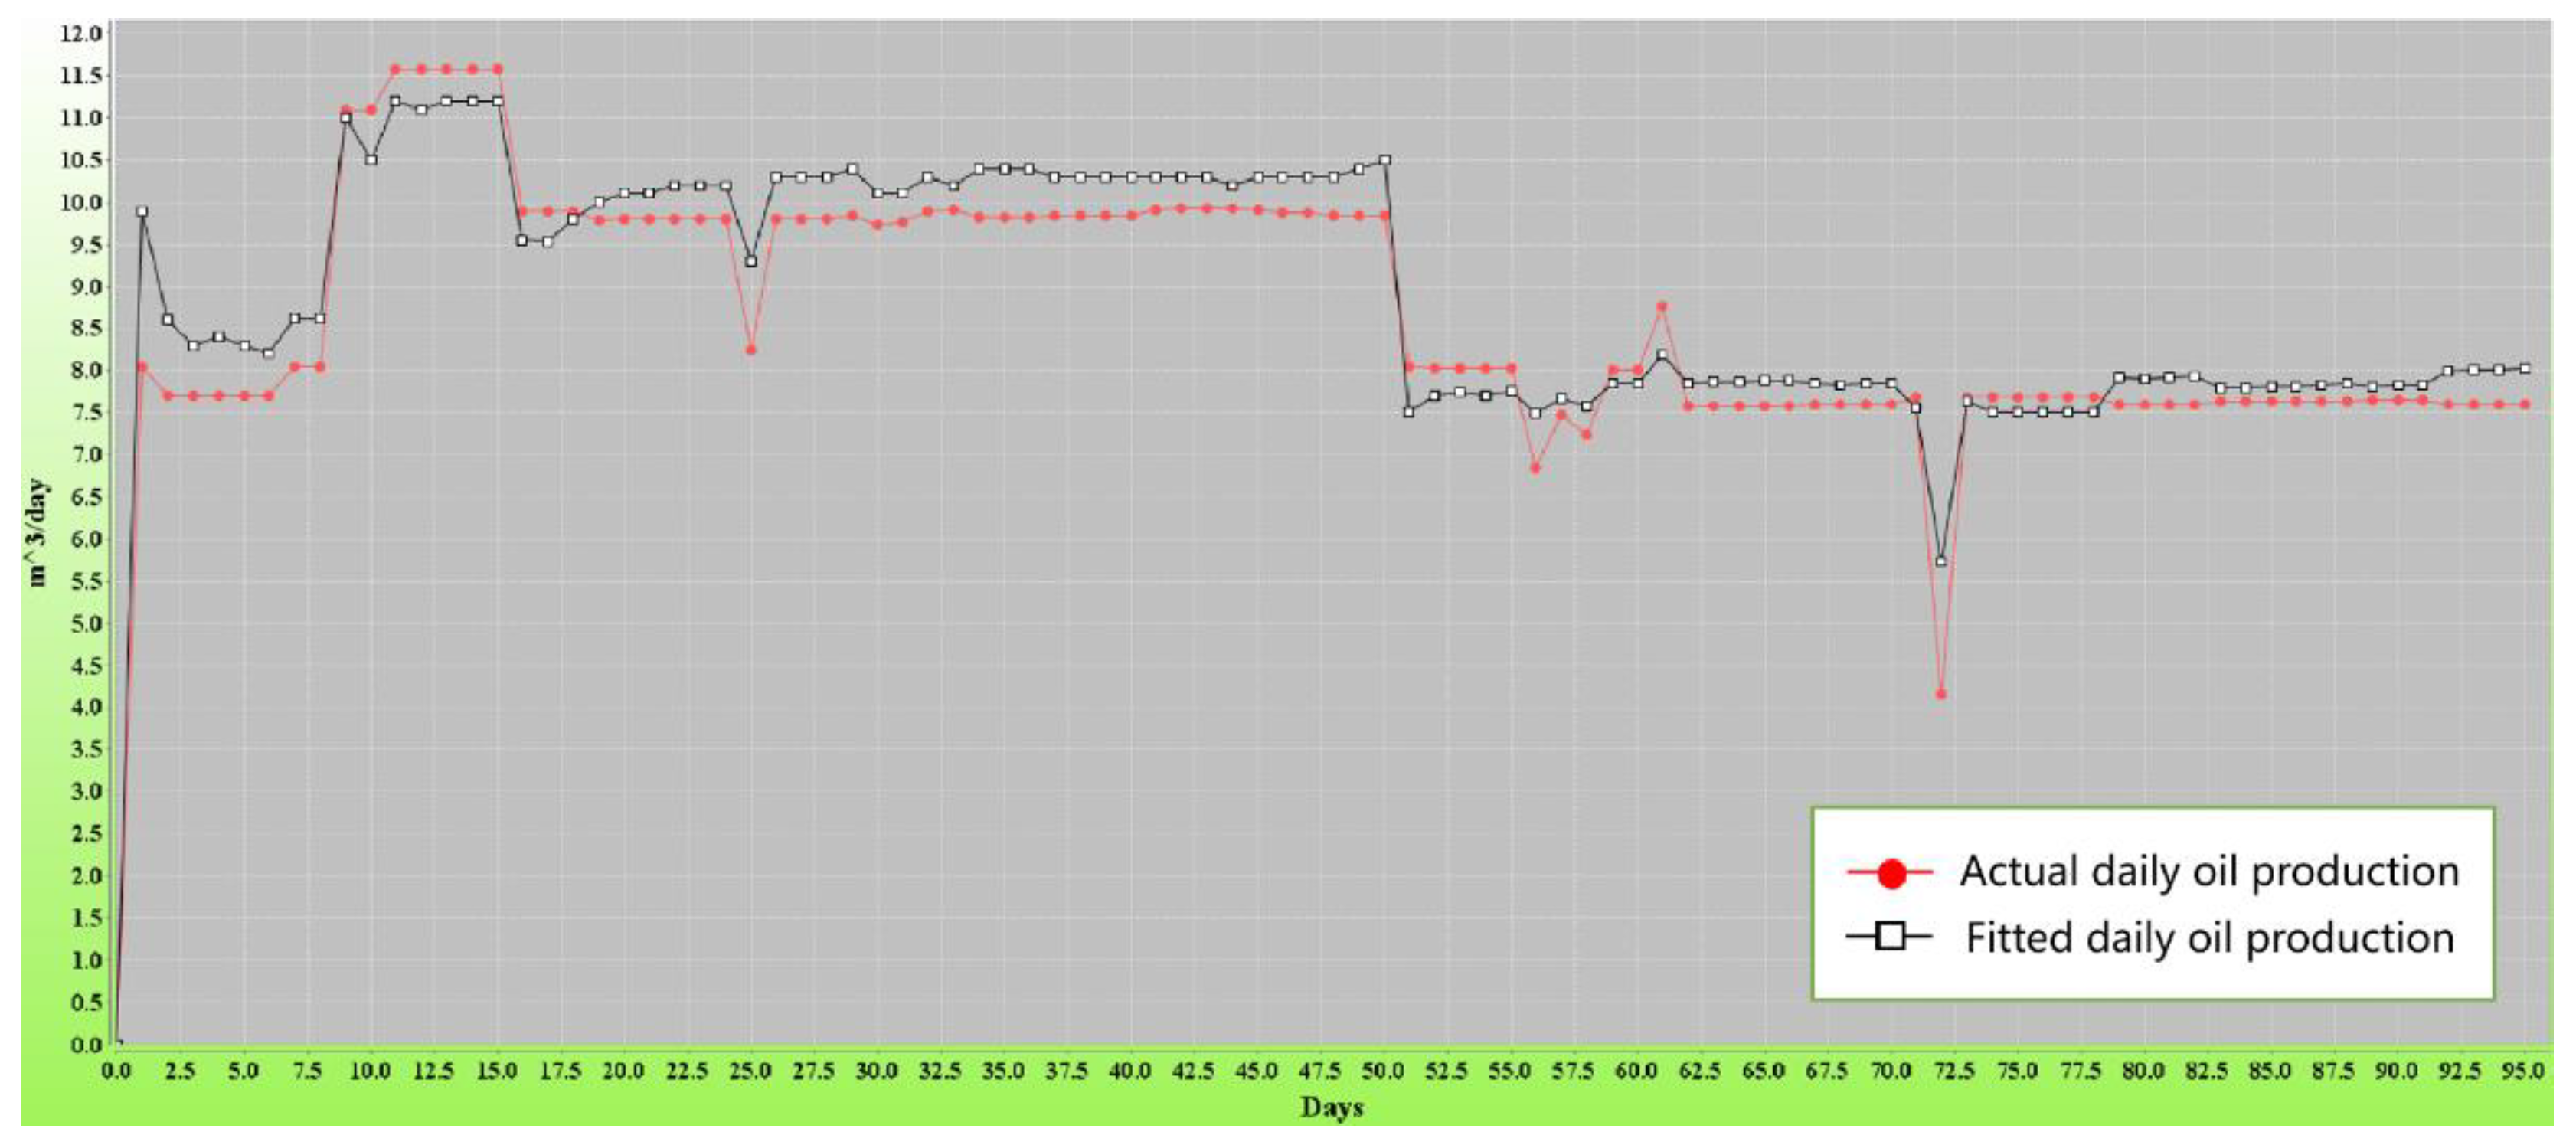
The history matching method was used to verify the model by adjusting reservoir physical parameters making the fitted curves of daily oil production and the actual production dynamic curve closer. When the average fitting error is less than 5%, we can determine that the model is reasonable and accurate [37,38]. Daily water production was set according to the production data of well JW-1, and the oil production of well JW-1 three months postfracting was simulated. The production performance data and the simulation results of well JW-1 are used for history matching, and the basic parameters of the production model and the permeability of the volume fracturing area are adjusted to make the established production model more accurately reflect the actual situation of the reservoir. The final basic parameters of the production model obtained by history fitting are listed in Table 1. Figure 3 is the history fitting curves of the daily oil production of well JW-1 in the three months. As shown in Figure 3, there are some inconsistencies between the historical fitted curve and the actual curve of daily oil production. The main reason is that the tight oil reservoir in the study region is characterized by strong heterogeneity, the reservoir physical properties changed slightly during the production process but the reservoir physical parameters in the simulation model were constant, while the general trend of the historical fitted curve and the actual curve of daily oil production is basically the same. The average fitting error is 4.3%, which is less than 5%, so the model is reasonable and accurate.

3. Results and Discussion

3.1. Optimization of Fracture Parameters

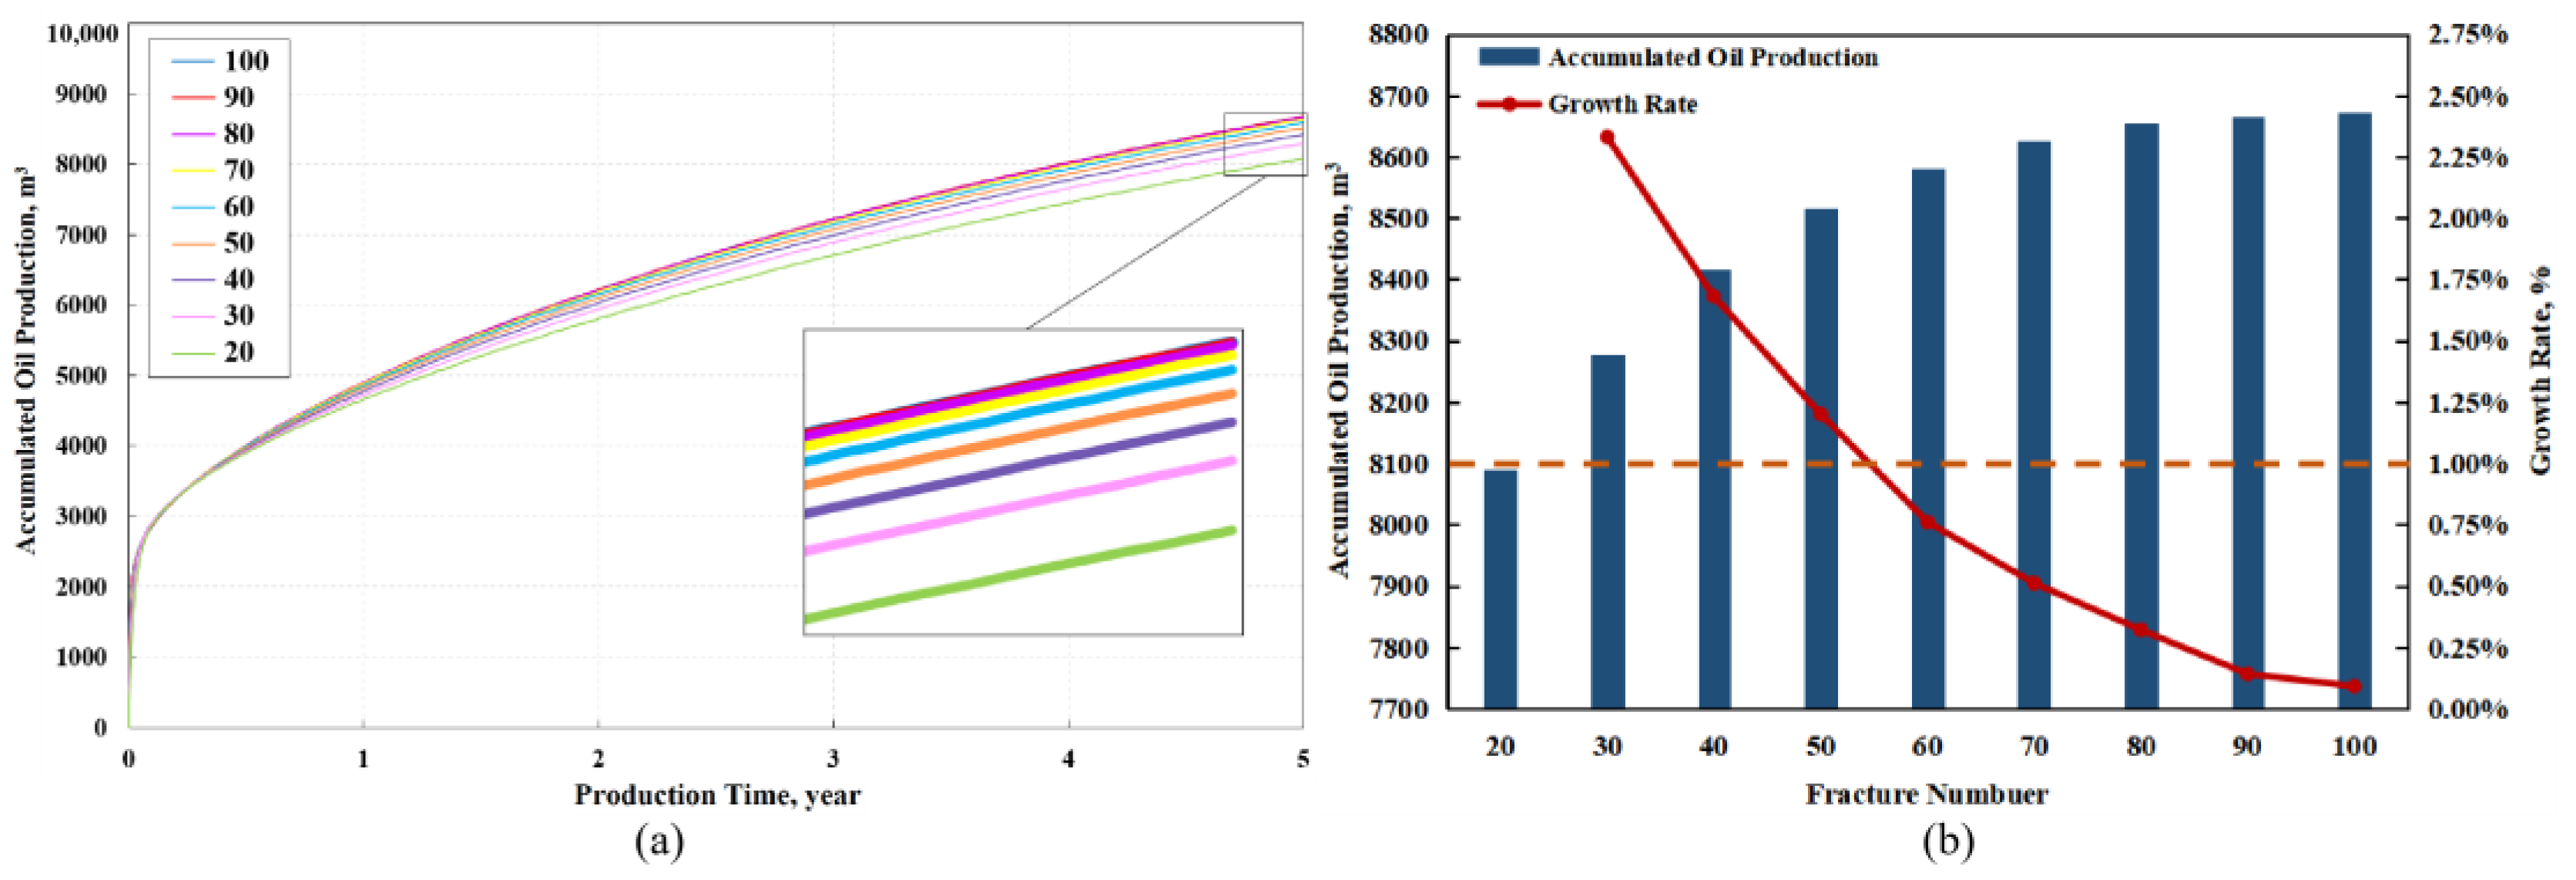
The fracture number, half-length and conductivity have significant effects on the productivity after volume fracturing [39,40]. Based on the simulation model established in the previous section, this section first analyses the influence mechanism of the fracture parameters on the productivity of tight oil reservoirs after volume fracturing. Figure 4a shows the evolution of cumulative oil production over time under different fracture numbers, and Figure 4b shows a comparison of the corresponding cumulative oil production growth rate. In the initial stage of production, the oil production under different fracture numbers increases significantly and gradually becomes slower over time. The larger the fracture number is, the higher the oil production, while the increase rate of the cumulative oil production is greatly reduced. When the fracture number exceeds 50, the growth rate is reduced to less than 1%. At this time, increasing the fracture number contributes little to the increase in oil production.
Figure 5a shows the evolution of the cumulative oil production over time under different fracture half-lengths, and Figure 5b shows a comparison of the corresponding cumulative oil production growth rate. The longer the fracture half-length is, the higher the cumulative oil production. The growth rate curve of the cumulative oil production exhibits a knee point (200 m). The growth rate decreases slightly before the knee point and significantly after the knee point. When the fracture half-length exceeds 220 m, the growth rate is reduced to less than 1%. At this time, increasing the fracture half-length contributes little to the increase in oil production.
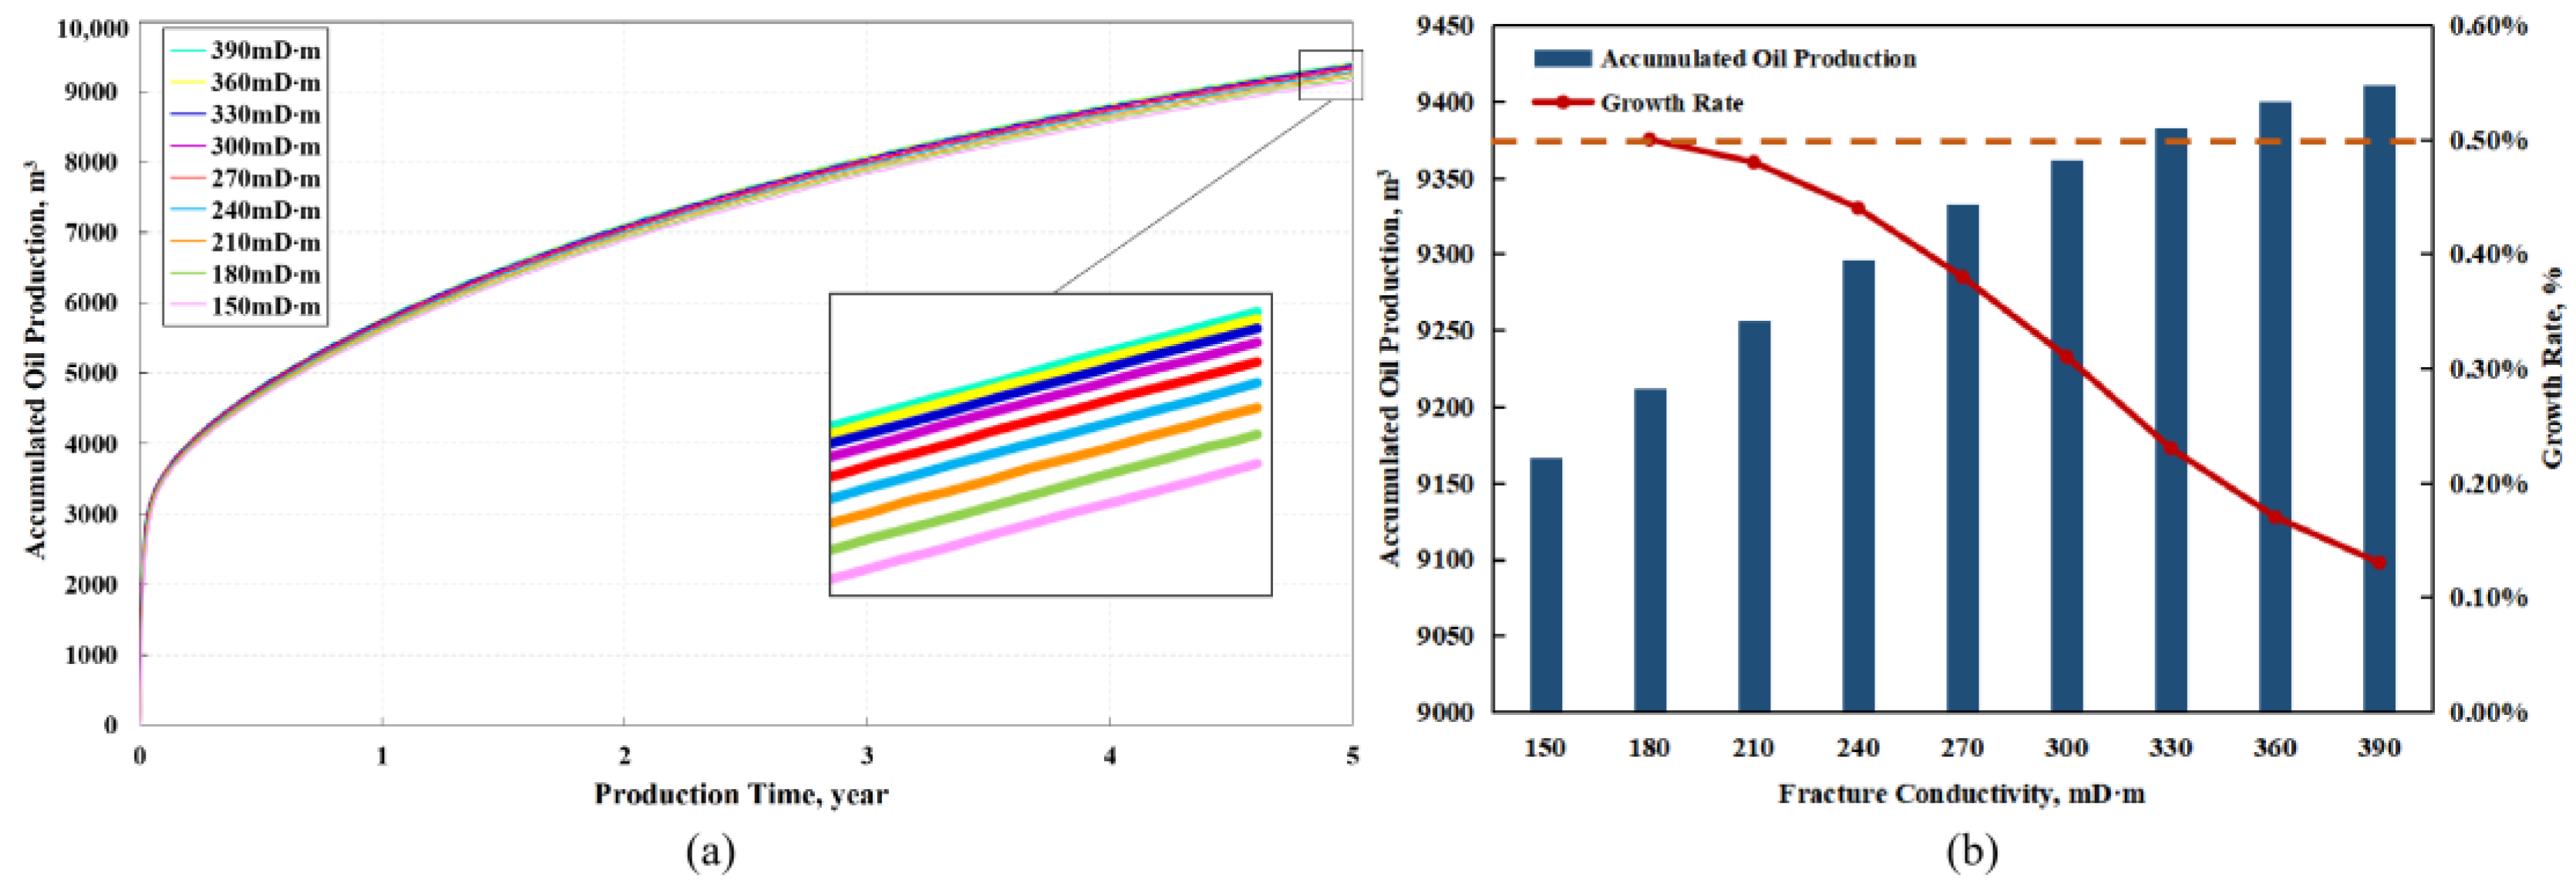
Figure 6a shows the evolution of the cumulative oil production over time under different fracture conductivities, and Figure 6b shows a comparison of the corresponding cumulative oil production growth rate. The cumulative oil production slowly increases with increasing fracture conductivity. Under different fracture conductivities, the cumulative oil production growth rate is basically below 0.5%. The increase in the fracture conductivity decreases the growth rate. Compared with improving the fracture number and half-length, improving the fracture conductivity contributes little to the cumulative oil production 5 years after fracturing.
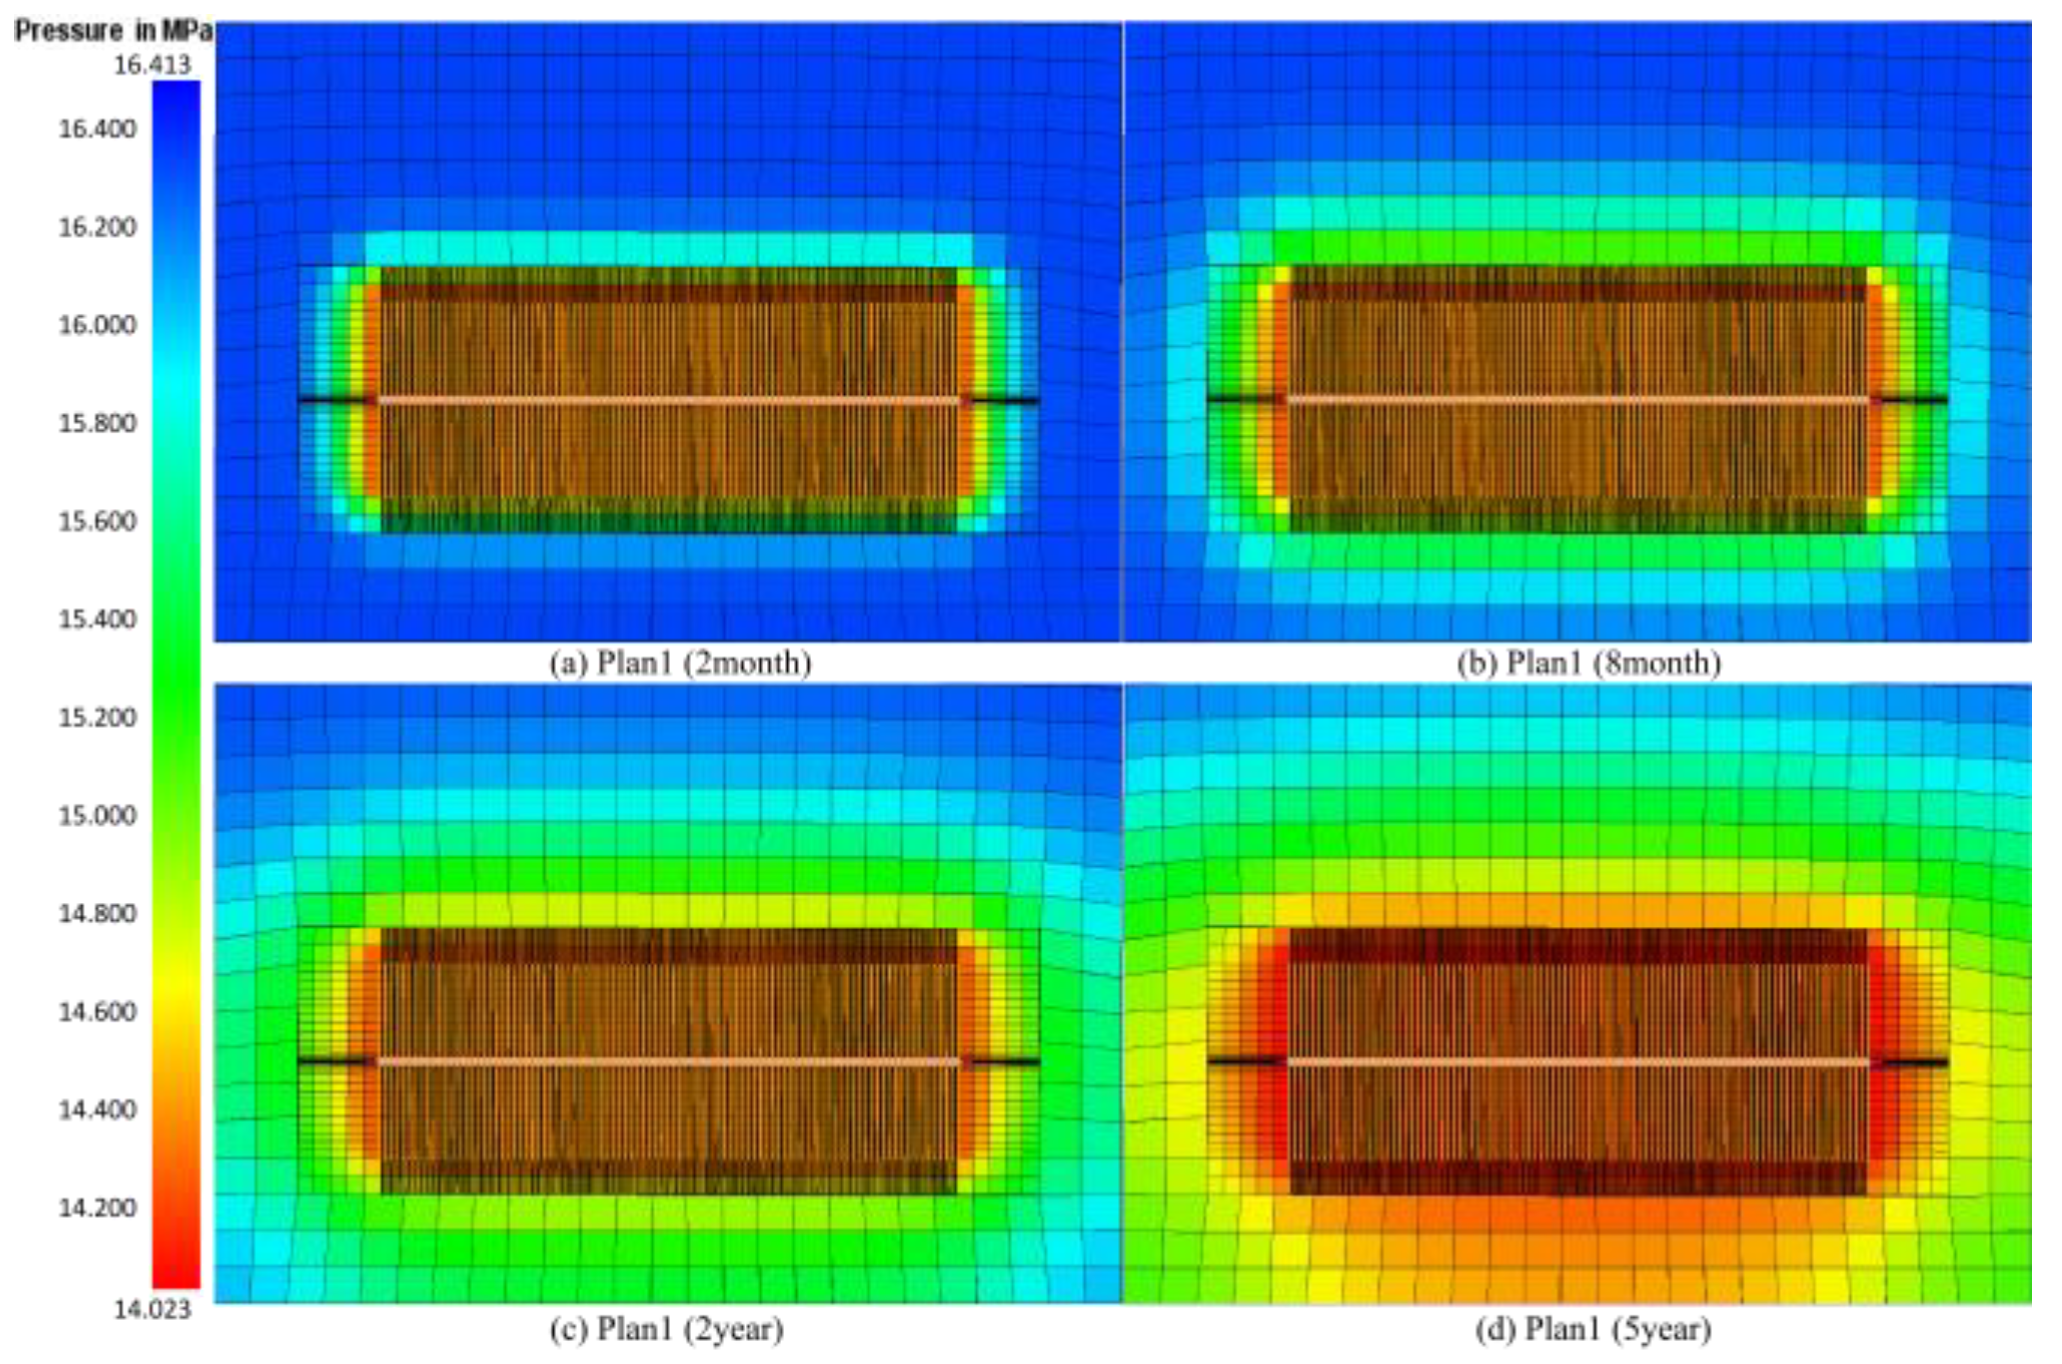
From the above analysis, it can be seen that the contribution of the productivity in tight oil reservoirs after volume fracturing mainly comes from the fracture half-length, followed by the fracture number, and the fracture conductivity has little effect. Within the area limits of the present study, the optimal design combination is a fracture number of 50, fracture half-length of 200 m and fracture conductivity of 300 mD·m. Figure 7 shows the evolution of pressure around fractures during the production process under this combination. It appears that the pore pressure around the main fractures dropped rapidly and that the pressure gradient significantly appeared with the production process after fracturing. The production-affected area of the reservoir pore pressure exhibits an elliptical shape that is gradually transferred to the boundary over time. Compared with the fracture tip area, for the root and toe area of the horizontal well the colour is deeper, and the decline in pore pressure is greater. Due to the small fracture spacing, the decline range of the reservoir pressure between the fractures is basically consistent, and the pressure gradient distribution is not obvious.

3.2. Optimization of Fracture Placement

3.2.1. Single Horizontal Well

As shown in Figure 8, this section analyzes the productivity of tight oil reservoirs after volume fracturing under six different FPCs with the same SRV, in which Scheme 1 with the traditional fracture equal length is set as the comparison group. The total fracture length and fracture number of the six schemes are set to 8800 m and 20, respectively, and fractures are evenly placed along the wellbore. By adjusting the single fracture length of the different schemes to maximize the postfracturing productivity of the corresponding scheme, the optimal fracture half-length of Schemes 2, 3, 4, 5 and 6 is finally determined.
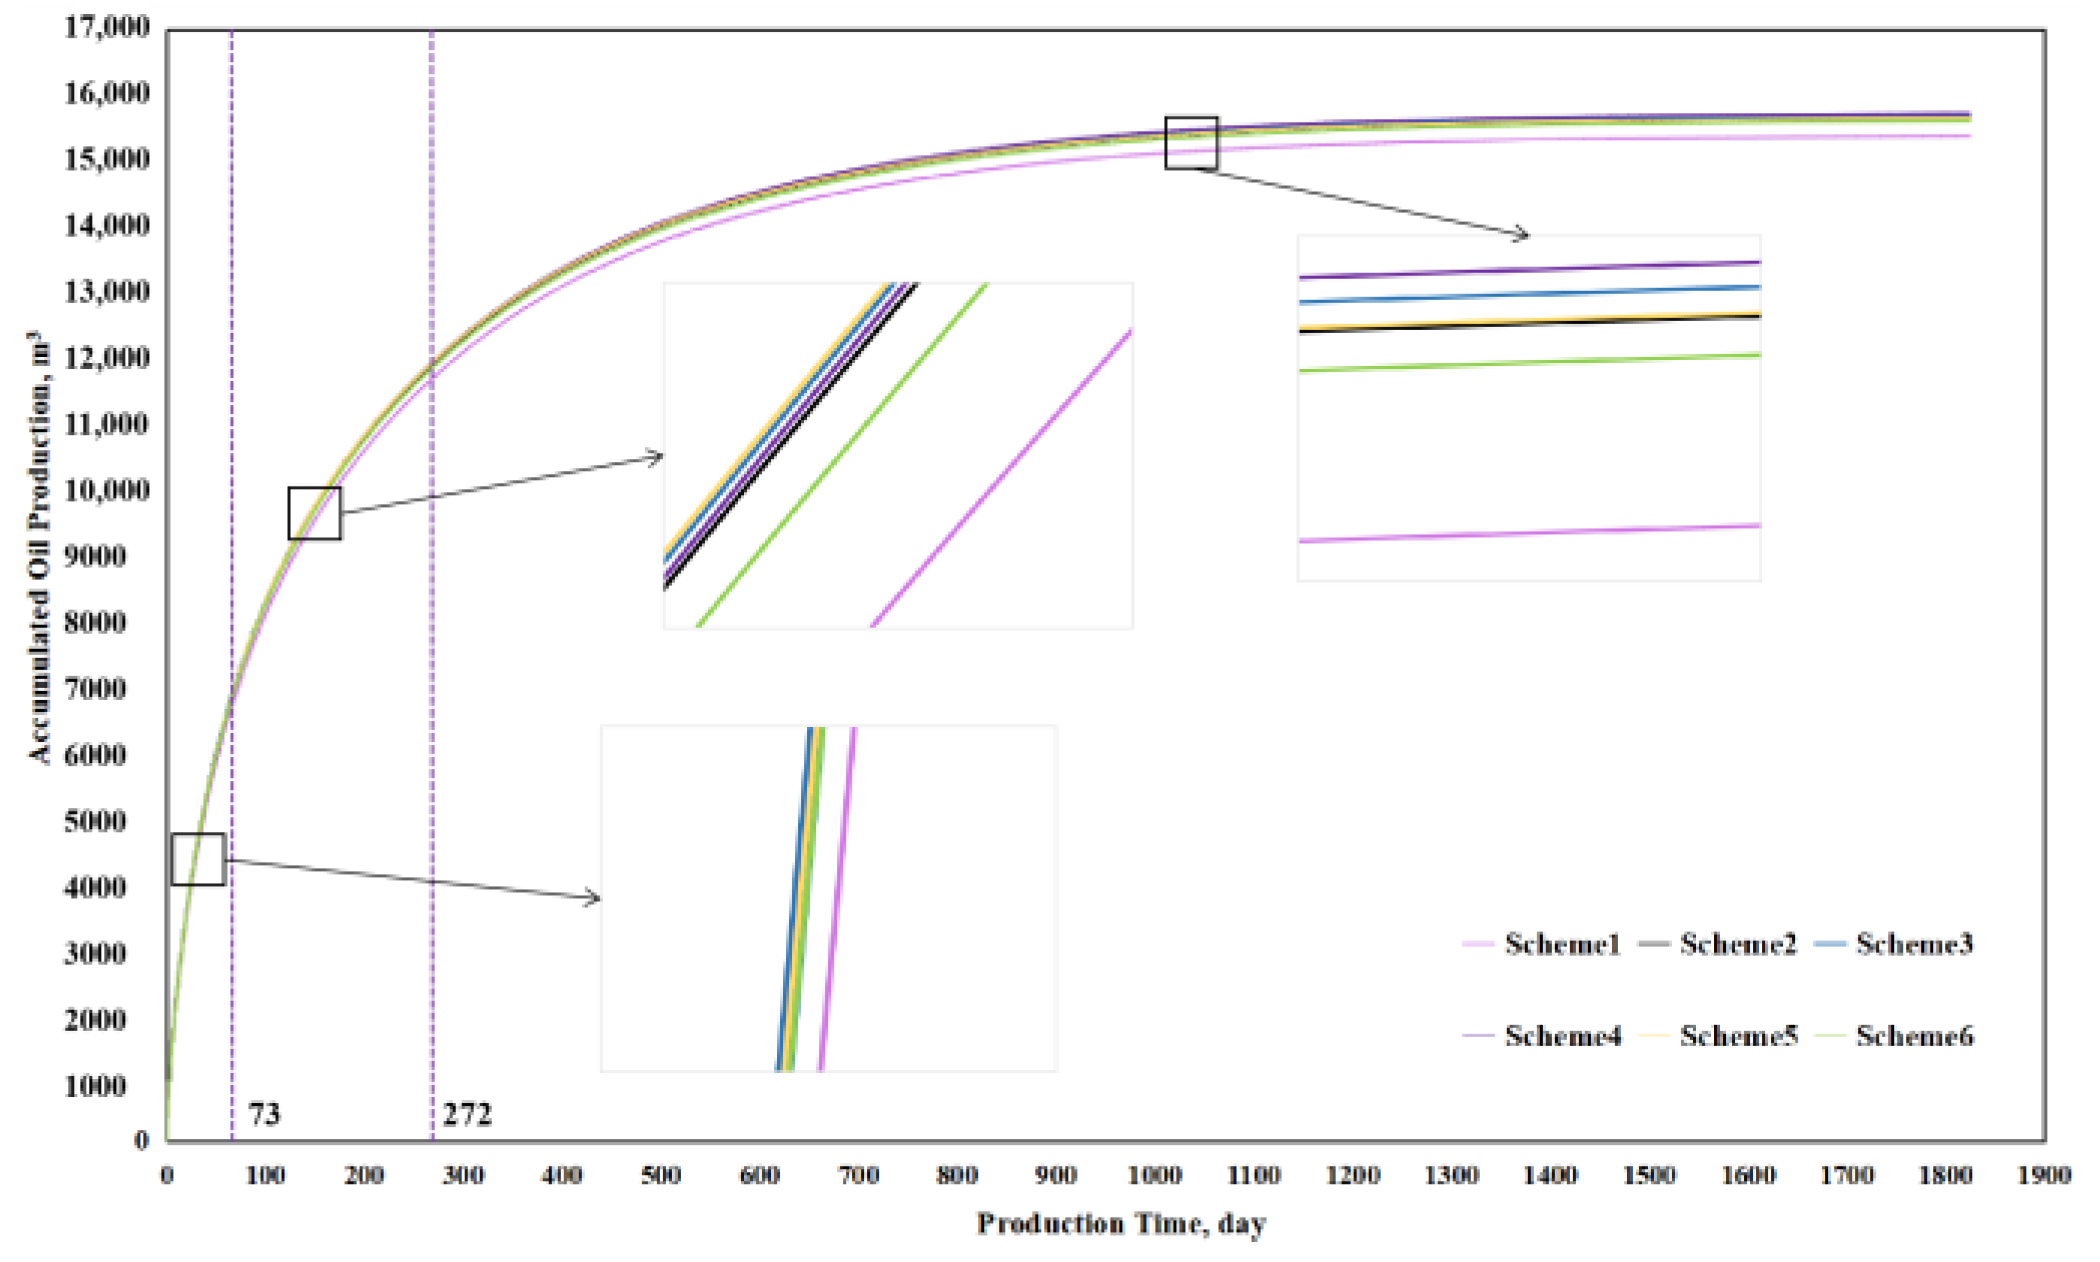
Based on the postfracturing reservoir production simulation model established in Section 2, the cumulative oil production of 6 FPCs is analyzed. As shown in Figure 9, compared with the scheme of the traditional fracture equal length, other FPCs with uneven fracture lengths can all improve oil production. There are intersections between the cumulative oil production curves of different FPCs. For production times below 73 days, the oil production of the dumbbell-shaped scheme is the highest; for production times between 73 days and 272 days, the oil production of short fractures at the root scheme is the highest; and for production times above 272 days, the oil production of the staggered distribution of the long and short fractures scheme is the highest. Fractures should be arranged in a staggered distribution of long and short fracture schemes to maximize long-term cumulative postfracturing oil production.
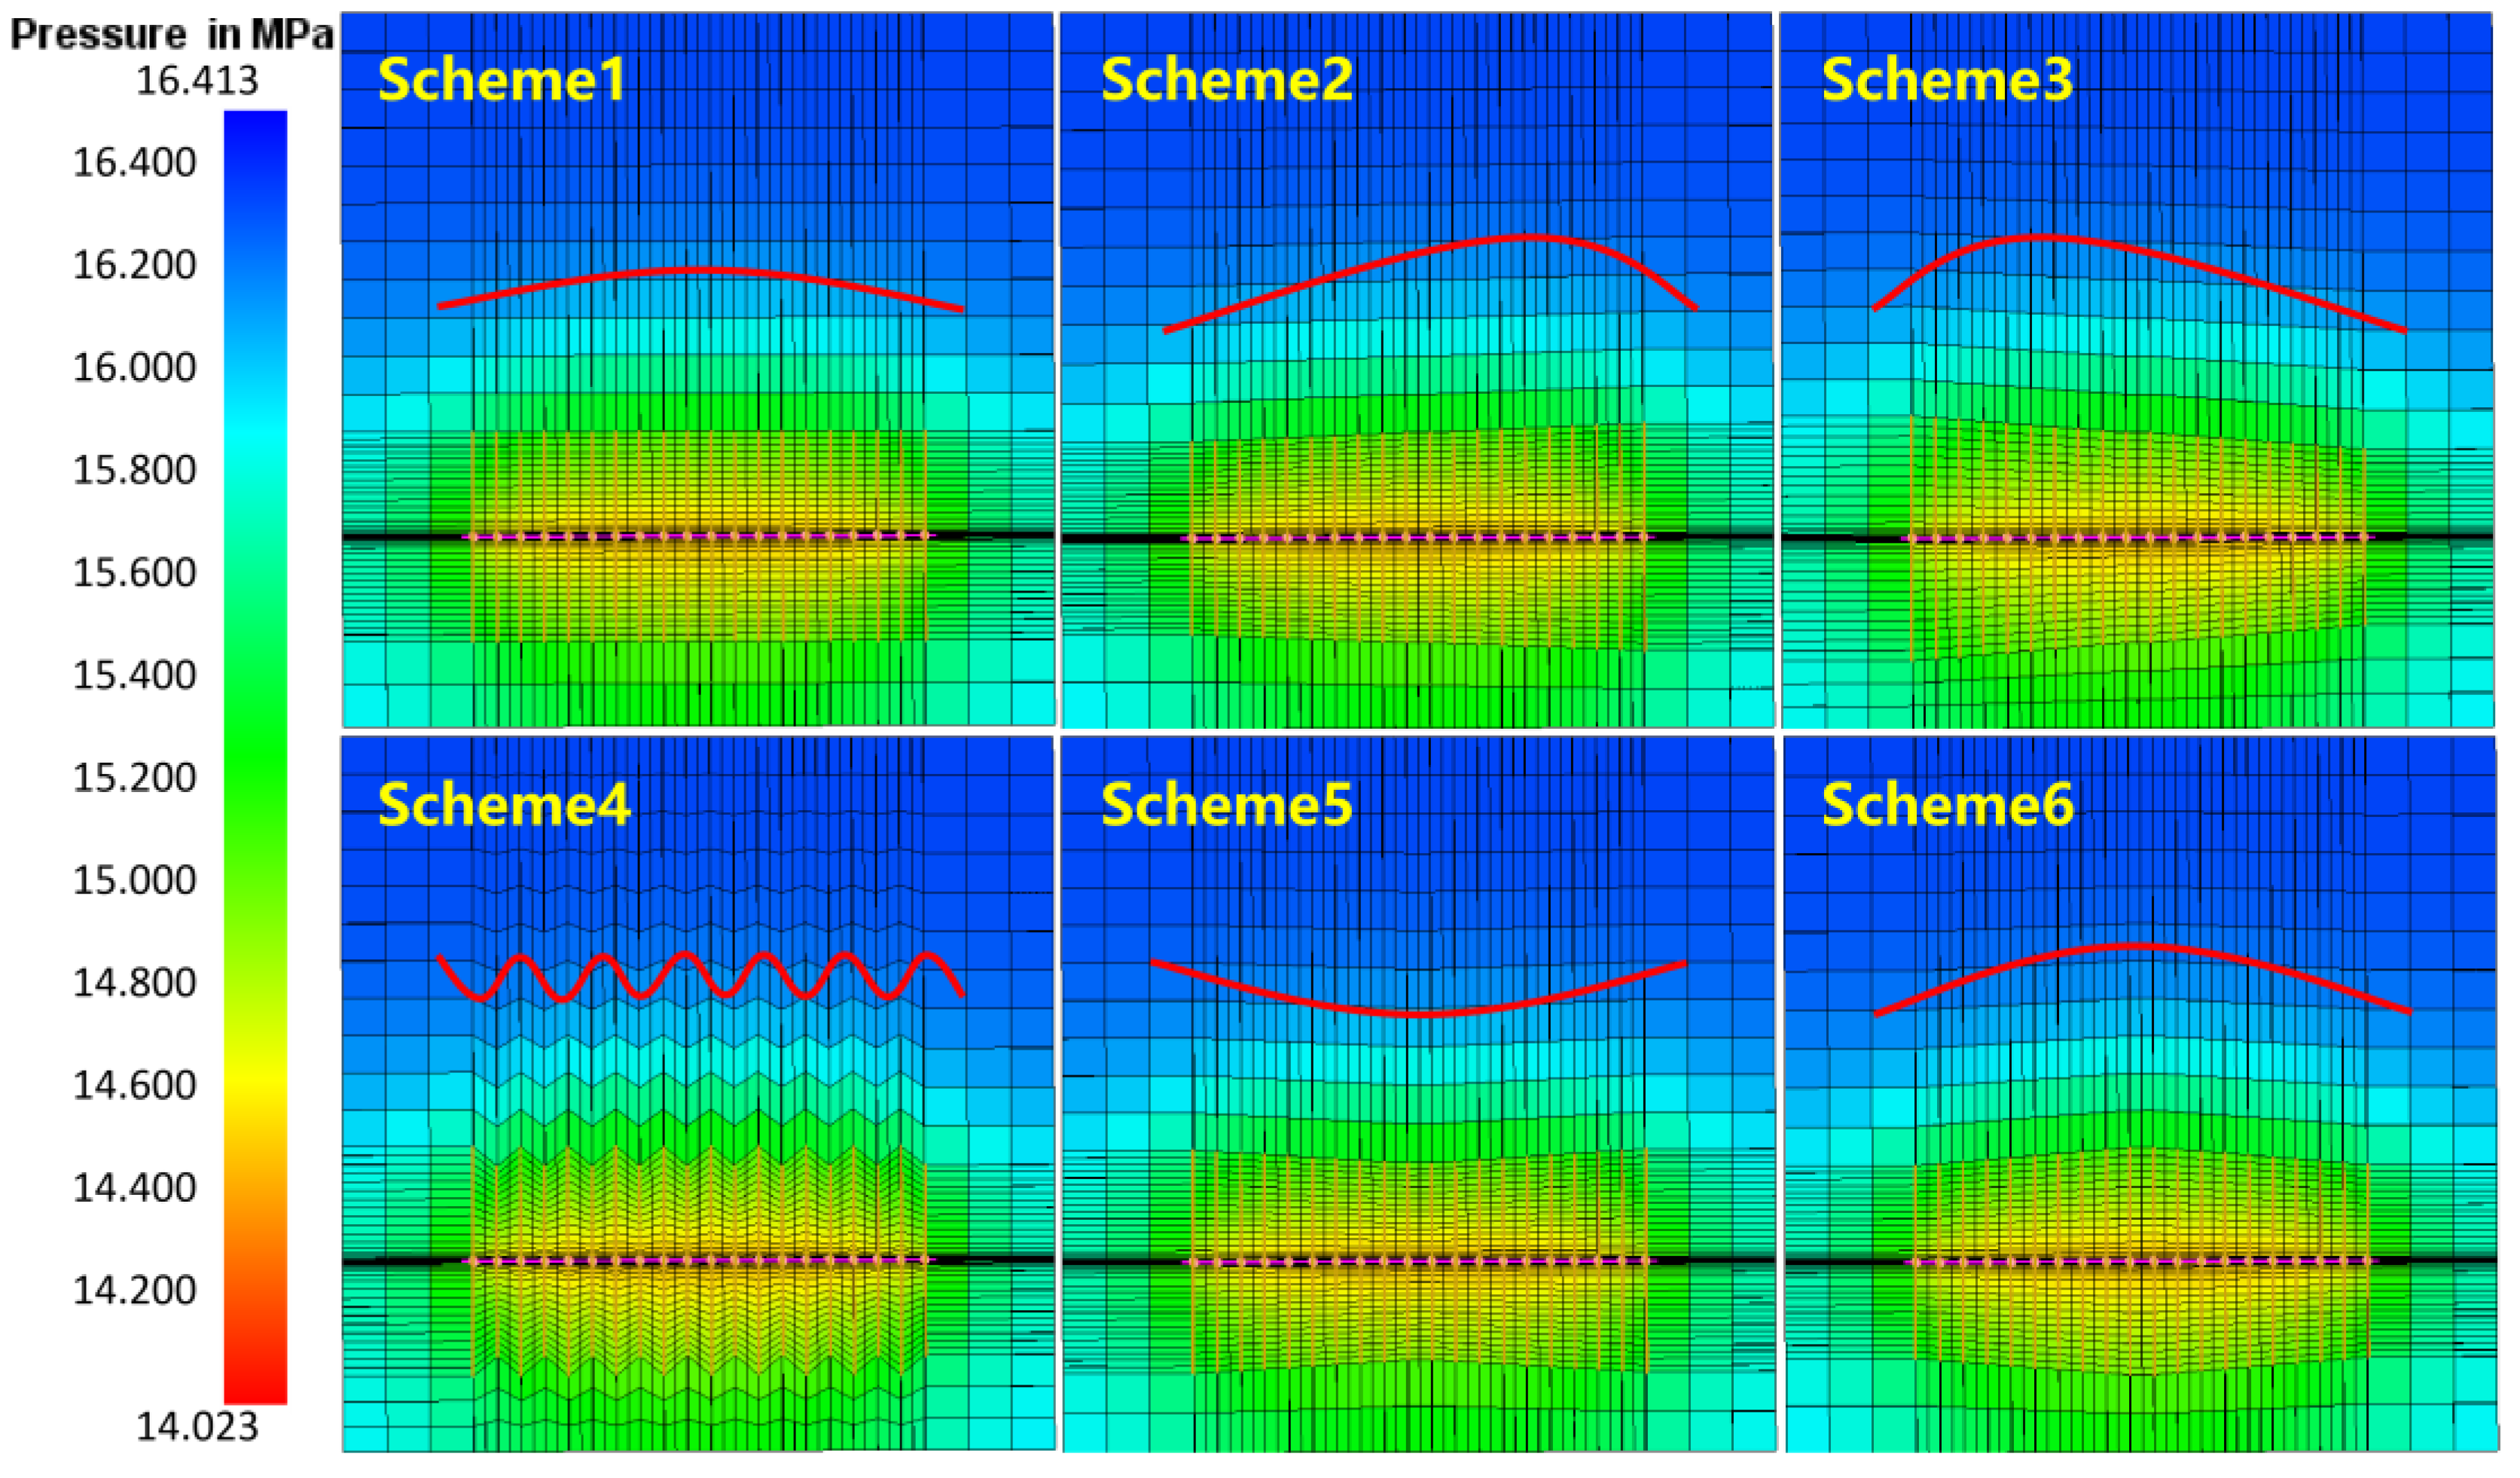
Figure 10 shows the pore pressure distribution one year postfracturing under six different FPCs. The pore pressure distribution pattern in the postfracturing reservoir production process is related to the FPC. The longer the fracture half-length is, the larger the area where the pore pressure is affected by production. The pore pressure presents a wave-like distribution under the staggered fracture arrangement. Compared with that in the other types of pore pressure distributions, the pore pressure in the middle of the two fractures is smaller in the wave-type pore pressure distribution. This is conducive to the rapid flow of oil and gas to the fractures to increase oil and gas production.

3.2.2. Dual Branch Horizontal Well

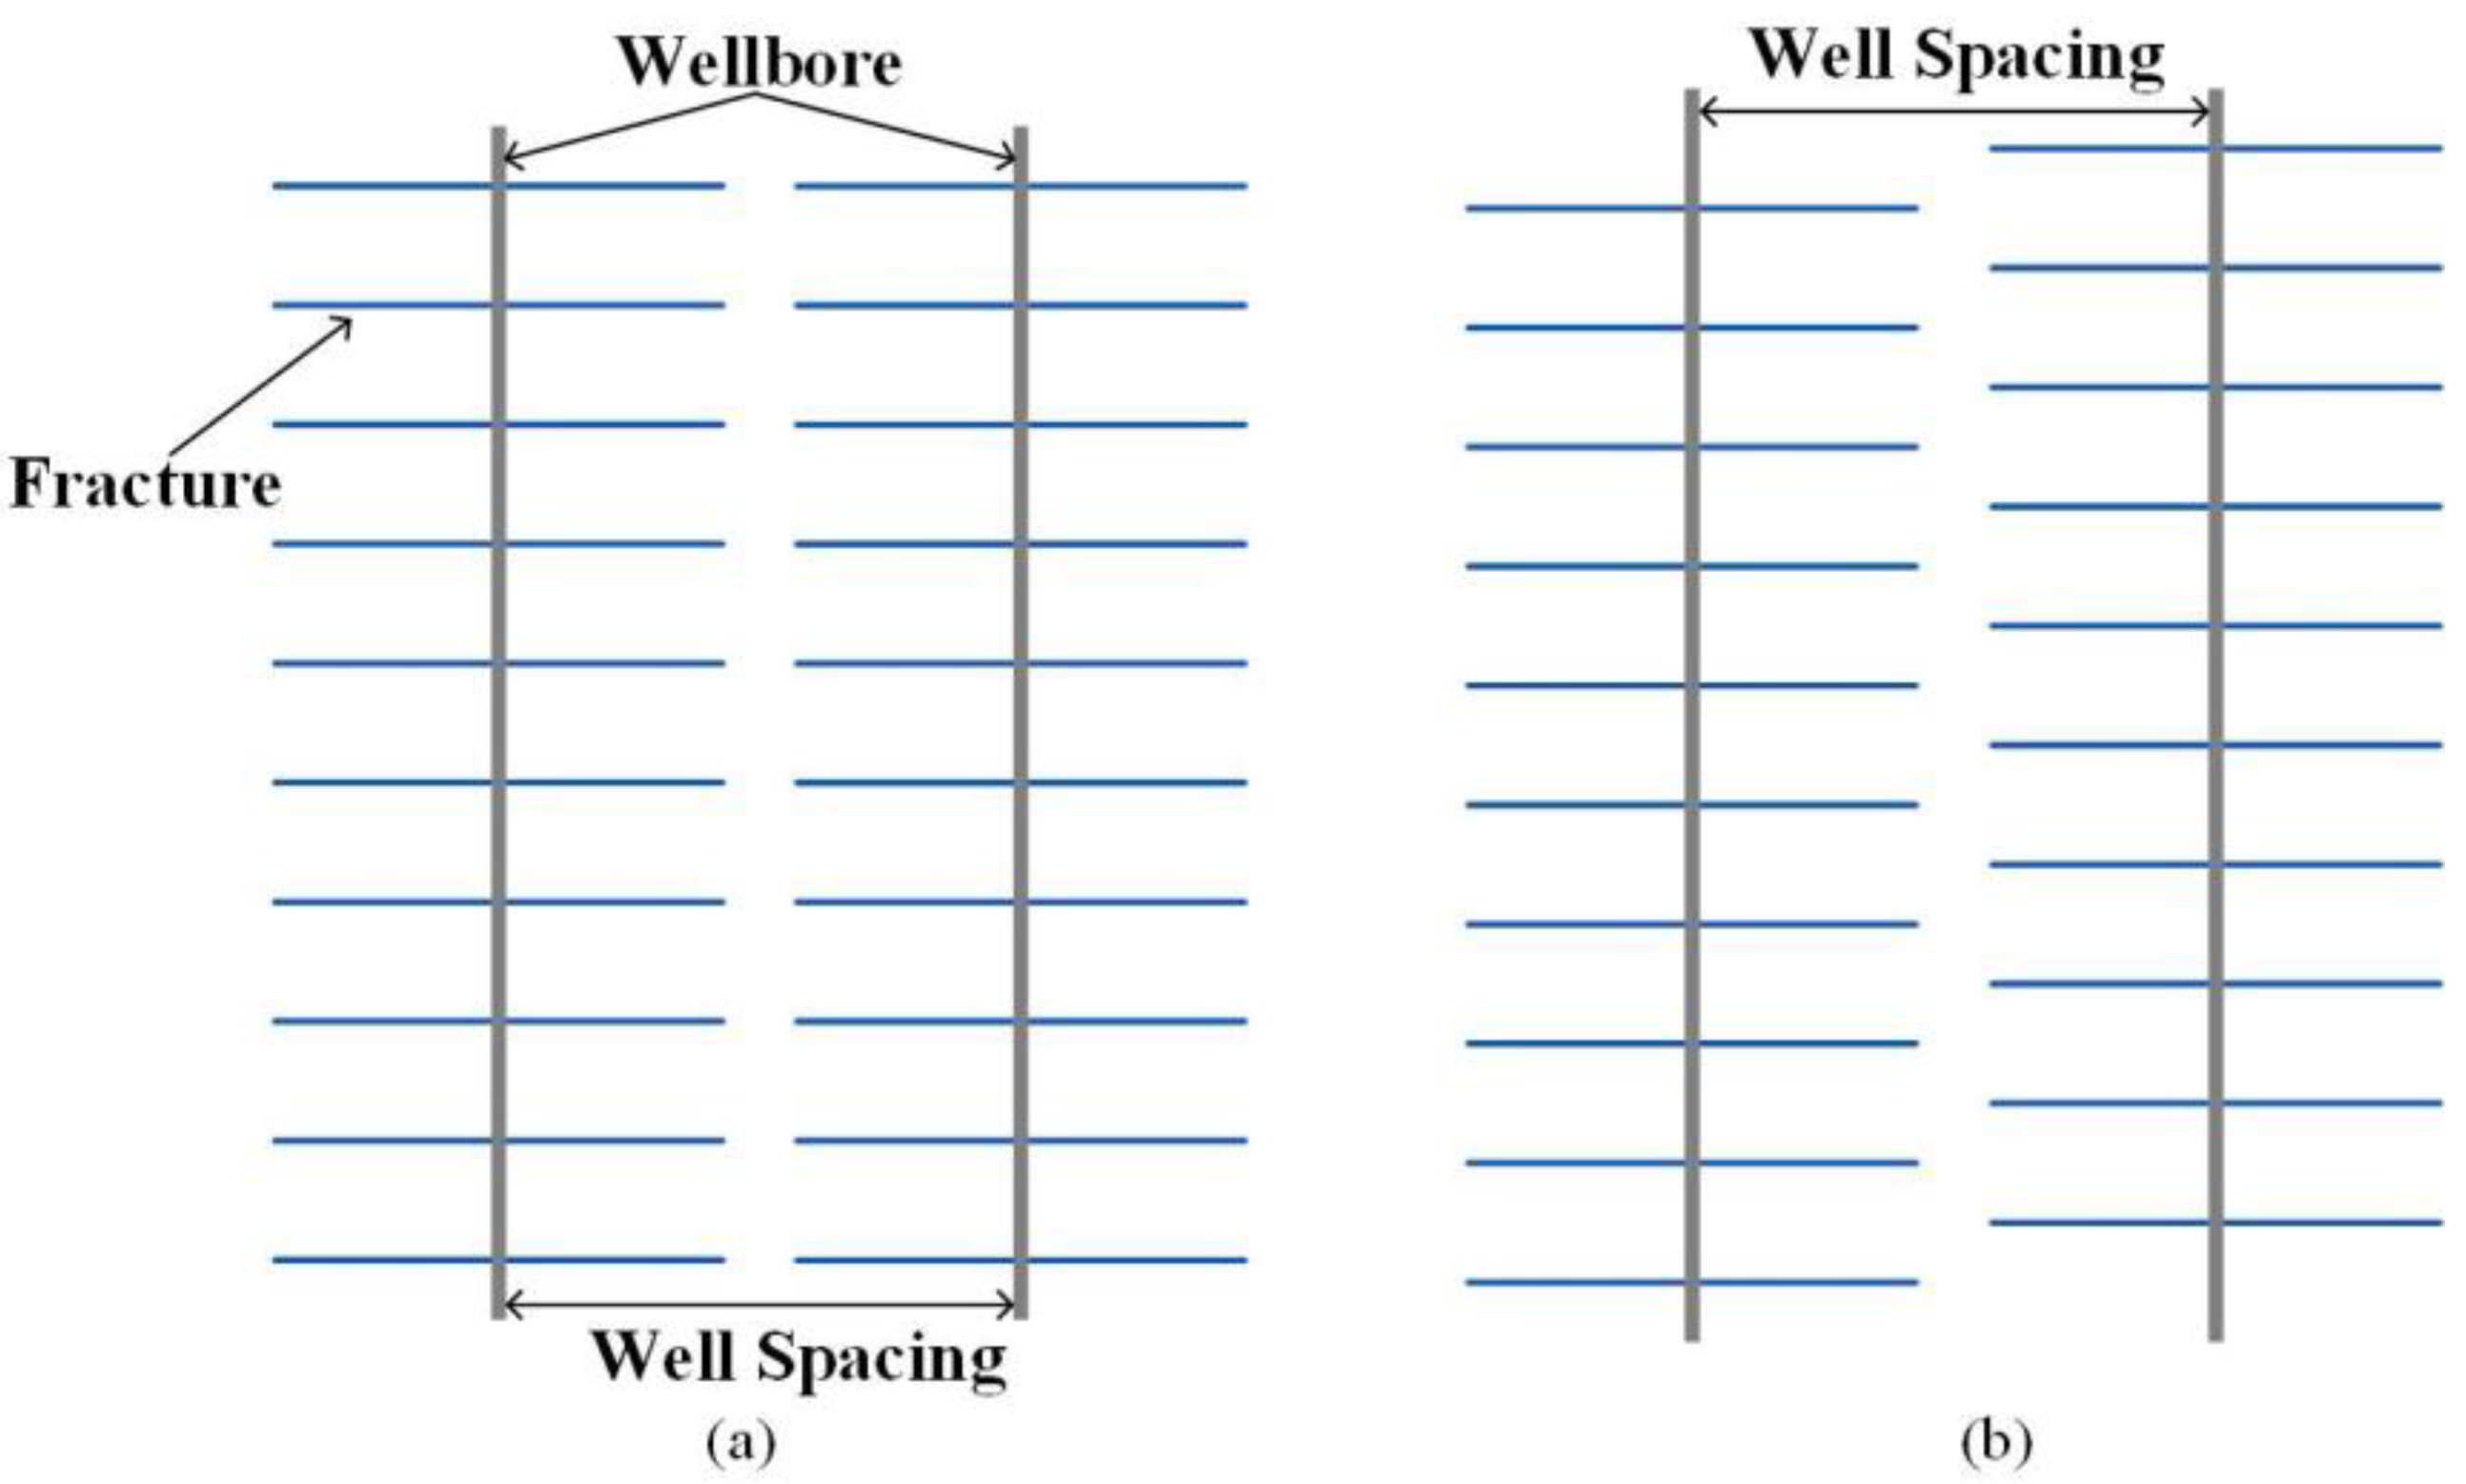
The interwell interference between two parallel horizontal wells induced by the postfracturing production process has an important effect on productivity. This section analyses the productivity of the dual branch horizontal well with different well spacings after fracturing under two different FPCs (see Figure 11).
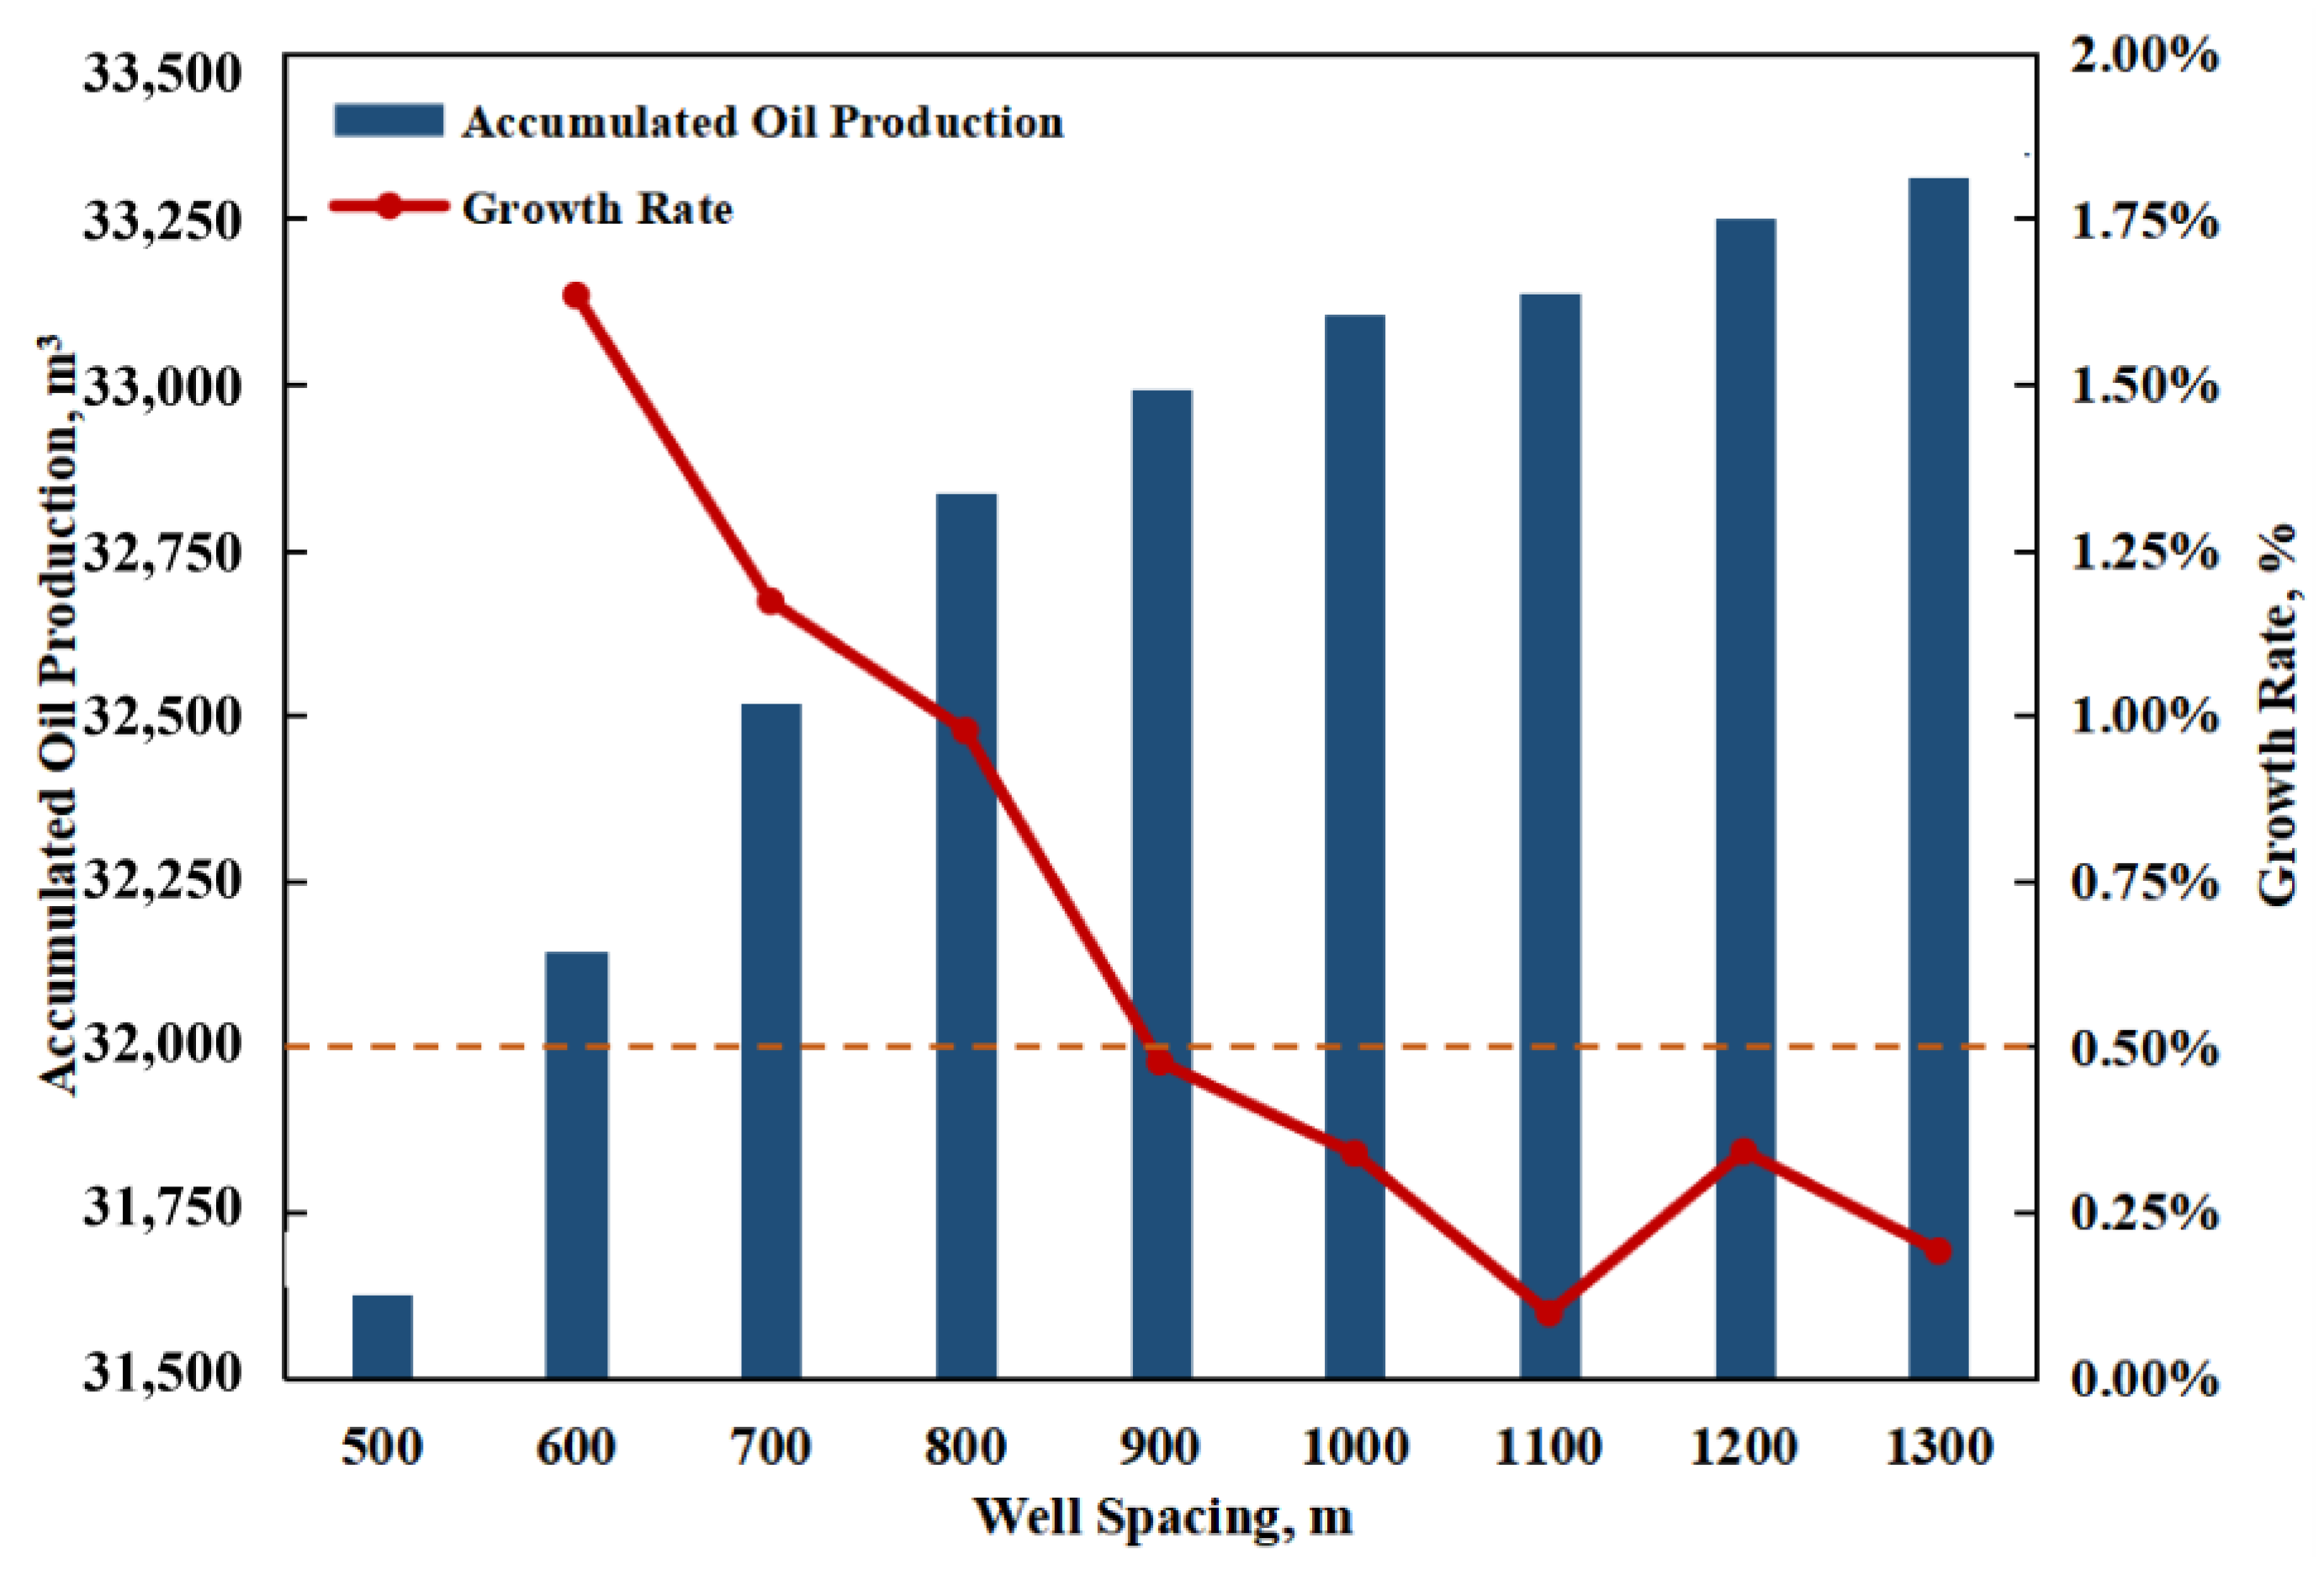
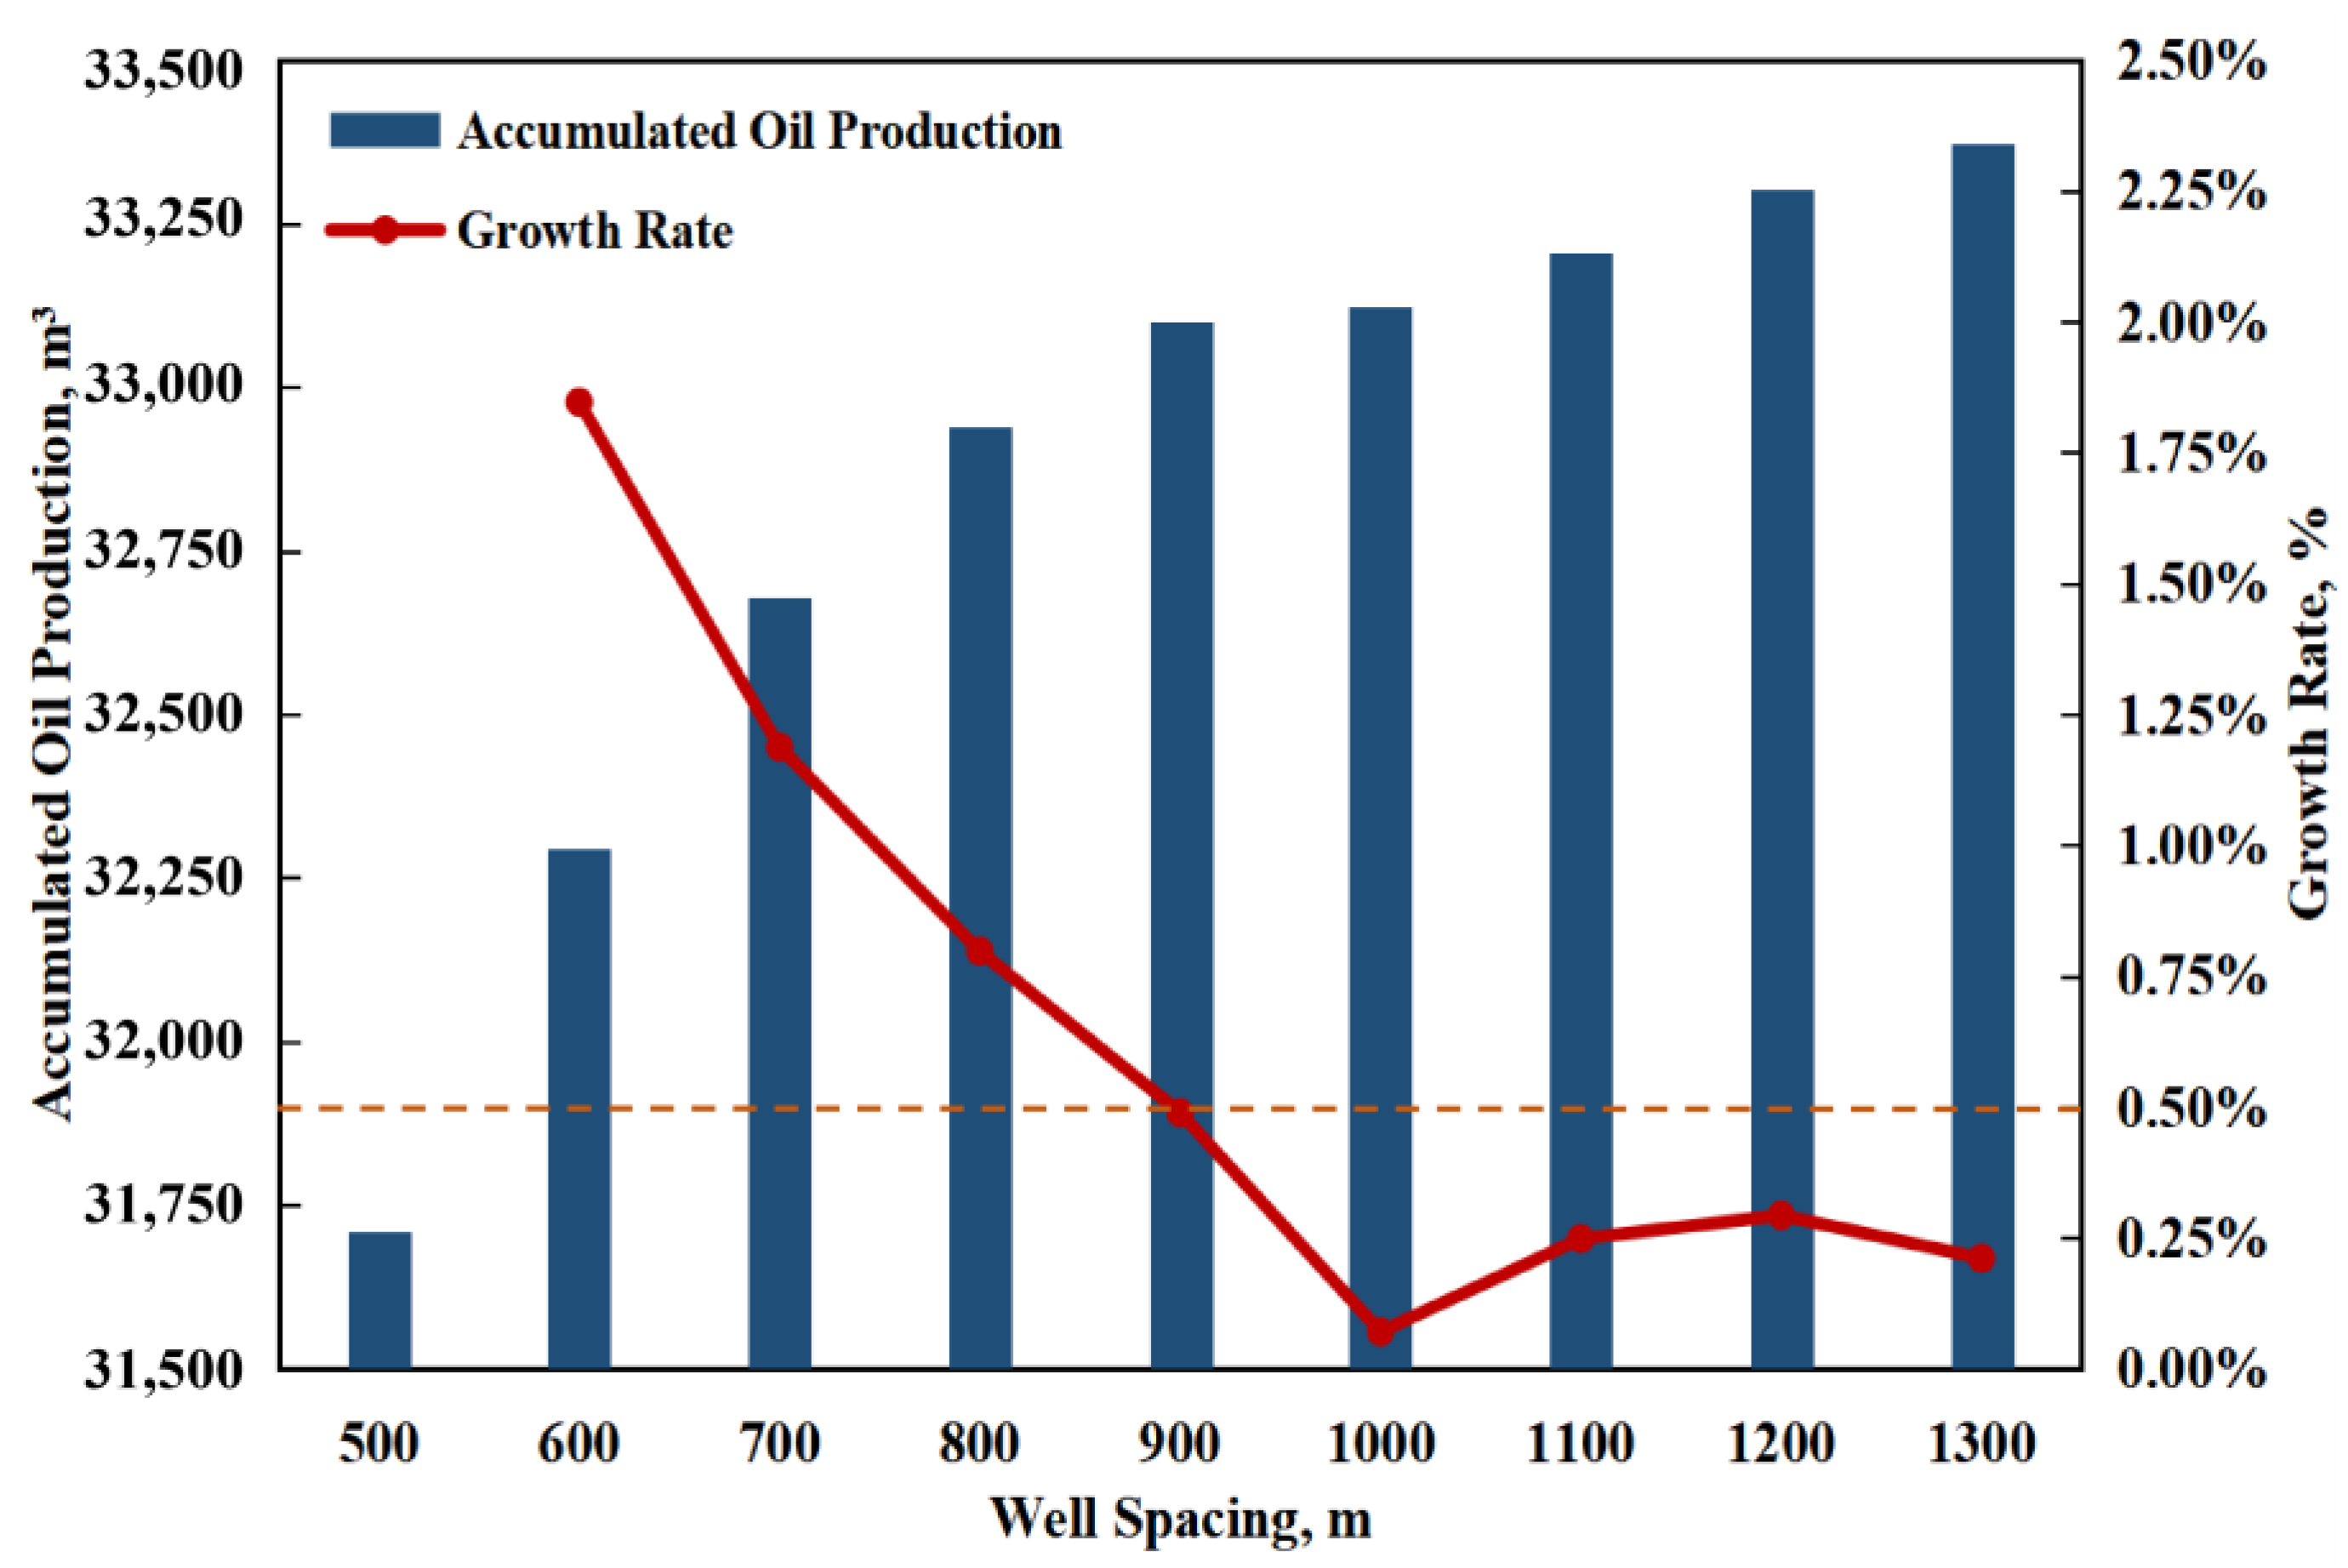
Figure 12 and Figure 13 show the cumulative oil production of the dual branched horizontal well with different well spacings after fracturing under the aligning and alternate fracture placement schemes. It is found that well spacing has a positive effect on increasing cumulative oil production under the two different schemes, both of which reach the optimal value at a well spacing of nearly 800 m. When the well spacing exceeds 800 m, the growth rate is reduced to less than 0.5%. At this time, increasing the well spacing contributes little to the increase in oil production, and the effect of interwell interference on production can be ignored. Compared with aligning the FPC, the well spacing of alternate FPC contributes more to the productivity. Comparing Figure 12 and Figure 13, it can be seen that the oil production of the alternate fracture placement is always higher than that of the aligning fracture placement. For the dual branch horizontal well, the alternate fracture placement scheme has higher postfracturing productivity.
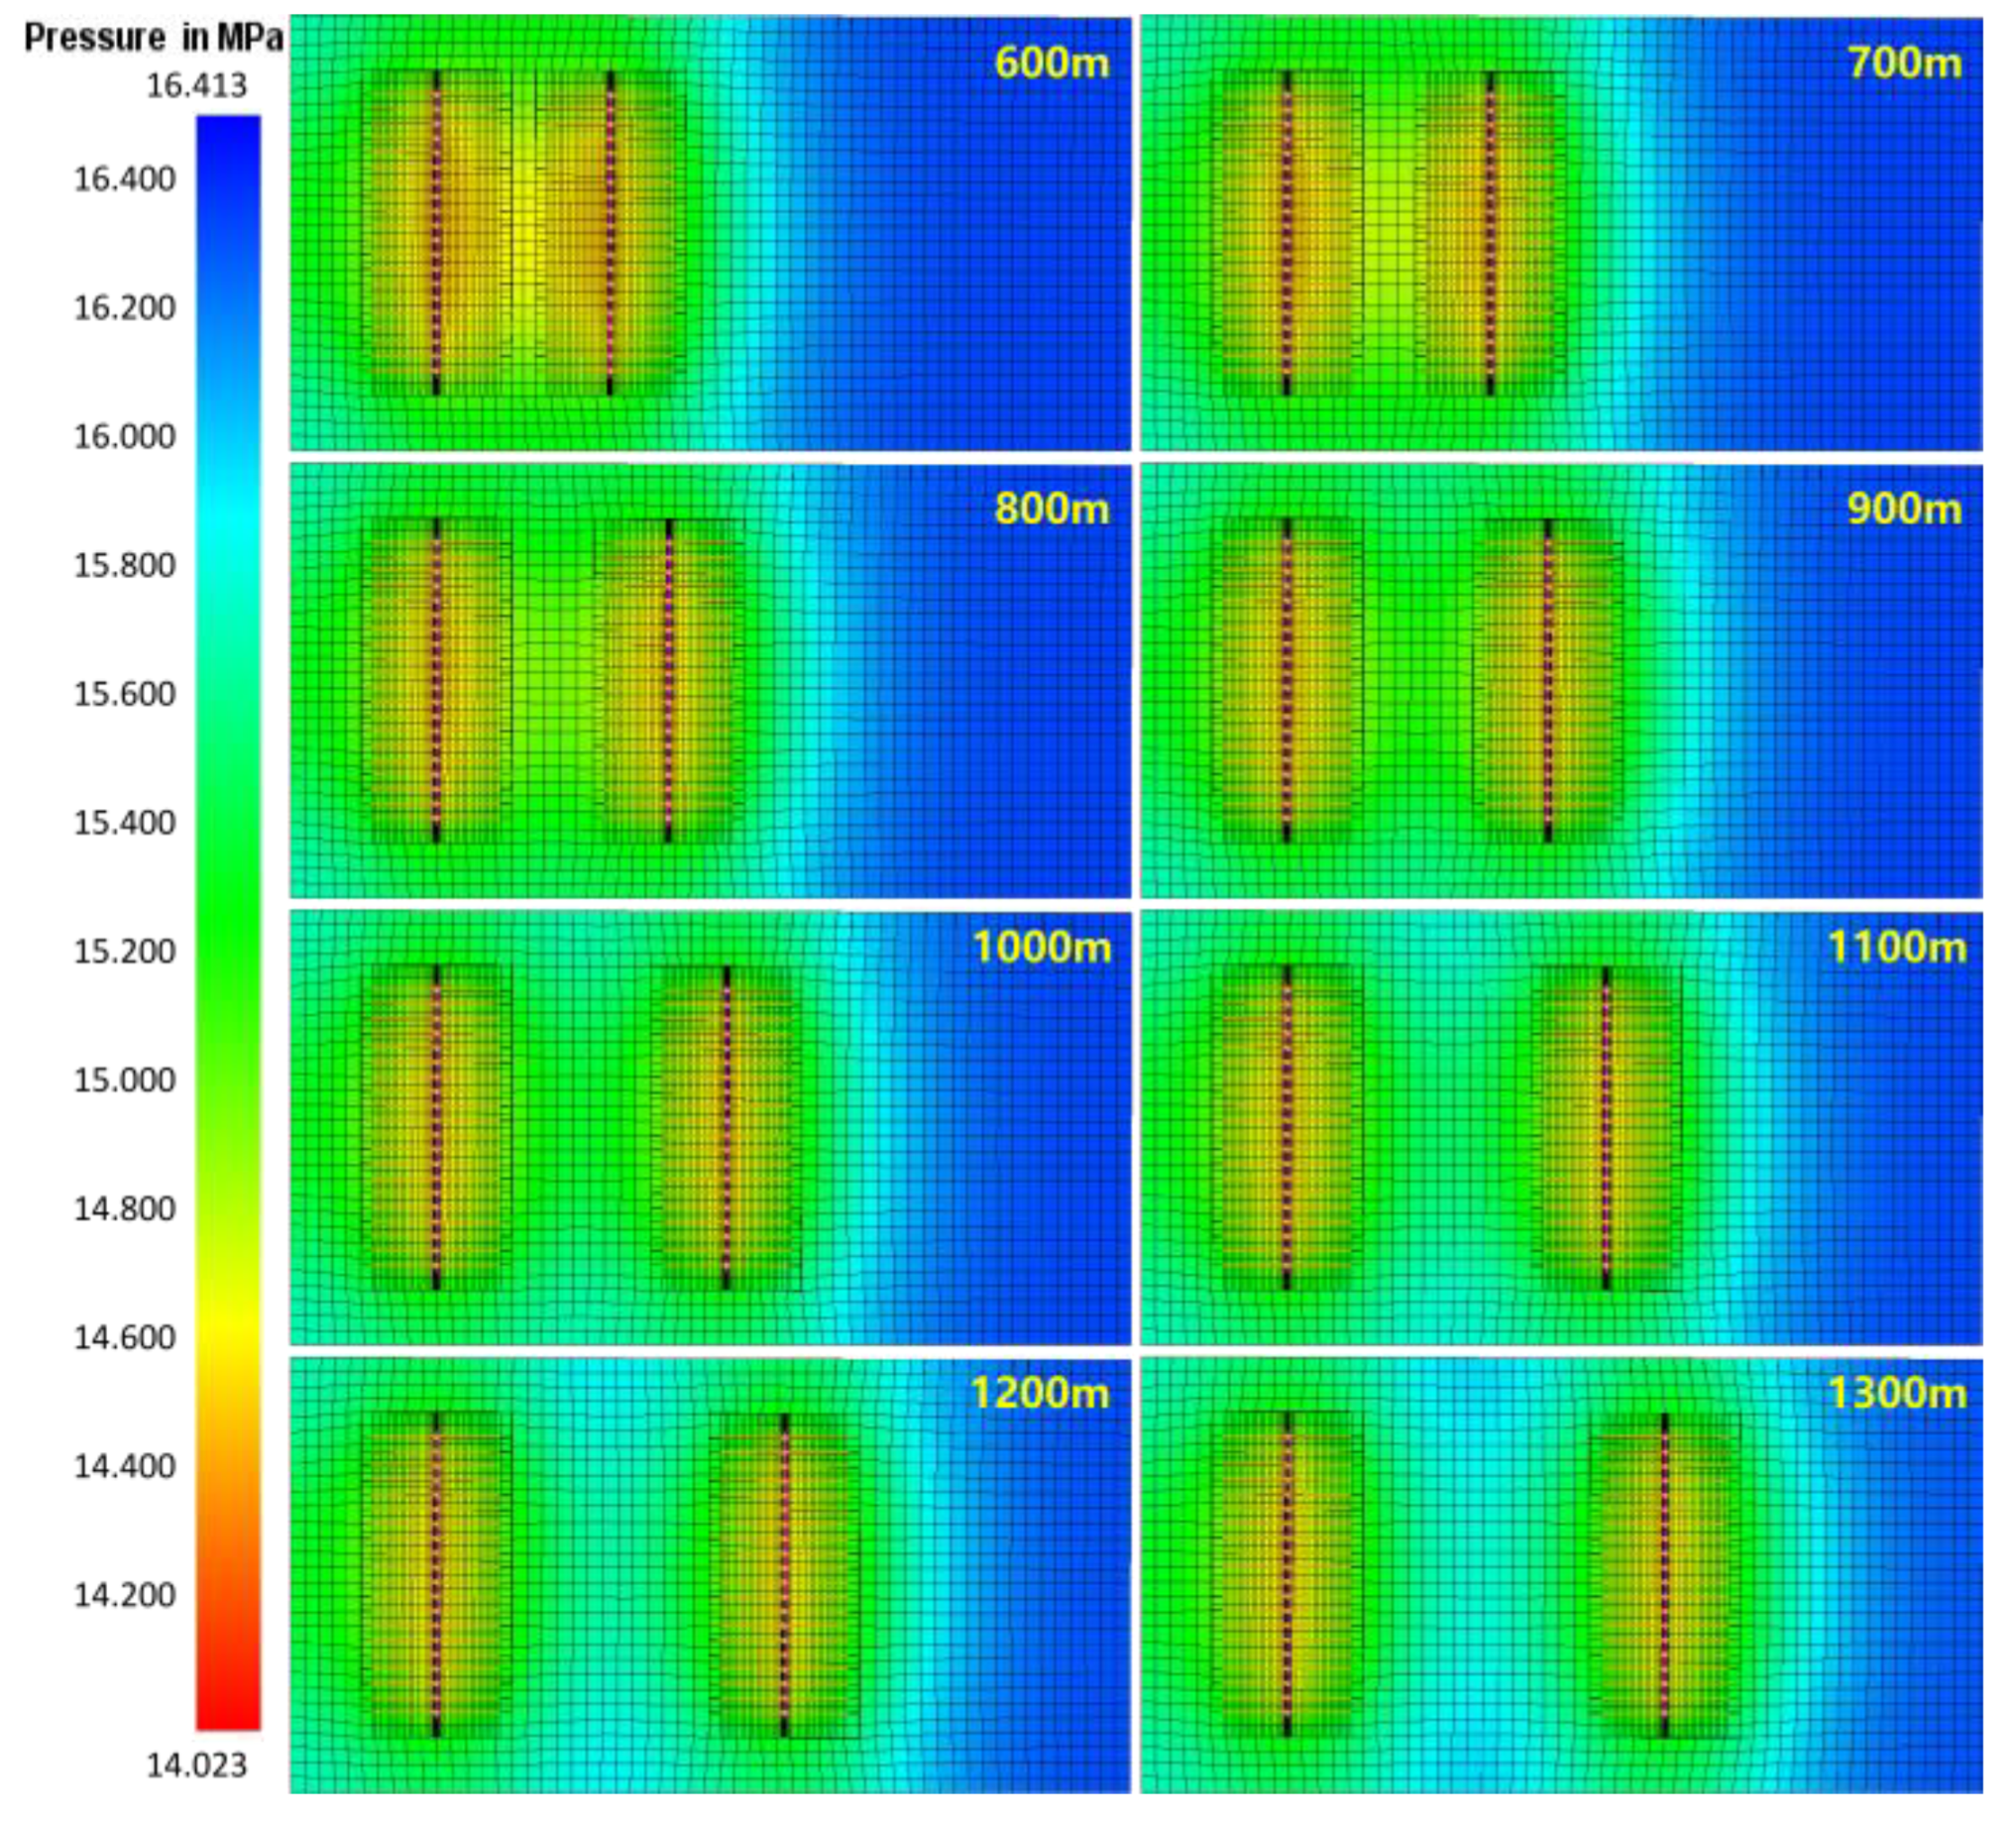
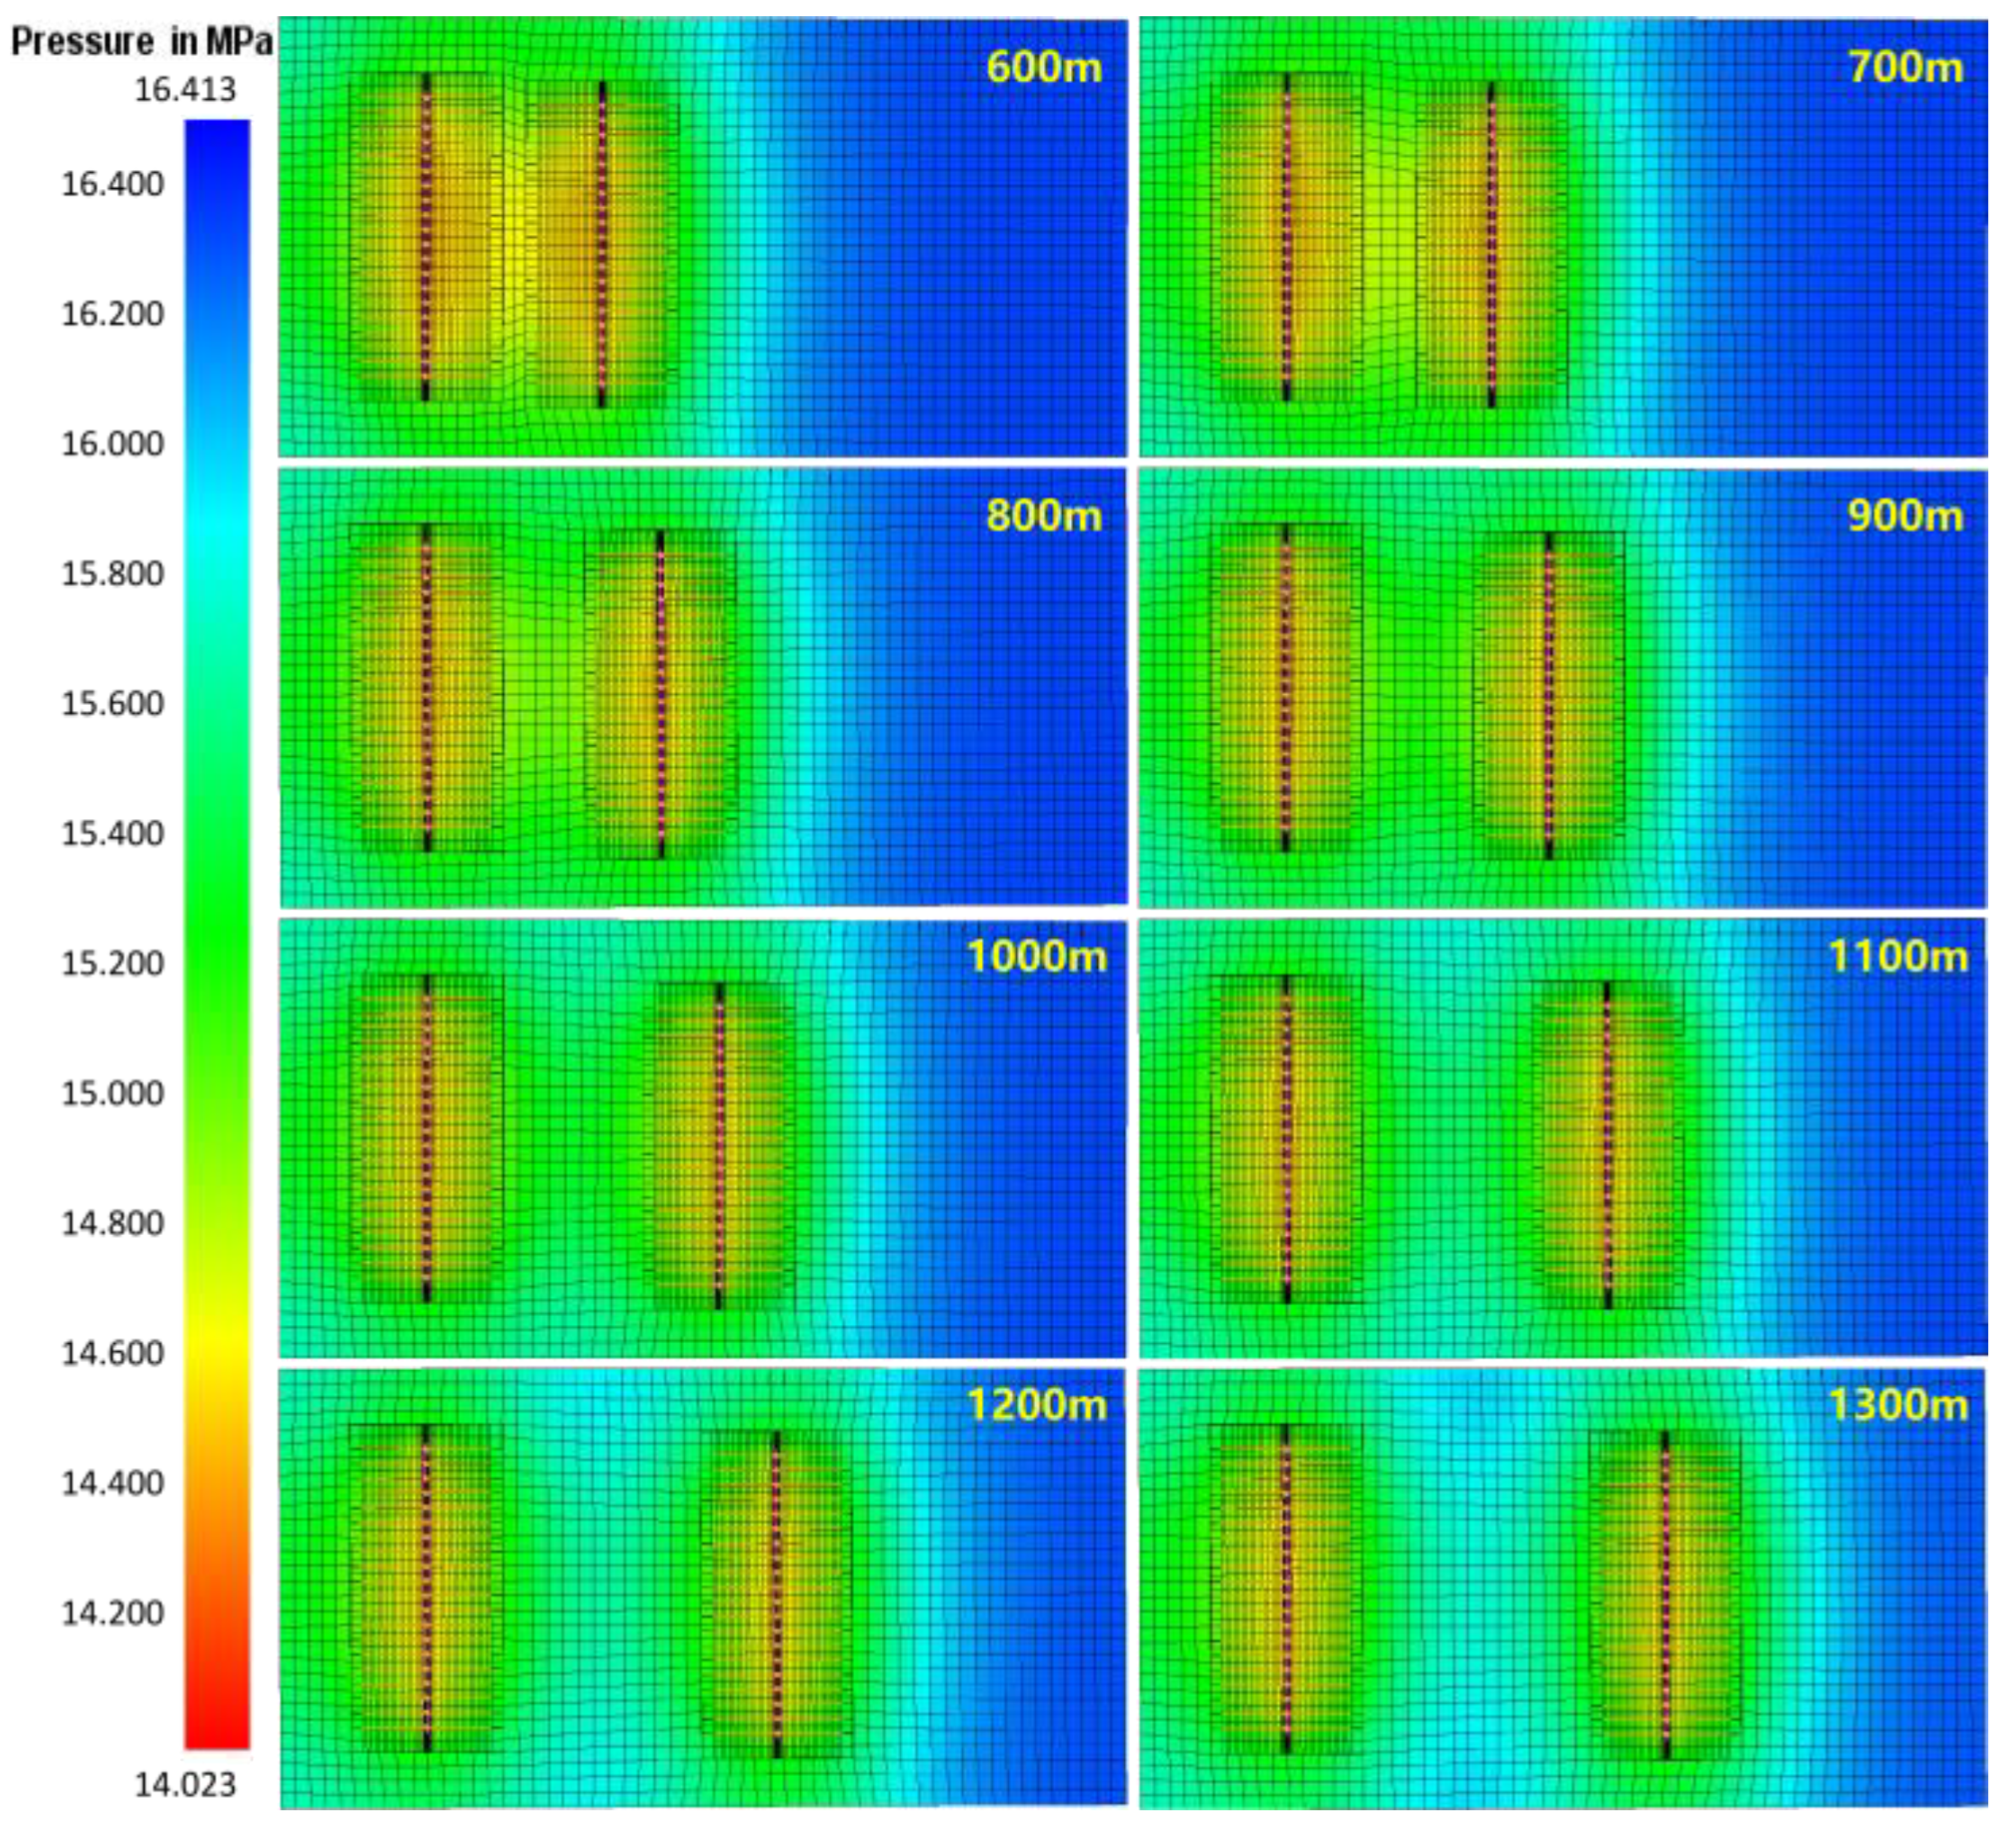
Figure 14 and Figure 15 show the pore pressure distribution of the dual branched horizontal well with different well spacings one year postfracturing under two different FPCs. Figure 14 and Figure 15 show that the smaller the well spacing, the greater the influence of oil and gas production on the pore pressure in the middle area of the dual branch horizontal well, and the greater the pore pressure drop. The aforementioned results have demonstrated that alternate fracture placement and a reasonable well spacing can reduce the interwell interference between dual branch horizontal wells, thereby increasing the postfracturing productivity of oil wells.

4. Conclusions

Based on the theory of the black oil model, combined with the characteristics of reservoir stimulation by the volume fracturing of horizontal wells in tight oil reservoirs, a postfracturing production numerical simulation model is established. The model was used to analyze the influence mechanism of tight oil reservoir fracture parameters and FPC on postfracturing productivity. The main results are as follows:
(1) A productivity simulation method for horizontal wells after volume fracturing is proposed, which simulates the effect of volume fracturing reservoir stimulation by setting a high-permeability area with a certain bandwidth around artificial fractures. The permeability of this area can be determined by history fitting, and the bandwidth can be determined by the statistical average of the microseismic monitoring results.
(2) The fracture length and number are the main parameters affecting the productivity of tight oil reservoirs after volume fracturing, while the fracture conductivity has little effect on productivity. An appropriate fracture length and number should be selected to maximize the productivity of tight oil reservoirs under economic development conditions.
(3) The postfracturing productivity under six different FPCs were investigated. The productivity and pore pressure field of different FPCs are quite different. Compared with a traditional FPC of equal length, an FPC with an uneven fracture length can improve the cumulative oil production after well fracturing.
(4) The dumbbell-shaped fracture placement scheme has the largest short-term postfracturing productivity. The arrangement of long fractures and staggered short fractures can maximize the long-term cumulative oil production after well fracturing.
(5) The pore pressure distribution pattern in the postfracturing reservoir production process is related to the FPC. Under a staggered fracture arrangement, the pore pressure presents a wave-like distribution, which is beneficial for increasing the postfracturing oil well production.
(6) Alternate fracture placement and a reasonable well spacing can reduce the interwell interference between the dual branch horizontal wells, thereby increasing the postfracturing productivity of the oil wells.
The production numerical simulation method proposed in this paper can accurately simulate the productivity of horizontal wells after volume fracturing. This method can be used for the optimal design of hydraulic fracturing parameters and fracture placement schemes. There are still many shortcomings in this paper. Future studies will be based on this method to analyze the postfracturing productivity of horizontal wells considering complex fracture competitive propagation patterns.

Author Contributions

Conceptualization, Y.J., J.Y. and H.W.; investigation, J.Y., Y.Z. (Yi Zou) and Y.L.; validation, Y.Z. (Yanjun Zhang), Y.J. and H.W.; writing—original draft preparation, Y.J., D.Z., H.W. and J.Y. All authors have read and agreed to the published version of the manuscript.

Funding

This work was supported by the National Natural Science Foundation of China (Grant Nos. 51934005 and 52174028), China Postdoctoral Science Foundation (Grant No. 2022MD713803) and Scientific Research Program Funded by Shaanxi Provincial Education Department (22JK0509).

Institutional Review Board Statement

Not applicable.

Informed Consent Statement

Not applicable.

Data Availability Statement

Not applicable.

Conflicts of Interest

The authors declare no conflict of interest.

References

  1. Wang, W.Q. Fluid Chemistry, Drilling and Completion; Oil and Gas Chemistry Management Series; Gulf Professional Publishing: Houston, TX, USA, 2021. [Google Scholar]
  2. Ma, X.; Hao, R.F.; Lai, X.A.; Zhang, Y.M.; Ma, Z.G.; He, M.F.; Xiao, Y.X.; Bi, M.; Ma, X.X. Field test of volume fracturing for horizontal wells in Sulige tight sandstone gas reservoirs. Pet. Explor. Dev. 2014, 41, 810–816. [Google Scholar] [CrossRef]
  3. Yu, L.; Wang, J.J.; Wang, C.; Chen, D. Enhanced Tight Oil Recovery by Volume Fracturing in Chang 7 Reservoir: Experimental Study and Field Practice. Energies 2019, 12, 2419. [Google Scholar] [CrossRef] [Green Version]
  4. Zhao, H.; Li, W.; Pu, H.; Yang, K.H. Formation Applicability Analysis of Stimulated Reservoir Volume Fracturing and Case Analysis. Petroleum 2021, 7, 160–167. [Google Scholar] [CrossRef]
  5. Wang, C.; He, S.B.; Wang, M.Y.; Xue, F.F. Density cutting volume fracturing technology for horizontal wells in the ultra-low permeability reservoirs: A case study of the Yuan284 area in the Huaqing oilfield Ordos Basin, China. Arab. J. Geosci. 2022, 15, 1409. [Google Scholar]
  6. Wu, Q.; Xu, Y.; Wang, X.Q.; Wang, T.F.; Zhang, S.L. Volume fracturing technology of unconventional reservoirs: Connotation, design optimization and implementation. Pet. Explor. Dev. 2012, 39, 377–384. [Google Scholar] [CrossRef]
  7. Ma, J.J.; Chen, J.J.; Chen, W.X.; Huang, L.C. A coupled thermal-elastic-plastic-damage model for concrete subjected to dynamic loading. Int. J. Plas. 2022, 153, 103279. [Google Scholar] [CrossRef]
  8. Mayerhofer, M.J.; Lolon, E.P.; Youngblood, J.E.; Heinze, J.R. Integration of Microseismic Fracture Mapping Results with Numerical Fracture Network Production Modeling in the Barnett Shale. In Proceedings of the SPE Annual Technical Conference and Exhibition, San Antonio, TX, USA, 24–27 September 2006. [Google Scholar]
  9. Hughes, D.J. A reality check on the shale revolution. Nature 2013, 494, 307–308. [Google Scholar] [CrossRef]
  10. Jiang, Z.L.; Qiu, H.J.; Huang, Y.P.; Jiang, K.P.; Fu, W.K.; Chen, J. Lacustrine Source Rocks of Middle Jurassic in Southeast Depression in Tarim Basin. Xinjiang Pet. Geol. 2013, 34, 1. Available online: http://www.zgxjpg.com/EN/Y2013/V34/I6/1 (accessed on 17 November 2022).
  11. Zhang, Q.S.; Li, M.; Zhang, Z.L.; Chen, Y.; Zhang, L.Y.; Li, A.S. Application of volume fracturing technology in tight oil reservoirs of Shengli oilfield. China Pet. Explor. 2019, 24, 233–240. [Google Scholar] [CrossRef]
  12. Mayerhofer, M.J.; Lolon, E.P.; Warpinski, N.R.; Cipolla, C.L.; Walser, D.; Rightmire, C.M. What Is Stimulated Reservoir Volume? SPE Prod. Oper. 2010, 25, 89–98. [Google Scholar] [CrossRef]
  13. Kolawole, O.; Esmaeilpour, S.; Hunky, R.; Saleh, L.; Ali-Alhaj, H.K.; Marghani, M. Optimization of Hydraulic Fracturing Design in Unconventional Formations: Impact of Treatment Parameters. In Proceedings of the SPE Kuwait Oil & Gas Show and Conference, Kuwait City, Kuwait, 13–16 October 2019. [Google Scholar]
  14. Wang, H.Y.; Zhou, D.S.; Liu, S.; Wang, X.X.; Ma, X.L.; Yao, T.Q. Hydraulic fracture initiation for perforated wellbore coupled with the effect of fluid seepage. Energy Rep. 2022, 8, 10290–10298. [Google Scholar] [CrossRef]
  15. Bazan, L.W.; Larkin, S.D.; Lattibeaudiere, M.G.; Terry, T.P. Improving Production in the Eagle Ford Shale with Fracture Modeling, Increased Conductivity and Optimized Stage and Cluster Spacing along the Horizontal Wellbore. In Proceedings of the Tight Gas Completions Conference, San Antonio, TX, USA, 2–3 November 2010. [Google Scholar]
  16. Roussel, N.P.; Sharma, M.M. Optimizing Fracture Spacing and Sequencing in Horizontal-Well Fracturing. SPE Prod. Oper. 2011, 26, 173–184. [Google Scholar] [CrossRef]
  17. Jabbari, H.; Zeng, Z.W. Hydraulic Fracturing Design for Horizontal Wells in the Bakken Formation. In Proceedings of the 46th U.S. Rock Mechanics/Geomechanics Symposium, Chicago, IL, USA, 24–27 June 2012. [Google Scholar]
  18. Yu, W.; Sepehrnoori, K. An efficient reservoir-simulation approach to design and optimize unconventional gas production. J. Canadian Pet. Technol. 2014, 53, 109–121. [Google Scholar] [CrossRef]
  19. Al-Fatlawi, O.; Hossain, M.; Essa, A. Optimization of Fracture Parameters for Hydraulic Fractured Horizontal Well in a Heterogeneous Tight Reservoir: An Equivalent Homogeneous Modelling Approach. In Proceedings of the SPE Kuwait Oil & Gas Show and Conference, Kuwait City, Kuwait, 13–16 October 2019. [Google Scholar]
  20. Shirbazo, A.; Fahimpour, J.; Aminshahidy, B. A new approach to finding effective parameters controlling the performance of multi-stage fractured horizontal wells in low-permeability heavy-oil reservoirs using RSM technique. J Pet. Explor. Prod. Technol. 2020, 10, 3569–3586. [Google Scholar] [CrossRef]
  21. Zhao, J.; Zhao, J.Z.; Hu, Y.G.; Zhang, S.A.; Huang, T.; Liu, X.J. Numerical simulation of multistage fracturing optimization and application in coalbed methane horizontal wells. Eng. Fract. Mech. 2020, 223, 106738. [Google Scholar] [CrossRef]
  22. Kolawole, O.; Wigwe, M.; Ispas, I.; Watson, M. How will treatment parameters impact the optimization of hydraulic fracturing process in unconventional reservoirs? SN Appl. Sci. 2020, 2, 1865. [Google Scholar] [CrossRef]
  23. Wang, H.Z.; Zhao, Z.M.; Zhu, J.; Diao, C.J.; Yang, Y.T. Fracture Parameters Optimization of Horizontal Well Volume Fracturing in Ma18 Block. Solid State Technol. 2020, 63, 6188–6200. [Google Scholar]
  24. Holt, S. Numerical Optimization of Hydraulic Fracture Stage Placement in a Gas Shale Reservoir. Master’s Thesis, Deflt University of Technology, Deflt, The Netherlands, 2011. [Google Scholar]
  25. Wilson, K.C.; Durlofsky, L.J. Computational Optimization of Shale Resource Development Using Reduced-Physics Surrogate Models. In Proceedings of the SPE Western Regional Meeting, Bakersfield, CA, USA, 21–23 March 2012. [Google Scholar]
  26. Jahandideh, A.; Jafarpour, B. Optimization of hydraulic fracturing design under spatially variable shale fracability. J. Pet. Sci. Eng. 2016, 138, 174–188. [Google Scholar] [CrossRef]
  27. Safari, R.; Lewis, R.; Ma, X.D.; Mutlu, U.; Ghassemi, A. Infill-Well Fracturing Optimization in Tightly Spaced Horizontal Wells. SPE J. 2017, 22, 582–595. [Google Scholar] [CrossRef]
  28. Shahkarami, A.; Wang, G.C. Horizontal Well Spacing and Hydraulic Fracturing Design Optimization: A Case Study on Utica-Point Pleasant Shale Play. J. Sus. Energy Eng. 2019, 5, 148–162. [Google Scholar] [CrossRef]
  29. He, Y.W.; Cheng, S.Q.; Li, S.; Huang, Y.; Qin, J.Z.; Hu, L.M.; Yu, H.Y. A Semianalytical Methodology To Diagnose the Locations of Underperforming Hydraulic Fractures Through Pressure-Transient Analysis in Tight Gas Reservoir. SPE J. 2016, 22, 924–939. [Google Scholar] [CrossRef]
  30. Peshcherenko, A.; Bekerov, I.; Chuprakov, D.; Abdrazakov, D. Fast-running model for high-volume hydraulic fracturing. J. Pet. Sci. Eng. 2022, 213, 110430. [Google Scholar] [CrossRef]
  31. Deng, H.Y.; Sheng, G.L.; Zhao, H.; Meng, F.K.; Zhang, H.Y.; Ma, J.L.; Gong, J.; Ruan, J.Y. Integrated optimization of fracture parameters for subdivision cutting fractured horizontal wells in shale oil reservoirs. J. Pet. Sci. Eng. 2022, 212, 110205. [Google Scholar] [CrossRef]
  32. Huang, L.C.; Liang, J.G.; Ma, J.J.; Chen, W.X. A dynamic bounding surface plasticity damage model for rocks subjected to high strain rates and confinements. Int. J. Impact Eng. 2022, 168, 104306. [Google Scholar] [CrossRef]
  33. Ma, J.J.; Zhao, G.F.; Khalili, N. A fully coupled flow deformation model for elasto-plastic damage analysis in saturated fractured porous media. Int. J. Plast. 2016, 76, 29–50. [Google Scholar] [CrossRef]
  34. Xia, D.B.; Yang, Z.M.; Li, D.L.; Zhang, Y.P.; Zhao, X.L.; Yao, L.L. Research on numerical method for evaluation of vertical well volume fracturing effect based on production data and well test data. J Pet. Explor. Prod. Technol. 2021, 11, 1855–1863. [Google Scholar] [CrossRef]
  35. Ma, J.J. Wetting collapse analysis on partially saturated oil chalks by a modified cam clay model based on effective stress. J. Pet. Sci. Eng. 2018, 167, 44–53. [Google Scholar] [CrossRef]
  36. Aziz, K.; Settari, A. Petroleum Reservoir Simulation; Elsevier: Houston, TX, USA, 1979. [Google Scholar]
  37. Zhang, G.M.; Liu, H.; Zhang, J.; Wu, H.A.; Wang, X.X. Three-dimensional finite element simulation and parametric study for horizontal well hydraulic fracture. J. Pet. Sci. Eng. 2010, 72, 310–317. [Google Scholar] [CrossRef]
  38. Peter, P.V.; Lee, W.J. A Better Way to Forecast Production from Unconventional Gas Wells. In Proceedings of the SPE Annual Technical Conference and Exhibition, Florence, Italy, 19–22 September 2010. [Google Scholar]
  39. Wang, H.Y.; Zhou, D.S.; Gao, Q.; Fan, X.; Xu, J.Z.; Liu, S. Study on the Seepage Force-Induced Stress and Poroelastic Stress by Flow Through Porous Media Around a Vertical Wellbore. Int. J. Appl. Mech. 2021, 13, 2150065. [Google Scholar] [CrossRef]
  40. Muther, T.; Aftab, A.; Ismail, A.I. Analysis on the effect of different fracture geometries on the productivity of tight gas reservoirs. Malay. J. Fundam. Appl. Sci. 2020, 16, 201–211. [Google Scholar] [CrossRef]
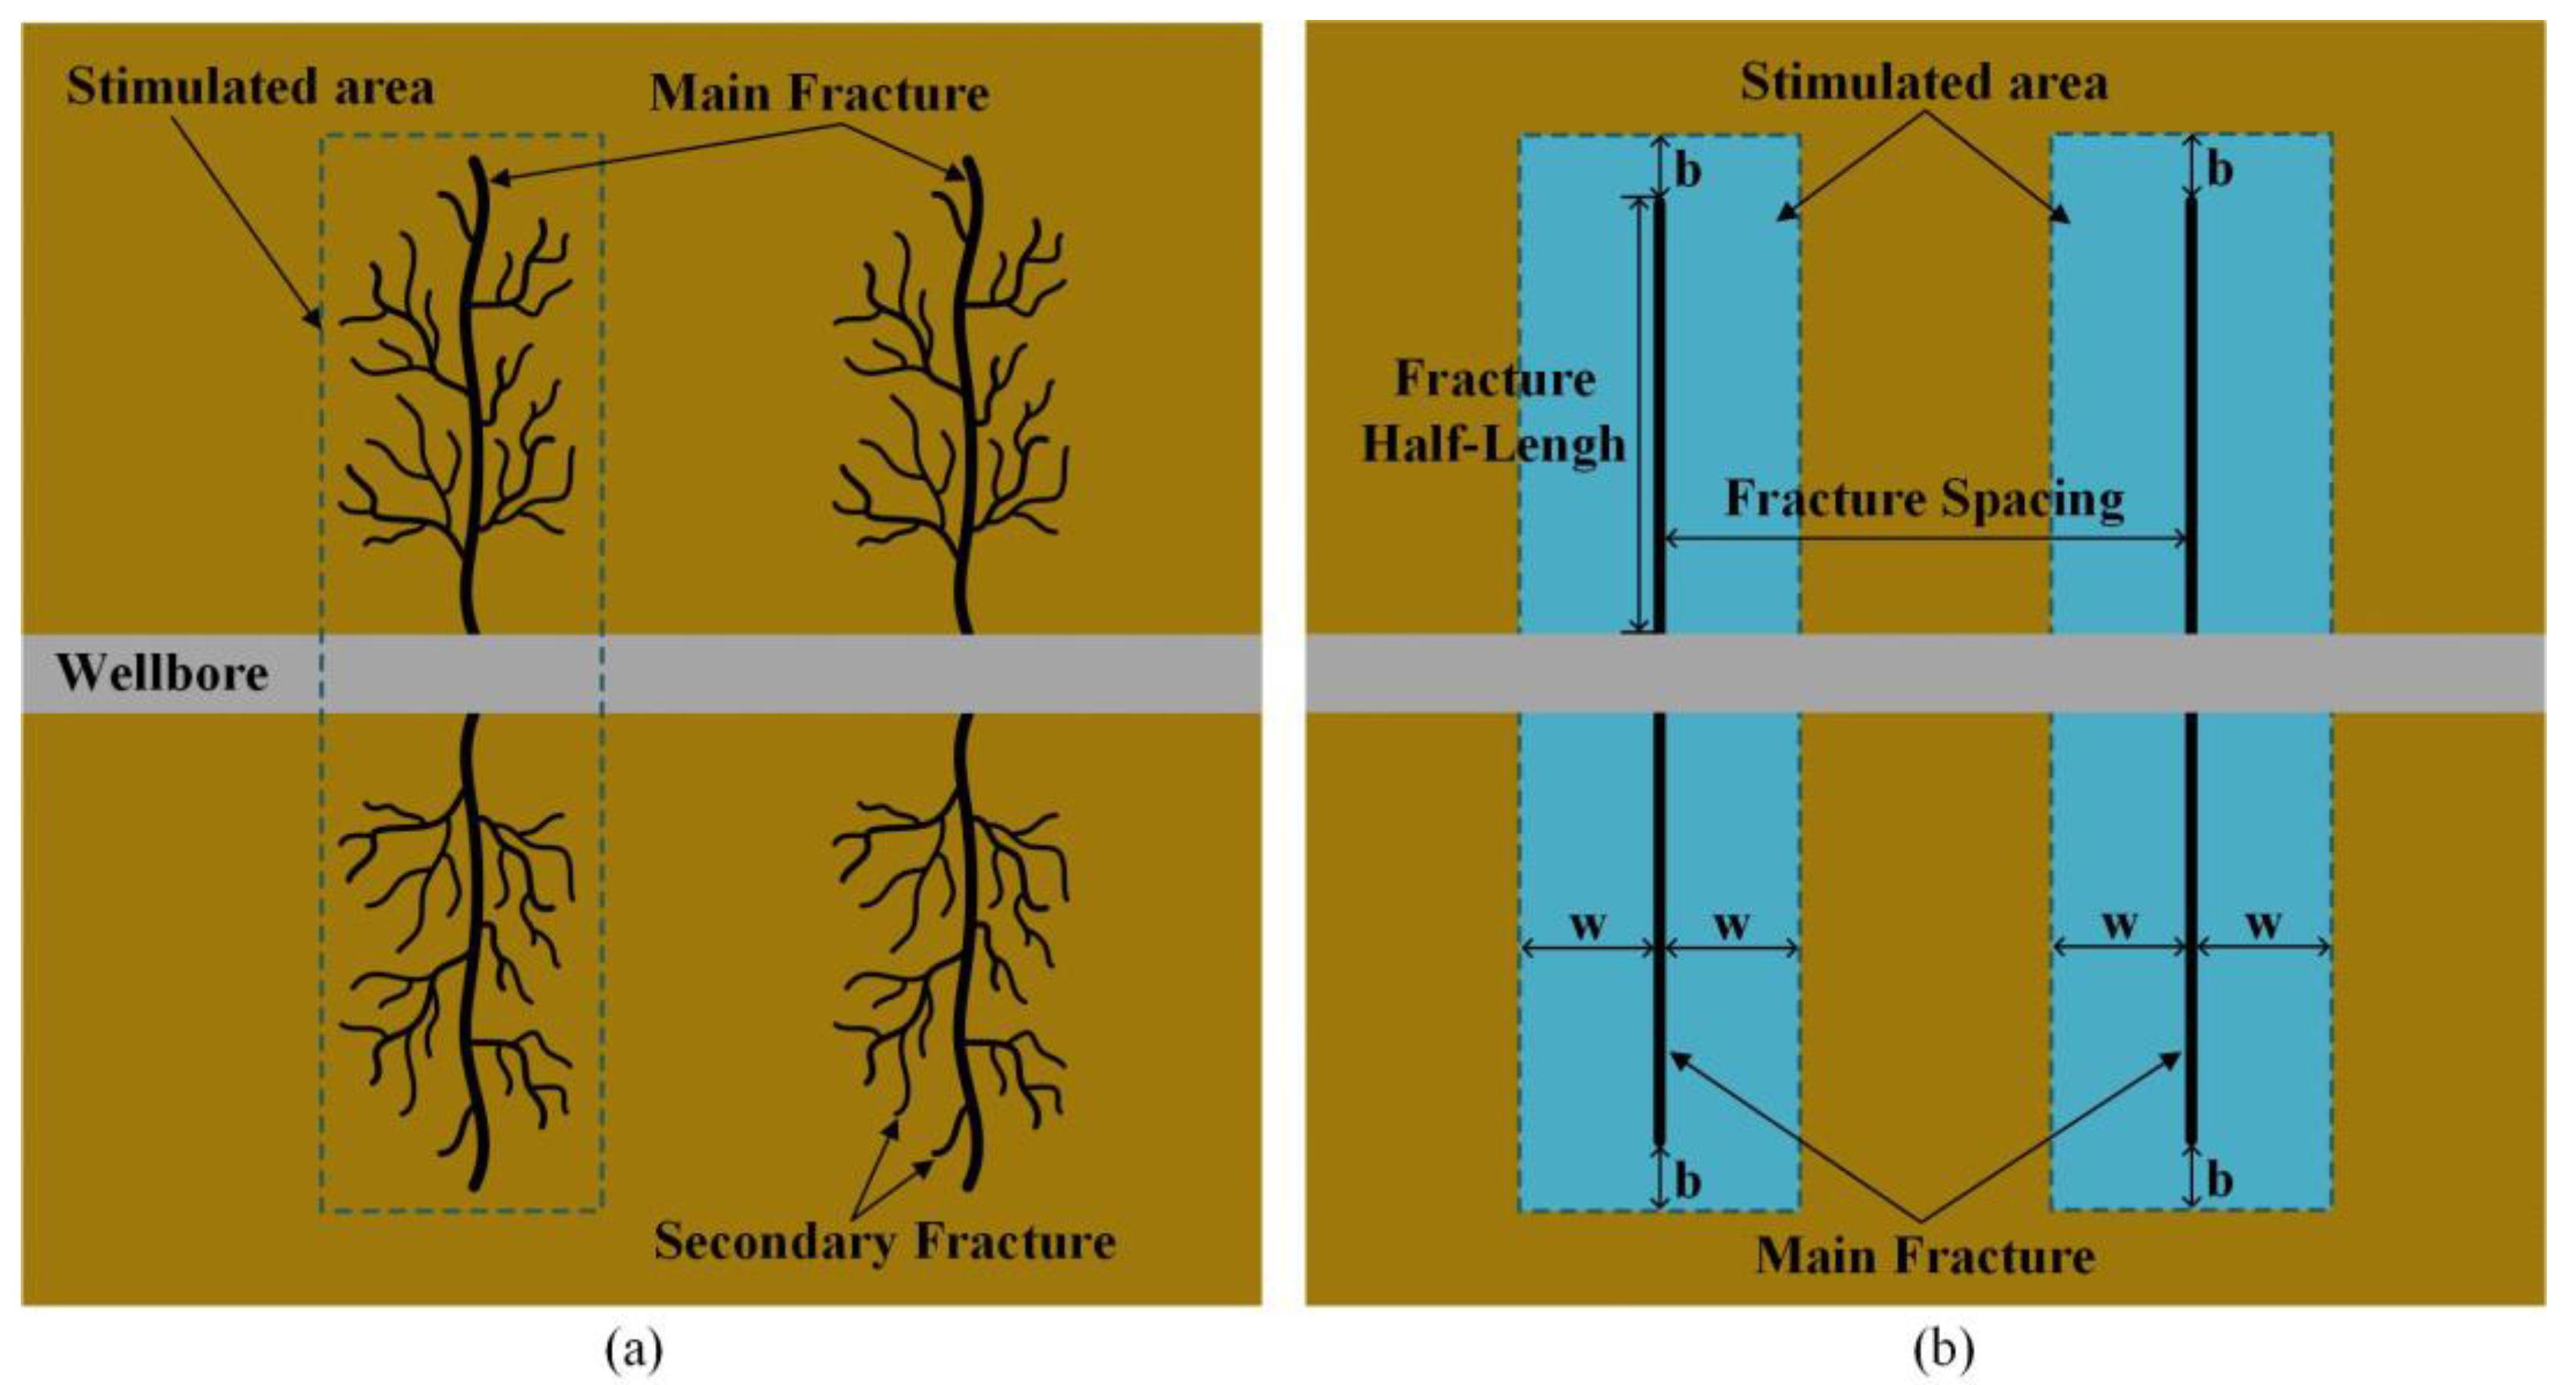
Figure 1. Effect of volume fracturing in tight oil reservoirs. (a) Actual stimulated effect; (b) Production simulation model.
Sustainability 14 15531 g001
Figure 2. Reservoir production simulation model of well JW-1. (a) 2D geological view; (b) 3D geological view.
Sustainability 14 15531 g002
Figure 3. Daily oil production history fitting curves of well JW-1.
Sustainability 14 15531 g003
Figure 4. Evolution of cumulative oil production after fracturing under different fracture numbers. (a) Evolution of cumulative oil production over time under different fracture numbers; (b) Comparison of the cumulative oil production growth rate under different fracture numbers.
Sustainability 14 15531 g004
Figure 5. Evolution of cumulative oil production after fracturing under different fracture half-lengths. (a) Evolution of cumulative oil production with time under different fracture half-lengths; (b) Comparison of the cumulative oil production growth rate under different fracture half-lengths.
Sustainability 14 15531 g005
Figure 6. Evolution of cumulative oil production after fracturing under different fracture conductivities. (a) Evolution of cumulative oil production with time under different fracture conductivities; (b) Comparison of the cumulative oil production growth rate under different fracture conductivities.
Sustainability 14 15531 g006
Figure 7. Distribution of pore pressure around fractures during the production process. (a) Scheme 1 (2 months); (b) Scheme 1 (8 months); (c) Scheme 1 (2 years); (d) Scheme 1 (5 years).
Sustainability 14 15531 g007
Figure 8. Different FPCs (the horizontal axis represents the optimal fracture half-length for each scheme).
Sustainability 14 15531 g008
Figure 9. Cumulative oil production of six different FPCs.
Sustainability 14 15531 g009
Figure 10. Pore pressure distribution one year postfracturing under six different FPCs.
Sustainability 14 15531 g010
Figure 11. FPC of the double branched horizontal well. (a) Aligning fracture placement; (b) Alternate fracture placement.
Sustainability 14 15531 g011
Figure 12. Cumulative oil production over five years under aligned FPCs with different well spacings.
Sustainability 14 15531 g012
Figure 13. Cumulative oil production over five years under alternate FPC with different well spacings.
Sustainability 14 15531 g013
Figure 14. Pore pressure distribution one year postfracturing under aligned FPCs with different well spacings.
Sustainability 14 15531 g014
Figure 15. Pore pressure distribution one year postfracturing under alternate FPC with different well spacing.
Sustainability 14 15531 g015
Table 1. Basic parameters of the reservoir production simulation model.
Fitting ParameterWell JW-1Fracture ParameterWell JW-1
Reservoir effective thickness (m)16.5Horizontal well length (m)1000
Reservoir average porosity (%)10.2Fracture number20
Reservoir permeability (mD)0.21Fracture half-length (m)160
Crude oil density (g/cm3)0.84Fracture height (m)30
Reservoir pressure (MPa)16.21Fracture width (mm)15
Drainage area (km2)0.823Fracture permeability (mD)20,000
Dimensionless reservoir aspect ratio0.667Fracture conductivity (mD·m)300
Total reservoir compression
coefficient (MPa−1)
5.45 × 10⁻⁴Stimulated area bandwidth (m)50
Equivalent reservoir viscosity (cp)1.5Stimulated area effective
permeability (mD)
8
Temperature (°C)59.0
Publisher’s Note: MDPI stays neutral with regard to jurisdictional claims in published maps and institutional affiliations.