Abstract
In this analytical investigation, preheated palm oil was used in the direct injection diesel engine with various optimization methods. The main purpose of the optimization was to get better results than the conventional engine. Raw palm oil was heated using the heat exchange process to reduce the density and viscosity. The relationship between the output process and factors response was evaluated in the design of experiment methods. The Taguchi method is an important method for optimization of the output response performance and emission characteristics of a diesel engine. Two important factors—output and input—were calculated. The input factors considered were preheated palm biodiesel blend, torque, injection pressure, compression ratio, and injection timing. The output factors calculated were smoke opacity, carbon monoxide emission, and brake-specific fuel consumption by using the signal-to-noise (S/N) ratio and analysis of variance. Carbon monoxide was most impacted by torque conditions through injection timing and injecting pressure, and opacity of smoke emission. Among them, injection timing had a higher impact. Different biodiesel blends were prepared: B10 (90% diesel + 10% oil), B20 (80% diesel + 20% oil), B30 (70% diesel + 30% oil) and B40 (60% diesel + 40% oil). Silver nanoparticles (50 ppm) were constantly mixed with the various biodiesel blends. The smoke opacity emission for the biodiesel blend B30 + 50 ppm silver nanoparticle showed the lowest S/N ratio and achieved better optimum results compared with the other blends. The blend B30 + 50 ppm silver nanoparticle showed the lowest S/N ratio value of 9.7 compared with the other blends. The smoke opacity, carbon monoxide emission, and brake-specific fuel consumption of all the response optimal factors were found to be 46.77 ppm, 0.32%, and 0.288 kg/kW·h, respectively.
1. Introduction
Natural problems, such as higher amounts of pollutants from environment and the impending depletion of nonrenewable energy sources, are the significant problems being faced for more than two decades. The petroleum engine produces less torque compared to the diesel engine. The diesel engine is more powerful than the spark-ignition engine and is thus used for high torque and automotive sector. However, it emits more harmful pollution, which may lead to acid rain, cause global warming, and impact human life [1]. To reduce the air pollution and environmental impact, biodiesels were introduced due to their low smoke opacity, hydrocarbon, and carbon monoxide emission characteristics. Nonetheless, there were drawbacks such as high oxides of nitrogen and cold flow properties for using biodiesel in the engine [2].
In many studies, the optimization method was introduced in the conventional engine to optimize various emission attributes and increase the performance of the engine. The Taguchi approach is an efficient method and has been adopted by many researchers. The True Mileage Unknown (TMU) developed by Electronic Control Unit (ECU) systems was used for various injection parameters. Hydrogen fuel was used in the inlet manifold system [3]. The optimization method used in Taguchi analysis was based on various parameters of the diesel engine, such as brake-specific fuel consumption (BSFC), brake thermal efficiency (BTE), and volumetric efficiency. The BSFC was reduced by 68.98% when hydrogen was mixed with diesel fuel. If the hydrogen content was increased, it was observed that there was a 33.14% increase in the volumetric efficiency.
The multi-objective optimization method is the best method to find low BSFC, high BTE, and high volumetric efficiency [4]. In the investigation, various techniques were used to reduce the nitric oxides (NOx), hydrocarbon (HC), carbon monoxide (CO), and smoke opacity emissions. It was found that these parameters were well optimized when the Taguchi method was implemented. The Taguchi L18 array concept was used to calculate the signal-to-noise (S/N) ratio and ANOVA was used to determine the various parameters modified in the engine. The NOx, smoke opacity, CO, and HC were affected by nozzle protrusion, IT, swirl level, pitch to clearance, nozzle holes, and injection pressure. The Taguchi L18 approach is the best method to optimize the tailpipe emission in the direct-injection (DI) conventional engine [5]. In this investigation, Karanja oil methyl ester was used in a variable compression ratio in the base engine. To solve the problems, the Taguchi method and a combination of gray relational analysis were applied with multiple responses. Using the S/N ratio was the best option to achieve optimum results [6]. The various blends, namely B0, B10, B20, B30, B40, and B50, were prepared and used in the conventional engine. Among all the blends, the B50 blend showed the best emission and performance characteristics without affecting any parameters in the engine [7]. In this study, diethyl ether and palm oil were used in DI of the base engine with various ratios of palm oil and diethyl. Various parameters such as IT and IP were modified to investigate the emission performance attributes of the base engine. The Taguchi L18 array was used in the investigation to give a better solution. The low concentration of the diethyl ether ratio showed the highest S/N ratio for BSFC, BTE, and exhaust gas recirculation. The blend B20 also showed the highest S/N ratio due to reducing CO and smoke opacity emission [8]. In the investigation, three types of coating materials—titanium, aluminum, and copper—were used in the DI diesel engine with varying speeds of 1400, 2000, 2600, and 3600 rpm. The optimum results were found with the material such as aluminum added with 13% of titanium at 2600 rpm, and engine power was better at 3600 rpm. The Taguchi methods were used to study the L16 array approach, with changes in various parameters such as TBC material, torque, and speed of the engine. The highest S/N ratio was seen with the TBC material of aluminum added with 13% titanium at 2600 rpm and for the engine power at 3600 rpm [9]. In the experiments, polanga biodiesel was used for the DI conventional engine without any major fuel modification. The Taguchi method was implemented and the various parameters, such as injection timing, load, and IP, were changed. At 200 bar pressure, optimum results were obtained for injection timing of 17.14 °C bTDC and 2.56 kW load, and the NOx emission was found to be reduced. At 200 bar pressure, injection timing of 12.83 °C bTDC and 4.84 kW load gave optimum results with increased BTE [10]. The Taguchi method was adopted in the investigation and polanga biodiesel was used in the diesel engine. The biodiesel was blended with diesel and the B30 blend was prepared. The blend B30 with injection pressure of 220 bar gave the optimum results. The input and output variables of the optimum value for BTE, NOx, and hydrocarbon emission were found to be 32.59%, 20.33 ppm, and 94.2%, respectively [11]. The engine was fueled with karanja biodiesel, and the performance and emission characteristics were determined using Taguchi methods. Four types of input parameters were investigated. When the torque was increased, the two parameters (BTE and NOx) reached the optimum value. The other two input parameters also reached optimal values. The experiments were carried out by using the Taguchi method using L16. The results showed optimum output response for 100% load condition, B20 blend (80% diesel + 20% oil), and compression ratio of 17.5% [12]. The aims of these experiments were to decrease the BSFC, NOx, HC, and CO, and to increase the BTE in the DI diesel engine. The optimum S/N ratio was used for determining the NOx emission [A3/B2/C3]. The HC emission [A3/B1/C2] was calculated using a lesser S/N ratio; the release of CO was determined using the smaller, the better S/N concept (i.e., A3/B1/C1) [13]. The effects of biogas flow rate, engine power, and intake temperatures on engine efficiency were also examined in this work. The engine in consideration was a compression ignition (CI) engine that runs in a dual-fuel mode while using biogas as the primary energy source and diesel as the pilot fuel. To reduce the number of tests below 9, a Taguchi method was used, and the S/N ratio was used to examine the best performance metrics [14].
In a previous study, when the Taguchi method was adopted, the L18 orthogonal arrays approach gave the optimum results and also controlled the BSFC, CO, and smoke opacity of the IC engine. Experimentally, preheated palm oil was used and added to diesel in various percentage ratio of B10, B20, B30, and B40. Various operating conditions were used for given input parameters such as preheated palm oil, ignition timing, torque, and ignition pressure, and the output results were obtained in terms of smoke opacity, BSFC, and carbon monoxide emission. To adopt the optimal blend, compression ratio, injection pressure, torque, and injection timing were used for the input variable in the base engine and three parameters, namely BSFC, the opacity of smoke, and carbon monoxide, were used for output variable from the conventional engine. The main objective of our research was to control the various emission parameters and improve the performance characteristics of the engine. Palm oil biodiesel mixed with the nanoparticle was used to obtain more oxygen, which helps to burn fuel completely during the combustion process.
The performance and emission parameters of various preheated oil blends with pure diesel are shown in Table 1. The upward and downward arrow marks used in the table show increase and decrease, respectively. Table 2 shows the downward and upward emission and performance parameters of biodiesel mixed with water nanoparticles.

Table 1.
Different preheated oils combined with pure diesel having different performance and emissions characteristics.

Table 2.
Biodiesel with water nanoparticles: emission and performance characteristics.
2. Material and Methods
2.1. Outlines for Palm Oil
Currently, palm oil is one of the world’s the most familiar raw vegetable oils, and its overall usage is 33% in India. Palm oil in India and other countries is used as a regular cooking oil. In a European country, palm oil use was 51% in the year 2017, to control emission from automobiles and trucks. The production of palm oil in India began in 1991 with 5000 tons, which increased to 200,000 tons in 2018. It is estimated that palm oil usage will be more than 9.3 million tons by 2030. As the local production is restricted, enormous imports are unavoidable. Figure 1 shows the amount of fatty acids in palm oil [31].
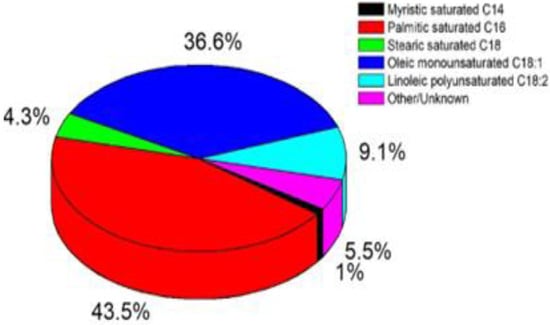
Figure 1.
Amount of various fatty acids in palm oil’s (percentages).
2.2. Fuels Properties
The raw oil is not used directly in the DI diesel engine due to high viscosity and density of the fuel. To reduce the high viscosity and density of the fuel, two main methods are used. One is the transesterification procedure to deliver biodiesel and the other method is the preheating process, which is the latest one [32]. In the preheating process, time consumption is very less relative to the transesterification method. Crude palm oil was poured into a heat exchanger and heated up to 110 °C to decrease the viscosity and density [33,34,35,36,37]. Figure 2 shows that Fuel preparation flow chart. Diesel was added in various ratios (i.e., 90%, 80%, 70%, and 60%) and mixed with the preheated oil. Various blends were prepared to investigate and termed as B10, B20, B30, and B40 [38]. To determine the chemical and physical properties of various blends, they were tested as per the ASTM standards. Table 3 shows the properties of various fuel blends. The properties of the test fuel and diesel are very close to each other due to the preheating process. Preheated oil was used in a conventional base engine without any major modificationshows the process for preparing the fuel.
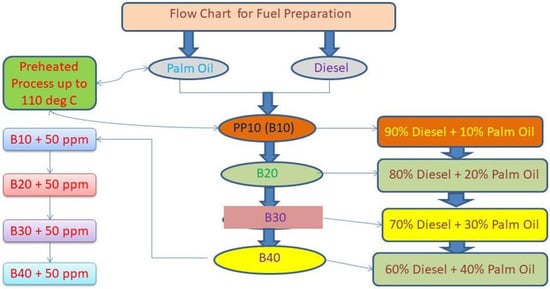
Figure 2.
Fuel preparation flow chart.

Table 3.
Fuel property.
2.3. Experimental Procedure and Heat Exchange Process
The experiments were carried out in a single-cylinder four-stroke conventional base engine, as shown in Figure 3, which illustrates the experimental setup. An eddy current and torque dynamometer was coupled with a diesel engine. Initially, the diesel engine was warmed up and run up to 30 min to achieve the stabilized condition [39]. A smoke meter and an exhaust gas analyzer were used to measure the quantity of the CO and smoke opacity emissions in the tailpipe. The gas analyzer was used to determine the various emissions such as NOx, CO, HC, and CO2 emitted from the base engine whereas the smoke meter was used to measure the smoke opacity. The emission parameters are discussed in Sections 4.3–4.5 [40]. Raw oil was directly used in the conventional engine as due to its high density and viscosity. To lessen the density and viscosity, transesterification and preheating processes were used. The preheating process was conducted using two types of heater and heat exchange process [41,42,43]. The oil was heated at a constant temperate of 110 °C with the help of a temperature-reading instrument. Figure 4 shows that heat exchange process.
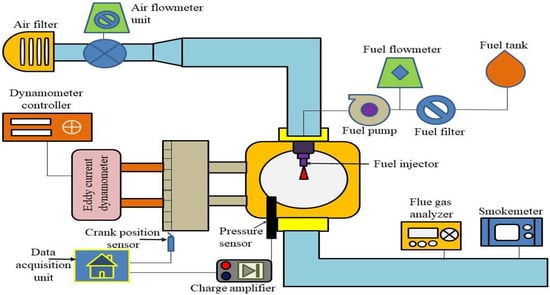
Figure 3.
Experimental setup.
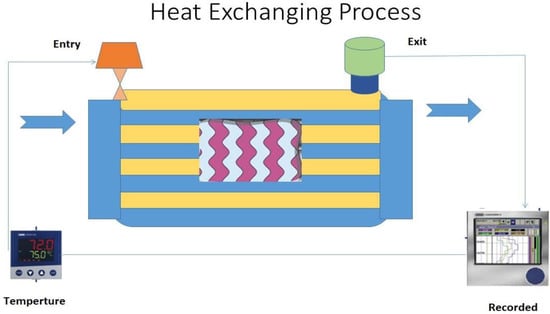
Figure 4.
Heat exchange process.
2.4. FTIR
The outcomes of Fourier transform infrared (FTIR) examination are shown in Figure 5. In the figure various stretches of bonds appear at changed peaks; N–H bonds of value 3432.94, single aldehyde of 2777.28, C–H, O–H bonds of 2676.19; C≡C bonds of 2071.75, C=C bonds of 1637.58, and C=O bonds of 1121.56. The peaks close to 3464, 2935, and 2867 cm−1 are attributed to extending OH bond and C–H extending of aldehydic individually. The bands at 1632 cm−1 are related to amide emergence because of carbonyl length. The peakat 1055 cm−1 relates to extending the reverberation of the amine C–N. The peak at about 1753 cm−1 is correlated to extending the bond of C=C. The peak close to 841 cm−1 is attributed to C=CH2 and the peaks close to 682 and 658.94 cm−1 are due to out-of-plane bending. The bond CH reverberation is CH=CH of subbed ethylene frameworks. The FTIR spectra of silver nanoparticles displayed unmistakable peaksat 2927.78, 1631.45, and 1383.65 cm−1. The sharp peak at 1641 cm−1 indicates solid ingestion in the bond because of to the extending vibration of C=O (NH) gathering [44,45,46,47,48]. The 1393 OF band produced for C–N and C–C extending; the nearness of the top at 2927 cm−1 was doled out to extending reverberation separately C–H and C–H.
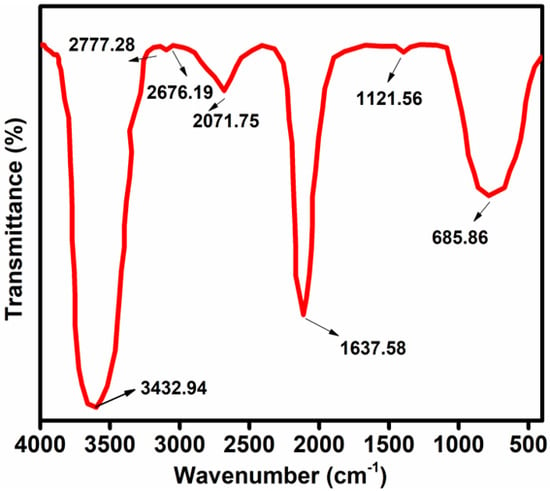
Figure 5.
FTIR analysis for the palm oil.
2.5. XRD
The nanoparticles prepared were studied using powder XRD. Figure 6 shows the XRD pattern of silver nanoparticles. The figure unmistakably shows the sharp peaks at (2θ) 39.20, 45.57, 65.58, and 78.87 relating to the (111), (200), (220) and (311) planes, respectively. Comparing JCPDS (card no. 89-3722), green-incorporated AgNP sample was found to have an FCC structure with normal crystallite size.
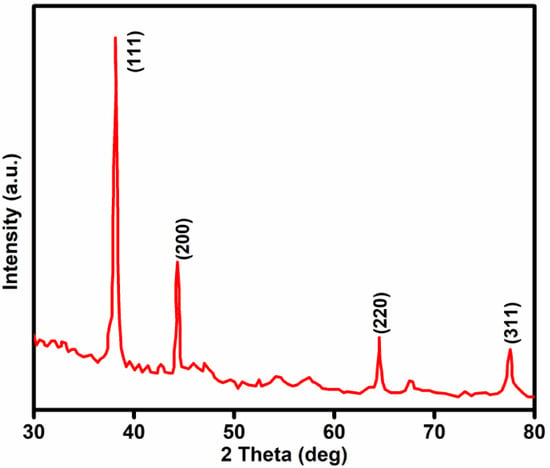
Figure 6.
XRD analysis for silver.
2.6. GC-MS Analysis
In this examination, the concentrates of methanol in preheated palm oil recognized the nearness of 9th significant mixes with the particular weight of sub-atomic and territory as appeared by the nearness of different top shown in the figure. Mixes were distinguished by examining their discontinuity of mass [49]. 1,3-Dioxane has a capacity to fight malignant growth and parasitic infection. Likewise, numerous studies have shown that carboxylic utilitarian gathering present in the concentrate has antibacterial and anticancer actions. Figure 7 shows the gas chromatography–mass spectrometry (GC-MS) analysis of palm oil.
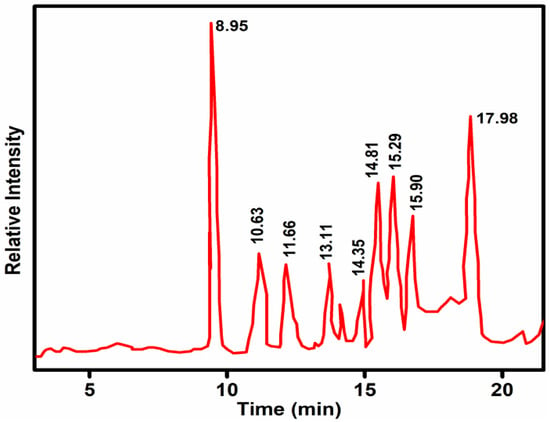
Figure 7.
GC-MS analysis for palm oil nanoparticles.
2.7. Synthesis of Silver Nanoparticles
The silver nanoparticles were synthesized using 25 mL palm oil. Silver nanoparticles were added to 230 mL of 0.001 M deionized water and mixed all together [50]. The mixture was stored in a shaker bottle at 150 rpm at room temperature. Shading adjustments at the subsequent arrangement were performed at regular intervals by calculating absorbance at 380–720 nm using UV noticeable spectrum rays [51,52,53,54]. The shaker rotated at 11,000 rpm for 35 min and the obtained product was cleaned three times with refined water, deionized water, and lastly with ethanol, and then put away at −45 °C for additional examination. Figure 8 shows the SEM images of silver nanoparticles.
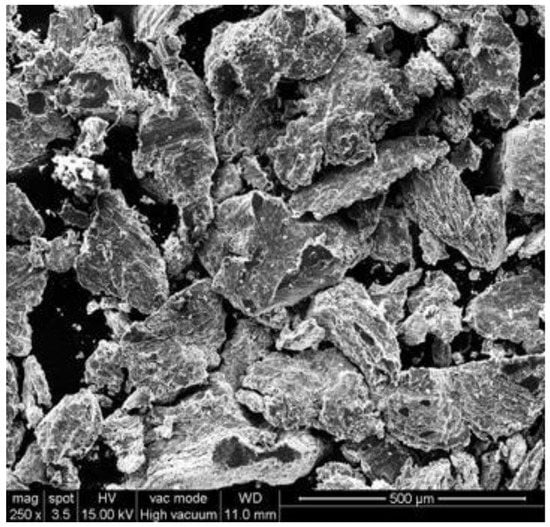
Figure 8.
SEM images of silver nanoparticles.
2.8. Signal-to-Noise Level
In the Taguchi method, a small proportion of power is used to distinguish control, which decreases changeability of an item or procedure by limiting the impacts of noise factors [34]. Control factors are those plan and procedure stepsthat can be controlled. Noise factors cannot be controlled during creation or item use but can be controlled during experimentation [55]. The S/N ratio was examined to calculate the aspect attribute of the nominal-the-superior, lower-the-improved, and higher-the-improved in the Taguchi method. In this investigation, the lower-the-better aspect attribute was studied to calculate the optimum sequences of factors [56]. Table 4 shows the chemical composition of palm oil.

Table 4.
Chemical composition of palm oil.
3. Experimental Design
The most significant step in optimization in the Taguchi technique isidentification of the entry factors while influencing the experiment’s performance responses to a more prominent stage [57]. Various operating conditions were used to obtainthe most important input parameters such as preheated palm oil, ignition timing, torque, and ignition pressure. The output parameters obtained are smoke opacity, carbon monoxide, and BSFC. Multiple levels of entry factors are chosen to establish the desired versatile combination of factors to get the necessary exit responses [58,59]. All entry factors and their level look are shown in Table 5. In this investigation, according to the Taguchi method, an L16 array with five columns and sixteen rows is considered in Table 6. Each symmetrical array deals with four levels of entry limits. Figure 9 indicates the strategy for evaluating and Table 7 shows that experimental setup. Different engine input parameters are used in the investigation. The engine torque load represents the (V), palm oil various blend (W), compression ratio (X), injection pressure (Y) and injection Timing (Z).

Table 5.
Various engine parameters and their levels.

Table 6.
Taguchi L16 orthogonal arrays.
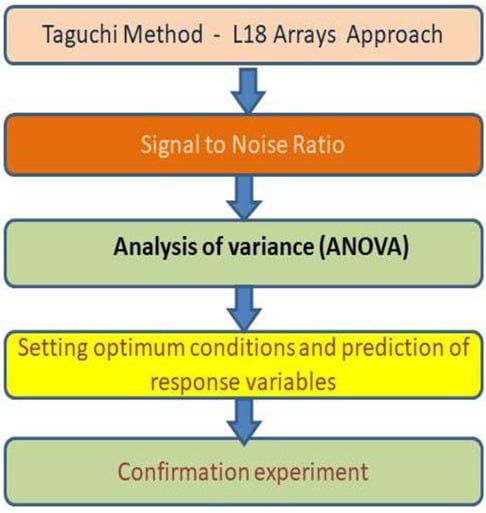
Figure 9.
Research methodology.

Table 7.
Test engine specification.
4. Results and Discussion
4.1. S/N Ratio
S/N ratiowas used to distinguish the manageable variables, which decreased the impact of the noise variables on the returns. The variables of greater S/N ratio were chosen to produce the optimum quality results and lesser variation. The essentialness level of every specification is the S/N ratio versus variables levels bend shifts starting with first levels then onto the next level, as shown in Figure 5, Figure 6 and Figure 7. The difference between greatest and least mean average S/N ratio value was determined for every specification (see Table 5). The data show that the greater difference is attributed to a greater impact on the exit (output) returns [60]. This S/N ratio of the optimum value is associated with the mean average compared with the optimum quantities. The variable level versus S/N ratio is shown in Table 7
where n is the number of observations and y represents the data observed.
4.2. Brake-Specific Fuel Consumption
Figure 10 shows the effect of S/N ratio on the BSFC with respect to torque for the various optimization parameters used in the diesel engine. Generally, the BSFC of diesel engine is inversely proportional to the BTE [61]. The BTE was increased and BSFC was decreased in the conventional diesel engine. The blend, torque, ignition timing, ignition pressure, and compression ratio were varied in the diesel engine to find the best optimum results in the conventional engine. The S/N ratio with the better-the-lower attributes can be used to calculate the BSFC. The outcomes were replaced by 2 and the calculated values had S/N ratio for all returns variables. These values were optimized for various engine parameters. The optimized results were obtained for 5 Nm engine torque (V), biodiesel 30% and diesel 70% + silver nanoparticles 50 ppm (B30) (W), injection timing 27 bTDC (Z), compression ratio 17.2:1 (X), and ignition pressure 205 bar (Y). B30 showed the optimum results for the S/N ratio value of 9 compared to the other blends. With an increase in the compression ratio, the S/N ratio value was decreased compared with other CRs. The optimum results were obtained for 18.1:1 compression ratio. With an increase in the torque, the S/N ratio value was increased to achieve the optimum result at 5 Nm. The injection timing (26 crank angle degree before top dead center, bTDC) and injection pressure were obtained for calculating the optimum results and the results then compared with the other injection timings and pressures (V1W3X4Y3Z3).
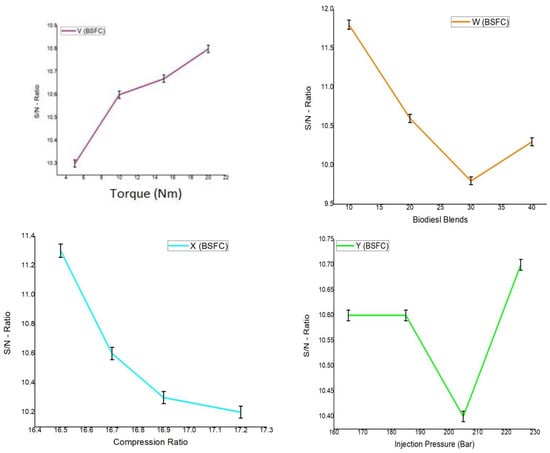
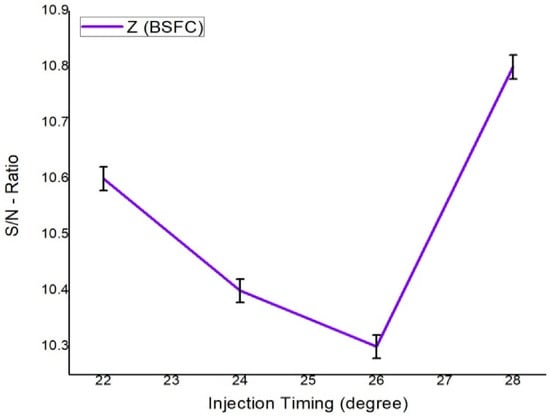
Figure 10.
Brake-specific fuel consumption for S/N ratio.
4.3. Carbon Monoxide
Figure 11 shows the S/N ratio for carbon monoxide variation with torque for the various optimization parameters adopted in the current engine. The formation of carbon monoxide in the diesel engine was because the fuels did not burn completely during the combustion process [62]. The S/N ratio of carbon monoxide with the better-the-lower characteristics can be used. The outcomes were replaced by 2, as shown in Figure 6. The obtained results were the S/N ratio value for all returns variables. With an increase in the torque, the S/N ratio was also increased, and achieved the optimum value at 5 Nm (V) torque, which was then compared with the optimum torque values of others. The blends B30 + 50 ppm silver nanoparticle showed the lowest S/N ratio value of 9.7 compared with the other blends. The S/N ratio for the optimum result of B30 (W) was 9.7 compared with the other optimum blends. With an increase in compression ratio, the S/N ratio values were also increased to achieve the optimum result of 17.2 for CR (X) compared with the other CR optimum results. With an increase in the injection pressure, the S/N ratios were also increased and suddenly dropped at 185 bar pressure but showed optimum results at 165 bar (Y) compared with the S/N ratios of other injection pressure. When the injection timing was increased, the S/N ratio increased up to 22 IT and dropped suddenly and then achieved the optimum value of 27°bTDC (Z) compared with the other injection timings. These values were optimized in various engine parameters obtained (V1W3X4Y1Z4) [63].
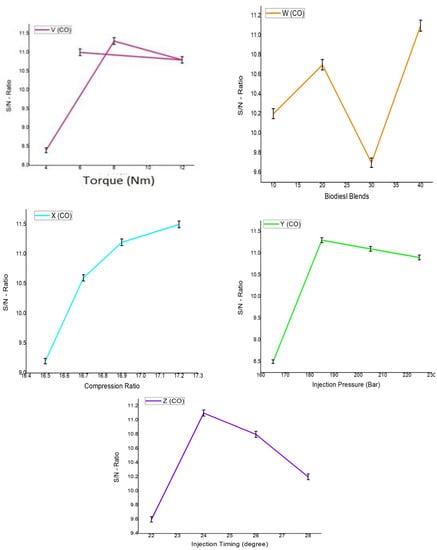
Figure 11.
S/N ratio of carbon monoxide.
4.4. Smoke Opacity
Figure 12 shows the S/N ratio of smoke opacity with operating torque for the various optimization parameters used in the diesel engine. Formation of smoke opacity emission increased the temperature andamount of soot particles. The smoke opacity, the S/N ratio with the better-the-lower attributes can be used [64]. The results were replaced by 2; their estimated results were the S/N ratios for all returns variables. With an increase in the torque, the S/N ratio was also increased to reach the optimum results for 5 Nm torque compared with the other torque. The smoke opacity for the biodiesel blend B30 + 50 ppm silver nanoparticle showed the lowest S/N ratio and optimum results compared with that of the other blends. When the CR was increased, the S/N ratio also increased compared with the CR. Optimum results were obtained for 16.9 CR compared with the other compression ratios. On increasing the injection pressure, the S/N ratio also increased and then decreased and achieved optimum results for 185 bar compared with the other blends. With an increase in the injection timing, the S/N ratios were increased and dropped suddenly at IP 24 and showed a better injection timing at 26 IP compared with the other injection timings. These values were optimized for various engine parameters obtained (V1W1X3Y2Z3). Table 8: S/N value for output returns and Table 9: S/N ratios at the various factors range.
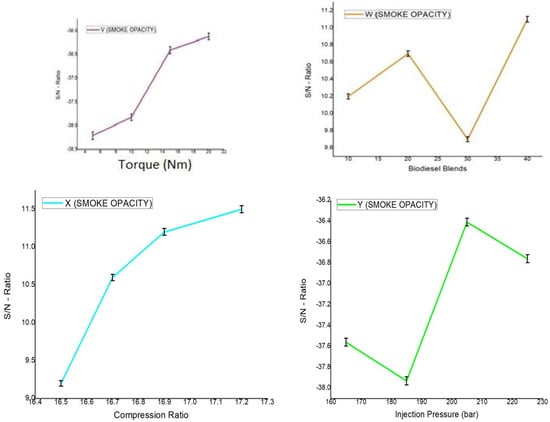
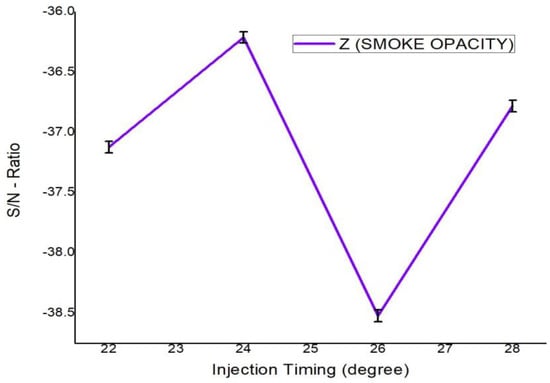
Figure 12.
S/N ratio for smoke opacity.

Table 8.
S/N value for output returns.

Table 9.
S/N ratios at the various factors range.
5. ANOVA
The important parameters in the diesel engine are injection timing, injection pressure, compression ratio, torque, and various blends. To calculate the output parameters forthe diesel engine, carbon monoxide, smoke opacity, and BSFC and its variances were calculated. The analyses of the variance (ANOVA) for three output returns were performed and the results are shown in Table 10.

Table 10.
ANOVA results.
5.1. Brake-Specific Fuel Consumption
The BSFC is the consumption of per unit ofa specific fuel, which evaluates eco-friendliness [65,66,67]. Various parameters such as IT, IP, and CR were considered to operate the engine with different biodiesel blends, namely B10, B20, B30, and B40. The results of ANOVA showed that the compression ratio affects the BSFC. The main reason might be the increase in the maximum cylinder pressure with an increase in CR due to the higher amount of fuel injected through the combustion chamber, which further increased the effective power [68].
5.2. CO
The CO emission was analyzed for optimized joined diesel engine technique parameters. The outcomes of the ANOVA for the attributes of the output of carbon monoxide are shown in Table 8. The F values of ANOVA are clearly shown in Table 9. Torque condition, ignition timing, and injecting pressure impact the carbon monoxide emissions. The decrease in carbon monoxide emission might be a direct result of the atomization and disproportionate dissemination of small amounts of fuel in the ignition chamber [69].
5.3. Smoke
For smoke opacity, the injection procedures for various parameters are shown in Table 9. The F values show that torque condition and injection timing affect smoke opacity. Mixing of various biodiesel blends and injection pressure also moderately affects the smoke opacity [70].
6. Optimum Conditions and Response Variables for Prediction
6.1. Optimal Combinationof Engine Performance Parameters
Calculating optimal combination of engine performance parameters in the degree of freedomis the next step to determine the optimal states of the regulation of various parameter to yield optimal returns [71]. The response parameters optimized in this investigation were BTHE and volumetric efficiency, and emissions and BSFC were reduced. Optimum parameters provided the highest values of BTHE and lesser values of oxides of nitrogen, hydrocarbon, and brake-specific consumption. The S/N ratio for the ideal setting was controlled using the optimum parameters [72]. In the ideal estimation of reaction, factors can be anticipated using the below substance equation
where T is the output response variable f and X1 is the control and design parameter values for the ith level of parameter X.
6.2. BSFC
The optimal test results of all returns parameters such as carbon monoxide, BSFC, and smoke opacity were put into Equation (3) to determine the S/N ratio, as shown in Figure 5. The diesel engine parameters obtainedwere A1B3C4D3E3. Using Equation(3), the value of BSFC was found to be 0.34 kJ/kW·h [46].
6.3. CO
The optimal test results for all returns factors such as carbon monoxide, BSFC, and smoke opacity were substituted in Equation (3) to determine the S/N ratio (Figure 6). The optimum diesel engine parameters obtained were V1W3X4Y3Z4. Using Equation (3), the value of CO was found to be 0.38%.
6.4. Smoke
The optimal test results are substituted in the Equation (3) to all returns factors such as carbon monoxide, BSFC, and smoke opacity to determine the S/N ratio in Figure 11. The diesel engine parameters for optimization results obtained were V1W1X3Y2Z3. From Equation (3), the value of smoke opacity was determined as 109.66 [73].
7. Confirmation Experiment
The Taguchi method is the final step to confirm the results. When the factors of optimum combinations were selected, the predicted average factor value was compared to the average factor value [43]. In this investigation, experiments were conducted with the help of Equations (4) and (5). The final results are shown in Table 11.

Table 11.
Confirmation experiment.
neff = N/1 + DOFt
DOFe = degrees of freedom for the errors
VARe = variance of replication errors
Neff = number effective of replication
N = total numbers of conducted experiments
DOFT = degrees of freedom for mean optimum
F (α, 1, fe) = F-ratio required for the 100% (1 − a) confidence interval
8. Conclusions
In this investigation, the Taguchi method was used to optimize the emission and performance characteristics of the DI diesel engine. The S/N ratio and ANOVA were used to obtain the optimum results. Mainly three parameters were considered for this experiment to optimize the output responses, namely, smoke opacity, carbon monoxide, and BSFC. The compression ratio had the most impact on the BSFC. Carbon monoxide was most affected by torque conditions through injection timing, injecting pressure, and opacity of smoke emission, and among them injection timing had a higher impact. The smoke opacity, carbon monoxide, and BSFC values of all the response-optimal factors were found to be 46.77 ppm, 0.32%, and 0.288 kg/kW·h, respectively.
Author Contributions
Conceptualization, I.S.M.; formal analysis, I.S.M. and E.P.V.; funding acquisition, M.A.; Investigation, M.P.; Methodology, S.R.M.; Resources, E.C. and S.S.; Supervision, E.C. All authors have read and agreed to the published version of the manuscript.
Funding
This research was funded by King Khalid University, Saudi Arabia.
Acknowledgments
The authors extend their appreciation to the Deanship of Scientific Research at King Khalid University, Saudi Arabia, for funding this work through Research Group Program under Grant No. R.G.P.2/133/43.
Conflicts of Interest
The authors declare no conflict of interest.
Abbreviations
| BTE | break thermal efficiency |
| HC | hydrocarbon |
| CO | carbon monoxide |
| NOx | oxides of nitrogen |
| FTIR | Fourier transform infrared |
| XRD | X-ray diffraction |
| GCMS | gas chromatography–mass spectrometry |
| SEM | scanning electron microscope |
| DI | diesel engine |
| BSFC | break-specific energy consumption |
| TMU | true mileage unknown |
| ECU | electronic control unit |
| IT | injection timing |
| IP | injection pressure |
References
- Mahalingam, A.; Munuswamy, D.B.; Devarajan, Y.; Radhakrishnan, S. Investigation on the emission reduction technique in acetone-biodiesel aspirated diesel engine. J. Oil Palm Res. 2018, 30, 345–349. [Google Scholar] [CrossRef]
- Siva, R.; Devarajan, Y. Effect of flow rate and concentration of carbamide on the reducing NOx emissions in palm biodiesel fuelled researh engine. J. Oil Palm Res. 2019, 31, 281–285. [Google Scholar]
- Jayakar, J.; Elumalai, P.V.; Annamalai, K.; Mailainathan, M.; Dhinesh, B.; Harikrishnan, G. Macroscopic characteristics of palm oil and palm oil methyl ester using dimensionless analysis. J. Oil Palm Res. 2018, 30, 666–673. [Google Scholar]
- Bose, P.K.; Deb, M.; Banerjee, R.; Majumder, A. Multi objective optimization of performance parameters of a single cylinder diesel engine running with hydrogen using a Taguchi-fuzzy based approach. Energy 2013, 63, 375–386. [Google Scholar] [CrossRef]
- Nataraj, M.; Arunachalam, V.P.; Dhandapani, N. Optimizing diesel engine parameters for low emissions using Taguchi method: Variation risk analysis approach—Part I. Indian J. Eng. Mater. Sci. 2005, 12, 169–181. [Google Scholar]
- Choudhary, A.K.; Chelladurai, H.; Kannan, C. Optimization of Combustion Performance of Bioethanol (Water Hyacinth) Diesel Blends on Diesel Engine Using Response Surface Methodology. Arab. J. Sci. Eng. 2015, 40, 3675–3695. [Google Scholar] [CrossRef]
- Pohit, G.; Misra, D. Optimization of Performance and Emission Characteristics of Diesel Engine with Biodiesel Using Grey-Taguchi Method. J. Eng. 2013, 2013, 915357. [Google Scholar] [CrossRef]
- Abel, S.E.R.; Loh, S.K. Fermentation of biodiesel-derived waste for 1,3-propanediol production with response surface methodology. J. Oil Palm Res. 2017, 29, 74–80. [Google Scholar] [CrossRef][Green Version]
- Özel, S.; Vural, E.; Binici, M. Optimization of the effect of thermal barrier coating (TBC) on diesel engine performance by Taguchi method. Fuel 2019, 263, 116537. [Google Scholar] [CrossRef]
- Sharma, A.; Ansari, N.A.; Singh, Y.; Mustefa, I.; Vivekanandhan, C. Optimization of Engine Parameters using Polanga Biodiesel and Diesel Blends by using Taguchi Method. Mater. Today Proc. 2018, 5, 28221–28228. [Google Scholar] [CrossRef]
- Ansari, N.A.; Sharma, A.; Singh, Y. Performance and emission analysis of a diesel engine implementing polanga biodiesel and optimization using Taguchi method. Process Saf. Environ. Prot. 2018, 120, 146–154. [Google Scholar] [CrossRef]
- Jena, S.P.; Mahapatra, S.; Acharya, S.K. Optimization of performance and emission characteristics of a diesel engine fueled with Karanja biodiesel using Grey-Taguchi method. Mater. Today Proc. 2020, 41, 180–185. [Google Scholar] [CrossRef]
- Prabhahar, M.; Prakash, S.; George, I.; Amith, K.K. Optimization of performance and emission characteristics of bio diesel fuelled VCR engine using Taguchi approach. Mater. Today Proc. 2020, 33, 859–867. [Google Scholar] [CrossRef]
- Ramachandran, S.; Shrivastava, A.; Sharma, A.; Feroskhan, M.; Kuma, R.M.; Dasharath, S. Performance, emission and combustion characteristics of a biogas–diesel dual fuel engine using Taguchi method. Mater. Today Proc. 2022, 54, 548–556. [Google Scholar] [CrossRef]
- Hazar, H.; Sevinc, H.; Sap, S. Performance and emission properties of preheated and blended fennel vegetable oil in a coated diesel engine. Fuel 2019, 254, 115677. [Google Scholar] [CrossRef]
- Prabu, S.S.; Asokan, M.; Prathiba, S.; Ahmed, S.; Puthean, G. Effect of additives on performance, combustion and emission behavior of preheated palm oil/diesel blends in DI diesel engine. Renew. Energy 2018, 122, 196–205. [Google Scholar] [CrossRef]
- Jain, N.L.; Soni, S.; Poonia, M.; Sharma, D.; Srivastava, A.K.; Jain, H. Performance and emission characteristics of preheated and blended thumba vegetable oil in a compression ignition engine. Appl. Therm. Eng. 2017, 113, 970–979. [Google Scholar] [CrossRef]
- Nagaraja, S.; Sooryaprakash, K.; Sudhakaran, R. Investigate the Effect of Compression Ratio Over the Performance and Emission Characteristics of Variable Compression Ratio Engine Fueled with Preheated Palm Oil-Diesel Blends. Procedia Earth Planet. Sci. 2015, 11, 393–401. [Google Scholar] [CrossRef]
- Hazar, H.; Aydin, H. Performance and emission evaluation of a CI engine fueled with preheated raw rapeseed oil (RRO)–diesel blends. Appl. Energy 2010, 87, 786–790. [Google Scholar] [CrossRef]
- Chauhan, B.S.; Kumar, N.; Du Jun, Y.; Lee, K.B. Performance and emission study of preheated Jatropha oil on medium capacity diesel engine. Energy 2010, 35, 2484–2492. [Google Scholar] [CrossRef]
- Karabektas, M.; Ergen, G.; Hosoz, M. The effects of preheated cottonseed oil methyl ester on the performance and exhaust emissions of a diesel engine. Appl. Therm. Eng. 2008, 28, 2136–2143. [Google Scholar] [CrossRef]
- Agarwal, D.; Agarwal, A.K. Performance and emissions characteristics of Jatropha oil (preheated and blends) in a direct injection compression ignition engine. Appl. Therm. Eng. 2007, 27, 2314–2323. [Google Scholar] [CrossRef]
- Pugazhvadivu, M.; Jeyachandran, K. Investigations on the performance and exhaust emissions of a diesel engine using preheated waste frying oil as fuel. Renew. Energy 2005, 30, 2189–2202. [Google Scholar] [CrossRef]
- Kumar, S.; Dinesha, P.; Ajay, C.M.; Kabbur, P. Combined effect of oxygenated liquid and metal oxide nanoparticle fuel additives on the combustion characteristics of a biodiesel engine operated with higher blend percentages. Energy 2020, 197, 117194. [Google Scholar] [CrossRef]
- Mallikarjun, M.V.; Mamilla, V.R.; Rao, G.L.N. Investigations on the Performance and Exhaust Emissions of a Diesel Engine Using Preheated Madhuca Indica Oil As Fuel. Int. J. Mech. Prod. Eng. Res. Dev. 2011, 1, 1–15. [Google Scholar]
- Gad, M.; Jayaraj, S. A comparative study on the effect of nano-additives on the performance and emissions of a diesel engine run on Jatropha biodiesel. Fuel 2020, 267, 117168. [Google Scholar] [CrossRef]
- Yuvarajan, D.; Babu, M.D.; BeemKumar, N.; Kishore, P.A. Experimental investigation on the influence of titanium dioxide nanofluid on emission pattern of biodiesel in a diesel engine. Atmosph. Pollut. Res. 2018, 9, 47–52. [Google Scholar] [CrossRef]
- Ramanan, M.V.; Yuvarajan, D. Emission analysis on the influence of magnetite nanofluid on methyl ester in diesel engine. Atmos. Pollut. Res. 2016, 7, 477–481. [Google Scholar] [CrossRef]
- Dhahad, H.A.; Chaichan, M.T. The impact of adding nano-Al2O3 and nano-ZnO to Iraqi diesel fuel in terms of compression ignition engines’ performance and emitted pollutants. Therm. Sci. Eng. Prog. 2020, 18, 100535. [Google Scholar] [CrossRef]
- Rai, R.K.; Sahoo, R.R. Effective power and effective power density analysis for water in diesel emulsion as fuel in diesel engine performance. Energy 2019, 180, 893–902. [Google Scholar] [CrossRef]
- World Wildlife Fund. Palm Oil. Available online: https://www.worldwildlife.org/industries/palm-oil (accessed on 1 June 2022).
- Li, X.; Cheng, Y.; Zhang, Z.; Ji, S. The Effect of Coupling Injection Parameters and Double-Swirl Chamber on the Diesel Engine Performance. Arab. J. Sci. Eng. 2018, 44, 1393–1401. [Google Scholar] [CrossRef]
- Sudershan, B.G.; Kamoji, M.A.; Rampure, P.B.; Banapurmath, N.R.; Khandal, S.V. Experimental Studies on the Use of Pyrolysis Oil for Diesel Engine Applications and Optimization of Engine Parameters of Injection Timing, Injector Opening Pressure and Injector Nozzle Geometry. Arab. J. Sci. Eng. 2017, 43, 4517–4530. [Google Scholar] [CrossRef]
- Afzal, A.; Kareemullah, M.; Abdul Razak, R.K. Production of Biodiesel from Various Sources and Comparative Engine Performance Studies by Using Different Biodiesel Blends. J. Eng. Res. 2018, 6, 1–21. [Google Scholar]
- Kareemullah, M.; Afzal, A.; Rehman, K.F.; Shahapurkar, K.; Khan, H.; Akram, N. Performance and emission analysis of compression ignition engine using biodiesels from Acid oil, Mahua oil, and Castor oil. Heat Transf. Asian Res. 2019, 49, 858–871. [Google Scholar] [CrossRef]
- Mujtaba, M.; Cho, H.M.; Masjuki, H.; Kalam, M.; Farooq, M.; Soudagar, M.E.M.; Gul, M.; Ahmed, W.; Afzal, A.; Bashir, S.; et al. Effect of alcoholic and nano-particles additives on tribological properties of diesel–palm–sesame–biodiesel blends. Energy Rep. 2020, 7, 1162–1171. [Google Scholar] [CrossRef]
- Elahi, M.; Asif, M.S.; Mohammad, A.; Safaei, R.; Manokar, A.M.; El, A.I.; Olusegun, M.A.M.; Samuel, D.; Anjum, I.; Ahmed, W.; et al. Investigation on the Effect of Cottonseed Oil Blended with Different Percentages of Octanol and Suspended MWCNT Nanoparticles on Diesel Engine Characteristics. J. Therm. Anal. Calorim. 2022, 147, 525–542. [Google Scholar] [CrossRef]
- Verma, T.N.; Nashine, P.; Chaurasiya, P.K.; Rajak, U.; Afzal, A.; Kumar, S.; Singh, D.V.; Azad, A.K. The Effect of Etha-nol-Diesel-Biodiesel Blends on Combustion, Performance and Emissions of a Direct Injection Diesel Engine. Sustain. Energy Technol. Assess. 2020, 42, 100851. [Google Scholar] [CrossRef]
- Ranjit, P.S.; Shaik, K.B.; Chintala, V.; Saravanan, A.; Elumalai, P.V.; Murugan, M.; Reddy, M.S. Direct utilisation of straight vegetable oil (SVO) from Schleichera Oleosa (SO) in a diesel engine—A feasibility assessment. Int. J. Ambient Energy 2022. [Google Scholar] [CrossRef]
- Elumalai, P.; Annamalai, K.; Dhinesh, B. Effects of thermal barrier coating on the performance, combustion and emission of DI diesel engine powered by biofuel oil–water emulsion. J. Therm. Anal. 2018, 137, 593–605. [Google Scholar] [CrossRef]
- Samuel, O.D.; Okwu, M.O.; Oyejide, O.J.; Taghinezhad, E.; Afzal, A.; Kaveh, M. Optimizing biodiesel production from abundant waste oils through empirical method and grey wolf optimizer. Fuel 2020, 281, 118701. [Google Scholar] [CrossRef]
- Kumar, S.S.; Rajan, K.; Mohanavel, V.; Ravichandran, M.; Rajendran, P.; Rashedi, A.; Sharma, A.; Khan, S.A.; Afzal, A. Com-bustion, Performance, and Emission Behaviors of Biodiesel Fueled Diesel Engine with the Impact of Alumina Nanoparticle as an Additive. Sustainability 2021, 13, 12103. [Google Scholar] [CrossRef]
- Manigandan, S.; Atabani, A.; Ponnusamy, V.K.; Pugazhendhi, A.; Gunasekar, P.; Prakash, S. Effect of hydrogen and multiwall carbon nanotubes blends on combustion performance and emission of diesel engine using Taguchi approach. Fuel 2020, 276, 118120. [Google Scholar] [CrossRef]
- Nikzadfar, K.; Shamekhi, A.H. Investigating a new model-based calibration procedure for optimizing the emissions and performance of a turbocharged diesel engine. Fuel 2019, 242, 455–469. [Google Scholar] [CrossRef]
- Arunkumar, M.; Mohanavel, V.; Afzal, A.; Sathish, T.; Ravichandran, M.; Khan, S.; Abdullah, N.; Bin Azami, M.; Asif, M. A Study on Performance and Emission Characteristics of Diesel Engine Using Ricinus Communis (Castor Oil) Ethyl Esters. Energies 2021, 14, 4320. [Google Scholar] [CrossRef]
- Afzal, A.; Soudagar, M.; Belhocine, A.; Kareemullah, M.; Hossain, N.; Alshahrani, S.; Saleel C, A.; Subbiah, R.; Qureshi, F.; Mujtaba, M. Thermal Performance of Compression Ignition Engine Using High Content Biodiesels: A Comparative Study with Diesel Fuel. Sustainability 2021, 13, 7688. [Google Scholar] [CrossRef]
- Samuel, O.D.; Kaveh, M.; Oyejide, O.J.; Elumalai, P.; Verma, T.N.; Nisar, K.S.; Saleel, C.A.; Afzal, A.; Fayomi, O.; Owamah, H.; et al. Performance comparison of empirical model and Particle Swarm Optimization & its boiling point prediction models for waste sunflower oil biodiesel. Case Stud. Therm. Eng. 2022, 33, 101947. [Google Scholar] [CrossRef]
- Yaliwal, V.; Banapurmath, N.; Soudagar, M.E.M.; Afzal, A.; Ahmadi, P. Effect of manifold and port injection of hydrogen and exhaust gas recirculation (EGR) in dairy scum biodiesel—Low energy content gas-fueled CI engine operated on dual fuel mode. Int. J. Hydrogen Energy 2021, 47, 6873–6897. [Google Scholar] [CrossRef]
- Khandal, S.V.; Ağbulut, Ü.; Afzal, A.; Sharifpur, M.; Razak, K.A.; Khalilpoor, N. Influences of hydrogen addition from different dual-fuel modes on engine behaviors. Energy Sci. Eng. 2022, 10, 881–891. [Google Scholar] [CrossRef]
- Hussain, F.; Soudagar, M.; Afzal, A.; Mujtaba, M.; Fattah, I.; Naik, B.; Mulla, M.; Badruddin, I.; Khan, T.; Raju, V.; et al. Enhancement in Combustion, Performance, and Emission Characteristics of a Diesel Engine Fueled with Ce-ZnO Nanoparticle Additive Added to Soybean Biodiesel Blends. Energies 2020, 13, 4578. [Google Scholar] [CrossRef]
- Ziaee, O.; Zolfaghari, N.; Baghani, M.; Baniassadi, M.; Wang, K. A modified cellular automaton model for simulating ion dynamics in a Li-ion battery electrode. Energy Equip. Syst. 2022, 10, 41–49. [Google Scholar]
- Aslimi, M.S.; Dastjerdi, S.M.; Mousavi, S.B.; Ahmadi, P.; Ashjaee, M. Assessment and multi-objective optimization of an off-grid solar based energy system for a Conex. Energy Equip. Syst. 2021, 9, 127–143. [Google Scholar] [CrossRef]
- Sharifi, M.; Amidpour, M.; Mollaei, S. Investigating carbon emission abatement long-term plan with the aim of energy system modeling; case study of Iran. Energy Equip. Syst. 2018, 6, 337–349. [Google Scholar]
- Kumar, B.R.; Saravanan, S.; Sethuramasamyraja, B.; Rana, D. Screening oxygenates for favorable NOx/smoke trade-off in a DI diesel engine using multi response optimization. Fuel 2017, 199, 670–683. [Google Scholar] [CrossRef]
- Subramani, S.; Govindasamy, R.; Rao, G.L.N. Predictive correlations for NOx and smoke emission of DI CI engine fuelled with diesel-biodiesel-higher alcohol blends-response surface methodology approach. Fuel 2020, 269, 117304. [Google Scholar] [CrossRef]
- Uslu, S.; Aydın, M. Effect of Operating Parameters on Performance and Emissions of a Diesel Engine Fueled with Ternary Blends of Palm Oil Biodiesel/Diethyl Ether/Diesel by Taguchi Method. Fuel 2020, 275, 117978. [Google Scholar] [CrossRef]
- Narayana, V.; Ratnam, C.; Rao, R.U.; Prasadarao, K. Multi-response optimization of DI diesel engine performance parameters using Karanja methyl ester by applying Taguchi-based principal component analysis. Biofuels 2016, 8, 49–57. [Google Scholar]
- Ganapathy, T.; Murugesan, K.; Gakkhar, R. Performance optimization of Jatropha biodiesel engine model using Taguchi approach. Appl. Energy 2009, 86, 2476–2486. [Google Scholar] [CrossRef]
- Wu, Z.-Y.; Wu, H.-W.; Hung, C.-H. Applying Taguchi method to combustion characteristics and optimal factors determination in diesel/biodiesel engines with port-injecting LPG. Fuel 2014, 117, 8–14. [Google Scholar] [CrossRef]
- Jadhav, S. Multi-Objective Optimization of Performance (BSFC) and Emission (NOx) Characteristics for CI Engine Operated on Mangifera Indica Methyl Ester Using Taguchi Grey Relational Analysis. SAE Tech. Pap. 2016, 1, 10. [Google Scholar]
- Nigade, S.S. Performance and Emission Characteristics of CI Engine Operated on Madhuca Indica biodiesel using Multi-Objective Optimization by Applying Taguchi Grey Relational Analysis. SAE Int. J. Fuels Lubr. 2016, 9, 392–399. [Google Scholar] [CrossRef]
- Ayhan, V.; Çangal, Ç.; Cesur, İ.; Çoban, A.; Ergen, G.; Çay, Y.; Kolip, A.; Özsert, İ. Optimization of the factors affecting performance and emissions in a diesel engine using biodiesel and EGR with Taguchi method. Fuel 2020, 261, 116371. [Google Scholar] [CrossRef]
- Vellaiyan, S.; Subbiah, A.; Chockalingam, P. Multi-response optimization to improve the performance and emissions level of a diesel engine fueled with ZnO incorporated water emulsified soybean biodiesel/diesel fuel blends. Fuel 2018, 237, 1013–1020. [Google Scholar] [CrossRef]
- Bhalla, V.; Khullar, V.; Tyagi, H. Investigation of factors influencing the performance of nanofluid-based direct absorption solar collector using Taguchi method. J. Therm. Anal. 2018, 135, 1493–1505. [Google Scholar] [CrossRef]
- Gunes, S.; Senyigit, E.; Karakaya, E.; Ozceyhan, V. Optimization of heat transfer and pressure drop in a tube with loose-fit perforated twisted tapes by Taguchi method and grey relational analysis. J. Therm. Anal. 2018, 136, 1795–1806. [Google Scholar] [CrossRef]
- Mohammadi, M.; Abadeh, A.; Nemati-Farouji, R.; Passandideh-Fard, M. An optimization of heat transfer of nanofluid flow in a helically coiled pipe using Taguchi method. J. Therm. Anal. 2019, 138, 1779–1792. [Google Scholar] [CrossRef]
- Abadeh, A.; Passandideh-Fard, M.; Maghrebi, M.J.; Mohammadi, M. Stability and magnetization of Fe3O4/water nanofluid preparation characteristics using Taguchi method. J. Therm. Anal. 2018, 135, 1323–1334. [Google Scholar] [CrossRef]
- Elumalai, P.; Nambiraj, M.; Parthasarathy, M.; Balasubramanian, D.; Hariharan, V.; Jayakar, J. Experimental investigation to reduce environmental pollutants using biofuel nano-water emulsion in thermal barrier coated engine. Fuel 2020, 285, 119200. [Google Scholar] [CrossRef]
- Elumalai, P.V.; Parthasarathy, M.; Hariharan, V.; Jayakar, J.; Iqbal, S.M. Evaluation of water emulsion in biodiesel for engine performance and emission characteristics. J. Therm. Anal. 2021, 147, 4285–4301. [Google Scholar] [CrossRef]
- Parthasarathy, M.; Ramkumar, S.; Elumalai, P.; Gupta, S.K.; Krishnamoorthy, R.; Iqbal, S.M.; Dash, S.K.; Silambarasan, R. Experimental investigation of strategies to enhance the homogeneous charge compression ignition engine characteristics powered by waste plastic oil. Energy Convers. Manag. 2021, 236, 114026. [Google Scholar] [CrossRef]
- Krishnakumar, S.; Khan, T.; Rajashekhar, C.; Soudagar, M.M.; Afzal, A.; Elfasakhany, A. Influence of Graphene Nano Particles and Antioxidants with Waste Cooking Oil Biodiesel and Diesel Blends on Engine Performance and Emissions. Energies 2021, 14, 4306. [Google Scholar] [CrossRef]
- Zare, S.; Ayati, M.; Ha’iriYazdi, M.R.; Kabir, A.A. Convolutional neural networks for wind turbine gearbox health monitoring. Energy Equip. Syst. 2022, 10, 73–82. [Google Scholar]
- Sabzi, S.; Asadi, M.; Moghbelli, H. Review, analysis and simulation of different structures for hybrid electrical energy storages. Energy Equip. Syst. 2017, 5, 115–129. [Google Scholar]
Publisher’s Note: MDPI stays neutral with regard to jurisdictional claims in published maps and institutional affiliations. |
© 2022 by the authors. Licensee MDPI, Basel, Switzerland. This article is an open access article distributed under the terms and conditions of the Creative Commons Attribution (CC BY) license (https://creativecommons.org/licenses/by/4.0/).