1. Introduction
The need for urban planners and local authorities to coordinate the activities related to emergency and ordinary planning is increasing. Despite the existing link between the different planning levels and the emergency planning process, this coordination has never been effectively concretized. It is not yet clear how ordinary planning choices influence emergency planning ones, and vice versa [
1]. In this context, it is necessary to think about new urban planning methods and tools, with particular attention being paid to the existing interconnections between various scientific sectors and different scales of action [
2].
To improve the effectiveness of the emergency measures, it is also necessary that the emergency plans contain in-depth information regarding the main urban elements, which when a hazard occurs must ensure the correct system functionality and response of urban systems. These elements are the strategic buildings (SBs), emergency areas (EAs), and strategic road network [
3].
The strategic road network plays a crucial role in disaster management planning. Its failure modifies the accessibility to urban services, having negative impacts on the economic and social structure of the city. It also influences the effectiveness of the rescue and evacuation procedures in urban areas [
4]. According to its functionality, the decision-makers define the emergency response strategy, such as the evacuation and rescue actions [
5]. During an earthquake, in fact, buildings may collapse and may partially or fully obstruct roads, modifying the practicability of the road network [
6].
The debris generated by the collapsed buildings reduces the capacity of the strategic road network, having negative impacts on the accessibility to EAs and causing delays in the intervention times of first responders [
7]. Therefore, to enhance urban resilience, which is defined as the capacity of a system to reach and maintain a certain level of functionality after a hazard occurs [
8], the interdependence between buildings and strategic road network systems must be analyzed.
Although they did not specifically reference strategic road networks, several researchers have investigated the influence of collapsed buildings on the operationality of transportation systems after the occurrence of an earthquake. Zolfaghari and Mogheisi [
9] proposed a probabilistic approach to evaluate the probability of road closures after earthquakes. The method considers the uncertainties associated with earthquake distributions in time and space, the ground motion distribution, and the damage caused to buildings and road structures. Tamima and Chouinard [
10] developed a probabilistic approach to estimate reductions in road capacity because of debris generated by collapsed buildings, as well as to evaluate the reductions in response times of the first responders. Xu et al. [
6] proposed a method to evaluate the post-earthquake traversability of a road network considering collapsed masonry and reinforced concrete (RC) buildings, which was determined using a multi-degree of freedom (MDOF) model. Argyroudis et al. [
11] proposed a probabilistic systemic risk analysis of a road network considering the potential for blockages due to the collapse of adjacent buildings during an earthquake. Golla et al. [
12] studied the accessibility to local roads by evaluating road closures due to collapsed buildings.
All of these studies have aimed to evaluate road obstructions generated by the collapse of buildings’ structural elements, with particular attention being paid to RC and masonry buildings. No specific references exist for buildings’ non-structural elements, especially in RC-framed buildings, such as masonry infills (MIs). Despite the collapse of these elements being an important issue in the emergency management process, in none of these studies have the road obstructions generated by these elements been evaluated.
The analysis and evaluation of the road obstructions generated by MIs in RC-framed buildings is useful in emergency planning because many researchers have demonstrated that after an earthquake, the losses and costs generated by the collapse of non-structural components of buildings are higher than those from structural damage [
13]. Moreover, the collapse of non-structural elements, such as MIs in RC-framed buildings, is more probable than the collapse of structural elements.
To ensure the effectiveness of the emergency strategies and measures when a seismic hazard occurs, it is highly important to consider the structural behavior of these elements and their interdependence with the strategic road infrastructure system. The assessment of the strategic road network’s practicability, as well as the assessment of its functionality, when considering the effects of collapsed MIs of RC-framed buildings is very useful for the emergency planning process. Moreover, the seismic behavior of MIs in RC-framed buildings is nowadays one of the most relevant research topics in the structural engineering field. The widespread use of these non-structural elements is typical of residential, industrial, and strategic buildings, especially in European countries. Structural models usually do not consider the effects of MIs on the overall response, as their contribution has been considered for isolation and enclosure purposes only. This is mainly due to the heterogeneity of the typologies and the related values of the mechanical properties. However, MIs significantly contribute to the risk mitigation of progressive collapse of cast-in-place and precast RC-framed structures [
14,
15].
Therefore, only the weight of MIs acting on beams is generally included in structural models, and their seismic verification is addressed after the structural analysis through seismic code procedures for in-plane (IP) drift limitations or out-of-plane (OOP) stability checks [
16]. The MI typologies are numerous and differ in their overall thickness, number of layers, block or brick layout, mortar quality, and presence of air cavities. As a consequence, the mechanical parameters may exhibit a high dispersion of values. This is not the case for other building materials such as structural concrete and steel reinforcement, given the higher degree of control and testing.
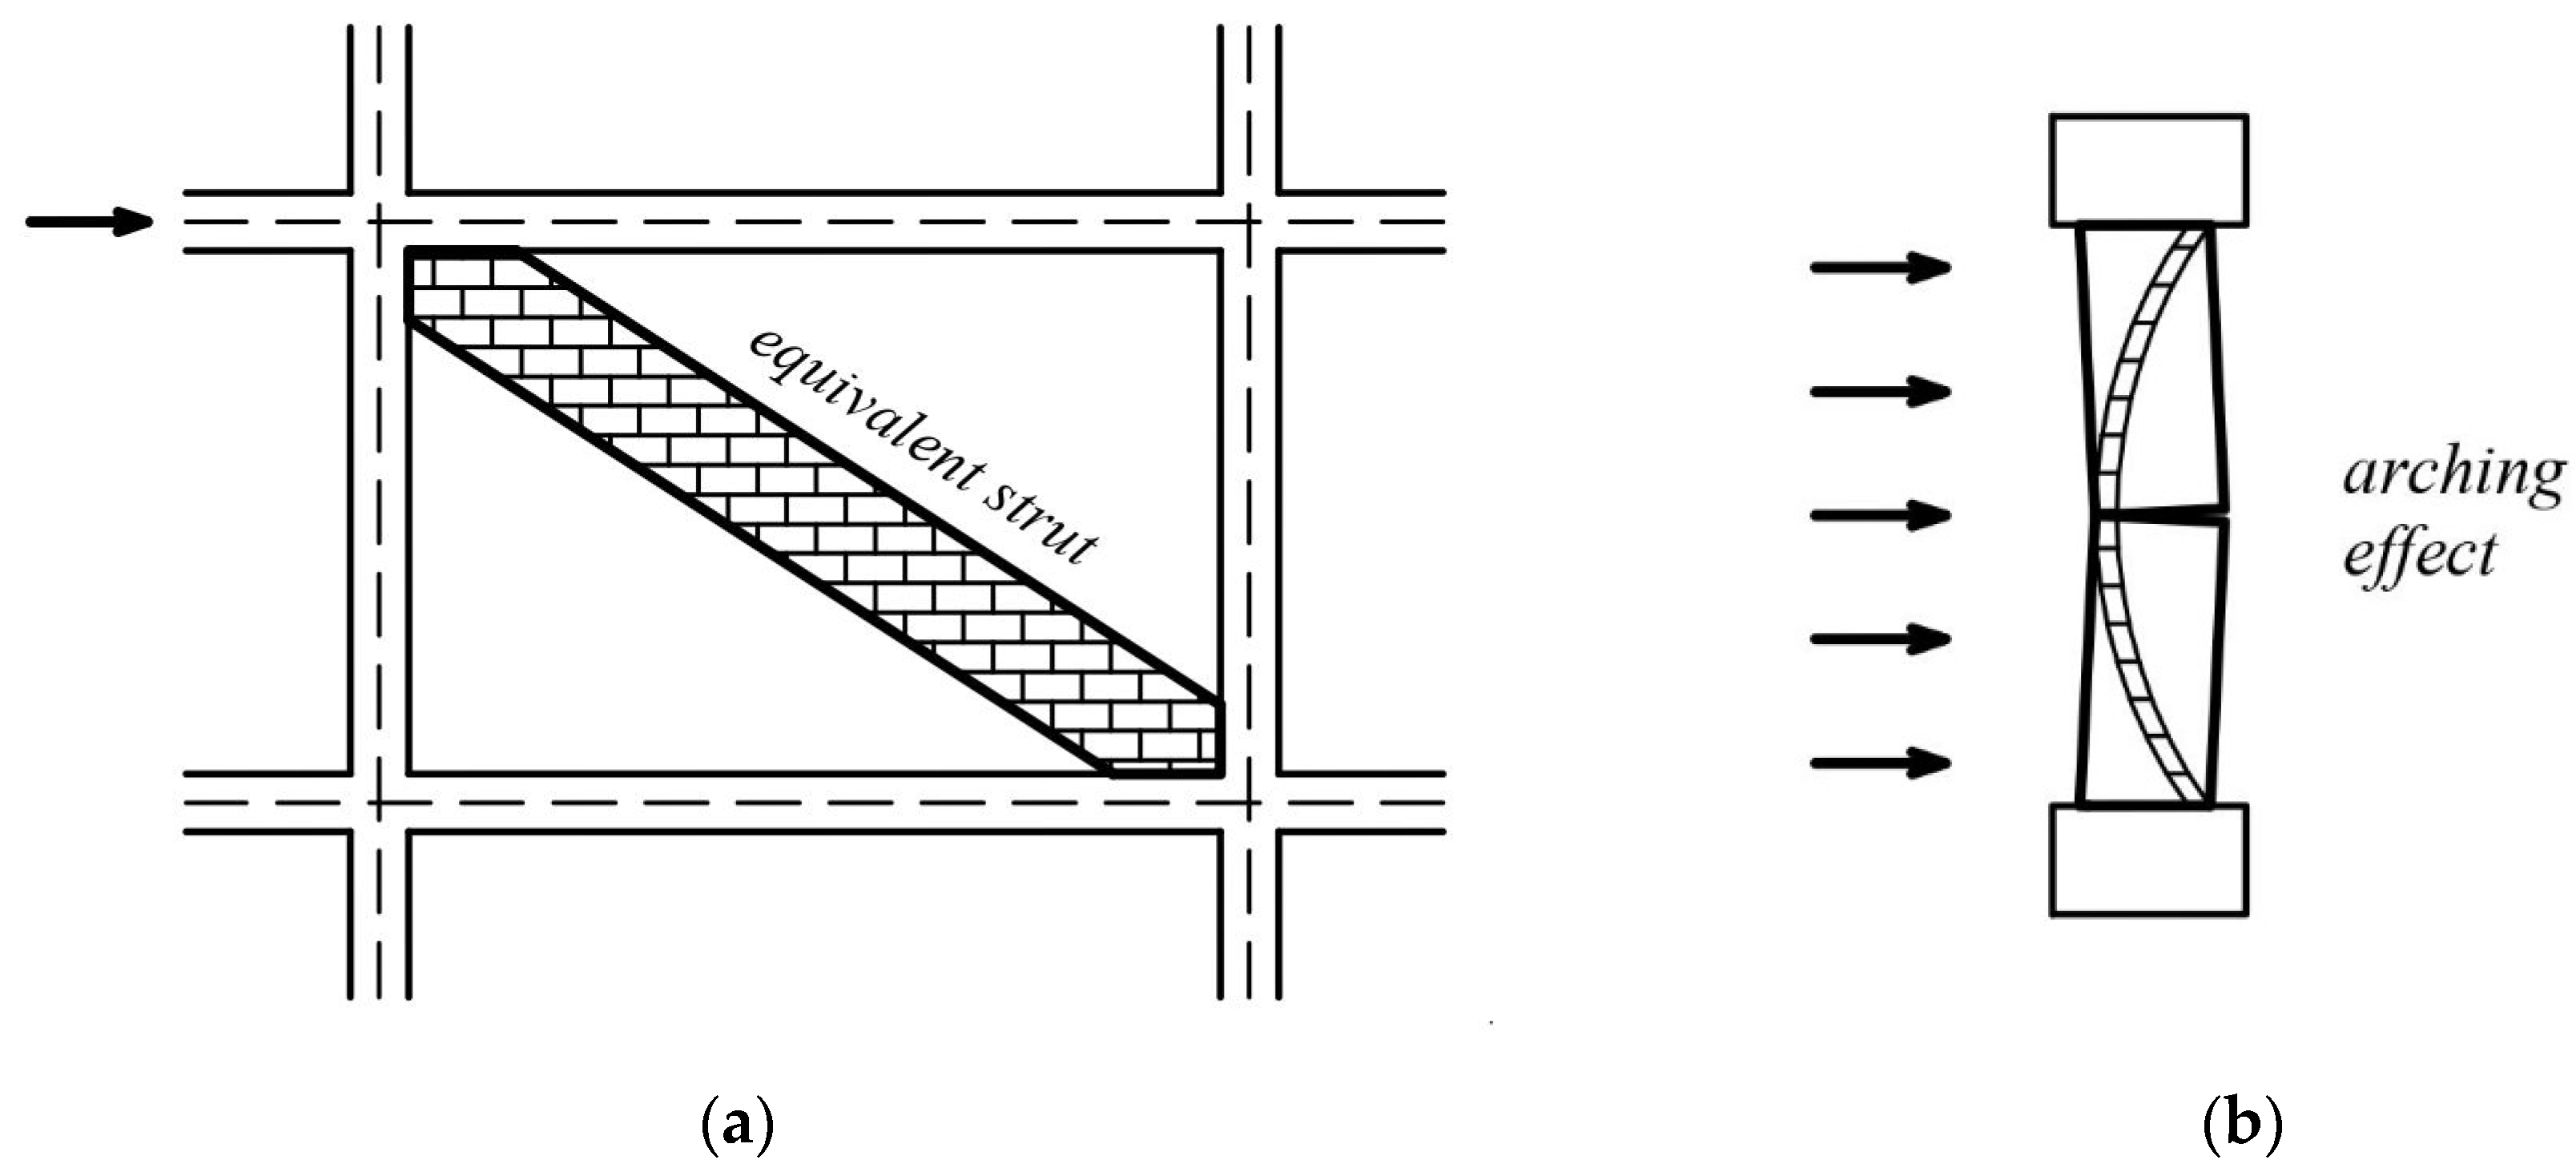
During a seismic event, masonry panels react along two directions: IP and OOP. The RC frame responds to a distribution of horizontal seismic forces applied at the floor level and dynamic equilibrium is reached via the compatible deformation of all structural and non-structural members, until the combination of their local damage forms a global collapse mechanism. MIs contribute to the equilibrium as well. At first, the panels behave elastically, deforming together with the surrounding frame; if the horizontal displacements increase, due to the higher seismic forces, the MIs will detach from the structural elements on two opposite corners. The seismic action is transferred to the panels through the remaining opposite contact corners, establishing an equivalent strut behavior; the diagonal strip is mainly compressed while the other panel areas are mostly unloaded (
Figure 1a). Classic infill modelling strategies aim to define the MI properties (elastic modulus, dimensions, strut strength) to predict the IP inelastic behavior. However, MIs are simultaneously loaded in the OOP direction. In full-contact conditions with the surrounding frame, the MI OOP static scheme can be simplified as a pinned rectangular plate. The inertial action due to its own mass deforms the panel in the OOP direction until an intermediate macro-crack arises. From this point on, a double arching action may be triggered based on the contrast between the cracked panel parts and surrounding structural elements, guaranteeing significant OOP strength (
Figure 1b). This condition can be ensured if the panels are slim enough. Higher OOP acceleration will increase the seismic OOP displacement demands until collapse, after propagation of the cracks along the two diagonal directions.
Research on the seismic behavior of MIs started in 1956, focusing on the IP response [
17,
18,
19]. During the following decades the IP models were refined, extending the applications to MIs with openings and reproducing local effects on RC members [
20,
21,
22]. The OOP behavior has been investigated more recently [
23,
24,
25,
26]. The OOP strength and stiffness are heavily affected by the IP damage, which cumulates during the seismic event (IP→OOP interaction). This topic has been experimentally studied during the last decade only [
27,
28,
29], laying the groundwork for the interpretation of crack patterns and comprehensive MI modelling. Recent earthquakes (i.e., L’Aquila in 2009, Lorca in 2011, Nepal in 2015) increased the awareness of the potential hazard of MIs to lives (falling debris) and structural members (local damage) due to OOP failure. High repair costs and downtimes are also typical long-term consequences.
Therefore, an adequate methodology for MI damage and collapse prediction is needed, based on more complete models than those adopted in the past. The key challenge is to develop an improved, simple, comprehensive, and effective MI macro-model that is able to represent all of the main IP and OOP aspects and reproduce the global effect of MIs on the structural system.
Since few authors have analyzed the traversability conditions of strategic road networks because of the roadside debris generated by the non-structural elements of buildings, to fill this gap the authors propose an evaluation method using a seismic hazard index to assess the practicability of the strategic road network and define the seismic emergency routes, considering the collapse of MIs in RC-framed buildings after a seismic event. To investigate the seismic behavior of MIs and their potential applications in emergency planning, a newly developed MI macro-model [
30,
31] is proposed. It offers the possibility of simulating the IP and OOP seismic responses, their interactions, as well as the collapse occurrence rate. The recent refined IP-OOP models are either 3D or fiber-section-based, with reduced applicability for larger structures (higher computing times, higher memory consumption rates). The proposed macro-model can be easily implemented in a professional code; each panel is composed of five beam elements and their non-linear behavior is handled via built-in routines. Particular attention is paid to the IP → OOP interaction, allowing the user to simulate the effects of IP damage on the OOP response during the seismic event. It is possible to explore the damage state of the panels after the event, as well as the velocity and acceleration at the failure time step, to predict the debris area. The authors tested and applied the proposed method to a geographic area in the municipality of Gioia Tauro (Reggio Calabria, Italy).
This integrated method could be useful for decision-makers and urban planners during the emergency management planning phases, especially during the prevention phase. It represents a useful tool to reduce the loss of performance of the entire urban system after a hazard takes place, identifying the practicable strategic road network. It also helps planners to locate SBs. Moreover, using this tool, urban planners can correctly arrange emergency plans, identifying, before an earthquake, the safest connections between SBs and EAs.
The identification of hazardous roads can guide the allocation of financial resources for extraordinary maintenance interventions, as well as for infrastructure reorganization, in a more effective and accurate way. The definition of a priority order considering the infrastructure level of risk is useful to realize these interventions efficiently. In this sense, the proposed method represents a valid support for the management and maintenance of the heritage of buildings and infrastructure.
The rest of this paper is organized as follows.
Section 2 contains descriptions of the study area and the dataset.
Section 3 describes the methodological framework used to evaluate the practicability of the strategic road network in the context of the collapse of MIs in RC-framed buildings according to the developed MI macro-model.
Section 4 describes and discusses the results for the application of the proposed methodology to the case study.
Section 5 summarizes the conclusions of this research.
2. Study Area and Dataset
Gioia Tauro is a municipality located in the Calabria region, Italy (
Figure 2). It covers an area of 39.87 square kilometres and has a population of around 19,075 inhabitants.
Seismic risk is one of the main risk factors for the Calabria region. From the seismic classification of the Italian territory, which takes into account the intensity and frequency of past earthquakes and divides the territory into four areas with decreasing levels of danger (from 1 to 4, where 1 represents a high danger level and 4 represents a very low danger level), it emerges that about 64% of the Calabrian municipalities (357 out of 404) fall in zone 1 (high danger) and the remaining 36% (157 out of 404) fall in zone 2 (medium danger).
According to the seismic classification of Italian municipalities, the proposed case study falls into a high level of seismic danger. The definition of practices and approaches oriented to improving the efficiency of emergency planning is, therefore, important for such an area.
From an experiment performed in collaboration with the Civil Protection of the Calabria Region [
32], using the potentialities of the GIS environment, the authors built the virtual city [
33,
34] of Gioia Tauro, in which the SBs, EAs, and strategic road network were mapped. The GIS platform considered is the open source QGIS Desktop software [
35].
The authors identified the EAs, for which different characteristics, such as the surface extension, the presence of connections to the services, and the number of hosts were specified, as well as the SBs, defining the type of structure (institutional reference, health facility, school, etc.). Next, the authors identified the connection routes between SBs and EAs as the strategic road networks of the analyzed municipality.
Once the EAs, SBs, and strategic road networks had been identified, the authors considered only the RC-framed buildings facing the strategic road network, since they could potentially interfere with it. The authors retrieved the polygons of the buildings from the Regional Technical Cartography (CTR) information [
36].
Figure 3 represents the part of the strategic urban system used as a case study. The authors identified the municipal building of Gioia Tauro as the SB, three EAs (EA-01, EA-02, EA-04), as well as the strategic road network. The analyzed strategic road network is made up of 17 stretches. The authors identified the stretches by a number from 1 to 17. EA-01, EA-02, and EA-04 had extensions of 0.86 ha, 0.22 ha, and 0.35 ha, respectively.
As shown in
Figure 4, the buildings facing the strategic road network are mainly characterized by the RC-framed structure.
3. Materials and Methods
3.1. Methodology for the Evaluation of the Seismic Hazard Index
The risk degree associated with each strategic road path depends on its exposure, vulnerability, and hazard [
37].
The exposure level depends on the amount of road users that could be potentially involved during the earthquake (direct exposure) and the amount of the population that would not be able to use the infrastructure because of its failure (indirect exposure).
The vulnerability degree estimates the predisposition of the infrastructure to be subjected to damage; therefore, it depends on the characteristics, such as the length and width of the road, the existence of critical elements (bridges, galleries, underpaid, etc.), and the redundancy.
The hazard level is used to evaluate the effect on the road path determined by the interdependence between various types of hazards and different territorial components (structures and infrastructure).
In the present research, in order to quantitatively assess the practicability of the strategic road network based on the collapse of MIs in RC-framed buildings, the authors defined a seismic hazard index for each emergency routes.
A hazard index is generally defined as the combination of a frequency index, an intensity index, and an extension index [
38,
39]. Considering a high intensity level of seismic risk, the intensity level does not affect the formulation. Based on [
40], the authors defined the seismic hazard index as follows:
In (1), Ij represents the seismic hazard index of j-th road, P is the occurrence probability of a seismic hazard, which is a function of the earthquake return period, and EXj is the extension of the j-th road affected by the seismic hazard.
The occurrence probability of seismic hazard during the nominal life of a structure depends on the considered limit state [
16]. Since a high level of seismic risk is considered, the evaluated seismic scenario is the life safety (LS) limit state, according to which the occurrence probability during the nominal life of the structure is equal to 10%.
The extension of the j-th road potentially affected by the seismic risk is assessed as follows:
In Equation (2), Lhs is the length of the stretch affected by an earthquake, nh is the number of hazardous stretches, and Lj is the total length of j-th road.
The length of the stretch affected by the earthquake depends on the obstructions generated by the collapse of buildings adjacent to it. The seismic hazard index considering the obstruction generated by the collapse of MIs is evaluated as the following equation:
Here, Lhs_NS is the length of the stretch affected by the debris area generated by the collapse of MIs in RC-framed buildings facing the j-th road, assessed using the proposed macro-model, while nh_NS is the number of stretches affected by the obstruction.
3.2. Layout and Desing of the Benchmark Structure
The large-scale vulnerability analysis of MIs requires a simplified structural model and a phenomenological non-structural macro-model. A detailed analysis of each building that faces the overall strategic road network would not be practical; the large number of structural surveys, numerical models, analyses, and related post-processing stages would increase both the costs and time required. Therefore, the generic RC-framed building can be represented as an equivalent tridimensional model, designed to match the typological, dimensional, and dynamic parameters of a specified urban setting. This simplified refence model can be defined as the “benchmark structure” to evaluate the effects of design parameter variability, including in the number of stories n
s, bay length L, fundamental period T
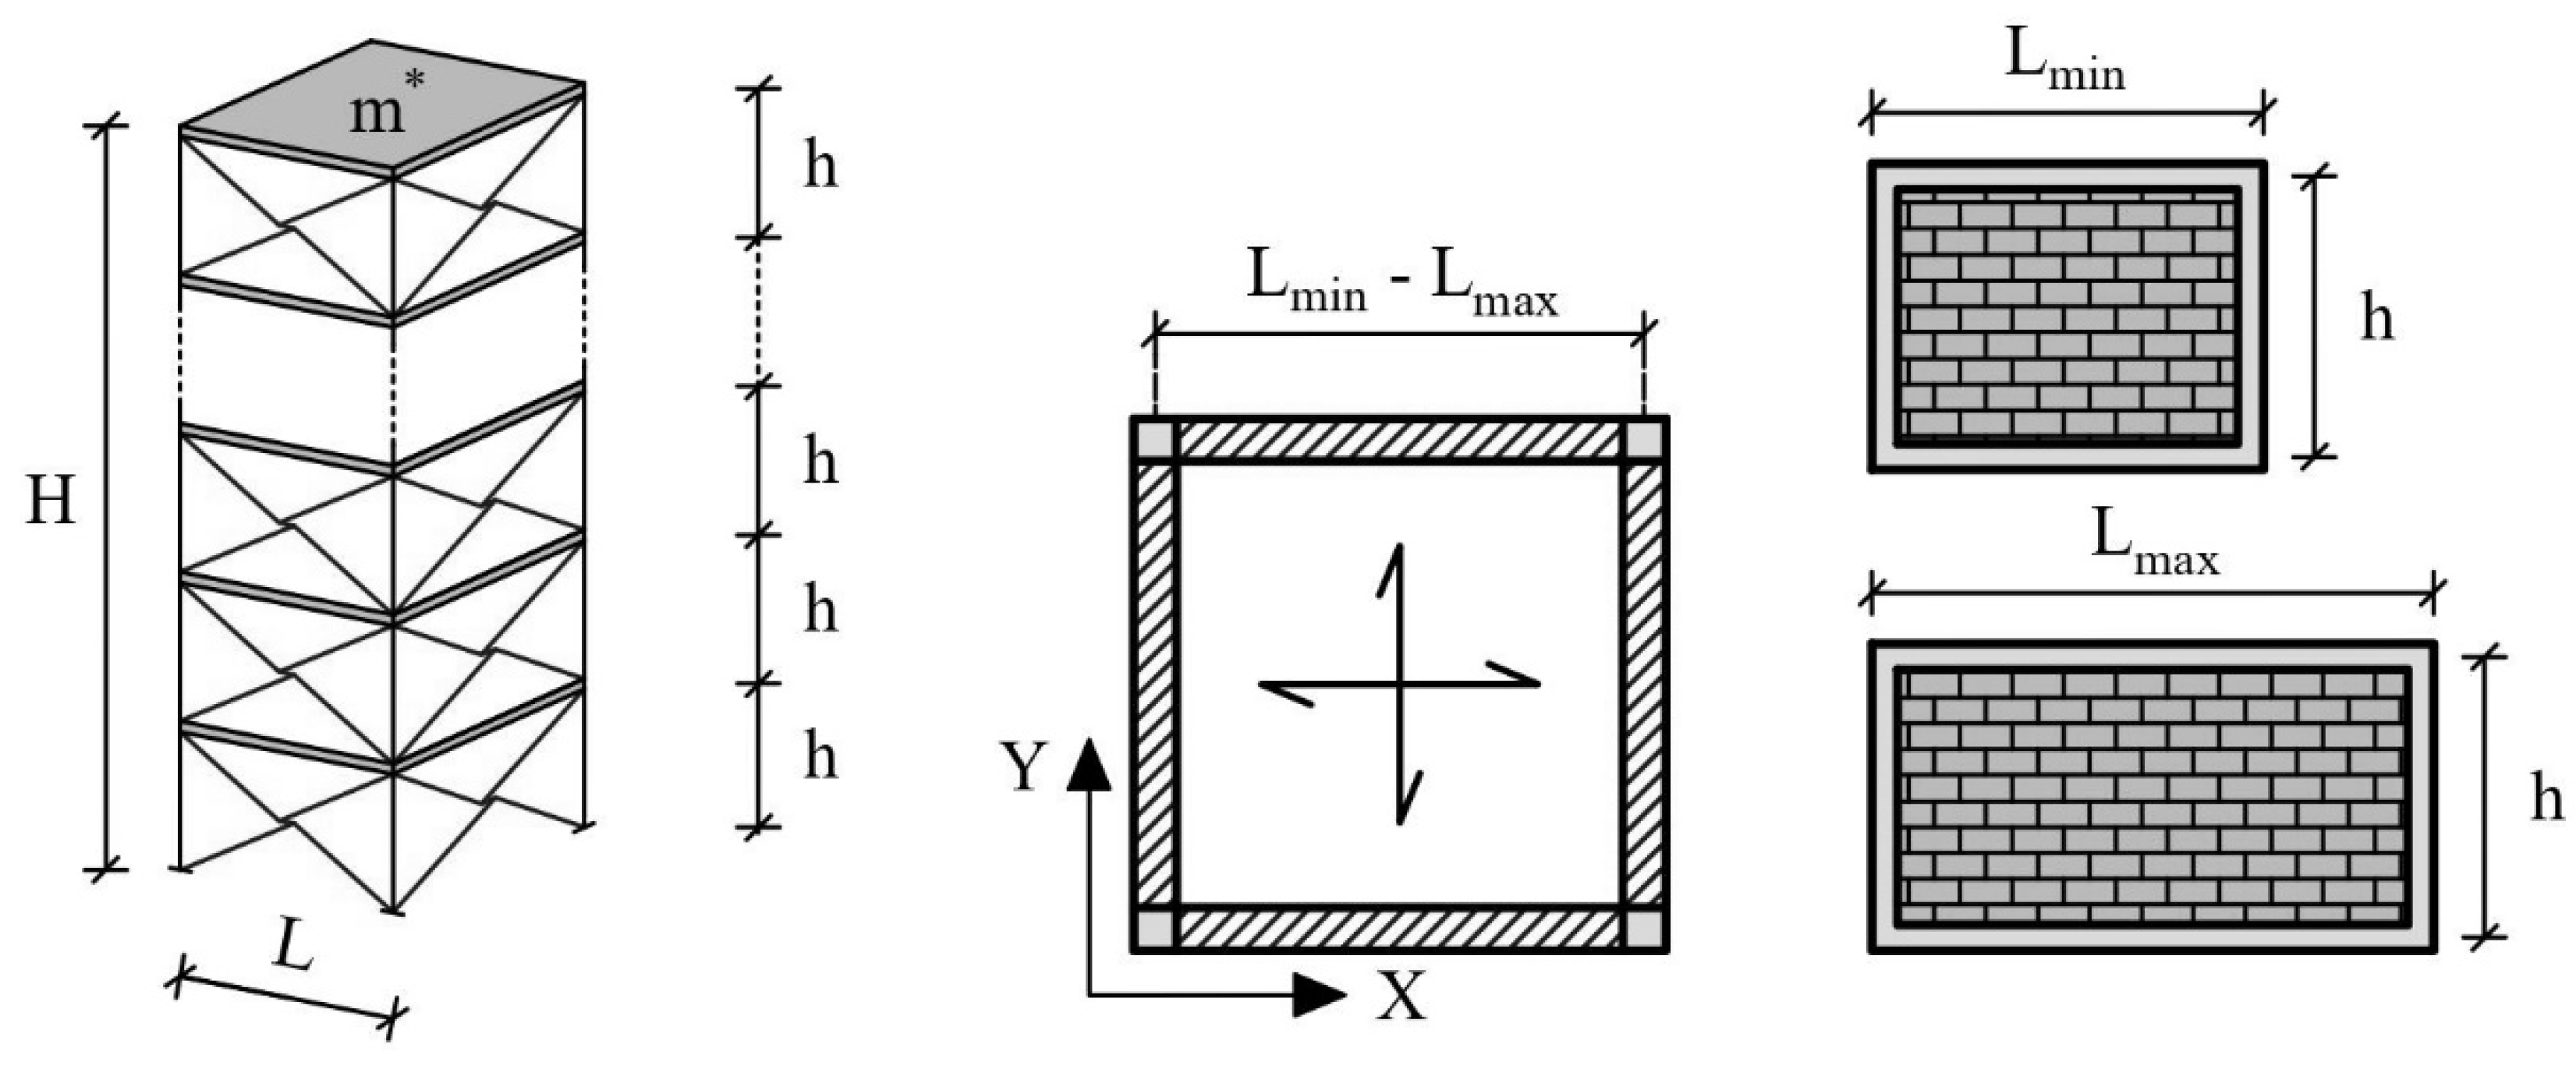
1, structural behavior factor q, and seismic input intensity. The benchmark models are single-bay multi-story RC structures. The bay length L has the same value in both directions (X and Y). The inter-story height (h) is constant, equal to 3.0 m, consistent with the typical mean value found in existing buildings (
Figure 5). The beams are considered infinitely stiff during bending (shear-type frame behavior). The cross-section of the columns is square and the column dimensions are reduced along the building height every 2 or 3 stories, starting from the base of the structure. These initial geometrical and typological assumptions reduce the free structural parameters. In this way, the residual ones are evaluated so as to match relevant variabilities of real structures.
A census of residential and commercial RC-framed buildings of the municipality of Gioia Tauro was carried out. All of the relevant data were summarized into GIS layers. In this way, the structural clusters depending on the age of construction and number of stories can be defined. Most of the building was completed after 1975, following very few and outdated seismic design prescriptions. The building codes in force during the second part of last century were based on a weak column–strong beam design philosophy; no failure hierarchy between structural members was established. This design assumption is consistently applied to benchmark structures. Therefore, the allocation of buildings in different clusters depends on the number of stories n
s only. Each real structure was georeferenced and included in the GIS layers ready for queries. The maximum and minimum observed in-plan dimensions are extracted from each structural cluster. The fundamental period of vibration T
1 can be evaluated by applying DM 16/01/1996 [
41] with a simplified formulation, where T
1 depends on the total building height H = 3.0n
s and the in-plan dimension B along the considered direction (par. C.6.1.1). In this way, it is possible to identify the upper and lower limit of T
1 for the i-th cluster (4):
The realistic fundamental period range is discretized, adopting an internal step of 0.05 s (
Figure 6). It is possible to establish a dynamic equivalence between the real and benchmark structures after fixing a T
1 value that belongs to the interval. The column dimensions are modified to match the assumed value in both the X and Y directions (the benchmark model is symmetric).
The calibration procedure can be carried out if the total floor mass m* is previously assigned to each level of the benchmark model. The typical planimetric configuration of a RC-framed structure is composed of a grid of beams that define a certain number of rectangular floor fields (
Figure 7a). The total floor mass M depends on the vertical structural elements (columns), horizontal elements (beams, stairs, slabs), non-structural components (partitions, infill walls), and parts of the live load (occupants, furniture, etc.). It is reasonable to assume that the bays have the same length and that the total floor mass M is uniformly distributed on the floor surface. As a result, a constant mass m can be assigned to each floor field. In this way, the floor mass M depends on (5) for the number of bays in the X (n
b,X) and Y (n
b,Y) directions:
An equivalence between the mass-to-floor stiffness ratio of the real structure (M/k) and benchmark model (M*/k*) is established (6):
The ratio R
m*m between the benchmark model floor mass m* and a real floor field m can be expressed as a two-variable function (7):
The column stiffness kc can be omitted, since the cross-section is assumed to be constant for all floor columns for the both real and benchmark structures.
The domain of this function (
Figure 7b) can be limited to a realistic range of the number of bays n
b,X and n
b,Y. The in-plane dimensions of an RC-framed structure without structural joints cannot exceed 30 m, consistent with Eurocode 2, par. 2.3.3 [
42]. The upper bound of the number of bays is equal to 8 (rounded up) if a minimum bay length of 4 m is assumed, while the lower bound is 2 for residential buildings. Given these constraints, the model floor mass M*, which coincides with its field mass m*, can range between 1.78 and 3.16 times the real floor field mass m. An intermediate value of 2.50 is adopted for parametric analyses. The mean structural and non-structural observed dimensions, as well as typical dead and live loads for residential buildings, are assumed to evaluate the field mass m.
The benchmark models are based on the simplification of real structures. The generic model will be similar but not the same as the real building. Thus, the debris area that forms after the MIs collapse cannot be evaluated based on the results of a single analysis. For each fixed number of stories ns it is necessary to identify the range of variability of all relevant design parameters for the selected urban area. The non-linear dynamic analysis results will populate the debris area database, accounting for each possible combination of variabilities. The MIs′ initial velocity and acceleration initial conditions at the failure time step will be post-processed to identify the worst case scenario, which is similar or less severe than the real one.
The numbers of stories of the RC-framed buildings potentially interfering with the strategic road network range from 2 to 8 based on the collected data. Therefore, seven structural clusters were set. As previously mentioned, a fundamental period range T
1 is assigned to each cluster (
Table 1, dynamic variability). The benchmark models of the infilled structures are labelled as ISn
s.T
1,j, with n
s = 2 … 8 and T
1,j = T
1,1 … T
1,n. The maximum value of the index j depends on the discretization of the fundamental period range of each cluster; T
1,1 corresponds to T
1,min, while T
1,n corresponds to T
1,max. Thus, the label IS3.T
1,2 refers to the 3-story infilled structure with a fundamental period T
1,2 = 0.25 s. The index j values range from 1 (0.20 s) to 4 (0.35 s).
The minimum Lmin = 4 m and maximum Lmax = 7 m realistic values are adopted for the geometric variability of the bay length L, which affects the model floor mass m* (m*min = 517 kN, m*max = 1190 kN). Moreover, real structures can exhibit different degrees of inelastic global behavior, which can be summarised into the structural behavior factor q. The evaluation of the exact q value may require a very refined inelastic structural model of every building that falls within the selected urban area, which is not feasible in terms of the time and costs. Three values were selected (1.5, 3.0, 4.5), ranging from an almost elastic to a severely inelastic potential structural response.
Once the geometry, loads, and masses of the model have been defined, a response spectrum linear procedure is carried out to calculate the amount of reinforcement needed in the beams and columns. The municipality of Gioia Tauro is selected as design site. The associated elastic spectrum at the limit state LS is generated, assuming building class II, a nominal design life V
R = 50 years, and subsoil class C (i.e., peak ground acceleration on rock PGA
LS = 0.262 g and subsoil parameter S = 1.319) as the conditions. The current Italian building code [
16] provides additional information about these parameters. Concrete class C20/25, having a cylindrical concrete strength equal to 20 MPa, and reinforcement steel B450C, with a yield strength equal to 450 MPa, are assumed during the design phase of the structural elements.
Benchmark models are designed for each combination of geometric (number of stories n
s and bay length L, associated with the floor mass m*) and dynamic (fundamental period T
1) parameters and the seismic behavior factor (q). Each model is preliminarily built on SAP2000 [
43]. The longitudinal and transversal reinforcement is quantified on the basis of a response spectrum analysis, reducing the spectral ordinates (LS) through the assumed global behavior factor. The b are frame data are assembled into input data files that will be executed on a C++ code for the non-linear dynamic analysis of RC-framed infilled structures [
31]. The columns and beams are modelled as 1D elements. The inelastic response of the columns is governed by a lumped plasticity model. Specifically, the reinforcement and geometrical cross-section data allow the definition of 3D biaxial bending moment–axial force domains, assigned to the column ends, while elastic behavior is assumed for the beams.
The MI macro-models are included in the bare frame structural model after the design procedure, as the prescribed older (and newer) design procedures do not account for their contribution to the seismic response. Each benchmark structure is totally infilled. The innovative MI modelling strategy is detailed in
Section 3.3.
Non-linear dynamic analyses are carried out to capture the structural and non-structural damage evolution over time. Two pairs of artificial biaxial accelerograms are applied at the base of the benchmark models. The acceleration time histories are generated through the SeismoArtif software [
44], guaranteeing adequate matching between their response spectra and NTC18 [
16] code spectra (site: Gioia Tauro) in the LS and collapse prevention (CP) limit states (
Figure 8).
The input data files are automatically generated through a MATLAB [
45] assembly routine; the structural geometry and design results are integrated with non-structural properties and accelerograms (
Figure 9), varying all possible combinations of the previously discussed parameters.
3.3. Modelling of the In-Plane and Out-of-Plane Non-Linear Seismic Responses of Masonry Infills
The double-layer (12 + 12 cm) MI typology is selected for parametric analyses, being widely implemented in existing RC-framed buildings and highly vulnerable to OOP failure when compared to modern single-layer infills (30 cm thick). The relevant mechanical parameters were suggested by Hak et al. [
46].
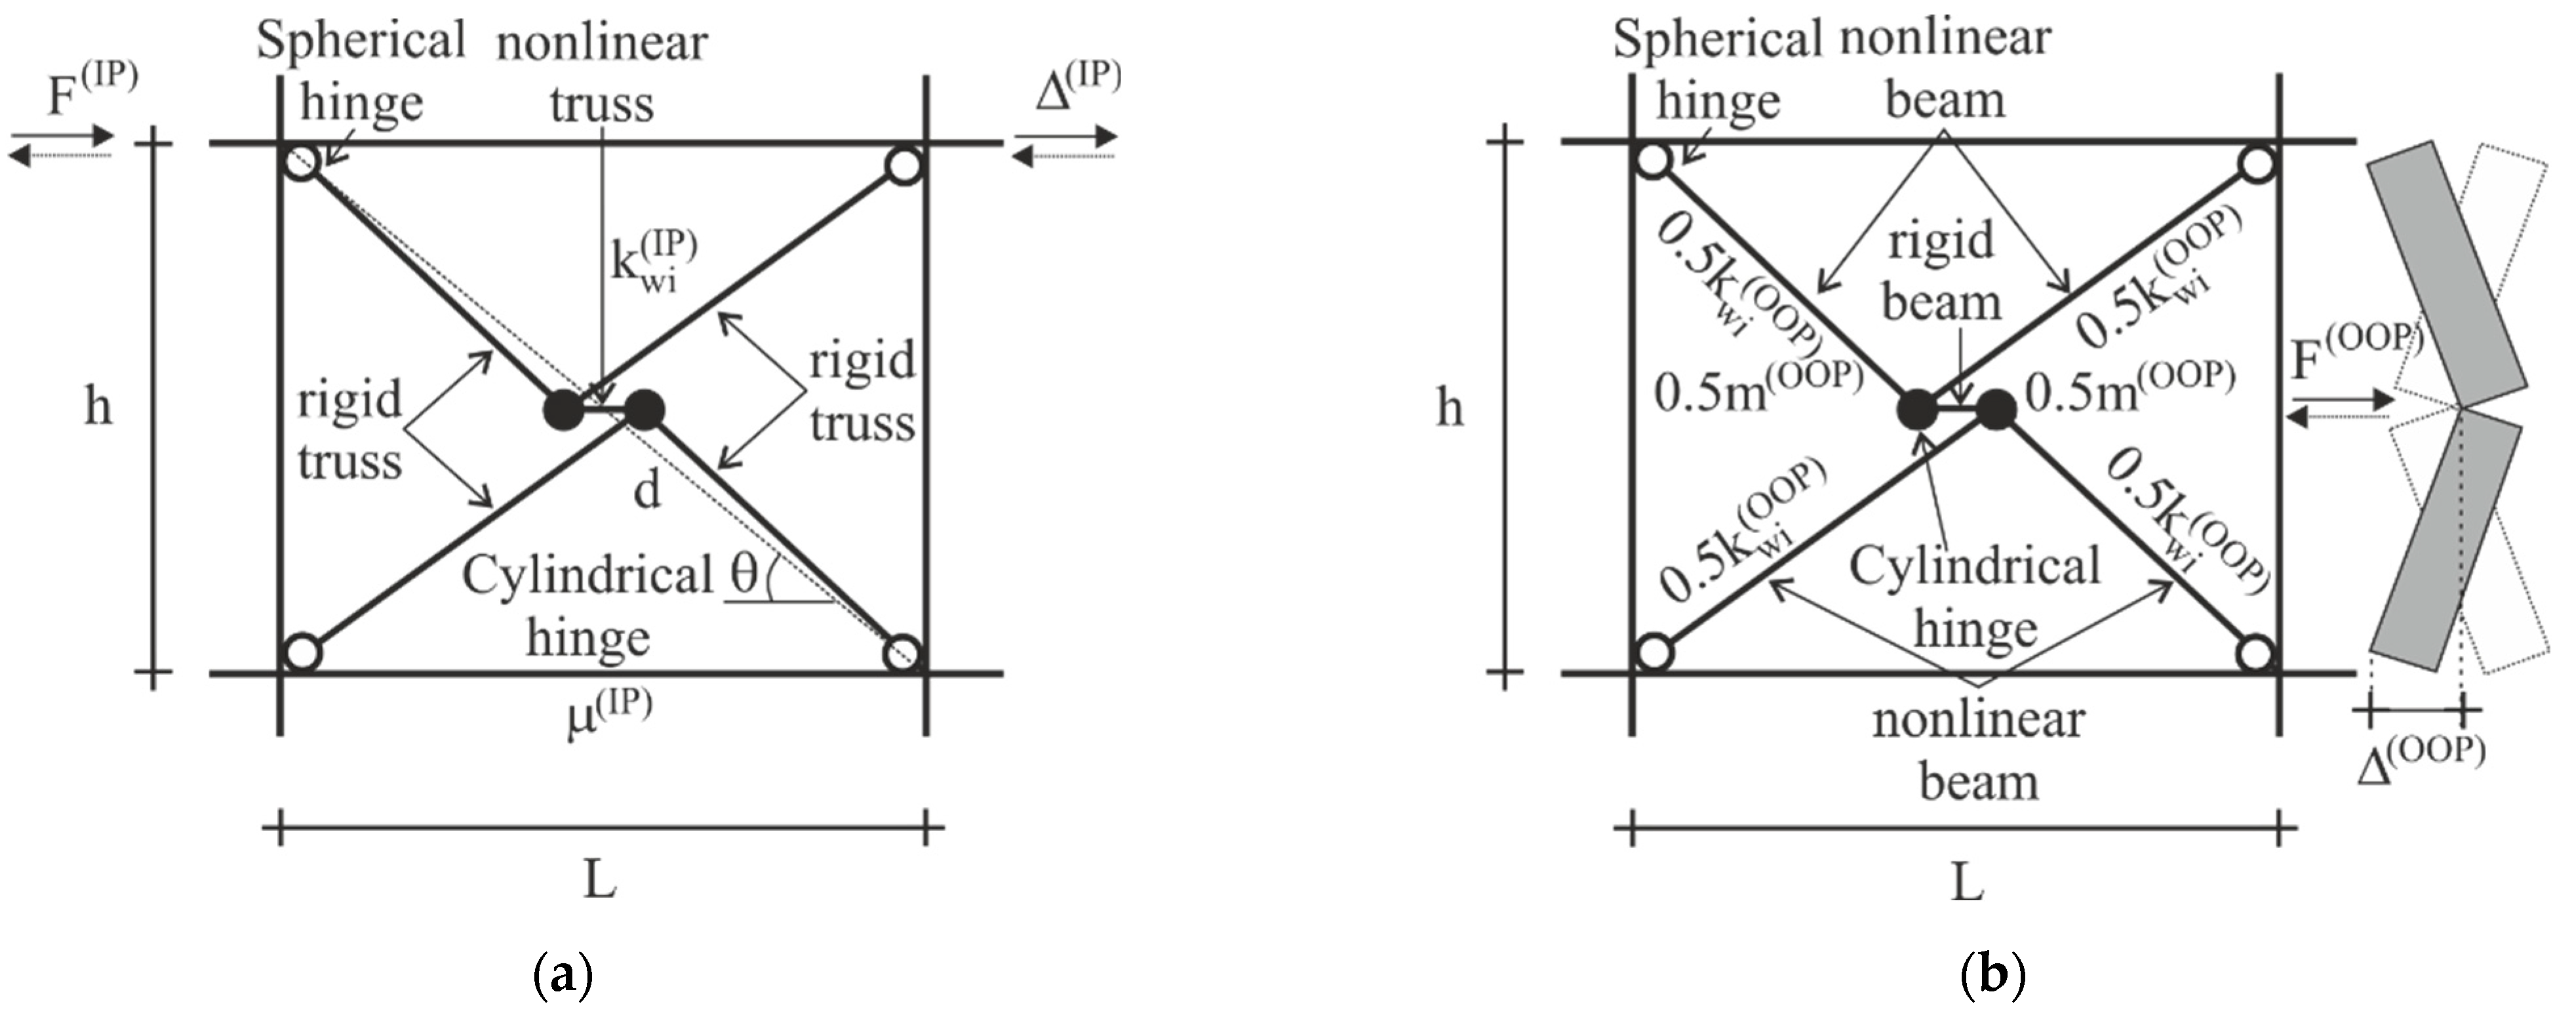
The non-linear seismic behavior of masonry panels is represented by a five-element macro-model (
Figure 10). The IP and OOP responses are replicated by global force–displacement backbone curves. The backbones are generally evaluated through an analytical procedure, which is usually calibrated on a wide set of experimental curves (IP and OOP failure tests). The detailed damage evolution of the 3D infill components (blocks, mortar, interfaces) cannot be predicted. However, this phenomenological modelling strategy provides a global MI damage overview, where backbone points can be associated with the main damage evolution points. In this way, many structures can be analyzed, guaranteeing reduced computation times and related costs.
The proposed macro-model [
31] is composed of a central element and a system of four diagonal beams, which govern the inelastic IP and OOP responses, respectively. The diagonal elements are axially stiff, guaranteeing that the seismic IP action is completely transferred to the central element. Two intermediate concentrated masses are activated in the OOP direction only. The inertial forces that derive from the ground motion application to the structure deform the four-element system in the OOP direction. Continuity is guaranteed by the central element, which is stiff in terms of OOP flexure. Spherical hinges placed at four outer nodes nullify the moment transfer to the surrounding frame; cylindrical hinges allow the transmission of axial force only to the central IP truss element (
Figure 10a). The OOP mass (m(OOP)) is equal to 81% of the total mass of the panel, consistent with [
24], and it is evenly split between the two central nodes (
Figure 10b).
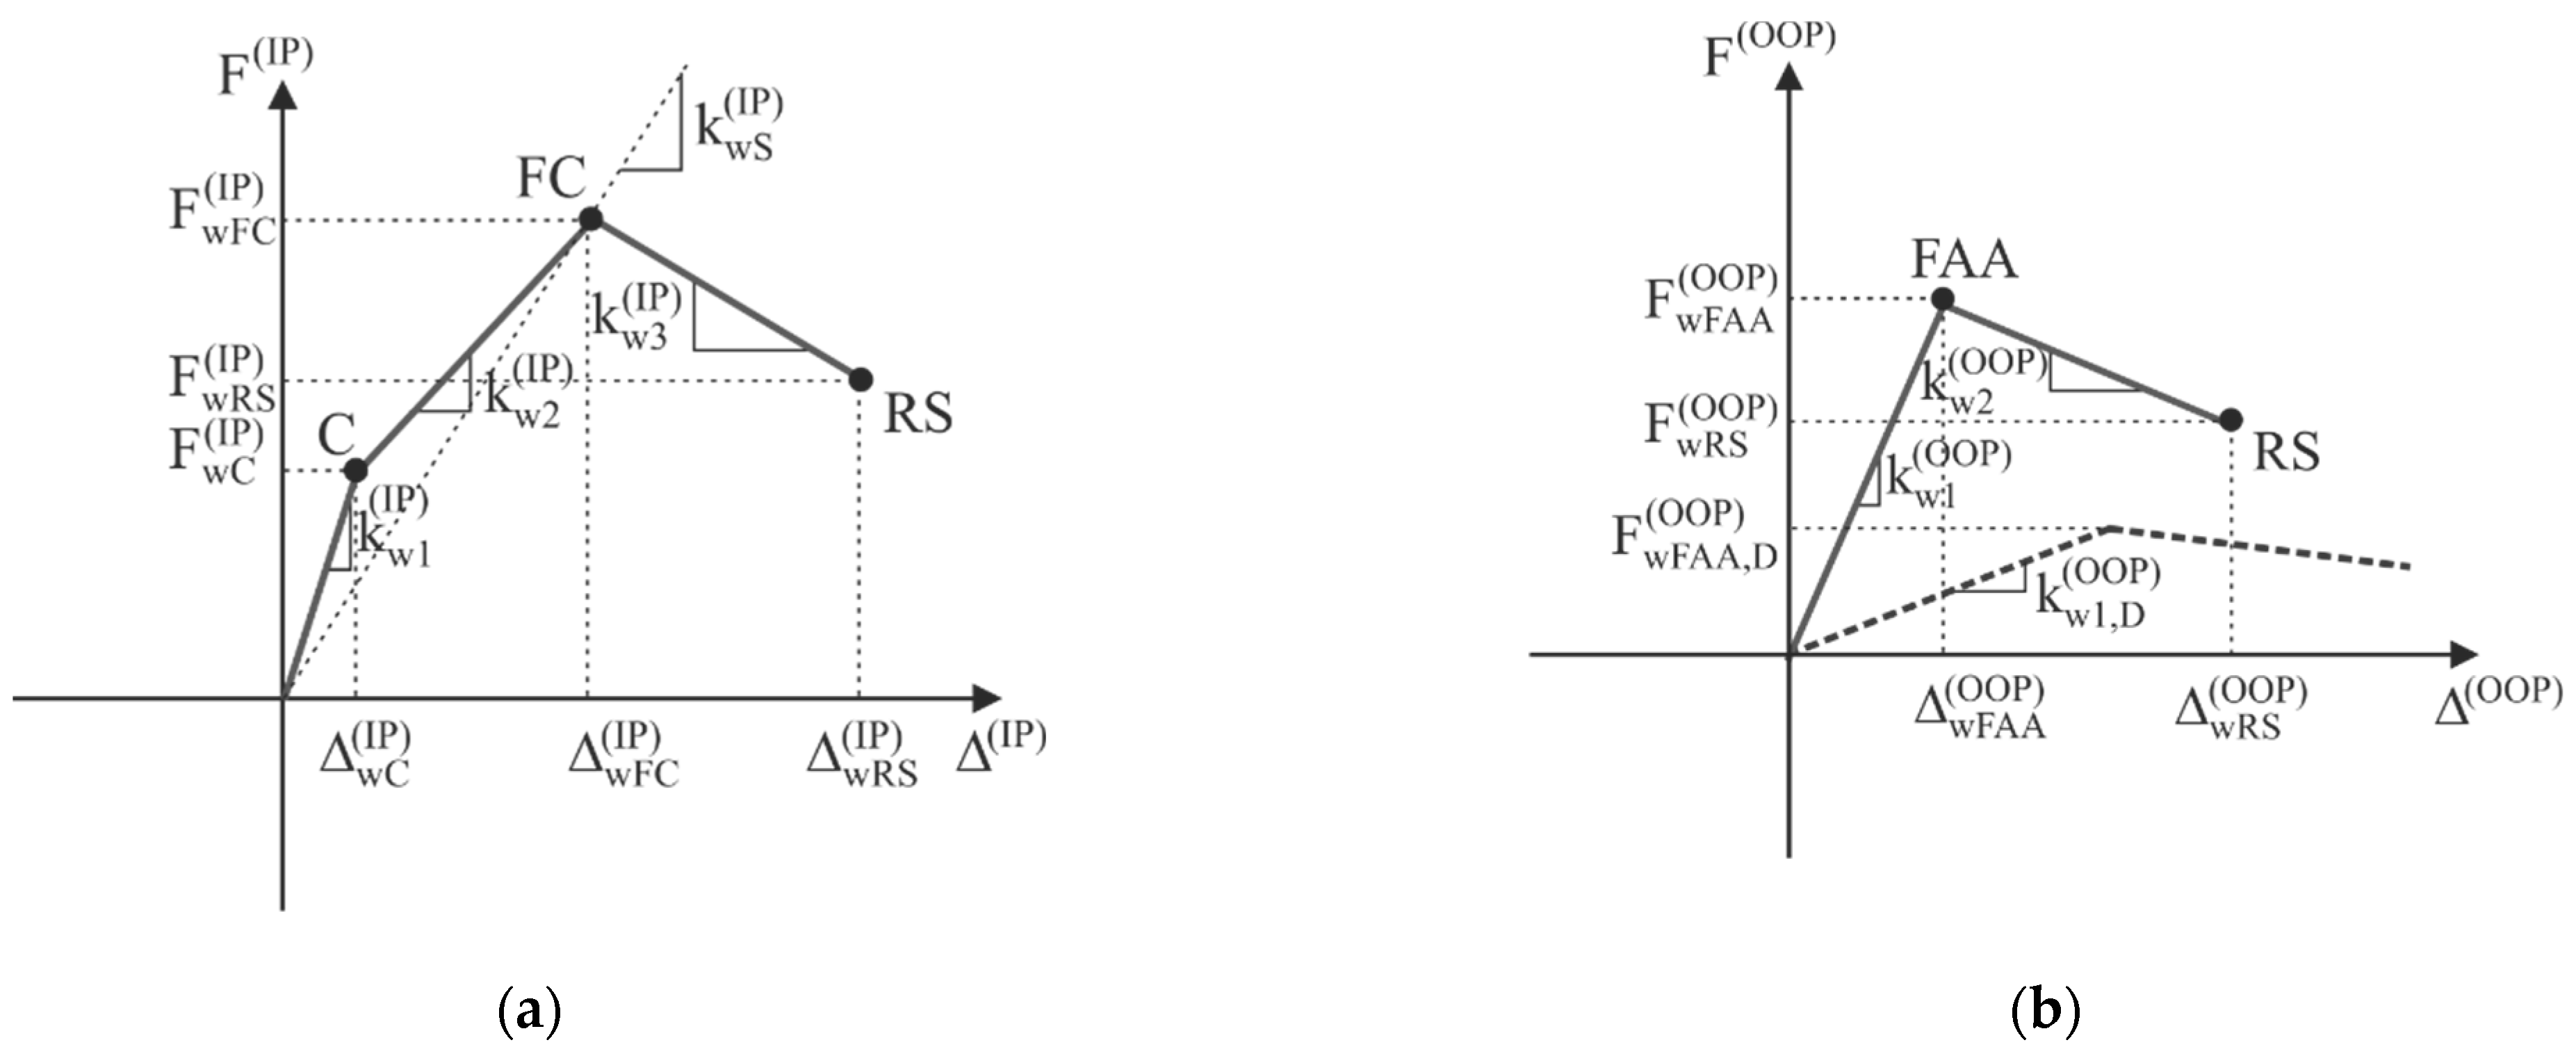
Once the geometry, restraint, and constraint conditions are set, it is important to define the realistic force F − displacement Δcurves (backbones) for the MIs of a generic benchmark model. The IP backbone curve F
(IP) − Δ
(IP) (
Figure 11a) is trilinear and can be identified through the macro-cracking (F
wC(IP), Δ
wC(IP)), full cracking (F
wFC(IP), Δ
wFC(IP)), and residual (F
wRS(IP), Δ
wRS(IP)) points. The maximum IP strength is evaluated while accounting for four possible IP failure mechanisms [
47]: central compression, corner crushing, shear sliding, and diagonal tension. The IP initial k
w1(IP) and post-elastic stiffness k
w2(IP), the macro-cracking F
wC(IP), and the residual strength F
wRS(IP), as well as the collapse displacement Δ
wRS(IP), are calculated following [
48] for the formulation of masonry panels. Th eother parameters are univocally defined.
Due to their typical thickness range, MIs can exhibit significant OOP strength after the first macro-crack. Sufficient contact area between the cracked masonry and surrounding structural elements guarantees the OOP arching effect. The arch strength increases with higher panel thickness and compressive masonry strength. The OOP backbone curve F
(OOP) − Δ
(OOP) (
Figure 11b) is bilinear. The formulation in [
24] has been proven to offer reliable estimations of the OOP stiffness in the cracking stage [
26]. Therefore, it is applied to evaluate the secant-to-peak stiffness k
w1(OOP) (first branch). The maximum OOP strength F
wFAA(OOP) depends on the degree of lateral contact between the panel and structural elements. FEMA 356 [
49] provides a safe-sided lower bound expression, which accounts for one-way vertical arching only. This assumption is realistic, since the existing structures may be affected by the contact deterioration. The second OOP branch represents the softening behavior until collapse (F
wRS(OOP), Δ
wRS(OOP)). The residual OOP strength F
wRS(OOP) and failure displacement Δ
wRS(OOP) are calibrated based on experimental tests on panels of the same thickness [
31].
Figure 12 summarizes the IP and OOP backbone curves referring to the two possible geometrical configurations due to the different bay lengths (L
min = 4 m and L
max = 7 m). As shown, the strength values of the IP and OOP backbone curves corresponding to L
max (red lines) are higher than those obtained for L
min (green lines), with the displacements being equal. This kind of behavior can be interpreted by observing that the IP strength of the MIs depends on the equivalent strut width, whose value increases with the diagonal length of the panel; the same applies for the OOP strength, which is related to the length and height of the infill panel.
The MI macro-model not only simulates the inelastic IP and OOP seismic responses, but also the effect of the IP damage on the OOP behavior as well. This phenomenon is called the IP→OOP interaction. This was confirmed both experimentally [
27,
28,
29] and in the aftermath of recent earthquakes (L’Aquila, 2009; Lorca, 2011; Central Italy, 2016), highlighting the limits of the classic MI modelling strategies. The MI model code is provided with an internal routine that handles the reductions in the first OOP branch’s stiffness k
w1(OOP) and maximum strength F
wFAA(OOP) on the basis of the maximum experienced IP interstory drift ratio (IDR). The IDR is defined as the ratio between the relative displacement Δ
(IP) and the interstory height h of the story. The empirical relations in Equations (8) and (9), which are valid for slender panels and were proposed by [
50], are applied to evaluate the degraded initial stiffness k
w1,D(OOP) and maximum strength F
wFAA,D(OOP). Moreover, no additional backbone decay is allowed if the IP drift ratio exceeds the 0.8% value. Double-layer MIs can be considered as being already extremely damaged in this case. Additional decay would have no physical meaning. The relations between the ultimate (F
wRS(OOP), Δ
wRS(OOP)) and peak (F
wFAA(OOP), Δ
wFAA(OOP)) points do not change if the IP→OOP interaction is triggered:
3.4. Evaluation of the Debris Area
The extension of the obstruction area generated by the collapse of MIs in RC-framed buildings depends on the maximum distance achievable by the debris during its fall. This movement (
Figure 13) is made up of two rates: d
1, which is evaluated considering the bullet motion; and d
2, which according to empirical studies [
51] is twice d
1.
Based on these observations, the maximum distance achievable by the MI debris (d
max) is calculated assuming that the maximum velocity of expulsion of the MI at the OOP failure is horizontal (
), as shown in (10):
The effective road width (
) for the movement of rescue vehicles is calculated based on (11), considering the width of the road (W) and the width of the debris (d
max):
Considering the effective road width () and the general width of a rescue vehicle, which is generally assumed to be equal to 2 m, the authors defined the following practicability conditions:
If m, the stretch is not practicable;
If m, the stretch is practicable.
The whole stretch is not practicable even if only one road section is closed.
After the identification of the practicable and non-practicable stretches, the extension of the road affected by this closure and the seismic hazard index can be evaluated based on Equations (2) and (3), respectively.
4. Results and Discussion
4.1. Non-Structural Debris Velocity Results
4.1.1. Global Analysis
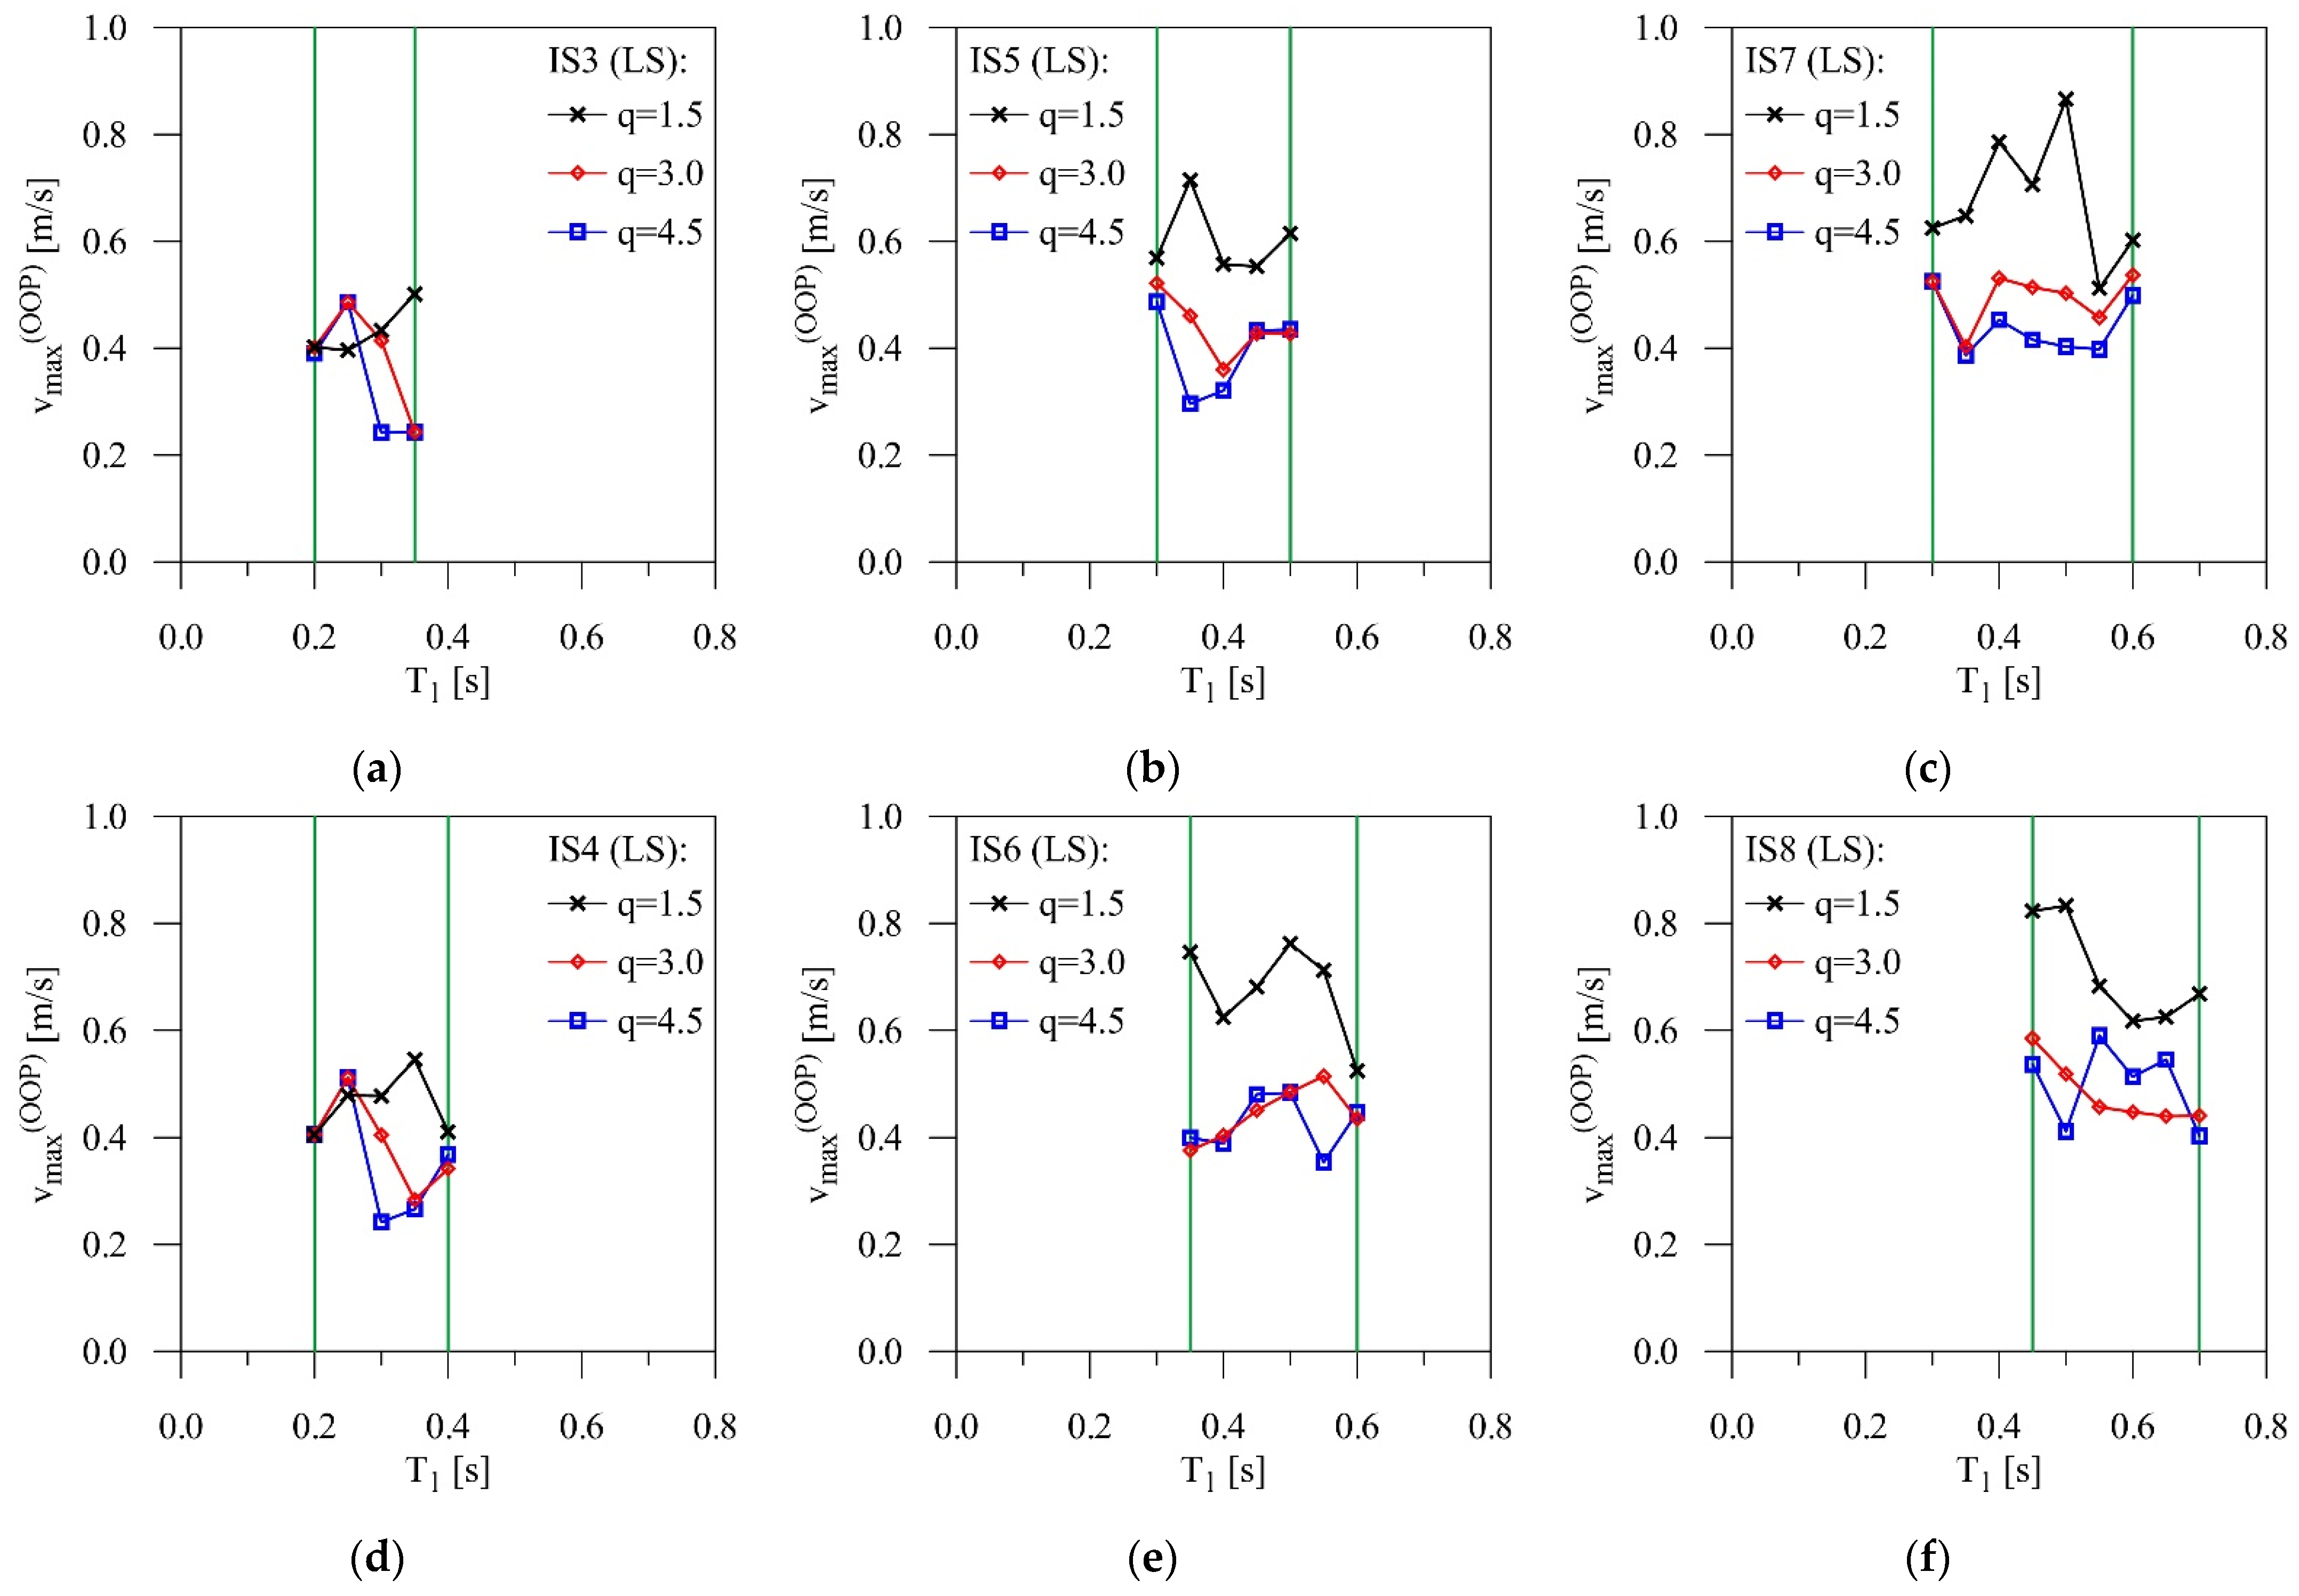
The first group of results is focused on the maximum OOP velocity of MIs at different seismic action intensity levels. The OOP velocity envelope results at the LS and CP levels (
Figure 14 and
Figure 15, respectively) are discussed below, with reference to the variability of the fundamental vibration period T
1 and behavior factor q. The values close to the lower threshold for each n
s correspond to the first branch of the NTC18 design spectrum of acceleration, while their upper threshold may exceed the constant acceleration branch. The maximum velocity curves are evaluated as envelope results between in-height values for bay lengths L
min and L
max. Different curves are shown for each number of stories, considering the IP → OOP interaction of MIs. Each curve is referenced to a specific global ductility level: LD (low ductility, q = 1.5), MD (medium ductility, q = 3.0), and HD (high ductility, q = 4.5). The OOP nodal velocity is measured at the panels’ mid-height.
The maximum OOP velocity at failure tends to increase with the structural height (
Figure 14). The LD models exhibit the highest velocity values, while the MD intermediate curves are often slightly higher or close to the HD ones. This confirms that the capacity design typical of newer seismic standards guarantees a lower overall debris velocity at failure due to energy dissipation through structural damage. Velocity peaks at the LS level are relevant for large-scale analyses, laying the foundations for the debris area evaluation. The maximum debris velocities range between 0.2 m/s and 0.6 m/s for MD and HD structures and between 0.4 m/s and 0.9 m/s for LD structures.
The CP curves (
Figure 15) depict the velocity results at a higher intensity level (i.e., the maximum level suggested in the Italian seismic code) for 3-, 5-, and 7-story structures for the sake of brevity. At the CP limit state, the LS trends are confirmed. The differences between behavior factor values become clearer as the number of stories increases (
Figure 15c). The maximum velocity does not increase much for low-rise buildings (
Figure 14a and
Figure 15a). As n
s increases, higher values at the CP level are generally attained (
Figure 14b,c and
Figure 15b,c). Smaller differences can be found if HD models are considered, since the structural damage increases too, compensating for the ground motion intensity increase.
Based on the maximum results at the LS limit states and the calculation procedure discussed in
Section 3.4, the maximum distance d
max that can be reached by MI debris is summarized in
Table 2, depending on the number of stories. Each value is obtained by taking into account all combinations of maximum debris velocity and collapsed panel height values.
As can be noted in
Table 2, the maximum distance does not increase linearly. In some cases (i.e., 4- and 5-story structures), it can be slightly reduced too. This is mainly due to the different MI collapse height and velocity values, which heavily depend on the behavior factor q. The spatial distribution of the collapsed panels will be clearly explained in the following subsection.
4.1.2. Local Analysis
Envelope curves are useful for illustrating the maximum OOP velocity trends for typical fundamental period values. In this subsection, complementary graphs are presented (
Figure 16 and
Figure 17) to make a comparison between the LS (dashed line) and CP (solid line) limit state maximum velocity and damage evolution trends along the building height. Each curve represents the maximum OOP MI velocity for each behavior factor q. Collapsed panels are shown as empty (LS) or solid (CP) dots. For the sake of brevity, only results referring to 6-story structures are discussed, while varying the T
1 value. A brief description of the differences between the L
max (
Figure 16) and L
min (
Figure 17) results will complete the main findings. Only the selected fundamental period cases (T
1 = 0.40 s, 0.50 s, and 0.60 s) are reported in
Figure 17 for the sake of brevity.
The MIs of LD structures are generally the most damaged ones (
Figure 16), due to the low overall seismic energy dissipation. As expected, the CP curves tend to depict higher maximum velocity values than LS ones. The differences are less evident or inverted if the distribution of the collapse structures is similar between the LS and CP states, since only the collapse time step changes. The almost linear velocity trend for LD structures confirms the quasi-elastic structural behavior.
The curves are flattened if the structural behavior factor q increases. Little to no MI collapse should be expected at the LS limit state in the case of HD structures, especially for lower T
1 values, since the absorbed seismic energy is lower. The vulnerability areas are concentrated in the lower and intermediate stories, due to the higher local IP drift, which triggers the OOP backbone decay. The MD structures exhibit intermediate behavior, with collapses that can spread up to the highest stories in some cases (
Figure 16c).
The higher T1 values only cause a slight overall velocity increase, confirming the trends discussed in the previous section.
Minor differences between the results in the LS and CP limit states can be found in the case of L
min (
Figure 17a–c). The maximum velocity values and OOP collapses tend to be slightly higher. More OOP collapses occur when compared to the corresponding L
max curves (
Figure 16d–f). Since the fundamental period of vibration for IS6 structures is constant, differences in the spatial distribution of the collapses can be attributed to the higher modes of influence on the OOP force distribution, while the greater number of collapses is mainly due to the lower OOP displacement capacity of the MIs with the minimum bay length L
min (
Figure 12b).
4.2. Assessment of the Practicability of the Strategic Road Network and Seismic Hazard Index
As previously stated, the maximum distance of the debris expulsion generated by the collapse of MIs in RC-framed structures depends on the number of floors that characterize the RC-framed buildings facing the strategic road network. The potentially interfering RC-framed buildings are, therefore, classified according to the number of floors that characterizes them (
Figure 18).
After the identification of the potentially interfering RC-framed buildings and following the non-structural debris velocity results, we identify the footprint areas generated by the expulsion of the debris due to the collapsed MIs from RC-framed buildings (
Figure 19). Thanks to this analysis, the potentially interfering RC-framed buildings can be classified in interfering buildings and non-interfering buildings. The interfering buildings lead to road obstructions. The non-interfering buildings correspond to the buildings that do not cause any obstruction because they are positioned backward from the roadside or because they are made up of only one floor.
As the footprint area of the debris generated by collapsed MIs has been evaluated, we can identify the interrupted road stretches and the not-interrupted road stretches, verifying the practicability condition stated in
Section 3.4. In
Figure 20, the non-practicable stretches and the practicable stretches are identified.
Thanks to the identification of the obstructed road stretches, we can evaluate the extension of the road stretches affected by seismic risk using Equation (2).
Considering the LS limit state and setting the occurrence probability of the seismic event P as equal to 10%, the seismic hazard index of the analyzed strategic road network system with reference to the MIs behavior is assessed in
Table 3.
4.3. Discussion of the Results
The results indicate that the strategic road mainly affected by the collapse of MIs in RC-framed buildings is road 1, which connects the SB to EA-01. The length of road 1 characterized by obstruction from the debris generated by the collapsed MIs in the RC-framed buildings is 16% of the total road length; therefore, the seismic hazard index of this road is higher than the others. This happens because along road 1 there are many RC-framed buildings characterized by 3, 4, and 5 floors. The percentage of road 2’s length affected by the obstruction from the debris generated by the collapse of the MIs in the RC-framed buildings is equal to 4%. This describes the real situation well because the buildings characterized by 3, 4, and 5 floors are located only along stretch 13. Finally, road 3, which connects the SB to EA-04, is not affected by any MI debris obstruction. Along this road, in fact, there are 3 buildings with more than 3 floors positioned backward from the roadside. Road 3, therefore, is the safest among the three existing roads connecting the SB to the EAs within this area.
From the analysis of the existing EAs within the municipality of Gioia Tauro, it emerges that EA-01 is the biggest in the whole municipality. However, if a hazard occurs, it cannot be reached because of the obstruction generated by the collapse of the MIs in the RC-framed buildings. This EA, although it is the biggest one in the whole municipality of Gioia Tauro, is unreachable and, therefore, unusable. The obtained results show that in the dense urban context, the localization of EAs is quite difficult due to the interdependency between the road network and buildings.
According to the results of the proposed case study, the shortest path in a pre-event condition coincides with the safest path after an earthquake occurs. Therefore, in this case, the traditional method of emergency planning used to identify the emergency route as the shortest path from the SBs to EAs works. According to the proposed methodology, in most of the cases, the shortest path does not coincide with the safest one. This happens because the proposed methodology considers the performance of the physical components of urban systems, such as the structural behavior of the MIs in RC-framed buildings. This kind of assessment, therefore, reveals that the strategic road network is very altered as compared to the situation before the earthquake occurs. The functionality of the system depends on the capacity of the system itself, which in ordinary conditions is greater than in emergency conditions. This significantly influences the post-earthquake emergency response, causing extensive delays for rescues.
The assessment of the practicability of the strategic road network also shows which buildings require specific interventions because their potential for obstruction is higher than others. As shown by the proposed case study, within the inner area, where the buildings are closely located to the road network and where the width of the roads is small as they are secondary or local roads, the RC buildings characterized by more than 3 floors have a higher probability of obstructing the strategic road network. A specific analysis related to physical and structural conditions of these buildings could contribute to enhancing the urban resilience of the strategic urban system.
In this research, we used an innovative MI macro-model for all RC-framed buildings in order to predict their failure and to assess the debris area generated by their collapse. Despite the existing difficulties relating to data availability, determined by the lack of structured and updated public databases, to further improve the proposed research work, a refined analysis of the buildings could be carried out in order to obtain non-structural damage patterns for specific buildings.
In this research, we assessed the practicability of the strategic road network considering the obstruction area generated by the collapse of non-structural elements. This work may be improved by considering also the collapse areas generated by structural elements in order to analyze the strategic road network conditions after a seismic hazard occurs, as well as to provide overall guidance for the definition of the safest paths.
Furthermore, since the proposed research was focused only on the assessment of the effects determined by the seismic hazard, future studies may include other types of hazards in order to develop a multi-hazard approach. As a single-hazard approach may underestimate the level of risk, a multi-hazard approach could be very useful to enhance the effectiveness and the efficiency of the rescue measures during the whole emergency management process.
5. Conclusions
Integrating the knowledge of different scientific sectors, namely urban planning and structural engineering, in this paper we have presented an innovative emergency management method to assess the practicability of the strategic road network considering the collapse of MIs in RC-framed buildings after a hazard occurs. The MIs were modelled using an innovative macro-model and the prediction of the OOP failure made it possible to identify, according to the number of stories of each building facing the strategic road network, which road stretches are practicable or not. Based on this, we evaluated the seismic hazard index for each strategic road to quantify the effect generated by the collapse of non-structural elements on the strategic road network’s practicability considering the interdependency between the roads and built environment.
The results retrieved from the structural analysis of the MIs demonstrated that the structural behavior factor q has a huge impact on the non-structural peak velocity at failure. The fundamental period of vibration T1 has an effect on the maximum values to a lesser extent. The bay length L mainly affects the OOP backbone extension and the overall number of OOP collapses, which tends to increase for lower L values. Moreover, the maximum debris expulsion distance does not follow a linear trend if the number of stories increases. This is mainly due to different velocities and in-height positions of the collapsed panels, which heavily depend again on the structural behavior factor.
Applying this method to a portion of the strategic urban system in the municipality of Gioia Tauro, we demonstrated that after a hazard occurs, the capacity of the strategic road network is highly reduced, badly influencing the rescue operations. The practicability of the strategic road network is greatly altered due to the complex interactions between the roads and built environment, which as indicated by the proposed application is higher in the core parts of urban areas than in the other areas.
The proposed method could be a useful tool for the preparation of emergency plans, as well as for the assessment of the existing ones. Verifying the strategic road network system’s functionality in a post-earthquake phase can guide decision-makers in the identification of the safest rescue path, as well as in the allocation of EAs. Considering the behavior of non-structural elements in RC-framed buildings facing the road when an earthquake occurs, this method can help decision-makers to quickly identify where the EAs need to be allocated. Thanks to this tool, and through the simple recognition of the number of stories in RC-framed buildings, it is possible to evaluate where to position the EAs, as well as to assess the operationality of the strategic road networks. This analysis can be extended to the territorial level to identify the safest escape routes, as well as to focus economical resources in detail over specific urban areas that area at risk.
This method could be very useful for identifying which buildings require maintenance or seismic retrofit interventions. At the same time, it could also be employed to assess which road infrastructure needs to be monitored over time. In this way, public funds can be efficiently spent and the resilience of urban systems can be improved.


