1. Introduction
The massive consumption of fossil fuels for the production of electrical energy results in vast amounts of greenhouse gases leading to global warming [
1]. In Pakistan, intermittent renewable resources are used in rural communities in conjunction with the mainstream networks [
2,
3,
4]. However, these resources require huge capital costs to add reliability; for instance, utilizing solar energy requires a battery backup system, especially for the islanded power system [
5,
6]. Pakistan is an agricultural country as 25% of gross domestic production (GDP) accounts for agriculture. 60,000 MW of hydroelectric resources are evaluated nationwide, but only 11% of them are harnessed up till now and the rest of them are still untapped [
7,
8]. Besides rivers, Pakistan has built a series of canals to divert water from western rivers and to provide water to southern Punjab. These canals, along with their use in irrigation, are used as small-scale hydel power generation resources in Pakistan. More than 10,000 MW of small-scale hydropower potential is estimated in Pakistan, while 90% is still untapped. 800MW is installed but not working to actual capacity [
9].
Usually, the canal system is considered as small-scale hydel power generator that can generate equal power during day and night thus enhancing reliability which lacks in other renewable energy resources like solar and wind [
10,
11].
In [
12], a study was performed for rural electrification in an ICT Telecenter in the Kelabit Highlands of Sarawak. It compared a hybrid system of diesel, solar, hydro, and fuel cell energy to a standalone PV system. HOMER software was used to analyze and compare the standalone and the hybrid system economically to get NPC, COE, and CO
2 emissions. Results show that the hybrid system has an efficiency between 15–75%, while the standalone system has just around 10% efficiency [
13].
A study conducted In South Africa show that the best configuration of renewable sources to meet the load demand is grid–PV–battery–inverter configuration. HOMER software is used to find the least and most economic COE and NPC [
14]. However, hydropower as a distributed energy resource has not been considered in the study. Suresh Vendoti, and M. Muralidhar sought to find the best-suited combination of renewable resources by taking four different combinations of resources. Results showed that the best combination was battery–fuel cell–biomass–biogas–wind–solar, providing the lowest NPC and COE, while providing full supply to much of the studied area [
15]. Jamiu Omotayo and Makbul A. M. Ramli provided a solution for the shortfall of electricity in remote rural areas of Nigeria by designing a hybrid system of a PV solar–micro-hydro–diesel–battery and analyzed its performance in HOMER software. Results show that this system works better in the case of net present cost, cost of energy and other technical aspects [
16]. However, the study has only used HOMER Pro software sizing for economic and technical impact assessments. Shaheed Lekan Gbadamosi and Nnamdi I. Nwulu developed a hybrid system for farming application with optimal power dispatch and reliability analysis with hybrid CHP–PV–wind systems. By using HOMER software for optimization, results show a 48% reduction in energy cost while using the above hybrid system as compared to Combined-Heat and power (CHP) system [
17].
Sandile Phillip Koko and Kanzumba Kusakana developed a model called grid-interactive micro-hydrokinetic-pumped hydro storage (MHK-PHS). They conducted optimal power dispatch analysis with HOMER software. Results show that the model uses renewable technology and provides supply to the load while the excess load was supplied by the grid. By the proposed model, electrical load was reduced on the grid [
18]. However, no other source was considered, whereas a detailed economic analysis of the pumped hydro, initial cost and its comparison with other distributed generations and overall economic impact in light of those resources may have provided the broader spectrum of study.
A hybrid system of Simulink design on Santay Island is applied for optimal sizing. HOMER software results show the proposed hybrid scheme is the best way to provide electricity to the Island [
19]. However, the study is site-specific with more focus on the selected distributed generation sources. Ramadoni Syahputra and Indah Soesanti collected data from village of Yogyakarta in Indonesia. They used HOMER software to calculate the NPC and COE of different resources combinations. The extended particle swarm optimization technique is used to check the optimal capacity [
20].
Zifan Zhang and Xiangyu Yang considered a small hydro generator connected with the national grid. Authors applied grid-connected switch controllers and power controller switches to test the system reliability. Three types of systems were tested that are: hydro grid with no control, islanded hydro grid, and hydropower grid with passive island. Mohammed Guezgouz and Jakub Jurasz introduced a new strategy for energy management and coordination of the hybrid-system. Authors used MATLAB to implement a grey wolf optimizer for achieving higher reliability at a low cost [
21].
At the Bandar Dayyer coastal area, a techno–economic analysis is performed using two sources wind and solar with HOMER software. Results show the annual production of 470,176 kW of electricity. The net cost of installation of a 3 kW solar system is 14,790 USD and the wind turbine system is 7340 USD. Comparative results showed that the installation cost of wind is less than solar but solar generation is higher [
22]. In [
23], HOMER software is used for various distributed generation sources under the case study of India with the objective to enhance the reliability factor.
1.1. Hybrid Distributed Generation and Associated Potential Challenges
Cited literature shows some interesting results related to hybrid generation source operations and their impact on the project economics. It is revealed from the literature review that adding distributed generation or backup sources such as battery backup, fuel cells, or diesel generators has a significant impact on project economics [
22,
24,
25,
26]. In general, the research studies are specific in their evaluation of the cumulative impact of hybrid generation or backup sources on the overall project. Primary resources such as solar and wind always remain as a fixed and critical part of simulations in the literature, with the addition of other supplementary sources such as diesel generators, fuel cells, and battery backups to quantify their impact on the overall project. This approach shrinks the scope of the study as analyzing the dynamics of removing or tweaking the parameters of primary sources and their possible positive or negative impacts on project economics is not considered. Moreover, the studies are very much focused on certain case studies thus confining the scope of the study and its utilization in a broader spectrum. However, in some recent studies such as [
27], the authors have analyzed primary sources such as solar PV power with hydrogen production to evaluate the economic and environmental impact in five cities in India.
To the authors’ knowledge, micro-hydro generation with solar PV as primary generation has not been evaluated. According to the SWOT analysis conducted in [
28], micro-hydro resources have many positive points including their applicability to be installed on small waterways. Moreover, various configurations of solar with hydro and grid, and the trigeneration impact in terms of project NPC, COE, Operational cost, unmet load, excess generation, percentage of grid units, and renewable production, have not been studied
Pakistan is one of the countries with good potential for canal based hydro power resources. The hydroelectric resources of 60,000 MW have been identified in Pakistan [
24]. The availability of renewable sources (solar power), along with one of the world’s best canal irrigation systems, makes Pakistan a potential location for utilizing the canal based micro-hydro system’s distributed power generation. Being agricultural land, the canal system is widely spread across the country. Pakistan’s canal system is further divided in three sub-canals: Main canal, Secondary canals (minors), and Tertiary canals (water courses). The area allocated by each canal is shown in
Table 1 [
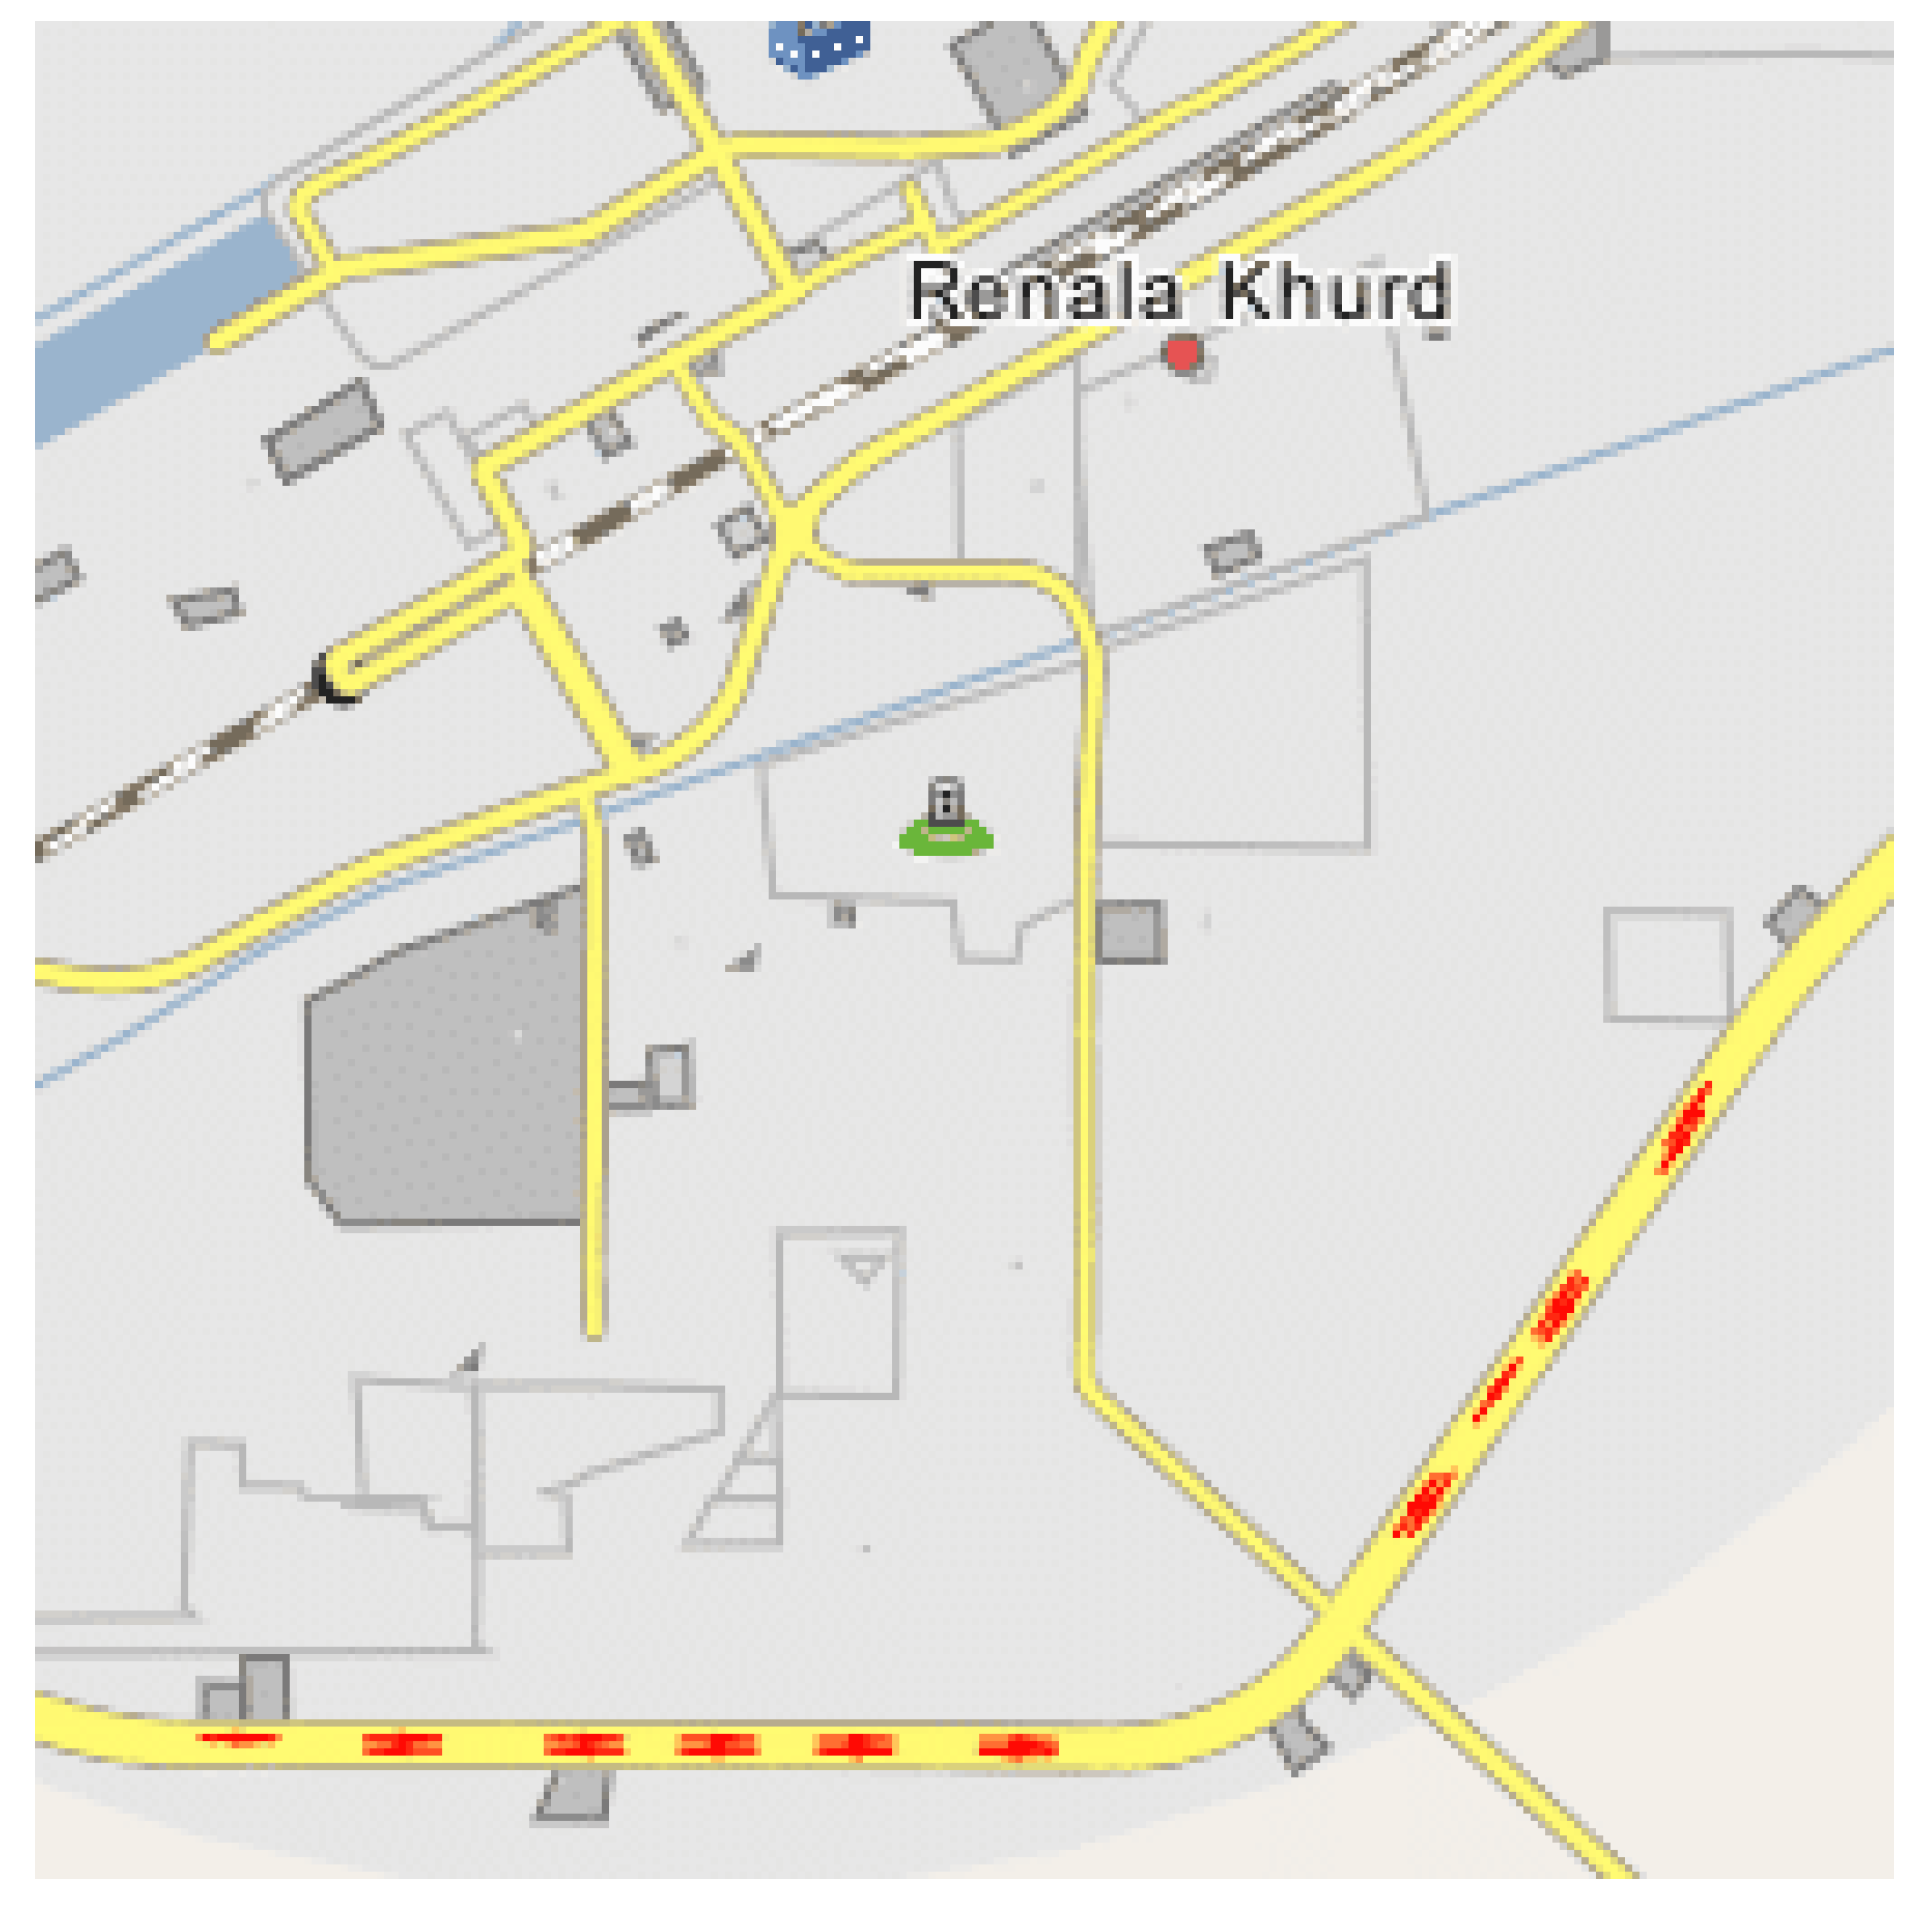
5]. Renala Khurd power station, as shown in
Figure 1, is located in the Punjab province of Pakistan, in the Okara district. The primary data regarding generation through the Renala Khurd power plant, its operational months, and the load that it feeds, was taken by the local district authority responsible for the operation of the Renala Khurd hydropower plant.
1.2. Contribution
Despite the existence of canal systems in the world, micro-hydro resources are not extensively tapped for grid-connected or islanded microgrid power generation for nearby communities. One of the reasons for not tapping the proven potential of micro-hydro resources is the extensive utilization of solar PV systems in these areas as a cleaner source of power generation integrated with the grid. However, generation through PV is a costly solution due to higher system sizing to reduce the burden on the grid. This research study is focused on developing a trigeneration concept with optimal sizing strategies keeping hydropower as a fixed resource generator to reduce solar PV system sizing, reduce the burden on the grid, reduce the utilization of battery backups, and enhance reliability. This study also assesses the technical parameters such as unmet load, percentage of the grid and solar utilization, and excess generation through the renewables for various studied configurations. The main contributions of this research article are as follows.
A comprehensive framework and feasibility study for tapping the potential of micro-hydro into the existing distrusted generation sources for microgrid operation near the canal areas;
Development of the optimal sizing of trigeneration sources using a genetic algorithm with detailed problem formulation of the objective functions and a set of constraints based on the fixed and variable generation sources to reduce the operational, net present cost, and cost of energy;
Conduction of detailed economic assessment of various configurations and combinations (solar–grid, grid–hydro, grid–Solar–hydro) for detailed comparative analysis for sustainable system design;
Reliability assessment of various configurations in terms of unmet load, grid units purchased, percentage of renewable energy and grid utilized, and excess power generation.
A site at Renala Khurd is taken for study. Renala Khurd is a small-scale hydel power plant with 1.1 MW generating capacity. Currently, the hydropower generated from the Renala Khurd power plant services the nearby community along with the grid. The HOMER Pro software is used to simulate different scenarios described in
Table 2.
2. Methodology
The research work is divided into three parts. In the first part, the load profile of the site under study is developed. In the second part, the simulation of different scenarios discussed in
Table 2 is performed. In the last part, GA optimization is used for system sizing and the values of optimal system sizing are used in HOMER Pro software to evaluate the results.
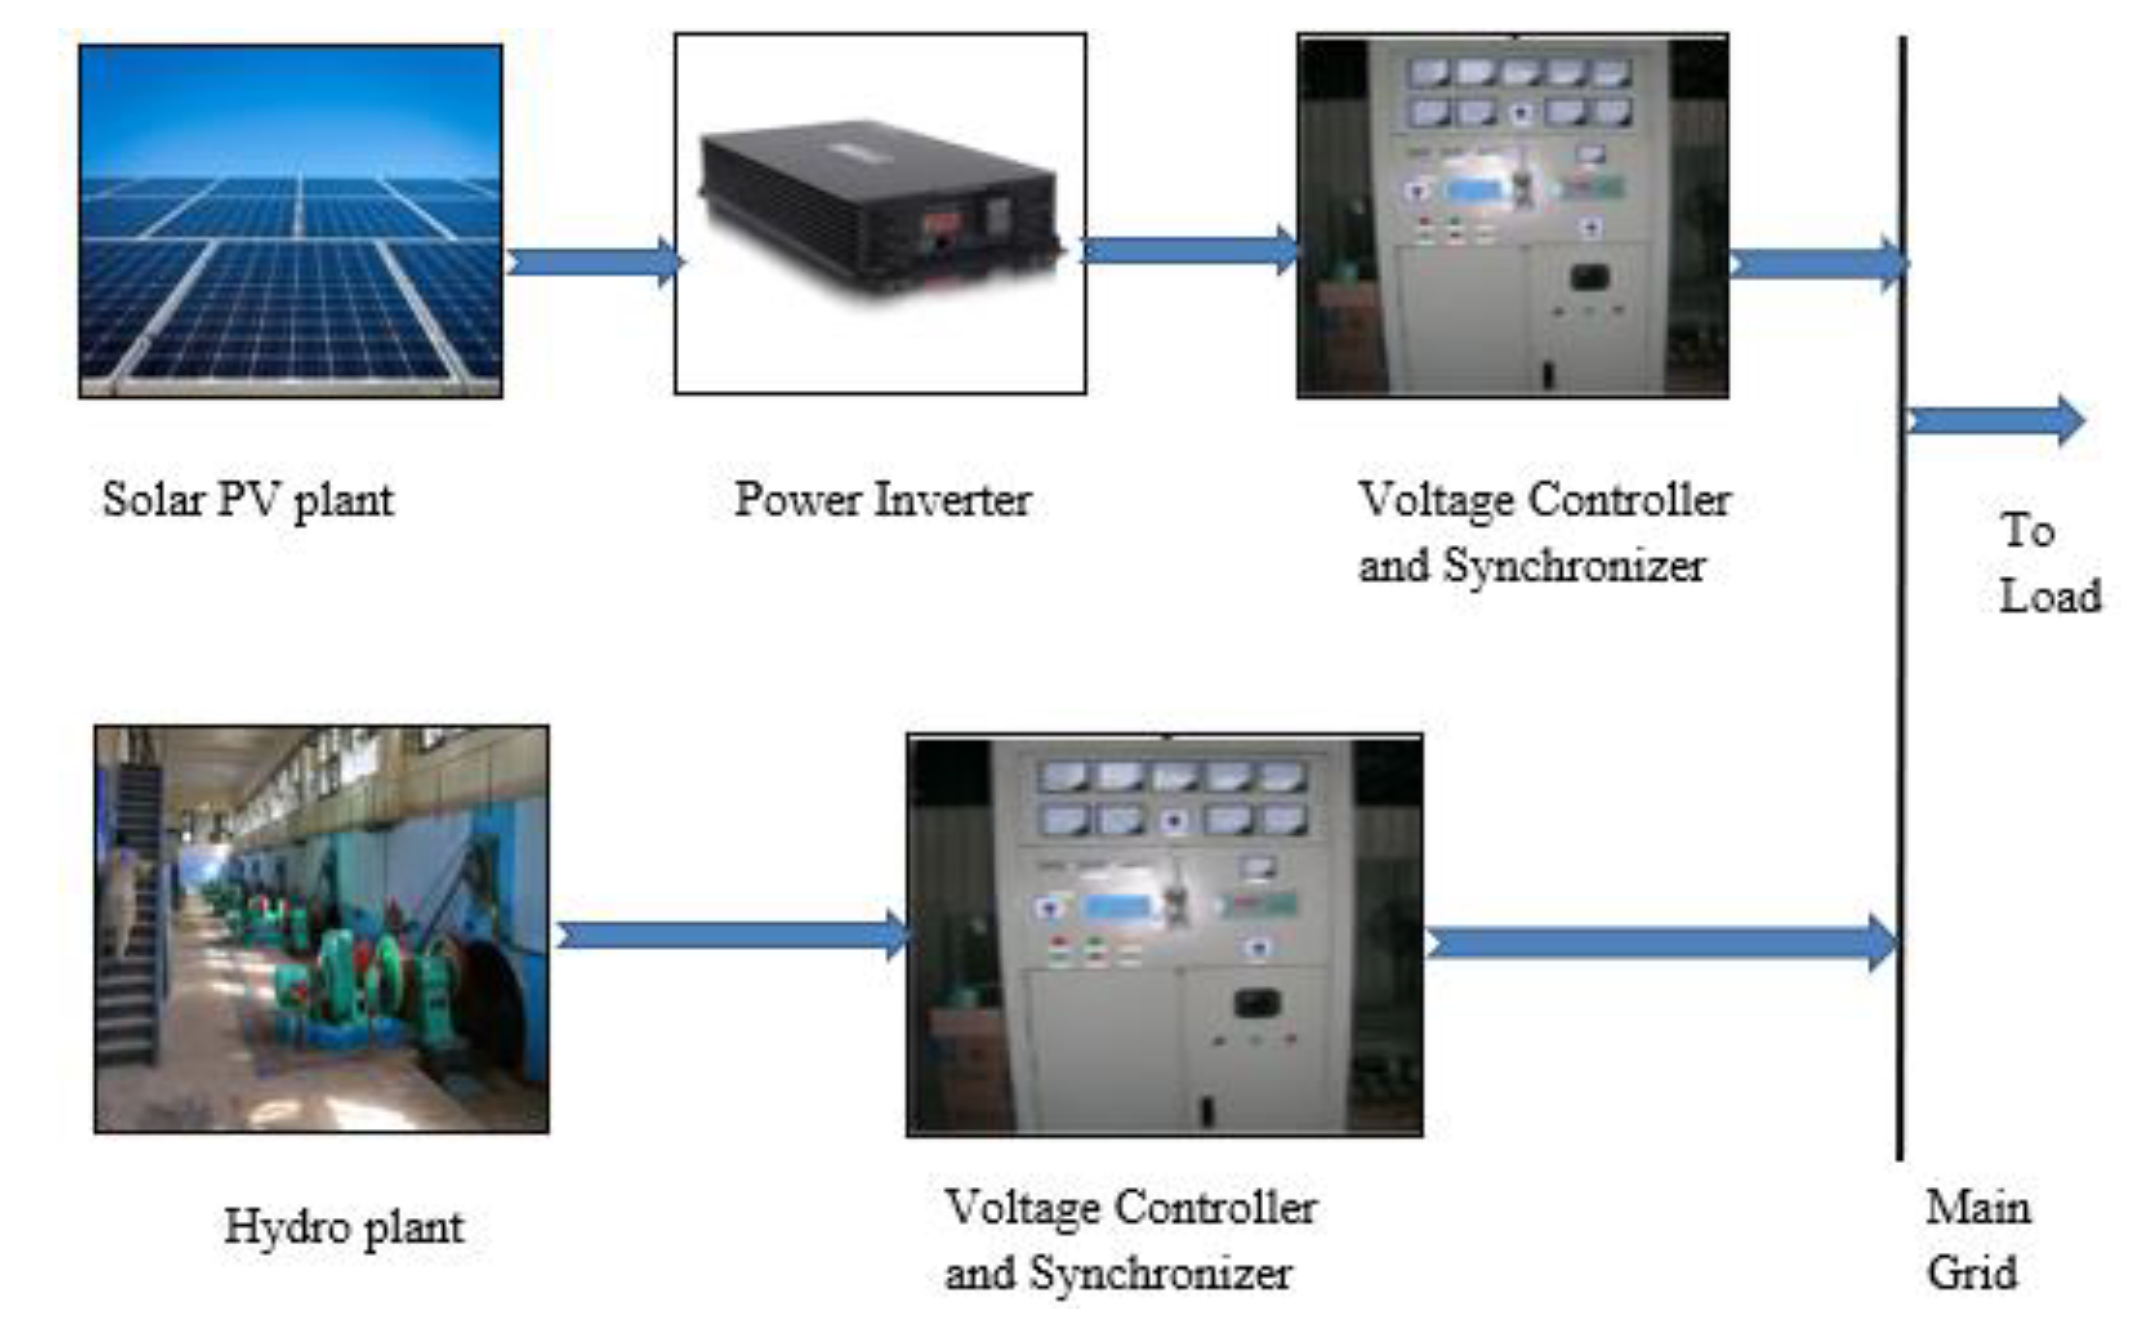
An overview of our microgrid hybrid system in terms of components is shown in
Figure 2. Solar PV plant output DC power is changed to AC power by a power inverter and fed to the voltage controller. At the same time, AC power goes to the voltage controller from the Hydel resource, and the controller is connected to the main grid.
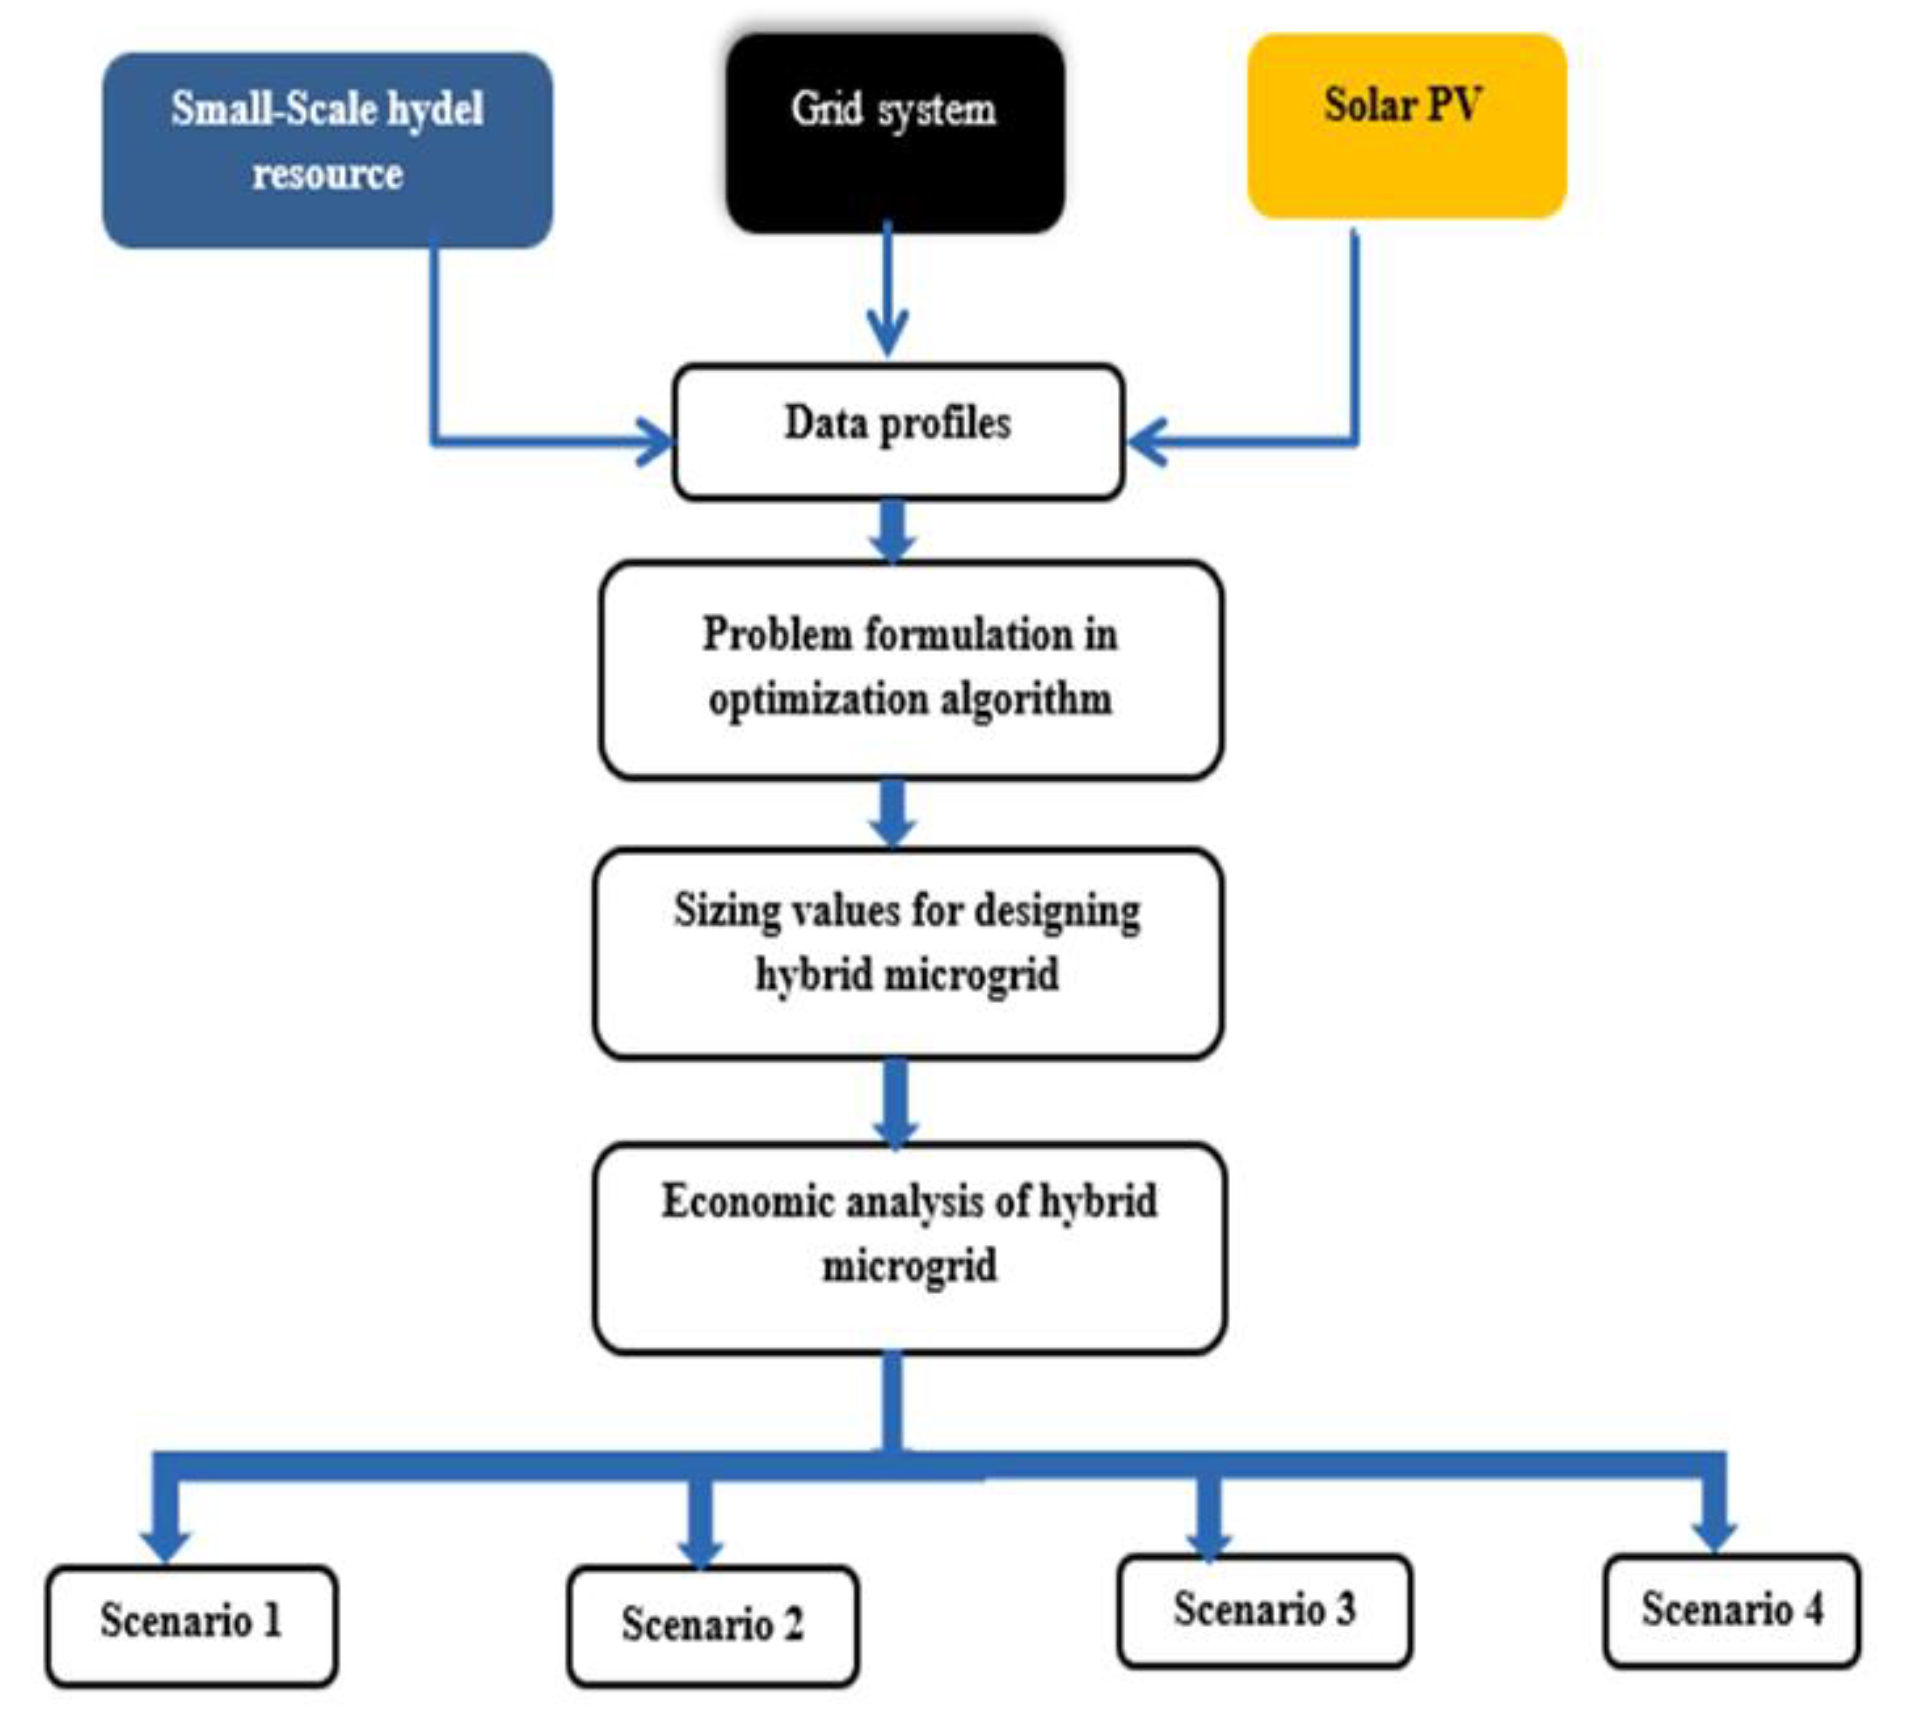
Figure 3 shows the flow chart of the methodology. Firstly, load profiles and generation profiles are made. Then objective function and constraints in the genetic algorithm in MATLAB will be designed for minimal utilization of the grid, solar PV, battery, and small-scale hydel resources. This optimization scheme will provide optimal values for the sizing of resources. This leads to an economic analysis of hybrid microgrids. With the above-defined objective function and constraints.
2.1. Load Profile Development
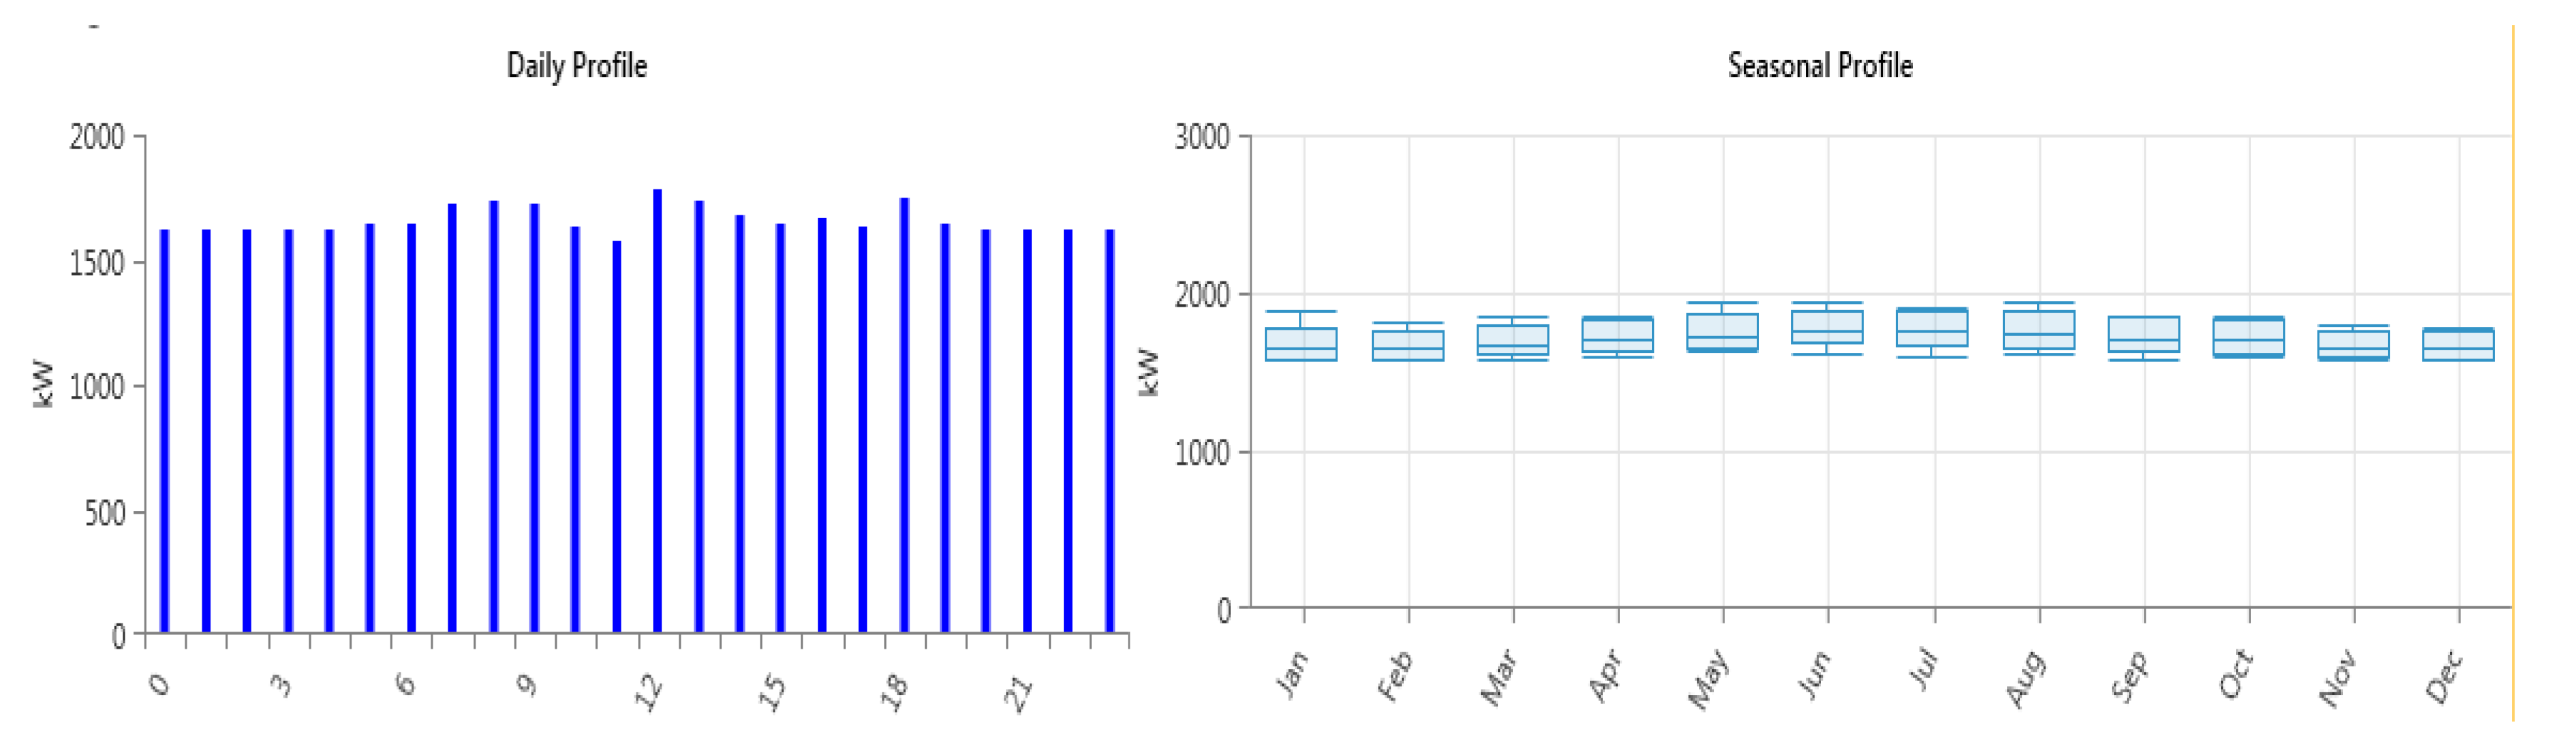
The load profile was formulated from the available data from the Renala Khurd hydel power plant. The Renala Khurd power plant is currently supplying energy to a village receiving a residential load (
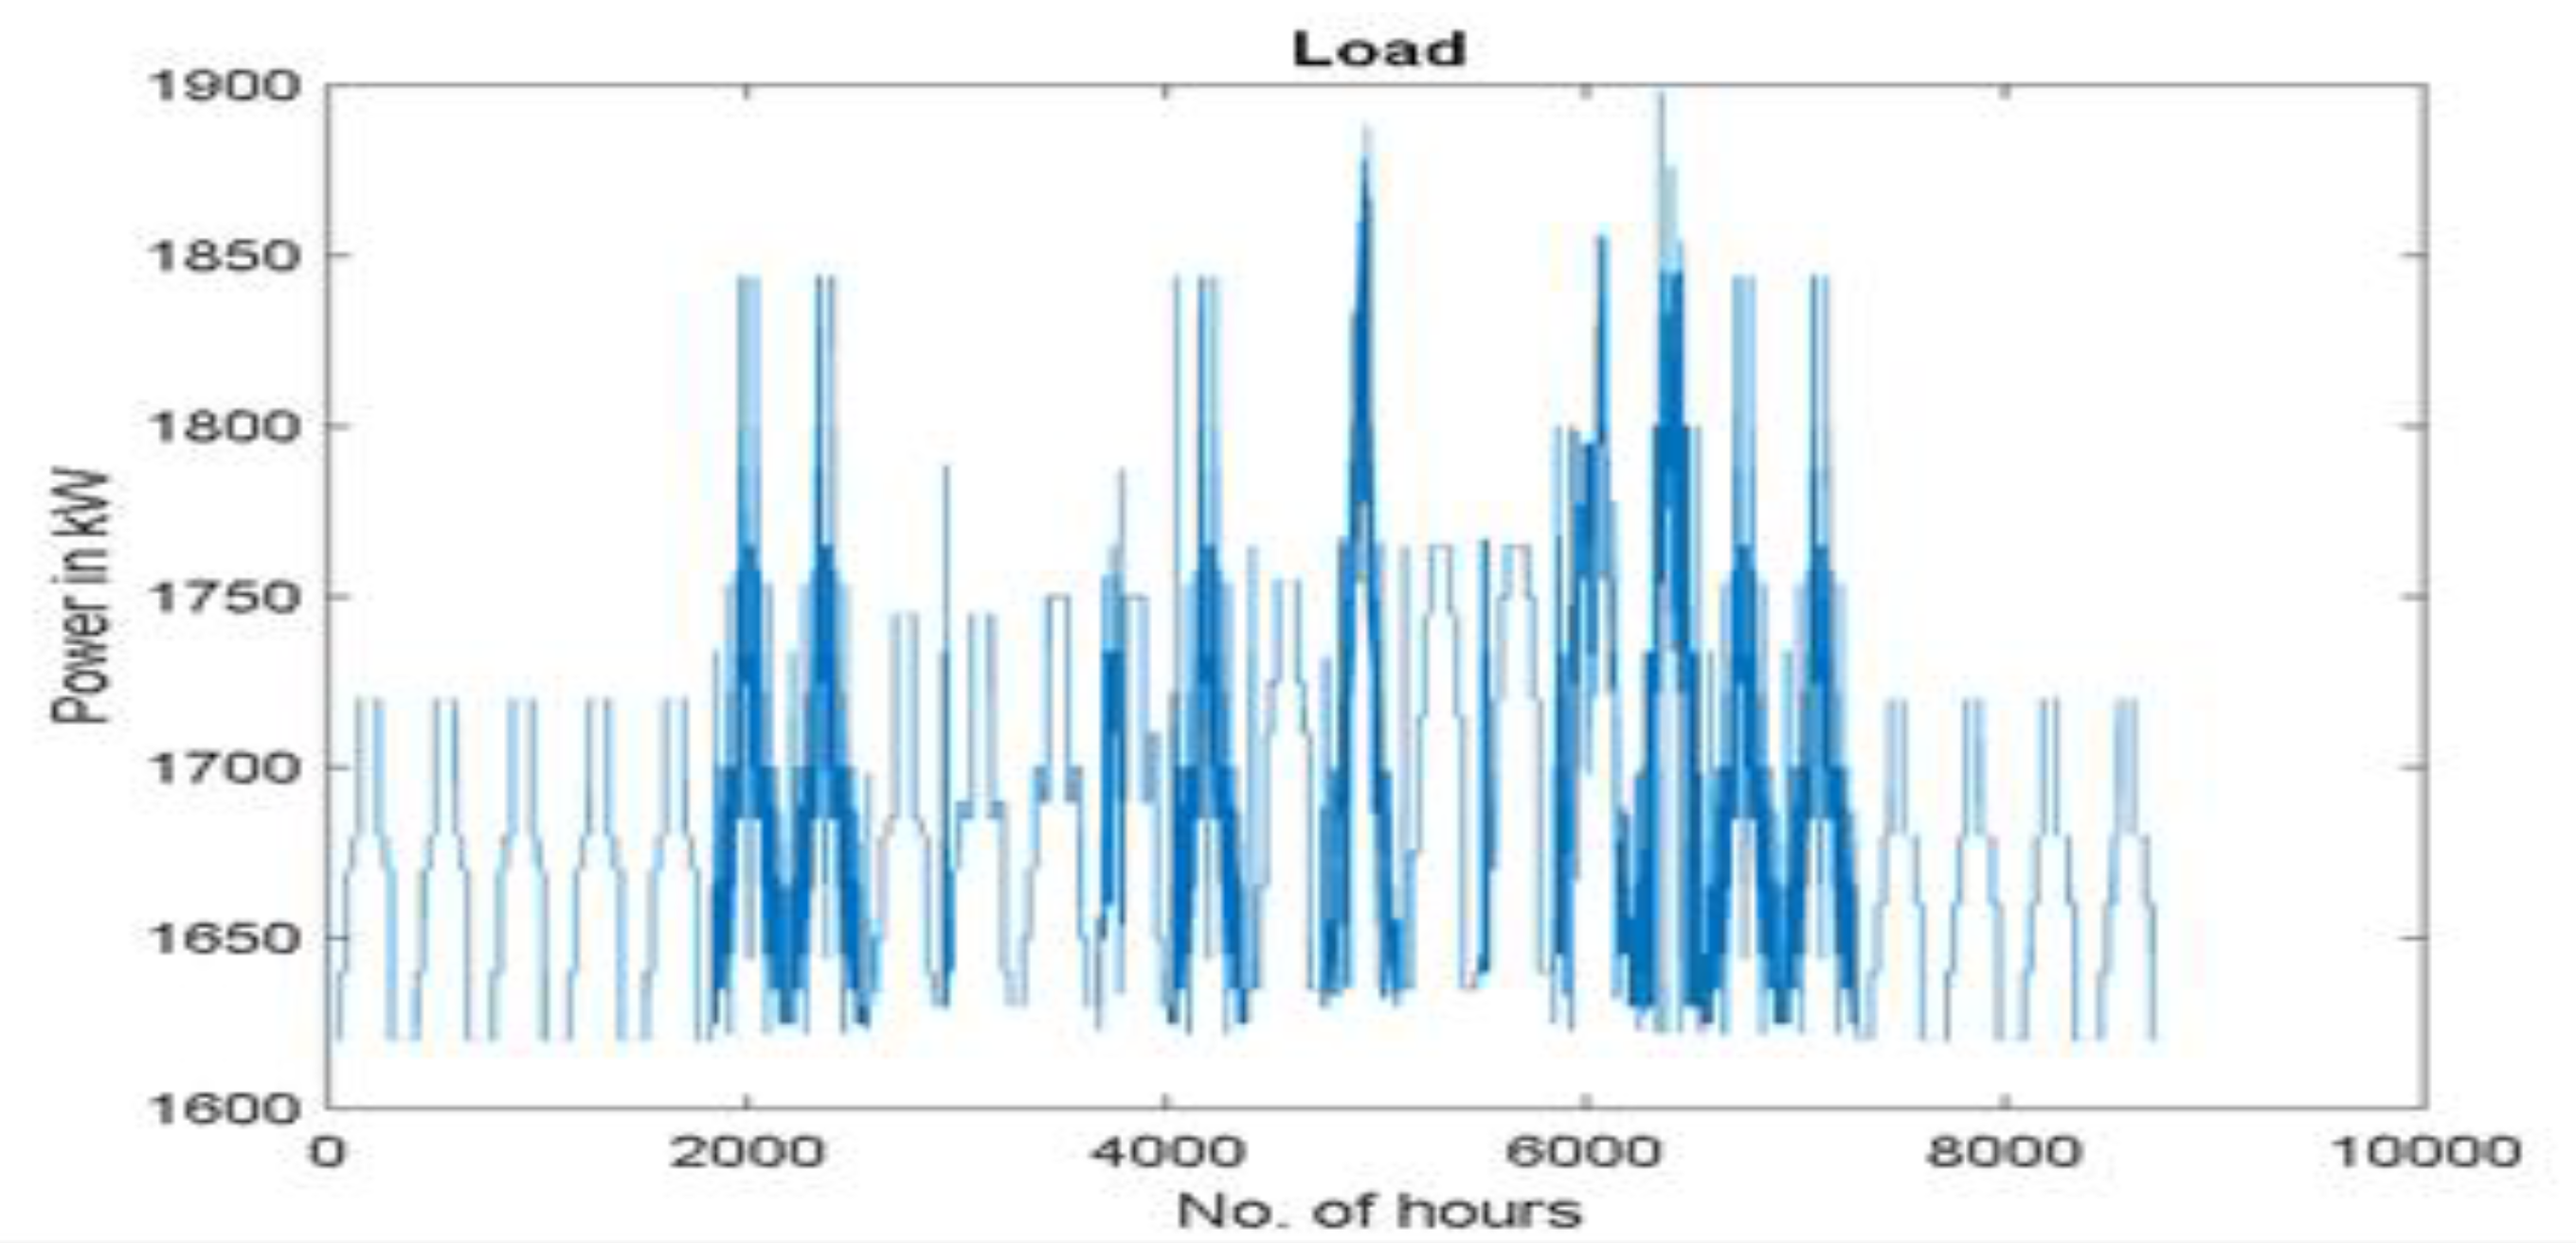
Table 3). The energy demand for the village is 1.9 MW which is fulfilled by a hydel power plant of 1.1 MW and the remaining power is fed by the national grid. Due to the shortfall of power through the national grid, sometimes the village witnesses a few hours of load shedding as hydel power alone cannot fulfill the required demand of the village. The daily load profile of the village is shown in
Figure 4.
Since Renala Khurd is a small-scale power plant, load and generation data collection is conducted from energy meters installed for the village. Energy demand is mainly constituted as household fans, light bulbs, water tube wells, water pumps, and some air conditioners. The daily and monthly load profile from HOMER Pro is shown in
Figure 4. The average load/day is 1703.7 kW and the peak load/day is 1944 kW as shown below in
Figure 5. The load factor of the village is calculated as 0.88. The hydel power is not available during the months of December and January. The peak power consumption trends are recorded in the month of June. During this time load demand is fulfilled by the national grid. Due to load shedding hours, as well as high tariff rates, the power production from the grid has become a matter of concern for both consumers and utilities. It can be seen in the figure that most villages in Pakistan opt for solar-based generation with battery backup. However, huge capital investment is involved. On the other hand, there is an efficient and one of the world’s largest canal systems available in Pakistan that can be used as a hydel resource along with solar generation. It is anticipated that the hybrid combination of solar and hydel can reduce the capital and overall operation cost significantly. In the next section, we will analyze multiple hybrid resources using HOMER Pro software to calculate the capital cost of the system. Capital costs, along with operational costs, are two major factors affecting project NPC and COE, as shown in Equations (1) and (2).
The following equation shows how NPC is calculated from the annual cost and capital recovery factor of the hybrid system [
29]. Where C
NPC = Net present cost (NPC), C
ann,t = Total annual cost, CRF = Capital recovery factor, i = Real Interest rate, and Nproj = Project lifetime in year, COE (cost of energy) is the ratio of total useful annual energy cost to total energy produced by the system [
30].
where
= Total energy (kWh/yr) generated by the local microgrid, and
= Total grid sales (kWh/yr).
Therefore, optimal sizing helps reduce the overall cost of the project. In this research study, we will calculate the system sizing as it directly impacts the capital cost.
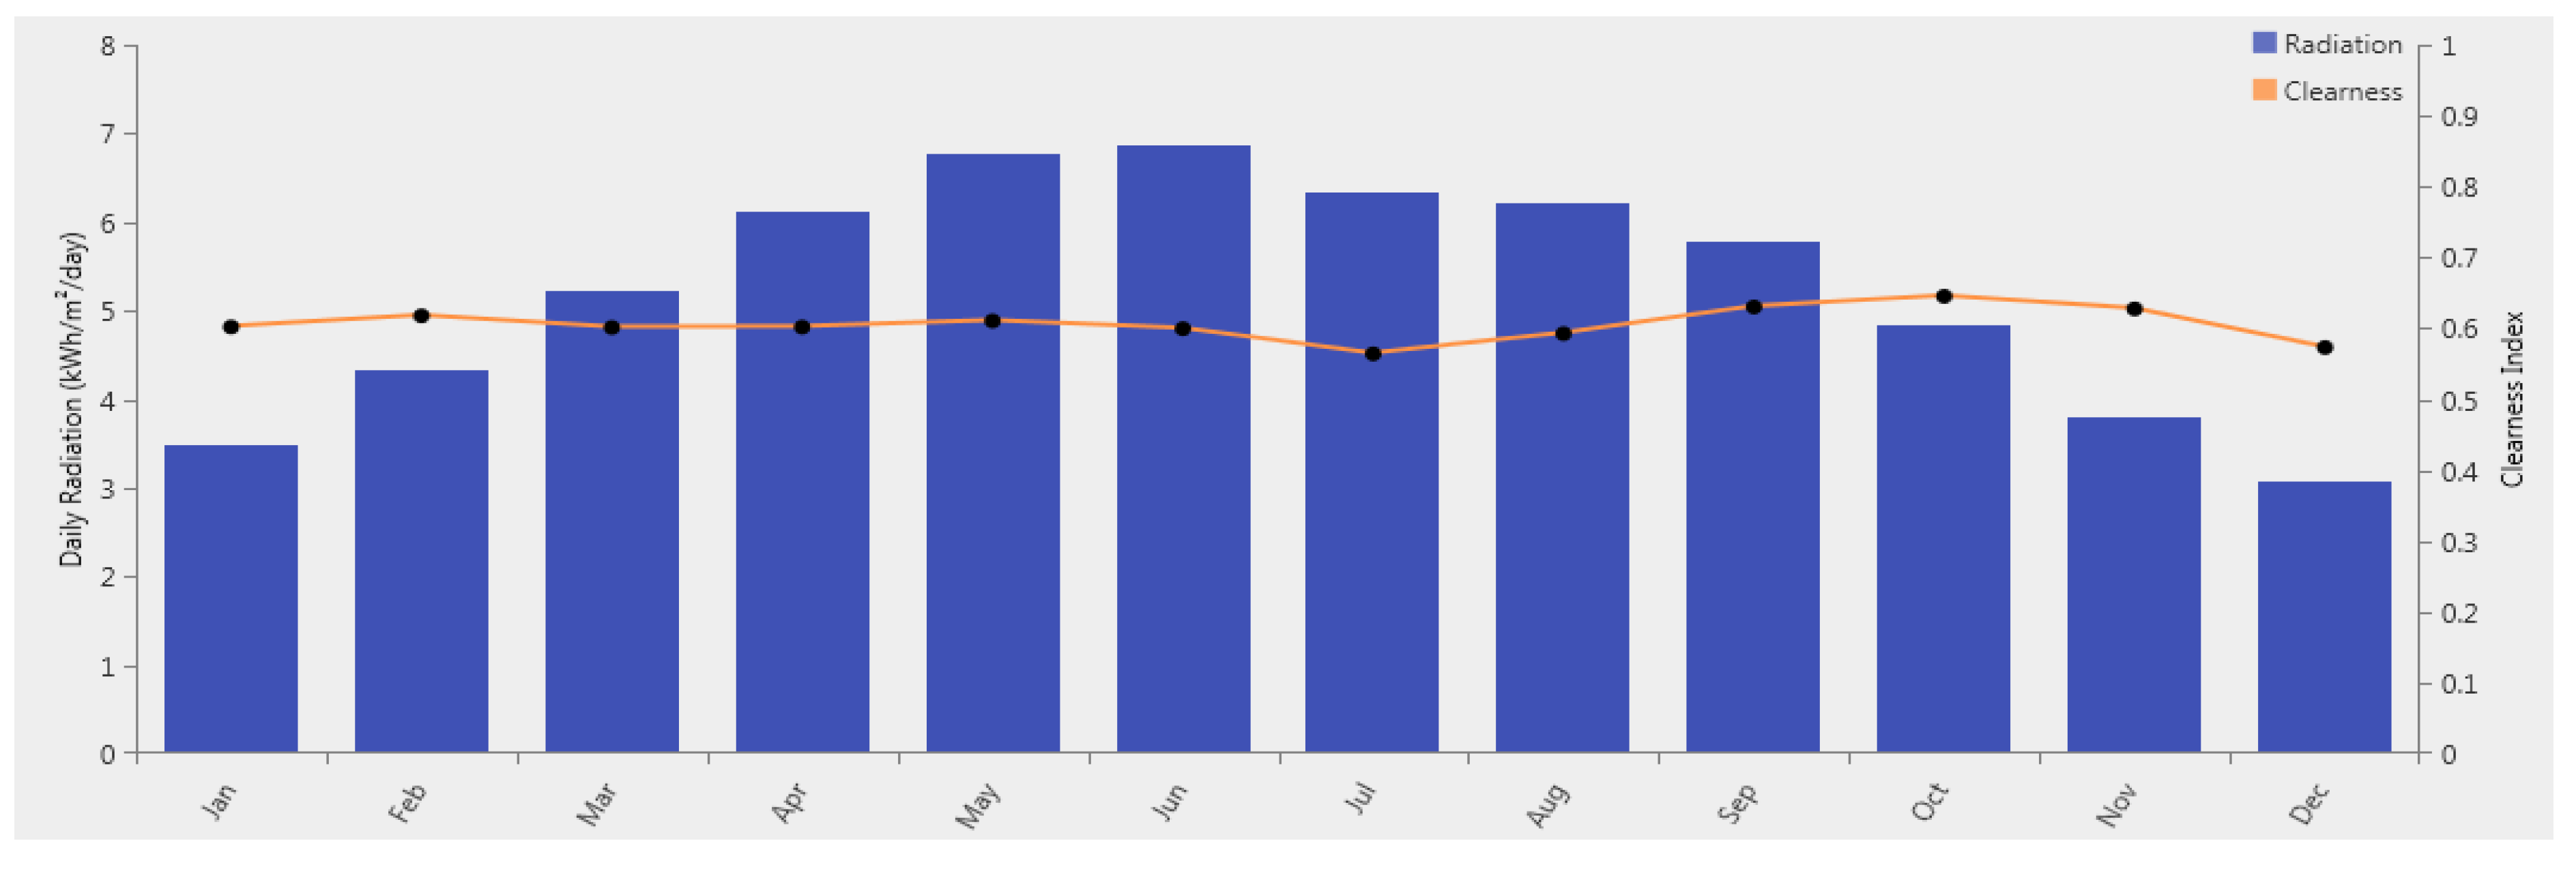
2.2. Annual Solar Radiation
The annual solar radiation for the study area is obtained from National Renewable Energy Laboratory (NREL) database [
31]. The peak irradiance is in June at 6.858 (kWh/m
2/day) and the minimum irradiance is in December at 3.080 (kWh/m
2/day). The annual daily solar irradiance is shown in
Figure 6 below.
2.3. Analysis of Utilizing Multiple Energy Resources for Hybrid Microgrid
In this section we will calculate the system sizing from two approaches:
System sizing using HOMER Pro software along with economic analysis;
System sizing using the genetic algorithm (GA) and attained optimum sizing values will be used in HOMER Pro software for economic analysis.
Four scenarios based on resource selection and its impact on sizing are considered as discussed in
Table 2.
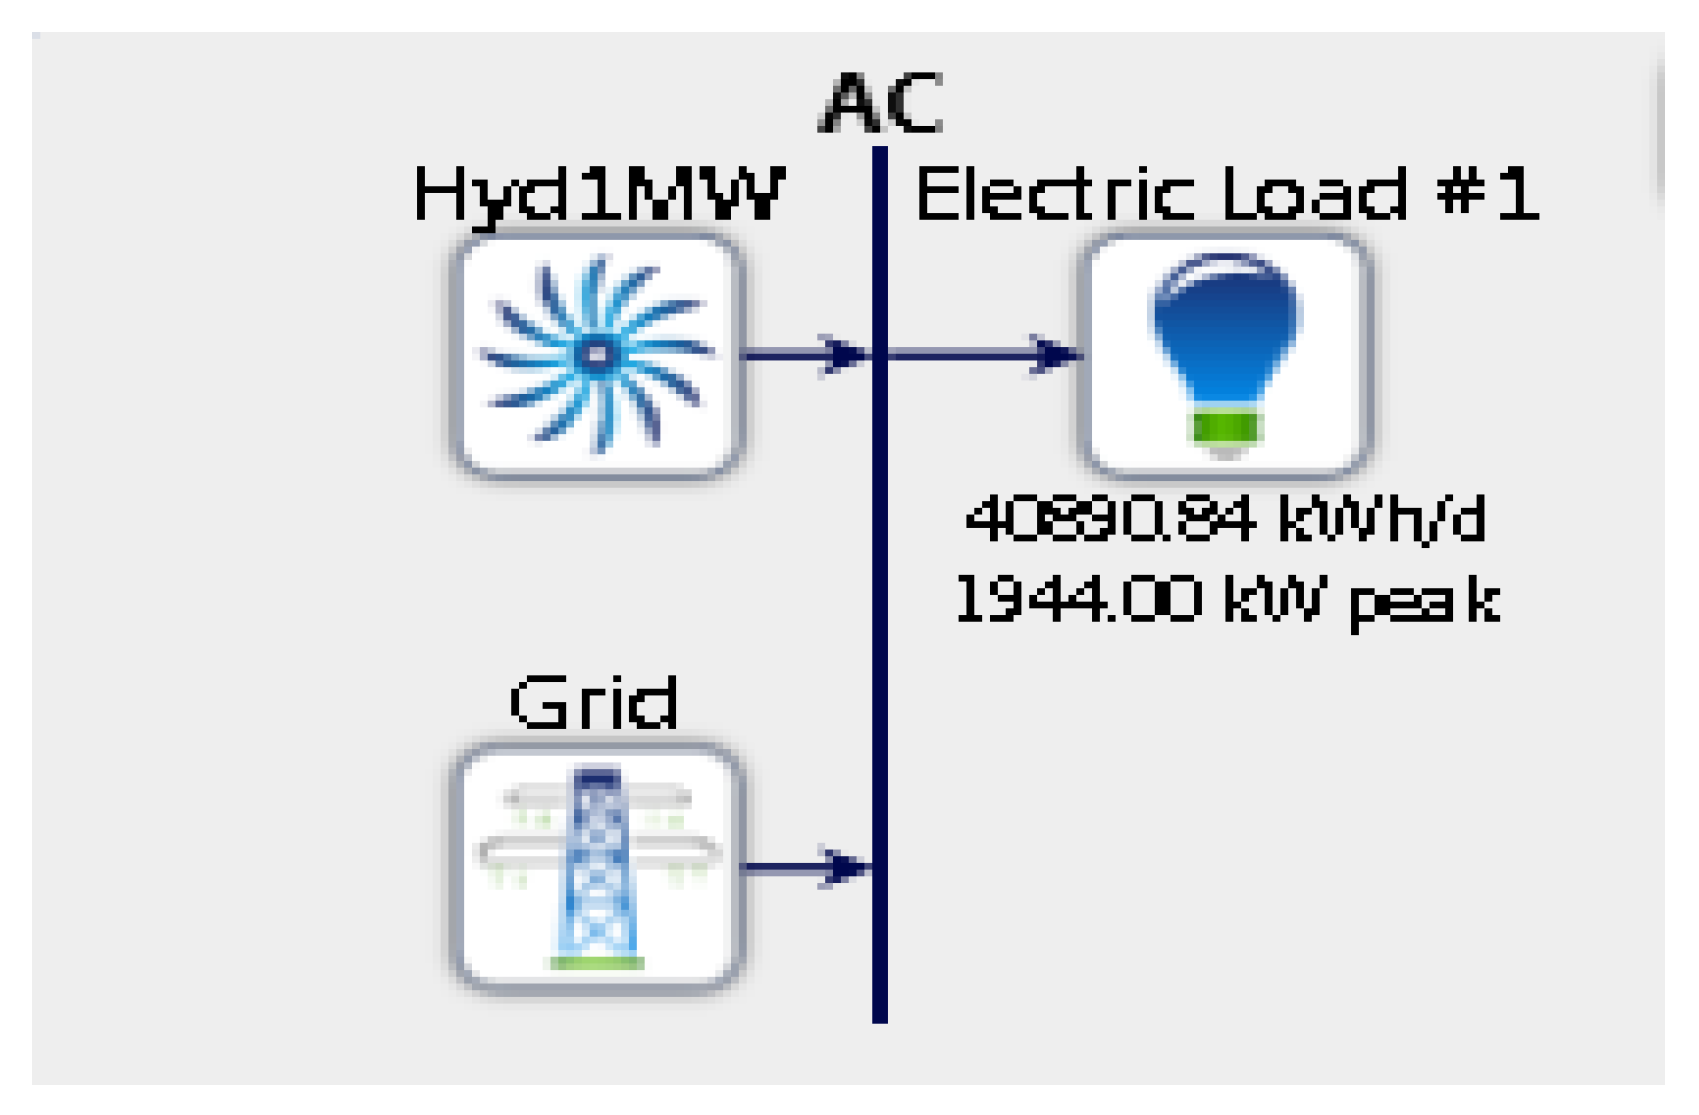
2.4. Scenario 1: Small-Scale Hydel (SSH) and Grid
Scenario 1 is based on the actual hybrid power system installed at Renala Khurd. The main grid is used as the primary source to fulfill load demand and the small-scale hydel is used as a secondary power generation source. HOMER Pro software incorporates load profile and the above-mentioned resources along with solar GUI data for sizing and cost optimization.
Figure 7 shows the schematic of scenario1. Electricity purchased from the national grid is calculated as 0.13
$/kWh. The discount rate and inflation rates are 5.88% and 2%, respectively for scenario1 as shown in
Table 4.
2.5. Scenario 2: Grid and (SPV)
To reduce the load-shedding conditions, most residents utilize solar PV along with the grid. However, the capital cost of the system increases significantly because of huge system sizing that eventually increases the NPC of the project. In some cases, battery banks are also being used as a source of backup power. In the second scenario, we have simulated the most popular configuration in Pakistan where the grid is being used with solar PV as a hybrid resource. The inflation cost and discount rates are kept the same as scenario 1. The cost of solar PV can be found in
Table 4. The hydel power has not been used in scenario 2 to assess the impact of sizing and project performance parameters in the most popular microgrid configuration where grid and solar PV sources are preferred, and hydel power has never been taken into account despite the good canal-based hydropower potential available. This scenario will help in understanding the impact of adding the hydel to solar PV and grid as a resource. The objective of scenario 2 is to simulate the economic impact of current power infrastructure being used to compare it with scenario 3 and scenario 4, which use hydel resources along with grid and solar PV. The economic values of parameters will remain the same as shown in
Table 4.
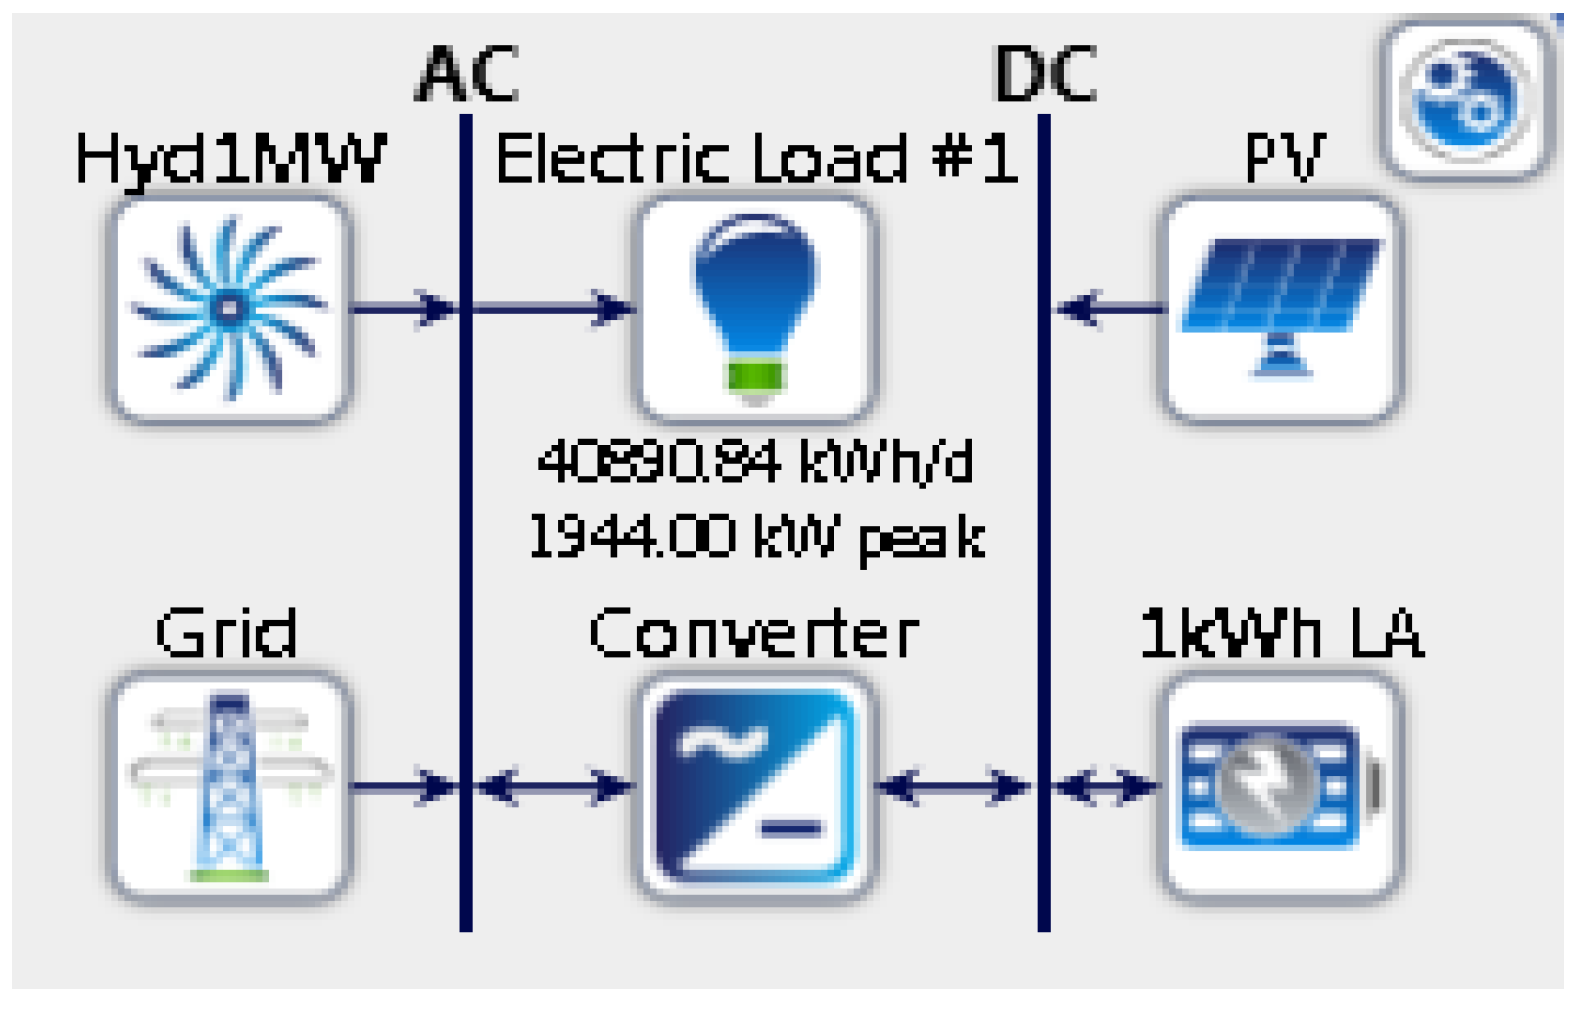
Figure 8 shows the schematic of scenario 2.
2.6. Scenario 3: Small Scale Hydro (SSH), Solar PV (SPV), BATT, and Grid with GA
In scenario 3, HOMER Pro software is provided with the defined values of solar PV and grid. The optimal values of solar PV and grid are obtained using the genetic algorithm. Since in scenario 2, HOMER Pro software was used with no bounds, the sizing values of the grid and solar PV were based on the load following technique. However, restricting the system with defined constraints using the GA may provide a more comparative and economically viable economic solution. GA has been widely used for cost optimization in power systems. Therefore, in this research, GA is used for sizing. The objective function and constraints for the proposed system are given as below. The obtained values from the GA will be in the form of the total power required from each resource to fulfill the load. The obtained values from the GA shall be multiplied by the existing unit cost of solar PV battery, and grid to find the optimal cost of each power system. The total power of each resource obtained can be interpreted as resource sizing which will be used in HOMER Pro software to limit the sizing. This is contrary to scenario 4, where HOMER Pro open-endedly selected the sizing values.
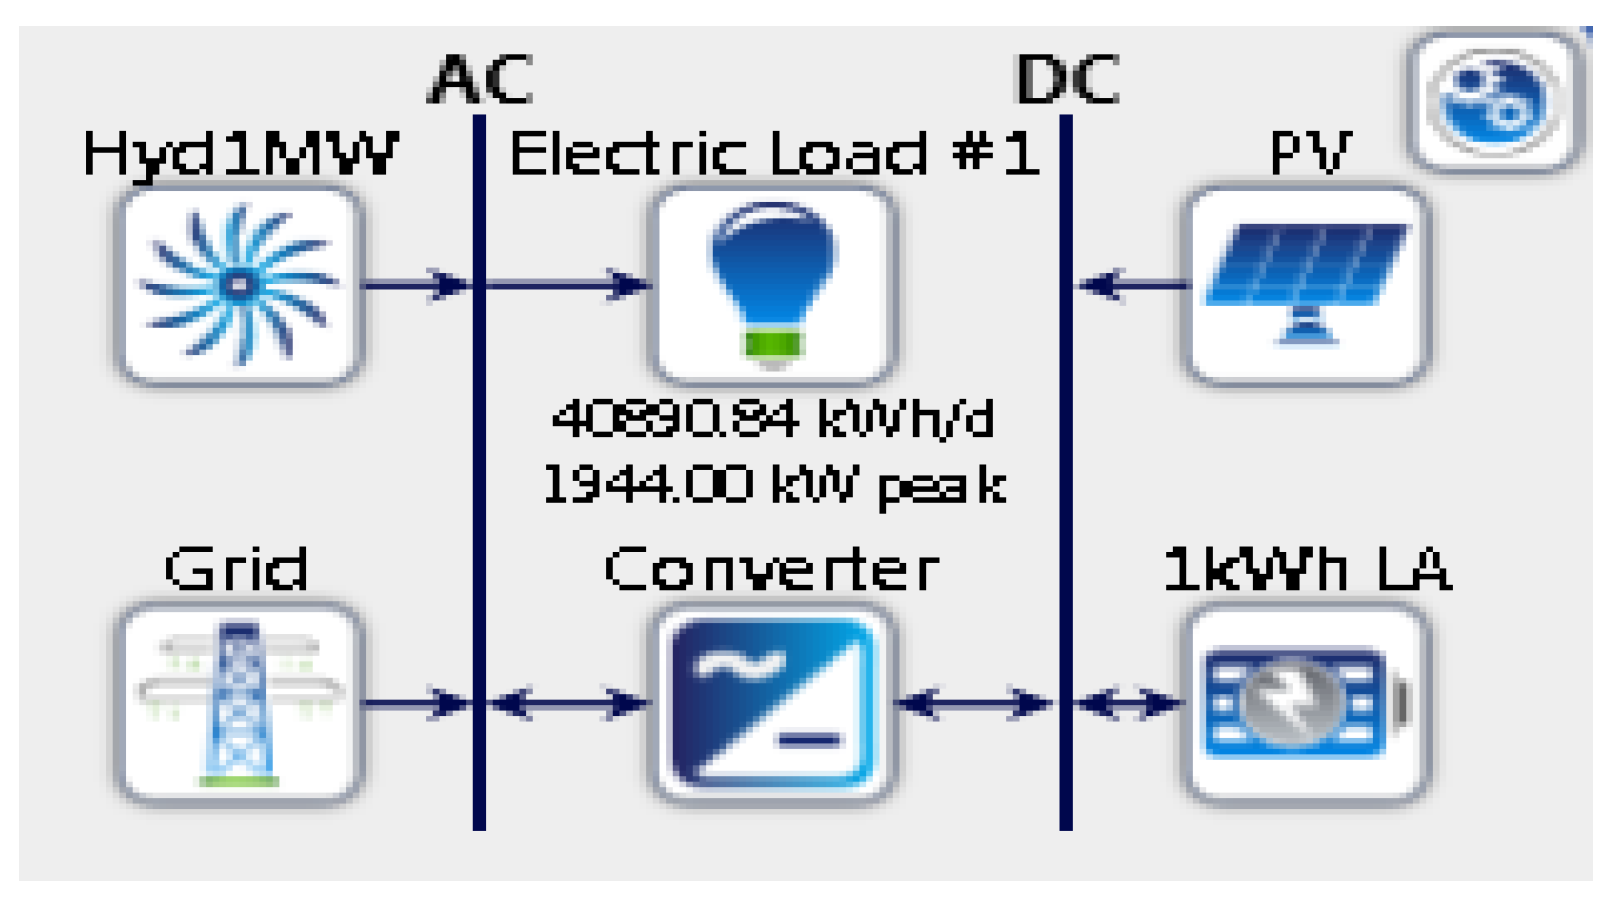
Figure 9 shows the schematic of the scenario 3.
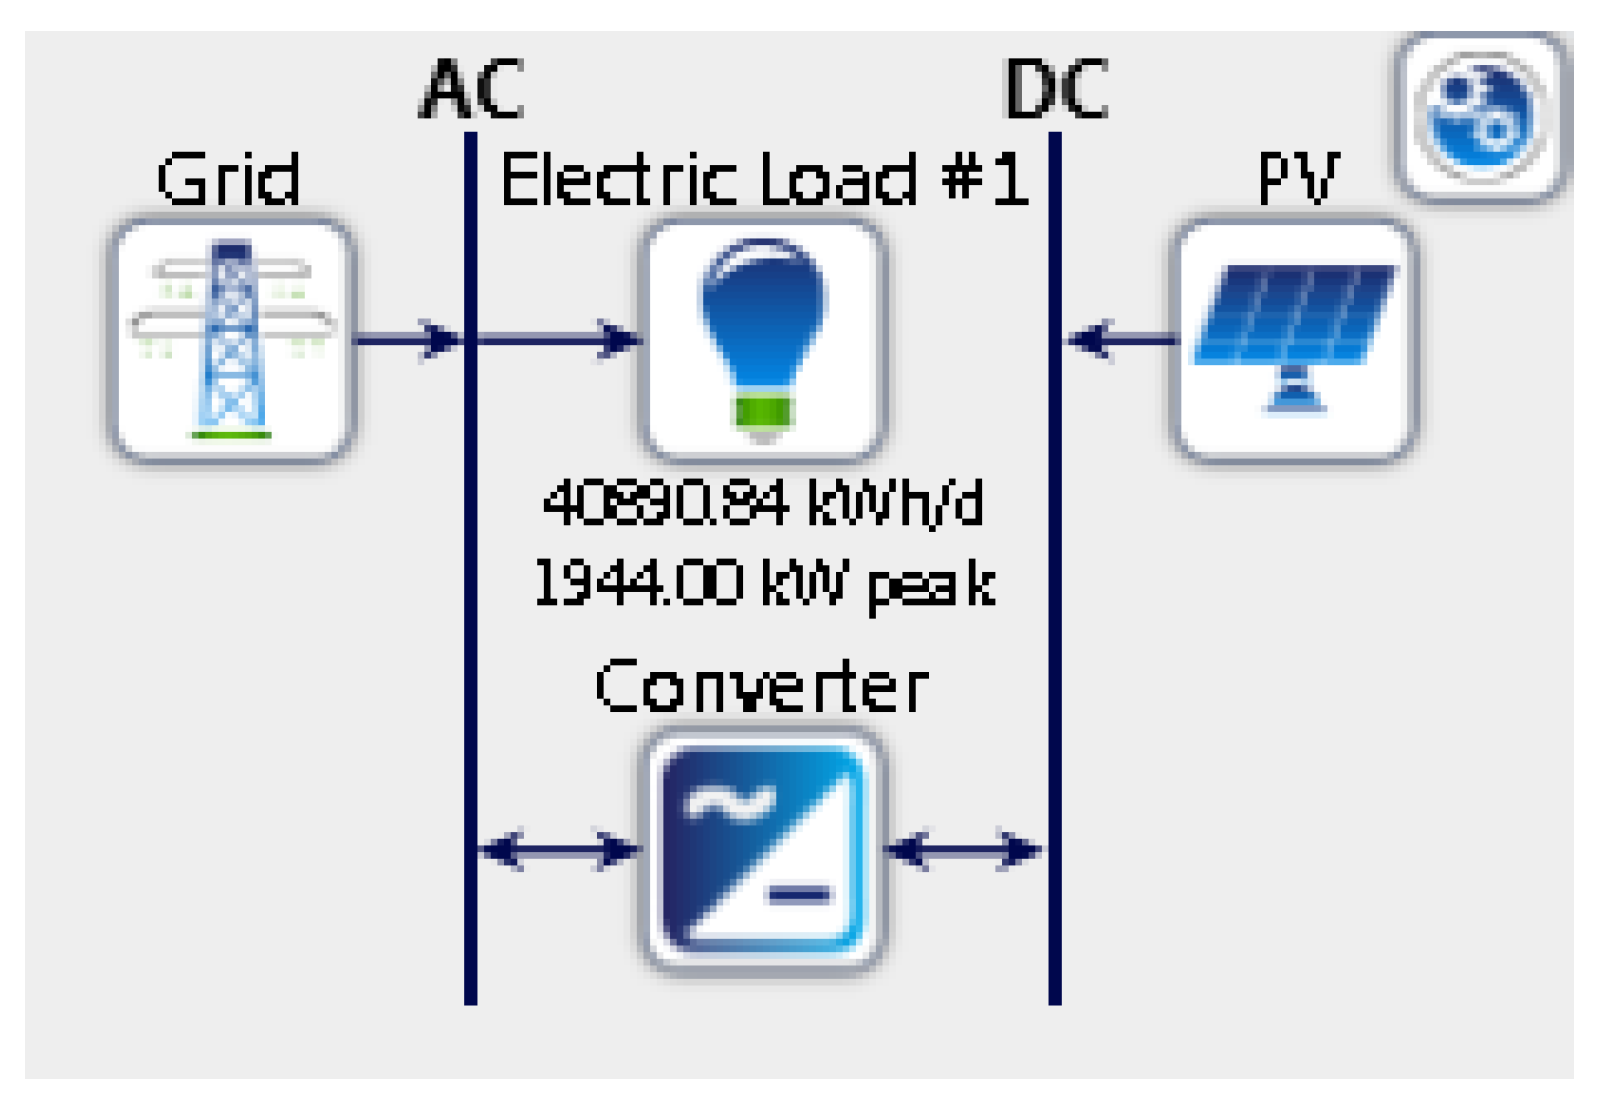
2.7. Scenario 4: SSH, SPV, BATT, and Grid
To assess the economic impact of utilizing solar energy as another source with grid and hydel power generation, secnario1 is modified by adding solar PV battery storage in a DC bus bar, as shown in
Figure 10. The 1 kW solar PV and 83.4 Ah battery storage cost
$545 and
$235 respectively. The remaining values such as the inflation rate and discount rate as mentioned in
Table 4 will remain the same in HOMER Pro.
The HOMER Pro software will simulate the system without any bounds or constraints. The load following controller of HOMER Pro is used for simulation. Since there are no bounds for system sizing, the HOMER Pro software will open-endedly size the overall system.
2.8. Modeling of System Components
For size and economic optimization of hybrid systems, component modeling is a significant step. Mathematical representation of solar PV system, hydro turbine, grid, battery storage, and Converter is explained below:
2.8.1. Solar PV System
The power output from solar PV systems can be calculated by using meteorological data like ambient temperature, solar radiation, etc. It depends largely on the solar radiation of the study area [
32]. Solar power is calculated from Equation (3) as shown below:
where, T
c = Cell temperature (°C), T
amb = Ambient temperature (°C), G = solar radiation (W/m
2), P
pv = Output power from PV cell (W), P
n-pv = Nominal power from PV cell at reference conditions (W), G
ref = solar radiation at reference condition (1000 W/m
2), K
T = Temperature coefficient at maximum power (3.7 * 10
−3 (1/°C)), and T
ref = PV cell temperature at reference conditions (25 °C).
2.8.2. Hydro Turbine
For Hydro system, the first parameter is to calculate the flow rate. The flow rate for the hydro system can be calculated if we have a catchment area in addition of rainfall data. The area from which rainwater flows is called the catchment area. This procedure implies for run-off river type of hydro system [
33]. The hydropower is calculated from the following Equation (4):
where Q
site = Discharge at site (m
3/s), Q
guage = Discharge at gauge (m
3/s), A
site = Catchment Area (m
2), A
guage = Catchment Area of gauge (m
2), and K = Scaling constant. The hydro power [
34] is calculated from the following Equation (5):
where P
hydel = Mechnical power from turbine,
= Hydraulic efficiency of turbine,
= Density of water (1000 kg/m
3),
= Acceleration gravity (9.8 m/s
2),
= Head height (m), and
= Discharge at site (m
3/s).
2.8.3. Grid
The annual cost for purchasing power from the grid can be calculated by the following Equation (6) where P
g is power purchased from the grid (kWh).
where
= Price of grid power (
$/kWh),
= Power purchased from the grid at hour t (kW), and T = Total time for study interval (1 to 8760 h for a year).
The amount of power purchased from the grid should be in a certain range:
where P
g min is the minimum power purchased from the grid and P
g max is the maximum power purchased from the grid supply. Power purchased from the grid should be within above-mentioned limits [
35].
2.8.4. Battery Storage
In the solar PV system, small-scale hydel may not be able to meet the load at all times, so battery storage is used as a backup for the hybrid system [
36]. The storage capacity of the battery, charging and discharging, are calculated from the following equations:
where C
bs = Storage capacity of the battery (kWh), E
load = Hourly load energy (kWh), AD = Daily Autonomy within the range of (0.1 to 1.0),
= Inverter efficiency,
= Battery efficiency, and
= Depth of discharge.
Battery charging happens when generated power is greater than load and surplus power is stored in a battery. Battery charging is calculated from the following equation: The equation 9 in [
36] can be modified to add power of the hydel energy along with the PV. Same is done for Equation (10).
Battery discharging occurs when a load is greater than a generation and battery storage is discharged to cover the deficit:
2.8.5. Converter
A converter is an essential part of the system when we have a solar PV system and battery storage working on DC power but load, grid, and small-scale hydel are working on AC power. It converts AC to DC power to charge a battery and it supplies a path from DC bus to the AC load. Thus, the main role of the converter is the regulation of current in either direction.
3. Genetic Algorithm Based System Sizing
Optimization techniques have been widely used to select the optimal sizing of distributed generation systems. One of the biggest advantages of optimal computation is that under multiple generation sources, the optimization algorithm helps in finding the best numbers for sizing each source under a set of realistic bounds or constraints. In this research, the trigeneration sources concept is introduced for the grid-connected microgrid while having fixed hydro generation. It is obvious that under the built-in simulation software, solar could be the best source with fixed hydro in order to limit the grid resource which is elaborated in detail in scenario 4 of this research. On the contrary, reducing the solar will increase the grid operation which, again, is not feasible in terms of the environment as dependence on fossil fuel is increased which is elaborated in scenario 1 of this research. To optimally find the best values under the set of realistic constraints specified for the current case study, an objective function is defined. Later sections explain the problem formulation for the objective function and set of constraints.
3.1. Problem Formulation
Problem formulation includes objective function and constraints discussed below.
3.2. Objective Function
Capital cost minimization of the hybrid system with fixed hydro generation is one of the main goals of this research as the capital cost is directly associated with the system sizing. In other words, the lower the capital cost, the lower the sizing of the system. The objective function aim is to reduce the overall cost of all the resources, which is the cost minimization function Min (C
t). The cost minimization function includes solar PV system P
pv, battery storage P
bs, small-scale hydel generation P
hydel, and grid P
. The formula for evaluating the minimum power of the battery, grid, and solar PV has been discussed in the mathematical model of the power generation through these sources from Equations (7)–(10). Equation (11) elaborates all of the costs below. The cost of the solar PV, battery storage, and grid is aimed to be reduced while reducing the capacity of grid, solar PV, and battery storage. Equations (3)–(10) are used for evaluating the size of the different generations. However, while selecting each component sizing, a set of constraints are taken into consideration. The set constraints are given in the next section.
where C
t = Total cost of the hybrid system, C
pv = Solar PV cost, C
bs = Battery storage cost, C
hydel = Small-scale hydel cost, and C
g = Grid cost.
3.3. Constraints
For the realistic operation of the hybrid electrification systems, a set of constraints is discussed below.
3.3.1. Load Power Constraint
The load of the given area must be fed optimally while having the best possible energy mix. The constraint in Equation (12) shows that for any period t, load power P
.L. should be fulfilled by any combination of the resources:
To ensure the load operation at any instance of time, the load power consumption should not be less than the accumulated power produced by the PV, battery, hydel, and grid resources.
3.3.2. Battery Storage Constraint
The battery sizing is important due to the heavy capital and recurring cost involved. However, to ensure reliability, the battery power state of the charge should be kept above 40%. Forty percent of the battery will not only provide reliability but will also help to increase the life of the battery bank. For instance, <40% would reduce the battery bank size; on the other hand, >40% would certainly increase the battery sizing which will eventually increase the oversizing.
where P
bs SOC = Battery storage state of charge SOC.
3.3.3. Hydel Constraints
Hydel power used for optimization should be equal to the generated power from Renala Khurd power station. The maximum generation capacity of Renala Khurd Hydel power is 1100 kW. The hydro constraint is to keep the hydel no more than 1100 kW.
The amount of power purchased from the grid should be in the range of minimum power, i.e., the power that is taken as 30% of the total accumulated power required while the maximum power that can be purchased from the grid is 50% of the accumulated power. It is assumed that solar is available 90% of the year as it can be seen from
Figure 5 that the clearance index is more than 60% most of the year in the target location.
where P
g min is the minimum power purchased from the grid and P
g max is the maximum power purchased from the grid supply. Power purchased from the grid should be within the above-mentioned limits.
3.3.4. Bounds Constraint
To limit the battery storage at the higher end, the higher bound may not be more than the peak power. However, size of battery storage and the number of solar panels, and related constraints are discussed in Equation (16) below. The battery capacity should be less than the highest power required. Since the highest power is found from the load profile, the average maximum power achieved at a certain period over the years has been taken as maximum power. The same has been done to size the power of the battery bank.
where, M
bs = Battery bank capacity (0, N
bs), N
bs = Maximum number of battery, P
max = Maximum capacity of solar panel, and M
PV = system solar PV panel capacity.
4. Results and Discussions
The results of all four scenarios have been analyzed based on the NPC, COE, annual production from the grid, and percentage of the unmet load. The reliance on NPC and other discussed factors is directly influenced by the system sizing. Therefore, system sizing of each scenario is also discussed and linked with associated parameters such NPC, COE, annual production from the grid, and percentage of the unmet load.
4.1. Scenario 1: SSH and Grid
In scenario 1, grid and hydel power are analyzed. Scenario 1 is the actual scenario at Renala Khurd. The grid sizing that consumed several units to fulfill the load was kept infinite. The size of hydel power at Renala Khurd is 1.1 MW. The economic costs, such as capital, operation, and grid units purchased, can be found in
Table 4.
As per the simulation results, the NPC of the current system is $14,884,780, the COE of the system is 0.0771 $/kWh, and the percentage of grid utilization is 59.3%, whereas the unmet load is 0.0019%. It is observed from the scenario 1 results that the grid is being utilized most of the time to fulfill the demand load. In summer, the load shedding is at its peak in rural areas of Pakistan, since the grid is mostly used which in unable to fulfill the entire load. This is also validated from scenario 1 as the grid is being utilized for 60%.
4.2. Scenario 2: Grid and SPV
In the second scenario, we have simulated the most popular scenario in Pakistan where the grid is being used with solar PV as a hybrid resource. The inflation cost and discount rates are kept the same as scenario 1. The cost of solar PV can be referred from
Table 4. Hydel power has not been used in scenario 2 so as to assess the impact of sizing and project performance parameters in actual conditions without using hydel.
As per the simulation results, the NPC of the system is $19,409,410 which is higher than the NPC of scenario 1. The overall solar power sizing was 4.7 MW and grid utilization was 54.0% because the battery bank was considered and the power at night was fulfilled by the national grid. There was no unmet load in the system and COE was $0.0988 per kWh. It can be observed that, even after installing solar PV power, there is no significant impact in terms of grid utilization. Since the reliance on the grid was aimed to be reduced to avoid load shedding, HOMER Pro selected a huge system sizing for solar PV which is 4.7 MW. It was revealed that there was around 11% of excess electricity being produced. It can be concluded from scenario 2 that the system is a bit oversized which certainly impacts the NPC and payback period.
4.3. Scenario 3: SSH, SPV, BATT and Grid with GA
To avoid oversizing, an optimal sizing formulation was conducted using GA.
Table 5 below shows the optimal values achieved using the GA algorithm. The solar system was considered as 880 KW and the grid units to be purchased were found to be 1600 KWh. The hydel power was considered 1.1 MW already installed in Renala Khurd.
Using the search space option of HOMER, the optimal values of solar PV, grid, and battery storage obtained from the GA were used. The results show the NPC as 9,520,898
$ for scenario 3. On the other hand, grid utilization was reduced by 47.8%. However, the excess electricity was almost negligible at 0.028%, whereas the unmet load was increased to 3.31%. The economics for scenario 3 along with other scenarios are shown in
Table 6.
The sizing of solar PV in the scenario 3 along with the grid units was reduced significantly with no excess energy which shows proper utilization of grid and solar PV.
4.4. Scenario 4: SSH, SPV, BATT and Grid
Scenario 4 utilizes the same resources as used in the above-mentioned scenario 3. HOMER Pro software is utilized with size and cost optimization. Solar PV and grid size being utilized are kept unbounded.
The excess electricity for scenario 4 is 291,619 kWh per year. The unmet load is found to be 0%. The result shows that scenario 4 provides the least grid utilization percentage at 34.1%. The solar PV size was calculated at 2707 kW which is greater than scenario 3. The hydel system is already being installed at Renala Khurd with 1108 kW. The NPC for scenario 4 is 14,884,780, which is 17.1753% higher than the NPC of the scenario 3. Thus, scenario 4 provides higher NPC and solar sizing than scenario 3. However, the grid utilization is the least.
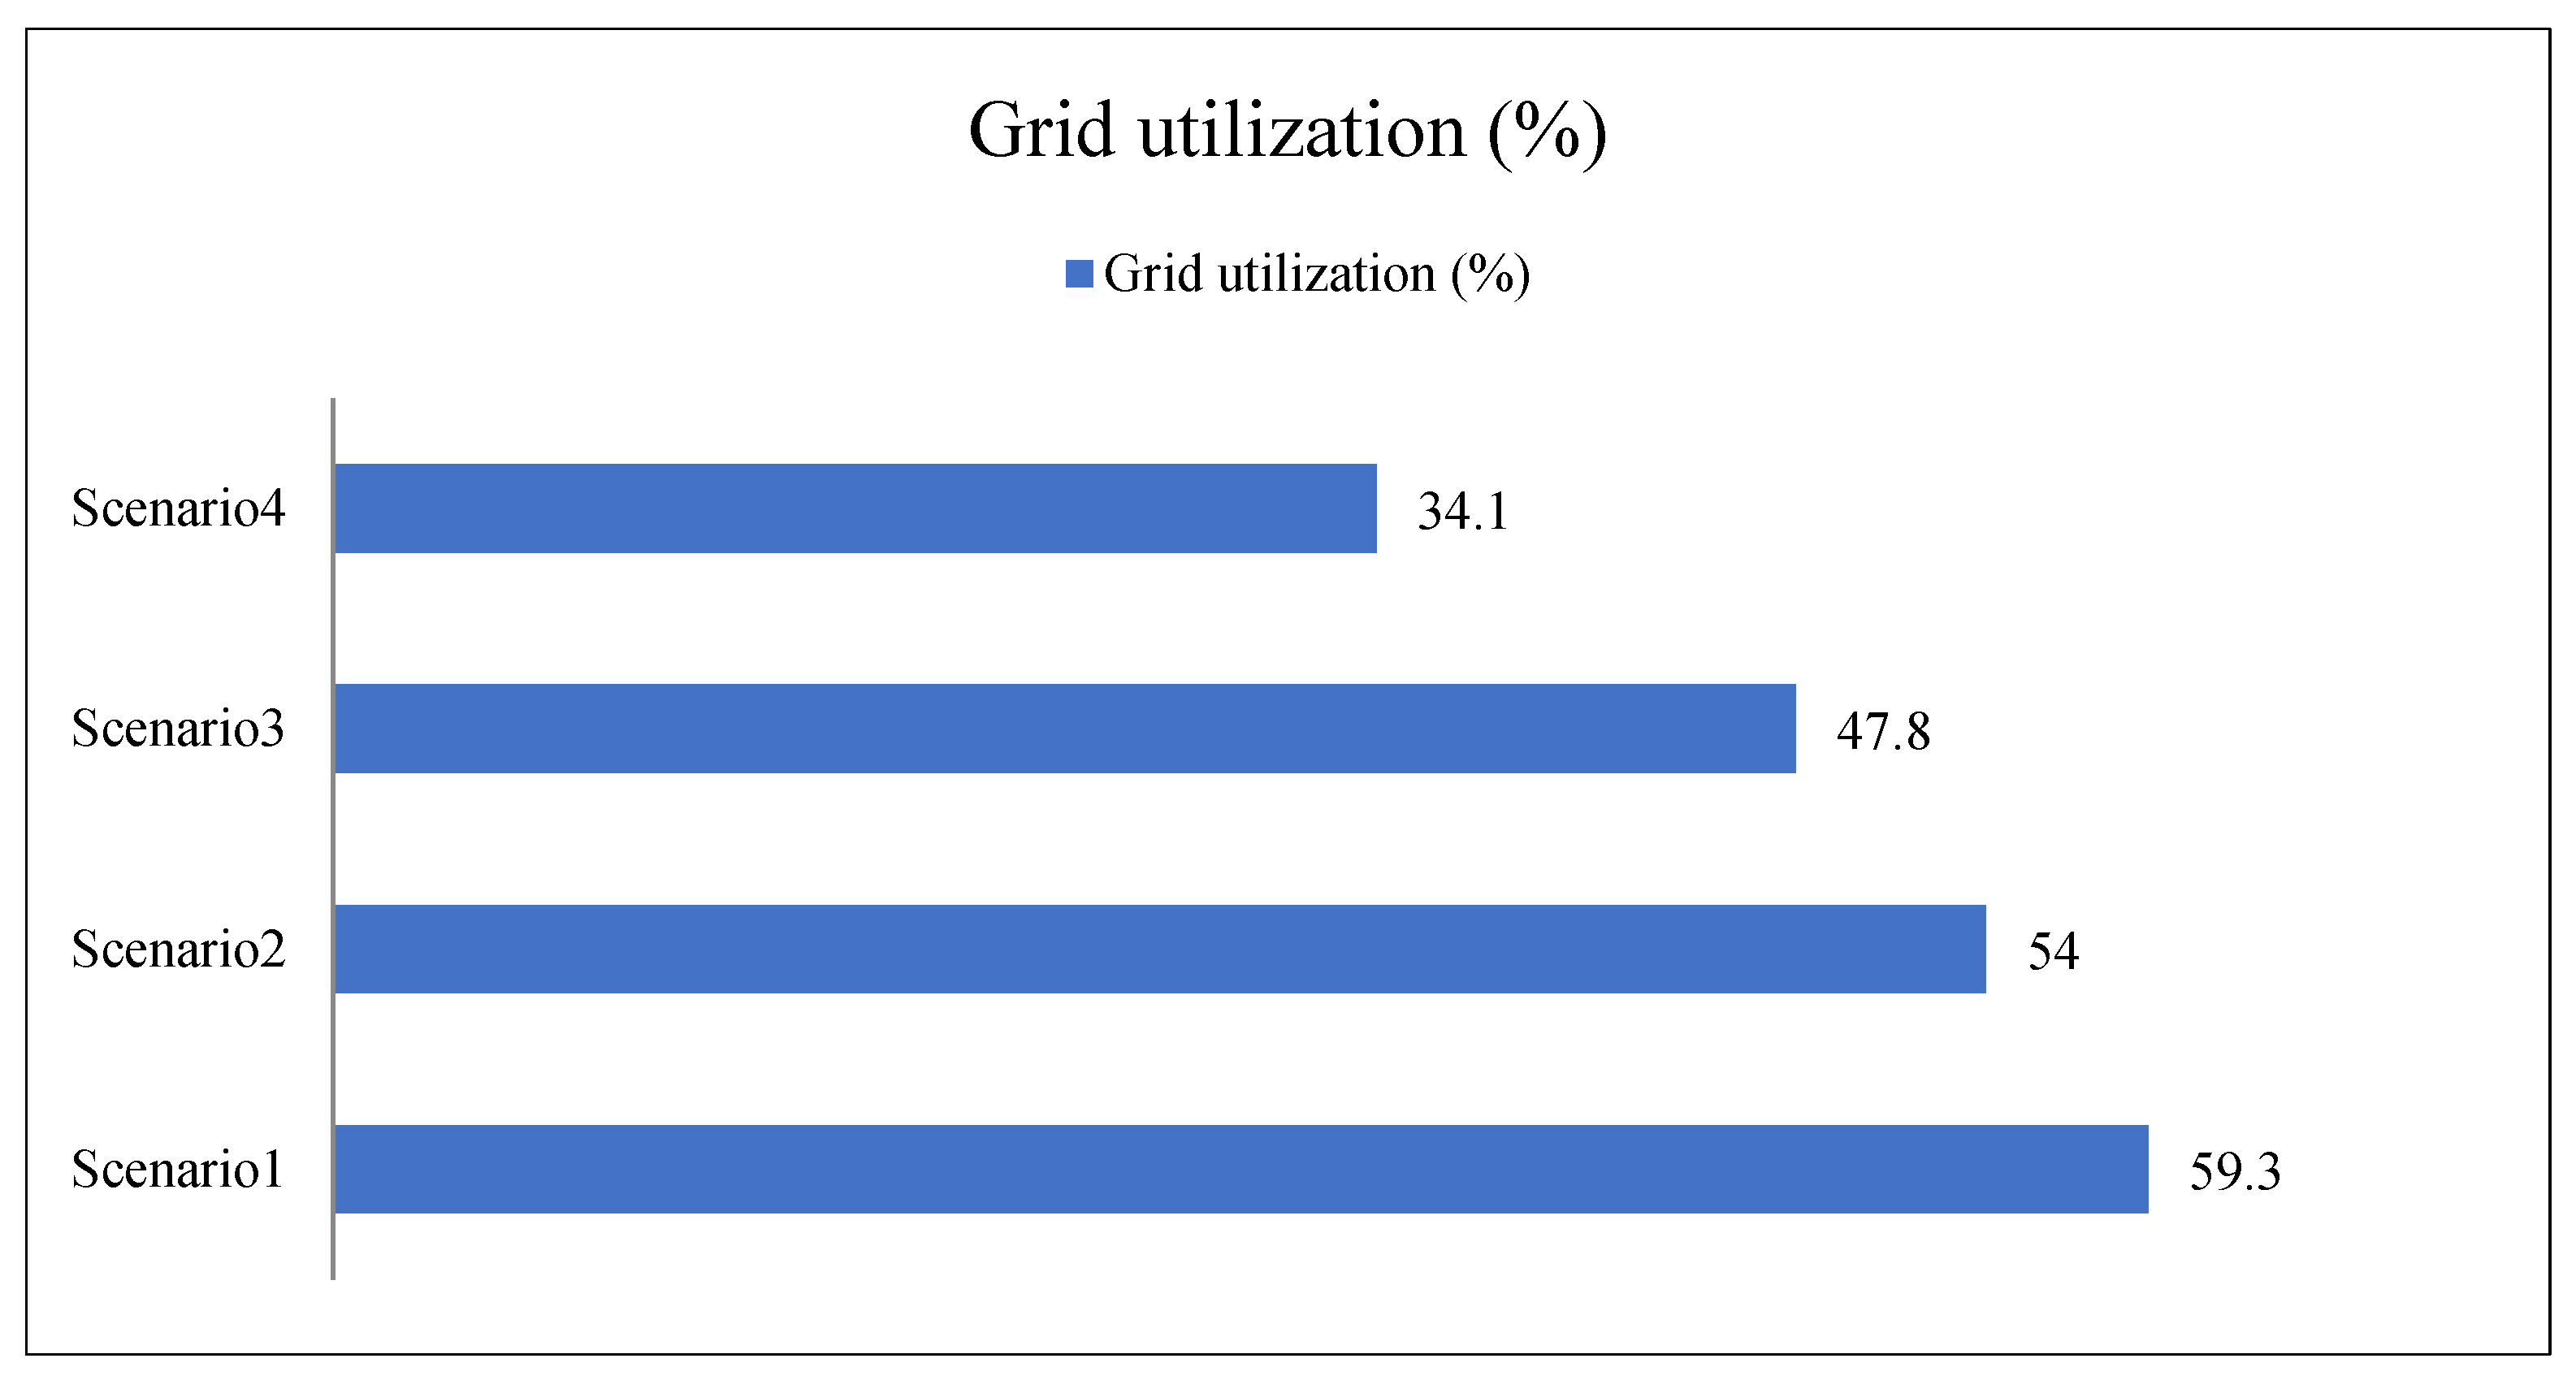
4.5. Grid Utilization
The grid utilization of all the scenarios is shown in
Figure 11. Scenario 2 has the least grid utilization and scenario 1 has the maximum grid utilization.
Figure 11 below shows a bar graph for grid utilization.
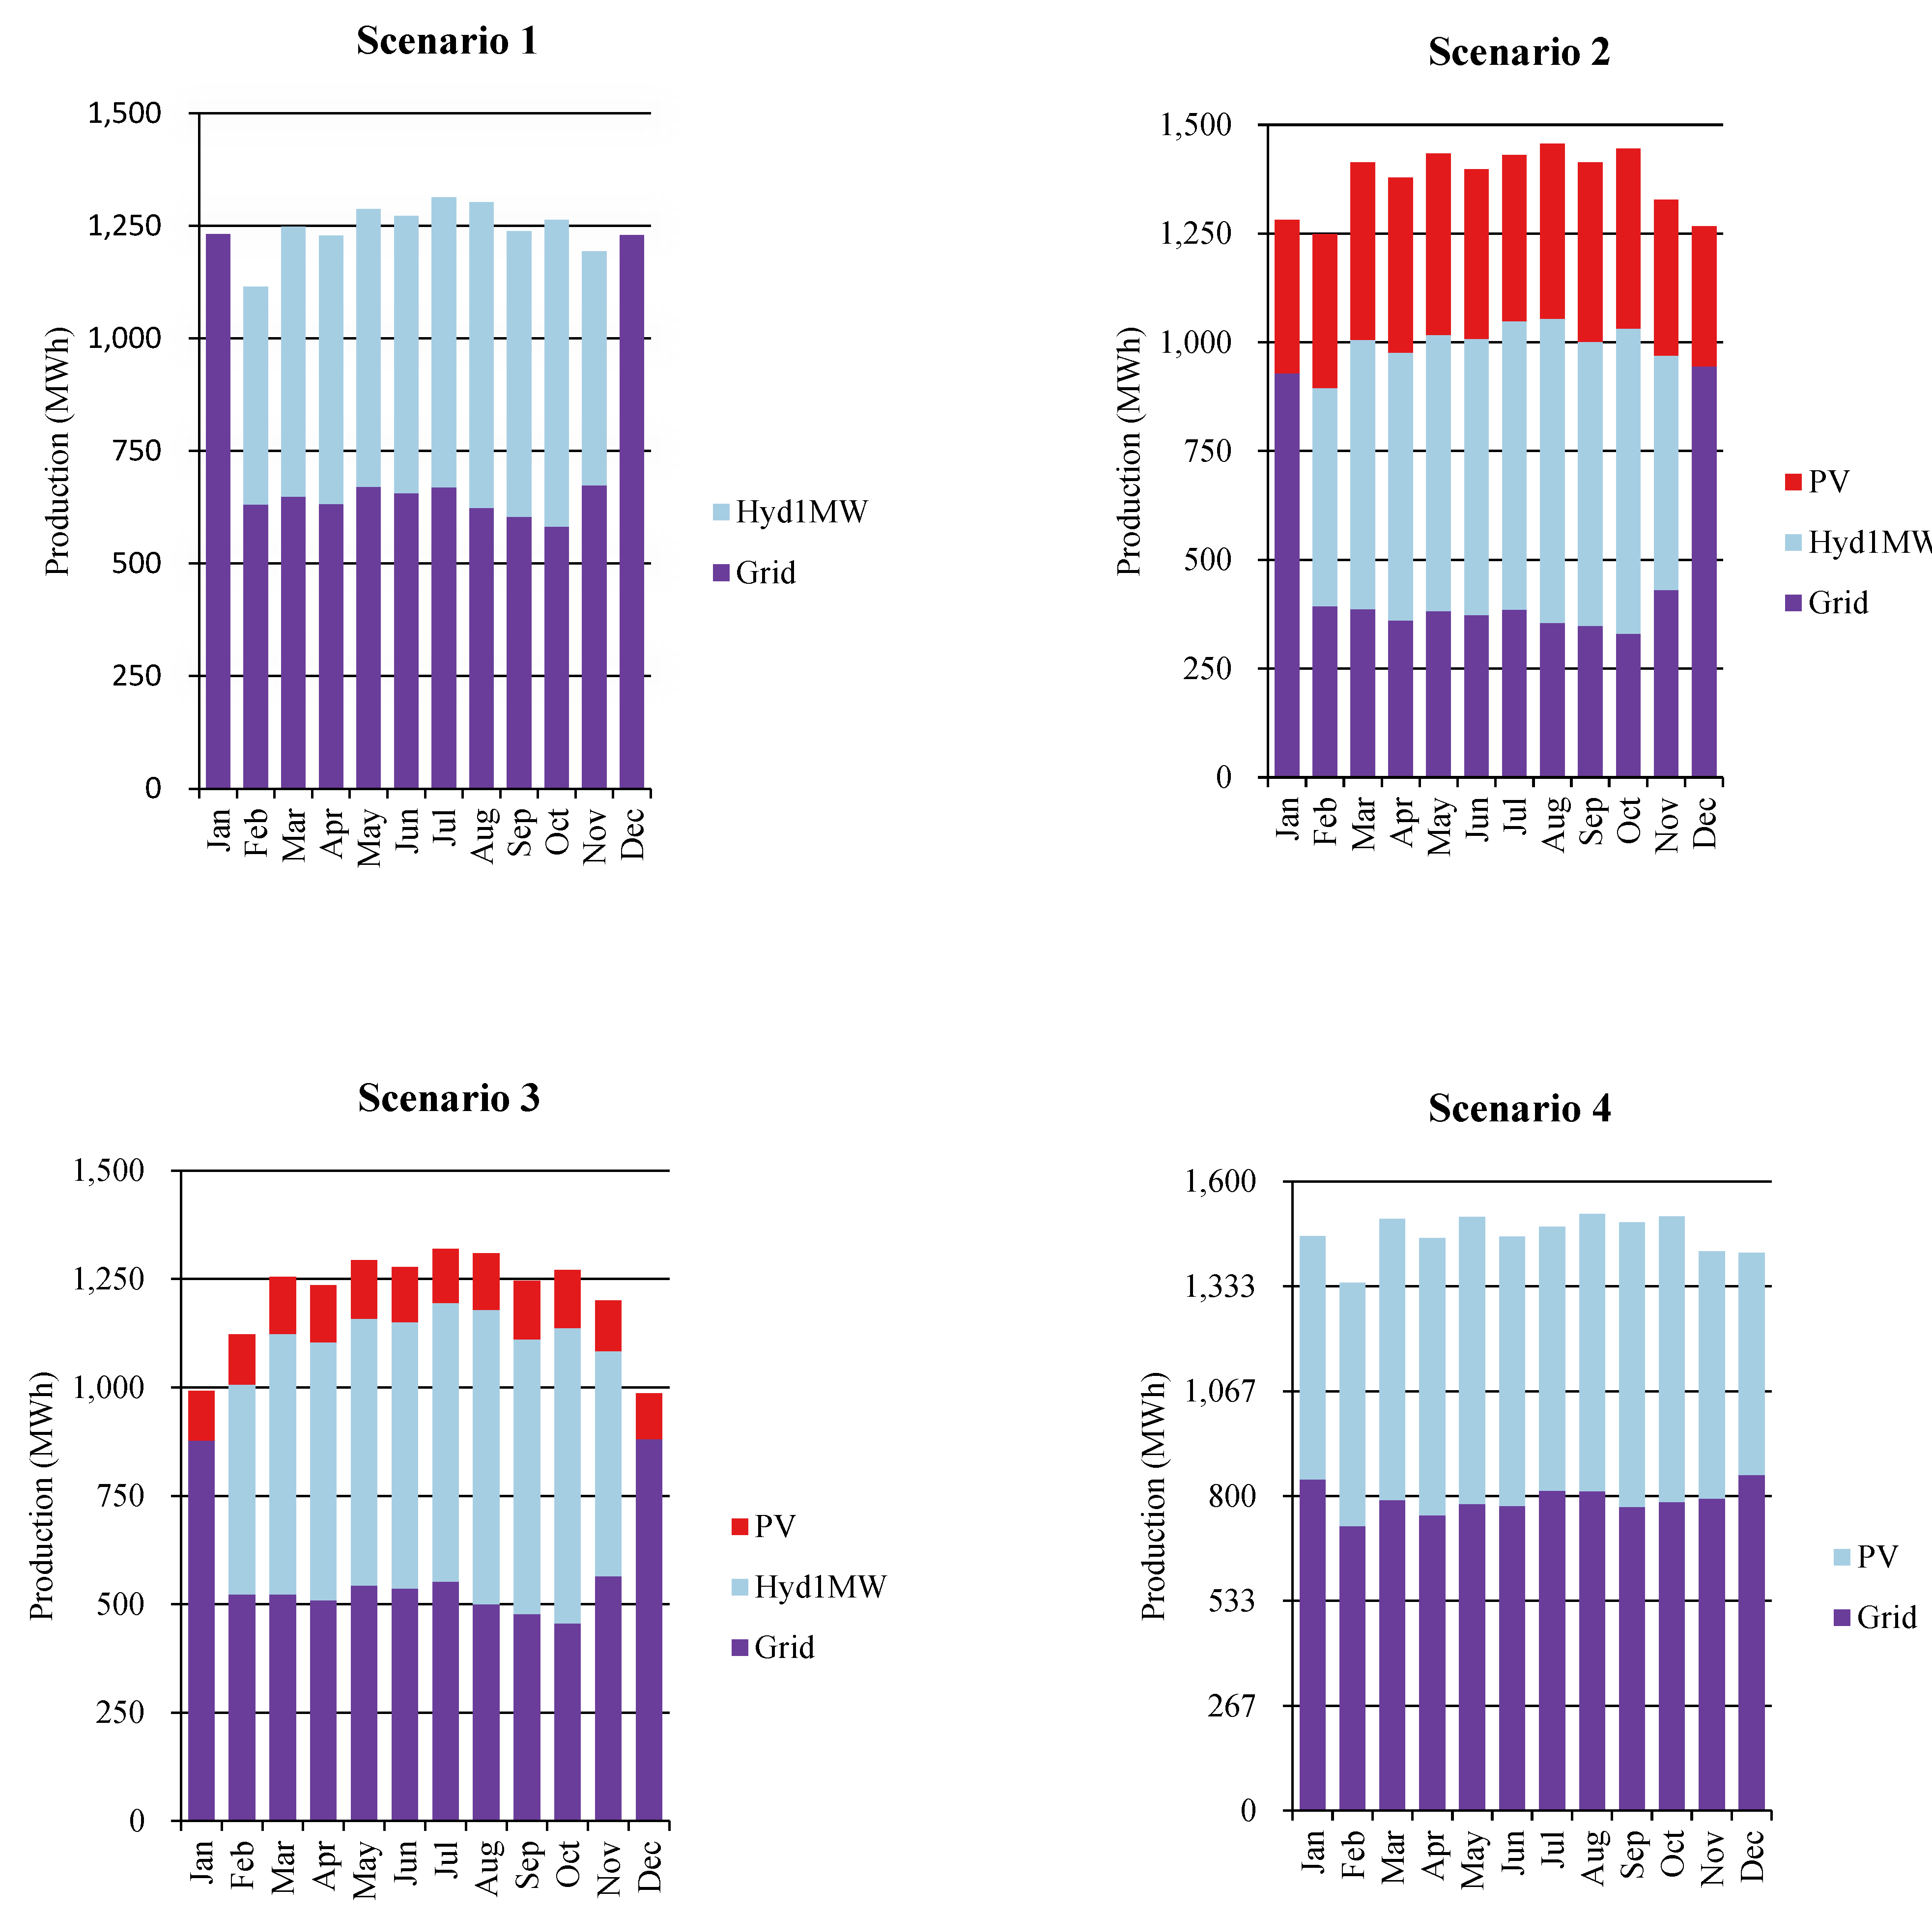
4.6. Annual Electricity Production
Figure 12 shows the electricity production of all four scenarios. It can be seen that scenario 1 has the highest grid consumption, followed by scenario 2 where the solar PV power and grid alone was used. Scenario 3 has the 3rd highest grid utilization as the GA was used to optimally reduce the sizing of the solar PV to 880 kW. The last production of power from the grid is found in scenario 4 because HOMER Pro sizes the solar PV unboundedly, causing higher NPC.
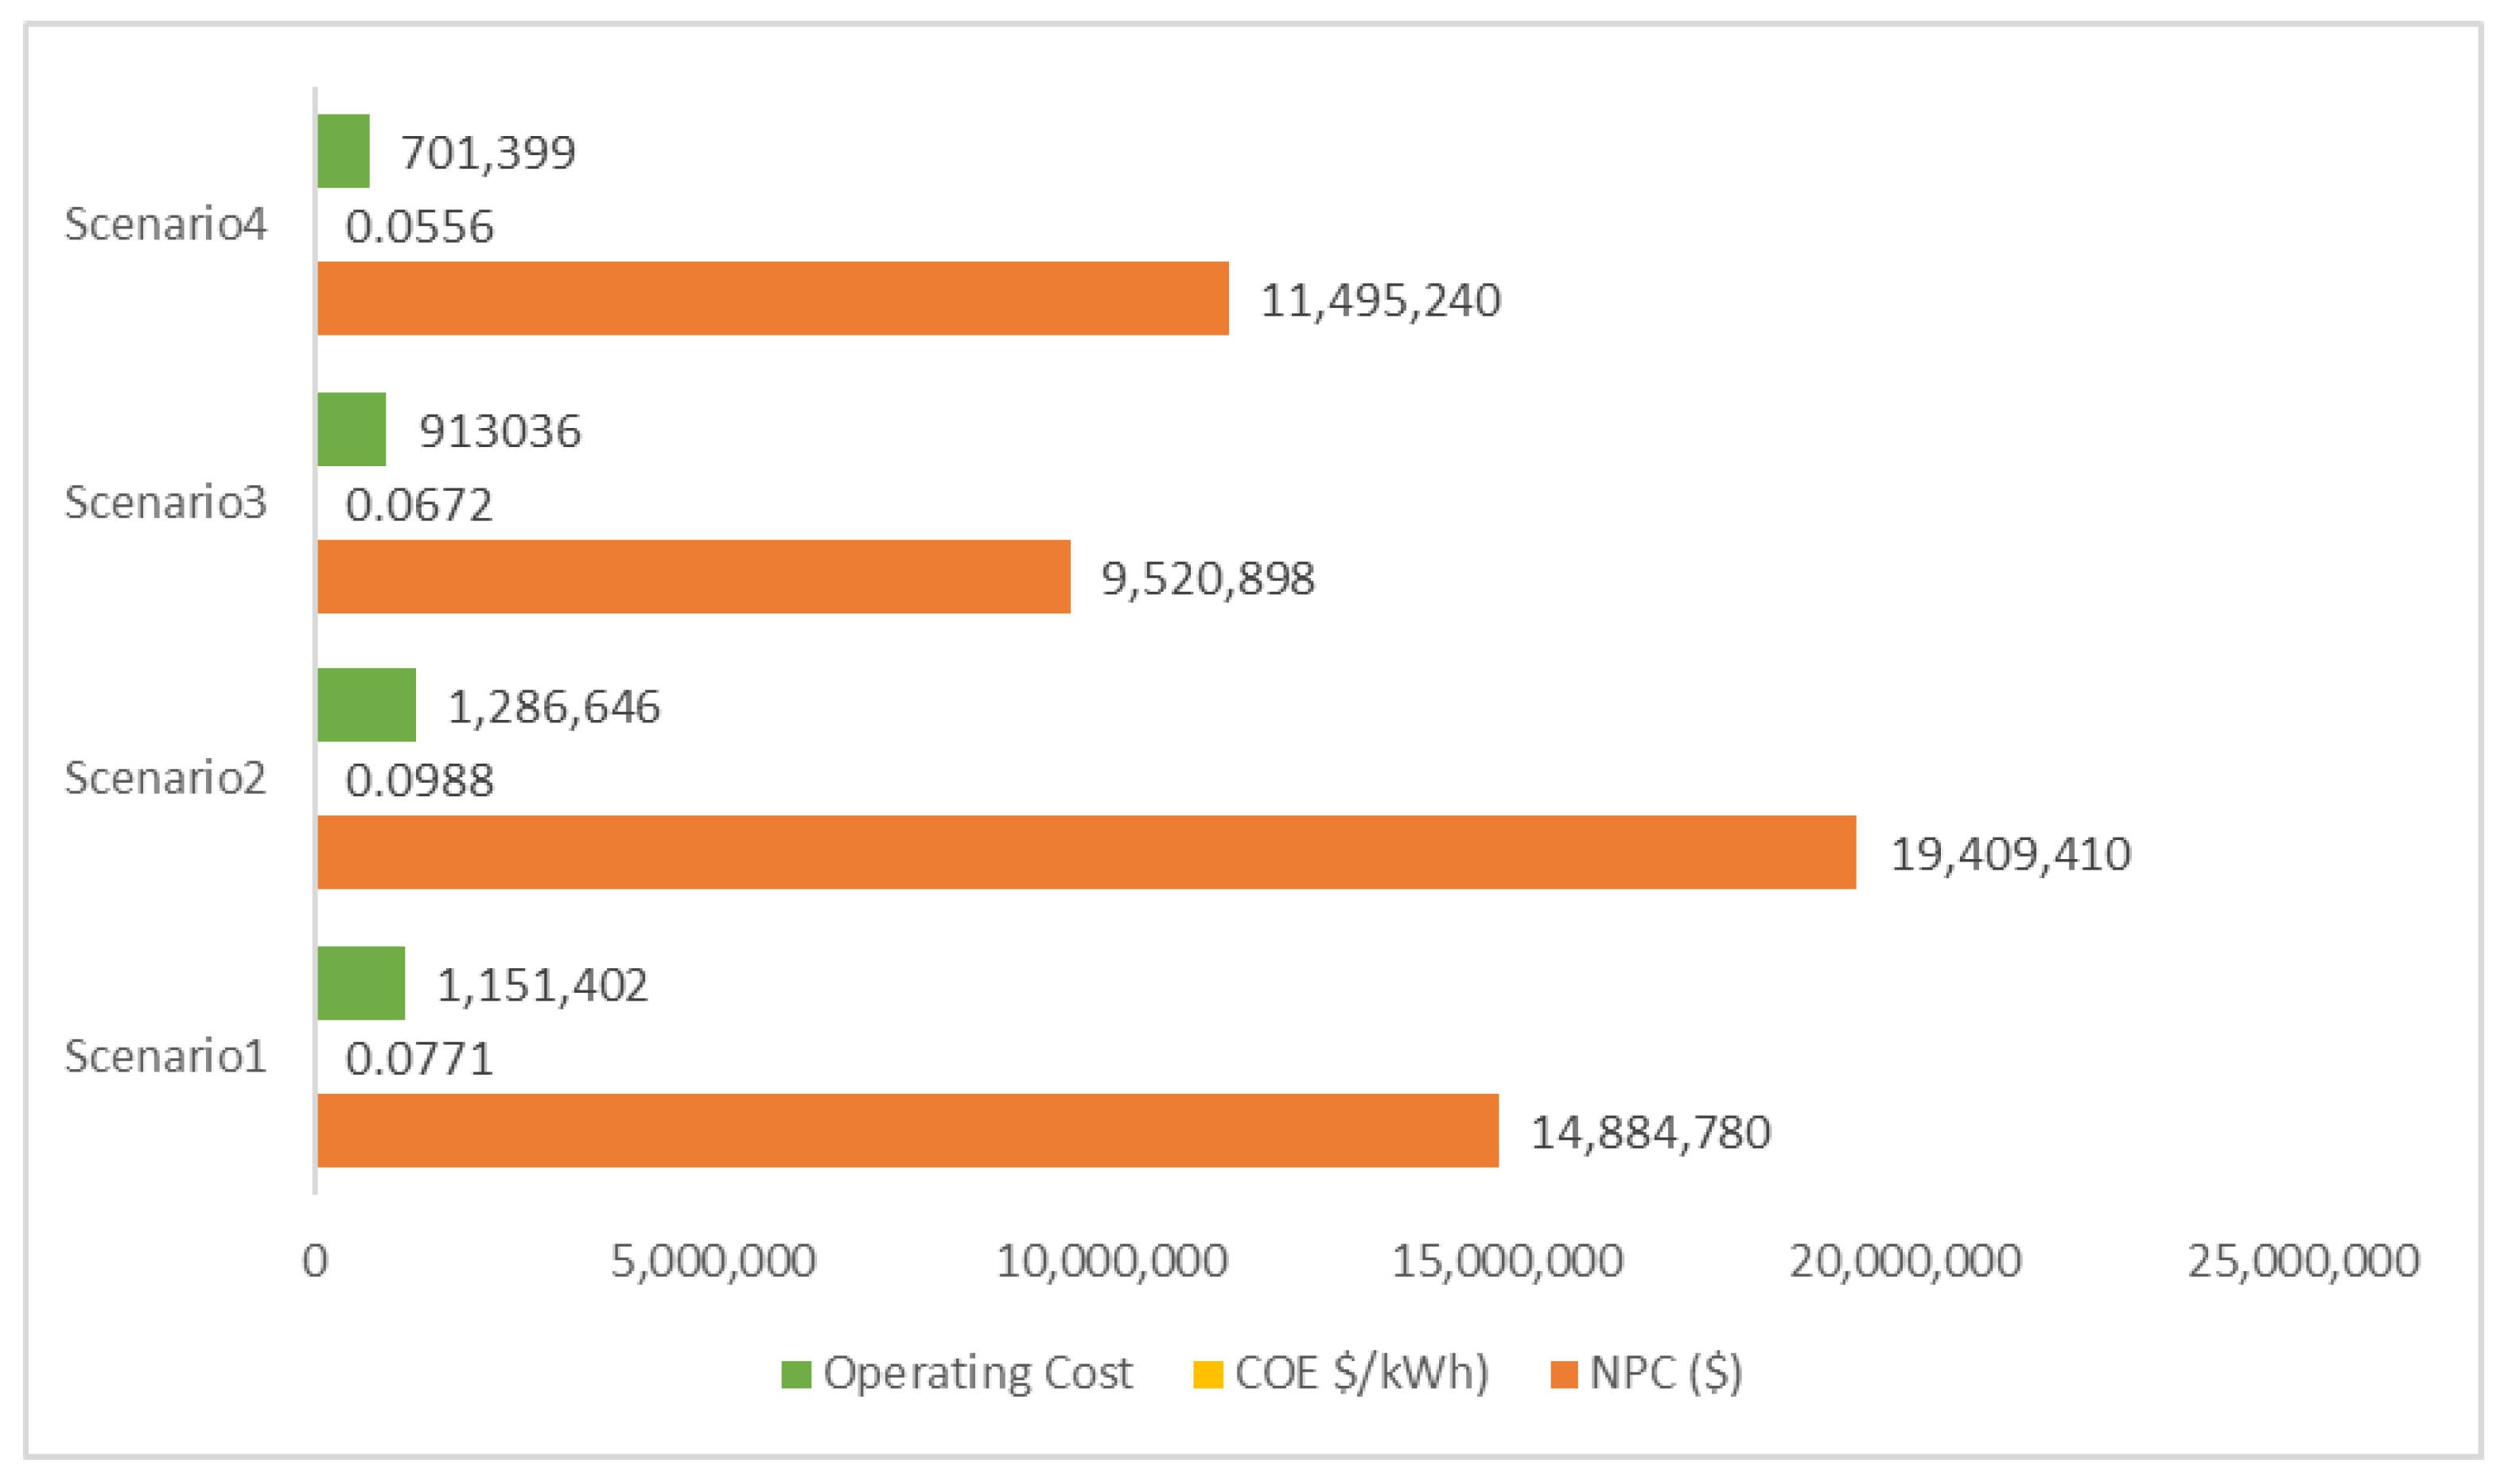
4.7. Economics Comparison
Figure 13 shows the economic comparison of all four scenarios. The lowest NPC and COE is for scenario 3 using the GA. The sizing was significantly reduced but the unmet load was slightly increased to 3% based on GA sizing, followed by scenario 4 where all the resource combinations were used. The NPC is higher because HOMER unboundedly sizes the solar PV. Scenario 1 has the second highest economic performance parameter values as it only used hydel with the grid where the grid is mostly fulfilling the needs. The highest economic performance parameters are for scenario 2, where only solar and grid have been used.
4.8. Environmental Comparison
Table 5 shows the environmental comparison of mitigation of the CO
2 while using production through renewable energy resources. The avoided emissions can be calculated as [
27]. The emission factor is taken as 389 tCO
2/GWh [
13].
where
is the mitigation of CO
2, is the annual electricity production through renewable energy, and
is the emission factor.
The CO2 mitigation was highest in scenario 4 as solar system installation is higher in this scenario. Whereas scenario 3 has the lowest mitigation of CO2. Scenario 2, on the other hand, has a total CO2 mitigation of 1,793,382,582.
4.9. Comparison with the Inclusion of Battery Bank
Table 7 shows the technical and economic comparison with the inclusion of a battery bank. The NPC is increased by 20.9% when compared to scenario 3 without a battery bank. On the other hand, the cost of energy is also increased from 0.067 kWh to 0.08 kWh whereas the annual production increased from 14,509,901 to 14,539,654 kwh/yr with the inclusion of the battery bank in scenario 3. In scenario 4, the excess electricity was increased from 291,619 kWh/yr to 1,965,962 kWh/yr which is 85% higher than the scenario 4 case. The difference in the NPC of scenario 4 with and without battery is lower because HOMER Pro optimization increases the grid utilization to reduce the sizing cost of the solar PV and battery bank. However, with scenario 4, the grid utilization is increased to 54% which, again, is not feasible during the non-availability of the grid during the daytime and load shedding hours.
5. Conclusions
This paper presents the simulation, modeling, and optimization of a hybrid system for electrifying areas near canals with huge potential for small-scale hydel power plants. The main objectives of the research study were to minimize the electrical burden on the grid, optimal size, and cost optimization. Four different scenarios were considered for optimization: Scenario 1: small-scale hydel (SSH) and grid; scenario 2: solar PV (SPV) and grid; scenario 3: SSH, SPV, battery storage and grid with genetic algorithm (GA) size optimization; scenario 4: SSH, SPV, battery storage and grid. It is revealed from the current study that different combinations of distributed generators have a significant impact on project performance parameters such as NPC, COE, operational cost, unmet load, excess generation, and percentage of grid share. The NPC of the 3rd scenario, related to the trigeneration combination with the genetic algorithm, was 36%, 50%, and 17% less than the 1st, 2nd, and 4th scenarios, respectively. Similarly, grid utilization was also reduced to 47% from 59.3%, which is the actual current scenario of the hydro–PV configuration of Renala Khurd. It was further investigated that mini-hydro or micro-hydro resources can be used as a supplementary resource in proper integration with solar PV and grid, which may significantly reduce the need for battery backups. The NPC increased from $9,520,898 to $ 12,038,950 in scenario 3 while adding batteries which is 20.91% higher. Furthermore, excess generation and percentage of grid share can be reduced by using the trigeneration configuration with optimal genetic algorithm sizing. However, the unmet load in scenario three was increased to 3% on account of less utilization of solar PV power. It is proposed that, in order to cater to the unmet load, load management schemes can be introduced with the genetic algorithm based on optimal sizing. In the future, the micro-hydro feasibility analysis can be conducted for islanded microgrids as well.


