Abstract
Due to the lack of grid power availability in rural areas, hybrid renewable energy sources are integrated with microgrids to distribute reliable power to remote locations. This optimal hybrid system is created using a solar photovoltaic system, wind turbine, diesel generator, battery storage system, converter, electrolyzer and hydrogen tank to provide uninterrupted power and meet different load demands of different communities in Doddipalli village, Chittoor, Andhra Pradesh, India. Optimization and techno-economic analysis are performed to design the proposed system using HOMER Software. Various configurations are obtained from the software among which the best four combinations are considered for case studies. This research article aims to design the optimal hybrid renewable energy system, wherein the design consists of PV/BS (1476 kW-solar PV, 417 batteries, electrolyser-200 kW, hydrogen tank-20 kg and 59.6 kW-converter) by comparing the minimum net present cost (NPC: $7.01 M), levelized cost of energy (LCOE: 0.244 $/kWh), and the high renewable fraction (RF: 84.1%). In this research, the proposed system would be more economical when solar energy becomes the primary source and is integrated with the battery. This research also presents a sensitivity analysis of the off-grid HRES system with various electrical load demands, project lifetime, and derating factors.
1. Introduction
Rural area development, especially in growing countries, such as India, is highly dependent on electricity. Nowadays, power is produced from conventional energy sources, such as fossil fuels, coal, etc. Day by day, power consumption is increasing due to the increasing demand; due to this, traditional sources are depleting. So, there is a need to produce power to meet the increasing demand. Hence, renewable energy sources are alternatives for this issue of generating power, and they are reliable, eco-friendly and free of cost.
Furthermore, distributing electricity to remote areas is critical for economic growth, job creation, poverty eradication and better living conditions. In remote areas, most people face problems regarding power outages, poor power quality and frequent power interruptions because the conventional power grid is far from the considered location. Because of the lower economic potential, utility grid expansion to remote rural regions is economically unfeasible and unattainable. Hence, power challenges in these regions may be resolved by implementing an off-grid HRES incorporating RES. In such cases, PV arrays, wind turbines, and diesel generators have typically been utilized to meet electrical load demands with cost-effective feasible and dependable power. This grid-independent HRES can supply economical and uninterrupted power to those living in remote areas. In addition, the standalone HRES designed in rural and urban regions may enhance power utilization and economic improvement and overcome challenges connected to finite fossil fuel reserves.
1.1. Related Work
There are two HRES systems based on their operation: grid-connected and grid-independent. The grid-independent HRES is the most dependable solution for remote rural areas to distribute uninterrupted power supply at the LCOE []. Simulation of these grid–independent and grid-connected microgrids is carried out using various software to validate their performance before being implemented practically in any location. Although different software is available in the literature, in the research, HOMER software is considered because it reduces the complexity in the design and performs techno-economical and sensitivity analysis of the HRES systems. So, a thorough investigation has been carried out on this area of research work that has already been executed using HOMER software to find the gaps to address them with recent advancements. Table 1 summarizes the relevant publications published in the last three years on constructing the HRES using HOMER software to design the optimum system for remote locations based on the availability of renewable sources.

Table 1.
Location-based HRES design using HOMER software.
In [], the authors reviewed the papers on the optimal operation of hybrid renewable sources, based on power generation for supplying power to remote areas, the factors influencing the HRES system and its energy management strategies. In [], the authors focused on four essential types of HRES systems, which are optimizing, sizing, energy management, controlling and analyzing the role of the off-grid HRES for rural electrification, for energy saving, feeding and decreasing the cost of energy.
The authors of [] reviewed the effects of various PV and wind turbine topologies, control techniques, and techno-economic parameters on hybrid system performance. These methodologies may help to enhance hybrid system design and control concerning practical system implementation in remote areas, such as Barwani, India. The best possible HRES configuration is PV/WT/BM/BS/DG regarding the TNPC and its LCOE. The authors proposed in [] a comprehensive feasibility analysis of an off-grid hybrid renewable energy system for electrifying agriculture and irrigation areas in Dongola, Sudan. A systematic and integrative approach, combined with techno-economic and optimization analysis, is given for adequate planning and design of HRES. The authors of [] demonstrated the techno-economic feasibility of an off-grid HRES for rural electrification through a case study of a village in West China by performing simulation, optimization, and sensitivity analysis. The results indicated that the PV/WT/BDG/BS combination would be the most cost-effective and reliable for the off-grid hybrid power system. The authors of [] investigated an economical hybrid solution for the best storage technology in the backward regions of Northern and Eastern India, while meeting the domestic and community load. In this context, the financial and technical aspects of a standalone hybrid renewable energy system are analyzed, while considering the environmental benefits of standalone PV/WT/DG/BS configurations, which lead to the optimized hybrid arrangement having LCOE, NPC, and RF values of 0.192 $/kWh, $1,23,851, and 93.3%, respectively. The authors of [] developed cost-effective and technically efficient sustainable energy. The research article investigates the techno-economic-environmental feasibility of PV and BM energy potential for a rural community in Sidhwanbet, Punjab, India. The proposed optimum HRES comprises a PV, BG, and BS that have been optimized. The best HRES was identified using NPC, LCOE, OC, and RF.
The primary purpose of the design of HRES is to provide continuous electrical power with high sustainability and a levelized cost of energy for that specific location by using RES. Firstly, optimum system construction and techno-economic analysis of several HRES systems for grid-independent mode are examined. Finally, sensitivity analysis is carried out with the parameters, such as project lifespan, electrical load demand and derating factor. In addition, the simulated HRES is separated and evaluated for the optimal system design based on economic factors, such as minimum NPC, LCOE, and RF.
1.2. Novelties of Proposed HRES Model
The following are the primary factors and the research objectives.
- To meet the energy demand of the specified rural region, it has been designing an optimal HRES system with the lowest Levelized cost of energy by utilizing PV, WT, DG, BS, Electrolyser, HTank and COV;
- Due to the additional components of the proposed optimal design, such as an electrolyzer and hydrogen tank, it can also be used for hydrogen load applications (example: automobiles).
1.3. Benefits of the Proposed HRES Model
The benefits of the suggested HRES model are listed below.
- The suggested model applies to both real-world and online HRES with non-linear systems. The proposed strategy has a comprehensive outcome, including optimum design;
- The proposed approach selects the most practicable HRES design by tackling the system’s points and issues. As a result, this approach meets the consumers’ requirement for financial benefits with quick performance;
- The suggested HRES is based on a thorough investigation that includes sensitivity analysis.
The remaining part of this research is organized into the following sections: Section 2 gives a detailed outline of the methodology, components, and cost details. Section 3 explains the considered location and its load details and elaborates on the availability of renewable resources at the site. Finally, Section 4 presents simulation results, a techno-economic analysis, a summary of all components, comparison economics, winning system architecture and sensitivity analysis. Finally, Section 5 deals with the conclusion of the work.
2. Methodology and Components Required
To design an ideal HRES system, a required and unified framework would be constructed depending on the renewable sources available in the selected location, financial risk, environmental regulations, and accessible RES supplies. The significant HRES construction and planning inputs must include a daily load demand profile that accounts for seasonal swings, onsite meteorological data, the specific location where optimal HRES should be implemented and the present power production capacity. The lowest-cost HRES system design among the various structures can be determined using HOMER software by conducting simulation, optimization and sensitivity analysis []. This simulation approach yields the NPC, LCOE, O&M, and operational expenses. In addition, HOMER software performed the techno-economic analysis after developing the optimal HRES system. Sensitivity analysis is carried out for the proposed system to identify the financial sustainability of the variability of system parameters. This research suggests future investments and statistics on system planning, system extension, and policy decisions.
2.1. Cost Analysis Information
The cost minimization function performs the techno-economic analysis of standalone hybrid renewable energy systems [,]. It is expressed as:
The total cost of the HRES system comprises “the total cost of the solar PV arrays, WT cost, DG cost, number of batteries cost, CON cost, TLC cost, electrolyzer cost, and hydrogen tank cost.” The TNPC and LCOE are determined by the total annualized cost of the system. This proposed system is primarily inspired by “the NPC and LCOE”. The TNPC method is used to rank different HRES designs that are obtained throughout the optimization process.
2.1.1. Net Present Cost
The TNPC is determined by using “the total annualized cost and the LCOE of the system”. Equation (2) [] gives TNPC as:
where “—total annualized cost ($/yrs), —annual real interest rate (%) (discount rate), Lproj—project lifespan (yrs), and —capital recovery factor with expressed as a % of the interest rate”.
2.1.2. Capital Recovery Factor
The is determined by the following Equation (3) []
where “ denotes the number of years, and indicates the annual interest rate (%), a drop in interest rates may reduce CRF, leading to an increase in NPC”.
2.1.3. Cost of Energy
The COE is described as “the average cost per kWh of useful electrical energy produced by the system” and determined by Equation (4) []:
where “ does the microgrid system serve the electrical energy (kWh), is the amount of power sold to the grid by the microgrid system (kW)”.
2.1.4. Renewable Energy Fraction
Renewable energy fraction () is “the fraction of the power produced from renewable sources and transferred to the system”. It is dimensionless and is denoted as fren and calculated by Equation (5) []:
where “ is the non-renewable electrical production (kWh/yr), is the non-renewable thermal production (kWh/yr), is the Total electrical load served (kWh/yr), is the Total thermal load served (kWh/yr)”.
2.2. Homer Software
It is used to design the optimal hybrid microgrid system according to the load profile available in the considered location. In this research, the primary procedure begins by evaluating the load profile of the selected area, followed by gathering the solar and wind potential. The system is then designed using several components. The economic criteria, as well as the component sizes, are incorporated. Finally, the optimization is carried out to evaluate the HRES model’s cost optimization []. The Figure 1 shows the Homer software procedure.
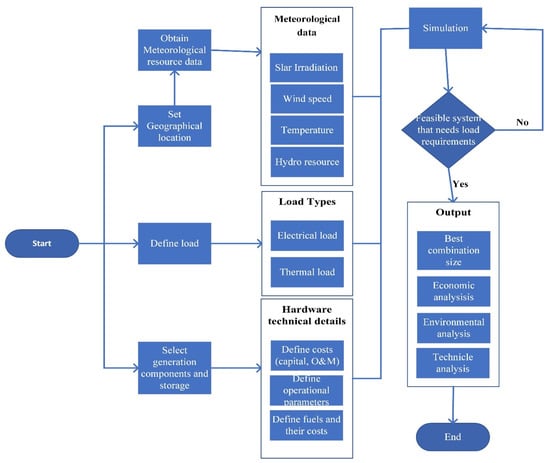
Figure 1.
Homer software procedure.
Benefits of Homer Software []
- ➢
- This software is the global standard for optimizing standalone and grid-connected power system designs for remote locations to supply reliable power;
- ➢
- Many technological possibilities, economic differences, and energy sources’ availability complicate these selections. On the other hand, HOMER’s optimization and sensitivity analysis make evaluating the different system configurations easier;
- ➢
- HOMER also presents simulation results in different tables and graphs, which aid in comparing setups and evaluating their economic and technological benefits. Export tables and charts for use in reports and presentations.
3. Proposed System Information
3.1. Site Details
The location investigated in this research article is Doddipalli village, Chittoor district, Andhra Pradesh, India, with a latitude and longitude of 13°02′04.83″ N 79°12′59.67″ E and a height of 305 m beyond sea level. By census data, approximately 5292 people live in 1309 homes, with 2–5 people in each house. The literacy rate is approximately equivalent to 68.2%. Agriculture is the primary activity of this community, with over 60–80 hectares of agricultural land surrounded by stone mining zones []. Even though grid energy is accessible in this area, it is insufficient to satisfy rising demand, particularly during summer. Consequently, an off-grid HRES system is necessary at this location to reach the growing demand and supply of continuous power.
3.2. Load Profile
3.2.1. Domestic, Commercial and Agricultural Loads
An onsite field survey has been carried out to get information on different loads of energy consumption, such as DL (lights, fans, TV, radio, and refrigerators), CL (oil and rice mills, mini business shops, and grilling stone motors), and AL (water pump motors) for 24 h to estimate the need of load demand. The survey of load data is given to the HOMER software as input. The scaled annual average is utilized in three definite sensitivity variables to the proposed system’s load condition (125%, 150%, and 175%). The HOMER software will discuss 8760 hourly total load measurements over the year (i.e., day-to-day changeability) using an hourly profile of the load and random irregularity factors. In this research, they have been treated 10% and 20%, respectively, with a time step size of 60 min. Table 2 summarizes the total load information that was gathered in that location and the load demand of that location is higher in the morning and evening. Finally, the load demand (kW) and loading process period (h) will be considered for calculating energy consumption. Finally, Equations (6) and (7) [] are used to compute the energy demand in kWh.

Table 2.
Complete Load details of the selected location.
The regular load profile is based on the average daily load of the Doddipalli village residence. Figure 2a depicts a detailed load profile for a domestic unit in the community for a year. This load consumption scenario assumes 1309 houses with normal load requirements in one rural community. DL describes all the electrical power employed in the area for domestic purposes (“lighting, cooking, mobile charging, etc.”). According to HOMER software, the peak and daily demand for DL were 77.67 kW and 536.32 kWh/day, respectively. The commercial load consists of the peak and daily load demand of 18.6 kW and 126.91 kWh/day, respectively. It is determined based on the quantity of energy used by different motors and other appliances in and around the considered location. For irrigation purposes, water pumping motors are regarded as agricultural loads (deferrable loads) depending on their peak load (11.25 kW) and their daily load (41.88 kWh/day).
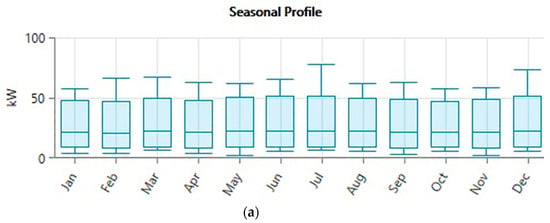
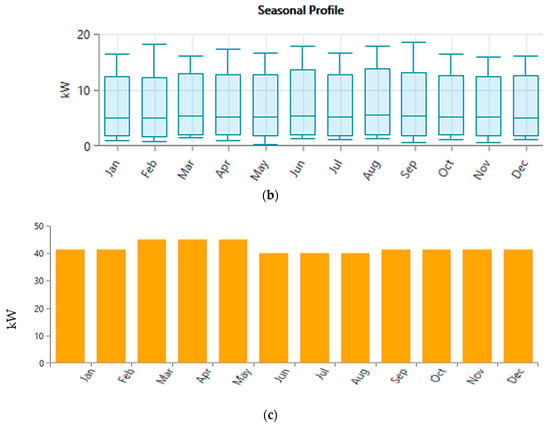
Figure 2.
(a): Yearly profile of domestic loads. (b): Yearly profile of commercial loads. (c): Yearly profile of agriculture loads.
When the load data was entered into HOMER software, it generated Figure 2a–c. These diagrams show monthly load profiles of commercial, domestic and agricultural loads. In addition, the HOMER’s random variability function may be used to produce these profiles. In addition, Figure 3 depicts the daily load profile of TEL for 24 h at the considered location.
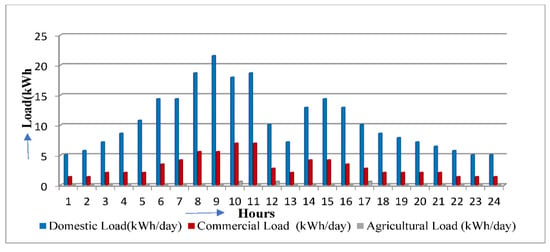
Figure 3.
Complete load profile graphical representation of the selected location.
3.2.2. Thermal Loads
The demand for thermal energy for room heating, industrial process heating, and hot water heating is denoted by TL. This load can be handled by the boiler, a waste heat recovery generator, or by extra electricity. These loads account for 5% of total electrical loads and data obtained from HOMER over 24 h. The annual average for this load is 126.9 kWh/d, with a scaled peak load of 18.6 kW and a load factor of 0.28. As a result, the primary purpose of including this load type in the HRES design is to explore the effect of excess energy feeding the TL into the system [].
3.3. Resources Estimation
In the present research considered, non-conventional energy sources are solar and wind. Hence, Solar radiation and wind speed are measured monthly and annually. The ideal scaling of an HRES is determined by many modelling elements, including technological, economic, and social consequences [].
3.3.1. Solar System
For designing off-grid HRES, this study primarily addresses RESs such energy as solar and wind systems. Solar radiation is available at the considered location for 10–12 h/per day during the summer but only 6–8 h per day during the winter. In addition, summer temperatures in the considered site exceed 48 degrees Celsius. NASA and NREL [] provide solar irradiance data for the considered location.
Figure 4 shows the specified location’s CI values (“Atmospheric clearness measurement and its range between 0 and 1”) and average monthly PV irradiance data. The value of CI changes between 0.633 (Feb) and 0.436 (July), with 0.5266 (annual average value).

Figure 4.
CI and average monthly solar radiation details for the selected location.
3.3.2. Wind Energy Source
According to the NASA database, the average monthly wind speed of the selected location for 30 years calculated at 50 m over the earth’s surface is 5.10 m/s. Figure 5 shows the average monthly wind speed information for the considered site. The roughness of the surface is 0.01 at this location [].

Figure 5.
Monthly average wind speed information for the selected location.
3.3.3. Temperature Details
According to NASA’s prediction of the global energy resource database for the next 30 years, the average monthly air temperature at the considered site is 26.37 °C. The average monthly air temperature was obtained from NASA for the selected location and is shown in Figure 6 [].

Figure 6.
Monthly average temperature data for the selected location.
3.4. Components and Description
The HRES architecture mainly contains PV arrays, wind turbines, battery storage systems, converters, DG, and load demand. The main benefit of constructing an HRES by combining more RESs is improving operational features, dependability, and overall potential. The design of the grid-independent HRES architecture is according to the availability of load data, the component’s technical specifications, component costs, and the availability of solar and wind energy at the specified location.
The simulation of the system operation is done by HOMER software using energy balance analysis of a specific period. It also calculates the energy flows of each off-grid HRES component. It determines the scheduling of different sources (solar, wind and DG) in the hybrid system during system operation. The HOMER software is responsible for scheduling battery charging and discharging. Other RESs may be integrated to create various configurations. The HOMER also determines the best design to satisfy the required load demands of the specified location under the given circumstances. The techno-economic analysis employed in this developed HRES was also performed, including capital cost, fuel cost, O&M cost, replacement cost, NPC, LCOE, and RF for all the components. For this research’s economic analysis, the project lifetime is 25 years, and an interest rate of 10% and an inflation rate of 3% are assumed.
3.5. Techno-Economical Details
3.5.1. Solar PV System Specifications
Among numerous RESs in India, solar energy is readily accessible for producing electricity in remote areas when limited grid power is available. The power generated by the PV module is proportional to the location’s SR quantity. The estimated yearly SR is expected as 5.13 kWh/m2/day. This research employed a solar Max 500RX PV array consisting of a monocrystalline PERC cell, including a dark-colored black sheet and frame, to design the HRES system. This PV module’s installation and capital costs are 3000 $/kW and $10 per module, respectively []. Dependent on the SR and the atmospheric temperature recorded, the performance of PV panels at every hour can be determined using the below-mentioned Equation (8) [].
where YPV—relevant capacity of the PV in kW, fPV is the derating factor of PV in %, GT is SR incident on PV in the present timeframe in kW/m2, GT,STC is incident radiation at STC in kW/m2, αp is the temperature coefficient of power considered as −0.5 in %/°C, TC is PV cell temperature in the present timeframe in %/°C and Tc,STC is the temperature of PV cell at STC, considered as 25 °C. This represents the energy outcome at STC (STC is the emission of 1 kW/m2, 25 °C—cell temperature).
Table 3 [,] contains the exact technical parameters of this PV module. For example, the PV array’s O&M costs may be approximately $10/kW/year, based on labor and shipping costs from the production facility. The most significant disadvantage of the PV system is that its salvage value is zero, and its replacement cost is equal to the installation cost. The derating factor of the solar panel is set to 0.96 (typically from 0.7 to 0.98) and the ground reflectance is set to 30%, then the system efficiency improves.

Table 3.
Description of components.
3.5.2. Wind Turbine Specifications
The wind turbine in this research has maximum power efficiency and a cut-in speed of (4–5) m/s. The technical and financial specifications of the Enercon E-53 (800 kW) low-speed wind turbine are shown in Table 3. This model’s capital, O&M costs are $1,028,115.00 and $77,314.25, respectively [].
The power produced by a WT system is evaluated at each time step. The wind speed of the turbine is determined using Equation (9) [].
where Speed of wind at the HH (m/s); —Speed of wind at anemometer height (m/s); : HH of the turbine (m); —Anemometer height (m); : Surface roughness length (m); —(..): Natural logarithm.
The WT output power attained at general conditions is determined using Equation (10) []
where —WT output power (kW); —WT output at standard temperature and pressure (kW); : Actual air density [kg/m3]; o: Air density at standard temperature and pressure (1.225 kg/m3).
The power generated by WT was calculated using Equation (11).
If > or , where —Rated power of windmill, —Wind speed at the considered site, and : Cut-in and a cutout of windspeed of a windmill, —Rated wind speed of a windmill.
3.5.3. Diesel Generator Specifications
When the power generation from RERs is reduced, a DG is employed as a backup device to generate energy and deliver it continuously to customers during maximum demand conditions. The Auto-sized Kohler DG proposed for the HRES design is selected from the HOMER Pro software, which automatically adjusts itself to match load requirements under all circumstances []. The technical and financial specifications of the diesel generator are shown in Table 3.
If the total electricity generated by non-conventional energy and storage cells is inadequate, DG is used as a unified power system to meet load needs. Equation (12) expresses that their power production determines the gas volume of diesel generators at every period [].
where —power produced by diesel generator (kW) at hourly (t), —Fuel consumption (Litre/hour), —rated power of the diesel generator produced hourly (t), a and b are coefficients (litter/kW).
3.5.4. Battery Specifications
A battery storage device is integrated as a backup device to ensure uninterrupted and reliable functioning of the off-grid HRES system under power mismatch situations. The total cost and technical specifications of the battery utilized in the off-grid HRES construction are provided in Table 3. The battery’s storage bank life is given by Equation (13) [].
where —Storage float life (year); —storage bank life (year); —No. of batteries in the storage bank; —Lifetime storage throughput (kWh); —Annual storage throughput (kWh/yr).
3.5.5. Converter Specifications
A generic converter used by HOMER software in this work for designing an off-grid HRES system can convert the total power produced by RESs. Table 3 shows the converter type, pricing and technical specifications []. The converter cost depends on its type, capacity, and size. This work estimates a 15-year lifetime for inverter and rectifier inputs with relative capabilities and efficiencies of 100% and 95%, respectively and is given by the Equation (14) [].
where —Output power from/to a converter, and —Input power from/to converter.
3.5.6. Boiler Specifications
A boiler is connected to the HRES system, a backup heat source that supplies the appropriate thermal load whenever needed. The boiler becomes essential when a TL is connected to the HRES system. The TLC enables massive power generation to integrate loads into the thermal bus. A basic TLC of 1 kW was selected from HOMER software and the software’s cost data consists of capital, replacement, and O&M costs of $200 per 1 kW, $200 and $20/yr, respectively, for each converter with a lifespan of 20 years. This work estimates a 15-year lifetime for inverter and rectifier inputs with relative capacities and efficiencies of 100% and 95%, respectively.
3.5.7. System Economics
The nominal discount rate HRES is between 8% and 10%, with an anticipated inflation rate of 2%. In this hybrid system, the yearly capacity shortfall is estimated to fluctuate between 0% and 10%. In this study, the project lifespan of HRES design is assumed to be between 15 and 25 years. The operational reserve is determined to be 10% of the hourly load demand, 80% of the PV system, and 70% of wind energy generation. The minimum renewable energy component is taken as 40%.
3.6. Other Constraints
In this study, the following limitations are considered while doing the analysis: The maximum yearly storage capacity is 10%, the minimum RF is 60%, the load in current time steps is 10%, the annual full load is 5%, the output power of PV system is 80%, and the wind turbine output power is 75%.
3.7. Sensitivity Variables
Sensitivity analysis is performed by taking into account multiple values for a specific input variable, allowing for the monitoring of the impacts of certain input variables included in the design of the techno-economic analysis. Different values are assigned to these variables within a specific range to examine their effect on the optimized system. This paper uses sensitivity analysis to define the optimum value of a particular variable used in developing the best HRES system. Hence, throughout the optimization process, this research will offer clear information on how the economic and technical outcomes changed based on alternative input assumption values, assisting in designing a proper HRES system for the considered location.
Therefore, the project lifetime evaluated throughout this research design and simulation phase is 25 years. This change in project lifespan will help to determine whether the optimized HRES system is more cost-efficient. The sensitivity analysis is carried out for several input factors, such as project duration (25 and 30) years, yearly average load demand (125%, 150%, and 175%), and derating factors (0.86 and 0.96).
4. Simulation Results and Discussions
In the present work, the three main tasks are done using HOMER software to achieve different HRES topologies: simulation, optimization, and sensitivity analysis. The economic parameter outcomes derived from the optimization method, minimum NPC, LCOE, and RF, were used to rank and choose the optimal off-grid HRES design. In addition, a techno-economic analysis of a standalone HRES system, including sensitivity parameters, is also done to find the optimal system for the considered location.
Figure 7 depicts the design of the standalone HRES system using HOMER software. The HOMER simulation results depend on component’s input parameters, available potential, load demand, cost and other constraints. In addition, it generates a considerable number of HRES systems that are appropriate and effective for meeting the load requirements at the considered location.
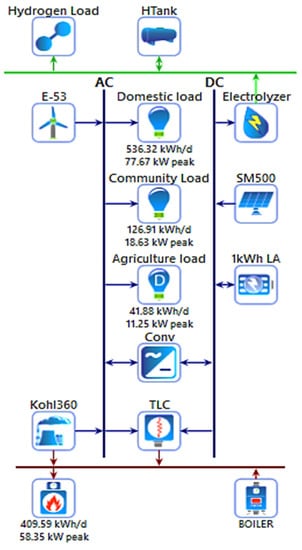
Figure 7.
HOMER design of the hybrid microgrid model.
4.1. Techno Details of the Proposed HRES System
The information about the technical analysis of energy sources and components used in the HRES design is given in Table 4.

Table 4.
Technical details of energy sources and components.
Figure 8 depicts the simulation results of various HRES for the selected location, and the top consequence gives the optimal HRES. The different HRES system designs comparison is based on minimum NPC, LCOE, and RF. The total NPC of a system is “the present value of all the costs acquired over its lifespan minus the current value of all the revenue it earns over its lifespan”. The costs include capital costs, replacement costs for waste disposal, operation with maintenance costs, and fuel costs.

Figure 8.
The optimization results of a hybrid standalone microgrid model.
The summary of system economics alone is given in Figure 8. The simulation results show the overall NPC of the PV/BS system is $7.01 M, and the operating cost is $138,346, which is less than the total NPC of all other potential system combinations. Therefore, it is concluded that the HRES comprising PV/BS system is the best optimal design for the selected location. Hence, further analysis of this optimal system is carried out to affirm its optimality.
4.1.1. Cost Summary of HRES
Table 5 gives the NPC of the optimal system obtained from simulation, which consists of solar max 500RX PV arrays of capacity 1476 kW, generic 1 kWh lead acid-12V battery of 417 numbers, generic boiler, generic electrolyzer, generic large free converters of 59.6 kW capacity, hydrogen tank, and TLC of 500 kW. This HRES system has the minimum NPC and LCOE values at $7.01 M and $2.34/kWh, respectively.

Table 5.
The total NPC and annualized costs of HRES.
From the above, it can be concluded that the NPC is the minimum for the optimal standalone HRES design for the selected location. However, it is also important to note that the yearly expenditures for the components of this optimal HRES are expected to be $590,902.04.
4.1.2. Electric Summary of HRES
Table 6 summarizes the simulation results for HRES’s power production, utilization, and excess and unmet loads. This table shows the total annual generation of standalone HRES, energy consumption, and excess and unmet loads.

Table 6.
Summary of generation, consumption, excess, and unmet power from the optimal HRES.
4.2. Sensitivity Analysis
Sensitivity analysis monitors the impact of specific factors on the proposed system. This work considers three sensitivity variables: scaled annual average electrical load, project lifetime, and derating factor, as shown in Table 7.

Table 7.
Sensitivity analysis.
The HOMER design diagrams are given in Figure 9 for different sensitivity parameters, and the outcomes are shown in Table 8 and Table 9 for the top four optimized systems that are obtained from HOMER i.e., (Figure 10 and Figure 11)
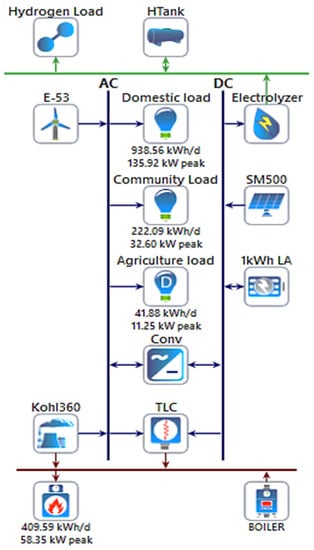
Figure 9.
Different HRES configurations for sensitivity analysis.

Table 8.
Project Lifetime = 25 yrs.

Table 9.
Project Lifetime = 30 yrs.
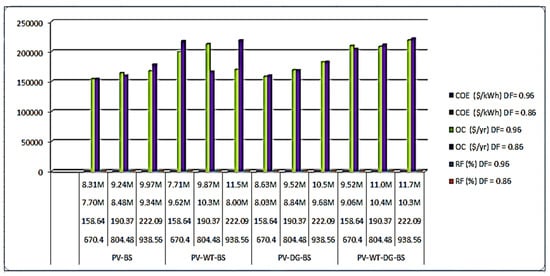
Figure 10.
Graphical representation of Table 7a.
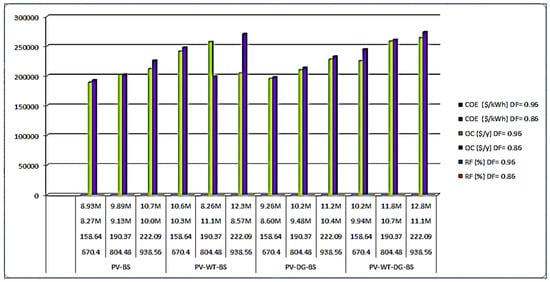
Figure 11.
Graphical representation of Table 7b.
- (1)
- PV-BS;
- (2)
- PV-WT-BS;
- (3)
- PV-DG-BS;
- (4)
- PV-WT-DG-BS.
From Table 7 and Table 8, it is clear that as the derating factor of PV is decreased, the NPC and LCOE increase at a higher rate, while there is much less change in the total OC. Hence, the running cost of renewables is much less. In contrast, the capital cost is much higher, increasing as the derating value decreases. However, the LCOE remains the same even when the project lifetime increases. At the same time, there is a significant increase in the operating cost. In addition, it is observed that as the load increases, LCOE decreases. From all perspectives, it is observed that PV/BS system was selected as the optimal design by techno-economic analysis compared to PV/WT/BS, PV/DG/BS, and PV/WT/DG/BS designs. Although, it proved to be the best system for sensitivity analysis. Hence, it is observed that this optimal system may be well suited for the selected location with a hybrid system consisting of solar PV arrays of the capacity of 1476 kW, a generic 1 kWh lead acid-12 V battery of 417 numbers, a generic boiler, a generic electrolyzer of 200 kW, generic large free converters of 59.6 kW capacity, hydrogen tank of 20 kg, and generic TLC of 500 kW. This design can be recommended to improve the community’s well-being in the considered area.
4.3. Comparison of Proposed Work Design with Other Models in the Literature
More HRES designs are produced by different RES, such as PV/WT/DG/HTank/Electrolyser/BS/COV, using the HOMER software for rural electrification in the considered location. The results show that the PV/BS system is the optimal HRES with minimum NPC-$7.01 M, LCOE-0.244 $/kWh, and high RF-84.1%. Hence, these standalone HRES configurations can be considered winning system architecture configurations. The comparative analysis of the existing and proposed models is represented in Table 10.

Table 10.
Comparison of existing models and proposed designed standalone HRES model.
Therefore, compared to other research works published in [,,], the proposed HRES model was optimally feasible for the LCOE of 0.244 $/kWh. If the LCOE of all systems is equal, then the optimal design is decided by RF.
5. Conclusions
This research gave an optimal off-grid HRES design and a detailed techno-economic analysis with various configurations for the rural community loads in Doddipalli village, Andhra Pradesh, India. This analysis found that the hybrid PV/BS configuration is the optimal design among the other configurations that meet the requirement of electrical demand in the considered location at a reduced energy cost. Furthermore, sensitivity analysis of the various structures was carried out to validate the effectiveness of the optimal system even under other design constraints, such as change in a project lifetime and derating factor of PV array at different % of loads.
The winning system architecture obtained from HOMER software is PV/BS of minimum NPC-$7.01 M, Levelized COE-0.244 $/kWh and RF-84.1%. It consists of 1476 kW Solar PV arrays, 417 batteries (12 V), and 59.6 kW of power converters.
Hence, this optimal HRES configuration can provide a reliable power supply to consumers with zero percentage of unmet loads.
Author Contributions
Conceptualization, V.P.; Methodology, V.P.; Formal analysis, C.A.N.; Investigation, C.A.N.; Writing—original draft, C.A.N.; Writing—review & editing, V.P. All authors have read and agreed to the published version of the manuscript.
Funding
This research received no external funding.
Institutional Review Board Statement
Not applicable.
Informed Consent Statement
Not applicable.
Data Availability Statement
Not applicable.
Acknowledgments
The authors are highly grateful to the Chancellor, Vice-chanceller of Vellore Institute of Technology, Vellore for providing the VIT seed grant and excellent infrastructure facilities and encouragement that have made this research work possible.
Conflicts of Interest
The authors declare no conflict of interest.
Nomenclature
| Symbols | |
| Ah | Ampere hour |
| a & b | Coefficients |
| CRF(j,N) | Capital recovery factor with j expressed as a percentage of the interest rate |
| DNPC | Total net present cost ($) |
| Dann,total | Total annualized cost ($/yr) |
| Els | Electrical energy served by the microgrid system (kWh) |
| Egrid | The amount of power sold to the grid by the microgrid system (W) |
| Enon-ren | Non-renewable electrical production (kWh) |
| Ereserved | Total electrical load served (W) |
| Fcons | Fuel consumption ($/L) |
| FDG_r | Rated power at the DG (W) |
| fPV | Derating factor of PV |
| Fren | Renewable energy fraction |
| GT | Solar radiation incident on (kWh/m2/day) |
| GT,STC | Incident radiation at STC (kWh/m2/day) |
| Hnon-ren | Non-renewable thermal production |
| Hserved | Total thermal load served (kW) |
| h | Loading process period (duration) |
| j | Annual real interest rate (%) |
| kW | kilo Watt |
| kWh | kilo Watt hour |
| ln | Natural logarithm |
| L | Liter |
| LProj | Project lifespan (yrs) |
| h | Hours |
| M | Million |
| MJ/kg | Mega joule/kilogram |
| m | Meter |
| mAh | Milli ampere-hour |
| MW | Megawatt |
| m/s | Meter per second |
| N | No. of years |
| Nbatte | No. of batteries in a storage bank |
| PDG | Power production by DG (kW) |
| PWTG | WT output power (kW) |
| PWTG,STP | WT output at STP (kW) |
| Pwt | WT output power (kW) |
| Pr | Rated power of the windmill (kW) |
| Pinput | Input power (kW) |
| Poutput | Output power (kW) |
| Qlifetime | Lifetime storage throughput (kWh) |
| Qthrpt | Annual storage throughput (kWh) |
| Rbatte,f | Storage float life (yrs) |
| Rbatte | Storage back life (yrs) |
| Rs. | Rupees |
| t | Time |
| TC | PV cell temperature (°C) |
| TC,STC | Temperature of PV cell at STC |
| Uanem | Speed of the wind at the anemometer height (m/s) |
| Uhum | Speed of the wind at HH (m/s) |
| V | Volts |
| v | wind speed (m/s) |
| Vr | Rated wind speed of the windmill (m/s) |
| Vcut-in | Cut-in wind speed of a windmill (m/s) |
| Vcut-out | Cut-out wind speed of a windmill (m/s) |
| WT | Wind turbine |
| YPV | Relevant capacity of PV (kW) |
| yr | Year |
| Zhum | HH of the turbine (m) |
| Zanem | Anemometer height (m) |
| Zo | Surface roughness length (m) |
| αp | Temperature co-efficient of power |
| ηcnv | Converter efficiency |
| $ | Dollar |
| $/L | Dollar/Liter |
| $/kW | Dollar/kilo Watt |
| % | Percentage |
| ρ | Actual air density |
| ρo | Air density at STP |
| Abbreviations | |
| AC | Alternating Current |
| AL | Agricultural Loads |
| A.P. | Andhra Pradesh |
| ASR | Annual Solar Radiation |
| AWS | Annual wind speed |
| BG | Bio-Gas |
| BGDG | Bio-Gas Diesel Generator |
| BLR | Boiler |
| BM | Bio-Mass |
| BS | Battery Storage |
| CEF | Content at the end of year |
| CI | Clearness index |
| CL | Commercial Loads |
| LCOE | Levelized Cost of Energy |
| CON | Converter |
| CRF | Capital recovery factor |
| DC | Direct current |
| DFP | Diesel Fuel Price |
| DL | Domestic Loads |
| DG | Diesel generator |
| D CON | Dedicated converter |
| DL | Domestic Load |
| E-53 | Enercon-53 |
| ESC | Energy storage capacity |
| FC | Fuel Cell |
| PV | Photo Voltaic |
| LCOE | Lowest Cost of Energy |
| Lio-Ion | Lithium Ion |
| HFC | Hydrogen Fuel Cell |
| HH | Height of the hub |
| HOMER | Hybrid optimization of multiple energy resources |
| HSC | Hydrogen storage capacity |
| NASA | National aeronautics and space Administration |
| NE | North-East |
| NG | Nitrogen gas |
| HRES | Hybrid renewable energy systems |
| NPC | Net Present Cost |
| NREL | National renewable energy Laboratory |
| OC | Operating cost |
| O&M | Operation and maintenance |
| PCM | Phase change materials |
| PERC | Passivated Emitter and Rear Cell |
| PLT | Project lifetime |
| PV | Photovoltaic |
| RC | Replacement cost |
| RES | Renewable energy sources |
| RF | Renewable energy fraction |
| TL | Thermal loads |
| SC | Specific consumption |
| SR | Solar radiation |
| STC | Standard test conditions |
| STP | Standard temperature and pressure |
| TLC | Thermal load controller |
| TNPC | Total net present cost |
| TV | Television |
| TEL | Total electrical loads |
| TES | Thermal energy storage system |
| UK | United Kingdom |
References
- Ahmad, J.; Imran, M.; Khalid, A.; Iqbal, W.; Ashraf, S.R.; Adnan, M.; Ali, S.F.; Khokhar, K.S. Techno economic analysis of a wind-photovoltaic-biomass hybrid renewable energy system for rural electrification: A case study of Kallar Kahar. Energy 2018, 148, 208–234. [Google Scholar] [CrossRef]
- Pujari, H.K.; Rudramoorthy, M. Optimal design, pre-feasibility techno-economic and sensitivity analysis of off-grid hybrid renewable energy system. Int. J. Sustain. Energy 2022, 41, 1466–1498. [Google Scholar] [CrossRef]
- Hassan, Q.; Jaszczur, M.; Hafedh, S.A.; Abbas, M.K.; Abdulateef, A.M.; Hasan, A.; Mohamad, A. Optimizing a microgrid photovoltaic-fuel cell energy system at the highest renewable fraction. Int. J. Hydrogen Energy 2022, 47, 13710–13731. [Google Scholar] [CrossRef]
- Krishnamoorthy, M.; Periyanayagam, A.D.V.R. Optimum Design and Techno-Economic Analysis of Hybrid Renewable Energy System for Rural Electrification-A Case Study. In Proceedings of the 2019 IEEE 1st International Conference on Energy, Systems and Information Processing (ICESIP), Chennai, India, 4–6 July 2019; IEEE: Piscataway, NJ, USA, 2019; pp. 1–7. [Google Scholar]
- Pujari, H.K.; Rudramoorthy, M. Optimal design and techno-economic analysis of a hybrid grid-independent renewable energy system for a rural community. Int. Trans. Electr. Energy Syst. 2021, 31, e13007. [Google Scholar] [CrossRef]
- Sawle, Y.; Jain, S.; Babu, S.; Nair, A.R.; Khan, B. Prefeasibility economic and sensitivity assessment of hybrid renewable energy system. IEEE Access 2021, 9, 28260–28271. [Google Scholar] [CrossRef]
- Pal, P.; Mukherjee, V. Off-grid solar photovoltaic/hydrogen fuel cell system for renewable energy generation: An investigation based on techno-economic feasibility assessment for the application of end-user load demand in North-East India. Renew. Sustain. Energy Rev. 2021, 149, 111421. [Google Scholar] [CrossRef]
- Aziz, A.S.; Tajuddin, M.F.N.; Adzman, M.R.; Mohammed, M.F.; Ramli, M.A. Feasibility analysis of grid-connected and islanded operation of a solar PV microgrid system: A case study of Iraq. Energy 2019, 191, 116591. [Google Scholar] [CrossRef]
- Sahu, P.K.; Jena, S.; Sahoo, U. Techno-Economic Analysis of Hybrid Renewable Energy System with Energy Storage for Rural Electrification. Hybrid Renew. Energy Syst. 2021, 63–96. [Google Scholar] [CrossRef]
- Li, C. Technical and economic potential evaluation of an off-grid hybrid wind-fuel cell-battery energy system in Xining, China. Int. J. Green Energy 2021, 18, 258–270. [Google Scholar] [CrossRef]
- Kiliç, G.A.; Al, K.; Dağtekin, E.; Ünver, Ü. Technical, Economic and Environmental Investigation of Grid-Independent Hybrid Energy Systems Applicability: A Case Study. Energy Sources Part A Recovery Util. Environ. Eff. 2020, 1–16. [Google Scholar] [CrossRef]
- Miao, C.; Teng, K.; Wang, Y.; Jiang, L. Techno-economic analysis on a hybrid power system for the UK household using renewable energy: A case study. Energies 2020, 13, 3231. [Google Scholar] [CrossRef]
- Li, J.; Liu, P.; Li, Z. Optimal design and techno-economic analysis of a solar-wind-biomass off-grid hybrid power system for remote rural electrification: A case study of west China. Energy 2020, 208, 118387. [Google Scholar] [CrossRef]
- Odou, O.D.T.; Bhandari, R.; Adamou, R. Hybrid off-grid renewable power system for sustainable rural electrification in Benin. Renew. Energy 2020, 145, 1266–1279. [Google Scholar] [CrossRef]
- Jeyasudha, S.; Krishnamoorthy, M.; Saisandeep, M.; Balasubramanian, K.; Srinivasan, S.; Thaniaknti, S.B. Techno-economic performance analysis of hybrid renewable electrification system for remote villages of India. Int. Trans. Electr. Energy Syst. 2021, 31, 151–166. [Google Scholar]
- Mokhtara, C.; Negrou, B.; Bouferrouk, A.; Yao, Y.; Settou, N.; Ramadan, M. Integrated supply–demand energy management for the optimal design of off-grid hybrid renewable energy systems for residential electrification in arid climates. Energy Convers. Manag. 2020, 221, 113192. [Google Scholar] [CrossRef]
- Baseer, M.A.; Alqahtani, A.; Rehman, S. Techno-economic Design and Evaluation of Hybrid Energy Systems for Residential Communities: Case Study of Jubail Industrial City. J. Clean. Prod. 2019, 237, 117806. [Google Scholar] [CrossRef]
- Pandiyan, P.; Sitharthan, R.; Saravanan, S.; Prabaharan, N.; Tiwari, M.R.; Chinnadurai, T.; Yuvaraj, T.; Devabalaji, K. A comprehensive review of the prospects for rural electrification using stand-alone and hybrid energy technologies. Sustain. Energy Technol. Assess. 2022, 52, 102155. [Google Scholar] [CrossRef]
- Muh, E.; Tabet, F. Comparative analysis of hybrid renewable energy systems for off-grid applications in Southern Cameroons. Renew. Energy 2019, 135, 41–54. [Google Scholar] [CrossRef]
- Ammari, C.; Belatrache, D.; Touhami, B.; Makhloufi, S. Sizing, optimization, control and energy management of hybrid renewable energy system—A review. Energy Built Environ. 2022, 3, 399–411. [Google Scholar] [CrossRef]
- Sawle, Y.; Gupta, S.C.; Bohre, A.K. Review of hybrid renewable energy systems with comparative analysis of off-grid hybrid system. Renew. Sustain. Energy Rev. 2018, 81, 2217–2235. [Google Scholar] [CrossRef]
- Elkadeem, M.R.; Wang, S.; Sharshir, S.W.; Atia, E.G. Feasibility analysis and techno-economic design of grid-isolated hybrid renewable energy system for electrification of agriculture and irrigation area: A case study in Dongola, Sudan. Energy Convers. Manag. 2019, 196, 1453–1478. [Google Scholar] [CrossRef]
- Khan, F.A.; Pal, N.; Saeed, S.H.; Yadav, A. Techno-economic and feasibility assessment of standalone solar Photovoltaic/Wind hybrid energy system for various storage techniques and different rural locations in India. Energy Convers. Manag. 2022, 270, 116217. [Google Scholar] [CrossRef]
- Kumar, R.; Channi, H.K. A PV-Biomass off-grid hybrid renewable energy system (HRES) for rural electrification: Design, optimization and techno-economic-environmental analysis. J. Clean. Prod. 2022, 349, 131347. [Google Scholar] [CrossRef]
- Abdul-Wahab, S.; Mujezinovic, K.; Al-Mahruqi, A.M. Optimal design and evaluation of a hybrid energy system for off-grid remote areas. Energy Sources Part A RecoveryUtil. Environ. Eff. 2022, 44, 4964–4976. [Google Scholar] [CrossRef]
- Vishnupriyan, J.; Manoharan, P.S. Prospects of hybrid photovoltaic /diesel standalone system for six different climate locations in the Indian state of Tamil Nadu. J. Clean. Prod. 2018, 185, 309–321. [Google Scholar] [CrossRef]
- Almashakbeh, A.S.; Arfoa, A.A.; Hrayshat, E.S. Techno-economic evaluation of an off-grid hybrid PV-wind-diesel-battery system with various scenarios of the system’s renewable energy fraction. Energy Sources Part A Recovery Util. Environ. Eff. 2019, 1–24. [Google Scholar] [CrossRef]
- Lilienthal, P. Autosize Genset Diesel Generator, Homer Pro Software User Manual. HOMER® Pro Version 3.7 User Manual; August 2016. Available online: https://www.homerenergy.com/products/pro/docs/latest/index.html (accessed on 14 May 2022).
- Lilienthal, P. How HOMER calculates PV Output Power, Wind Turbine Power and Battery Output, Energy Charge Output, Total Net Present Cost, Cost of Energy and Break-Even Grid Extension Distance, Homer Help File 2016. HOMER® Pro Version 3.7 User Manual; August 2016. Available online: http://homerenergy.com/ (accessed on 14 May 2022).
- Doddipalle Population—Chittoor, Andhra Pradesh. Available online: https://www.census2011.co.in/data/village/596060-doddipalle-andhra-pradesh.html (accessed on 14 May 2022).
- Esan, A.B.; Agbetuyi, A.F.; Oghorada, O.; Ogbeide, K.; Awelewa, A.A.; Afolabi, A.E. Reliability assessments of an islanded hybrid PV-diesel-battery system for a typical rural community in Nigeria. Heliyon 2019, 5, e01632. [Google Scholar] [CrossRef]
- He, L.; Zhang, S.; Chen, Y.; Ren, L.; Li, J. The techno-economic potential of a renewable energy-based microgrid system for a sustainable large-scale residential community in Beijing, China. Renew. Sustain. Energy Rev. 2018, 93, 631–641. [Google Scholar] [CrossRef]
- Small Wind Electric Systems–NREL. Available online: https://www.nrel.gov/docs/fy09osti/35818.pdf (accessed on 24 June 2022).
- NASA, Surface Meteorology and Solar Energy. Available online: https://eosweb.larc.nasa.gov (accessed on 24 June 2020).
- NREL, National Renewable Energy Laboratory. Available online: http://www.nrel.Gov (accessed on 24 June 2022).
- Kolhe, M.; Ranaweera, K.M.I.U.; Gunawardana, A.G.B.S. Techno-economic optimum sizing of the hybrid renewable energy system, Industrial Electronics Society. In Proceedings of the IECON 2013-39th Annual Conference of the IEEE Industrial Electronics Society, Vienna, Austria, 10–13 November 2013; pp. 1898–1903. [Google Scholar]
- Gakkhar, N. Benchmark Cost for “Grid Connected Rooftop and Small Solar Power Plants Programme” for the Year 2017–18. 2017, p. 2. Available online: https://www.jjpvsolar.com/benchmark-cost-for-grid-connected-rooftop-2017-18/ (accessed on 11 October 2018).
- Havells Solar Panel, Inverter, Battery And Solar System Price. Available online: https://kenbrooksolar.com/price-list/havells-solar-panels-inverter-price-list-in-india (accessed on 16 July 2022).
- Kohler Generators Specifications. Available online: https://www.indiamart.com/proddetail/kohler-generators-19529517512.html (accessed on 16 July 2022).
- Discover Innovative Battery Solutions. Available online: https://discoverbattery.com/?utm_term=discover%20battery&utm_campaign=Branded&utm_source=adwords&utm_medium=ppc&hsa_acc=1744226009&hsa_cam=15281686722&hsa_grp=129522918453&hsa_ad=562198293068&hsa_src=g&hsa_tgt=kwd-306225620102&hsa_kw=discover%20battery&hsa_mt=e&hsa_net=adwords&hsa_ver=3&gclid=EAIaIQobChMI0ZOOoLm1-wIVFtJ3Ch3X7g6FEAAYASAAEgKaifD_BwE (accessed on 16 July 2022).
- Generic System Converter Default Cost Details, Homer Pro Manual. Available online: https://www.homerenergy.com/products/pro/docs/index.html (accessed on 16 July 2022).
- Lambert, T.; Gilman, P.; Lilienthal, P. Micropower System Modeling with HOMER; National Renewable Energy Laboratory: Golden, CO, USA, 2006. [Google Scholar]
Publisher’s Note: MDPI stays neutral with regard to jurisdictional claims in published maps and institutional affiliations. |
© 2022 by the authors. Licensee MDPI, Basel, Switzerland. This article is an open access article distributed under the terms and conditions of the Creative Commons Attribution (CC BY) license (https://creativecommons.org/licenses/by/4.0/).