Article

Experimental Investigation of the Output Performance of Compressed-Air-Powered Vehicles with a Pneumatic Motor

1
Faculty of Environment and Life, Beijing University of Technology, Beijing 100124, China
2
Faculty of Materials and Manufacturing, Beijing University of Technology, Beijing 100124, China
*
Authors to whom correspondence should be addressed.
Sustainability 2022, 14(22), 15377; https://doi.org/10.3390/su142215377
Submission received: 10 October 2022 / Revised: 12 November 2022 / Accepted: 17 November 2022 / Published: 18 November 2022
(This article belongs to the Special Issue Toward Carbon Neutrality: Renewable Energy and Energy Engineering)

Abstract

:
Compressed-air vehicles have the advantages of zero pollution and low cost. A compressed-air engine test bench is established in this study. The effects of rotational speed, torque, and regulated pressure on the power performance, economy, and energy conversion efficiency of the pneumatic motor are investigated. The differences in power output, compressed-air consumption rate, and energy conversion efficiency between forward and reverse rotation of the pneumatic motor are compared and analyzed. To effectively investigate the performance of a compressed-air vehicle under various road conditions, this study compares and analyzes the power performance, economy, and energy conversion efficiency of pneumatic motors under different road conditions. Experimental results show that the power output and energy conversion efficiency of the pneumatic motor in reverse rotation are less than those in forward rotation, indicating that the pneumatic motor has better power performance and higher efficiency with forward rotation than reverse rotation. The compressed-air consumption rate of the pneumatic motor with reverse rotation is higher than that with forward rotation, indicating that the pneumatic motor with forward rotation has better economic performance than with reverse rotation. The maximum power output and energy conversion efficiency of the pneumatic motor are about 1220 W and 13.23%, respectively.

1. Introduction

Energy storage technology is crucial for the development of distributed energy, smart grids, and the energy Internet [1,2]. It is also an important supporting technology to reduce the peaks and fill the valleys of conventional power and to improve the efficiency, safety, and economy of conventional-energy power generation and transmission. Compressed-air energy storage is an electric energy storage system that has a large capacity and can realize long-term electric energy storage [3]. Compressed-air-powered vehicles are driven by the compressed air stored in the vehicles’ tanks.
The compressed air supplied to the engine expands inside the cylinder, and the energy of the compressed air is converted into mechanical work. Compressed-air engines (CAEs) are simple, almost frictionless, and light and have minimal wear and tear, long service intervals, non-spark operation, and low vibration [4]. Dižo et al. [5] conducted a numerical study of a CAE with rotating cylinders and developed a mathematical model of the designed engine. A real prototype was also built under laboratory conditions, and its function was verified. Yu et al. [6] investigated the effects of intake and exhaust pressure on the efficiency and power output of a CAE through simulation and experimental studies. The results indicated that the power output of the engine with a rotary air distribution system was about five times that of a CAE with a cam air distribution system. Sivasubramanian et al. [7] converted a spark ignition engine into a CAE to reduce pollution. Kumar et al. [8] developed a CAE by modifying a conventional engine. Meanwhile, Vishnuvardhan et al. [9] converted an internal combustion engine into a CAE by using a solenoid valve for the intake and exhaust to improve the output performance of the engine. Sabareesan et al. [10] investigated a CAE with different opening and closing times of various valves. Pujari et al. [11] designed a double-lobe camshaft for a CAE and validated the effectiveness of the camshaft on the basis of static structural analysis results. Zhang et al. [12] investigated a CAE with three and four stages to analyze the overall efficiency and shaft work. The results showed that an effective means to improve the overall efficiency and power output is to utilize cooling, increase the number of stages, and improve the stage efficiency. Furthermore, Nabil et al. [13] converted a gasoline engine into a CAE by using a solenoid valve instead of a spark plug. Their results indicated that the torque was 7.8 N·m and the speed was 300 rpm. Yu et al. [14] developed a prototype and established a physical model of a CAE. Their experimental results showed that the maximum power output, torque output, and efficiency were 1.92 kW, 56.55 Nm, and 25%, respectively. Meanwhile, Yu et al. [15] proposed a fuzzy logic speed control strategy and performed a theoretical evaluation of a compressed-air-powered system validated by experimental results. Zeng et al. [16] proposed a model using theoretical exergy analysis of a CAE and investigated the influence of rotation speed, ambient temperature, and pressure on the performance of the engine. Zeng et al. [17] developed a CAE and built a theoretical model and test bench to investigate the power and torque output at different port times. Their experimental data showed good agreement with the simulation results.
Compressed-air vehicles have the advantages of environmental friendliness and low cost [18,19]. Xu et al. [20] proposed an auxiliary power system for transport applications and built a test bench for a compressed-air vehicle. Their experimental results revealed that the maximum value of power output was approximately 410 W. Uszyński et al. [21] established a mathematical model of a pneumatic system, analyzed the air consumption of a compressed-air vehicle, and compared the simulation and experimental data. Alami et al. [22] proposed the manufacture, design, and testing of a compressed-air vehicle. The proposed prototype could travel 180 m at a speed of 3.47 km/h when the pressure was 6.3 bar. Ramasubramanian et al. [23] investigated the effects of different vane angles and diameters on the power output of a compressed-air vehicle. Giradkar et al. [24] studied a compressed-air vehicle using a pneumatic wrench to produce mechanical work through compressed air. Radhika et al. [25] developed a hybrid vehicle driven by compressed-air energy and solar energy to reduce pollution. Meanwhile, Teli et al. [26] designed a pneumatically powered bicycle with an overall efficiency of 54.4% when compressed-air energy was used. Shi et al. [27] established a mathematical model of an air-driven hydraulic vehicle and validated the model by using experimental data. The results indicated that the model was accurate. In addition, Evrin et al. [28] developed a prototype of a pneumatic vehicle and performed an experimental investigation. The experimental results revealed that the maximum torque varied from 21 Nm to 44 Nm, and the energetic efficiency of the compressed-air vehicle was 59.5%. Shi et al. [29] built a mathematic model, developed an experimental station, and analyzed the dynamic characteristics of an air-powered vehicle. Their results indicated that the established model was effective, and the efficiency of the compressed-air vehicle was about 30%. In another study, Alami et al. [30] established a test rig of a pneumatically driven vehicle and analyzed various load cycles and operating modes. They found that the maximum velocity was around 14 km/h, and the power output of the driven sprocket was 0.7 hp. Zhi et al. [31] developed a compressed-air system using single-screw expander with different oil–gas separators. They found that using a centrifugal oil–gas separator could improve the output performance of the proposed system. Evrin et al. [32] developed a powering system with compressed air and investigated the performance of the proposed system through exergy and energy efficiencies. The results indicated that the exergy and energy efficiencies were 51% and 59.5%, respectively. Simon et al. [33] designed a compressed-nitrogen vehicle and investigated its ergonomic, dynamic, and economic performances through experimental data. Nabil et al. [13] modified a petrol engine into a CAE using solenoid valve for piston timing. The results indicated that the efficiency could reach up to 9.6%. Wang et al. [34] proposed a four-stroke CAE with high torque, developed a calculation model for the CAE, and investigated the dynamic characteristics through experimental data. The results indicated that the rotational speed, torque, and driving range were 650 r/min, 1032.48 N·m, and 60–80 km when the inflation pressure was 10 Mpa. Karaca et al. [35] proposed a new energy system integrating solar and wind energy for desalination and power generation. The results indicated that the exergy and energy efficiencies were 37.6% and 45.4%, respectively.
Hybrid technology has become popular because it has been proven to reduce fuel needs and improve vehicle efficiency [18]. Karaca et al. [36] developed a hybrid compressed natural gas–pneumatic system as a power source option for buses. Their experimental results showed that the hybrid compressed natural gas–pneumatic bus emitted 0.80 kg of carbon dioxide per kilometer, making it the second-friendliest choice after the hydrogen fuel cell bus (0.312 kg of carbon dioxide per km). The cooling and heating loads of the developed system were 25 and 15 kW, respectively, and its exergy and energy efficiencies were 67.5% and 46.6%, respectively [37]. Al-Zareer et al. [38] developed a compressed liquid-air cooling system for fast vehicle cabin cooling. Their results revealed that the temperature could be reduced by 15.2 °C and 12.0 °C in 1 min when the pressure is 9.0 and 5.0 bar, respectively. Brown et al. [39] developed a low-cost hybrid drivetrain based on a pneumatic system and established a thermodynamic model of a proof-of-concept prototype. The experimental results indicated that the round-trip efficiency was approximately 10%. Meanwhile, Zeynali et al. [40] investigated robust, multi-objective thermal and electrical energy hub management integrating hybrid battery–compressed-air energy storage systems and the plug-in-electric-vehicle-based demand response. Doosti et al. [41] proposed an energy hub including an ice storage conditioner, plug-in electric vehicle, and solar-powered compressed-air energy storage to reduce operation and emission costs. In addition, Ghazvini et al. [42] proposed a mathematical optimization approach for the environmental and economic operation of a microgrid that includes electric vehicles and compressed-air energy storage.
The literature review presented above indicates that compressed-air vehicles are a technology with potential advantages of zero pollution, low cost, simplicity, low vibration, and zero friction. These vehicles are driven by compressed air. Compressed air is easy to obtain and can be generated by compressors. The electrical energy required for the compressors can be converted from renewable energy, such as solar, wind, biomass, and tidal energy, and cannot rely on non-renewable energy sources, such as coal or oil. The research and promotion of compressed-air vehicles play a vital role in solving the problems of environmental protection and non-renewable energy consumption. A CAE test bench was built in this study. The effects of regulated pressure, torque, and rotational speed on the power performance, economy, and energy conversion efficiency of the pneumatic motor (PM) were studied. The differences in power output, compressed-air consumption rate (CACR), and energy conversion efficiency between forward and reverse rotation of the PM were compared and analyzed. When the PM is in expander mode, it can provide power for the CAV. When the CAV is in deceleration or downhill and the PM is in compressor mode, it can provide braking torque and generate compressed air. The PM can enhance the braking performance, recover the braking energy, and improve the energy utilization efficiency. To effectively simulate the performance of compressed-air vehicles under road conditions, this study compares and analyzes the power performance, economy, and energy conversion efficiency of PMs under extra-urban driving cycle (EUDC), highway, Japan, and urban dynamometer driving schedule (UDDC) conditions.

2. Experimental Setup and Working Principle

2.1. Test Bench of Experimental Setup

The compressed-air vehicle test bench is composed of a compressor, refrigerant dryer, pressure regulator valve, solenoid valve, flowmeter, magnetic particle brake, magnetic particle brake controller, data acquisition card, PM, and temperature and pressure sensors. The compressed air produced by the compressor is stored in the air tank. Moreover, the regulator valve controls pressure in the air pipeline, and the refrigerant dryer is used to heat the compressed air. In addition, the flow rate is adjusted by controlling the switching frequency and the opening and closing times of the solenoid valve. Meanwhile, the conversion between forward rotation and reverse rotation of the pneumatic motor can be realized by changing the direction of the intake and exhaust. In addition, the flowmeter is used to measure the flow rate of compressed air into the pneumatic motor, while the temperature and pressure sensors are used to measure the intake temperature, intake pressure, exhaust temperature, and exhaust pressure of the pneumatic motor. Moreover, the torque sensor is used to measure the torque and rotation speed of the pneumatic motor. The magnetic particle brake is used to simulate the torque value of the CAV under road conditions. The torque of the pneumatic motor is controlled by the input current of the magnetic particle brake. The data acquisition system is mainly used to collect the temperature, pressure, flow rate, rotation speed, and torque data. The PM is used as the driving system of the CAE. Full play is given to the small size of the PM, which can generate high power, initiate emergency starts/stops, and is especially suitable for frequent starting. Moreover, the reverse and forward operation is convenient, the starting torque is large, the PM can be started with a load, the maintenance is easy, and the steeples can change speed, among other advantages, combined with the urban conditions and traffic light conditions of frequent starting and stopping of vehicles. When the PM is in expander mode, it can provide power for the CAE. When the CAE is in deceleration or downhill and the PM is in compressor mode, it can provide braking torque and generate compressed air. The PM can enhance the braking performance, recover the braking energy, and improve the energy utilization efficiency. Figure 1 shows the prototype and schematic of the CAE test bench.
To simulate the power and economy of the compressed-air vehicle under road conditions, this study compares and analyzes the power performance and economic performance of the PM under the EUDC, highway, Japan, and UDDS working conditions.

2.2. Working Principle

Compressed air enters the cylinder of the PM, expands, and outputs work in the cylinder, and the compressed air after the work is discharged from the PM. The PM is a machine that uses the principle of outputting mechanical work to reduce the air temperature when the compressed air expands and depressurizes to obtain cooling capacity. When the compressed air has a certain pressure and temperature, it has potential energy embodied by pressure and kinetic energy embodied by temperature, which are collectively called internal energy. The main function of the PM is to consume the internal energy of the compressed air itself by using the adiabatic expansion of the compressed air in the PM to do external work.
The technical work of the PM can be written as follows:
W t = p in V 1 p out V 2
where Wt is the technical work of the PM (W), pin and pout are the intake pressure and exhaust pressure (bar), respectively, and V1 and V2 are the intake/exhaust volume of the PM (L), respectively.
The expansion work of compressed air of the PM can be expressed as follows:
W e = V 1 V 2 p d V
where W e is the expansion work, W .
The internal energy of ideal gas can be expressed as follows:
U = m × c V × T
The state equation of ideal gas can be written as follows:
p V = m R T
The temperature of ideal gas can be expressed as follows:
T = p V m R
The temperature of the compressed air before and after expansion in a PM can be expressed as follows:
T 2 T 4 = p 2 V 2 p 4 V 4 = p in V 1 p out V 2
As the technical work output of the PM, W s 0 , p in V 1 p out V 2 , and T 2 T 4 , i.e., T in T out .

3. Result and Discussion

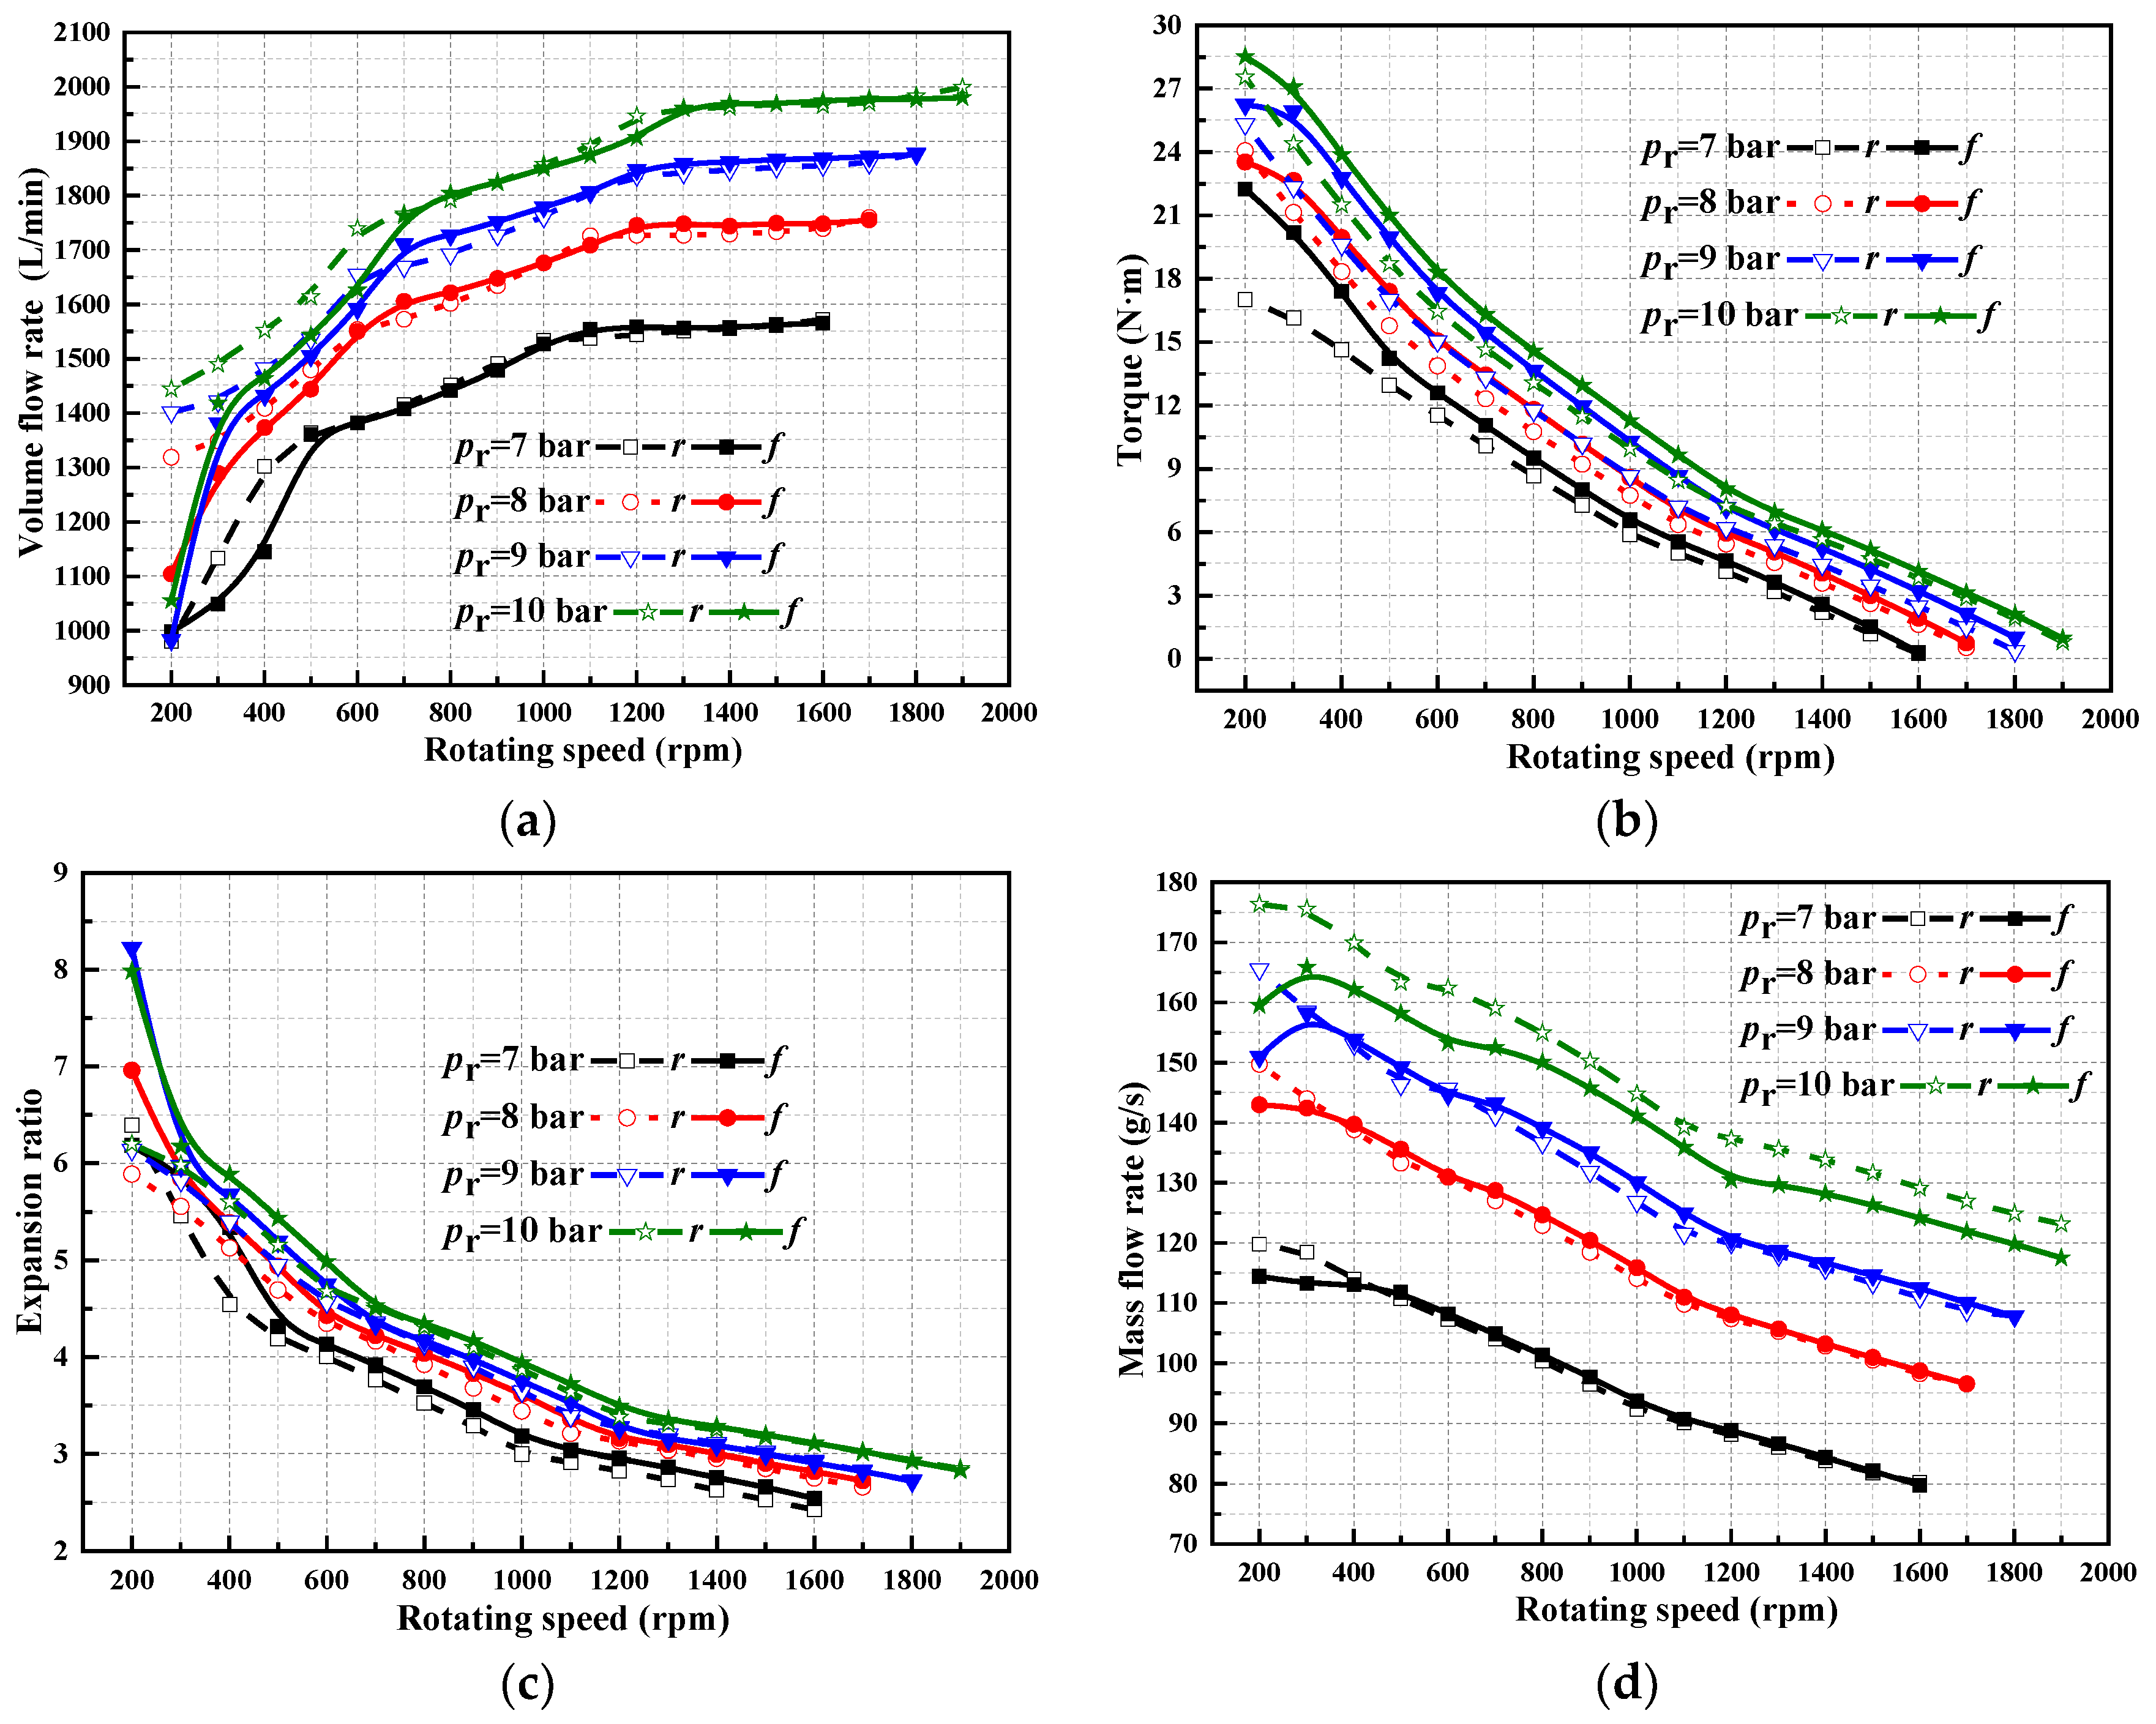
3.1. Effect of Rotation Speed on the Output Performance of the PM

Figure 2a shows the variation in the compressed air’s volume flow rate (VFR) with rotational speed. When the rotational speed is constant, the VFR of the compressed air increases with the increasing regulated pressure. The compressed air enters the cylinder in a supercritical state when the regulated pressure is high. When the regulated pressure is low, the compressed air enters the cylinder and is in a subcritical state. Regardless of whether the PM rotates forward or in reverse, the change trend of the VFR with the rotational speed is essentially the same.
Figure 2b describes the variation in torque with rotational speed. Torque decreases with the increase in rotational speed. When the rotational speed is constant, the torque value of the PM increases with the increase in regulated pressure. At the same rotational speed, the torque value when the PM uses forward rotation is greater than that with reverse rotation.
The expansion ratio is the ratio of the intake pressure to the exhaust pressure of the PM, and it can be written as follows:
ε = p in p e
where ε is the expansion ratio, pin is the intake pressure (bar), and pe is the exhaust pressure (bar).
Figure 2c presents the variation in the expansion ratio with rotational speed. The expansion ratio decreases with the increase in regulated pressure and rotational speed. The variation trend of the expansion ratio of the PM with speed under forward and reverse rotation is effectively the same. When the expansion ratio is too low, the exhaust pressure is too high, resulting in the loss of the thermal energy of the compressed gas. The higher the exhaust pressure, the greater the thermal loss caused by the pressurized exhaust. The PM outputs as much mechanical work as possible, and the exhaust pressure should be reduced as much as possible. If the expansion ratio is too high, the compressed gas in the air storage tank will no longer be used at high pressures, resulting in a waste of energy.
The mass flow is obtained by multiplying the VFR and density of compressed air, as follows:
m = ρ × V
where ρ is the density (kg/m3) and V is the VFR (L/min).
Figure 2d presents the variation in the mass flow of the compressed air with rotational speed. The change trend of the mass flow with rotational speed is contrary to that of VFR with rotational speed. On the whole, the change trend of the mass flow of compressed air with rotational speed is essentially the same whether the PM rotates in forward or reverse.
The power output is the product of the torque and rotation speed, and it is expressed as follows:
P = 2 π × n × T r 60 × 1000
where P is the power output (W), n is the rotation speed (rpm), and Tr is the torque (N·m).
Figure 2e displays the variation in the power output with rotational speed. The power output of the PM increases with the increase in regulated pressure. The higher the pressure of the compressed air, the more work is produced per unit mass of compressed air. The lower the pressure of the compressed air, the less work is produced per unit mass of compressed air. When the rotational speed is low, the power output of the PM increases with the increase in rotational speed. However, after exceeding a certain critical rotational speed, the power output decreases with the increase in rotational speed. When the rotational speed is low, the angular speed increases and the torque decreases, but the torque reduction is small, whereas the angular speed increases rapidly. Therefore, the power output of the PM increases with the increase in rotational speed. When the rotational speed is high, the increase in angular speed is small and the torque decreases considerably, so the power output of the PM decreases with the increase in rotational speed. With the increase of rotational speed, the power output of the PM increases to the maximum value and then decreases. A maximum power output and the corresponding critical rotational speed exist in the middle. The power output when the PM is in forward rotation is greater than that in reverse rotation. The maximum power is approximately 1220 W at 900 rpm.
The CACR is defined as the ratio of the mass flow rate to the power output, and it can be as written as follows:
b = m P
where b is the CACR (g/J) and m is the mass flow rate (g/s).
Figure 2f shows the change in the CACR with rotational speed. With the increase in rotational speed, the CACR initially decreases and then becomes flat. After exceeding a certain critical rotational speed, the CACR increases sharply with the increase in rotational speed. At the low-rotational-speed stage, although the rotational speed increases rapidly, the value of CACR is small, and the number of air intakes per unit time is small, so the CACR is low. At the high-rotational-speed stage, although the number of intakes per unit time is large, the power output of the PM decreases, so its CACR increases. Overall, the CACR decreases from large to small and then increases from small to large. A minimum value and a corresponding critical rotational speed exist in the middle. When the rotational speed is lower than the critical rotational speed, the CACR decreases with the increase in rotational speed. When the rotational speed is higher than the critical speed, the CACR increases with the increase in rotational speed.
The PM’s energy conversion efficiency can be obtained as follows:
η = P m × ( h 1 h 2 s )
where η denotes the PM’s isentropic efficiency, m denotes the mass flow of compressed air, h1 is the enthalpy of the intake compressed air (kJ/kg), and h2s denotes the isentropic enthalpy of the exhaust compressed air (kJ/kg).
Figure 2g presents the effect of rotational speed on the efficiency. On the whole, the change in the energy conversion efficiency with rotational speed is similar to that of the power output with rotational speed. With the increase in rotational speed, the efficiency of the PM initially increases to the maximum value and then decreases. In the middle and low rotational speed ranges, the energy conversion efficiency decreases with the increase in regulated pressure. At medium and high rotational speeds, the efficiency increases with the increase in regulated pressure. In the full rotational speed range, the energy conversion efficiency of the PM with forward rotation is slightly higher than that with reverse rotation.
The main reason for the low efficiency of compressed-air vehicles is throttling. Multiple air storage tanks can be set. During the operation of the PM, the compressed air in each air storage tank can form multiple air sources with different pressures. In accordance with the required power, by optimizing the gas sources with different pressures, the throttling of compressed gas can be avoided as much as possible, and the throttling energy loss under variable working conditions can be reduced to improve the efficiency of the PM.
Ideally, the exhaust pressure of the PM should be similar to the ambient atmospheric pressure. However, in reality, when the air is discharged from the cylinder, its pressure is higher than the ambient pressure. The energy loss in the exhaust phase is mainly due to the exhaust pressure being higher than the ambient pressure. The more the exhaust pressure is higher than the ambient pressure, the greater the energy loss in the exhaust phase. The exhaust pressure of the cylinder should be reduced as much as possible to improve the efficiency of CAEs.
At the intake and expansion stages of the working cycle of the PM, the temperature of the air in the cylinder continues to decline. The temperature of the air in the cylinder is lower than the ambient temperature, so it is bound to absorb heat from the environment. The more heat is absorbed, the closer the process of air expansion is to the isothermal process, and the more work is outputted. Theoretically, the temperature of the working environment of the PM should be increased as much as possible. However, deliberately increasing the ambient temperature is costly and uneconomical. It is easier to prevent the ambient temperature around the PM from being much lower than that in the large peripheral environment by using materials with good thermal conductivity as the materials of various components of the PM, thereby appropriately enhancing the ventilation around the PM. The low-temperature air emitted by the PM can be used as the temperature-regulating gas. When the power of the PM is small, the discharged low-temperature air can be used for general air conditioning. When the power output is large, the temperature of the discharged air is low, and it can be used for refrigeration.

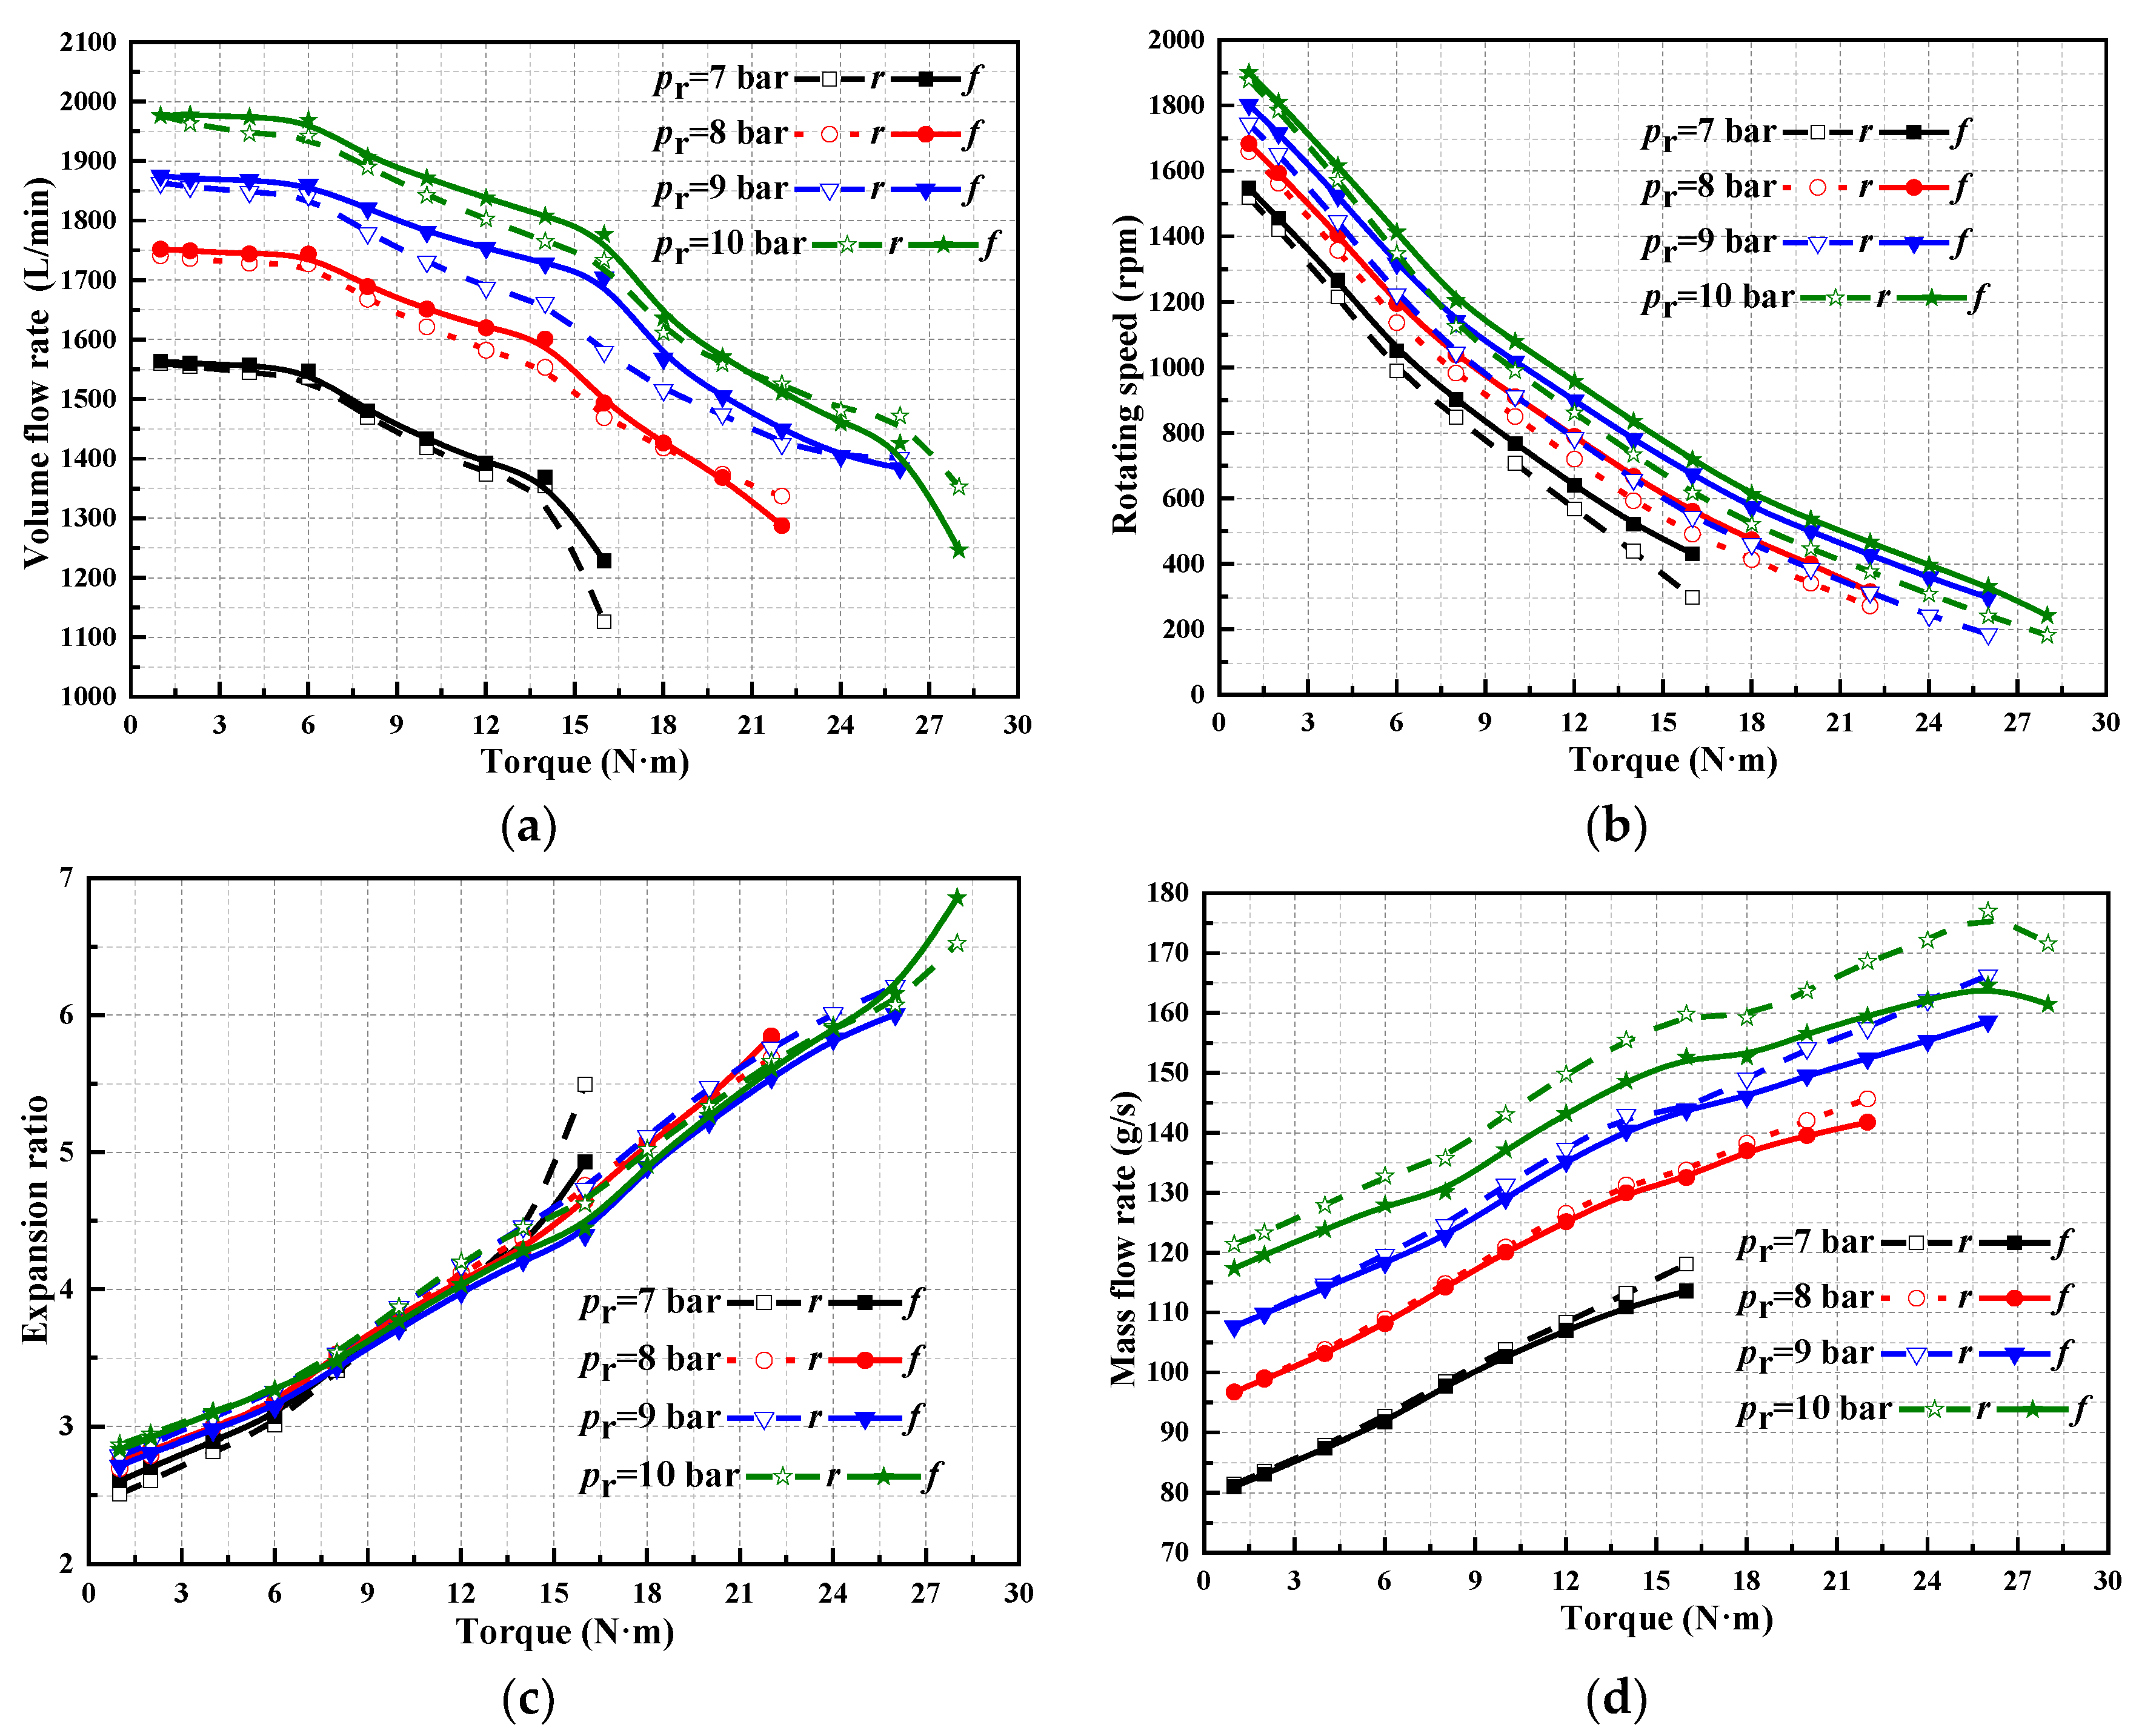
3.2. Effect of Torque on the Output Performance

Figure 3a shows the variation in the VFR with torque. The change in VFR with torque is contrary to that with rotational speed. The VFR decreases with the increase in torque. Generally, the change trend of the VFR of compressed air with torque is essentially the same whether the PM rotates forward or in reverse. Under the same torque, the VFR is slightly larger when the PM rotates forward than when it rotates in reverse.
Figure 3b shows the change in rotational speed with torque. The rotational speed decreases with the increase in torque. At the same torque, the rotational speed of the PM with forward rotation is slightly higher than that with reverse rotation. When the torque is 1 N·m, the rotational speed is 1900 rpm when PM rotates forward.
Figure 3c shows the change in the expansion ratio with torque. The expansion ratio increases linearly with the increase in torque. The regulated pressure has little effect on the expansion ratio. The variation trend of the expansion ratio with torque is essentially the same whether the PM rotates forward or in reverse.
Figure 3d presents the change in the mass flow rate with torque. The mass flow rate increases with the increases in regulated pressure and torque. Whether the PM rotates forward or in reverse, the change trend of the mass flow rate with torque is effectively the same. When the PM rotates in reverse, the mass flow rate reaches the maximum value of about 175 g/s, and the torque value is 26 N·m, with pressure of 10 bar.
Figure 3e shows the change in the power output with torque. The variation trend of the power output with torque is similar to that of the power output with rotational speed—that is, it initially increases and then decreases. The power output of the PM with forward and reverse rotation has similar variation trends. For the power output, the PM has a certain critical torque when the PM rotates forward and in reverse. When the torque is lower than the critical torque value, the power output increases with the increase in torque. When the torque is higher than the critical torque, the power output decreases with the increase in torque. At a certain torque value in the middle, the increased power caused by the increase in torque is equal to the reduction in power caused by the decrease in rotational speed, and the power output reaches the maximum value. Under the same experimental conditions, the output power of the PM with forward rotation is greater than that with reverse rotation, indicating that the power performance of the PM with forward rotation is better than that with reverse rotation.
Figure 3f shows the variation in the air consumption of the PM with torque. With the increase in torque, the CACR of the PM exhibits a linear downward trend, becomes flat, and then shows an increasing trend. The regulated pressure has little effect on the CACR. Whether the PM rotates forward or in reverse, the change curve of the CACR with torque is essentially the same.
Figure 3g presents the change in the energy conversion efficiency of the PM with torque. The variation of the PM’s efficiency with torque is similar to that of the PM’s power output with torque. With regard to the efficiency of the PM, a critical torque value also exists. The critical torque differs under different regulated pressures. In the range with medium and low torque values, the efficiency of the PM decreases with the increase in regulated pressure. In the range with medium and high torque values, the efficiency of the PM increases with the increase in regulated pressure. When the experimental conditions are the same, the energy conversion efficiency of the PM with forward rotation is higher than that with reverse rotation, indicating that the forward rotation of the PM is more economical than reverse rotation.
Table 1 lists the comparative results of the PM with forward rotation and reverse rotation. It is not difficult to find from Table 1 that CAVs have better power performance, economic performance, and energy conversion efficiency when the pneumatic motor is in forward rotation. When the PM is in expander mode, it can provide power for the CAV. When the CAV is in deceleration or downhill and the PM is in compressor mode, it can provide braking torque and generate compressed air. The PM can enhance the braking performance, recover the braking energy, and improve the energy utilization efficiency.

3.3. Comparison of the Output Performance of the PM under Dynamic Conditions

The PM is used in the air-powered vehicle, and its air source is the high-pressure gas stored in the air tank. In this study, the magnetic particle brake was used to simulate the load of the compressed air vehicle under road conditions, and the torque was controlled in accordance with the current input in the magnetic particle controller, in order to study the power performance, economic performance, and energy conversion efficiency of compressed-air vehicles under different working conditions. The input magnetic particle brake current was determined by the multiplication of the vehicle’s speed under different working conditions.
Figure 4, Figure 5, Figure 6 and Figure 7 present the experimental results of the PM under EUDC, highway, Japan, and UDDS conditions, respectively. The valley value of the rotational speed corresponds to the torque peak point. The peak point of torque corresponds to the peak points of the power output, expansion ratio, compressed-air mass flow rate, and efficiency of the PM. The CACR and rotational speed of the PM show similar trends. From the perspective of improving the power output and efficiency, the PM should work within the large torque range as much as possible to ensure good power output performance. From the perspective of improving economy, the PM should operate in the high rotational speed range. The maximum power output and efficiency of the PM under the EUDC, highway, Japan, and UDDS working conditions are 955, 1075, 893, and 895 W and 11.33%, 12.35%, 13.23%, and 11.93%, respectively.

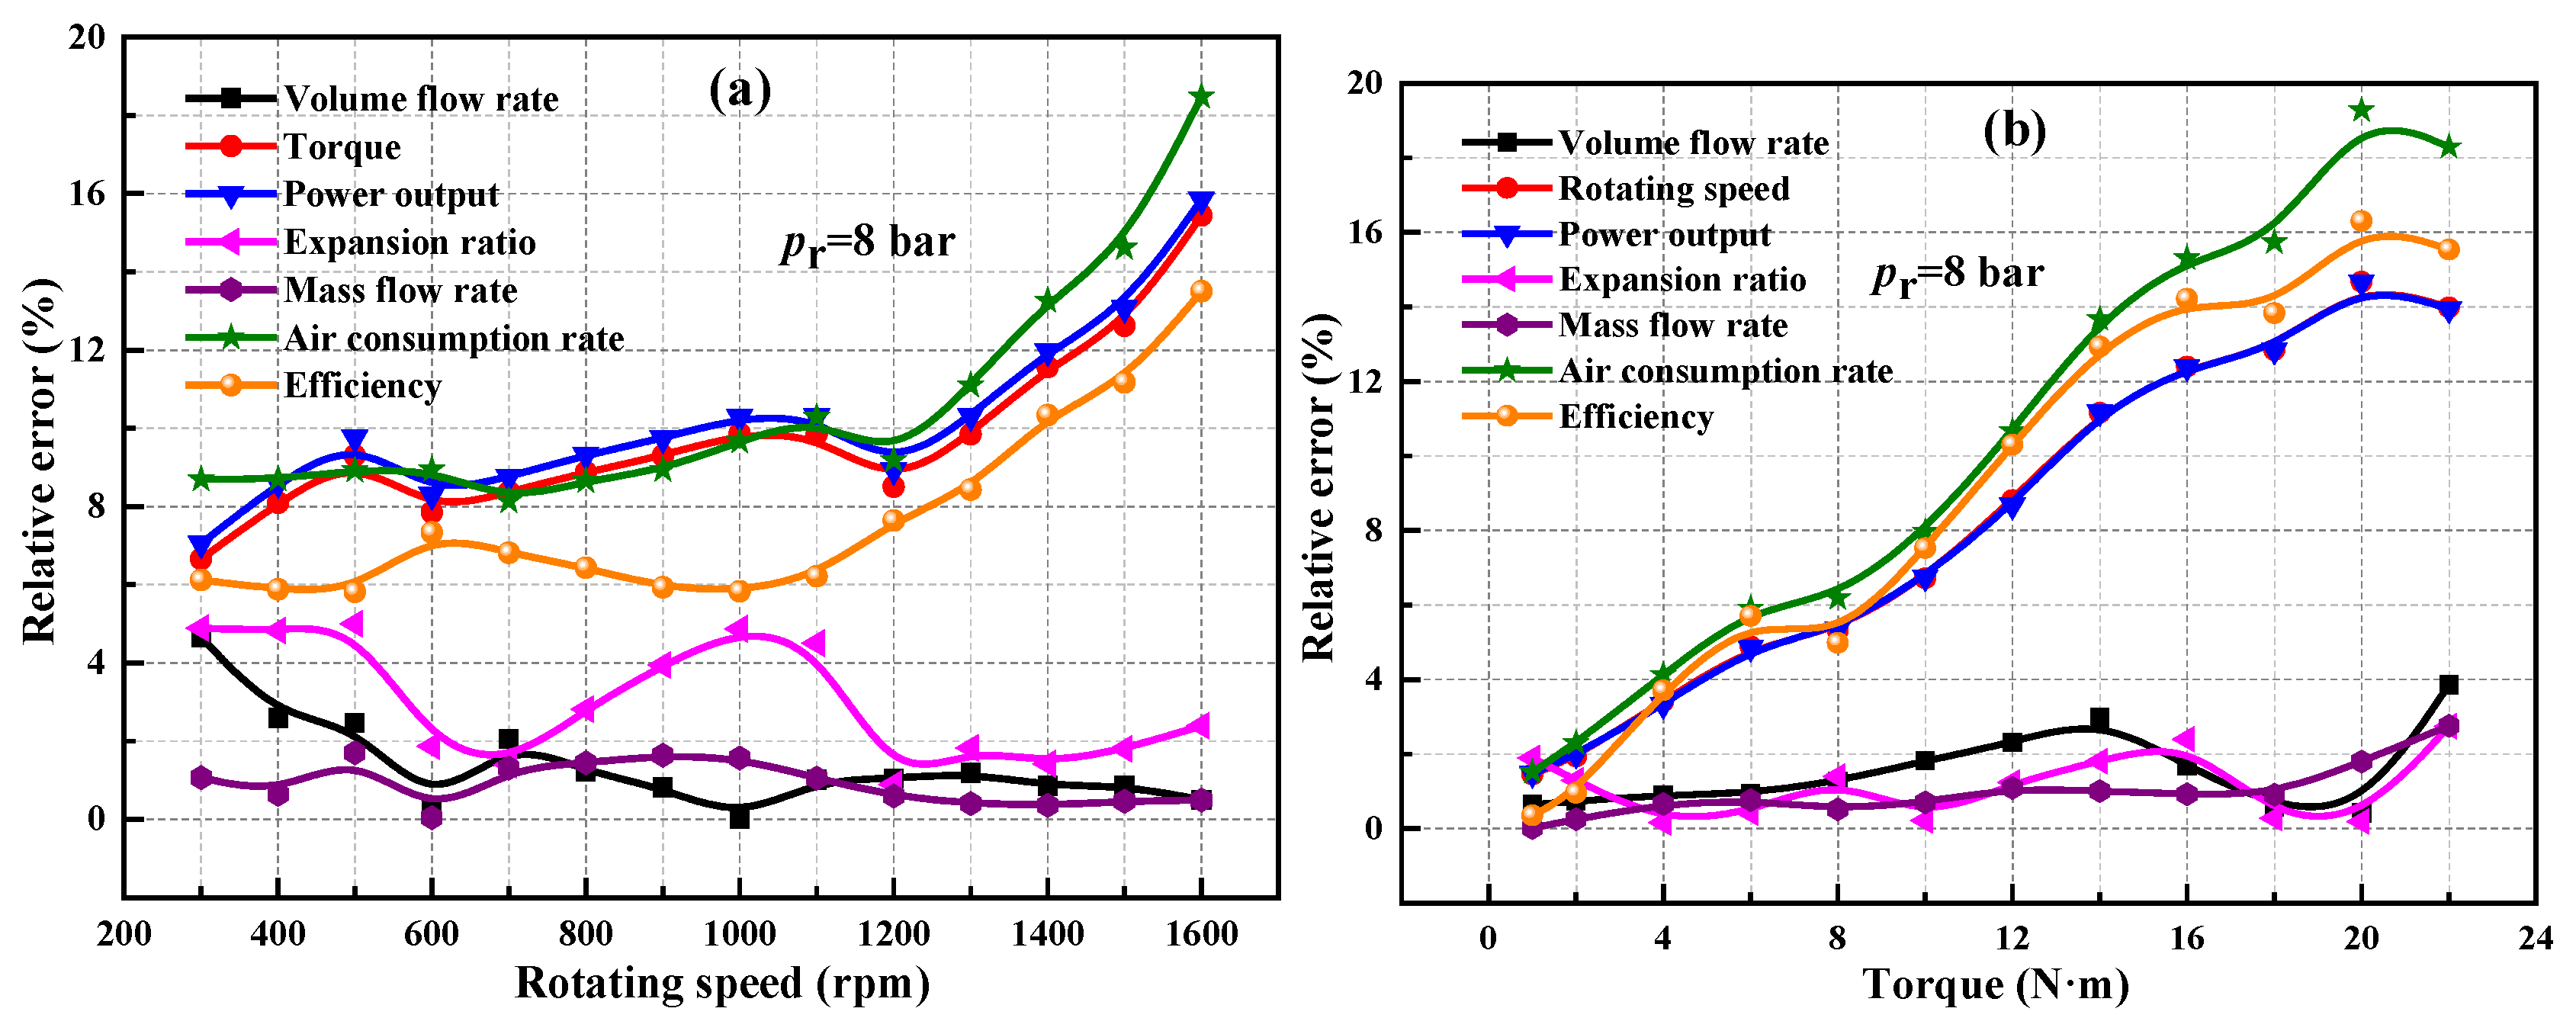
3.4. Relative Error Analysis of Forward and Reverse Rotation of the PM

Figure 8 shows the variation in the relative error of the PM in forward and reverse rotation with rotational speed (Figure 8a) and torque (Figure 8b). The variation trends of the relative errors of the CACR, energy conversion efficiency, and power output of the PM are essentially the same. The variation trends of the relative errors of the expansion ratio, VFR, and mass flow rate are also the same.

3.5. Uncertainty Analysis

Generally, the error bar is used to indicate the uncertainty of the measured data. The error bar is a line segment drawn in the direction indicating the magnitude of the measured value, with the arithmetic mean value of the measured value as the midpoint. Half of the length of the line segment is equal to the uncertainty.
Figure 9 shows the variation in the power output (Figure 9a,b), CACR (Figure 9c,d), and energy conversion efficiency (Figure 9e,f) of the PM with rotation speed and torque. The uncertainty of the output power of the PM is large, and the range is mainly concentrated in the medium and high torques and rotational speeds. The uncertainty of the CACR of the PM is high in the high-rotational-speed range. The uncertainty of the energy conversion efficiency of the PM is high at medium and high torques and rotational speeds.

4. Conclusions and Future Outlook

A compressed-air engine test bench was established in this study. The effects of torque, rotational speed, and regulated pressure on the power performance (output power), economy (CACR), and energy conversion efficiency of the PM were investigated. The differences in the power output, CACR, and energy conversion efficiency of the PM with forward and reverse rotation were also compared and analyzed. The main conclusions are as follows:
(1)
The effects of rotational speed, torque, and regulated pressure on the power performance, economy, and energy conversion efficiency of the pneumatic motor were investigated. The maximum power output and energy conversion efficiency of the pneumatic motor were about 1220 W and 13.23%, respectively.
(2)
The CACR of the PM with forward rotation was lower than that with reverse rotation, indicating that the forward rotation of the PM is more economical than the reverse rotation. The energy conversion efficiency of the PM with forward rotation was greater than that with reverse rotation.
(3)
The power output of the PM with forward rotation was greater than that with reverse rotation, indicating that the PM demonstrates better power performance with forward rotation than with reverse rotation.
(4)
From the perspective of improving the power output and energy conversion efficiency, the PM should work in the high-torque range as much as possible to ensure good power performance. From the perspective of improving economy, the PM should operate in the high-rotational-speed range.
(5)
This study compared and analyzed the power performance, economy, and energy conversion efficiency of PMs under EUDC, highway, Japan, and UDDC conditions.
The main reason for the low efficiency of compressed-air vehicles is throttling. In follow-up research, different intake pressures could be optimized in accordance with the requirements of working conditions. Another problem faced by compressed-air vehicles is that their energy density is too low. In future research, compressed air could be replaced with liquid nitrogen.

Author Contributions

Y.X.: Conceptualization, Methodology, Software, Writing—Original Draft. X.W.: Methodology, Investigation, Supervision. H.Z.: Fuding acquisition, Conceptualization, Investigation, Methodology, Supervision. F.Y.: Conceptualization, Methodology, Software. J.L.: Methodology, Software, Writing—Review and Editing. H.Y.: Conceptualization, Investigation, Methodology. K.N.: Methodology, Writing—Review and Editing. Z.L.: Conceptualization, Methodology, Software. Y.W. (Yan Wang): Methodology, Writing—Review and Editing. Y.W. (Yuting Wu): Resources, Methodology, Supervision. All authors have read and agreed to the published version of the manuscript.

Funding

This work was sponsored by the Beijing Natural Science Foundation (Grant No. 3222024) and supported by the State Key Laboratory of Engines, Tianjin University (Grant No. K2020-08). The authors would like to thank the editors and reviewers for their valuable comments on this research.

Informed Consent Statement

Informed consent was obtained from all subjects involved in the study.

Data Availability Statement

Data are available upon request.

Conflicts of Interest

The authors declare that they have no known competing financial interest or personal relationships that could have appeared to influence the work reported in this paper.

Nomenclature

pinIntake pressure (bar)
peExhaust back pressure (bar)
prRegulated pressure (bar)
PPower output (W)
TrTorque (N·m)
nRotational speed (r/min)
mMass rate of compressed air (g/s)
bCompressed-air consumption rate (g/J)
Greek letters
εExpansion ratio
ηEnergy efficiency
Acronyms
CAECompressed-air engine
CAVCompressed-air-powered vehicle
PMPneumatic motor
CACRCompressed-air consumption rate

References

  1. Chang, J.; Li, Z.; Huang, Y.; Yu, X.; Jiang, R.; Huang, R.; Yu, X. Multi-objective optimization of a novel combined cooling, dehumidification and power system using improved M-PSO algorithm. Energy 2021, 239, 122487. [Google Scholar] [CrossRef]
  2. Ibrahim, I.D.; Sadiku, E.R.; Jamiru, T.; Hamam, Y.; Alayli, Y.; Eze, A.A. Prospects of nanostructured composite materials for energy harvesting and storage. J. King Saud Univ.-Sci. 2020, 32, 758–764. [Google Scholar] [CrossRef]
  3. Xu, Y.; Zhang, H.; Yang, F.; Tong, L.; Yang, Y.; Yan, D.; Wang, C.; Ren, J.; Wu, Y. Experimental study on small power generation energy storage device based on pneumatic motor and compressed air. Energy Convers. Manag. 2021, 234, 113949. [Google Scholar] [CrossRef]
  4. Marvania, D.; Subudhi, S. A comprehensive review on compressed air powered engine. Renew. Sustain. Energy Rev. 2017, 70, 1119–1130. [Google Scholar] [CrossRef]
  5. Dižo, J.; Blatnický, M.; Sága, M.; Šťastniak, P. A Numerical Study of a Compressed Air Engine with Rotating Cylinders. Appl. Sci. 2021, 11, 7504. [Google Scholar] [CrossRef]
  6. Yu, Q.; Hao, X.; Tan, X. Comparative study on air distribution system for piston-type compressed air engine. Adv. Mech. Eng. 2017, 9. [Google Scholar] [CrossRef] [Green Version]
  7. Sivasubramanian, R.; Kumaresan, G.; Kumar, N.N.; Rajeshwaran, S.; Jeyaseelan, R.; Manikandan, V.; Maran, B.M. Design and analysis of air powered vehicle frame. Mater. Today Proc. 2020, 45, 1366–1370. [Google Scholar] [CrossRef]
  8. Kumar, S.; Pradhan, P.K.; Khan, Z.H.; Kumar, B.A.; Chaithanya, M. Design and developing of compressed air engine. Int. Res. J. Eng. Technol. (IRJET) 2017, 4, 1468–1474. [Google Scholar]
  9. Vishnuvardhan, M.; Prasad, K.S.; Purushothaman, J. Design and experimental investigation of compressed air engine. Mater. Today: Proc. 2020, 33, 3311–3313. [Google Scholar] [CrossRef]
  10. Sabareesan, S.; Kannan, R.; Chandrasekar, G. Design and Fabrication of Compressed Air Engine Technology. MASK Int. J. Sci. Technol. 2016, 1, 21–26. [Google Scholar]
  11. Pujari, P.C.; Jain, A.; Nath, D.S.; Kumar, N. Designing, modeling, and structural analysis of a newly designed double lobe camshaft for a two-stroke compressed air engine. Mater. Today Proc. 2021, 47, 3392–3399. [Google Scholar] [CrossRef]
  12. Zhang, X.; Wang, X.; Li, W.; Zhu, Y.; Zuo, Z.; Chen, H. Energy and exergy analysis of compressed air engine systems. Energy Rep. 2021, 7, 2316–2323. [Google Scholar] [CrossRef]
  13. Nabil, T. Investigation and implementation of compressed air powered motorbike engines. Eng. Rep. 2019, 1, e12034. [Google Scholar] [CrossRef]
  14. Yu, Q.; Cai, M. Experimental Analysis of a Compressed Air Engine. J. Flow Control. Meas. Vis. 2015, 3, 144–153. [Google Scholar] [CrossRef] [Green Version]
  15. Yu, Q.; Shi, Y.; Cai, M.; Xu, W. Fuzzy logic speed control for the engine of an air-powered vehicle. Adv. Mech. Eng. 2016, 8, 1–11. [Google Scholar] [CrossRef] [Green Version]
  16. Zeng, F.; Xu, J. Study on exergy analysis of a compressed air engine. Therm. Sci. 2018, 22, 1179–1191. [Google Scholar] [CrossRef]
  17. Zeng, F.; Xu, J. Theoretical and experimental research on the port timing of a compressed air engine. Energy Sources Part A Recover. Util. Environ. Eff. 2019, 44, 4888–4901. [Google Scholar] [CrossRef]
  18. Wasbari, F.; Bakar, R.; Gan, L.; Tahir, M.; Yusof, A. A review of compressed-air hybrid technology in vehicle system. Renew. Sustain. Energy Rev. 2017, 67, 935–953. [Google Scholar] [CrossRef] [Green Version]
  19. Fang, Y.; Lu, Y.; Roskilly, A.P.; Yu, X. A review of compressed air energy systems in vehicle transport. Energy Strat. Rev. 2021, 33, 100583. [Google Scholar] [CrossRef]
  20. Xu, Y.; Zhang, H.; Yang, F.; Tong, L.; Yan, D.; Yang, Y.; Wang, Y.; Wu, Y. Experimental investigation of pneumatic motor for transport application. Renew. Energy 2021, 179, 517–527. [Google Scholar] [CrossRef]
  21. Uszyński, S.; Ambroziak, L.; Kondratiuk, M.; Kulesze, Z. Air consumption analysis in compressed air powered vehicles. In Proceedings of the 2018 23rd International Conference on Methods & Models in Automation & Robotics (MMAR) IEEE, Miedzyzdroje, Poland, 27–30 August 2018; pp. 837–842. [Google Scholar]
  22. Alami, A.H.; Alblooki, N.; Tawalbeh, M.; Almerashi, Z.; Alkharousi, A.; Salameh, T. Compressed air for light vehicle propulsion. In Proceedings of the 2020 Advances in Science and Engineering Technology International Conferences (ASET) IEEE, Dubai, United Arab Emirates, 4 February–9 April 2020; pp. 1–6. [Google Scholar]
  23. Ramasubramanian, S.; Chandrasekaran, M.; Baskar, S.; Dowhithamaran, A. Ravin Design and development of pneumatic compressed air vehicle. Mater. Today Proc. 2020, 37, 690–693. [Google Scholar] [CrossRef]
  24. Giradkar, A.D.; Ade, N.K. Design and Testing of Compressed Air Vehicle. Int. J. New Technol. Res. 2018, 4, 03–06. [Google Scholar]
  25. Radhika, S.; Swapna, D.; Manikanta, P.; Sunain, S.K. Design of a compressed air vehicle. J. Refrig. Air Cond. Heat. Vent. 2016, 1, 1–6. [Google Scholar]
  26. Teli, S.N.; Chari, K.S.; Yadav, K.; Pawar, A. Design of Pneumatically Powered Bicycle. In Proceedings of the International Conference on Recent Advances in Computational Techniques (IC-RACT) 2020, Navi Mumbai, India, 26–27 June 2020. [Google Scholar]
  27. Shi, Y.; Wu, T.; Cai, M.; Wang, Y.; Xu, W. Energy conversion characteristics of a hydropneumatic transformer in a sustainable-energy vehicle. Appl. Energy 2016, 171, 77–85. [Google Scholar] [CrossRef]
  28. Evrin, R.A.; Dincer, I. Experimental investigation of a compressed air vehicle prototype with phase change materials for heat recovery. Energy Storage 2020, 2, e159. [Google Scholar] [CrossRef]
  29. Shi, Y.; Wang, Y.; Liang, H.; Cai, M. Power characteristics of a new kind of air-powered vehicle. Int. J. Energy Res. 2016, 40, 1112–1121. [Google Scholar] [CrossRef]
  30. Alami, A.H.; Abu Hawili, A.; Fadel, M.I.; Zwayyed, F.; Barbarji, T.; Ghommem, M. Technical feasibility of a pneumatically driven vehicle. Sci. Total Environ. 2021, 757, 143937. [Google Scholar] [CrossRef]
  31. Zhi, R.; Lei, B.; Zhang, C.; Ji, W.; Wu, Y. Experimental study of single screw expander with different oil-gas separators in compressed air powered system. Energy 2021, 235, 121371. [Google Scholar] [CrossRef]
  32. Evrin, R.A.; Dincer, I. Energy and exergy analyses of experimental compressed air vehicle prototype with heating element. Int. J. Exergy 2021, 35, 471–483. [Google Scholar] [CrossRef]
  33. Simon, M.; Simon, M.I. New research and design to obtain a compressed air driven prototype vehicle. Procedia Manuf. 2020, 46, 454–460. [Google Scholar] [CrossRef]
  34. Wang, L.; Zhu, S.-L.; Zhang, X.-R.; Zhang, H.-Y. Another way of cleaner public transportation: Four-stroke high torque CAE (Compressed Air Engine) performance analysis and CAE bus. Energy Rep. 2022, 8, 5727–5738. [Google Scholar] [CrossRef]
  35. Karaca, A.E.; Dincer, I.; Nitefor, M. Development of an integrated solar and wind driven energy system for desalination and power generation. Sustain. Energy Technol. Assess. 2022, 52, 102249. [Google Scholar] [CrossRef]
  36. Karaca, A.E.; Dincer, I. A Hybrid Compressed Natural Gas-Pneumatic System as a Powering Option for Buses: A Comparative Assessment. Energy 2021, 230, 120865. [Google Scholar] [CrossRef]
  37. Karaca, A.E.; Dincer, I.; Nitefor, M. Analysis of a newly developed hybrid pneumatic powertrain configuration for transit bus applications. Energy 2022, 248, 123557. [Google Scholar] [CrossRef]
  38. Al-Zareer, M.; Dincer, I.; Rosen, M.A. Development and analysis of a portable compressed liquid air cooling system for fast vehicle cabin cooling. Int. J. Refrig. 2017, 84, 117–127. [Google Scholar] [CrossRef]
  39. Brown, T.; Atluri, V.; Schmiedeler, J. A low-cost hybrid drivetrain concept based on compressed air energy storage. Appl. Energy 2014, 134, 477–489. [Google Scholar] [CrossRef]
  40. Zeynali, S.; Rostami, N.; Ahmadian, A.; Elkamel, A. Robust multi-objective thermal and electrical energy hub management integrating hybrid battery-compressed air energy storage systems and plug-in-electric-vehicle-based demand response. J. Energy Storage 2021, 35, 102265. [Google Scholar] [CrossRef]
  41. Doosti, R.; Sedighizadeh, M.; Sedighizadeh, D.; Fini, A.S. Robust stochastic optimal operation of an industrial building including plug in electric vehicle, solar-powered compressed air energy storage and ice storage conditioner: A case study in the city of Kaveh, Iran. IET Smart Cities 2022, 4, 56–77. [Google Scholar] [CrossRef]
  42. Ghazvini, A.; Sedighizadeh, M.; Olamaei, J. Semidefinite programing as a tool for economic-environmental operation of a microgrid including compressed air energy storage and electric vehicle. J. Energy Storage 2021, 43, 103215. [Google Scholar] [CrossRef]
Figure 1. Prototype and schematic of the CAE test bench: (a) Prototype of the CAE test bench. (b) Schematic of the CAE test bench.
Sustainability 14 15377 g001
Figure 2. Effect of rotation speed on the output performance of the PM: (a) VFR vs. rotational speed. (b) Torque vs. rotational speed. (c) Expansion ratio vs. rotational speed. (d) Mass flow rate vs. rotational speed. (e) Power output vs. rotational speed. (f) Effect of rotational speed on the CACR. (g) Efficiency vs. rotational speed.
Sustainability 14 15377 g002aSustainability 14 15377 g002b
Figure 3. Effect of torque on the output performance of the PM: (a) VFR vs. torque. (b) Rotational speed vs. torque. (c) Expansion ratio vs. torque. (d) Mass flow rate vs. torque. (e) Power output vs. torque. (f) CACR vs. torque. (g) Efficiency vs. torque.
Sustainability 14 15377 g003aSustainability 14 15377 g003b
Figure 4. Experimental results of the PM under EUDC conditions.
Sustainability 14 15377 g004aSustainability 14 15377 g004b
Figure 5. Experimental results of the PM under highway conditions.
Sustainability 14 15377 g005aSustainability 14 15377 g005b
Figure 6. Experimental results of the PM under Japan conditions.
Sustainability 14 15377 g006aSustainability 14 15377 g006b
Figure 7. Experimental results of the PM under UDDS conditions.
Sustainability 14 15377 g007aSustainability 14 15377 g007b
Figure 8. Variation in relative error with torque and rotational speed.
Sustainability 14 15377 g008
Figure 9. Variation in the error bar with torque and rotational speed.
Sustainability 14 15377 g009
Table 1. Comparison of the results of the PM with forward rotation and reverse rotation.
Rotational Speed (r/min)20040060080010001200140016001800
Torque
(N·m)
Reverse27.4721.2516.2712.789.677.015.453.641.77
Forward29.3023.8018.2514.5311.177.936.054.072.00
Expansion ratioReverse6.205.574.624.303.803.373.233.012.92
Forward8.165.894.984.353.943.453.263.012.92
Power
(W)
Reverse575.6891.31022.61072.71013.1881.1799.4609.3334.0
Forward613.8997.61147.31218.11170.7996.3887.9683.5378.3
CACR
(g/J)
Reverse0.3010.1840.1540.1390.1370.1510.1610.2050.361
Forward0.2570.1600.1320.1220.1190.1290.1420.1780.310
Efficiency
(%)
Reverse2.764.736.197.137.737.627.376.023.55
Forward2.925.316.988.058.778.808.336.874.13
Publisher’s Note: MDPI stays neutral with regard to jurisdictional claims in published maps and institutional affiliations.

