1. Introduction
Studies on complex pedestrian movements could be useful for the safe and efficient design of pedestrian facilities in both indoor and outdoor spaces [
1,
2]. This is significant as crowd disasters have become more frequent and are larger in scale due to an increase in the number of mega-events and walkable infrastructure [
3]. However, these disasters are often caused by the inappropriate utilization of space and the systemic failure of organizations to provide safe pedestrian facilities. A well-designed pedestrian facility together with proper management strategies can provide an efficient flow of pedestrians, as well as safe evacuation in case of emergencies [
3,
4,
5]. As walking facilities are critical components of sustainable transportation systems, the efficient and effective design of pedestrian facilities helps to promote this mode of active transport. This also plays a vital role in improving the quality of life by reducing the use of motorized modes of transport [
6]. However, the design of safe and efficient pedestrian facilities requires insight into complex human movements such as intersecting pedestrian streams for varying speed conditions.
Assessing safety and collecting data for highly complex human behaviors, which are continuous in movement space, is challenging [
7,
8]. These data can be obtained either from experimental methods (e.g., crowd experiments using animals and social insects, controlled laboratory experiments with human crowds, virtual reality (VR) and augmented reality (AR)-based crowd experiments, hypothetical choice surveys, and evacuation drills) or from field methods, including post-incident analysis of real incidents, field observations in natural settings, or qualitative interviews [
8]. Animal and insect experiments are advantageous for panic situations that cannot be performed using human subjects due to ethical reasons [
9,
10,
11]. However, controlled laboratory experiments with human subjects are a reasonable compromise between animal experiments and field observations. These experiments are comparatively easy to replicate and allow the researcher to control certain variables while studying the effect on others [
7]. Furthermore, computational tools for the simulation and design of pedestrian facilities for evacuation largely depend on assumptions that are found to be inconsistent or unrealistic due to the lack of human and social behavioral data [
12]. Therefore, experiments with human subjects are necessary for the validation of existing models for both normal conditions, as well as in situations where pedestrians move at higher speeds than in normal walking conditions.
Studies on interactions of pedestrian crowds with different geometrical settings, such as, turning, merging, and intersecting pedestrian streams, are of particular interest as they are very common features in pedestrian facilities. These movements require collision avoidance of pedestrians with both moving and stationary obstacles. Collision avoidance with moving obstacles in the case of intersecting streams of pedestrians requires stopping or steering maneuvers, both of which affect the individual pedestrian speed considerably [
13]. Numerous experimental studies have been conducted for common geometrical settings, e.g., turning [
14,
15,
16,
17], crossing [
6,
18,
19], and merging [
14,
20,
21,
22] configurations, under normal, as well as evacuation, conditions. Some studies have been conducted under panic conditions using insects [
10,
11,
23,
24] and animals [
25,
26,
27]. Different geometrical settings and desired speed levels can cause different bottleneck effects that can be assessed both qualitatively and quantitatively.
Previous studies have mainly focused on the bottleneck effect and capacity issues associated with these different geometrical settings. Very few studies, e.g., Lian et al. [
19] and Ye et al. [
17], presented the speed distributions within the congested area. However, a comprehensive characterization of speed variations within the bottleneck area has not been presented. A comprehensive microscopic evaluation of the speed distributions over the bottleneck area could be useful in identifying the mechanism of the occurrence of the congestion associated with complex geometrical settings. To address such gaps in the current knowledge, this study aims to examine the variation of velocities over the walking space and evacuation times (time-to-target) for crossing configurations of three crossing angles, under two desired speed levels. The two speed levels (normal-speed walking and slow-speed running) are used to mimic the normal and emergency evacuations, respectively. However, the speed was limited to slow-speed running to ensure the safety of the participants during the experiment. The present study is based on the controlled laboratory experimental data using human subjects collected in 2016 by Aghabayk et al. [
28], which examines the influence of intersecting angles on pedestrian crowd flow using the aggregate values of the flow rate, speed, evacuation time, and travel time. The present paper provides further in-depth and microscopic analysis of the data to understand the spatial variations in speed within the corridor for intersecting pedestrian streams at varying speed levels.
This paper is organized as follows:
Section 2 of the paper discusses the available empirical studies on crossing or intersecting pedestrian flows.
Section 3 provides a detailed description of the experimental setup and the analysis methods. Qualitative, as well as quantitative, discussions on the results are provided in
Section 4. Finally, in
Section 5, the conclusions are presented.
2. Related Works
Various influencing factors, such as flow ratio, boundary conditions, the width of the walking facility, intersecting angles, and human factors (collective, as well as individual) have been studied in the past to provide insight into the characteristics of intersecting pedestrian flows using laboratory experiments. The first human subject-based experiments for intersecting pedestrian streams were carried out in the Netherlands by Dameen and Hoogendoorn [
29]. They experimented with 90° and 180° angled crossings with single entries and multiple entries for varying flow ratios. They identified process variables such as free-flow speed, walking direction, density, and bottlenecks to comprehensively describe the movement of pedestrians.
Helbing et al. [
3] reported an experiment considering a 90° intersecting scenario and then simulated such behaviors using the social force model [
30]. They found that there were lane formations in intersecting regions and these lanes or stripes were formed at an angle of 45° for the intersection of two unidirectional flows. Similar observations regarding diagonal pattern formation were also made by Hoogendoorn and Daamen [
31] for crossing movements. However, the intersection of three or more pedestrian streams produced short-lived patterns, including rotary traffic in clockwise or counterclockwise directions, dominant pedestrian flow in one direction with the other direction clogged, stripe formation, and blockages [
3]. The formation of a dominant pedestrian flow in one direction with the other direction being clogged was also observed in the experiments conducted by Dias et al. [
11] using ants under an induced panic situation. Nevertheless, the other patterns, e.g., diagonal stripes, were not observed in intersecting streams of ants. Recently, a quantitative analysis of the stripe formation in the intersection area concerning density conditions was provided by Zanlungo et al. [
32]. Mullick et al. [
33] introduced computational methods to analyze the striped patterns, in addition to analyzing the geometric properties of the stripes. Bode et al. [
34] found that, in four-way intersecting streams, the relative dominance of the streams can switch stochastically, and the jams in some streams can coincide with higher flow rates in other streams. Helbing et al. [
3] also proposed improvements for the intersection of two bidirectional flow configurations of pedestrian flow by providing obstacles in the center of the junction.
The headway–speed relationship for intersecting flows with a crossing angle of 90° and a flow ratio of 50:50 was investigated by Asano et al. [
18] in Japan. The tendency of decreasing average speeds in small headways was found to be statistically not significant. Crossing configurations of 45°, 90°, 135°, and 180° were also used and the speed–density relationship at the crossing point was also explored in this study. They found that for 90° and 135° scenarios, even for lower flow levels, the speeds of pedestrians were affected by the crossing angles. Wong et al. [
6] proposed a pedestrian stream model for crossing pedestrian flows using the data collected from a controlled experiment. In the experiment, they considered four crossing angles, i.e., 45°, 90°, 135°, and 180°. They explained that the capacity decreases with an increase in the crossing angle. The outcomes of this study further explained that the rate of speed reduction is greater when the intersection angle increases from 0° to 90°; however, the rate of speed reduction became lower when the angle exceeds 90°. Versluis [
35] studied the interaction between intersecting pedestrians at a microscopic level, i.e., person-to-person and person-to-small group interactions. The study mainly focused on 0°, 45°, 90°, 135°, and 180° crossing scenarios. Individual pedestrians performed interaction movements in 88% of cases. Moreover, men were found to have a strong preference for passing through the right-hand side when compared to women.
Comparing the speed–density relationships for 90° and 180° intersections in varying conditions for blocked and unblocked sides, Zhang and Seyfried [
36] concluded that the intersection angle has no impact on the fundamental diagrams, at least for these angles. As they explained, the collision avoidance patterns are not influenced by the intersection angle and this may be the reason for the above observation.
The characteristics of oblique pedestrian streams were studied by Sun et al. [
37] quantitatively and qualitatively by varying the pedestrian volume levels and intersecting angles. A total of five intersection angles, i.e., 30°, 60°, 90°, 120°, and 150°, were considered in this study and showed that, for low flow rates, 30° was more efficient compared to the other angles. They further explained that the distance moved by individual pedestrians before initiating the crossing maneuver increased with an increase in flow due to less availability of gaps. Cao et al. [
38] compared the pedestrian fundamental diagrams from China and Germany. The fundamental diagrams showed a considerable difference, which is attributed to the difference in average body dimensions of Westerners and Asians, motivation, and competitiveness of participants in these experiments. Lian et al. [
19] explored four-directional intersecting pedestrian flows for 90° crossing configurations using the data collected through a controlled experiment. The results from this study indicate that the local density at the middle of the intersection could reach up to 10 peds/m
2 and the densities decrease towards the corridors. The speeds and flows of this study were consistent with the speeds reported by Helbing et al. [
39] for the local densities of less than 5 peds/m
2. However, when the local density exceeded 5 peds/m
2, flows and speeds were higher in Lian et al. [
19].
Controlled laboratory experiments have been conducted in the past for intersecting flows using animal subjects, representing the panic situation that cannot be done using human subjects due to ethical and safety reasons [
40]. Being a non-invasive method, using non-human biological entities may provide insight into human collective behaviors. Dias et al. [
11] conducted controlled experiments using ants to investigate crossing behaviors in a panic situation. One of the main observations in this study was that one stream is blocked, while the other stream moves forward, i.e., there is a transition of the clogging and shockwave between the two streams. The clogging period was observed to be unsymmetrical, with substantial variations in the two streams. This phenomenon, if arising in intersecting corridors of pedestrians, could pose a dangerous situation wherein the crowd forces could increase to unacceptable levels.
Aghabayk et al. [
28] investigated the impact of intersection angles and desired speed on the outflow rate and evacuation time of crossing configurations using the data collected through a controlled experiment. The paper considered three intersection angles, i.e., 30°, 90°, and 150°, and two desired speed levels, i.e., normal-speed walking and jogging. Such crossing configurations can be observed in numerous real-world situations, such as commuters intersecting each other in train/metro stations or crossing on sidewalks or intersections. They used a deviation of 30° from straight movement and straight bilateral movement for their study. This choice of angle also helps in providing a comparison with the existing literature. Furthermore, as the intersection angle rises from 90° to 180°, the area of potential conflict increases, and the conflict area is least for 90°. Therefore, it is essential to understand the effects of both acute and obtuse angles. The outcomes of this study indicate that a 30° intersection is the most efficient configuration compared to 90° and 150°, as a 30° intersection displayed higher flow rates and lower delays for both speed levels. Furthermore, for normal-speed walking cases, the walking speed steadily decreased with the increasing intersection angle. In contrast, for jogging cases, a 7% increase in average walking speed was noted when the angle was increased from 90° to 150°. As described in this study, this increment might be due to the agitation of pedestrians who were stuck at the junction. That is, after passing the congested region, the pedestrians tend to regain speed faster.
It can be noted that a wide range of intersecting angles under varying flow ratios and desired speed levels have been considered in previous studies to explore pedestrian behaviors at crossing configurations. These studies generally examined average speeds and flows, as well as the capacity of crossing configurations. Very few studies, e.g., Lian et al. [
19], presented the distribution of the densities within the bottleneck area of the intersection. However, detailed evaluations of the characteristics of the distribution of the congestion have not been provided. To identify the congestion occurrence mechanism and bottleneck effect associated with complex geometrical settings, detailed examinations of the distribution of speeds and densities under different walking conditions are necessary. Understanding the bottleneck effect and congestion mechanisms is critical for the safe and efficient design of pedestrian facilities, especially to avoid undesirable situations such as stampedes. Considering such applications, this study uses the data collected through the controlled experiment by Aghabayk et al. [
28], which considered three intersection configurations (30°, 90°, and 150° intersection angles) and two desired speed levels (normal-speed walking and jogging) to comprehensively investigate the spatial variation of individual speeds and delays. The details of the experiment and the analysis methods are discussed in the next section.
3. Methods
3.1. Controlled Experiment and Trajectory Data
A controlled laboratory experiment was conducted at the University of Tehran, in November 2016, with 89 participants (62 males and 27 females). The age of the participants in this experiment ranged from 13 to 84 years. Three intersecting angles, i.e., 30°, 90°, and 150°, were considered for the experiment. For each angle setup, the pedestrians were divided into two groups of equal numbers. The experiments were conducted under two speed conditions, i.e., normal-speed walking and slow-speed running or jogging. During normal-speed walking scenarios, experiment participants were instructed to walk at their normal walking speed, and during slow-running scenarios, the pedestrians were asked to jog or run slowly through the experiment configurations. Each of the normal walking and jogging conditions was repeated three times, making 18 total experiments for the unblocked condition (3 angles × 2 walking speeds × 3 repetitions). The participants were stationed randomly in the two intersecting groups to eliminate any bias and to prevent the participants from learning the movement strategies while the experiments were being repeated.
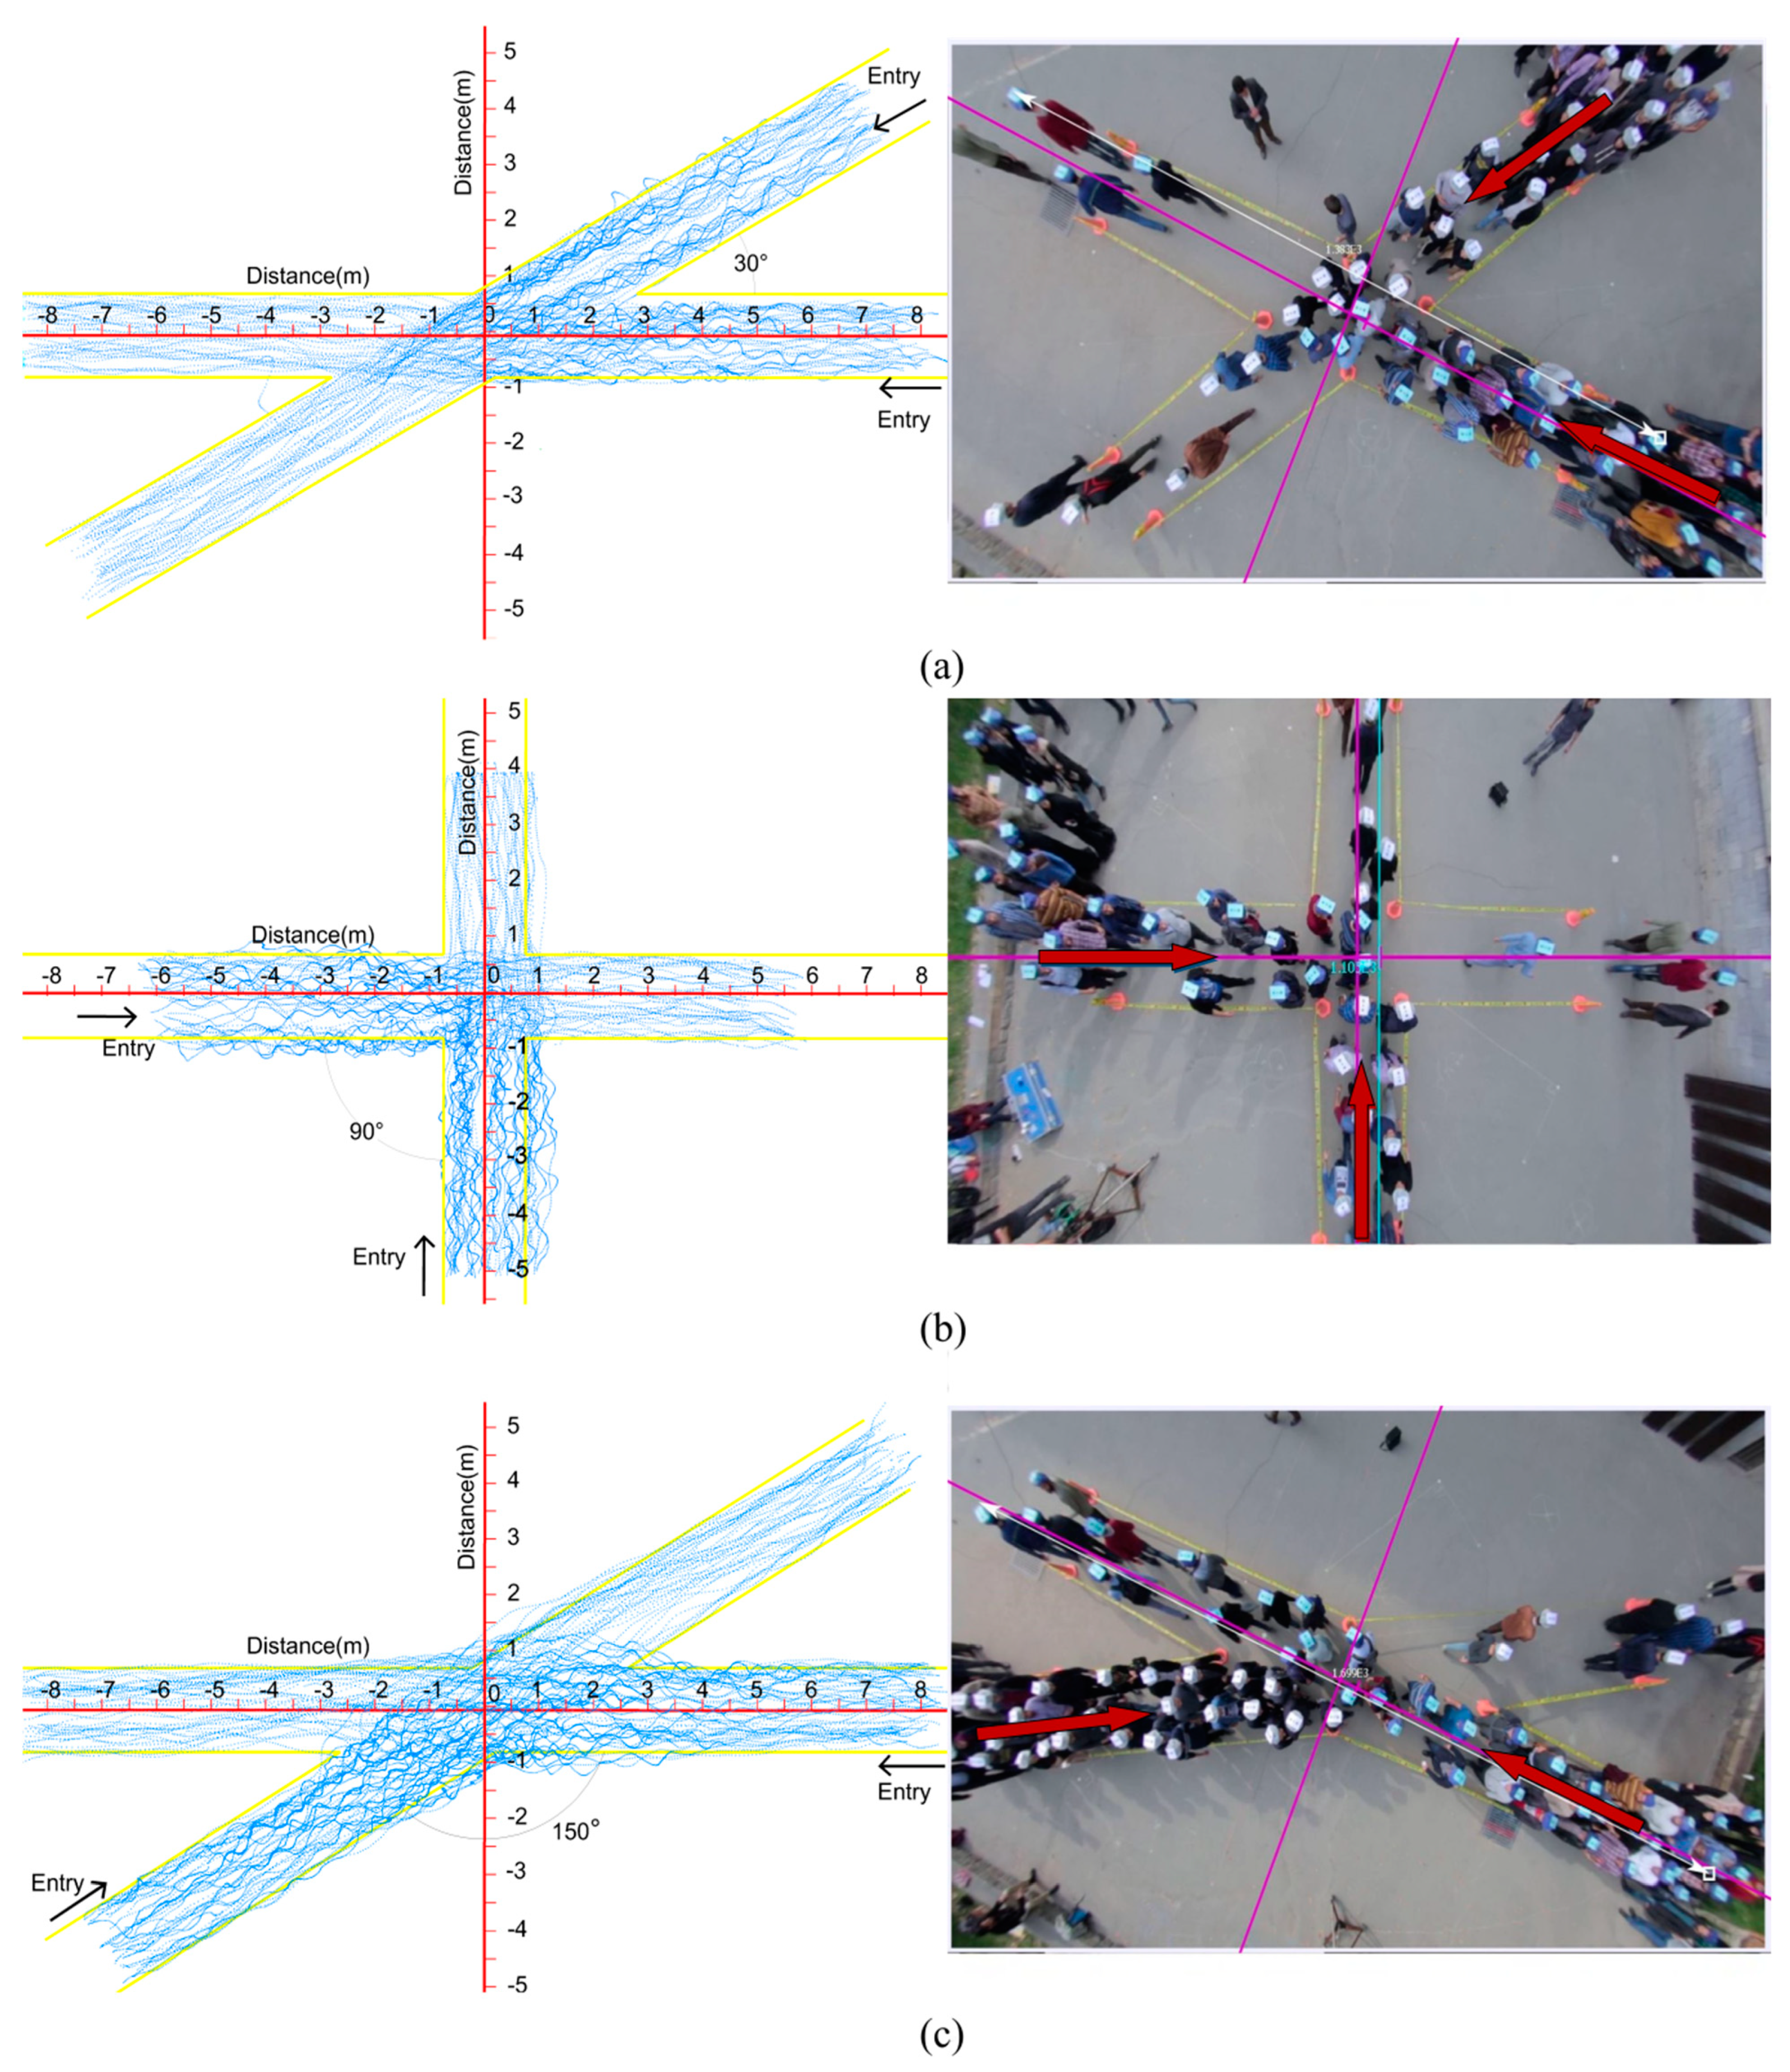
The intersecting walkways were created using tapes and traffic cones. Each walkway had a uniform width of 1.5 m with a minimum length of 8 m. The width of the walkway was just enough to allow a maximum of three participants to walk/jog side by side. For better visibility during data extraction, 44 participants (Group 1) were given white hats and 45 participants (Group 2) were given blue hats. The entire experiment was filmed using a crane-mounted camera placed exactly above the center point of the junction at a height of 8 m. The video was recorded with 25 frames per second in Full HD quality.
Figure 1 shows the trajectories and screenshots obtained for the three intersection angle scenarios. The collected trajectory dataset was used in the present study to explore the spatial distribution of speeds and time to target for different crossing angles under two evacuation speeds.
3.2. Analysis Methods
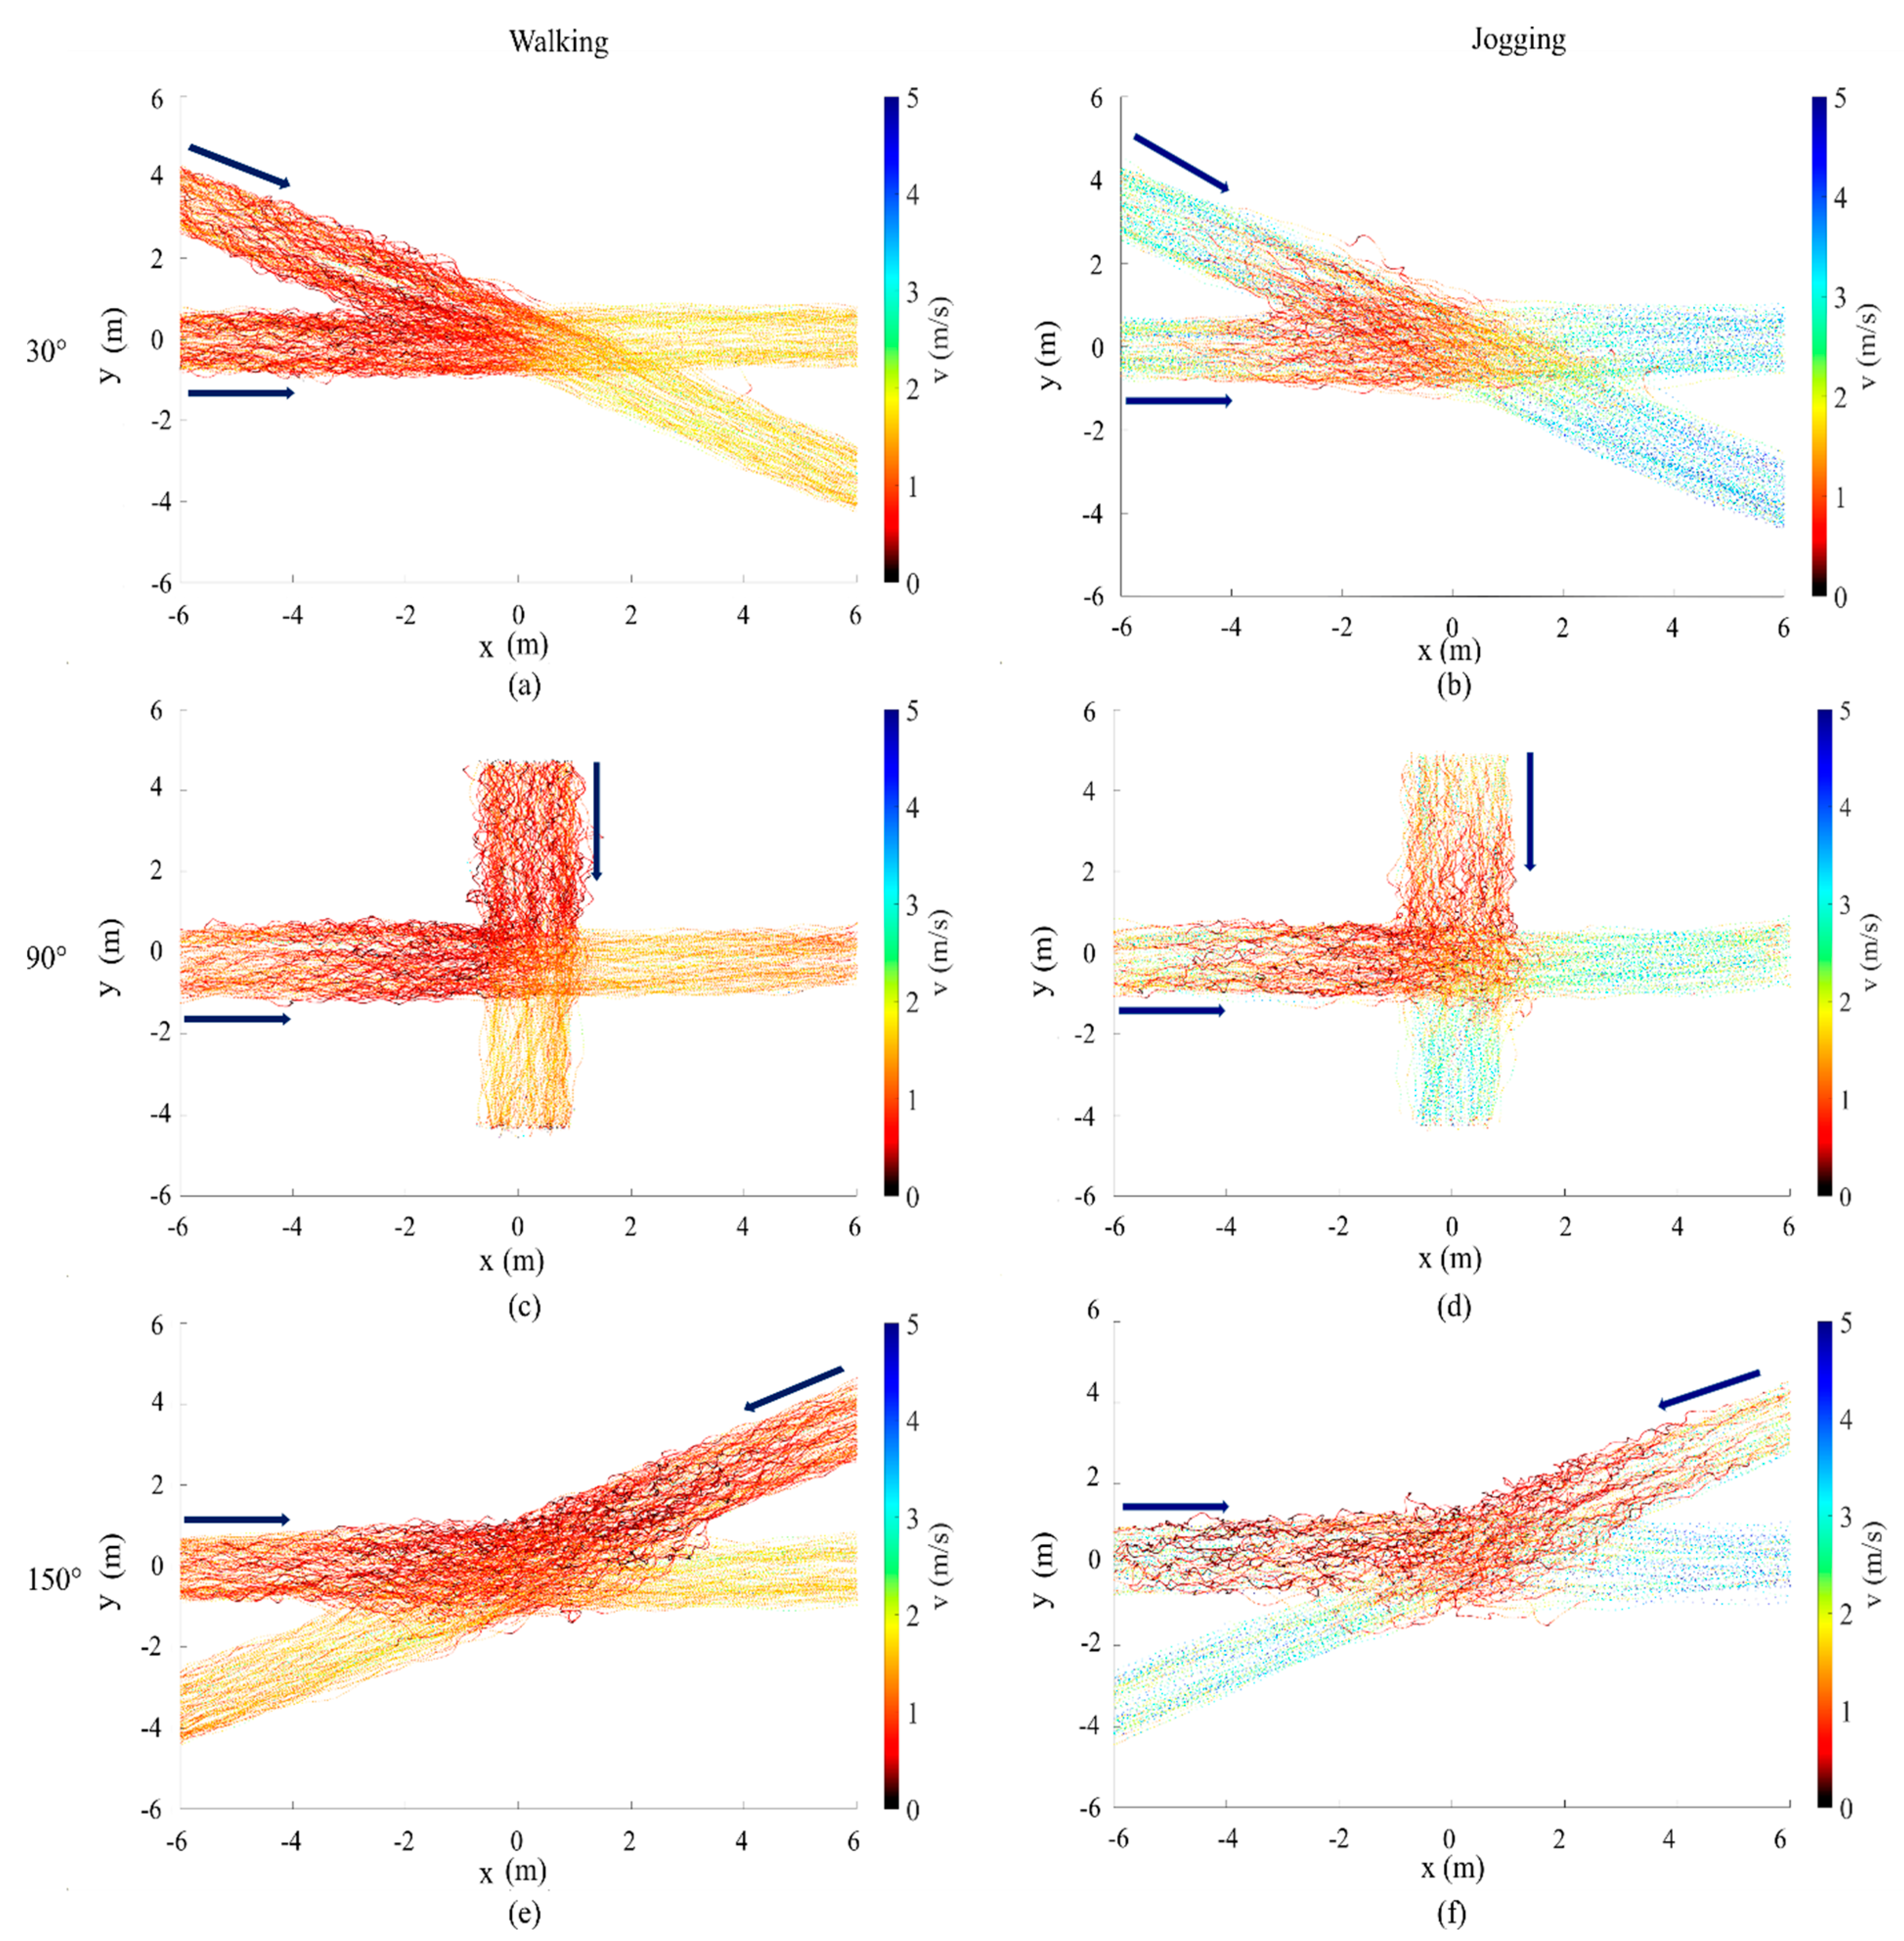
The trajectories were extracted from the recorded video footage using video tracking software (Tracker®). The extracted trajectory data consisted of the location (x, y coordinates) of each participant at every 0.04 s time interval. The raw data that consisted of trajectory points (x and y coordinates) at every 0.04 s were imported to MATLAB for further analysis. The speeds were averaged for every 5th time frame for each participant to obtain the average speed at each location. The average speed was plotted for all scenarios and directions (direction 1 and direction 2) for each of the three experimental trials. It was noted that the trends were similar for each of the six conditions for all the scenarios except for two conditions (90° jogging—trial 2—direction 1 and 150° jogging—trial 3—direction 2). The 90° jogging—trial 2—direction 1 showed a sharp decrease in speed followed by a short length of congestion and the 150° jogging—trial 3—direction 2 showed a drastic reduction in speed very close to the starting point of the trial, followed by a very flat and prolonged area of congestion. Such trials that deviated significantly from other trials were omitted from the rest of the analysis. The average speeds were plotted for each angle and for the different speed levels to analyze the effect of angle and desired speed on the spatial distribution of instantaneous speeds. Different colors were used to show distinct speed ranges using the MATLAB plot function.
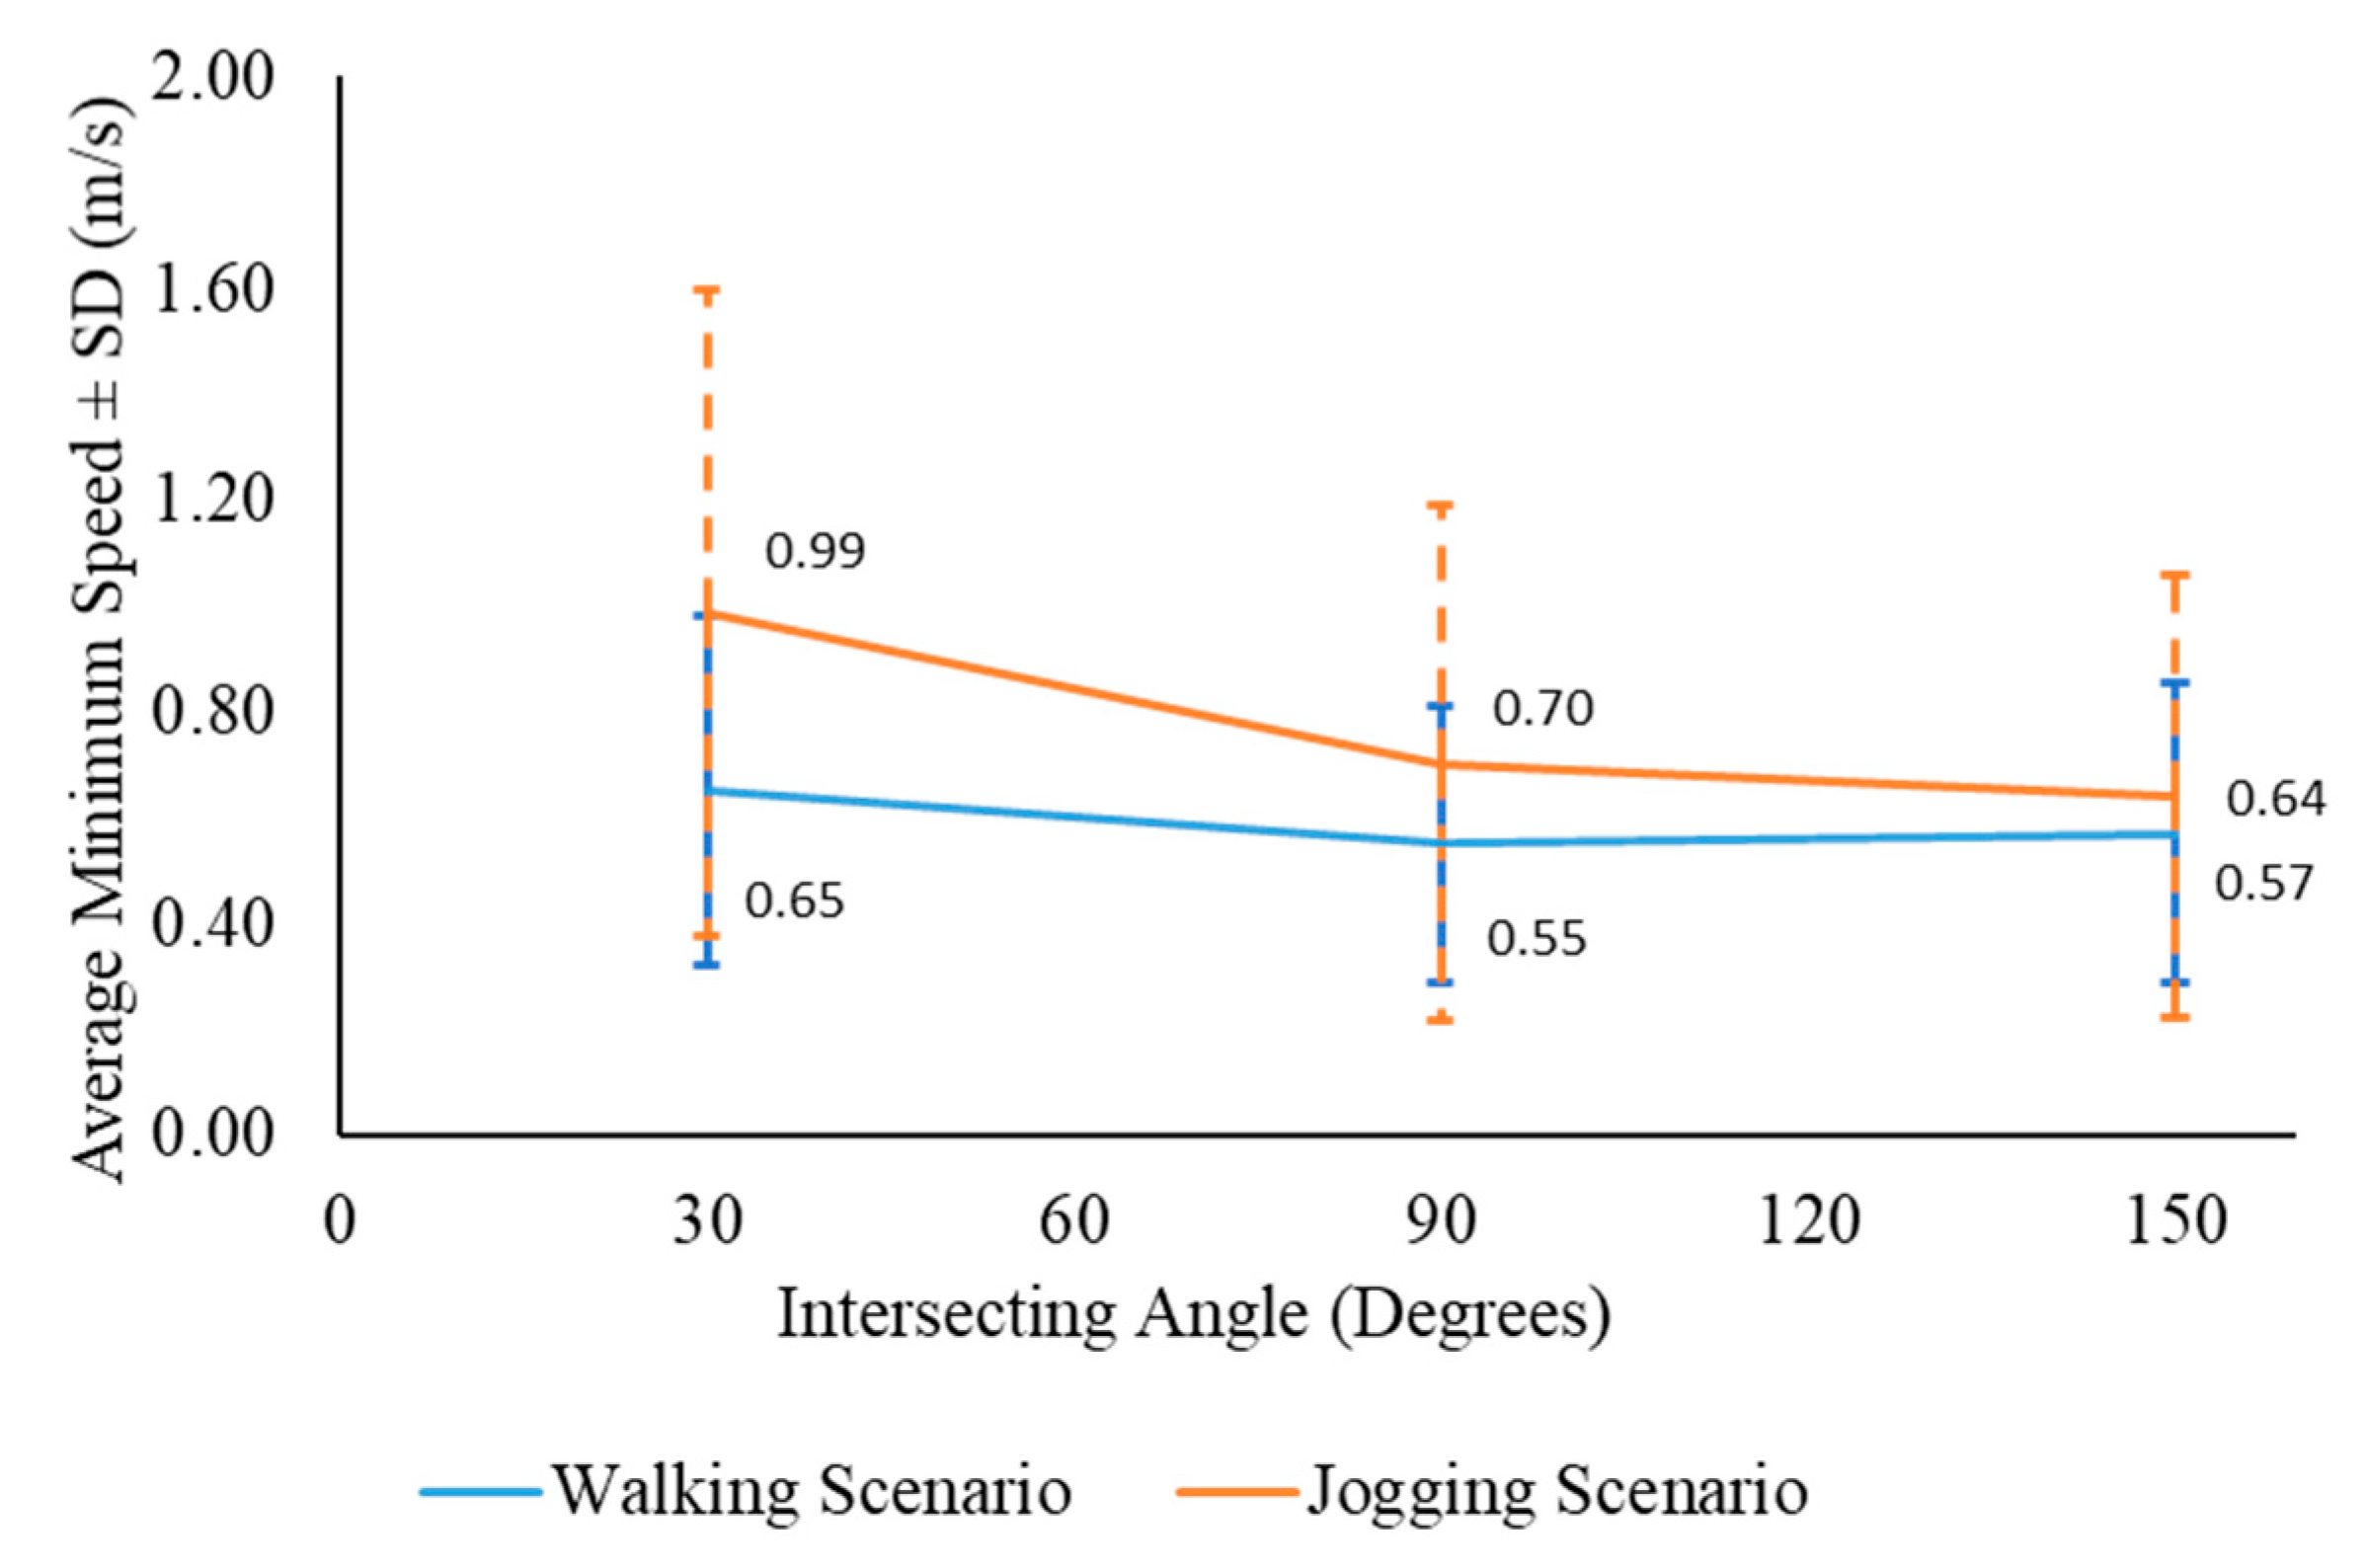
The trajectories (x, y) for all the six scenarios (3 angles × 2-speed levels) at every 0.04 s were plotted against instantaneous velocity (v) using MATLAB software. Further analysis of spatial variation of speed was carried out using the instantaneous speeds throughout the corridor. Robust-LOESS (LOcally Estimated Scatterplot Smoothing) was used to estimate the smoothed or average speed profiles. The RLOESS method uses a locally weighted linear regression to smooth data by applying a quadratic polynomial. It is considered local, as the smoothed value is defined by nearby data points within the specified span. The robust function is a weight function that makes this process resistant to outliers. The unpaired two-sample t-tests were conducted to statistically compare the average minimum speeds for different angles and speeds.
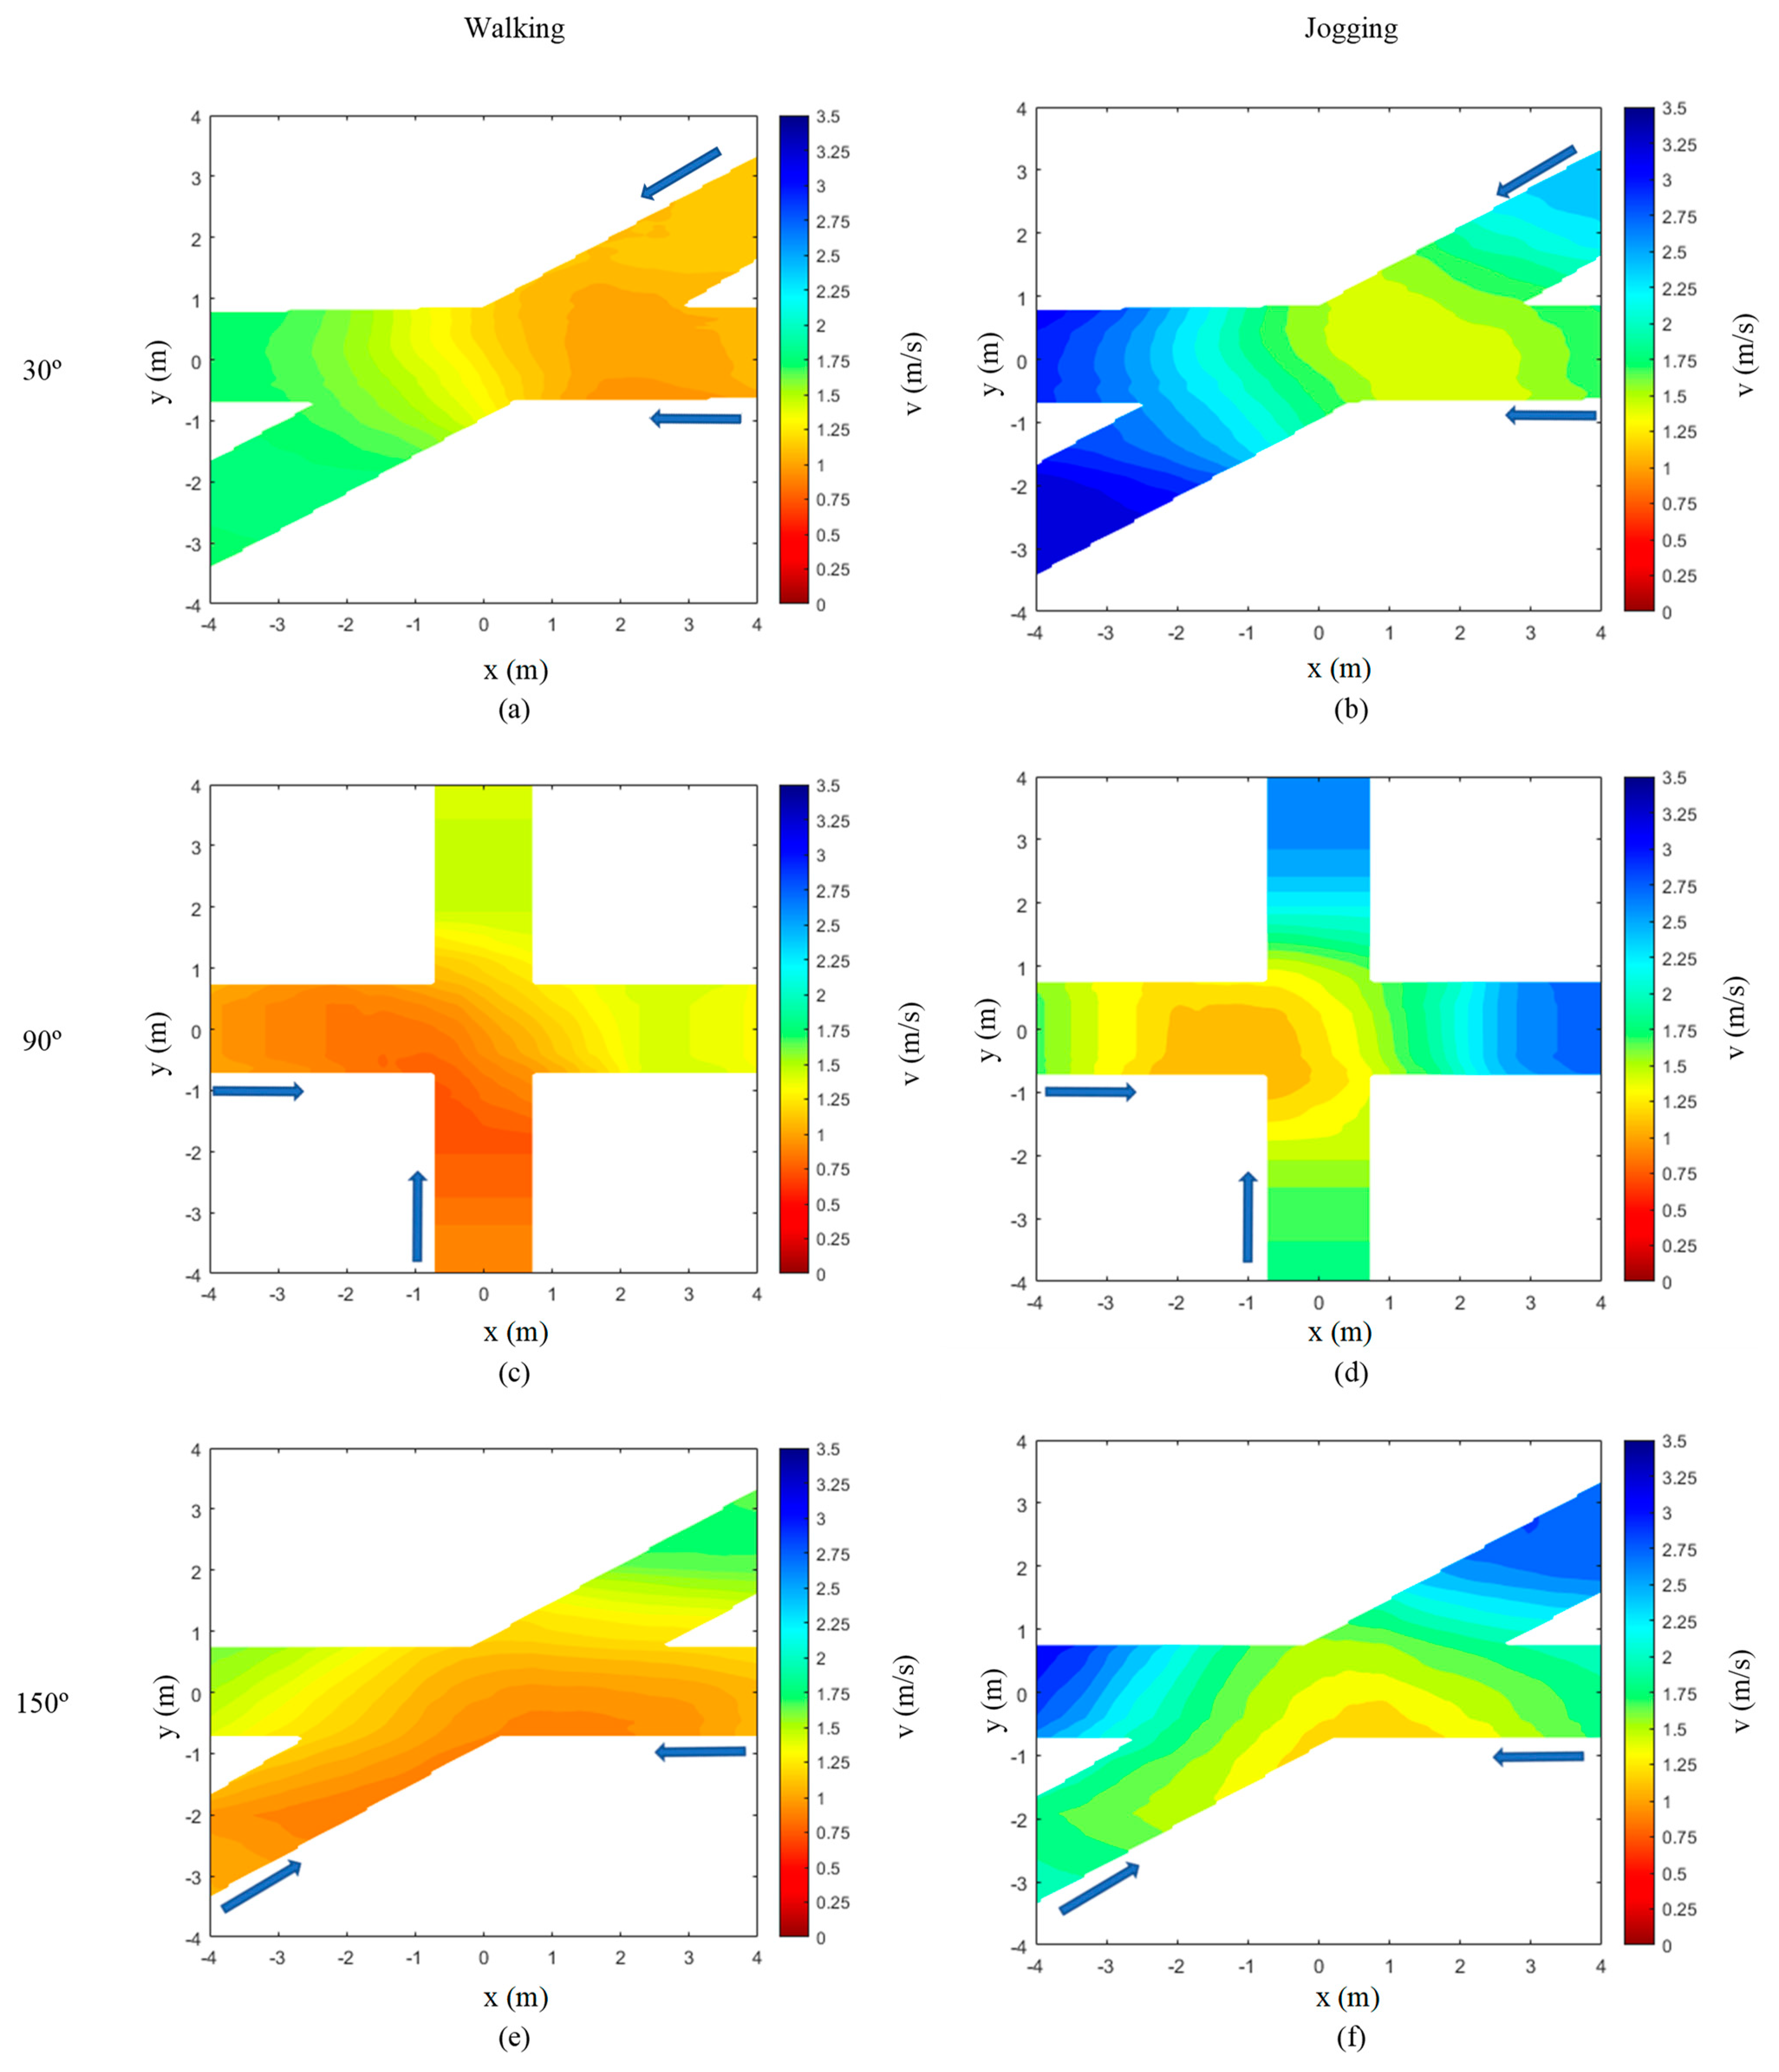
The heat maps were generated using MATLAB software for the x, y, and v values for all the angles and the different walking conditions adopted in the study. The heat maps were generated using a mesh size of 250 points and the data mean was filtered around 15 points in four directions (top, bottom, left, and right). Qualitative analysis was performed using the above-mentioned heat maps to identify the critical locations at the intersection and corridors where the speed variation is significant.
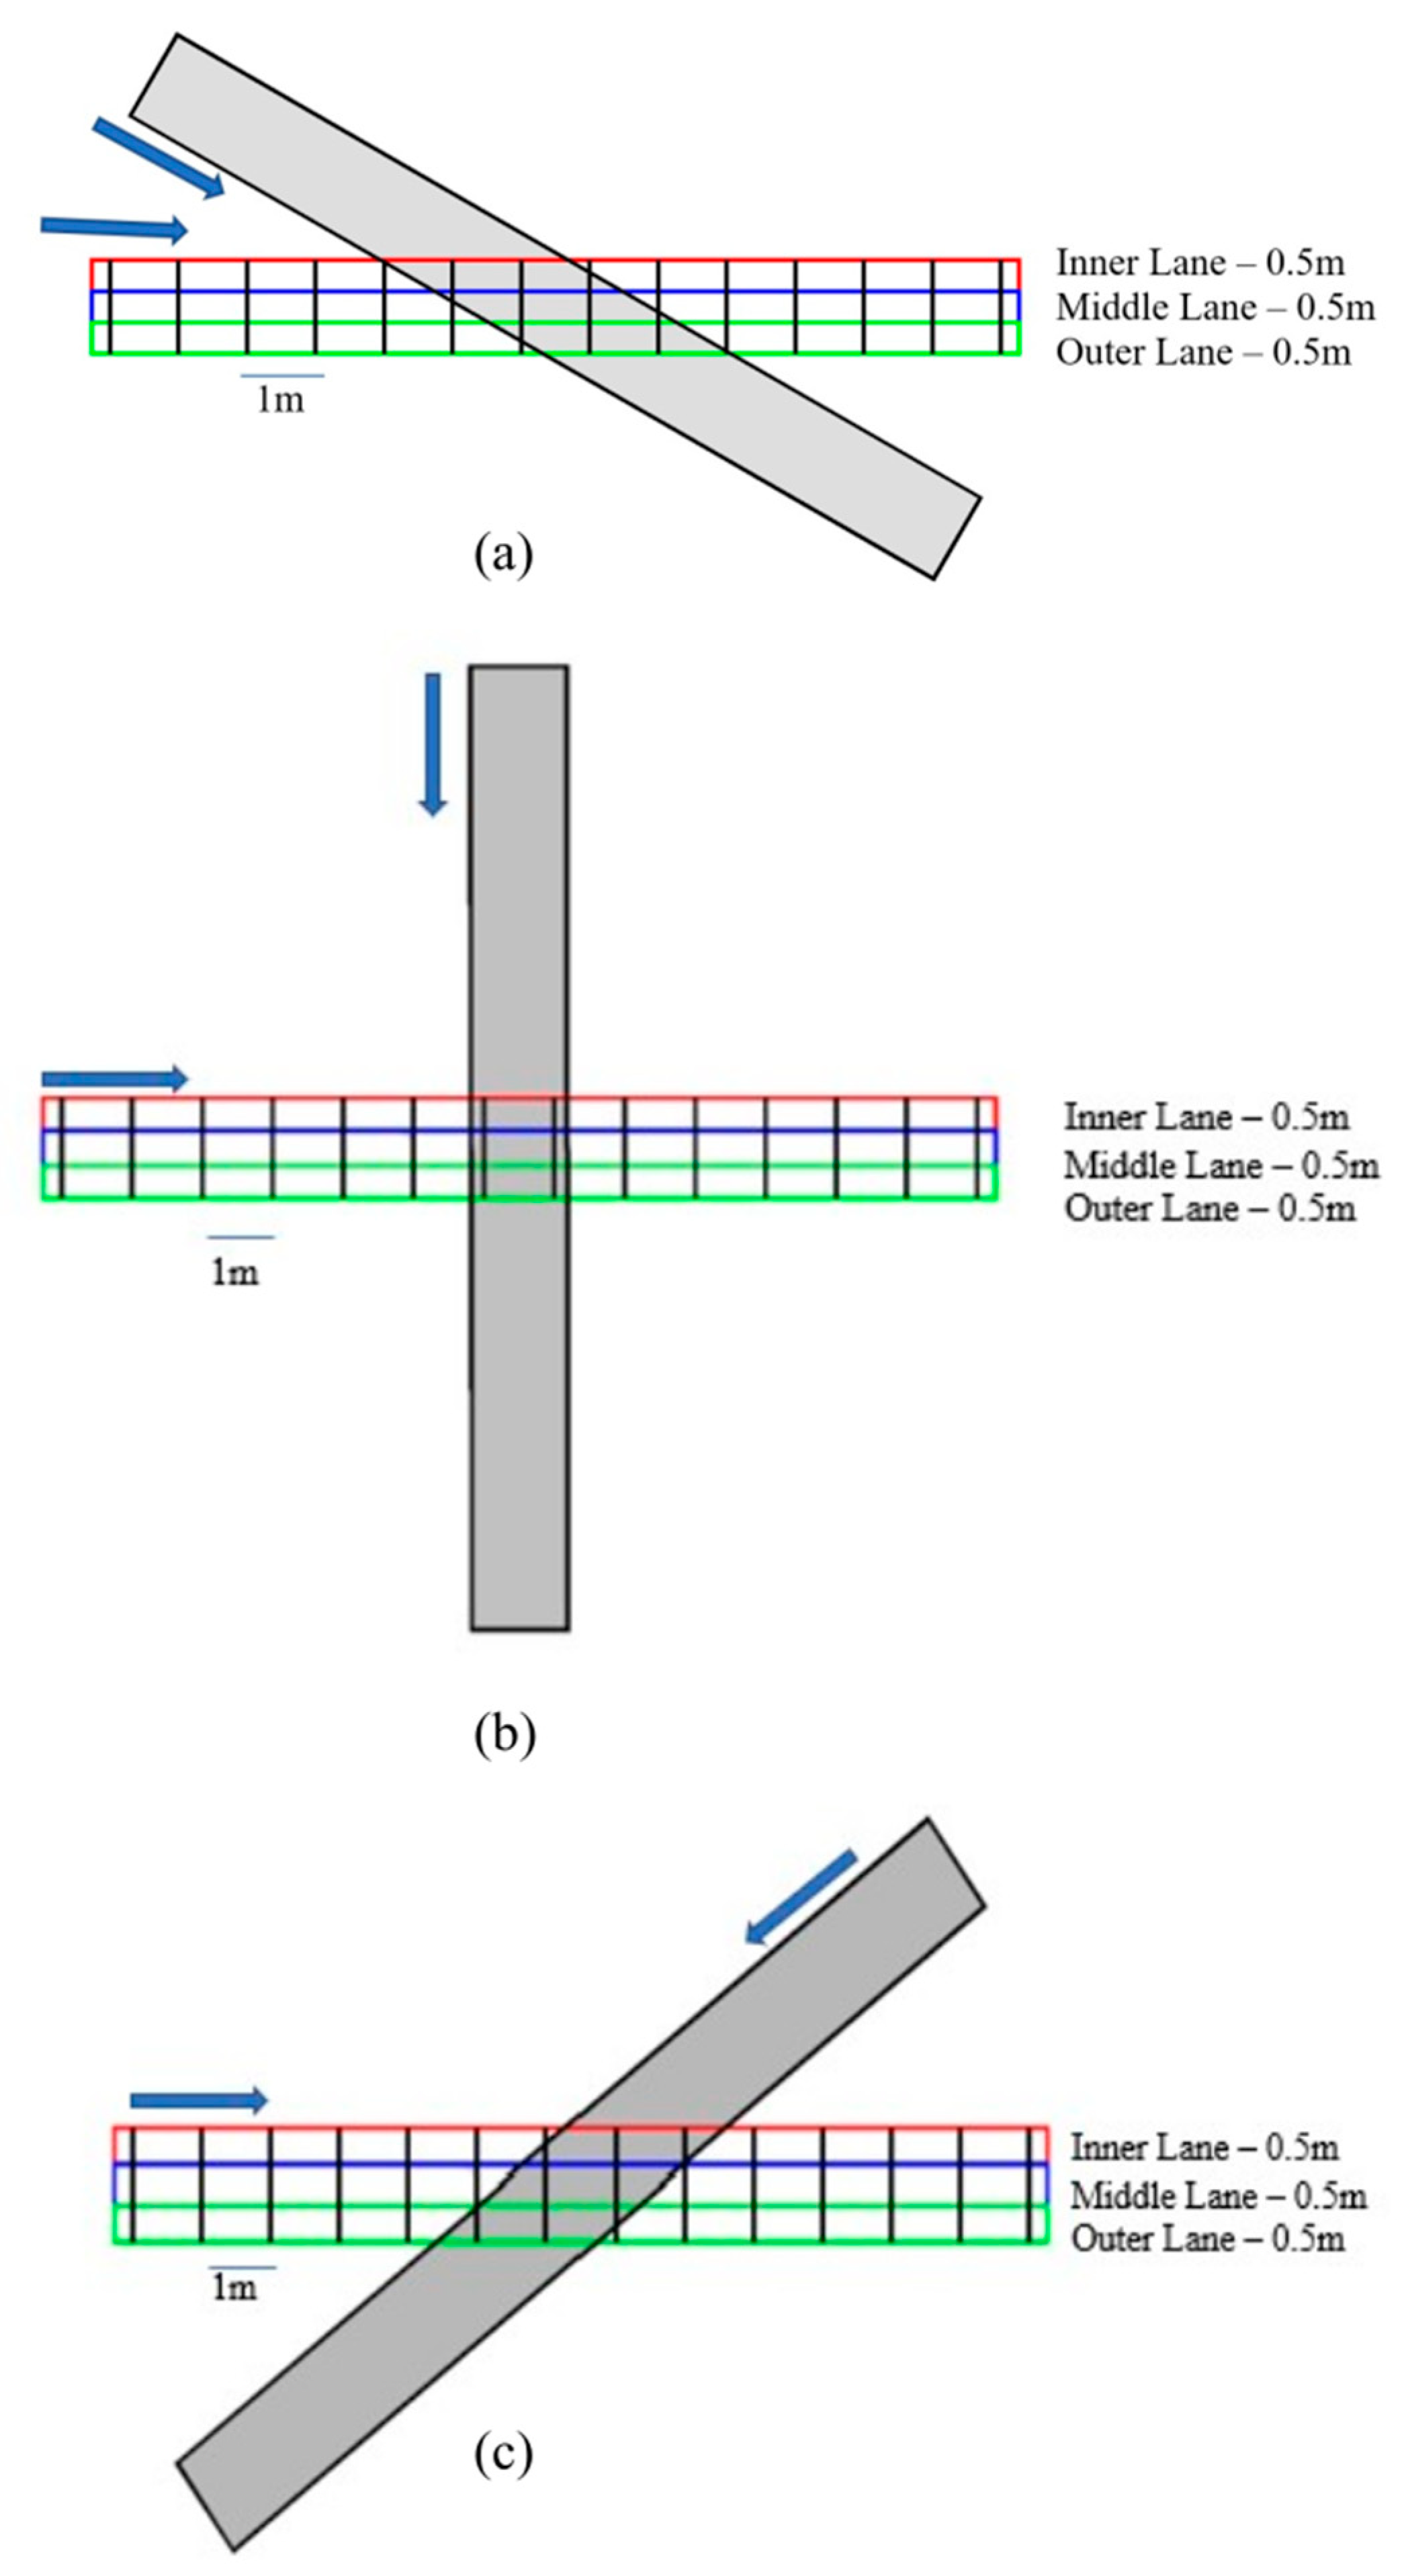
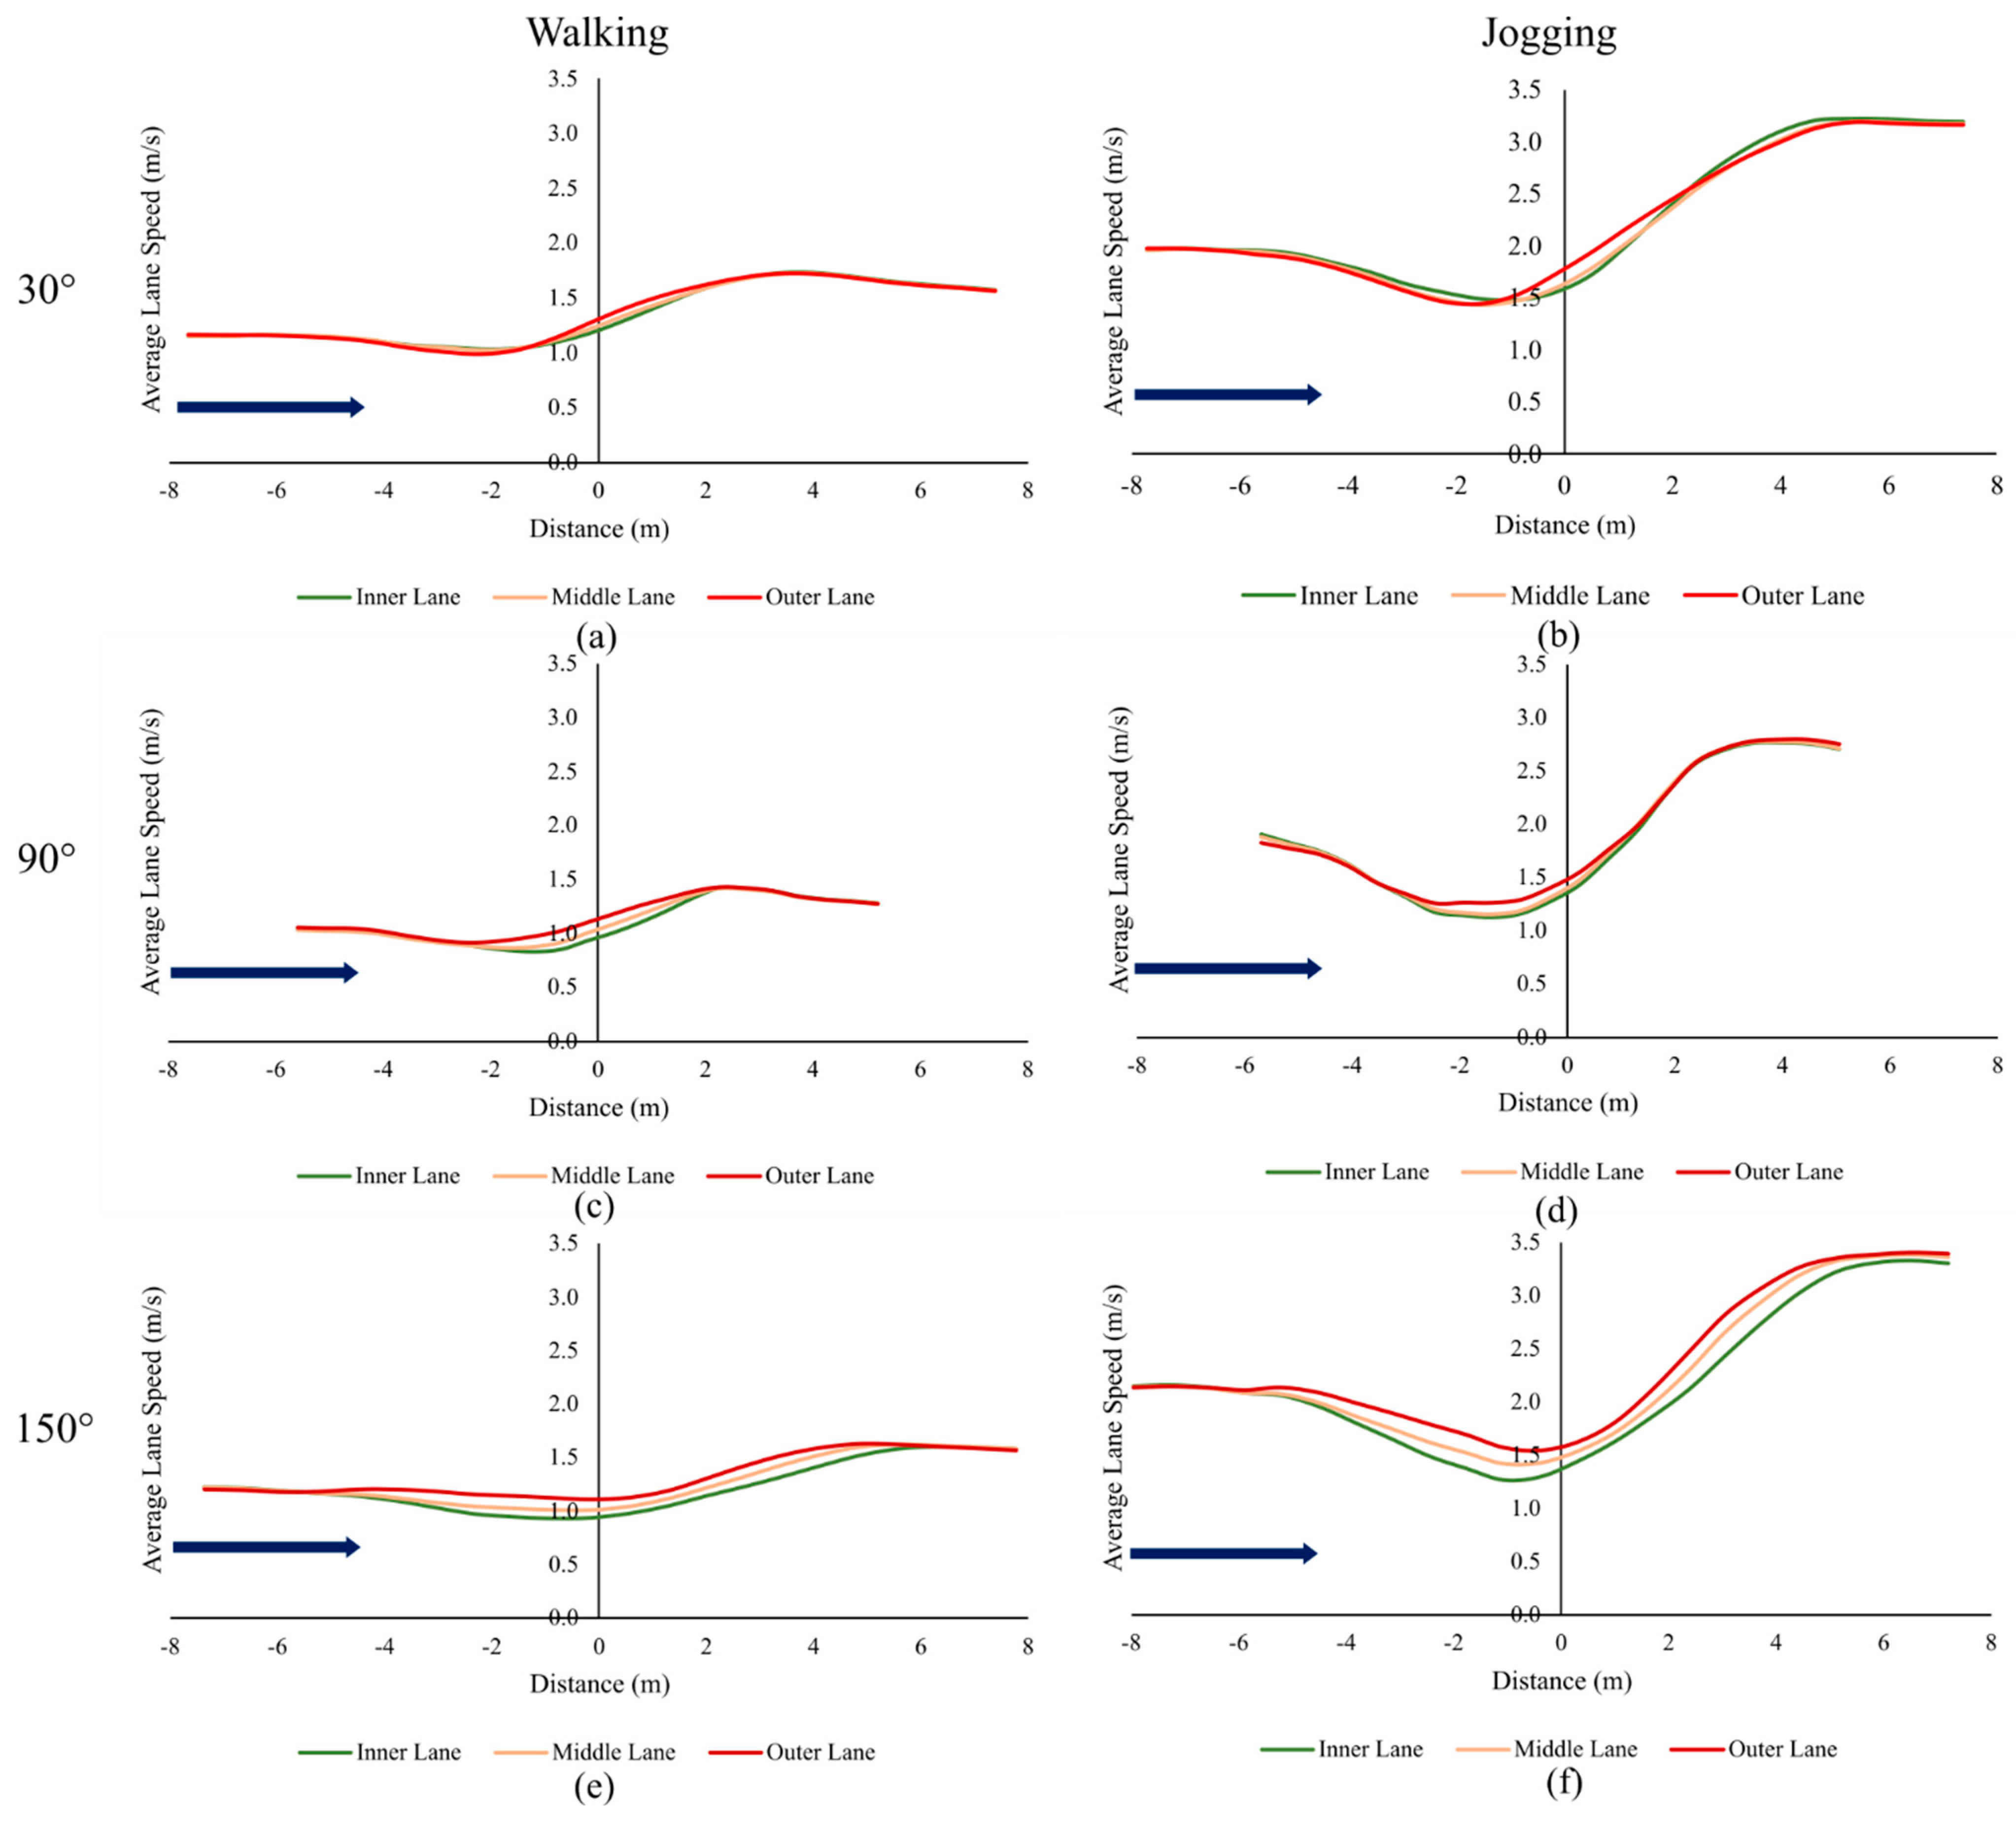
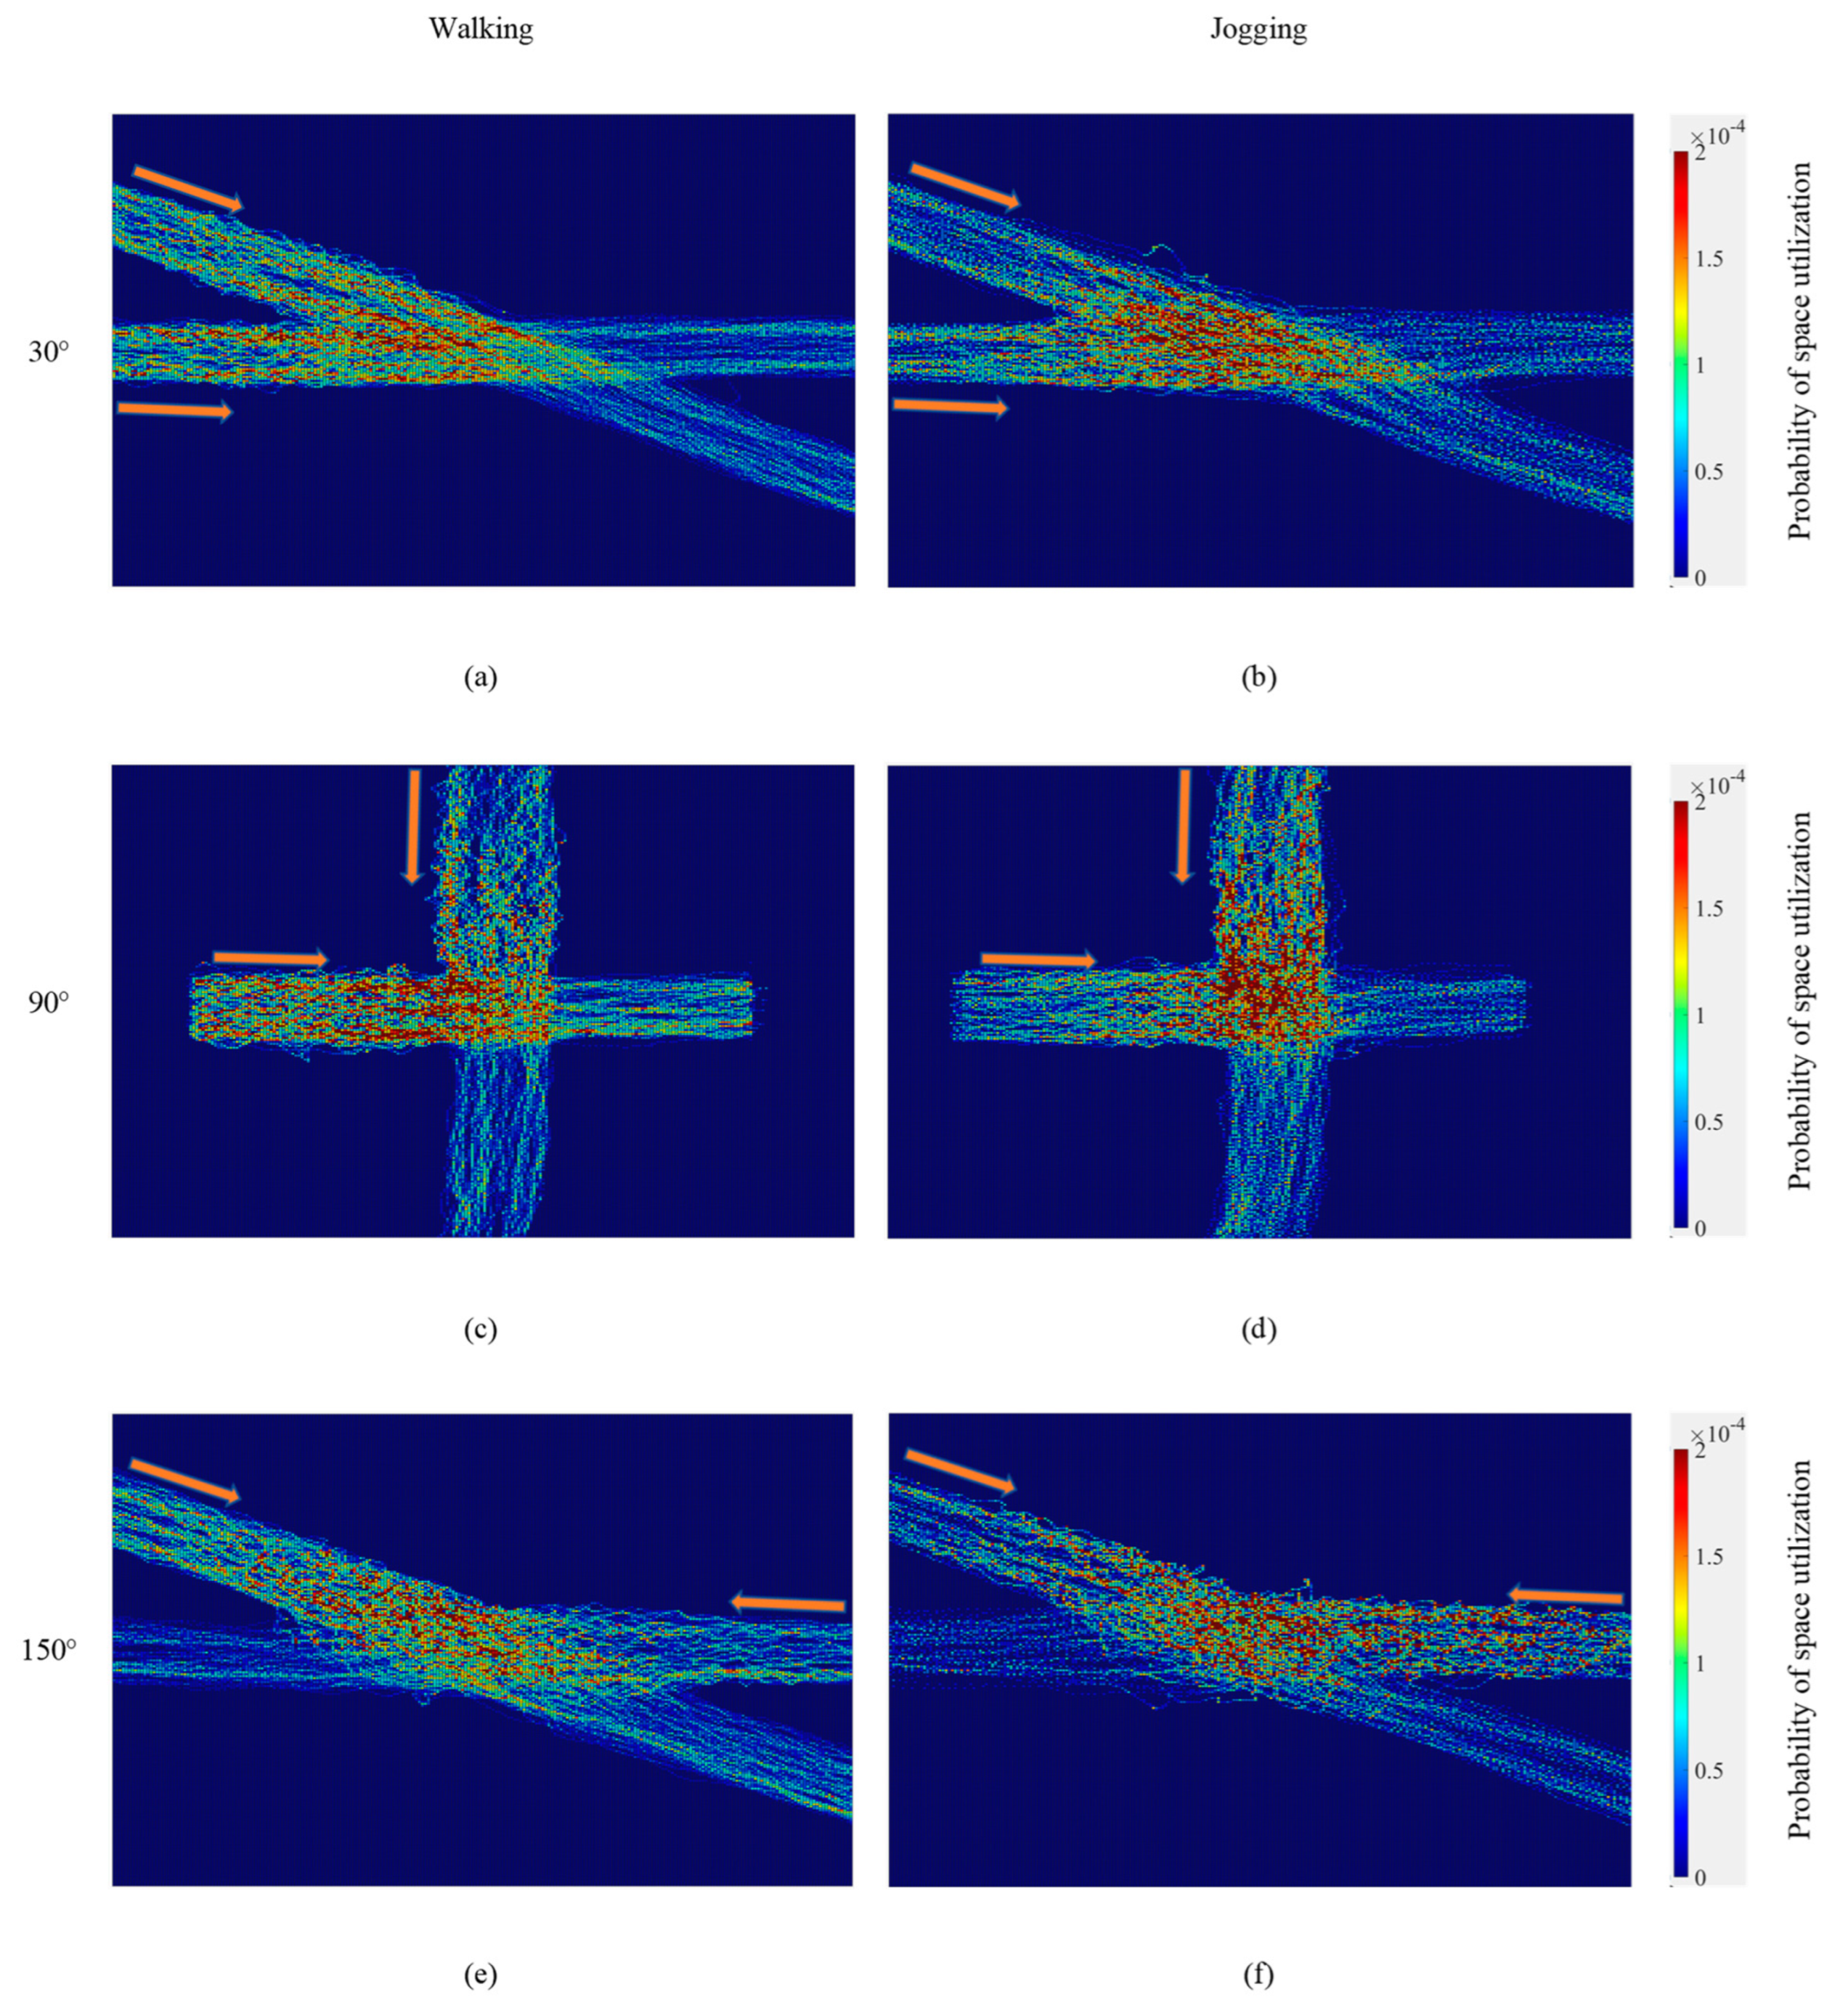
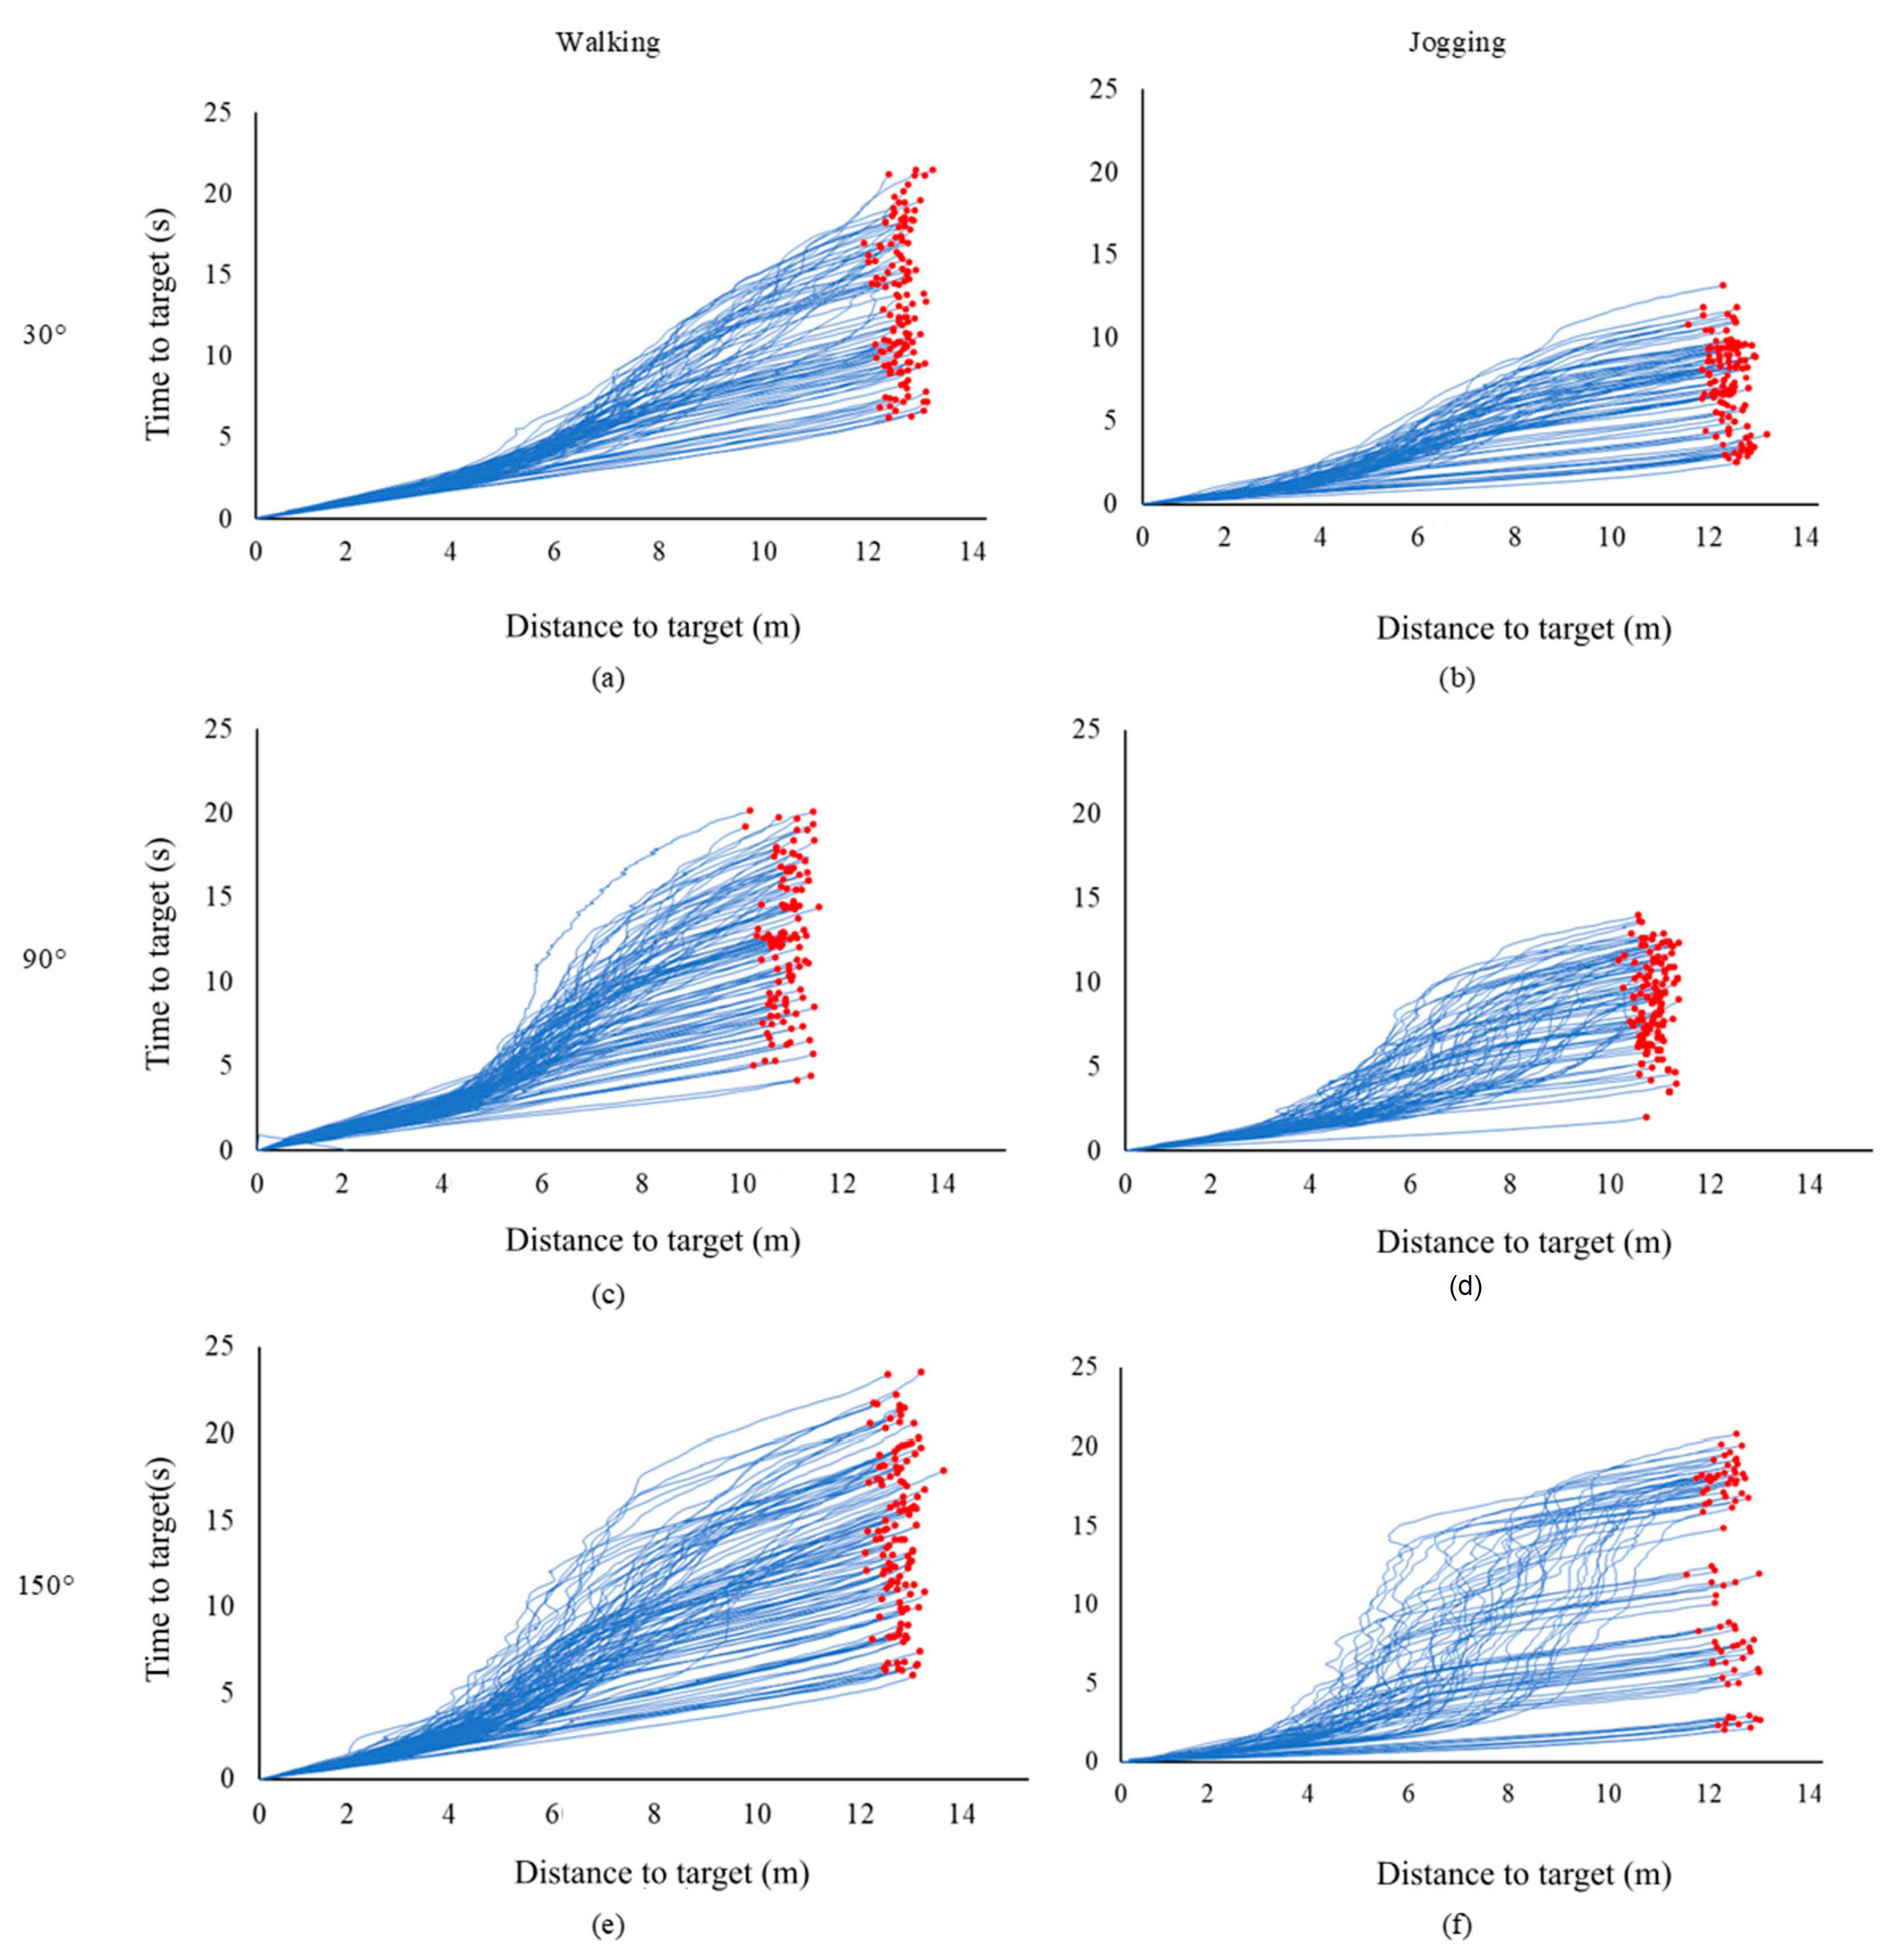
To analyze the lateral variation of speed, the corridors were divided into three lanes (inner, middle, and outer lanes) of 0.5 m width for each of the six scenarios. The variation of speed in each of the lanes was plotted against distance for comparing the differences. Furthermore, the space utilization of the walkway and the intersection was analyzed by using heat maps of the probability of the trajectory points. A time-to-target analysis was also carried out to estimate the delay caused to the pedestrians due to intersecting streams of pedestrians and the resulting congestion. The distance versus the time taken to complete the trajectory of individual pedestrians was used for this analysis.
5. Conclusions
Studies on pedestrian behaviors associated with complex geometrical settings could aid in the enhancement of pedestrian facility design to maximize the safety and efficiency of crowd flows. Furthermore, analyses of empirical data could be useful in improving pedestrian crowd modeling and simulation platforms that are commonly used to explore evacuation scenarios. In this study, the spatial variation of collective speeds, variations of the time to target, and the space utilization at crossing configurations were investigated using the trajectory data collected through a controlled experiment that considered three intersection angles, i.e., 30°, 90°, and 150°, and two desired speed levels, i.e., normal-speed walking and jogging. The comparison of average speed profiles along the corridors, minimum speeds, receding speeds, and the time to target showed that the 30° crossing configuration performed better than the 90°and 150° setups for both walking and jogging conditions.
The spatial analysis of speeds using speed heat maps and lane-based speed profiles indicated that the speed distributions along the corridors and intersection areas are not uniform and symmetric. Speeds were lower in inner lanes compared to outer lanes, indicating that stampedes could occur at the inner corners of the intersection. Furthermore, the speed distributions on the two inflow corridors were not symmetric, even though the number of pedestrians approaching the intersection from the two streams was the same and the configuration was symmetric. This could be due to the complexity and asymmetric nature of the microscopic interactions of pedestrians at crossing configurations.
The time-to-target analysis revealed that lower-angled intersections have shorter evacuation times. Although the delay for the jogging cases was lower for a given intersection angle than for the walking cases, the decelerations were greater for the jogging cases. This observation implies that stampedes are more likely to occur during emergency evacuations at higher-angled intersections. Space utilization maps revealed that, for the jogging cases, self-organized patterns might disappear, resulting in disorganized flow conditions. Such disorganized flow patterns under high-speed conditions, such as emergency evacuation, could result in stampedes, especially when the intersection angle is higher.
The findings of this study are important in understanding the congestion mechanism associated with complex crowd movements at crossing configurations, particularly under evacuation conditions. Based on this understanding, countermeasures could be devised to reduce congestion and eliminate potential stampedes at crossing configurations. The results could also help to recognize the probable location of the occurrence of stampedes in pedestrian facilities. This could assist in providing improved designs for pedestrian facilities by providing suitable intersecting angles. In addition, the trajectory data and findings of this study can aid the calibration and validation of microscopic simulation models to accurately reproduce the bottleneck effects and to evaluate different scenarios associated with crossing configurations.
In this study, a crossing configuration with narrow corridors (width = 1.5 m) was considered. Furthermore, two-way crossing scenarios were considered in the experiments. For different corridor dimensions (width) and experiment conditions (e.g., four directional flows and varying flow rates), the mechanisms of congestion occurrence and the characteristics of speed distributions may differ. Furthermore, the walking behavior of pedestrians could be affected by demographic factors and cultural influences. Therefore, such aspects should also be considered in future studies. Thus, experiments at different geographical locations with varying demographic factors (e.g., inclusion of different percentages of older and younger pedestrians) could be conducted to obtain a better understanding of pedestrian behaviors.






 ,
,