Abstract
Understanding the impacts of human activities on extreme precipitation events at different socioeconomic development levels (SEDLs) is critical for humans to tackle extreme events. This research aims to investigate the temporal variations of six extreme precipitation indices (EPIs) over 2000–2018 at different SEDLs for the selected 525 sites (considering socioeconomic and weather data availability and completeness) in mainland China and to assess the impacts of SEDL on extreme precipitation events. Six EPIs were selected according to the Expert Team on Climate Change Detection and Indices (ETCCDI), which were: consecutive dry days—(CDD); consecutive wet days—(CWD); simple daily intensity index—(SDII); the 95th percentile of precipitation on wet days—(R95p); maximum 1-day precipitation—(Rx1day); Annual total wet–day precipitation—(PRCPTOT), respectively. As important human activity—indicators, population and Gross Domestic Product (GDP) in 2018 were used to classify the SEDLs. The levels of SEDL for the sites were classified as I to VI, in which the population increased from 50 to ≥1000 × 104 and the GDP increased from <100 to ≥10,000 × 108 RMB. The Pearson correlations between the linear slopes (LS) of population (PopuLS) or GDPLS and six EPIs at different SEDLs were conducted to show the impacts of human activities on changes of EPIs over 2000–2018. The variations of six EPILS with the SEDLs were further studied with the Pearson correlation. The results showed that: (1) High risks of extreme precipitation events occurred at SEDL VI, which was highly affected by human activity; and SDII, R95p, Rx1day and PRCPTOT were the highest in 2016, being 15.2 mm day−1, 545.9 mm, 159.8 mm and 1617.9 mm. (2) There were higher risks of drought occurring for SEDL I, which was least affected by human activity; and three EPIs (R95p, Rx1day and PRCPTOT) were the lowest in 2011, being 156.9 mm, 53.1 mm and 601.6 mm. (3) As the SEDL increased from I to VI, the five EPILS (except CWD) increased and implied increasing risks of extreme flooding events. This research provided useful references for assessing comprehensive influences of human activities on extreme precipitation events.
1. Introduction
There is a broad agreement that the global climate is changing and human activities have led to significant increases of global surface temperatures [,]. Climate change is mainly reflected in the statistically different performance of climate elements (such as precipitation, temperature, radiative forcing, etc.) over a long period [,]. In the past centuries, the global surface average temperature has increased by 0.74 °C, and there will be a trend of accelerated warming in the future. The area of dry regions in the world increased by approximately 1.74% per decade over 1950–2018; meanwhile, the frequency and intensity of extreme weather events such as rainstorms, droughts, floods and compound events are increasing [,,]. The probability of extreme precipitation event is low (<5%), with the characteristics of sudden and strong damage [,]. The occurrence of extreme climate events have brought huge losses to economic and social development [] and increased the population exposure [], which are worthy of attention []. In recent decades, the frequency and intensity of extreme precipitation events have been increasing globally.
Both natural climate variability and human activities affect global and regional extreme precipitation events [,,,]. The main reasons for precipitation in different regions differ widely, and multiple regions of atmospheric and sea surface temperature (SST) anomalies can affect the precipitation over a specific region [,,]. The climate aspects are complex and diverse, e.g., the physical formation mechanism of precipitation, the precipitation status and patterns, the atmospheric and sea surface temperature (SST) anomalies, the large-scale atmospheric circulations such as El Niño or tropical cyclones [,]. Human activities, such as irrigation, construction of hydraulic/hydropower engineering, industrial activities, or revegetation/disafforestation, may have changed land use, aerosol emission and eco-environments, which also affects precipitation changes []. The Metropolitan Meteorological Experiment (METROMEX), conducted in the 1970s in the United States, indicated the effects of urban environments on extreme precipitation and pointed out that the urban precipitation in summer would increase by 5–25% from the background value, and with the expansion of the urban area, the precipitation anomalies would be more obvious []. The investigation of the trends of mean and variance of maximum daily precipitation in southern China showed that human activities had a greater impact on variance of extreme precipitation than natural climate change []. In addition to sensible heat, convection, and precipitation, frequent human activities in urban areas also affect the latent heat fluxes which are closely linked to land surface energy flux partitioning, cloud and precipitation formation [,,]. In addition, the change of urban land use led to urban heat/rain islands effect. The heat island effect accelerated water vapor transport and convection, promptly concentrated toward the central urban area, and led to the occurrence of extreme precipitation [].
In order to detect the effects of climate or urbanization on precipitation/rainstorm events, researchers have proposed several methods. The most frequently used method is the urban–rural contrast method. The multivariate Copula function was also adopted to obtain the rainfall process of the designed rainfall under different return periods []. Recently, the non-stationary extreme value theory in the Bayesian framework was employed to precipitation extremes to examine the risks of heavy precipitation in Indian cities, taking into account the effects of El Niño Southern Oscillation (ENSO), Indian Ocean Dipole (IOD) and Atlantic Multi-decadal Oscillation Index (AMO) []. For improving data availability, satellite-based precipitation products have also been more and more extensively applied to capture the magnitudes of extreme precipitation events [,]. For future projection/prediction/forecasting of precipitation extremes, many future scenario models from the Coupled Model Inter-comparison Project phase 6 (CMIP6) have been applied [,]. The research results were referable. The process of urbanization has led to the boundary extension of urban to rural areas, which may lead to the change of spatiotemporal patterns of precipitation. Song et al. [] divided Beijing into six sub-regions to analyze the temporal and spatial variation of frequency and magnitude of extreme precipitation events, and found that the urban areas (rapid urban expansion) and the southern part of the plain area showed increasing trends in six extreme precipitation indices (EPIs) (namely R90pT, R95pT, R99pT, R90pD, R95pD and R99pD). Zaman et al. [] investigated the spatiotemporal characteristics of extreme precipitation events in the Northern Highlands of Pakistan. With a large-scale analysis, Kishtawal et al. [] found that the incidence of light rainfall was lower in urban areas of India compared to rural areas during the Indian summer monsoon, while the incidence of heavy rainfall was much higher. Golroudbary et al. [] adopted the Co-ordination of Information on the Environment (CORINE) land cover classification to divide the urban and rural areas in the Netherlands; the result showed that the urban areas received more intense extreme precipitation than rural areas, especially in the western coast of the Netherlands (with the largest population).
China is a high-incidence country for extreme precipitation events, especially in the southeastern regions []. Historic extreme precipitation studies showed the effects of socioeconomic activity-caused (population migration, financial crises, military farms, and national decisions) extreme drought have led to long-term changes and caused collapse of the Ming dynasty in the late 15th century []. Gu et al. [] indicated that extreme precipitation events has been increasing significantly in northwestern and southeastern China, and there was a high incidence between April and September.
However, most previous researches compared the effects of human activities on precipitation extremes between urban and rural areas; limited studies divided the sites into multiple social–economic development levels (SEDLs) to reflect the effects of human activities on precipitation extreme events. The objectives of this research were: (i) to select six representative EPIs and identify their spatiotemporal variability characteristics in mainland China over 2000–2018; (ii) to classify the SEDLs at a total 525 sites based on population, GDP and both in 2018; (iii) to analyze the correlations between linear slopes of population (or GDP) and six EPIs at different SEDLs; and (iv) to investigate the effects of different SEDLs on changes of six EPIs.
2. Data and Methodology
2.1. The Studied Area and Date Sources
China is located in the east of Eurasia. China has a total area of 9.634057 million km2 with a descending three-step topography from west to east []. China is the second largest economy in the world []. In recent years, the development of urbanization has been very significant. The daily precipitation data over 2000–2018 were collected from the Meteorological Data Sharing Service Network of China (http://data.cma.cn/site/index.html (accessed on 25 April 2019)) based on observations from 839 meteorological stations. If data missing ratio for a given site was >1%, the site was not included in this research. Accordingly, a subset containing 525 stations was used with data missing ratio <1%. Missing data were interpolated using the data from an adjacent 10 sites of the same period. Subsequently, total 525 weather stations were selected for the analysis. The locations of the selected sites are shown in Figure 1.
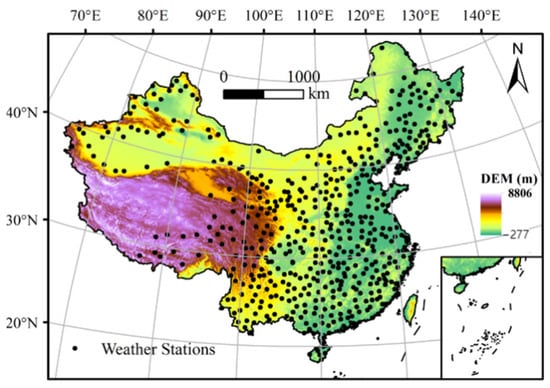
Figure 1.
The geological information, digital elevation (m) and location of weather stations in China.
Annual population and GDP data over 2000–2018 were collected from the National Bureau of Statistics (http://www.stats.gov.cn/tjsj/html (accessed on 25 April 2019)) and Winds Database (https://www.wind.com.cn/NewSite/about.htmlhtml (accessed on 25 April 2019)). The weather, population and GDP data were cross-examined using nonparametric tests including the Kendall autocorrelation test and Mann-–Whitney homogeneity tests []. Missing weather data were interpolated by using the arithmetic average of the neighboring 10 sites. A linear equation was used to interpolate missing population and GDP data.
2.2. Methodology
2.2.1. Classification of SEDLs
Population and GDP data of different sites are used to classify the SEDLs. The population data and GDP data at the selected 525 sites were collected from the National of Bureau Statistics, the Statistical yearbook of China (http://www.stats.gov.cn/ (accessed on 29 April 2019)) and the Winds Database (https://www.wind.com.cn/ (accessed on 30 April 2019)). The selected 525 sites are classified in 6 groups of SEDLs first by population in 2018, then by GDP in 2018, finally by both population and GDP in 2018 (Table 1).

Table 1.
SEDLs of the selected sites classified by population, GDP and both. RMB: Chinese currency.
2.2.2. Selection of Extreme Precipitation Indices
The six EPIs in our study were selected according to the Expert Team on Climate Change Detection and Indices (ETCCDI) and had been widely used for quantifying the precipitation extremes in different regions of the globe [,]. Considering representative properties from different aspects, 6 representative EPIs are selected, namely consecutive dry days (CDD), consecutive wet days (CWD), simple daily intensity index (SDII), the 95th percentile of precipitation on wet days (R95p), maximum 1-day precipitation (Rx1day), and annual total wet-day precipitation (PRCPTOT). The definitions of the selected six extreme precipitation indices are given in Table 2. The selected EPI can be divided into four categories: (1) The extremum of characteristic quantity, such as Rx1day, (2) The amount of characteristic quantity exceeds threshold value, such as R95p, (3) The duration of the characteristic quantity, such as CDD and CWD, and (4) other types including annual PRCPTOT and SDII. The selected six EPIs have good representation in the strength and duration of extreme precipitation events.

Table 2.
Definitions of the selected six EPIs.
2.2.3. Linear Slope Estimation and Pearson Correlations
In order to check whether the changes of population and GDP impact different EPIs, the linear slope (LS) values of annual population, GDP and EPIs over 2000–2018 versus time (year) are obtained (named as EPILS, PopuLS and GDPLS below, respectively). The Pearson correlations between pairs of PopuLS (or GDPLS) and EPILS are conducted to reveal the responses of extreme precipitation events to human activity-induced population and GDP changes. The larger the coefficient of determination (R2), the closer the relationship between two variables.
In addition, in order to show the differences of EPI changes at varying SEDLs, the variations of average EPILS vs. SEDLs were further studied.
The flow chart of the study is illustrated in Figure 2. First, we combined both GDP and population to classify the 525 sites into 6 SEDLs. This method considered the comprehensive human-induced changes in society. Second, we selected six EPIs to denote the extents of extreme precipitation. Third, we applied LSs of GDP, population and six EPIs to indicate the variable changes over the study period of 2000–2018. Finally, the Pearson correlation is used to evaluate the relationships between different variables.
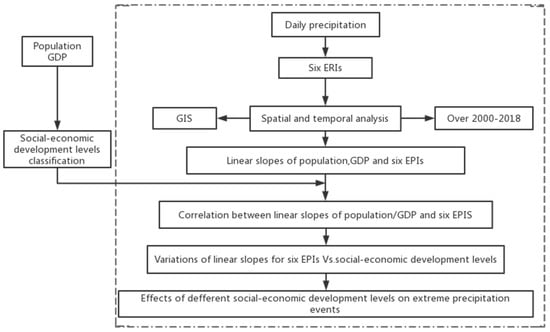
Figure 2.
The flow chart of the method in this research.
3. Results
3.1. Classification of SEDLs and Its Characteristics
As shown in Figure S1, based on population, 266, 101, 64, 39, 43 and 12 out of 525 sites are classified as SEDLs of I to VI, respectively. Based on GDP, 156, 192, 62, 52, 52, and 12 sites are classified as SEDLs of I to VI, respectively. When taking account of both population and GDP, SEDLs are initially classified separately by population and GDP. If the SEDLs are 1.5, 2.5, 3.5, 4.5 or 5.5, the corresponding classification of SEDLs are set to II, III, IV, V and VI. Finally, 270, 113, 52, 47, 35, and 8 sites belonged to SEDLs of I to VI, considering both population and GDP, respectively. The SEDLs of VI, which have highest population and GDPs, include Beijing, Tianjin, Chengdu, Wuhan, Chongqing, Shanghai, Guangzhou and Shenzhen, respectively.
Characteristics of SEDLs
The variations of annual population and GDP and their LSs at different SEDLs over 2000–2018 are compared in Figure 3. From SEDL of I to VI, the annual population and GDP curves generally increased (Figure 3a,c), the population changes (which were the total population of all sites at certain SEDL dividing number of sites) were 21.1–22.9 × 10⁴, 65.9–71.6 × 10⁴, 210.5–226.1 × 10⁴, 436.6–470.9 × 10⁴, 684.9–795.2 × 10⁴ and 1318.7–1834.3 × 104 corresponding to SEDL of I to VI, respectively, and the GDP changes (which were the total GDP of all sites at certain site-level dividing site number) were 9.1–98.3 × 10⁸, 44.7–360.2 × 10⁸, 117.7–989.4 × 10⁸, 240.8–2323.2 × 108, 690.4–6354.6 × 108 and 2308.6–22,489.1 × 108 RMB, respectively. The population and GDP of SEDLs VI had increased greatly and significantly higher than values of the other SEDLs.
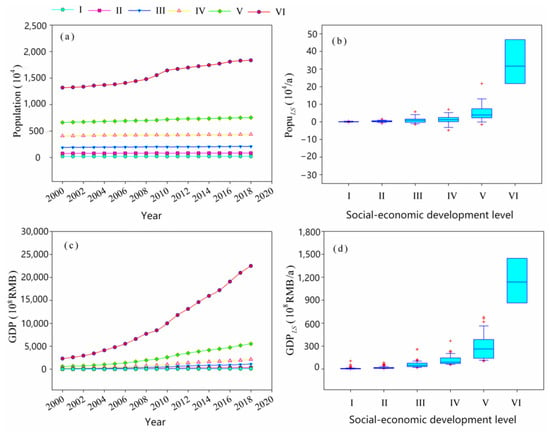
Figure 3.
Change of annual population (a), popuLS (b), GDP (c) and GDPLS (d) at different SEDLs over 2000–2018. The upper and lower edges of the boxes represent the 75th and 25th percentiles, and the whiskers are the 95th and 5th percentiles. The same explanation applies to subsequent box plots.
However, the differences within SEDLs of I, II and III were relatively small. The values and ranges of PopuLS and GDPLS decreased as SEDL decreased from VI to I, of which PopuLS and GDPLS at SEDL of VI were much higher than other SEDLs, reaching 15.9–56.7 × 10⁴/yr and 774.4–1570.6 × 108 RMB/a, respectively (Figure 3b,d). However, excepting an abrupt increase of GDP at a few sites at SEDLs of I and II, both PopuLS and GDPLS for SEDLs of I and II had a small change. In general, from SEDL of I to VI, the levels of socioeconomic development were speeded up, and the human-activity elevated.
Rapidly growing population and GDP leads to faster urban expansion []. The spatial distributions of annual mean population and GDP and their LSs over 2000–2018 showed similar patterns (Figure 4). The areas with a large population and high GDP were mainly located in southeastern China (Figure 4a,b). There were obvious differences of population and GDP between eastern and western China. Almost all sites with population >80 × 104 and GDP > 500 billion RMB were distributed in the southeastern China where economy and society develop faster. On the contrary, the sites located in the Qinghai–Tibet Plateau had a population less than 80 × 104 and GDP less than 50 billion RMB (except Lhasa). Meanwhile, the 280 sites with population < 50 × 104 and the 264 sites with GDP < 10 billion RMB were distributed randomly over China. Consequently, the population and GDP in southeastern China were generally higher than in northwestern China.
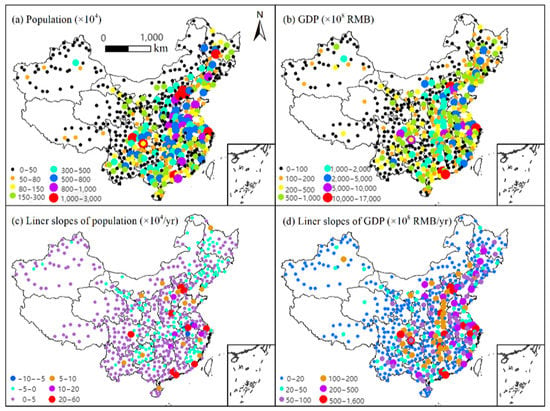
Figure 4.
Spatial distribution of population and GDP and their linear slopes in China.
The ranges of PopuLS and GDPLS over 2000–2018 were between −7.5 to 56.7 × 10⁴/yr and 0.008 to 1570 × 108 RMB/yr (Figure 4c,d). A total of 77% out of the 525 sites recorded positive trends in population, despite all sites showed increasing trends in GDP. The sites with declining population (with a LS of −5 to 0 × 104/yr) were mainly distributed in northeastern and middle China. Meanwhile, population at 92% of the sites and GDP at 65% of the sites endured smaller increasing trends, and LSs were 0 to 5 × 10⁴/yr for population and <20 × 108 RMB/yr for GDP. These sites were distributed in different regions of China. Moreover, the sites that belonged to SEDL of VI witnessed the most rapid population and GDP growth.
Only at 5 sites was the population was larger than 10 million and the PopuLS more than 20 × 104/yr, and only at 4 sites was the GDP was more than 1000 billion RMB and the GDPLS was more than 500 × 108 RMB/yr. Overall, most of the sites with larger PopuLS and GDPLS were located in the middle to south of eastern China, where the SEDLs P were already very high, denoting greater human-activity.
3.2. Spatial and Temporal Variations of Six EPIs at Different SEDLs
3.2.1. Temporal Variations
The temporal variations and box plots of six EPIs at different SEDLs over 2000–2018 are illustrated in Figure 5. The temporal variations of the EPIs varied with different SEDLs, and five wet EPIs followed generally similar patterns, except CDD, which denoted dry climate conditions. Less difference was found in CWD for different SEDLs when compared to SDII, R95p, Rx1day and PRCPTOT, which showed clear differences, especially at SEDLs of I and VI. The smallest values of SDII, R95p, Rx1day and PRCPTOT were for SEDL of I and the largest values were observed at SEDL of VI. However, there were not clear ranks for SEDLs of II, III, IV and V. The sites that were more developed and urbanized possibly experienced more extreme precipitation events. This was reasonable, since urban areas received more precipitation and generate more runoff with larger areas of watertight pavement than less developed rural areas. Therefore, to take measures preventing extreme flooding may be the most important priority in metropolitan areas. In addition, SDII, R95p, Rx1day and PRCPTOP had apparent peak values in 2016 for all the SEDLs, indicating the wettest year during the period.
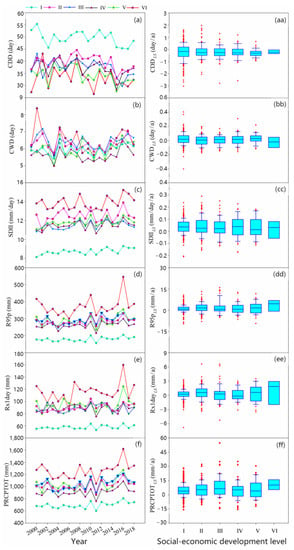
Figure 5.
The temporal variations of the six EPIs and the box plots of their LSs at different SEDLs over 2000–2018 in mainland China. (a) CDD; (b) CWD; (c) SDII; (d) R95p; (e) Rx1day; (f) PRCPTOT; (aa) CDDLS; (bb) CWDLS; (cc) SDIILS; (dd) R95pLS; (ee) Rx1dayLS; (ff) PRCPTOTLS.
However, CDD showed reversed patterns with the wet EPIs, namely the largest values occurred at SEDL of I while the smallest were found at SEDL of VI. This implied that in small town or rural areas, drought may be the most important thing for the government to pay attention to. There was larger variability of LSs for different EPIs (EPILS) from SEDLs of I, II and III, which was partially due to there being more sites at higher SEDLs. As the SEDL changed from I to VI, the middle values of CDDLS, CWDLS and SDIILS changed little; however, slight increasing values were found from the middle values of R95pLS, Rx1dayLS and PRCPTOTLS. This also manifested higher risks of extreme wet events for SEDL of VI. In general, both the variations of the wet EPIs and their LSs revealed that urbanized areas may have suffered more extreme flooding events, while from CDD, it was shown that rural areas may have suffered more extreme drought events.
3.2.2. Spatial Distributions and Trends of the Selected EPIs
The site-specific spatial distributions of six annual mean EPIs are mapped for mainland China in Figure 6. The CDD, which was the only index characterizing extreme drought features among the six selected EPIs, ranged from 10 to 140 days in the year and decreased from northwestern to southeastern China (Figure 6a). The longer CDD values were mainly distributed in southern Xinjiang and southern Qinghai–Tibet Plateau. The maximum CDD value was 140.9 days and occurred at Tulufan (89°20′00″ E, 42°93′33″ N) in northwestern China, whereas the shorter CDD values were distributed in central to eastern China. The minimum CDD value was 20.4 days at Laifeng (109°41′67″ E, 29°51′67″ N) in Hubei province (southeastern China). The CWD showed almost opposite features to CDD by its definition; however, its spatial distribution was not just opposite to CDD. The sites with longer CWD were mainly distributed in southern China, and the sites with shorter CWD values were mainly distributed in northwestern China. The CWD values generally increased from north to south China, indicating wetter climates in the south areas. The maximum CWD value was 14.6 days which occurred at Gongshan (98°66′67″ E, 27°75′00″ N) in Yunnan province (Figure 6b).
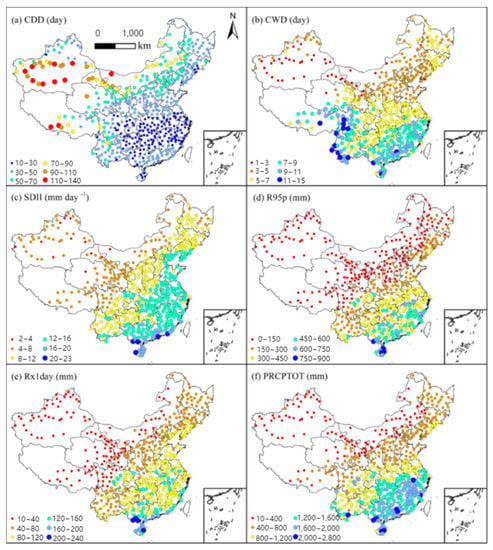
Figure 6.
Spatial distribution of annual mean values for the six selected EPIs in China.
The other three EPIs (SDII, R95p and Rx1day) had almost similar spatial distribution patterns. Specifically, the sites with SDII values between 8 to 12 mm day−1 were located in a long belt from southwestern to northeastern China, where the famous “Hu Huanyong Line” along the farming-–pastoral ecotone was located []. The values of R95p and Rx1day were low in northwestern China but high in southeastern China. Especially in the southern coastal area, the value of the three EPIs were significantly higher than in other regions (Figure 6c–e). The PRCPTOT varied greatly in space. The northwestern China was relatively dry with low PRCPTOT while the southeastern China was the opposite. This pattern determined the generally frequent, extremely dry events in northwestern China and extremely wet events in south China (Figure 6f).
The spatial distribution of LSs for the six EPIs are mapped in Figure 7. The ranges of LSs were between −3.1 to 2.0 day a−1 for CDD, −0.4 to 0.4 day a−1 for CWD, −0.2 to 0.4 mm day−1 a−1 for SDII, −23.9 to 28.3 mm a−1 for R95p, −6.7 to 6.6 mm a−1 for Rx1day, and −15.7 to 54.7 mm a−1 for PRCPTOT, respectively. There were 360 sites which had negative values of CDDLS. These sites were mainly distributed in eastern China and 86.3% of the sites had CDDLS of −1.0 to 0 day a−1, showing slightly alleviated drought conditions. However, 165 sites that had increasing trends in CDD were mainly distributed in southwestern China (Figure 7a). The difference in spatial distribution of CWDLS was not obvious, CWDLS at 99% of sites ranged between −0.3 to 0.3 day yr−1. Moreover, CWDLS values were negative at 221 sites, randomly distributed in space. Large CWDLS values were all located in the south China, implying potential deterioration of waterlogging or floods in the south (Figure 7b). High values of SDIILS were mainly distributed in eastern China, especially in Yangtze River Delta City Group and Beijing–Tianjin–Hebei Urban Agglomeration, where SDIILS values at most sites were greater than 0.2 mm day−1 a−1. Over 80% of the sites had small changes of SDIILS (between −0.1 to 0.1 mm day−1 a−1), and distributed randomly (Figure 7c). The spatial distribution pattern of R95pLS was highly similar with that of PRCPTOTLS, namely with both highest and lowest values in eastern China. A total of 64% of the sites had small changes (−5 to 5 mm a−1) of R95pLS and were located in western China. More than 76% of the sites had positive values of PRCPTOTLS (Figure 7d,f). As to the Rx1dayLS, values focused in the range of 0 to 2 mm a−1 at most sites, followed by −4 to −2 mm yr−1 and −2 to 0 mm yr−1, and the distribution of sites with different ranges of Rx1dayLS was random (Figure 7e).
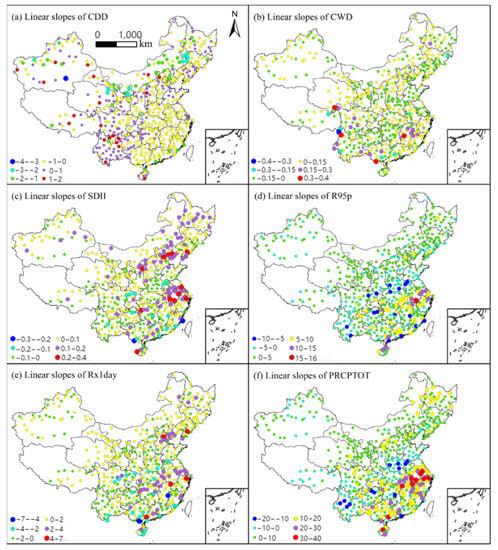
Figure 7.
Spatial distribution of linear slopes for the six EPIs over 2000–2018 in China.
3.3. The Correlations between PopuLS (or GDPLS) and EPIs at Different SEDLs
3.3.1. Correlation between PopuLS and Six EPIs
The correlations between LSs of population and six EPIs at different SEDLs are illustrated in Figure 8. It showed that: (1) The PopuLS ranged from −7.5 to 56.8 × 10⁴ a−1 corresponding to SEDLs of I to V, covering both negative and positive values. However, PopuLS for SEDL of VI were all positive, indicating continuously increasing of population in high-developed site/cities. (2) For SEDL of I, the correlations between PopuLS and linear slopes of three EPIs (CDD, CWD and SDII) were positive, but negative for PopuLS and the other three EPILS, which denoted the increase of PopuLS may have affected the changes of EPIs, especially CDDLS. (3) For SEDL of II, except there was negative correlation between PopuLS and SDIILS (or Rx1dayLS), there were generally positive correlations between PopuLS and linear slopes of the other four EPIs. (4) There were either negative or positive correlations between PopuLS and linear slopes of the six EPIs for SEDLs of III, IV and V. (5) For SEDL of VI which had the highest population and GDP, there was a negative correlation between PopuLS and CWDLS, and positive correlations were found between PopuLS and linear slopes of the other five EPIs. It showed that with the increasing PopuLS, extreme precipitation events also increased, with the characteristics of increased high precipitation (R95p), increased rainfall intensity (SDII), concentrated short time precipitation (Rx1day), but increased consecutive dry days (CDD). (6) Most of the correlations had not very good performance, especially when containing more sites.
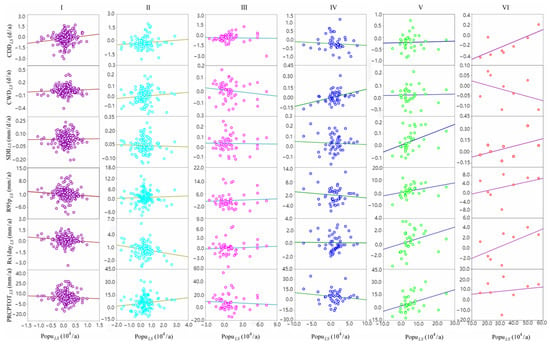
Figure 8.
The correlations between linear slopes of population and six EPIs at different SEDLs.
The LSs and determination of coefficients (R2) that indicated the relationship between LSs of population and six EPIs (for all the sites that belonged to certain SEDL of I to VI) are presented in Table 3. The LSs values did not regularly follow the increase of SEDL, showing relatively complicated effects of the increased population on the changes of extreme precipitation events. In addition, the R2 values ranged from 0.001 to 0.567, but most correlations were not too good. It showed that the population variation in the studied 19 years may have explained less than 57% of the variability in extreme precipitation events.

Table 3.
The relationship between linear slopes of population and EPIs (** means p < 0.01, * means p < 0.05).
3.3.2. Correlations between Linear Slopes of GDP and Six EPIs
The correlations between LSs of GDP and six EPIs at different SEDLs are illustrated in Figure 9. It showed that: (1) The GDPLS for all SEDLs were positive (ranges were between 0.008 and 1570.7 × 108 RMB a−1), and the range increased as SEDL increased from I to VI. Especially for SEDL of VI, the range of GDPLS ranked first and was between 774.5 to 1525.1 × 108 RMB a−1. (2) For SEDL of I and II, the correlations between GDPLS and linear slopes of four EPIs (SDII, R95p, Rx1day and PRCPTOT) were positive, but negative between GDPLS and the other two EPILS, which denoted the increase of GDPLS have affected the occurrence of extreme precipitation events. (3) For SEDL of III, except a few negative correlations between GDPLS and CDDLS (or CWDLS), generally there were positive correlations between GDPLS and LSs of the other five EPIs. With the increasing GDPLS, the precipitation increased and was more concentrated, but the risks of drought decreased. (4) For SEDL of IV, the correlations between GDPLS and LSs of CDD were negative, but were positive for GDPLS and the other five EPILS. Therefore, while flooding events had increased, the risks of drought decreased at the sites with faster economic growth. (5) For SEDLs of V and VI which had high GDP and linear slopes of GDP, there was negative correlation between GDPLS and CWDLS, but positive correlations were found between GDPLS and LSs of the other five EPIs. It implied that with faster economic development, humans are likely to experience more extremely wet/dry events. (6) Similar to Figure 8, most of the correlations did not have very excellent performance, especially for lower SEDLs which contained more sites.
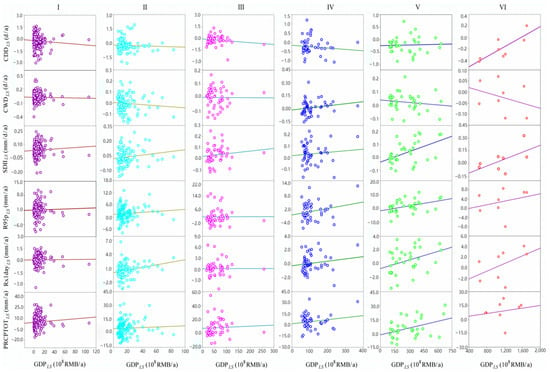
Figure 9.
The correlations between GDPLS and six EPILS at different SEDLs.
The correlations and R2 values between LSs of GDP and six EPIs at different SEDLs are presented in Table 4. Similar to the results of Table 3, the LSs values did not regularly change with the increase of SEDL, showing also complicated effects of the increased GDP on the extreme precipitation events. The R2 values ranged from 0.001 to 0.658 but generally the performance was not good. The GDP variations over the studied 19 years possibly explained less than 66% of the variability in extreme precipitation events.

Table 4.
The relationship between linear slopes of GDP and EPIs (*** means p < 0.001, ** means p < 0.01, * means p < 0.05).
3.4. The Relationship between Linear Slopes of Six EPIs and the SEDLs
As the SEDL increased from I to IV, PopuLS (or GDPLS) increased. The variations of LSs for each EPI (averaged for all the sites of a certain SEDL) with SEDL are shown in Figure 10. It showed that: (1) The LSs of five EPIs (except CWD) generally increased as the SEDL increased from I to VI. (2) The average LSs of CDD for all SEDLs were negative, but were positive for other four average EPIs (SDII, R95p, Rx1day and PRCPTOT), which denoted that the maximum consecutive drought days were shorter, but the intensity and the extreme values have increased. The LSs of average CWD for SEDL VI were negative, whereas they were positive for the other five SEDLs, indicating the declined maximum consecutive rainy days of SEDL VI. (3) From SEDL I to VI, the average LSs of six EPIs showed some regularity, which implied the precipitation would be increased and become more concentrated at higher SEDLs. Meanwhile, the sites which belonged to higher SEDLs had more impervious pavement; the rainstorm could not be discharged in time, which would lead to occurrences of urban inland inundation (especially at SEDL VI). (4) The LSs of five EPIs differed clearly between SEDL I and VI, but did not follow a clear increasing or decreasing relationship for SEDLs II, III, IV and V, which is why the R2 values ranged from 0.16 to 0.54, all not too high. This indicated that human-activity (population increase or GDP development) may have contributed 16% to 54% of variability in extreme precipitation events. Compared to human-activity, natural climate variability contributed more to affect extreme precipitation events.
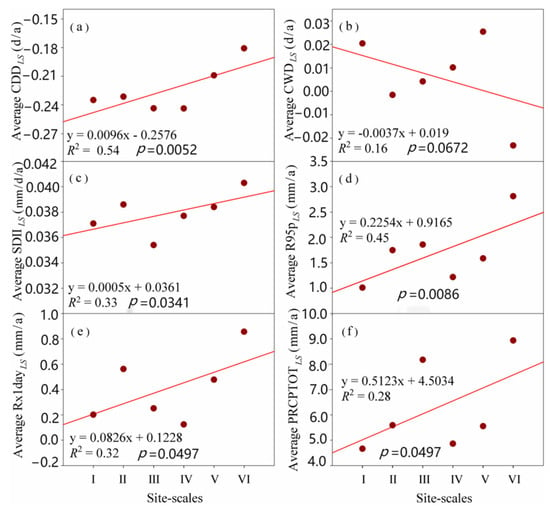
Figure 10.
The variations of the LSs of six EPIs with the SEDLs. The EPILS was averaged from all the sites which belonged to certain SEDL. (a) Average CDDLS; (b) Average CWDLS; (c) Average SDIILS; (d) Average R95pLS; (e) Average Rx1dayLS; (f) Average PRCPTOTLS.
4. Discussion
4.1. Impact of Urban Expansion at Different SEDLs on Extreme Precipitation
The rate of urbanization caused by human activities in China is particularly obvious from the start of the 21st century. Rapid urbanization plays indelible roles in modifying local climate, with more extreme precipitation in urban areas. The most significant change for different extents of urbanization is the change of land surface cover []. The previous vegetated areas (e.g., cropland) were replaced by impervious roads which had lower albedo and latent heat flux, but higher surface sensibility []. This has caused changes in surface runoff and the water cycle of urban areas, especially fast-developed big cities. Wang et al. [] adopted the advanced research core of the Weather Research and Forecasting (ARW–WRF) model to simulate the vegetation and irrigated arable land reduction caused by urban expansion, their results showed a significant change in near-surface temperature, humidity, wind speed and regional precipitation. Shem and Shepherd [] employed the Weather Research and Forecast model to simulate the “urban rainfall effect” formed by rapid urbanization in Atlanta; the convective evolution of two cases (a control case (URBAN) and an alternative case (NOURBAN)) showed distinct differences in the temporal and spatial evolution, the rainfall amounts of URBAN schemes in downwind were as high as 10–13% compared to NOURBAN. Xie et al. [] used five sources of land use–land cover (LULC) data and divided Beijing, China, into built-up land, cropland and broadleaf forest, and simulated precipitation with WRF. The results showed that urban expansion increased total precipitation. In this research (Figure 10), the increased SEDL implied an increasing urban expansion rate. The variations of the LSs of five EPIs (except CWD) showed increased trends with the increasing SEDLs, which meant that the extreme events at the sites with higher SEDLs increased faster. Thus, the sites with faster socioeconomic development not only suffered from the increase in total precipitation, but also from the short-term heavy rainfall.
4.2. How Population (or GDP) Increase Affect the Precipitation Events
There was no consistent conclusion about whether natural variability or human activities dominate extreme precipitation events. The changes of population (or GDP) did not directly affect precipitation. Sharma [] concluded that the continued population growth would increase human activities and cause rapid development of urbanization and urban area expansion. Because the urban surface buildings have higher sensible heat flux than the rural ground, rapidly expanding urban areas will cause more significant “urban heat island” effects, which will accelerate the formation of hot airflow over the city, and lead to an “urban rain island effect” [], which will then increase the gap of total precipitation and rain intensity between urban and rural areas, and cause frequent occurrence of extreme precipitation events in urban areas []. Kug and Ahn [] adopted the population data from 40 regions of the Korean Peninsula to reflect their urbanization over 1975–2005. The results showed that, compared with rural areas, the rapid increase of population in metropolitan areas led to rapid development of urbanization, which also had increased temperatures/precipitation (especially the most significant increase in precipitation caused by the urban heat island effect in summer). Guo et al. [] used the PSU/NCAR Mesoscale Modeling System (MM5) to reflect the impact of the rapidly changing surface conditions of Beijing on the cloud structure and precipitation distribution due to the explosive growth of the urban population, and showed that the increased population led to the increase of land surface roughness, which made precipitation more concentrated, thereby increasing the risks of extreme precipitation events. Therefore, population (or GDP) can be used as indicators to reflect the level of human activity, and ultimately affect the change of precipitation. Theide et al. found substantively meaningful variation in both temperature and precipitation effects between demographic groups and across countries [].
4.3. Challenges of Urbanization on Extreme Events
The temporal variations of six EPIs showed differences at different SEDLs (Figure 7). The sites at SEDL of VI (mainly distributed in southeastern China) showed wetter trends than the sites belonging to other SEDLs, and the sites which belonged to SEDL of I (mainly distributed in northwestern China) showed drier trends. However, under high precipitation, urban expansion caused by population and economic development may bring more extreme precipitation events in the future. Li et al. [] adopted the weighted average of 28 general circulation models to project the changes of future extreme precipitation under different representative concentration pathway scenarios and return periods. The results showed that the decreased CDD reflected possible relief of drought conditions, but the significantly increased Rx1day, R10, R20, R99p and PRCPTOT implied increasing risks of flooding and waterlogging events in the future. Rapid urbanization reduced not only water infiltration, but also the amount of water evaporation in urban areas []. Thus, for the sites at higher SEDLs, the increased extreme precipitation events will lead to more flooding events in the future. Necessarily, there are emerging needs of establishing a scientific warning system and taking preventive measures (such as construction of sponge cities and scientific underground drainage facilities, and increasing urban green areas, etc.).
4.4. The Utilization of the Obtained Results from This Research
The results of this research are useful for application to other sites or other time stages. Neighbor sites which have similar geography and general climate conditions could refer to our results if lacking continuous weather station data. The nearby sites at known SEDLs and the LSs of extreme precipitation indices can be used for trend analysis. The results obtained from this study could be used for those sites at a similar SEDL in the future. Our study period was 2000–2018, covering the rapid economic development stage of China. In the future, some lower scale sites may expand to a higher scale, therefore our results for certain SEDL are usefully referred. Due to the uncertainty of future economic and social development, the sites which belonged to each SEDL may change in the future. Therefore, this study chose 2000–2018 as the research period to better reflect the impact of human activities on extreme precipitation events in the context of rapid socioeconomic development.
Although some interesting results were obtained, there are some limitations in this research. First, our results are not universal, for the areas where the weather stations are distributed sparsely (e.g., the Qinghai–Tibetan Plateau region), it is hard to use results from a neighbor site. Second, only detecting the trends of EPIs cannot quantitatively assess the effects of human activities on an extreme precipitation event. Finally, whether natural variability or human activities dominate extreme precipitation events, there is no consistent conclusion, neither can this paper draw a deterministic conclusion. Future work will be to quantitatively analyze the contribution of human activities and climate change on extreme precipitation by different ways.
5. Conclusions
Based on population and GDP data in 2018, the selected 525 sites were divided into six SEDLs by population and GDP. From SEDLs of I to IV, annual mean population and GDP and their LSs increased, especially at the SEDL of IV (such as Beijing, Shanghai, Guangzhou and Shenzhen, etc.) which had rapid growing urban areas. In higher SEDLs, the sites had higher risks of extreme flooding events, but at lower SEDLs there were higher risks of suffering extreme drought. In 2016, four EPIs (SDII, R95p, Rx1day and PRCPTOT) had the highest values (15.2 mm day−1, 545.9 mm, 159.8 mm and 1617.9 mm) at SEDL of VI, but in 2011 three EPIs (R95p, Rx1day and PRCPTOT) reached their lowest values (156.9 mm, 53.1 mm and 601.6 mm) at the SEDL of I. Therefore, higher SEDLs had higher risks of flooding and waterlogging events, while lower SEDLs had higher risks of drought hazards.
The sites with higher SEDLs not only had larger populations and GDP, but also had more rapid socioeconomic development. Rapid urban expansion may cause urban heat/rain island effects and further increase the risk of extreme precipitation events. This could be verified by the increasing LSs of five EPIs (except CWD which decreased with the increasing SEDL and indicated more concentrated precipitation). Overall, different SEDLs affected the trend of extreme precipitation over 2000–2018 in mainland China. The sites which belonged to SEDLs of V and VI will face greater extreme precipitation challenges in the future. The results of this research will supply references for preventing heavy rain and flood disasters.
Supplementary Materials
The following supporting information can be downloaded at: https://www.mdpi.com/article/10.3390/su142215284/s1, Figure S1: Levels of site-scale classified by (a) Population, (b) GDP and (c) Both population and GDP in China; Figure S2: Statistical significance test of population, GDP, CDD, CWD, SDII, R95p, Rx1day, and PRCPTOT.
Author Contributions
Conceptualization, methodology, N.Y., Y.L. and F.L.; software, formal analysis, investigation, N.Y.; resources, data curation, B.P.; writing—original draft preparation, writing—review and editing, J.Z. and F.L. All authors have read and agreed to the published version of the manuscript.
Funding
This research was funded by the National Natural Science Foundation of China (52079114 and 52209070), the Chinese Universities Scientific Fund (2452020211), the Foreign Young Talent Plan (QN2022172005L) and the High-end Foreign Experts Introduction Project (G2022172025L).
Institutional Review Board Statement
Not applicable.
Informed Consent Statement
Not applicable.
Data Availability Statement
The weather data are collected from the China Meteorological Data Meteorological Data Sharing Network (http://data.cma.cn/ (accessed on 6 April 2019)).
Conflicts of Interest
The authors declare no conflict of interest.
Abbreviations
Social-economic development level—SEDL; Extreme precipitation index—EPI; Expert Team on Climate Change Detection and Indices—ETCCDI; El Niño Southern Oscillation—ENSO; Indian Ocean Dipole—IOD; Atlantic Multi-decadal Oscillation Index—AMO; Coupled Model Inter-comparison Project phase 6—CMIP6; Gross Domestic Product—GDP; Consecutive dry days—CDD; Consecutive wet days—CWD; Simple daily intensity index—SDII; The 95th percentile of precipitation on wet days—R95p; Maximum 1-day precipitation—Rx1day; Annual total wet-day precipitation—PRCPTOT; Linear slopes—LS; Advanced Research core of the Weather Research and Forecasting—ARW–WRF; land use-land cover—LULC.
References
- IPCC. Summary for Policymakers. In Climate Change 2021: The Physical Science Basis. Contribution of Working Group I to the Sixth Assessment Report of the Intergovernmental Panel on Climate Change; Cambridge University Press: New York, NY, USA, 2022. [Google Scholar]
- Wang, L.; Li, Y.; Li, M.; Liu, F.G.; Liu, D.L.; Pulatov, B. Projection of extreme precipitation events in China’s mainland with the statistical downscaled data from the selected 27 GCMs in CMIP6 under different SSPs. Atmos. Res. 2022; in press. [Google Scholar]
- Rahmat, A.; Khoiru Zaki, M.; Effendi, I.; Mutolib, A.; Yanfika, H.; Listiana, I. Effect of global climate change on air temperature and precipitation in six cities in Gifu Prefecture, Japan. J. Phys. Conf. Ser. 2019, 1155, 012070. [Google Scholar] [CrossRef]
- Szwed, M. Variability of precipitation in Poland under climate change. Theoret. Appl. Climatol. 2019, 135, 1003–1015. [Google Scholar] [CrossRef]
- Yao, N.; Li, Y.; Lei, T.; Peng, L. Drought evolution, severity and trends in mainland China over 1961–2013. Sci. Total Environ. 2018, 616, 73–89. [Google Scholar] [CrossRef] [PubMed]
- Rojas, R.; Feyen, L.; Watkiss, P. Climate change and river floods in the European Union: Socio-economic consequences and the costs and benefits of adaptation. Global. Environ. Change 2013, 23, 1737–1751. [Google Scholar] [CrossRef]
- Ridder, N.N.; Pitman, A.J.; Westra, S.; Ukkola, A.; Do, H.X.; Bador, M.; Hirsch, A.L.; Evans, J.P.; Di Luca, A.; Zscheischler, J. Global hotspots for the occurrence of compound events. Nat. Commun. 2020, 11, 5956. [Google Scholar] [CrossRef]
- Chen, J.; Brissette, F.P.; Zielinski, P.A. Constraining Frequency Distributions with the Probable Maximum Precipitation for the Stochastic Generation of Realistic Extreme Events. J. Extrem. Events 2015, 2, 1585–1590. [Google Scholar] [CrossRef]
- Duan, L.; Zheng, J.; Li, W.; Liu, T.; Luo, Y. Multivariate properties of extreme precipitation events in the Pearl River basin, China: Magnitude, frequency, timing, and related causes. Hydrol. Proces. 2017, 31, 3662–3671. [Google Scholar] [CrossRef]
- Ayugi, B.; Jiang, Z.; Iyakaremye, V.; Ngoma, H.; Babaousmail, H.; Onyutha, C.; Dike, V.N.; Mumo, R.; Ongoma, V. East African population exposure to precipitation extremes under 1.5 degrees C and 2.0 degrees C warming levels based on CMIP6 models. Environ. Res. Lett. 2022, 17, 044051. [Google Scholar] [CrossRef]
- Pakalidou, N.; Karacosta, P. Study of very long-period extreme precipitation records in Thessaloniki, Greece. Atmos. Res. 2018, 208, 106–115. [Google Scholar] [CrossRef]
- Krichak, S.O.; Breitgand, J.S.; Gualdi, S.; Feldstein, S.B. Teleconnection-extreme precipitation relationships over the Mediterranean region. Theoret. Appl. Climatol. 2014, 117, 679–692. [Google Scholar] [CrossRef]
- Yu, L.; Zhong, S.; Pei, L.; Bian, X.; Heilman, W.E. Contribution of large-scale circulation anomalies to changes in extreme precipitation frequency in the United States. Environ. Res. Lett. 2016, 11, 04403. [Google Scholar] [CrossRef]
- Tramblay, Y.; Badi, W.; Driouech, F.; El Adlouni, S.; Neppel, L.; Servat, E. Climate change impacts on extreme precipitation in Morocco. Global Planet. Chang. 2012, 82–83, 104–114. [Google Scholar] [CrossRef]
- IPCC. Summary for policymakers. In Climate Change 2013: The Physical Science Basis; Stocker, T.F., Ed.; Cambridge University Press: New York, NY, USA, 2013; pp. 1–29. [Google Scholar]
- Runge, J.; Petoukhov, V.; Donges, J.F.; Hlinka, J.; Jajcay, N.; Vejmelka, M.; Hartman, D.; Marwan, N.; Palus, M.; Kurths, J. Identifying causal gateways and mediators in complex spatio-temporal systems. Nat. Commun. 2015, 6, 8502. [Google Scholar] [CrossRef] [PubMed]
- Mamalakis, A.; Yu, J.-Y.; Randerson, J.T.; AghaKouchak, A.; Foufoula-Georgiou, E. A new interhemispheric teleconnection increases predictability of winter precipitation in southwestern US. Nat. Commun. 2018, 9, 2332. [Google Scholar] [CrossRef] [PubMed]
- Li, F.; Zhu, Q.; Riley, W.J.; Yuan, K.; Wu, H.; Gui, Z. Wetter California Projected by CMIP6 Models with Observational Constraints Under a High GHG Emission Scenario. Earths Future 2022, 10, e2022EF002694. [Google Scholar] [CrossRef]
- Min, S.-K.; Zhang, X.; Zwiers, F.W.; Hegerl, G.C. Human contribution to more-intense precipitation extremes. Nature 2011, 470, 378–381. [Google Scholar] [CrossRef]
- Ning, G.; Luo, M.; Zhang, W.; Liu, Z.; Wang, S.; Gao, T. Rising risks of compound extreme heat-precipitation events in China. Int. J. Climatol. 2022, 42, 5785–5795. [Google Scholar] [CrossRef]
- Changnon, S.A. Inadvertent Weather Modification in Urban Areas: Lessons for Global Climate Change. Bull. Am. Meteorol. Soc. 1992, 73, 619–627. [Google Scholar] [CrossRef]
- Gao, L.; Huang, J.; Chen, X.; Chen, Y.; Liu, M. Contributions of natural climate changes and human activities to the trend of extreme precipitation. Atmos. Res. 2018, 205, 60–69. [Google Scholar] [CrossRef]
- Schar, C.; Luthi, D.; Beyerle, U.; Heise, E. The soil-precipitation feedback: A process study with a regional climate model. J. Clim. 1999, 12, 722–741. [Google Scholar] [CrossRef]
- Berg, A.; Findell, K.; Lintner, B.R.; Gentine, P.; Kerr, C. Precipitation Sensitivity to Surface Heat Fluxes over North America in Reanalysis and Model Data. J. Hydrometeorol. 2013, 14, 722–743. [Google Scholar] [CrossRef]
- Yuan, K.; Zhu, Q.; Riley, W.J.; Li, F.; Wu, H. Understanding and reducing the uncertainties of land surface energy flux partitioning within CMIP6 land models. Agric. Forest Meteorol. 2022, 319, 108920. [Google Scholar] [CrossRef]
- Le, T.V.; Gallus, W.A., Jr. Effect of an extratropical mesoscale convective system on water vapor transport in the upper troposphere/lower stratosphere: A modeling study. J. Geophys. Res. 2012, 117, D03111. [Google Scholar] [CrossRef]
- Yin, C.; Wang, J.; Yu, X.; Li, Y.; Yan, D.; Jian, S. Definition of Extreme Rainfall Events and Design of Rainfall Based on the Copula Function. Water Resour. Manag. 2022, 36, 3759–3778. [Google Scholar] [CrossRef]
- Goyal, M.K.; Gupta, A.K.; Jha, S.; Rakkasagi, S.; Jain, V. Climate change change impact on precipitation extremes over Indian cities: Non-stationary analysis. Technol. Forecast. Soc. Chang. 2022, 180, 121685. [Google Scholar] [CrossRef]
- Ma, Q.; Li, Y.; Feng, H.; Yu, Q.; Zou, Y.; Liu, F.; Pulatov, B. Performance evaluation and correction of precipitation data using the 20-year IMERG and TMPA precipitation products in diverse subregions of China. Atmos. Res. 2021, 249, 105304. [Google Scholar] [CrossRef]
- Huang, Z.Y.; Zhang, Y.H.; Xu, J.T.; Fang, X. Can satellite precipitation estimates capture the magnitude of extreme rainfall Events? Remote Sens. Lett. 2022, 13, 1048–1057. [Google Scholar] [CrossRef]
- Du, S.; Wu, R.; Sun, H.; Yan, D.; Xue, J.; Liao, W.; Tuo, Y.; Zhang, W. Projection of Precipitation Extremes and Flood Risk in the China-Pakistan Economic Corridor. Front. Environ. Sci. 2022, 10, 7323. [Google Scholar] [CrossRef]
- Song, X.; Zhang, J.; Zou, X.; Zhang, C.; AghaKouchak, A.; Kong, F. Changes in precipitation extremes in the Beijing metropolitan area during 1960–2012. Atmos. Res. 2019, 222, 134–153. [Google Scholar] [CrossRef]
- Zaman, M.; Ahmad, I.; Usman, M.; Saifullah, M.; Anjum, M.N.; Khan, M.I.; Uzair Qamar, M. Event-Based Time Distribution Patterns, Return Levels, and Their Trends of Extreme Precipitation across Indus Basin. Water 2020, 12, 3373. [Google Scholar] [CrossRef]
- Kishtawal, C.M.; Niyogi, D.; Tewari, M.; Pielke, R.A., Sr.; Shepherd, J.M. Urbanization signature in the observed heavy rainfall climatology over India. Int. J. Climatol. 2010, 30, 1908–1916. [Google Scholar] [CrossRef]
- Golroudbary, V.R.; Zeng, Y.; Mannaerts, C.M.; Su, Z. Detecting the effect of urban land use on extreme precipitation in the Netherlands. Weather Clim. Extrem. 2017, 17, 36–46. [Google Scholar] [CrossRef]
- Wan, B.; Gao, Z.; Chen, F.; Lu, C. Impact of Tibetan Plateau surface heating on persistent extreme precipitation events in southeastern China. Mon. Weather Rev. 2017, 145, 3485–3505. [Google Scholar] [CrossRef]
- Han, J.; Yang, Y. The socioeconomic effects of extreme drought events in northern China on the Ming dynasty in the late fifteenth century. Clim. Chang. 2021, 164, 26. [Google Scholar] [CrossRef]
- Gu, X.; Zhang, Q.; Chen, X.; Fan, K. The spatiotemporal rates of heavy precipitation occurrence at difference scales in China. J. Hydraul. Eng. 2017, 48, 505–515. [Google Scholar] [CrossRef]
- Xu, H.; Bechle, M.J.; Wang, M.; Szpiro, A.A.; Vedal, S.; Bai, Y.; Marshall, J.D. National PM2.5 and NO2 exposure models for China based on land use regression, satellite measurements, and universal kriging. Sci. Total Environ. 2019, 655, 423–433. [Google Scholar] [CrossRef]
- Helsel, D.R.; Hirsch, R.M. Statistical Methods in Water Resources; Elsevier: Amsterdam, The Netherlands, 1992. [Google Scholar] [CrossRef]
- Liu, Y.R.; Li, Y.P.; Yang, X.; Huang, G.H.; Li, Y.F. Development of an integrated multivariate trend-frequency analysis method: Spatial-temporal characteristics of climate extremes under global warming for Central Asia. Environ. Res. 2021, 195, 110859. [Google Scholar] [CrossRef]
- Wang, F.; Li, Y.; Dong, Y.; Zhu, X. Regional difference and dynamic mechanism of locality of the Chinese farming-pastoral ecotone based on geotagged photos from Panoramio. J. Arid Land 2018, 10, 316–333. [Google Scholar] [CrossRef]
- Jiang, Y.; Fu, P.; Weng, Q. Assessing the Impacts of Urbanization-Associated Land Use/Cover Change on Land Surface Temperature and Surface Moisture: A Case Study in the Midwestern United States. Remote Sens. 2015, 7, 4880–4898. [Google Scholar] [CrossRef]
- Ilhamsyah, Y. Surface Energy Balance in Jakarta and Neighboring Regions As Simulated Using Fifth Mesoscale Model (MM5). Aceh Int. J. Sci. Technol. 2014, 3, 27–36. [Google Scholar] [CrossRef][Green Version]
- Wang, X.; Liao, J.; Zhang, J.; Shen, C.; Chen, W.; Xia, B.; Wang, T. A Numeric Study of Regional Climate Change Induced by Urban Expansion in the Pearl River Delta, China. J. Appl. Meteorol. 2014, 53, 346–362. [Google Scholar] [CrossRef]
- Shem, W.; Shepherd, M. On the impact of urbanization on summertime thunderstorms in Atlanta: Two numerical model case studies. Atmos. Res. 2009, 92, 172–189. [Google Scholar] [CrossRef]
- Xie, Y.; Shi, J.; Lei, Y.; Xing, J.; Yang, A. Impacts of land cover change on simulating precipitation in Beijing area of China. In Proceedings of the 2014 IEEE Geoscience and Remote Sensing Symposium, Quebec City, QC, Canada, 13–18 July 2014; pp. 4145–4148. [Google Scholar] [CrossRef]
- Sharma, P. 36. Salicylic Acid: A Novel Plant Growth Regulator—Role in Physiological Processes and Abiotic Stresses Under Changing Environments. In Climate Change and Plant Abiotic Stress Tolerance; Wiley: Weinheim, Germany, 2013; pp. 939–990. [Google Scholar] [CrossRef]
- Dixon, P.G.; Mote, T.L. Patterns and causes of Atlanta’s urban heat island-initiated precipitation. J. Appl. Meteorol. 2003, 42, 1273–1284. [Google Scholar] [CrossRef]
- Yang, X.L.; Yang, Q.Q.; Ding, J.J.; Xu, Y.P.; Zhou, Y.K. Effect of Urbanization on Regional Precipitation in the Qinhuai River Area, East China. Appl. Mech. Mater. 2012, 174, 2481–2489. [Google Scholar] [CrossRef]
- Kug, J.-S.; Ahn, M.-S. Impact of urbanization on recent temperature and precipitation trends in the Korean peninsula. Asia-Pac. J. Atmos. Sci. 2013, 49, 151–159. [Google Scholar] [CrossRef]
- Guo, X.; Fu, D.; Wang, J. Mesoscale convective precipitation system modified by urbanization in Beijing City. Atmos. Res. 2006, 82, 112–126. [Google Scholar] [CrossRef]
- Thiede, B.C.; Ronnkvist, S.; Armao, A.; Burka, K. Climate anomalies and birth rates in sub-Saharan Africa. Clim. Chang. 2022, 171, 5. [Google Scholar] [CrossRef]
- Li, L.; Yao, N.; Liu, D.L.; Song, S.; Lin, H.; Chen, X.; Li, Y. Historical and future projected frequency of extreme precipitation indicators using the optimized cumulative distribution functions in China. J. Hydrol. 2019, 579, 124170. [Google Scholar] [CrossRef]
Publisher’s Note: MDPI stays neutral with regard to jurisdictional claims in published maps and institutional affiliations. |
© 2022 by the authors. Licensee MDPI, Basel, Switzerland. This article is an open access article distributed under the terms and conditions of the Creative Commons Attribution (CC BY) license (https://creativecommons.org/licenses/by/4.0/).