Article

Assessing Rail Station Accessibility Based on Improved Two-Step Floating Catchment Area Method and Map Service API

School of Architecture and Art, North China University of Technology, Beijing 100144, China
*
Author to whom correspondence should be addressed.
Sustainability 2022, 14(22), 15281; https://doi.org/10.3390/su142215281
Submission received: 27 September 2022 / Revised: 12 November 2022 / Accepted: 13 November 2022 / Published: 17 November 2022

Abstract

:
Accessibility is an important index for evaluating the efficiency of rail stations. In view of the imbalance between the supply and demand of rail station settings and population distribution, this paper takes the Shijingshan District in Beijing as an example. Based on the Gaussian two-step floating catchment area method and Gaode map’s service interface, the accessibility of rail stations is simulated and analyzed in terms of both walking and riding. Combined with the calculation results, supply and demand relationship and trip time, the current characteristics and causes are analyzed, and the corresponding optimization suggestions are put forward. The main conclusions are as follows: (1) The accessibility distribution of rail stations in the Shijingshan District is relatively coordinated with the population distribution. The effectiveness of the accessibility assessment of rail stations can be further improved by improving the causal evaluation model with traditional calculation data; (2) The change of trip mode has a small impact on the accessibility of large stations, while small stations and areas with uneven station distribution can be improved by riding; (3) According to the K-value clustering method, the results of the two calculation methods are divided into five categories, and each category of demand units has different accessibility characteristics and causes; (4) Comprehensive accessibility is positively correlated with road density and population density.

1. Introduction

In large and medium-sized cities in China, the rail transit network has gradually taken shape, and it has also become the main role of urban public transportation [1]. The accessibility of rail stations reflects the convenience of the “last kilometer” of rail transit trips. It is of great significance to improve the use efficiency of rail stations and to build a public transport system with rail transit as the core.
The study of accessibility was first applied to public service facilities. In 1959, Hansen defined accessibility, for the first time, to represent the difficulty of reaching a particular destination, which was subsequently widely used in urban and rural planning, geographical mapping and other disciplines [2]. The study of rail transit accessibility is primarily divided into the study of rail station accessibility and rail transit network accessibility research. For example, Cheng Changxiu studied the accessibility of subway lines, transfer stations and all-terminal stations in Beijing [3]. Wei Panyi et al. studied Beijing metro lines based on bus transfer and accessibility between rail stations [4]. Yao Zhigang et al. optimized the linear buffer zone method, and put forward the road network distance buffer zone method and the road network attenuation method [5]. Ma Shuhong et al. calculated the accessibility of different trip modes and stations by determining the radiation range of stations to different connection modes [6].
From the above studies, fewer studies on rail transit accessibility focus directly on the accessibility of stations. Zuo et al. studied the relationship between the slow road network connectivity of the bus station and the bus trip [7], and the impact of slow traffic on the accessibility of public transport is also discussed, however, the object of the study is the whole process of a bus trip [8]. Although Wei Panzhihua studied the accessibility of the station, it mainly took the convenience of bus transfer and inter-station transfer [4]. These studies have focused on site accessibility issues, but few studies have analyzed site accessibility from the perspective of residents’ needs.
Accessibility measurement methods usually include the coverage method, nearest distance method, gravity model method and two-step floating catchment area method. Among them, the coverage method takes the total population or coverage proportion within the service area as the standard, which has a poor effect on the spatial difference of accessibility within the service area; the nearest distance method takes the trip cost as an indicator to reflect the accessibility of residents and lacks a consideration of the impact of the site itself on accessibility. The gravity model has factors such as site supply capacity and trip cost, however, lacks consideration of residents’ needs. The two-step floating catchment area method is modified based on the gravity model. By searching and analyzing the stations (supply side) and trip starting point (demand side), respectively, it can be used to measure the accessibility of rail stations at the trip starting point and identify the low-value areas of accessibility [9]. The traditional two-step floating catchment area method deals with the relationship between the supply side and the demand side, without distance attenuation, within the distance threshold, and it is inaccessible beyond the threshold. In the development process of this method, some scholars have improved it and added different impedance functions to make it more reasonable. The main functions are power, exponential and Gaussian [10]. The first two functions perform slightly better because of the rapid decline at the threshold point and the Gaussian decay in the threshold range [11,12].
The two-step floating catchment area method has been more frequently applied to the assessment of the accessibility of various public service facilities. Among them, Hu Ang et al. used the two-step floating catchment area method to analyze the spatial distribution, supply and demand of green space in the central districts of Chengdu [13]; Zhang Yanlin et al. analyzed the spatial accessibility and characteristics of elementary school education resources in Zhuzhou County, using the Gaussian two-step floating catchment area method and Gaode Map API [14]; Rao Yingxue et al. used a gravity-based two-step floating catchment area method to explore the accessibility of education resources in urban areas of Wuhan City under different impact factors [15]; Peng Jiandong et al. used the two-step floating catchment area method with multisource big data to evaluate the accessibility of elderly facilities and services in Wuhan [16]; Yang Li et al. studied the equilibrium and accessibility of the spatial distribution of medical resources in Nanjing using the two-step floating catchment area method [17].
In summary, the two-step floating catchment area method is primarily applied to the equilibrium and accessibility of public service facilities, such as parks and green spaces, educational resources, elderly service facilities and medical resources. However, research on the accessibility of rail transit stations uses the two-step moving search method less often, indicating that few scholars analyze the accessibility of rail stations from the perspective of supply and demand.
In addition, with the use of internet map API, scholars have begun to explore the use of big data to study the accessibility of rail stations [18,19,20,21], which has improved the accuracy and fit to daily life. By using internet map API, Xiao Bohua et al. proposed a computational method that integrates internet map data and network analysis, then used the method to analyze the urban rail transit planning scheme of Wuhu [22]. Dai Zhi et al. used internet map open source data and path planning API to quantitatively evaluate the accessibility index, using Shenzhen rail stations as an example [23]. Guo Peng et al. used internet map data to measure the accessibility and sensitivity analysis of green spaces in the central city of Tianjin [24]. Zheng Zhicheng et al. used internet map services and combined multi-source big data to explore the accessibility and driving formation mechanism of Kaifeng [25]. Qi Xiaoxing et al. used internet map POI data to analyze the spatial heterogeneity of the use of underground space in Jinan [26]. All the above studies used internet map API and conducted relevant research analysis, which showed that the internet map API data had a better fit with reality and was more helpful for the relevant research.
The accessibility of rail transit stations can be evaluated from the perspective of supply and demand by using the two-step floating catchment area and the Gaode map API. It can complement the calculation method of rail transit station accessibility. In addition, the use of Gaode Map API for relevant data acquisition can improve the accuracy of data acquisition and the degree of fitting with real life. The evaluation method of rail transit station accessibility is refined and expanded.

2. Materials and Methods

Based on the above, this study will take the two-step floating catchment area method as the main research method, make use of the path planning service provided by Gaode map service API (https://lbs.amap.com/api/webservice/guide/api/direction, accessed on 1 April 2022. Products of Alibaba Group, Hangzhou, China), and rely on ArcMap 10.6 (Products of Environment System Research Institute, Redlands, CA, USA) and IBM SPSS Statistics 23 (Products of IBM, New York, NY, USA). The accessibility of rail stations in the Shijingshan District of Beijing is studied and analyzed. In this way, the research field of existing theories and methods can be expanded, and the dynamic balance regulation strategy can be formulated to effectively adapt to external intervention, and the method guidance can be provided in the planning and management of orbital station area.

2.1. Study Area

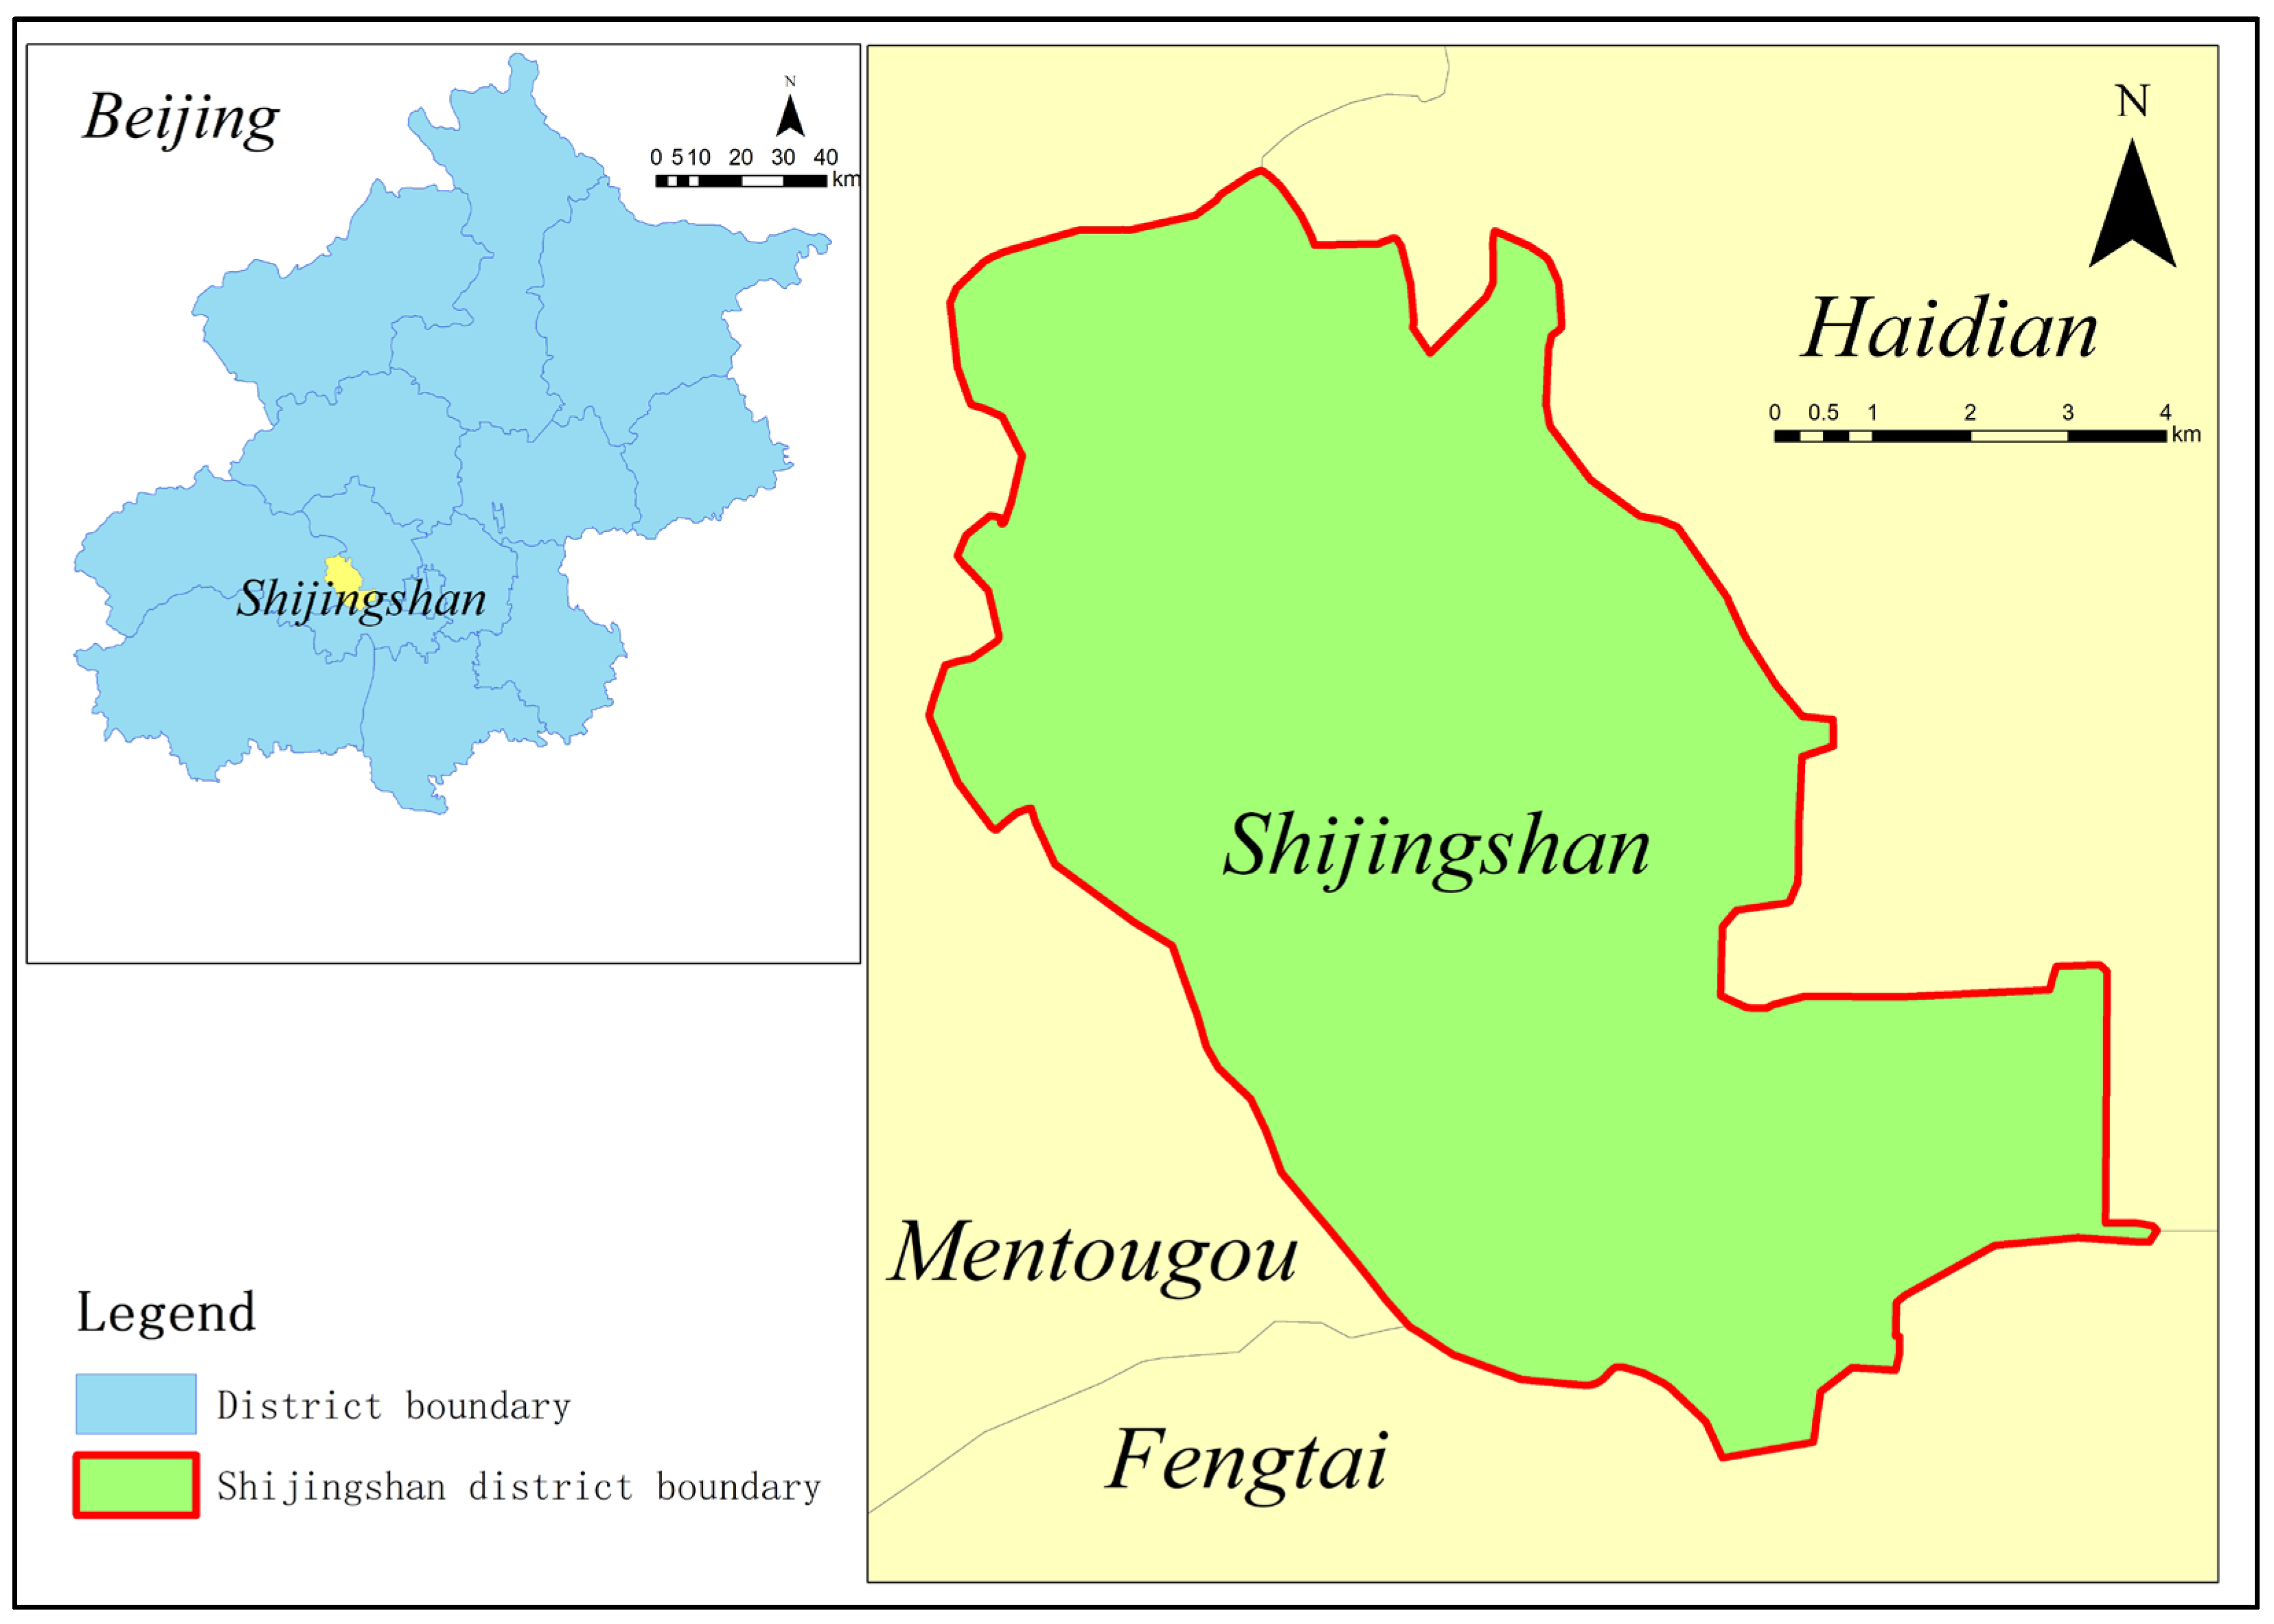
This paper takes the Shijingshan District of Beijing as the study area, with a total area of 85.74 km2 and 9 subdistricts under its jurisdiction, with a permanent population of 568,000 by 2020 (Figure 1). The area includes two tourist attractions: Xishan Park in the north and Shougang Industrial Park in the west. It not only has rich tourism resources, but also has concentrated transportation resources. It has a multi-level urban transportation system including subway, bus and Ring highway.

2.2. Data Source

2.2.1. Rail Station Data

The Shijingshan administrative boundary vector data was obtained through the national geographic information resource catalog service system, and the poi service, provided by Gaode map open platform, was used to obtain the location of rail stations; the poi data were sorted and screened according to the administrative boundary of Shijingshan. The road layer data from the Open Street Map.
A total of 11 poi data of rail stations were obtained (including the upcoming mode port station and the reconstructed Fushouling Station). The construction of the mode Moshikou station was completed, and the opening was delayed. Fushouling Station is planned to be opened, but is still in the reconstruction state. The specific construction results are unknown; therefore, the data retention mode port station data of Fushouling Station were deleted. In addition, the stations close to the boundary of the Shijingshan District are Yuquan Road Station of Line 1, Liaogongzhuang Station of Line 6 and Siqiao Station of Line S1. Among them, Liaogongzhuang Station and Tiancun Station and Shijingshan are separated by the fifth Ring Road and Fushi Road with a large barrier of space, and large distance, low accessibility. The four Road Bridge Station and the Shijingshan District are connected through the Shougang Bridge, with low accessibility, meaning the two stations are not used. Yuquan Road Station is located at the boundary of the Shijingshan District, surrounded by convenient transportation, leaving the data of the station.
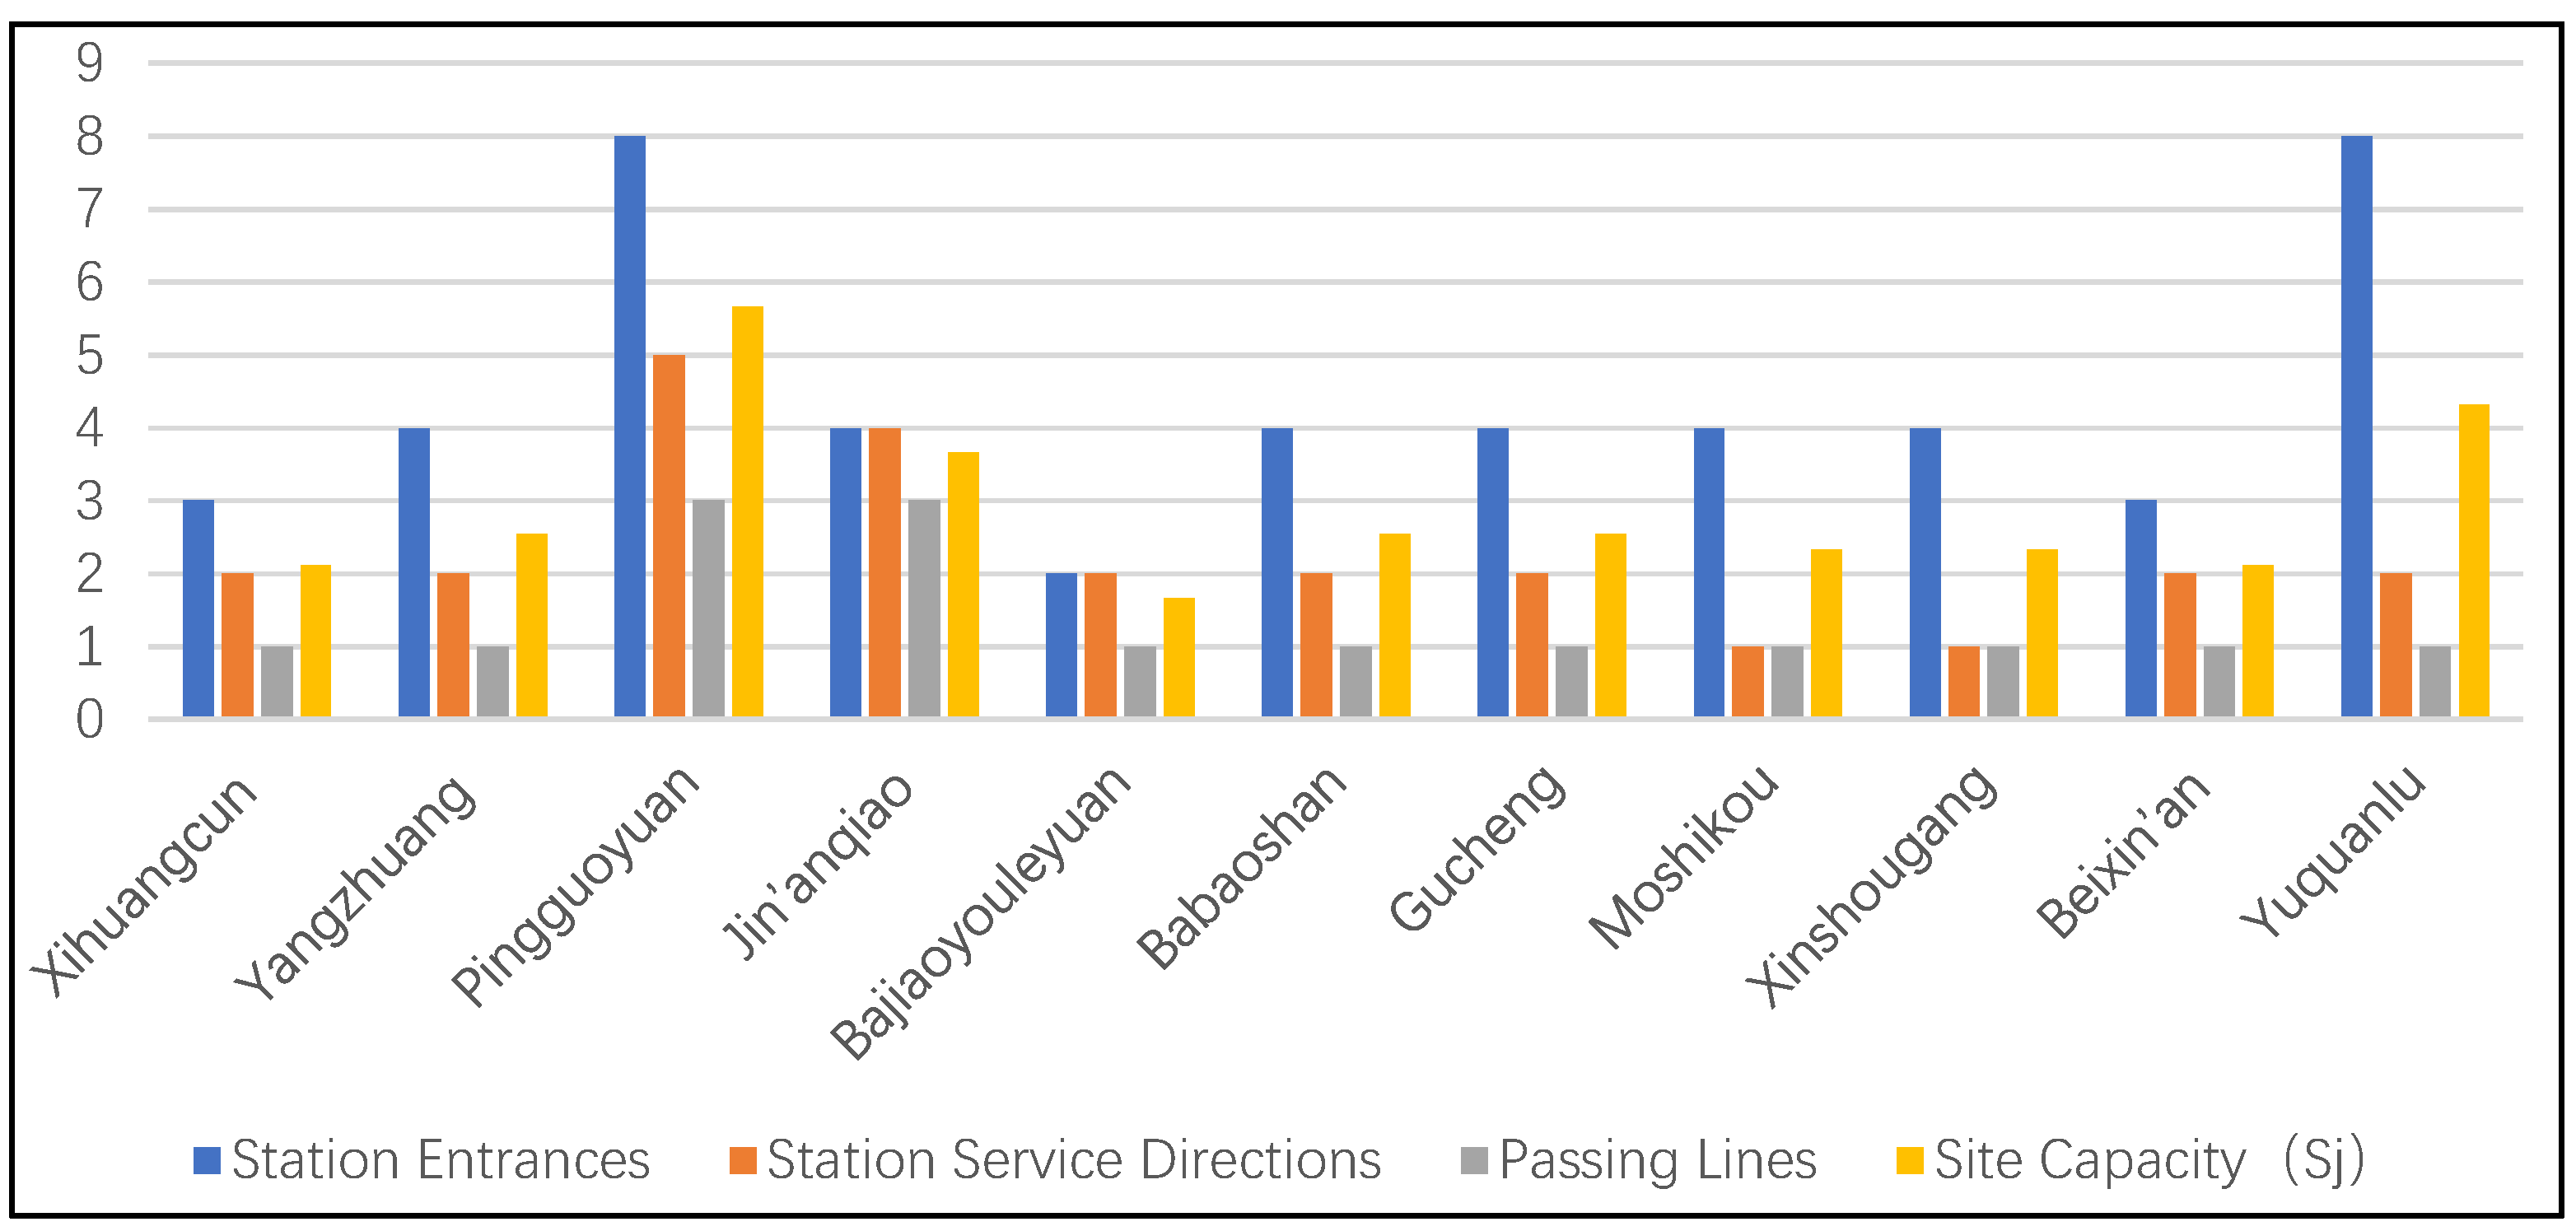
In this study, the supply quantity is represented by the carrying capacity of rail stations. The number of station entrances and exits [27,28,29], the number of station service directions [30], and the number of lines passing through the station are selected as indicators to evaluate the carrying capacity [27,31]. The data related to the carrying capacity of specific stations are obtained from the official website of Beijing Metro and field research.
Among them, the greater number of entrances of the site, the stronger the radiation capacity of the site to the surrounding plots, and the higher the service capacity. The number of service directions of a station is the sum of the line directions of the station. Usually, it is 2 for a non-transfer station, and the same direction for different lines of a transfer station is regarded as 1. The greater the number of service directions, the stronger the service capability. The number of lines passing through a station is the number of lines at the station. For example, Xihuangcun Station of Beijing Metro Line 6 is a common station, and there is only one line passing through line 6, so the number is counted as 1. Jin’anqiao Station of Beijing Metro is a transfer station between Line 6 and Line S1. If Line 6 and Line S1 pass through the station, the number is counted as 2.
In order to reflect the differences in weights between indices, Critic weighting was used in this study.
The Critic weight method is an objective empowerment method that comprehensively measures the objective weight of indicators, based on the contrast intensity and conflict between evaluation indicators. Among them, the contrast intensity is expressed in the form of standard deviation, referring to the value gap between each index. The larger the standard deviation, the higher the weight. Conflict is expressed by the correlation coefficient. A larger correlation coefficient is considered to have a strong positive correlation between the indicators; the smaller the conflict, the more the weight will be reduced. Based entirely on the index data itself, the Critic weight method can take into account the index variability, but also takes into account the correlation between the indicators, and uses the objective attributes of the index itself for scientific evaluation.
This study was calculated and assigned to each index using IBM SPSS Statistics 23, and the results are presented in Table 1.
The carrying capacity results were calculated with the specific data of Shijingshan rail stations in Figure 2.
The carrying capacity of the station calculated by the above method is the relative carrying capacity of the rail stations in the Shijingshan District, and the relative carrying capacity is expressed by numerical value, not the specific quantitative carrying capacity of the station. Among the 11 stations studied, Pingguoyuan Station has the strongest supply capacity, followed by Yuquan Road station, and octagonal amusement park station has the worst supply capacity.

2.2.2. Population Data

This study uses the residential area as the basic demand unit, and the demand data is the population number of the residential area. The Gaode map open platform was used to obtain the poi data of residential areas in the Shijingshan District, and to use the administrative boundary of the Shijingshan District for screening a total of 274 cases.
Step 1: Population grid data correction is performed. Using the grid data of a 100 m resolution population distribution, in 2020, in China, provided by the WorldPop website (https://hub.worldpop.org/geodata/summary?id=6524, accessed on 4 May 2022), the population data of each street in the seventh National Census (https://xxgk.bjwmb.gov.cn/wmcj/202106/t20210626_849142.htm, accessed on 4 May 2022) of the Shijingshan District (Table 2) is corrected. The results obtained are shown in Figure 3:
Step 2: Establish a requirement unit. Firstly, through the obtained Poi of the Gaode map service API residential area, the administrative boundary of the Shijingshan District is taken as the area in which to build a Tyson polygon to obtain the coverage area of each residential area. Secondly, create a buffer with a radius of 500 m through Poi. The data were obtained in two steps of clipping to avoid a Tyson polygon that is too large being formed by marginal or sparse location plots, resulting in data distortion. Finally, the modified population raster data partition is assigned to the trimmed result to obtain the demand unit and the corresponding population number. This resulted in 274 demand units. Compared with the traditional TAZ traffic district, this method is more refined and the data is more accurate.

2.2.3. Trip Time Data

Real travel time data were obtained using the path planning web service API of Gaode map (https://lbs.amap.com/api/webservice/guide/api/direction, accessed on 1 April 2022). Gaode path planning has a major advantage over other GIS simulation methods. This is because, when calculating the travel path and travel time, the Gaode path planning API takes into account the terrain and basic access facilities, such as hills, ramps, flyovers and road conditions. Therefore, the travel time obtained through path planning is the real-life travel time.
Transport modes included walking and riding a bike. First, by setting the Poi of the map service API residential area as the origin (O) and all rail stations as the destination (D), the travel time for each OD pair was calculated using Python. The times that were shorter than 900 s were then selected as the travel time for this residential area to reach the rail station. Through cyclic calculation, the travel time from each residential area to all stations was finally obtained. To avoid commuting congestion, we selected 10:30–16:00 on weekends as the data collection time.

2.3. Methodology

2.3.1. Research Framework

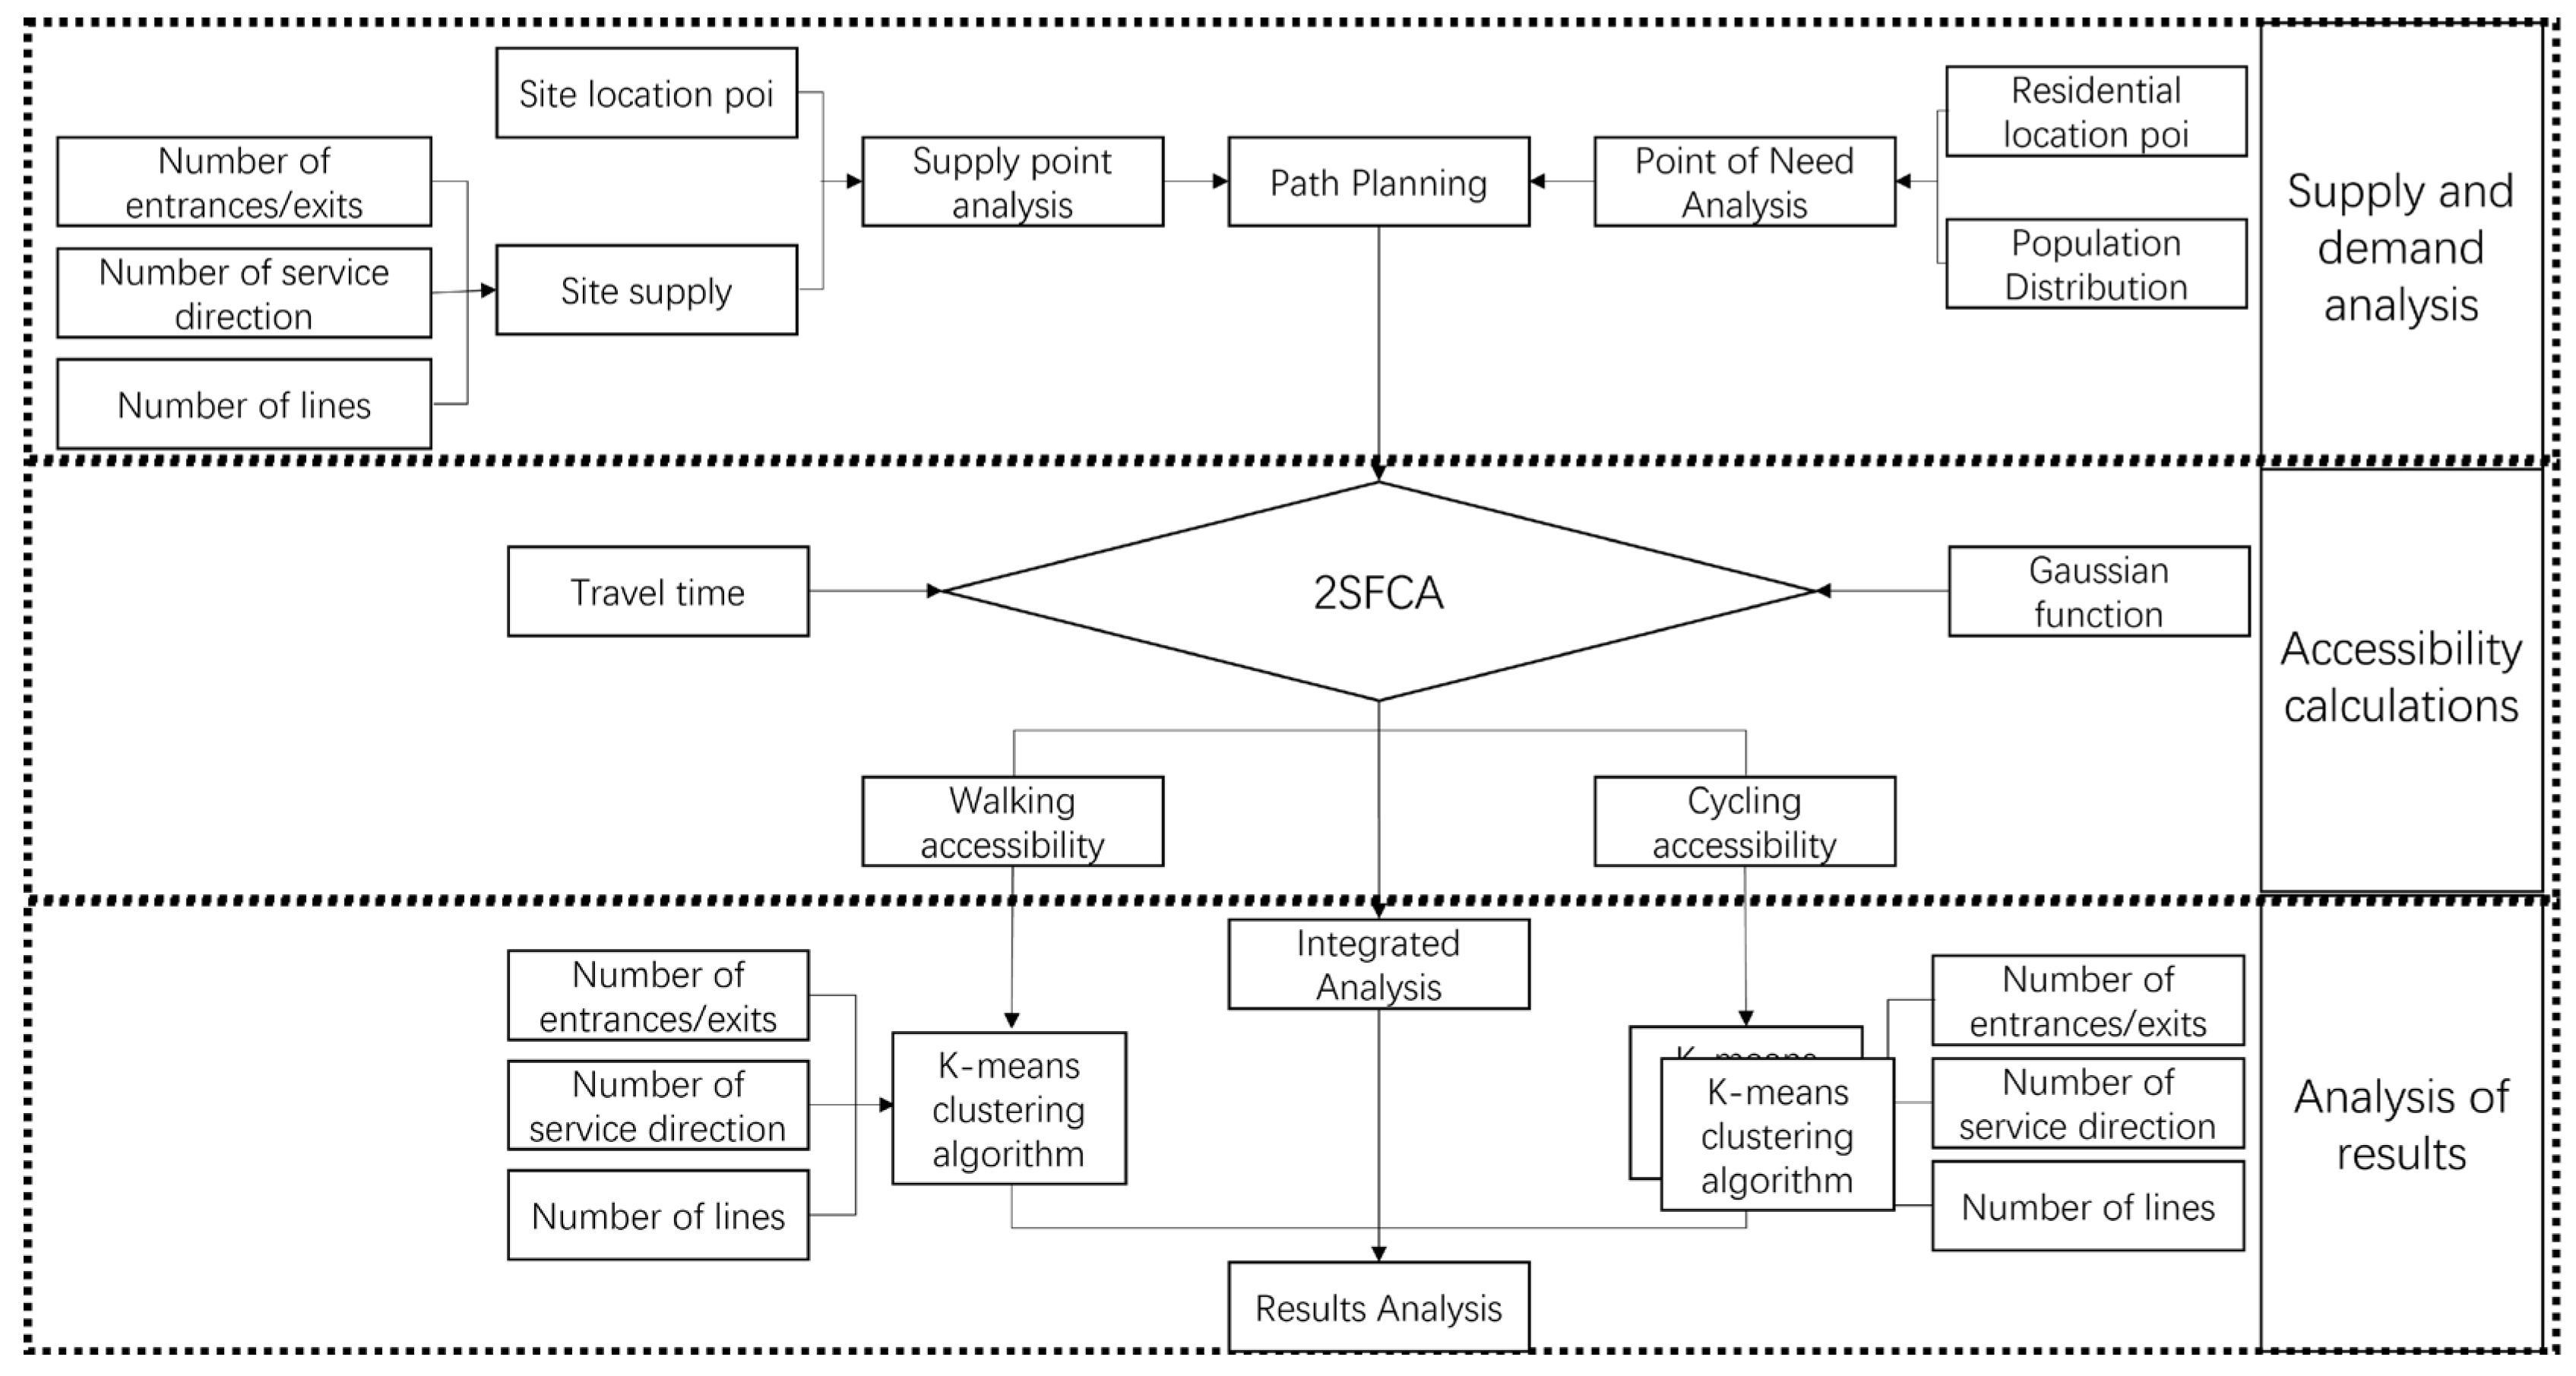
In this study, a two-step floating catchment area method was used to establish an accessibility evaluation model for rail stations. The main research links include supply and demand unit determination, supply side analysis, demand side analysis, accessibility evaluation and result analysis.
The first is the determination of the supply and demand units. The Poi service provided in the Gaode map open platform is used to obtain the rail station in the Shijingshan District as the supply side, and the residential area as the station demand side. The results of the seventh National Census in the Shijingshan District and the grid map of the population distribution at 100 m in the WorldPop website were used as the main basis. Secondly, the supply capacity of the supplier adopts the site carrying capacity as the main standard and evaluates the site carrying capacity by field research and Critic weight method to obtain the relative value of the site carrying capacity. Compared with the site passenger flow volume, instead of the supply capacity, the data deviation problem caused by the newly opened lines (such as Line 11) is solved. On this basis, through the path planning service provided by the Gaode map, taking the supply side and the demand side as the starting and ending points, for both walking and riding, the result and the corresponding time are selected. Finally, these were analyzed and summarized using the K-value clustering method [32], Analyze the reasons for the current difference of site accessibility distribution, and put forward the corresponding optimization scheme (Figure 4).

2.3.2. Evaluation of Accessibility Based on the Two-Step Floating Catchment Area Method

As the most basic impedance factor in the trip process, time can better reflect the essence of accessibility than the distance factor [10]; therefore, this study takes time cost as the calculation threshold instead of distance cost. In terms of time cost calculation, the path planning services provided by the Gaode map can consider other road factors, such as road conditions, which are more consistent with the real situation of residents’ daily trip and are more accurate than using GIS road network analysis and the OD matrix. Therefore, in this study, the Gaussian two-step floating catchment area method is adopted, and the return time of the Gaode map path planning is taken as the trip cost in order to establish the accessibility model of rail stations, which can be divided into the following three steps:
Step 1: Take the location of the rail station (supply point j) of Autonavi Poi climb as the center, and the limit time for residents to go to the station is t0. The search area was established for the radius, all the demand unit data was searched, and the demand unit data was summed to obtain the total demand side population data in the region. To calculate the supply-demand ratio Rj, the specific calculation method is as follows:
R j = S j k t k j t 0 G t i j D k
In formula: Dk is the number of population per demand population unit, tkj (s) is the time cost between the demand point k and the supply point j, the demand point k is within the threshold range (tkj ≤ t0). Sj is the supply quantity of the rail station, namely the supply point j. This study takes the carrying capacity of the rail station as the supply quantity. G (dij) is the Gaussian function considering the time decay:
G d i j = e 1 2 t i j t 0 2 e 1 2 1 e 1 2 ( t i j < t 0 )
Step 2: For any population, the unit position demand point i radius is to limit time t0 rail transit site, set up the search area, search of all rail transit site supply point j. By summation of the supply and demand ratio Rj of these rail transit stations, the accessibility Ai of rail transit stations based on distance cost for residential location i is obtained. The larger the Ai, the higher the spatial accessibility of rail transit stations within the range of the distance threshold, and the lower the accessibility otherwise. The specific calculation method is as follows:
A i = j t i t 0 G t i j R j
Step 3: The results of the accessibility calculation were divided into five categories of high accessibility, relatively high accessibility, medium accessibility, relatively low accessibility and low accessibility, in the way of natural discontinuity points for horizontal comparison.

3. Results and Discussion

3.1. Analysis of the Accessibility Results of Different Trip Modes

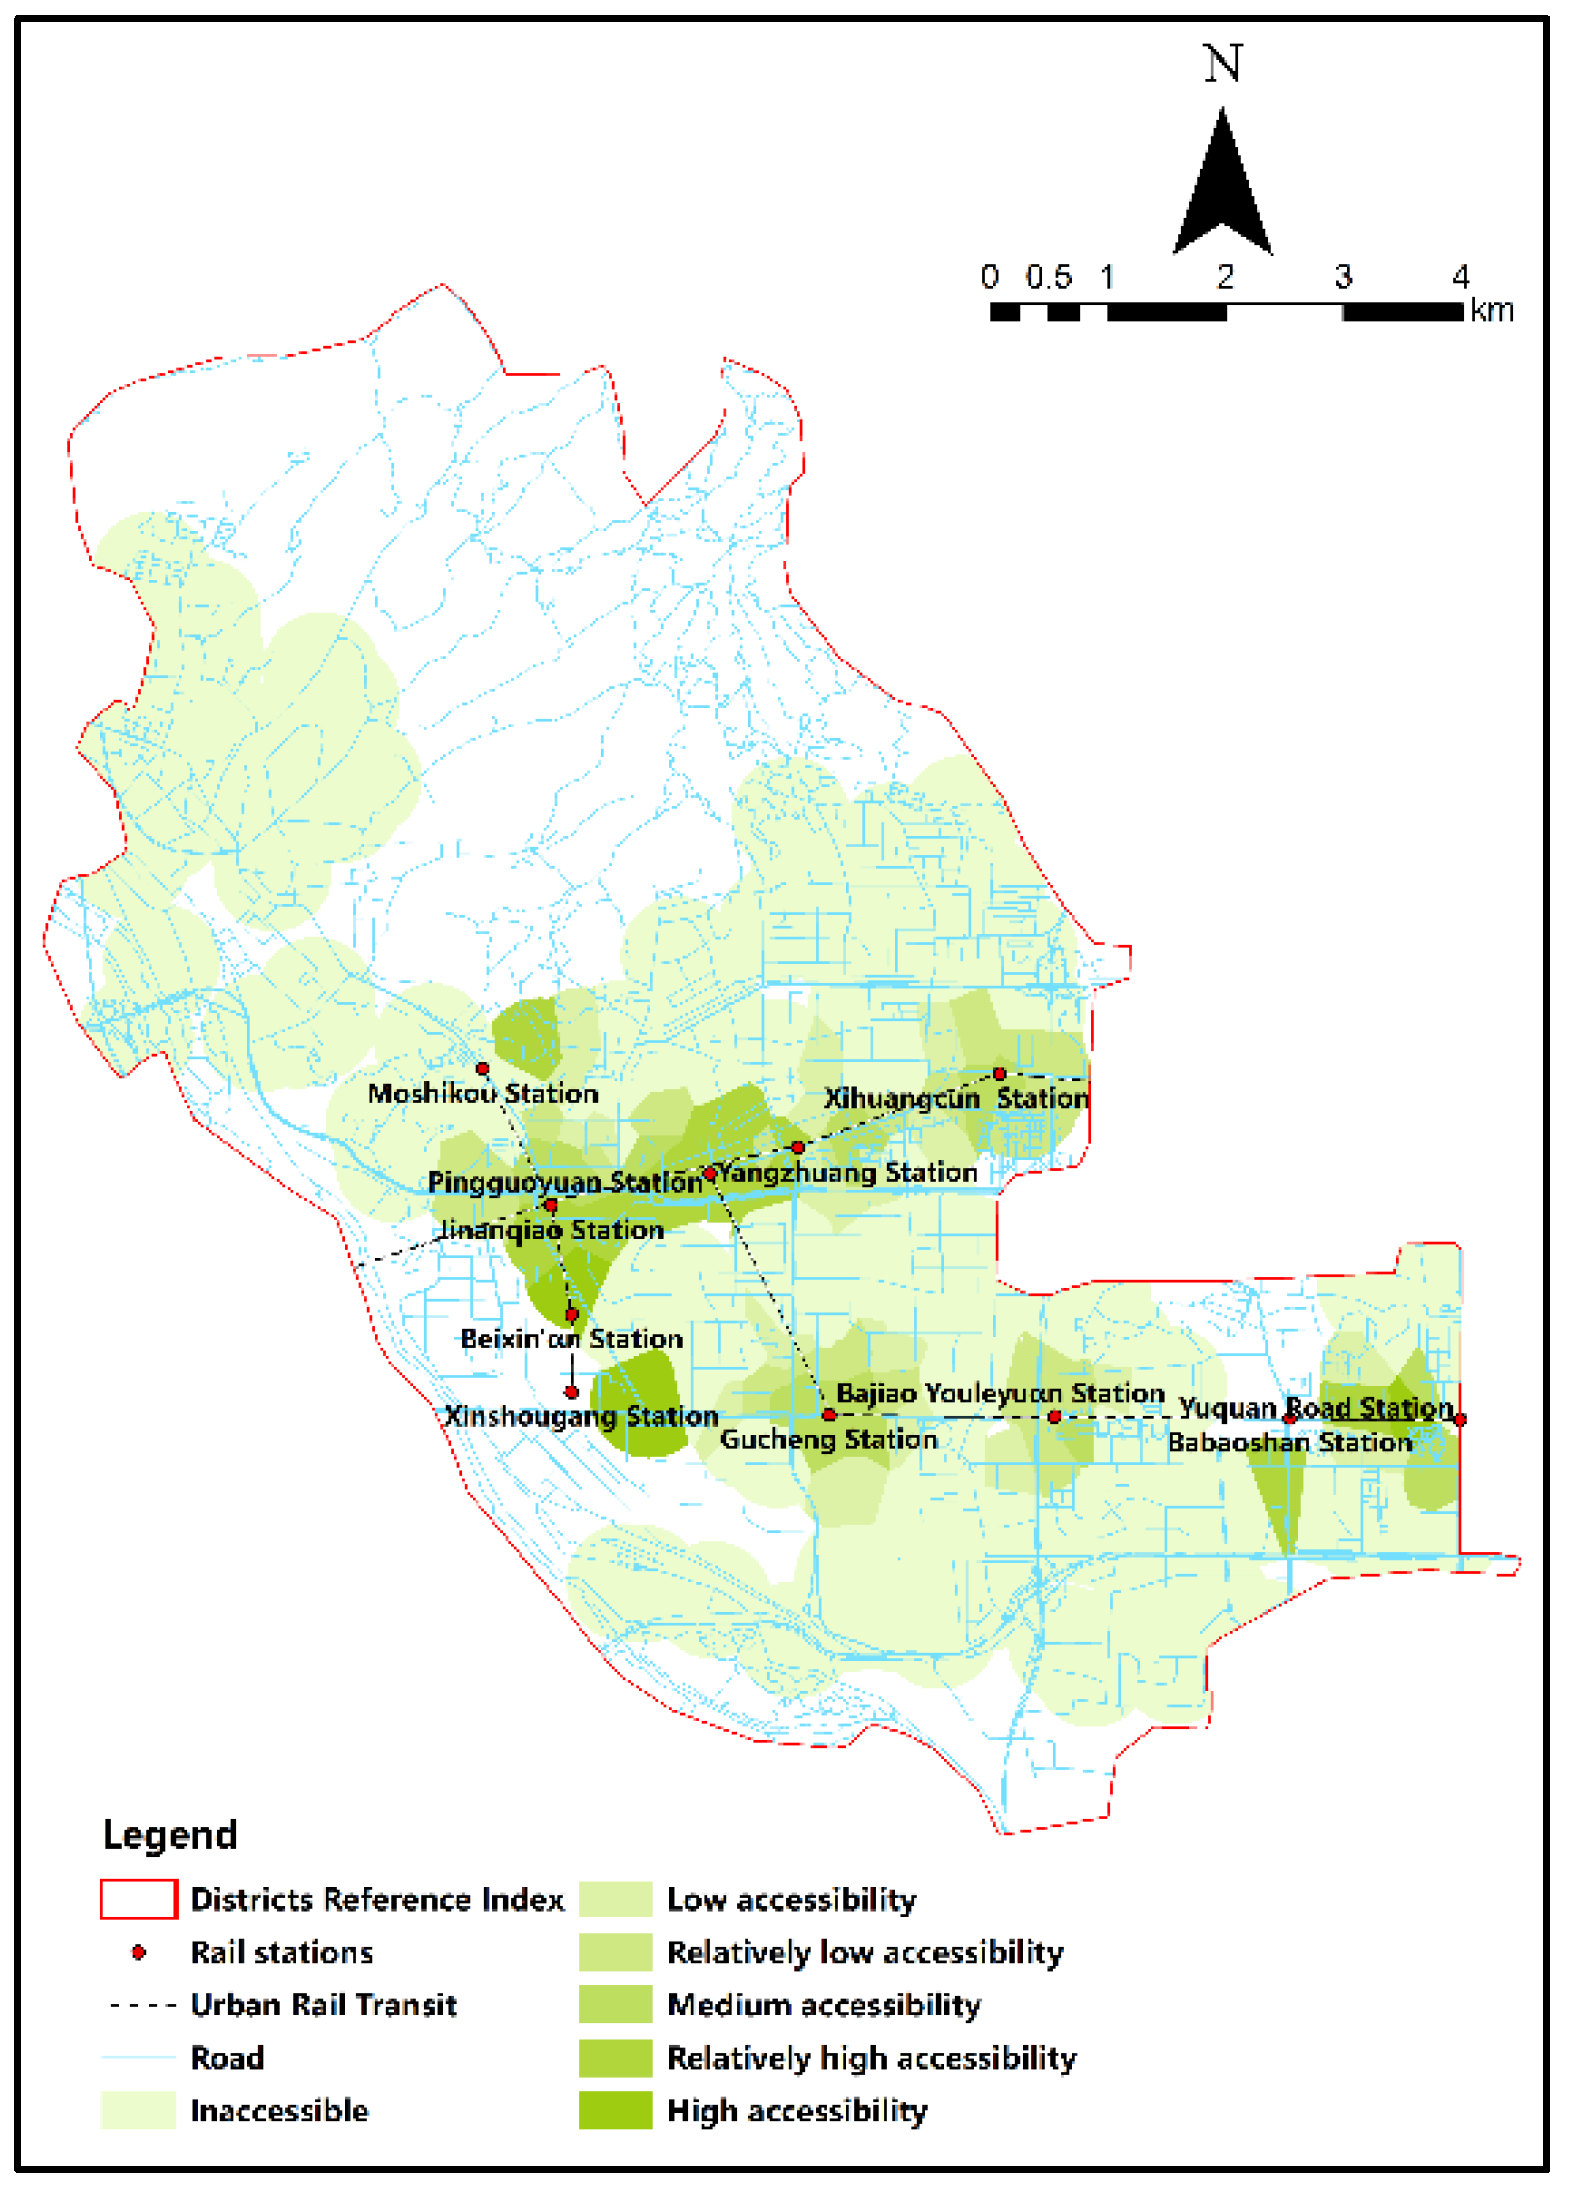
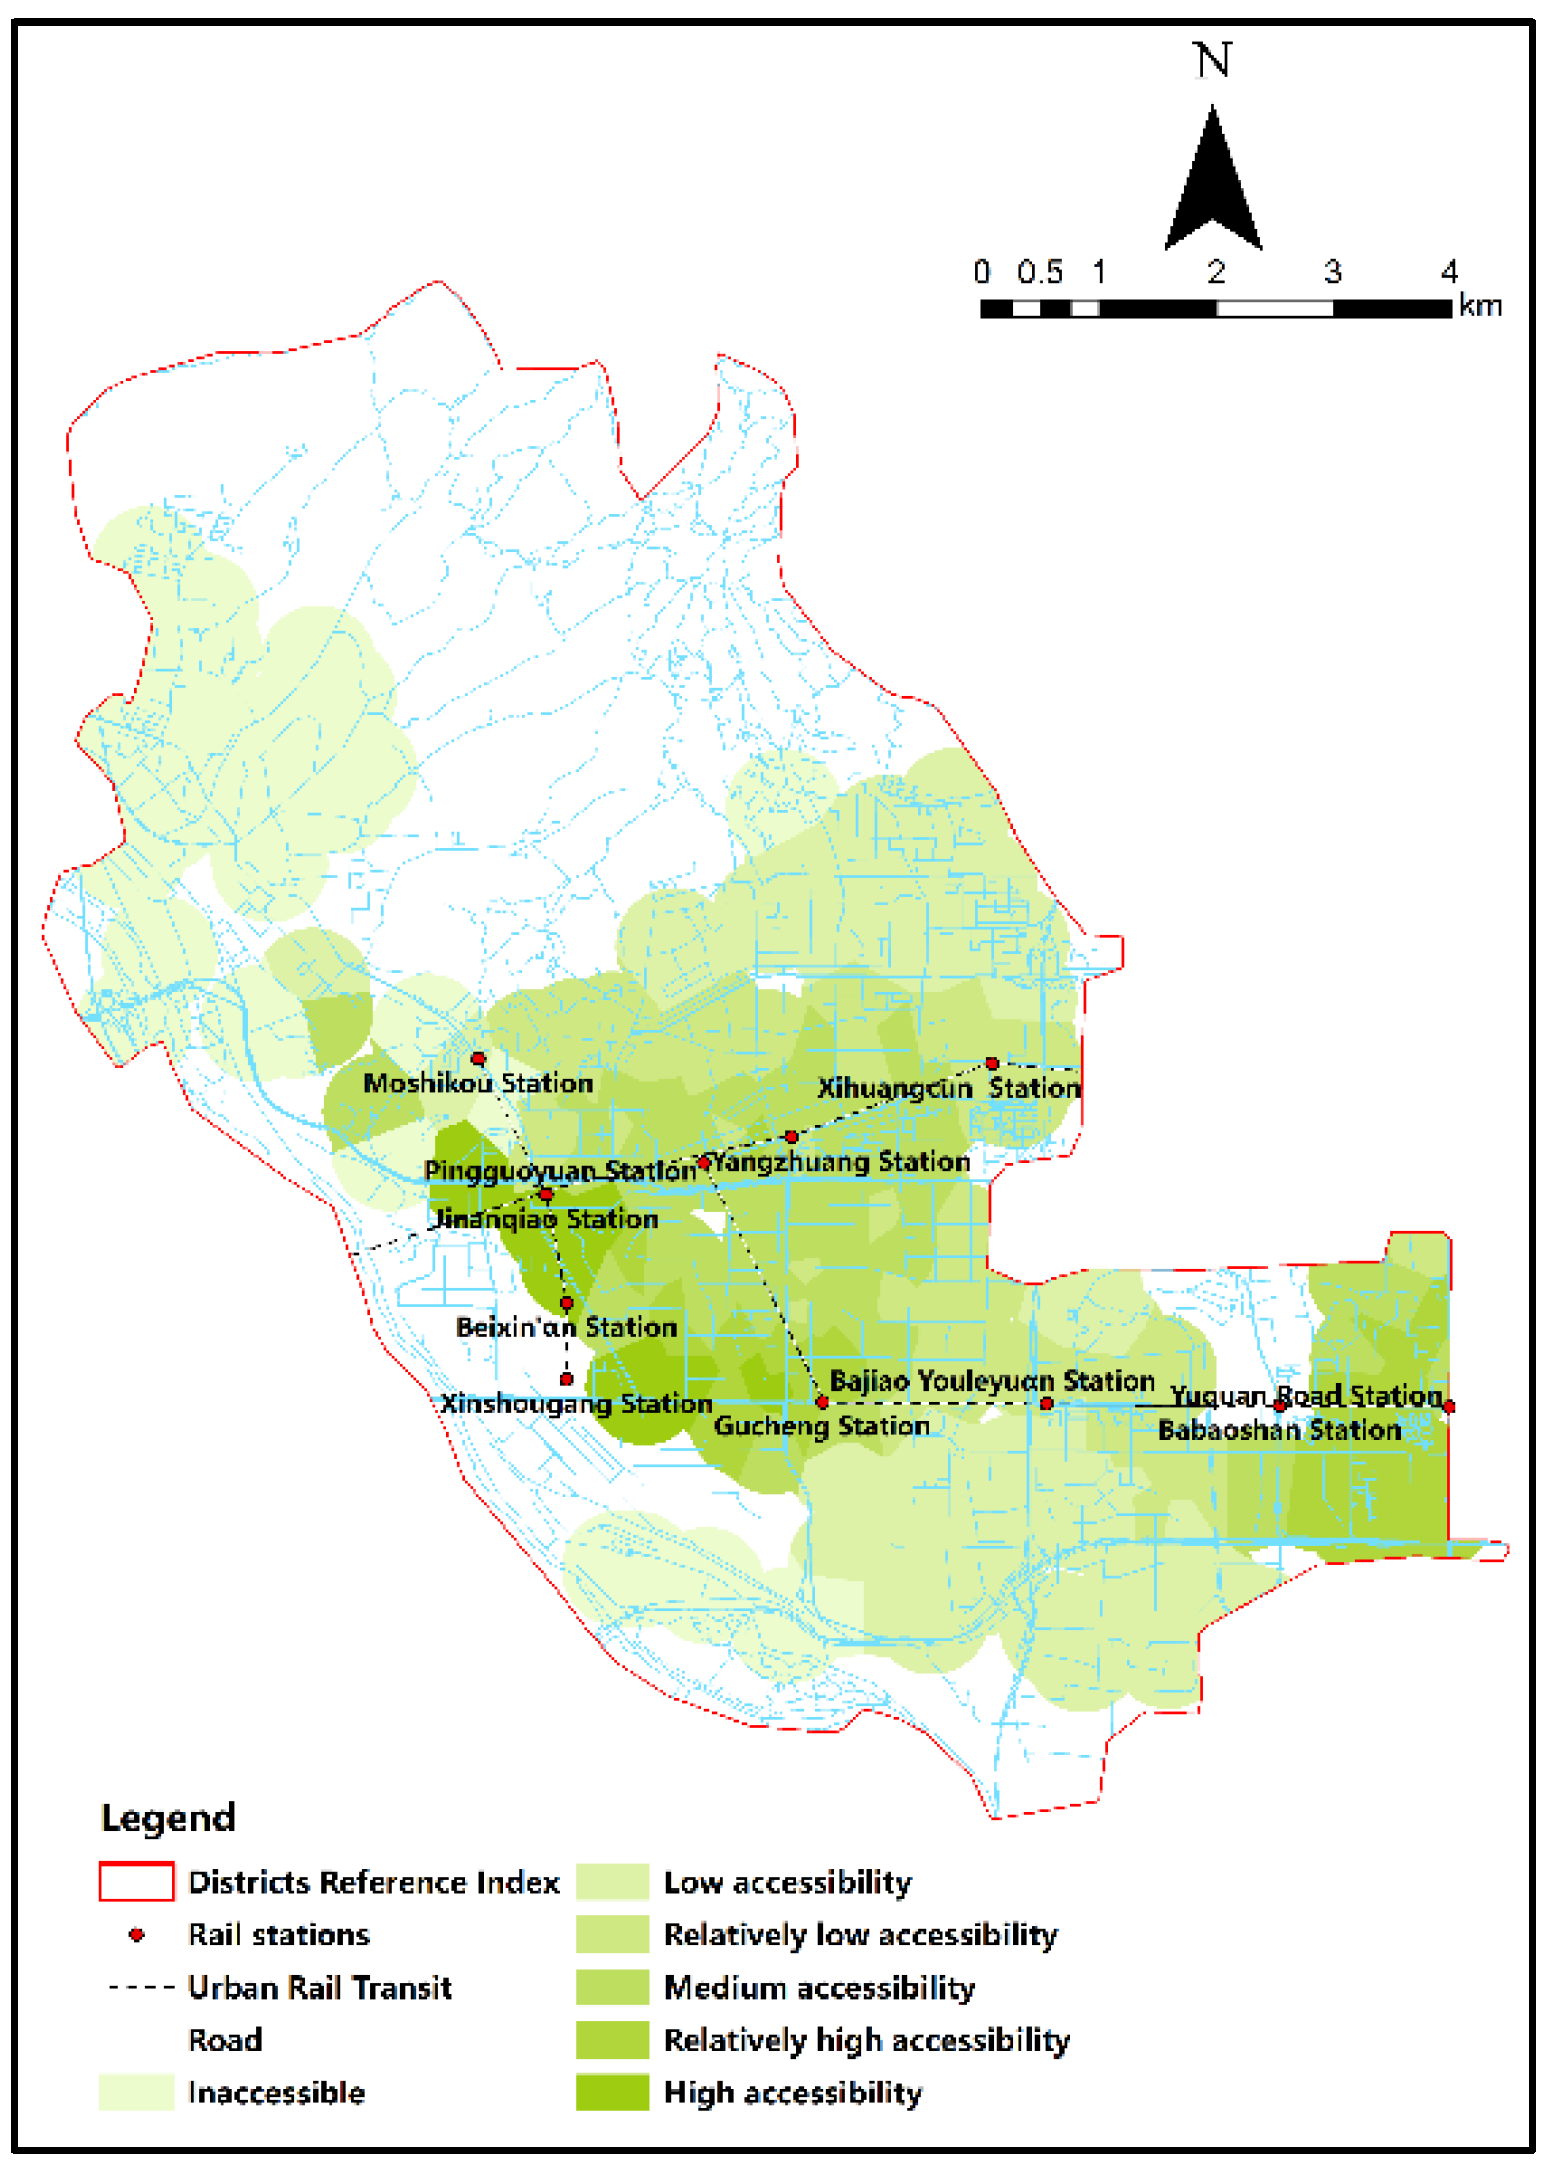
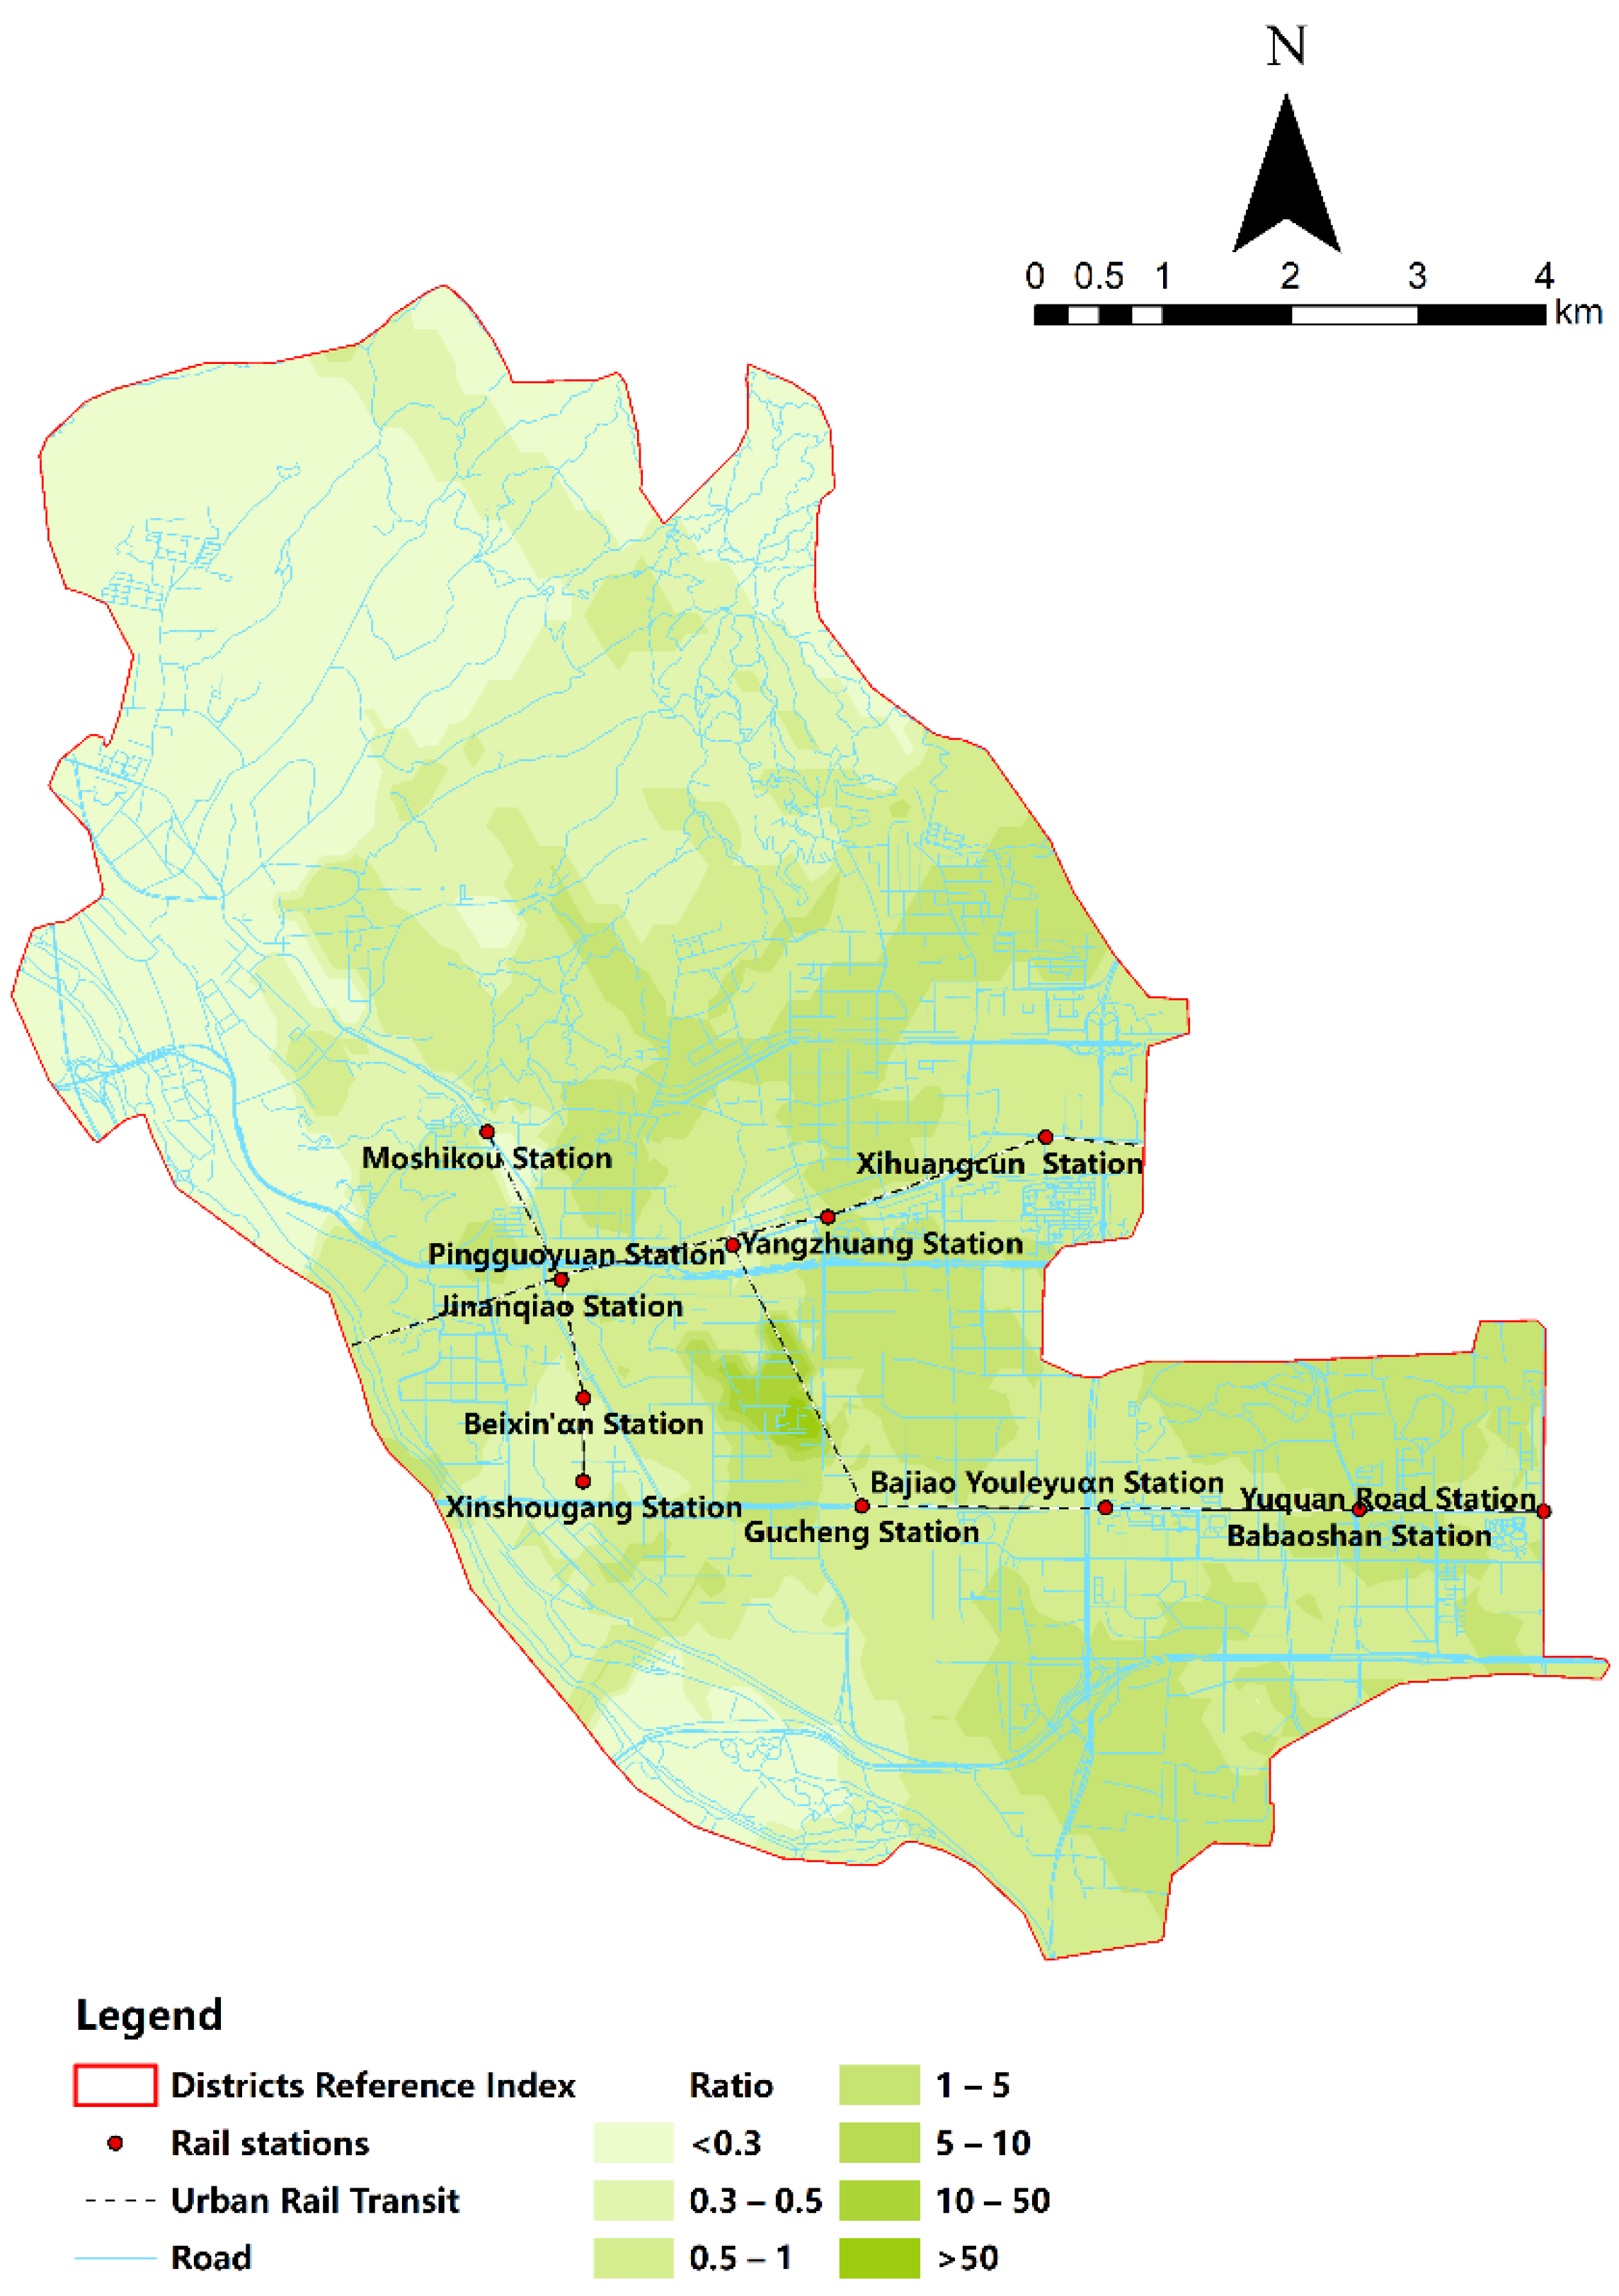
Computational analysis used 15 min of walking and 15 min of riding as thresholds, forming the analysis results into a visual figure, and the results are shown in Figure 5 and Figure 6. The results conclude: inaccessible region, low accessibility region, relatively low accessibility region, medium accessibility region, relatively high accessibility region, and high accessibility region.
According to the 274 demand units obtained in the previous step, when the trip mode is walking, 91 demand units can walk to the rail stations within 15 min, accounting for 33.21% of the number of demand units in the whole region. The 22 accessible demand units are above the average, accounting for 24.18% of the walking units. When the trip mode is riding, the riding time of 238 demand units to the rail transit station is less than 15 min, accounting for 86.86% of the total number of demand units in the whole region. Among them, 87 of the accessible demand units have higher accessibility than the average value, accounting for 36.55% of the number of achievable by riding (Table 3). The results show that the overall accessibility of rail transit stations in the Shijingshan District is 254 low, and the accessibility of riding is significantly higher than that of walking.

3.2. Comparative Analysis of the Two Trip Modes

In order to further reflect the impact of the two different modes of trip on the demand unit, the results of riding are compared with the 91 demand units that can walk to the station. If the riding site accessibility is higher than walking, the ratio is greater than 1, and the inverse is less than 1 (Table 4). As shown in the results, a total of 36 demand units have improved their accessibility after using cycling, among which three units, namely the Gucheng Ruyi community, Shougang Guxi residential area and Beijing Xixiandaicheng City, have obvious optimization effects by using cycling. The Kriging interpolation method was used in ArcGIS to visualize the comparison results (Figure 7). It can be clearly seen that the accessibility of demand units between Gucheng Station and Pingguoyuan Station of Line 1 increased significantly after cycling. The units with reduced accessibility are mainly located near Pingguoyuan Station and Yuquan Road Station.
Through the above analysis, the conclusion is drawn: (1) Riding can improve the accessibility of stations with inadequate development and uneven distribution areas. (2) For the surrounding areas of stations with a high carrying capacity and more mature development, the same travel mode has little impact on the accessibility.

3.3. Comparative Analysis of Shijingshan with Dongcheng District and Xicheng District

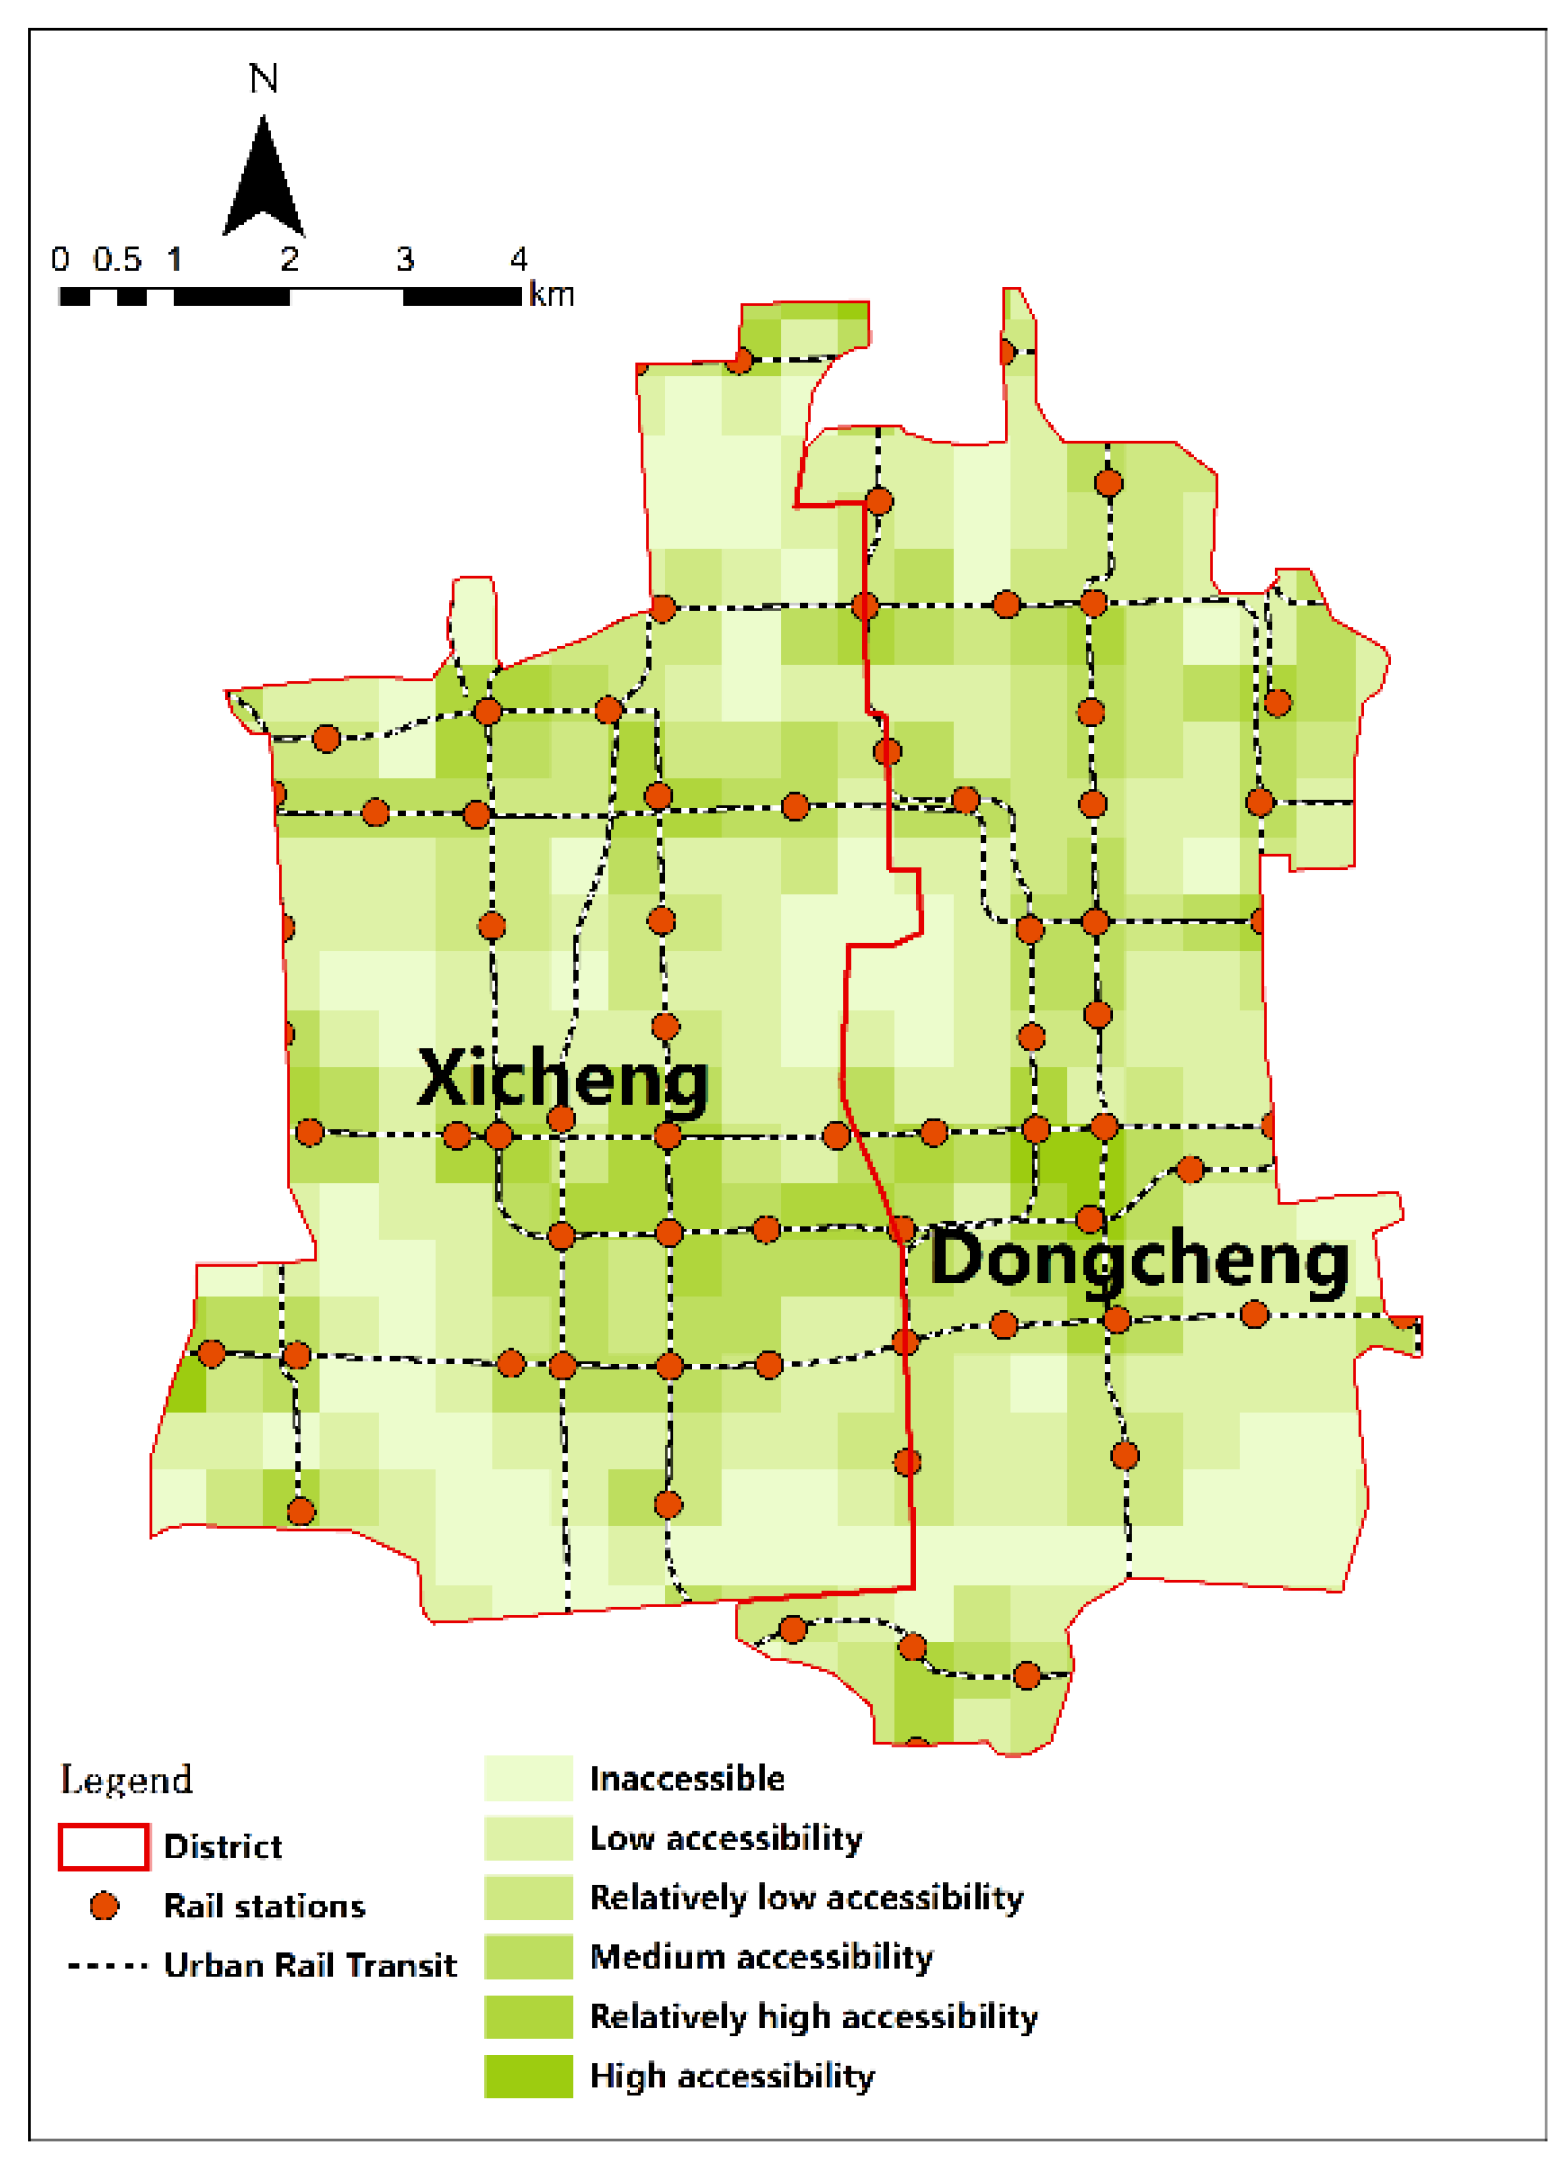
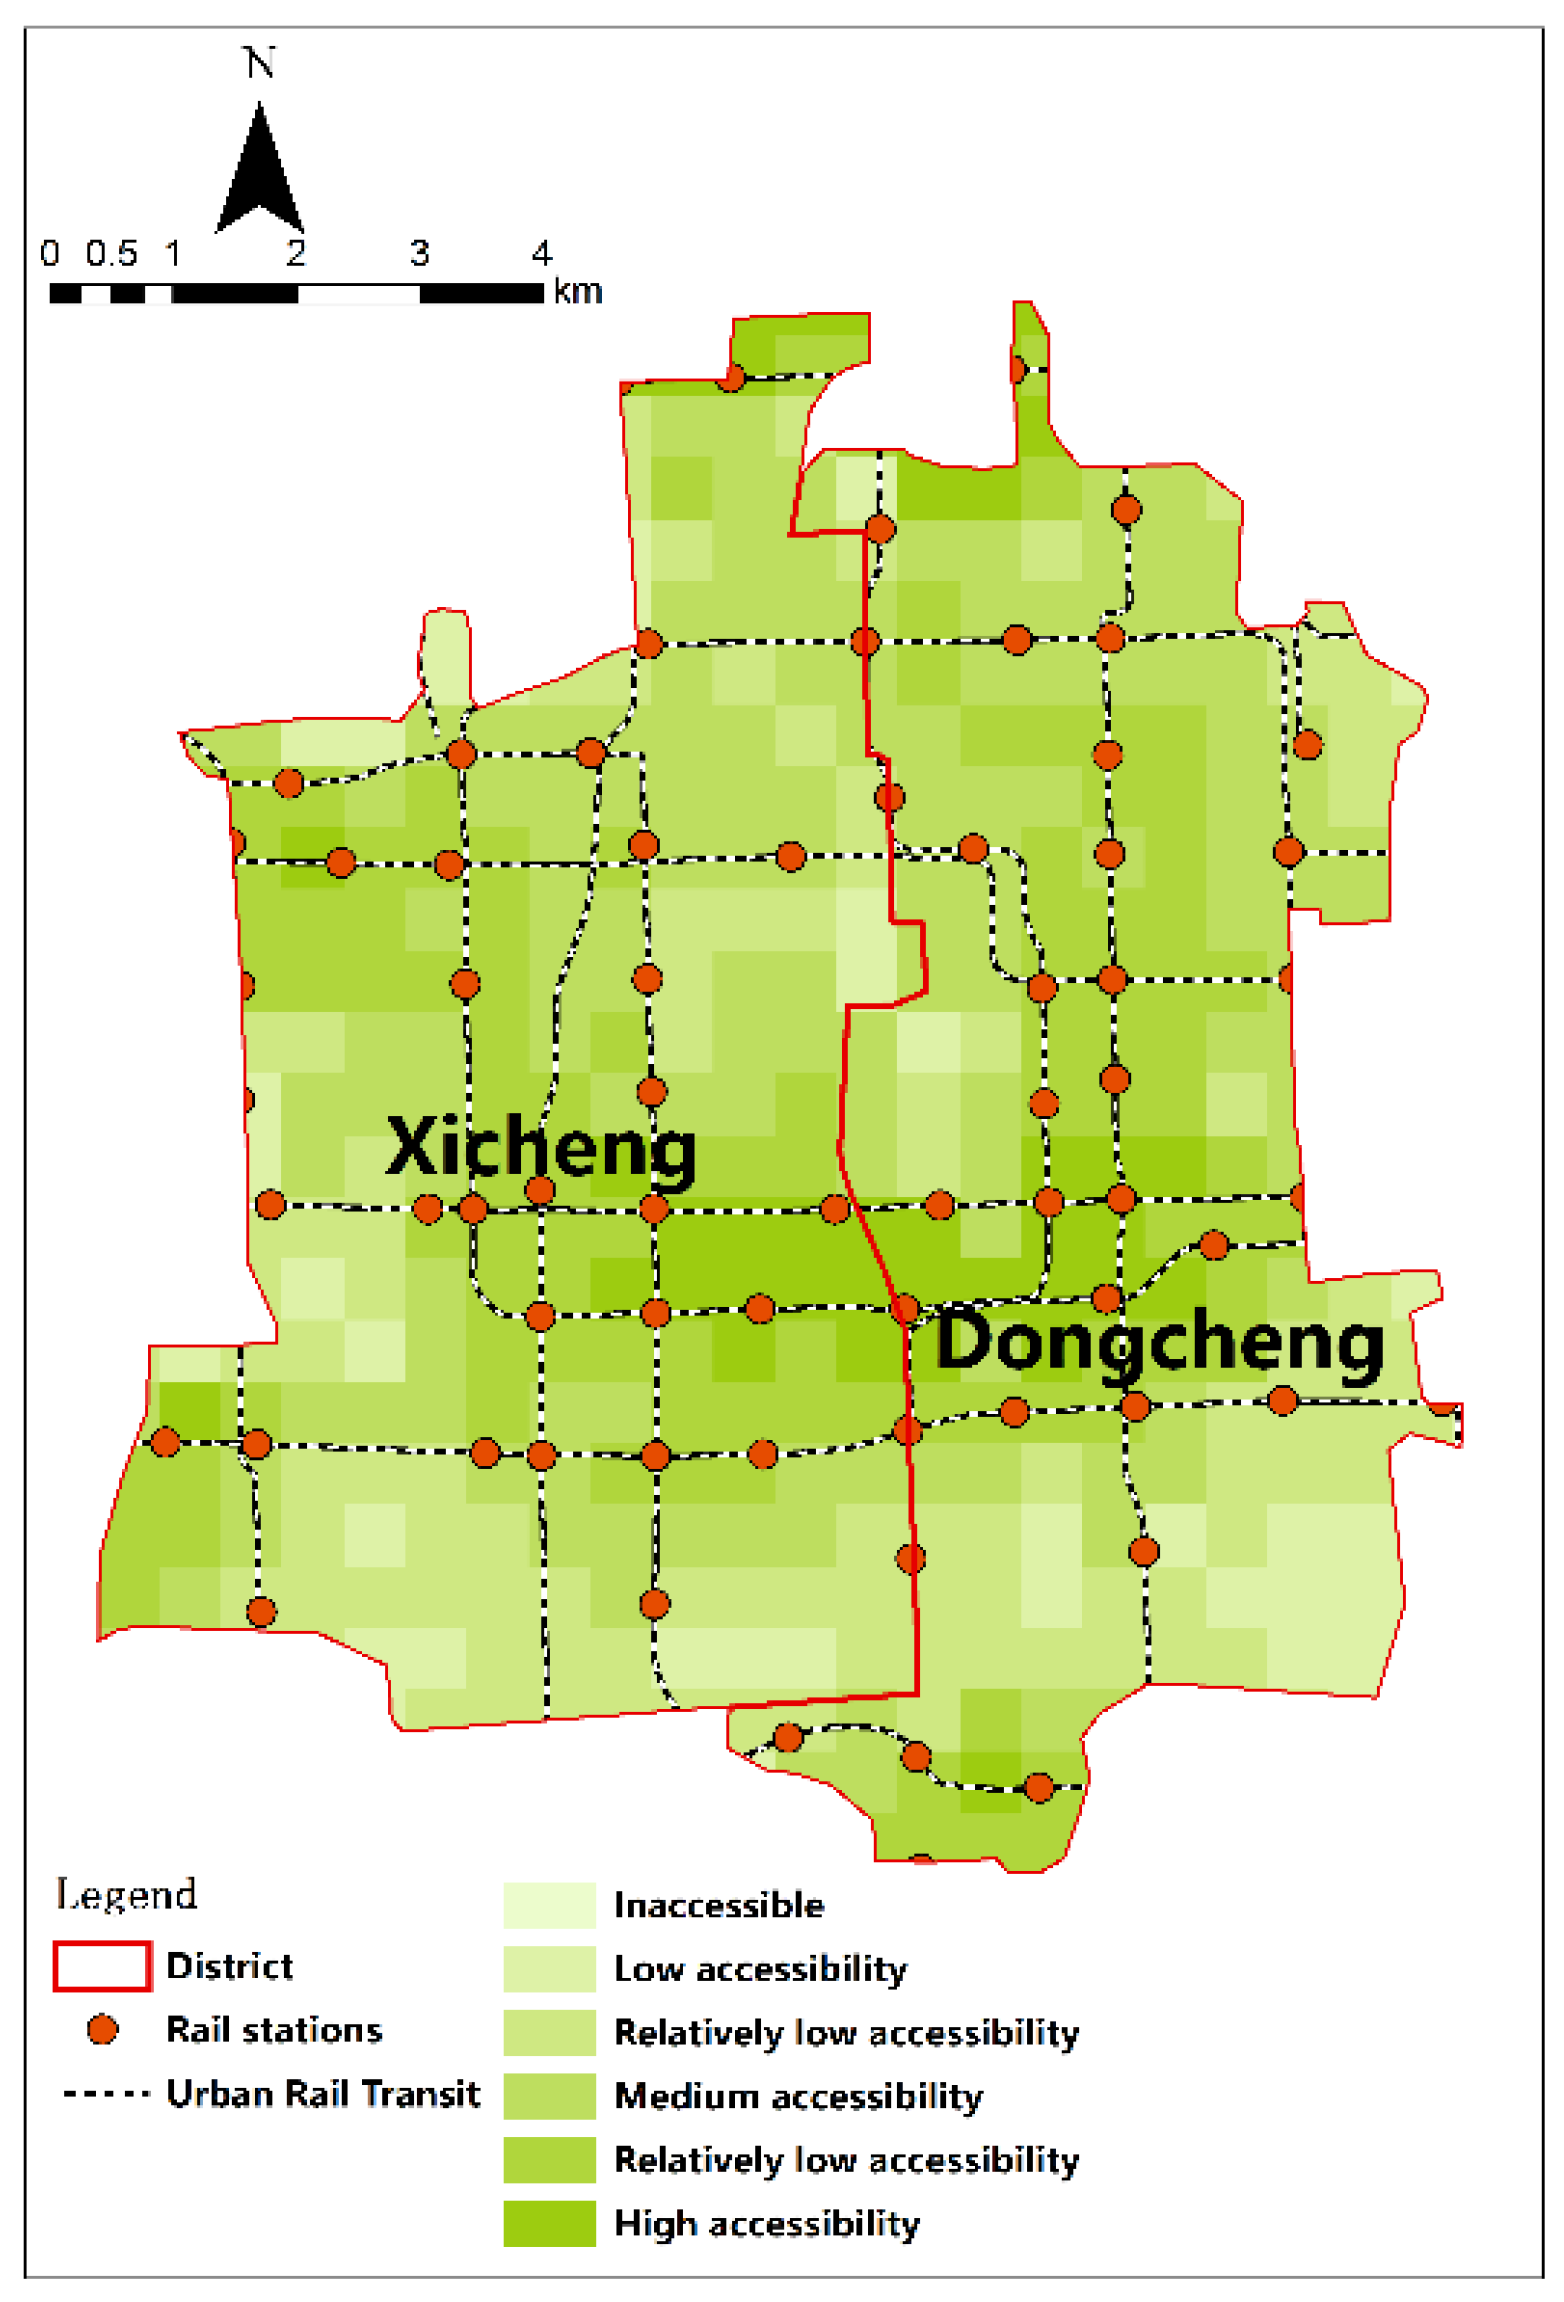
In order to determine whether this method applies to rail station accessibility evaluation, the same method was used to evaluate the walking accessibility and riding accessibility of rail stations in the Dongcheng District and Xicheng District of Beijing, and the results were compared and analyzed with those of the Shijingshan District.
The Dongcheng District and Xicheng District of Beijing cover a total area of 92.54 km2 and have a resident population of 1.815 million. The area is similar to the Shijingshan District, but the resident population is much higher. There are 66 rail stations in the Dongcheng District and Xicheng District.
The final calculation shows that when the trip mode is walking, 341 demand units can walk to the rail stations within 15 min, accounting for 80.05% of the number of demand units in the whole region (Figure 8). When the trip mode is riding, all demand units can ride to the rail stations within 15 min, accounting for 100.00% of the number of demand units in the whole region. A total of 321 units, or 94.13%, are above average in terms of walking accessibility units. There were 216 units with above-average riding accessibility, accounting for 50.70% of the number of all demand units in the area (Figure 9). There are 277 units whose ratio of riding accessibility to walking accessibility was greater than one, indicating that 65.02% of the units could improve accessibility by riding, however, the improvement was not significant (Table 5).
In order to more obviously analyze the results evaluated by this method, the standard deviation is used to represent the degree of balance in the accessibility evaluated results. The standard deviation of the results for the two modes of travel assessment was calculated, separately, for all cells, and these were compared; the study area with a smaller standard deviation indicated a more balanced accessibility distribution (Table 6).
According to the calculation results, although the overall accessibility results of the Dongcheng District and the Xicheng District are better than those of the Shijingshan District, the average accessibility results are lower than those of the Shijingshan District. This indicates that the per capita rail service in the Dongcheng District and Xicheng District is lower than that in the Shijingshan District within the reach of rail transit stations, however, the overall distribution is more uniform.

3.4. Clustering Analysis of the Accessibility of Walking Trip Mode

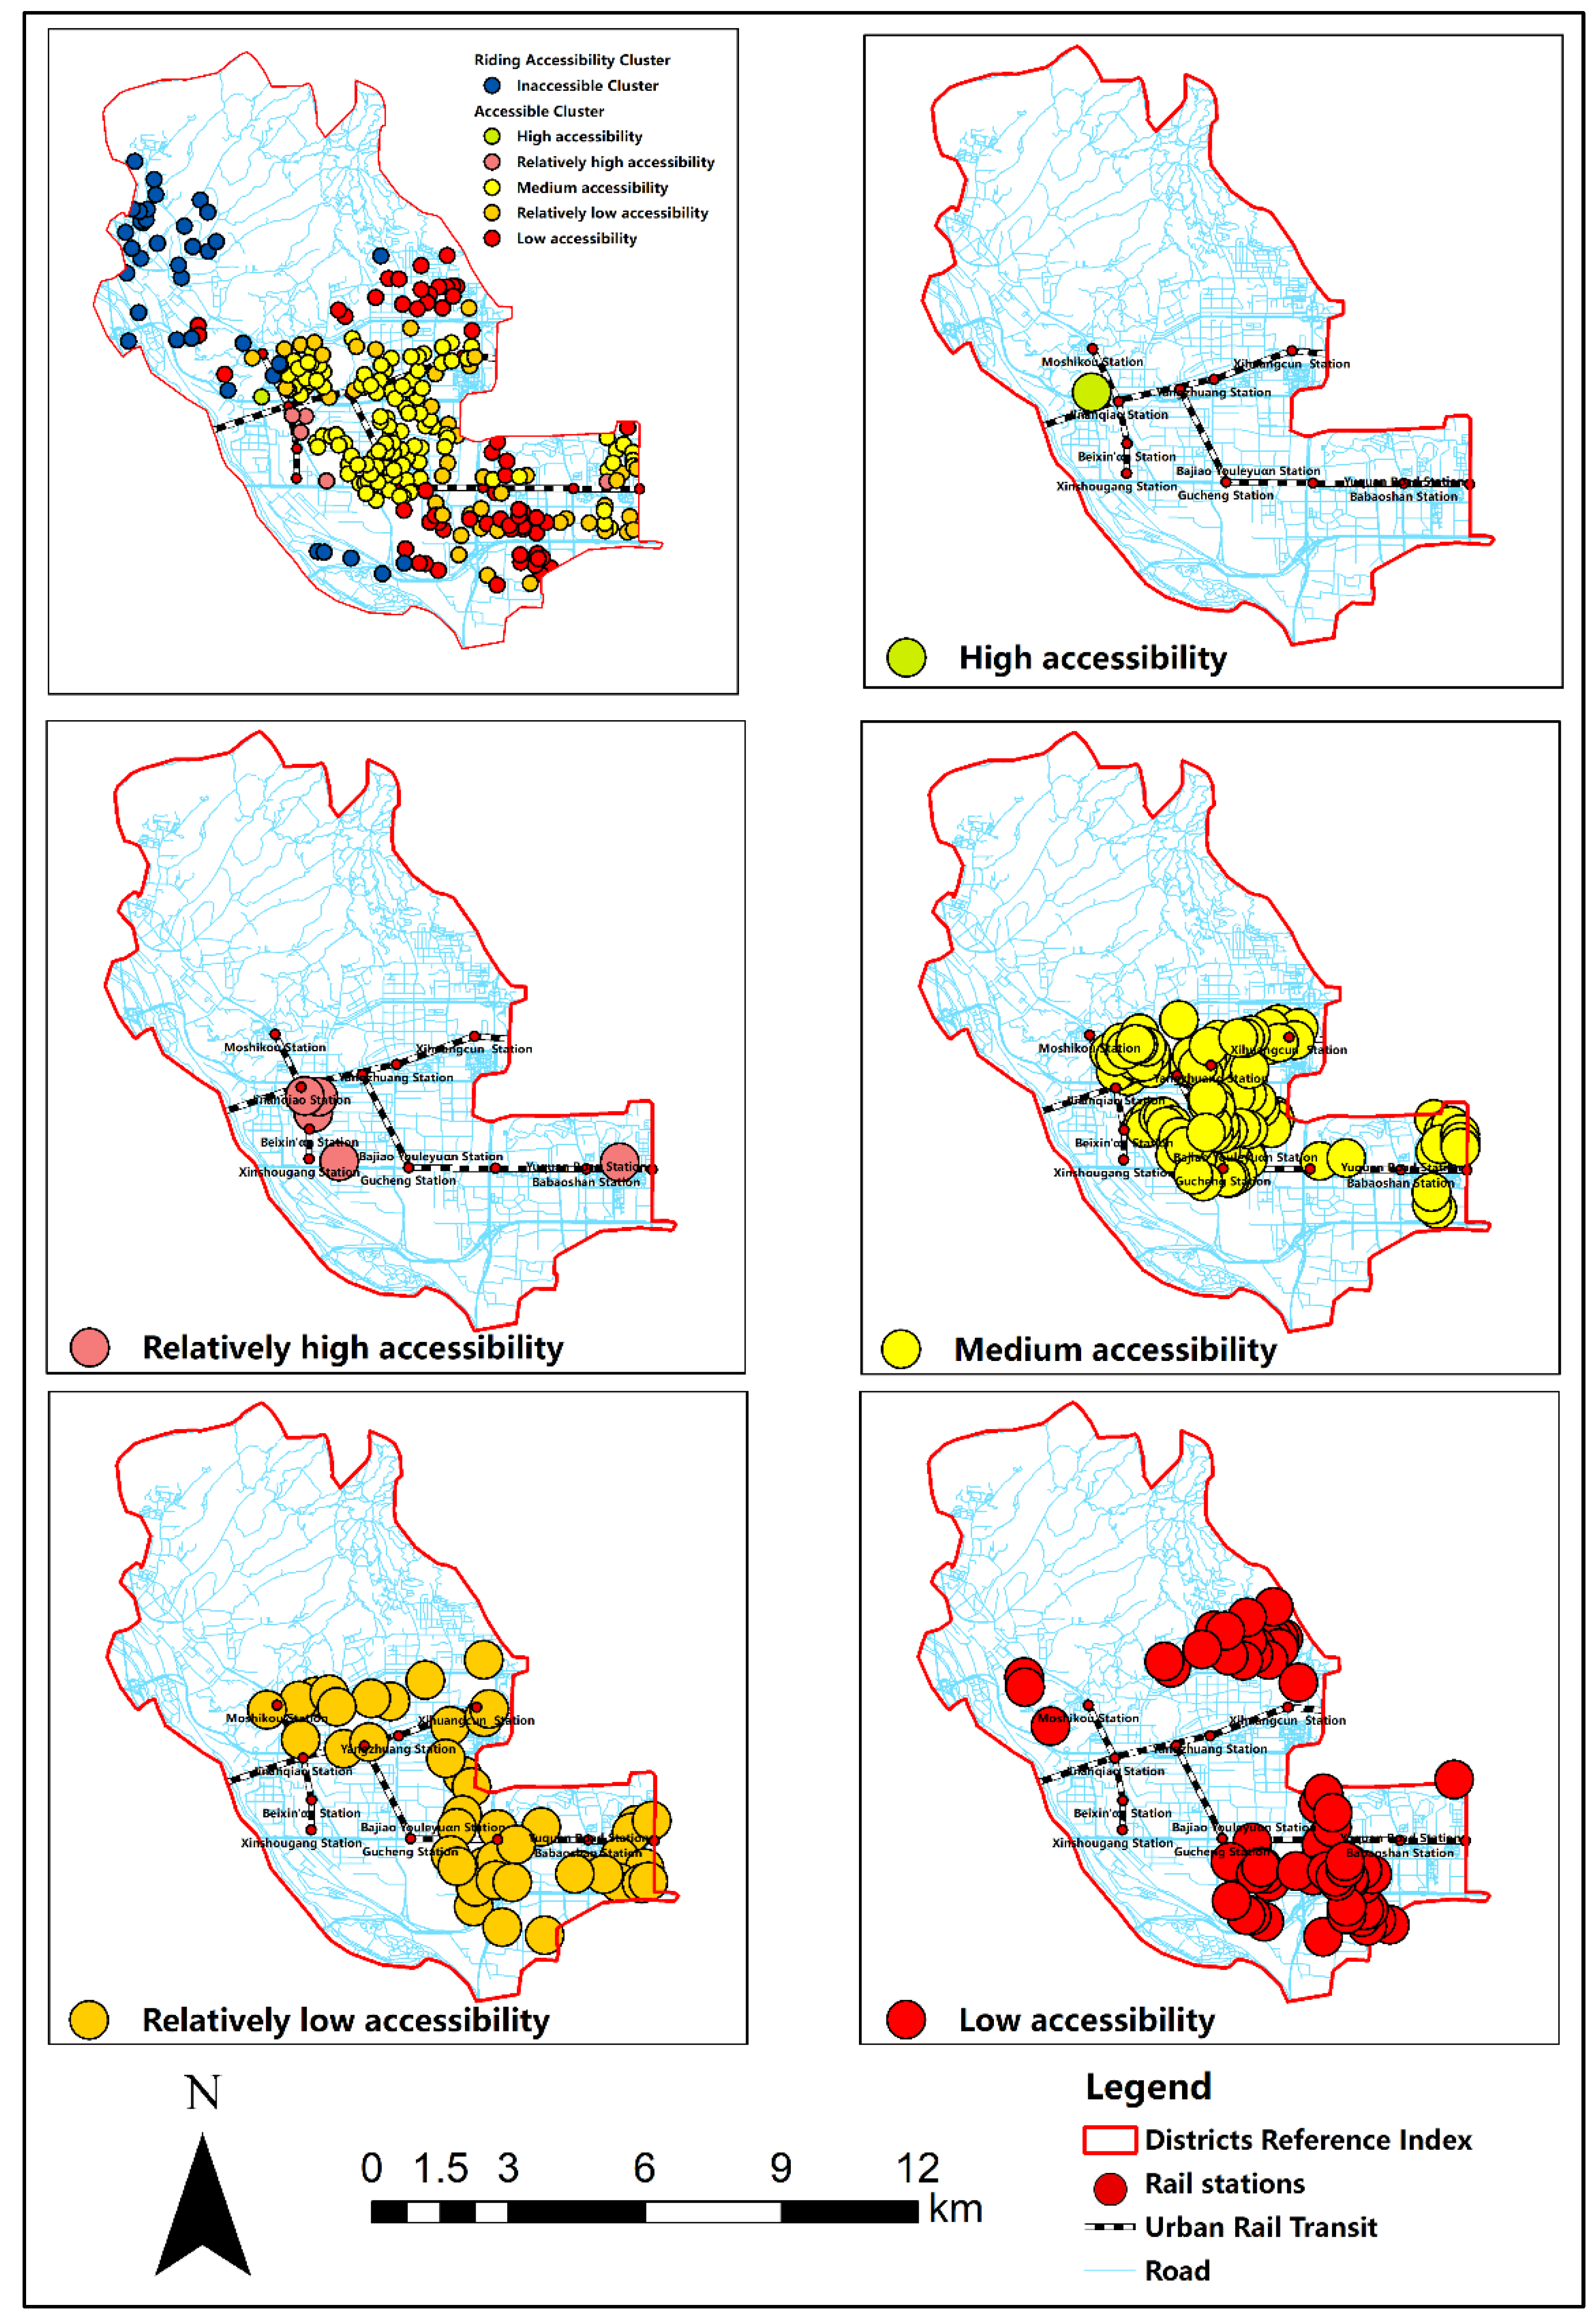
In order to comprehensively analyze the causes of the accessibility problems of rail stations, specific improvement measures and future optimization suggestions are made clear. The IBM SPSS Statistics 23 was used to perform K-value cluster analysis on the results obtained from the two trip modes. The indicators involved in the cluster analysis included the sum of the carrying capacity of sites accessible by the demand units, the number of population in the demand units, the average time from demand units to sites, and the result value of accessibility, obtained according to the two-step floating catchment area method. The results are divided into five categories. The clustering results of walking accessibility and influencing factors are shown in Table 7 and Figure 10.
There are four high accessibility units, namely Yuquan Hospital Family Building (between Yuquan Road Station and Babaoshan Station), Zhonghai Huanyutianxia (between Gucheng Station and New Shougang Station), Courtyard 99 of Shijingshan Road (between Gucheng Station and New Shougang Station) and Jingshan Fu (between North Xin ‘an Station and Jin’ anqiao Station). This area has a short distance to a single large station or multiple stations. Although there is a large residential population, the supply of surrounding stations can meet the demand, thus, walking to the site has the highest accessibility.
There are 14 units with relatively high accessibility, mainly distributed around Jin’anqiao Station, Pingguoyuan station and Yangzhuang Station. The time from such areas to large sites is moderate, but the population is small and the site supply capacity is sufficient, thus achieving high accessibility.
There are 22 units of moderate accessibility. These are distributed around the octagonal amusement park station, Gucheng station and Xihuangcun Station. Although it takes a short time to walk to the site, the supply of stations cannot meet the demand; therefore, the accessibility is not high. For such areas, the carrying capacity of the stations can be appropriately increased, such as with the addition of an octagonal amusement Park station and Xihuang Village Station entrance, to further improve the walking accessibility of such areas.
There are nine relatively low accessibility units, distributed in the south area of Line 1 and the east area of Moshikou Station. This region has the largest population, however, the carrying capacity of the accessibility site is poor, the supply cannot meet the demand, and the walking time to the site is long, making the accessibility low. It can optimize the slow traffic in such areas, advocate riding trip, and reduce the trip time. Adding sites or entrances to improve the carrying capacity of the site and improve its accessibility is also a solution.
There are 42 low accessibility units, mainly distributed in the area between Line 1 and Line 6, and in the east area of the Moshikou Station and Jin’anqiao Station. The supply of such units is greater than demand and the low accessibility is caused by long walking times to the site. Additional stops can be added around such units or slow traffic can be established to reduce the trip time from such areas to the stations.

3.5. Analysis of the Clustering Results for Riding Accessibility

The results obtained from riding were clustered using the same method, as shown in Table 8 and Figure 11:
There is a total of one high accessibility unit, which is the first casting area of Shougang, located in the west side of Jin’anqiao Station. Although this region has the largest population, the supply and demand relationship between the station and the population is balanced, and the time to ride to the large station is short and has the highest accessibility.
There are five relatively high accessibility units, namely Courtyard 99 of Shijingshan Road (located in the east of new Shougang Station), Zhonghai Huanyutianxia, Jingshan Fu and Zhonghai Tianxiayushanfu (located near the south of Jin’anqiao Station), and Yuanlin Community–Yuquan West Street (between Yuquan Road Station and Babaoshan Station). The supply and demand relationship between such regional stations and the population is close to balance, with the shortest time to the station, and therefore, high accessibility.
There are 125 medium accessibility units, mainly distributed in the enclosed area of Line 1, Line 11 and Line 6, just north of the West Chang’an Avenue. Such areas are located around large stations, and the supply can meet the demand, but it takes a long time to ride to the station; therefore, the slow traffic system can be appropriately optimized to reduce the trip time and improve the accessibility.
There are 44 relative low accessibility units, mainly distributed around the Bajiaoy Amusement of Line 1, the surrounding area of the south side along West Chang’an Avenue, and the surrounding area on the north side of Line 6. Such areas have a short trip time, but the supply cannot meet the demand, resulting in low accessibility. The current situation can be improved by improving the carrying capacity of octagonal amusement park stations, such as increasing entrances and exits.
There are 62 low accessibility units, mainly distributed in the south side of Line 1 and the north side of Line 6. Although their riding accessibility is low, it is greatly improved compared with walking trip. Due to the long trip time, the accessibility of such unit sites is low. Stations can be added in the area of such units to improve accessibility.

3.6. Analysis of the Influencing Factors of Accessibility Distribution

In order to explore the influencing factors of rail station accessibility, the spatial correlation of station accessibility and its influencing factors were analyzed. In the above calculations, the number of the demand unit population, as well as the trip time cost, were used. Therefore, the improved two-step floating catchment area method site accessibility can not only reflect the supply and demand relationship between population and station supply capacity, but also reflect the slow traffic situation between stations and residential areas.
Comprehensive accessibility was adopted to better reflect the correlation of site accessibility and its influencing factors. In this study, comprehensive site accessibility was obtained by simply adding walking and riding accessibility.

3.6.1. Correlation Analysis of the Accessibility Distribution and Population Density

From the perspective of the supply and demand relationship, in the areas with higher population activity, the impact of site accessibility is correspondingly higher. To better understand the relationship between residential population and site service capacity, comprehensive accessibility and population density were analyzed.
As shown in Table 9 and Figure 12, the correlation analysis results show that the 95% confidence interval values are all greater than 0, and the two-tailed level is less than 0.001, indicating that the comprehensive accessibility of rail transit stations in the Shijingshan District has a significant positive spatial correlation with the population density of residential communities. The results show that the comprehensive accessibility of rail transit stations in the Shijingshan District harmonious with the spatial distribution of population.

3.6.2. Correlation Analysis of the Accessibility Distribution and the Road Density

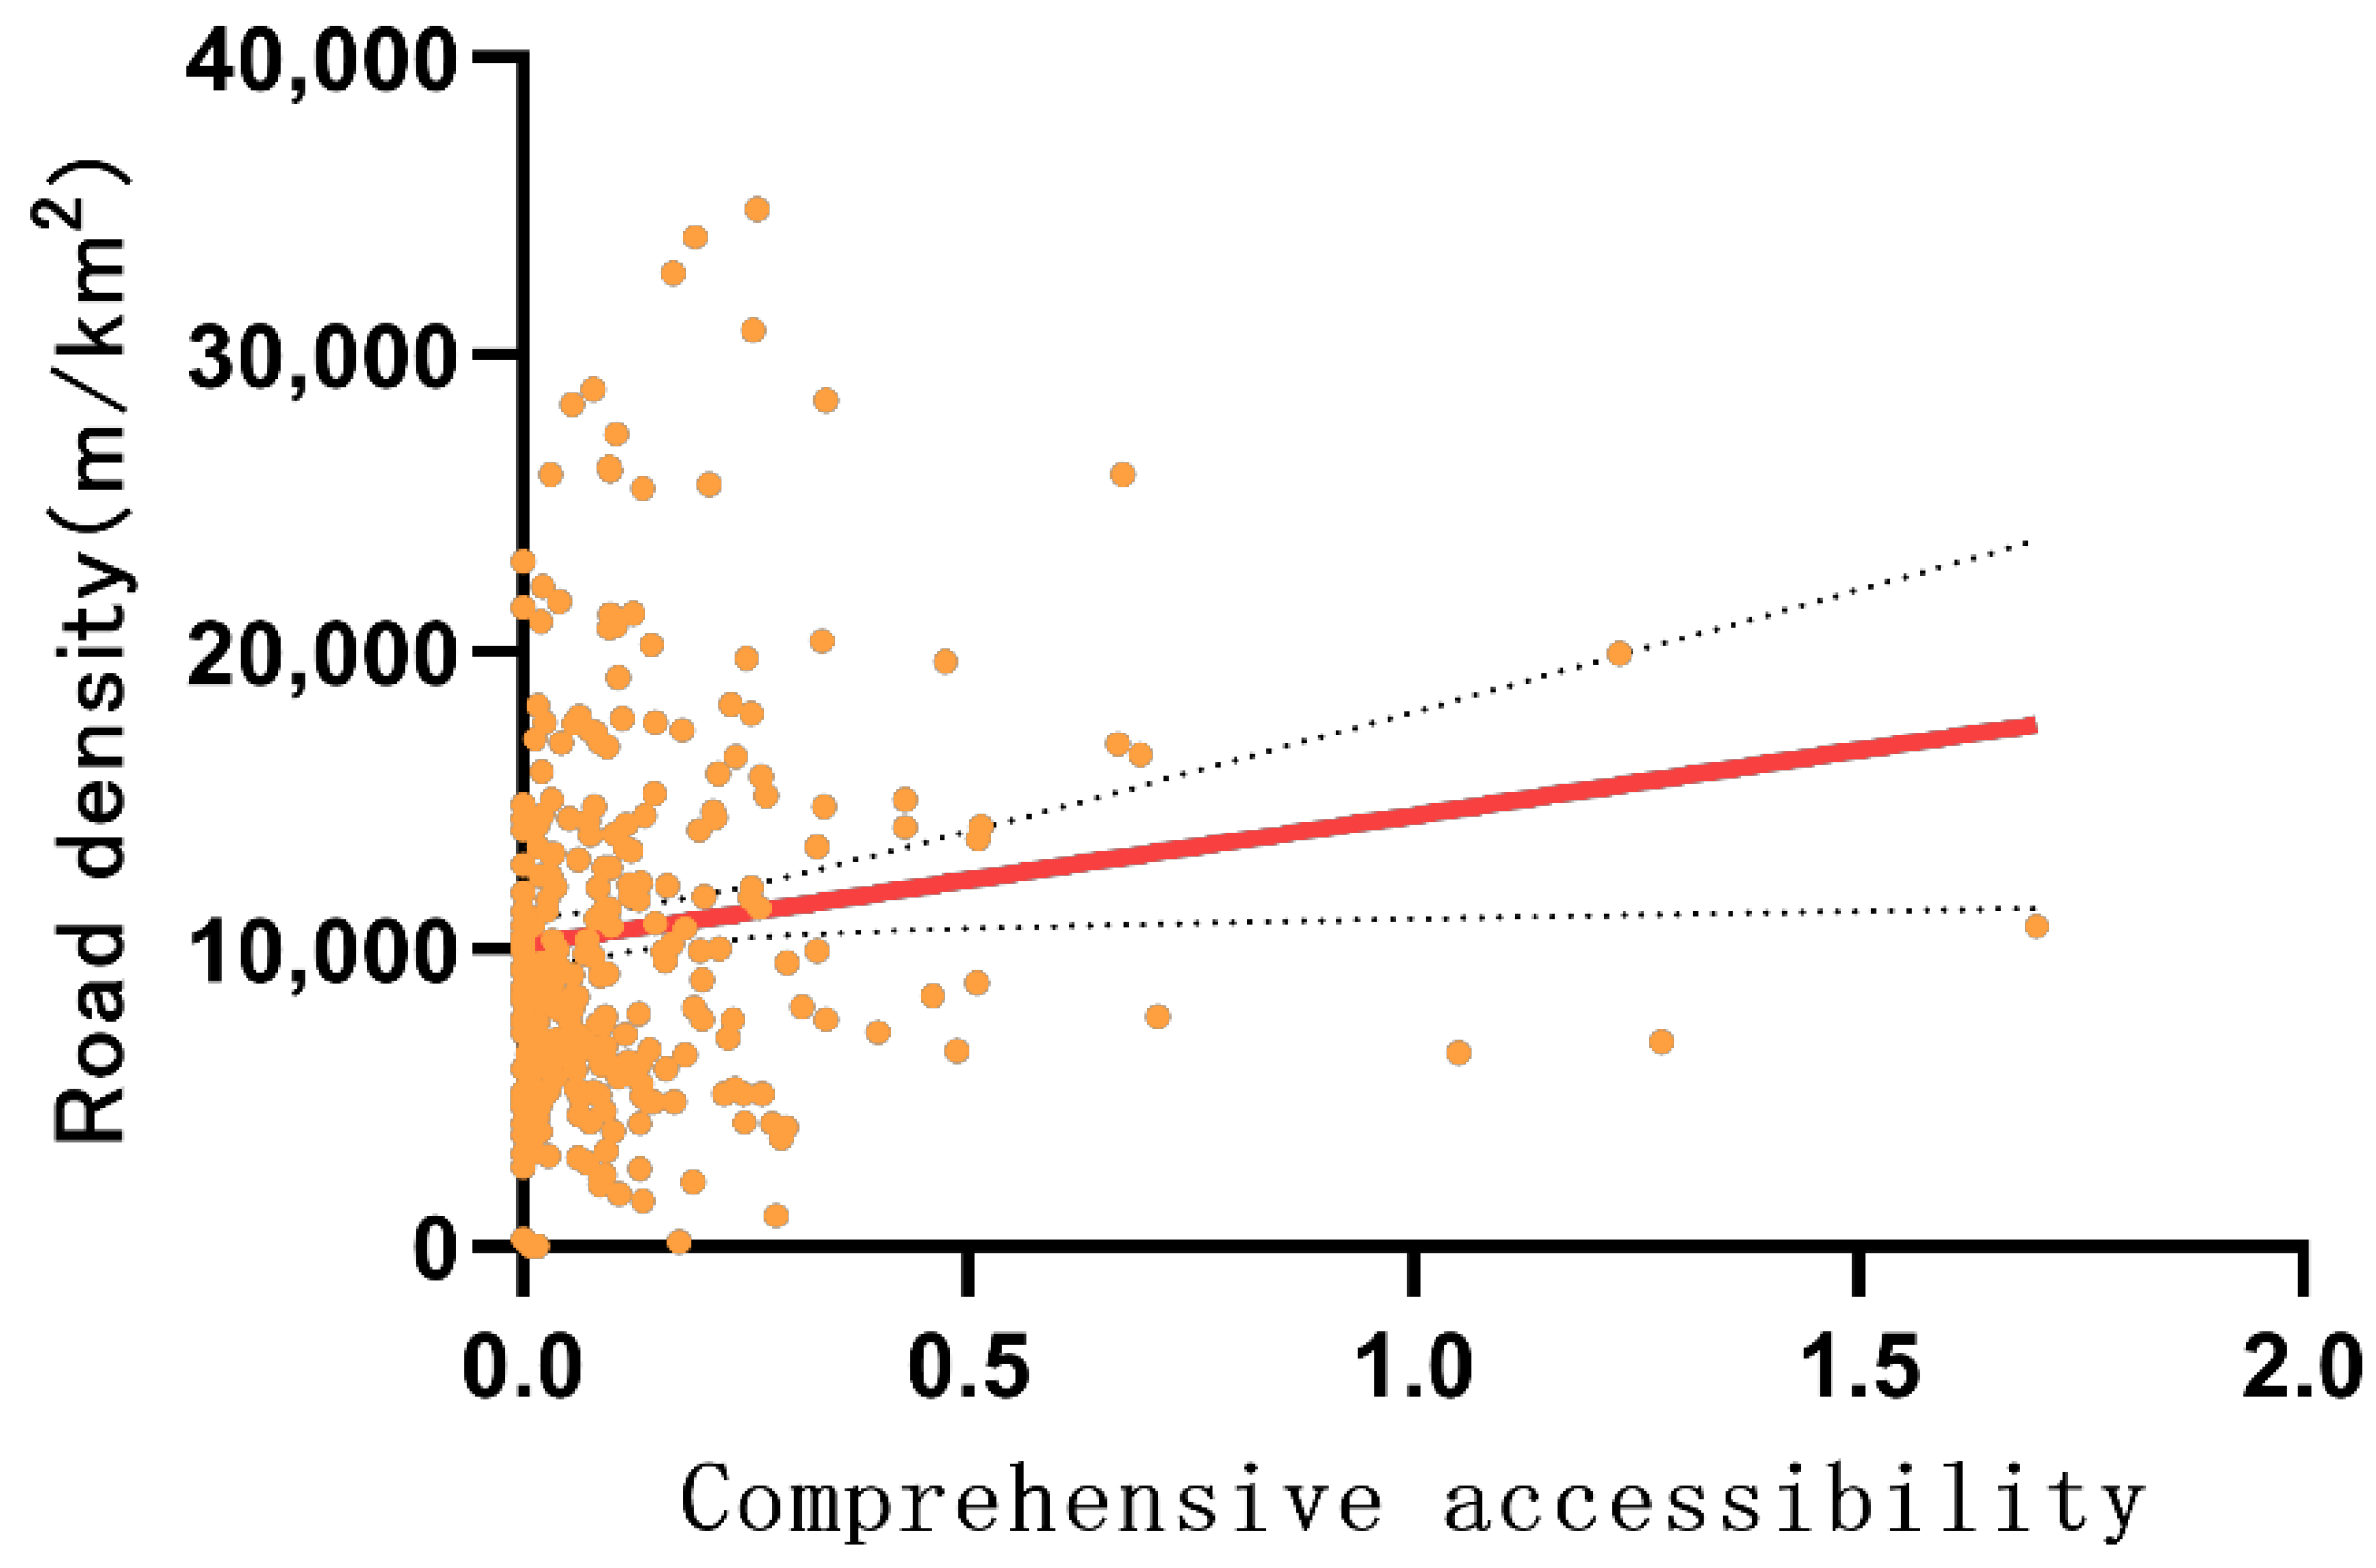
Trip time can affect the accessibility of the station and, to some extent, can reflect the slow traffic around the station. The higher the road density, the smaller the corresponding block size, and the more conducive to a slow trip to the destination. Therefore, the correlation between road density and the comprehensive accessibility of rail stations is selected for this analysis, and the analysis results are shown in Figure 13 and Table 10. The analysis showed the positive correlation between site integrated accessibility and road density, namely, the higher the road density, the higher the integrated accessibility. Site accessibility can be improved by increasing road density.

3.7. Suggestions for Optimizing Accessibility

Through the reconstruction project of slow-moving streets in the Shijingshan District, we asked the surrounding residents for their opinions on the reconstruction plan of walking and riding roads around the stations, and we conducted a questionnaire survey (Appendix A) on the surrounding residents, and 150 valid questionnaires were collected. Among them, 86.67% chose to go to the rail transit station by walking, and 66.92% of these people said they would choose to go to the rail transit station by riding if the riding road was optimized or increased. The questionnaire and photos (Figure A1) of the meeting are shown in Appendix A and Appendix B.
Based on the above analysis, the regional accessibility optimization measures of the 11 sites in the Shijingshan District were organized, as shown in Table 11.
The stations with relatively high accessibility are the new Shougang Station and North Xin’an Station, and the two stations are located in the Shougang Industrial Park. The small surrounding population leads to a supply that is greater than the demand; therefore, the accessibility is high, which can appropriately improve the degree of surrounding developments and increase the population.
Other site areas will mainly optimize the low accessibility areas. For areas with low walking accessibility, the main cause of low accessibility is the long walking time to the site. There are four areas in which the accessibility can be significantly improved by riding: (1) The area between Gucheng Station and Pingguoyuan Station; (2) The area between Yangzhuang Station and Pingguoyuan Station; (3) The triangle area of Pingguoyuan Station, Moshikou Station and Jin’anqiao Station; (4) The area between Babao Mountain Station and Yuquan Road Station. The accessibility of such regional stations is mainly improved by optimizing the riding environment and encouraging riding trips.
The second is the area with low cycling accessibility, which is caused by the low carrying capacity of the site and the long cycling time to the site. The representative areas are the northern area of Xihuangcun Station and the area around the Bajiao Amusement Park Station. The accessibility of the station can be improved by increasing the number of entrances and exits to improve the carrying capacity of the station and optimizing the riding environment to reduce the riding time.

4. Conclusions

Taking the rail transit station in the Shijingshan District as an example, this study analyzed the accessibility, from the perspective of supply and demand, through the path planning service provided by Amap API, using the Gaussian two-step floating catchment area method and the K-value clustering method, and finally drew the following conclusions:
(1) The supply capacity of the rail station in the Shijingshan District is calculated through the Critic weight method, which can more objectively reflect the difference in the supply capacity of the station itself, rather than the use of the station passenger flow volume. In addition, the 100 m resolution population grid in 2020 was corrected by using the seventh National Census in the Shijingshan District, and the Amap poi open platform was used as the demand unit, which improved the accuracy and timeliness of the demand unit. Compared with the straight-line distance and the OD cost matrix, the calculation accuracy of the trip distance and the time threshold is improved, and the results are more consistent with reality
(2) The walking accessibility of rail stations in the Shijingshan District is generally low, and the accessible demand unit is 33.21% of the total. If the trip mode is riding, the accessible demand unit is 86.88% of the total, showing a significant improvement. In addition, the rail stations in the whole region show the characteristics of insufficient development and uneven distribution. The results of the accessibility calculation show spatial characteristics of high accessibility in the central region and low accessibility in the north and south regions. Even if riding is adopted, only 36.55% of the residential communities with higher accessibility than the average level are accessible, and some areas are still inaccessible, such as some residential communities in Wulituo Street. Through comparing Shijingshan with Dongcheng and Xicheng, it became evident that different trip modes have little impact on the accessibility of areas with developed rail transportation. Therefore, by improving the slow trip environment and guiding residents to take riding trips, the effect of improving the accessibility of stations is more significant in areas with developing rail transportation.
(3) Through the K-value clustering method, the sum of the carrying capacity of the rail station, the population of the demand unit, the average time and accessibility results of the rail station of the demand unit are taken as the classification criteria. The demand units for rail stations in the Shijingshan District are divided into five categories for each trip mode. According to the actual situation of different stations and demand units, measures are proposed to improve the development degree around the stations, namely, to optimize the slow traffic environment and add the entrances and exits of the stations in order to improve the status quo of low accessibility demand units.
(4) The results of the correlation analysis between comprehensive accessibility and population density show a positive spatial correlation between them. This means the distribution of site accessibility is more harmonious with the distribution of population, and the distribution of accessibility is fair. Accessibility is also positively correlated with road density, suggesting that accessibility can be improved by improving road density.
(5) This study has refined the numerical relationship between supply and demand from the aspect of data source acquisition, but there are still improvements to be made in calculating the supply capacity of rail stations and the demand unit. If the supply capacity of the site is calculated with only three indicators, other factors affecting the supply capacity of the site have not been considered. In addition, with the number of population in the demand unit, the difference of population demand for rail stations is ignored.
(6) In future research, we can compare the calculation results with the difference of supply capacity formed by the actual construction of the stations and the different groups of people’s use data of the stations to verify the accuracy and practical value of the model for accessibility evaluation and provide a decision-making basis for improving the accessibility of the rail stations.

Author Contributions

Methodology, DL.; Formal analysis, H.Z.; Resources, Q.H.; Data curation, Q.H.; Writing—original draft, D.L. and H.Z.; Writing—review and editing, D.L. and H.Z. All authors have read and agreed to the published version of the manuscript.

Funding

This research was funded by [Natural Science Foundation of Beijing] grant number [8212009]; [Beijing Municipal Education Commission] grant number [CIT&TCD201904010]; [North China University of Technology] grant number [110051360022XN121-05]; [North China University of Technology] grant number [108051360022XN557].

Institutional Review Board Statement

Not applicable.

Informed Consent Statement

Informed consent was obtained from all subjects involved in the study.

Data Availability Statement

Not applicable.

Conflicts of Interest

The authors declare no conflict of interest.

Appendix A. Questionnaire

Questionnaire on the satisfaction of the slow running space around the track station
Questionnaire No.
Thank you for taking the time to fill in the questionnaire. Your answer will be of great significance to the “Research on the evaluation and optimization method of the slow running space around the track station”. We will protect your privacy. The answers to this questionnaire are for academic research only. Thanks again for your support!
  • Gender: A: Male B: female
  • Age: A: below 20 B: 20–39 C: 40–65 D: 65 and above
  • How often do you take the subway: A: every day B: every week C: every month D: occasionally
  • Why do you choose subway travel (multiple choices): A: arrives on time B: is fast C: is comfortable D: is inconvenient to park E: is near F: is safe G: is other
  • Your destination (multiple options): A: work, school commute B: transfer (train station, airport) C: recreation D: visiting friends and relatives E: Others
  • When you usually take the subway: A: before 7:00 B: 7:00–9:00 C: 9:00–17:00 D: 17:00–20:00 E: after 20:00
  • How do you get to the metro station: A: on foot B: by bike C: by bus D: by other
  • How long it takes you to get to the subway station: A: within 10 minutes B: 10–20 minutes C: 20–30 minutes D: more than 30 minutes
  • Do you need A detour to get to the subway station? A: No detour B: a little detour C: A general detour D: A very detour E: a very detour
  • If you use walking to get to the subway station, will you choose to ride if there are safe and high-quality cycling roads: A: Yes B: No
Please score your satisfaction with the walking environment around the subway station (5 points satisfactory ---- 1 point unsatisfactory):
ProjectOverall SatisfactionIndividual Satisfaction
Ease of AccessSecurityIdentity ofComfort
Convenient road networkCrossing red lightLevel of trailSafety across the StreetLight at nightLogo
guide
Service FacilitiesShelter of facilitiesQuality of environmentWidth of footpathEncroachment of footpathOpen spaceVisual Landscape
Site
Your suggestions for improving the walking environment around subway stations:
Please score the degree of satisfaction with the cycling environment around subway stations (5 points satisfactory ---- 1 point unsatisfactory):
ProjectOverall SatisfactionIndividual Satisfaction
Ease of AccessSecurityIdentity ofComfort
Convenient road networkCrossing red lightStation connectionSmooth of roadSafety across the StreetLight at nightSafe drivingAccessibility of visionIdentification GuidelinesIdentification of priorityService FacilitiesWidth of roadEncroachment of roadsParking spaceVisual Landscape
Site
Your demand for installing off-site law enforcement facilities in the cycling environment around subway stations: A: very need B: relatively need C: average D: not very need E: not at all need
Your suggestions for improving the cycling environment around subway stations:
Your answers will provide great help for us to better analyze the influencing factors of regional slow traffic system of rail transit stations. Thank you for your support and participation. Wish you a happy life and work!

Appendix B

Figure A1. Photos.
Figure A1. Photos.
Sustainability 14 15281 g0a1

References

  1. Golias, J.C. Analysis of traffic corridor impacts from the introduction of the new Athens Metro system. J. Transp. Geogr. 2002, 10, 91–97. [Google Scholar] [CrossRef] [Green Version]
  2. Hansen, W.G. How Accessibility Shapes Land Use. J. Am. Plan. Assoc. 1959, 25, 73–76. [Google Scholar] [CrossRef]
  3. Cheng, C.; Zhang, W.; Chen, J.; Cai, J. Ecaluating the Accessibility about Beijing’s Subways in 2008 Based on Spatial Syntax. Geo-Inf. Sci. 2007, 9, 31–35. [Google Scholar]
  4. Wei, P.; Huang, J.; Chen, Y.; Chen, N. Calculation Method of Urban Rail Transit Accessibility. J. Chongqing Jiaotong Univ. 2019, 38, 1–6. [Google Scholar]
  5. Yao, Z.; Fu, Y.; Zhang, J. Impacts of Accessibility to Transit Measures on Inequality Index of Public Transport. J. Transp. Syst. Eng. Inf. Technol. 2021, 21, 206. [Google Scholar]
  6. Ma, S.; Tang, D.; Li, X.; Sun, X. The accessibility of urban rail stations based on the catchment area. J. Shenzhen Univ. Sci. Eng. 2022, 39, 296–304. [Google Scholar]
  7. Zuo, T.; Wei, H.; Chen, N. Promote transit via hardening first-and-last-mile accessibility: Learned from modeling commuters’ transit use. Transp. Res. Part D 2020, 86, 102446. [Google Scholar] [CrossRef]
  8. Zuo, T.; Wei, H.; Chen, N.; Zhang, C. First-and-last mile solution via bicycling to improving transit accessibility and advancing transportation equity. Cities 2020, 99, 102614. [Google Scholar] [CrossRef]
  9. Ren, J.; Wang, Y. Spatial accessibility of park green space in Huangpu District of Shanghai based on modified two-step floating catchment area method. Prog. Geogr. 2021, 40, 774–783. [Google Scholar] [CrossRef]
  10. Tong, D.; Sun, Y.; Xie, M. Evaluation of green space accessibility based on improved Gaussian two-step floating catchment area method: A case study of Shenzhen City, China. Prog. Geogr. 2021, 40, 1113–1126. [Google Scholar] [CrossRef]
  11. Li, M.; Yang, L.; Wei, Y. Improved Gaussian based 2-step floating catchment area method: A case study of green space accessibility in Shanghai. Prog. Geogr. 2016, 35, 990–996. [Google Scholar]
  12. Wang, Q.; Xiu, C.; Wei, Y.; Zhang, L. Evaluation of Job Accessibility of Shenyang Using Gaussian Based 2-STEP Floating Catchment Area Method. Hum. Geogr. 2015, 30, 78–82. [Google Scholar]
  13. Hu, A.; Liu, Y.; Dai, W.; Du, W. Urban Park Green Space Supply and Demand Evaluation Based on Improved Two-Step Floating Catchment Area Method: A Case Study of the Area Within the Third Ring Road in Chengdu. Landsc. Archit. 2022, 29, 92–98. [Google Scholar]
  14. Zhang, Y.; Li, M.; Liu, Y. Spatial accessibility analysis of primary educational resources based on student home address and geocoding: A case study in ZhuzhouCountry, Hunan Province. Sci. Geogr. Sin. 2022, 42, 993–1004. [Google Scholar]
  15. Rao, Y.; Lin, G. Raionality of the Geographical Distribution of Urban Education Resources from the Perspective of Balancing Supply and Demand: A Case Study of Wuhan City. J. South-Cent. Minzu Univ. 2021, 41, 147–152. [Google Scholar]
  16. Peng, J.; Xing, L.; Yang, H. Research on planning and layout of elderly care service facilities based on supply-demand matching. J. Geo-Inf. Sci. 2022, 24, 1349–1362. [Google Scholar]
  17. Yang, L.; Ren, H.; Wang, M. Research on Spatial Accessibility and Balance of Medical Resources in Nanjing. J. Xinyang Norm. Univ. 2022, 35, 63–71. [Google Scholar]
  18. Gao, S.; Zhang, B. Study of the Accessibility of Integrated Transportation for Hub Airport Based on WebGIS Service. J. Geomat. 2022, 47, 58–62. [Google Scholar]
  19. Li, X.; Wang, X.; Zhuo, R.; Wan, L. Spatial Accessibility of Leisure Agriculture in Suburbs of Wuhan Based on Spatial Syntax and Network Analysis. J. Cent. China Norm. Univ. 2020, 54, 882–891. [Google Scholar]
  20. Zhou, Y.; Li, R.; Pan, L.; Chen, Y. Public Transit Accessibility Calculation and Evaluation of the Beijing South Railway Station. J. Beijing Universiy Technol. 2020, 46, 1365–1376. [Google Scholar]
  21. Li, L.; Ren, H.; Zhao, S.; Duan, Z.; Zhang, Y.; Zhang, A. Two dimensional accessibility analysis of metro stations in Xi’an, China. Transp. Res. Part A 2017, 106, 414–426. [Google Scholar] [CrossRef]
  22. Xiao, B. Calculation Method for Transit Accessibility of Urban Rail Transit Planning Scheme Based on Internet Map Data. Urban Mass Transit 2021, 24, 69–73. [Google Scholar]
  23. Dai, Z.; Jiang, J.; Mai, W.; Wang, X. Accessibility Quantitative Evaluation Method Based on Internet Map. Urban Mass Transit 2020, 23, 28–32. [Google Scholar]
  24. Guo, P.; Sun, Y. Accessibility of urban green space in downtown area of Tianjin based on internet map service and Gaussian 2 step floating catchment area method. J. Tianjin Norm. Univ. 2020, 40, 63–69. [Google Scholar]
  25. Zheng, Z.; Zhang, L.; Qin, Y. Accessibility to medical care services of urban residents based on internet map service in Kaifeng City. Resour. Sci. 2018, 40, 2307–2316. [Google Scholar]
  26. Qi, X.; Li, J. Evaluation on Demand Degree of Urban Underground Space based on the POI Data: A Case Study in Jinan City. China Land Sci. 2018, 32, 36–44. [Google Scholar]
  27. Chorus, P.; Bertolini, L. An application of the node place model to explore the spatial development dynamics of station areas in Tokyo. J. Transp. Land Use 2011, 4, 45–58. [Google Scholar]
  28. Meng, L. Research on the strategy of Planning Metro Station in Historical Street block under the Guidance of “Node—Place” Model. Master Tianjin Univ. 2018, 43, 4–8. [Google Scholar]
  29. Shiliang, S.; Hui, Z.; Miao, W.; Min, W.; Mengjun, K. Transit-oriented development (TOD) typologies around metro station areas in urban China: A comparative analysis of five typical megacities for planning implications. J. Transp. Geogr. 2021, 90, 102939. [Google Scholar]
  30. Lyu, G.; Bertolini, L.; Pfeffer, K. Developing a TOD typology for Beijing metro station areas. J. Transp. Geogr. 2016, 55, 40–50. [Google Scholar] [CrossRef] [Green Version]
  31. Sun, J.; Liu, J.; Zhao, L. Clustering Algorithms Research. J. Softw. 2008, 19, 48. [Google Scholar] [CrossRef]
  32. Yang, Z.; Yang, L.; Cui, X.; Guo, Y.; Gao, Y. Evaluation of Chengdu Central Metro Station Areas Coordination. Planners 2020, 36, 67–74. [Google Scholar]
Figure 1. Location of the Shijingshan District in Beijing.
Sustainability 14 15281 g001
Figure 2. Carrying capacity of rail transit stations in the Shijingshan District.
Sustainability 14 15281 g002
Figure 3. Population distribution map.
Sustainability 14 15281 g003
Figure 4. Framework of rail station accessibility study.
Sustainability 14 15281 g004
Figure 5. Results of the 15-min walk calculation.
Sustainability 14 15281 g005
Figure 6. Calculated results for 15 min of riding.
Sustainability 14 15281 g006
Figure 7. Results of comparing the accessibility of the two trip mod.
Sustainability 14 15281 g007
Figure 8. Calculated results for 15 min of walking of Dongcheng District and Xicheng District.
Sustainability 14 15281 g008
Figure 9. Calculated results for 15 min of riding of Dongcheng District and Xicheng District.
Sustainability 14 15281 g009
Figure 10. Spatial distribution of walking accessibility clustering results.
Sustainability 14 15281 g010
Figure 11. Spatial distribution of riding accessibility clustering results.
Sustainability 14 15281 g011
Figure 12. Analysis plot of comprehensive accessibility and population density.
Sustainability 14 15281 g012
Figure 13. Analysis of comprehensive accessibility and road density.
Sustainability 14 15281 g013
Table 1. Site carrying capacity Critic weights calculation results.
MetricVariability of the IndicatorConflicting of the IndicatorAmount of InformationWeight
Number of entrances and exits0.3191.0980.3544.21%
Number of site service directions0.2980.5960.17722.44%
Number of stations passing stations0.4050.6520.26433.35%
Table 2. Number of the seventh National Census in each street of the Shijingshan District.
Street NameResults of the Seventh Census
Babaoshan street61,211
Laoshan street40,023
Bajiao street110,929
Gucheng street67,685
Pingguoyuan street97,543
Jinding street67,734
Guangning street14,684
Wulituo street41,248
Lugu street66,794
Table 3. Analysis of Calculated Results.
Trip ModeNumber of Units AccessibleAbove the Average Unit NumberInaccessible Number of UnitsThe Proportion of Accessible Units/%Above the Average Unit Ratio/%
walk912218333.21%24.18%
ride237873786.88%36.55%
Table 4. Results of riding accessibility results compared to walking accessibility component.
Community NameRiding Accessibility Results (Ai1)Walking Accessibility Results (Ai2)Ai1/Ai2
Gucheng ruyi community0.1212870.000742163.51
Shougang Guixi Residential Area0.1209440.00370932.61
Beijing Xixiandaicheng City0.0871730.00830410.50
Jinping Pavilion Jintai Pavilion0.1034870.5644370.18
Hongxin home0.1013930.5729470.18
Miaopu community0.0990450.5947310.17
Yuquan Hospital Family Building0.1152531.1160750.10
Table 5. Analysis of Calculated Results about Dongcheng and Xicheng.
Trip ModeNumber of Units AccessibleAbove the Average Unit NumberInaccessible Number of UnitsThe Proportion of Accessible Units/%Above the Average Unit Ratio/%
walk3413218580.05%94.13%
ride4262160100.00%50.70%
Table 6. Comparative Analysis of Results.
DistrictAverage of WalkingAverage of RidingSTD of WalkingSTD of Riding
Dongcheng and Xicheng0.00013200.00018870.00010430.0000600
Shijingshan0.061183230.071924100.15528120.0644985
Table 7. Results of walking clustering.
ProjectNumber of UnitsPopulation SizeThe Sum of Carrying Capacity of Sites Accessible by Demand UnitsAverage Time on FootWalking Accessibility Results Values
High accessibility units40.170.72−0.563.69
Relatively High accessibility unit14−0.052.060.190.50
Medium accessibility unit22−0.13−0.48−1.26−0.10
Lower accessibility unit92.29−0.530.48−0.18
Relatively Low accessibility units42−0.42−0.390.55−0.43
Table 8. Results of riding clustering.
ProjectNumber of UnitsPopulation SizeThe Sum of the Carrying Capacity of the Accessible SitesAverage Riding TimeRiding Accessibility Result Values
High accessibility units14.831.53−0.365.01
Relatively High accessibility unit5−0.02−0.46−2.483.76
Medium accessibility unit125−0.520.61−0.210.34
Relatively Low accessibility unit441.53−0.43−0.22−0.29
Low accessibility units62−0.11−0.900.79−0.86
Table 9. Analysis of integrated accessibility and population density.
r95% Confidence Intervalp (Double Tail)p-Value Summaryp-Value Is Accurate or ApproximateWhether Important
(α = 0.00)
0.36920.2588~0.4700<0.0001****approximationyes
Note: The correlation was significant at level 0.01 (two-tailed). **** represent the significance level of 0.01%).
Table 10. Correlation analysis table of integrated accessibility and road density.
r95% Confidence Intervalp (Double Tail)p-Value Summaryp-Value Is Accurate or ApproximateWhether Important
(α = 0.00)
0.1620.04080~0.27840.0072**approximationyes
Note: The correlation was significant at level 0.01 (two-tailed). (** represent the significance level respectively of 1%).
Table 11. Rail station optimization measures and suggestions.
Optimization Measures and SuggestionsSite Name
Improve the degree of developmentNorth Xin’an Station, New Shougang Station
Optimize the riding environmentPingguoyuan Station, Gucheng Station, Yangzhuang Station, Moshikou Station, Jin’anqiao Station, Babaoshan Station, Yuquan Road Station
Add additional site entrances and exitsXihuangcun Station, Bajiao Amusement Park Station
Publisher’s Note: MDPI stays neutral with regard to jurisdictional claims in published maps and institutional affiliations.