1. Introduction
The Earth’s climate is the result of a huge set of non-linear interactions between several subsystems: Atmosphere, Cryosphere, Hydrosphere, Lithosphere and Biosphere [
1]. Over 4.5 billion years, the Earth’s climate has undergone many variations because of external and internal factors. The term “Climate Change” (CC) has been adopted as a change in climate due to natural or anthropogenic causes. The United Nations Frame Convention on CC (UNFCCC) has a narrower definition, considering that a CC is any change in climate that results from changes in the composition of the global atmosphere that are directly or indirectly attributed to human activity [
2]. In this context, the increase in surface air temperature observed during the last 150 years on a global scale because of the increase in certain greenhouse gases released as a consequence of human activity, especially since the beginning of the industrial revolution, constitutes evidence of CC in both definitions.
At the root of the industrial revolution was the possibility of producing large amounts of energy from fossil fuels. Man has been in charge of finding technologies to easily extract and store these fuels (coal and hydrocarbons) for over 150 years [
3]. In practice, it was a mass transfer from the Lithosphere to the Atmosphere. The energy, accumulated in the depths of the Lithosphere for hundreds of millions of years, has been the basis of Humanity’s development until today. At the same time, some products resulting from the production of this energy have been accumulating in the Atmosphere at an almost exponential rate. One of these products is carbon dioxide (CO
2), which is also released in the respiration of aerobic organisms; in the case resulting from the use of fossil fuels, the carbon atom of the CO
2 molecule was not originally found in the atmosphere, but in the subsoil. CO
2 is also a powerful greenhouse gas, that is, it strongly absorbs long-wavelength (infrared) radiation that is emitted by the earth and the atmosphere itself, further increasing the temperature of the atmosphere near the surface [
4]. The increase in air temperature in turn has direct impacts on the Hydrosphere (increase in mean sea level, ocean acidification, etc.), on the Cryosphere (melting of polar ice caps, glaciers, decrease in albedo, etc.), on the Lithosphere (decrease in permafrost, release of CH4, increase in ice-free surface, etc.) and in the Biosphere (extinction of species, etc.) [
5].
The impact of the present CC, of which global warming is the most immediate consequence combined with the issue concerning natural resources, requires a comprehensive scientific approach, either in the way they are understood or solved [
6]. Here, the synergies between energy efficiency, renewable energies (RE) and sustainable development [
7,
8] are the support for the energy transition in achieving the net-zero goal by 2050 limiting global temperature increase to 1.5 °C [
9].
Interestingly, CC has significant impacts on current energy production processes [
10]. The efficiency of thermal reactors decreases with increasing temperature and, on the other hand, the increase in energy consumption for cooling represents a problem that will be aggravated in a warmer atmosphere. Under these conditions, the current model of energy production and consumption is threatened by a problem that has its origins in the model itself, based on the extraction of fossil fuels.
In the Autonomous Region of the Azores (RAA), despite the efforts in the implementation of RE, the dependence on fossil fuels for energy production remains high. However, since 2019 there has been a slow but sustained increase in electricity production from renewable sources, reaching 38.3% of the electricity produced in the RAA in 2019 [
11]. In 2019, the main RE sources in the RAA were of geothermal origin (24.1%) and wind and hydro. (12.5%). Considering that energy dependence is itself also conditioned by atmospheric conditions (for example, the maritime transport of fuels), the impact of CC on the energy sector in the RAA will be very relevant.
The available literature is not very rich regarding climate projections for small islands such as the Azores. The latest IPCC report includes a chapter for small islands [
12], but unfortunately does not include those in the North Atlantic.
There is little work published for the Azores and Madeira islands, based on the SRES scenarios, but not addressing the impact on RE [
13,
14]. For the Canary Islands, there are also some studies assessing the impacts of solar and wind energy in the Canary Islands [
15,
16,
17], but based on the RCP scenarios.
There are also some feasibility studies of RE in the Azores [
18,
19,
20,
21], but they do not include the long-term impact of CC. In these conditions, this work’s main objective is to analyze the most recent results of climate projections for the Azores and their impacts on the various sources of RE, as well as the SWOT evaluation of possible strategies for a sustainable adaptation, Thus, the work presented here is the first that simultaneously addresses the issue of the impact of CA on RE in the Azores, using the most recent results of global models for SSP scenarios.
This paper presents some results of climate projections obtained for the Azores region, based on two SSP (Shared Socioeconomics Pathways) scenarios that may be useful in future impact studies.
3. Materials and Methods
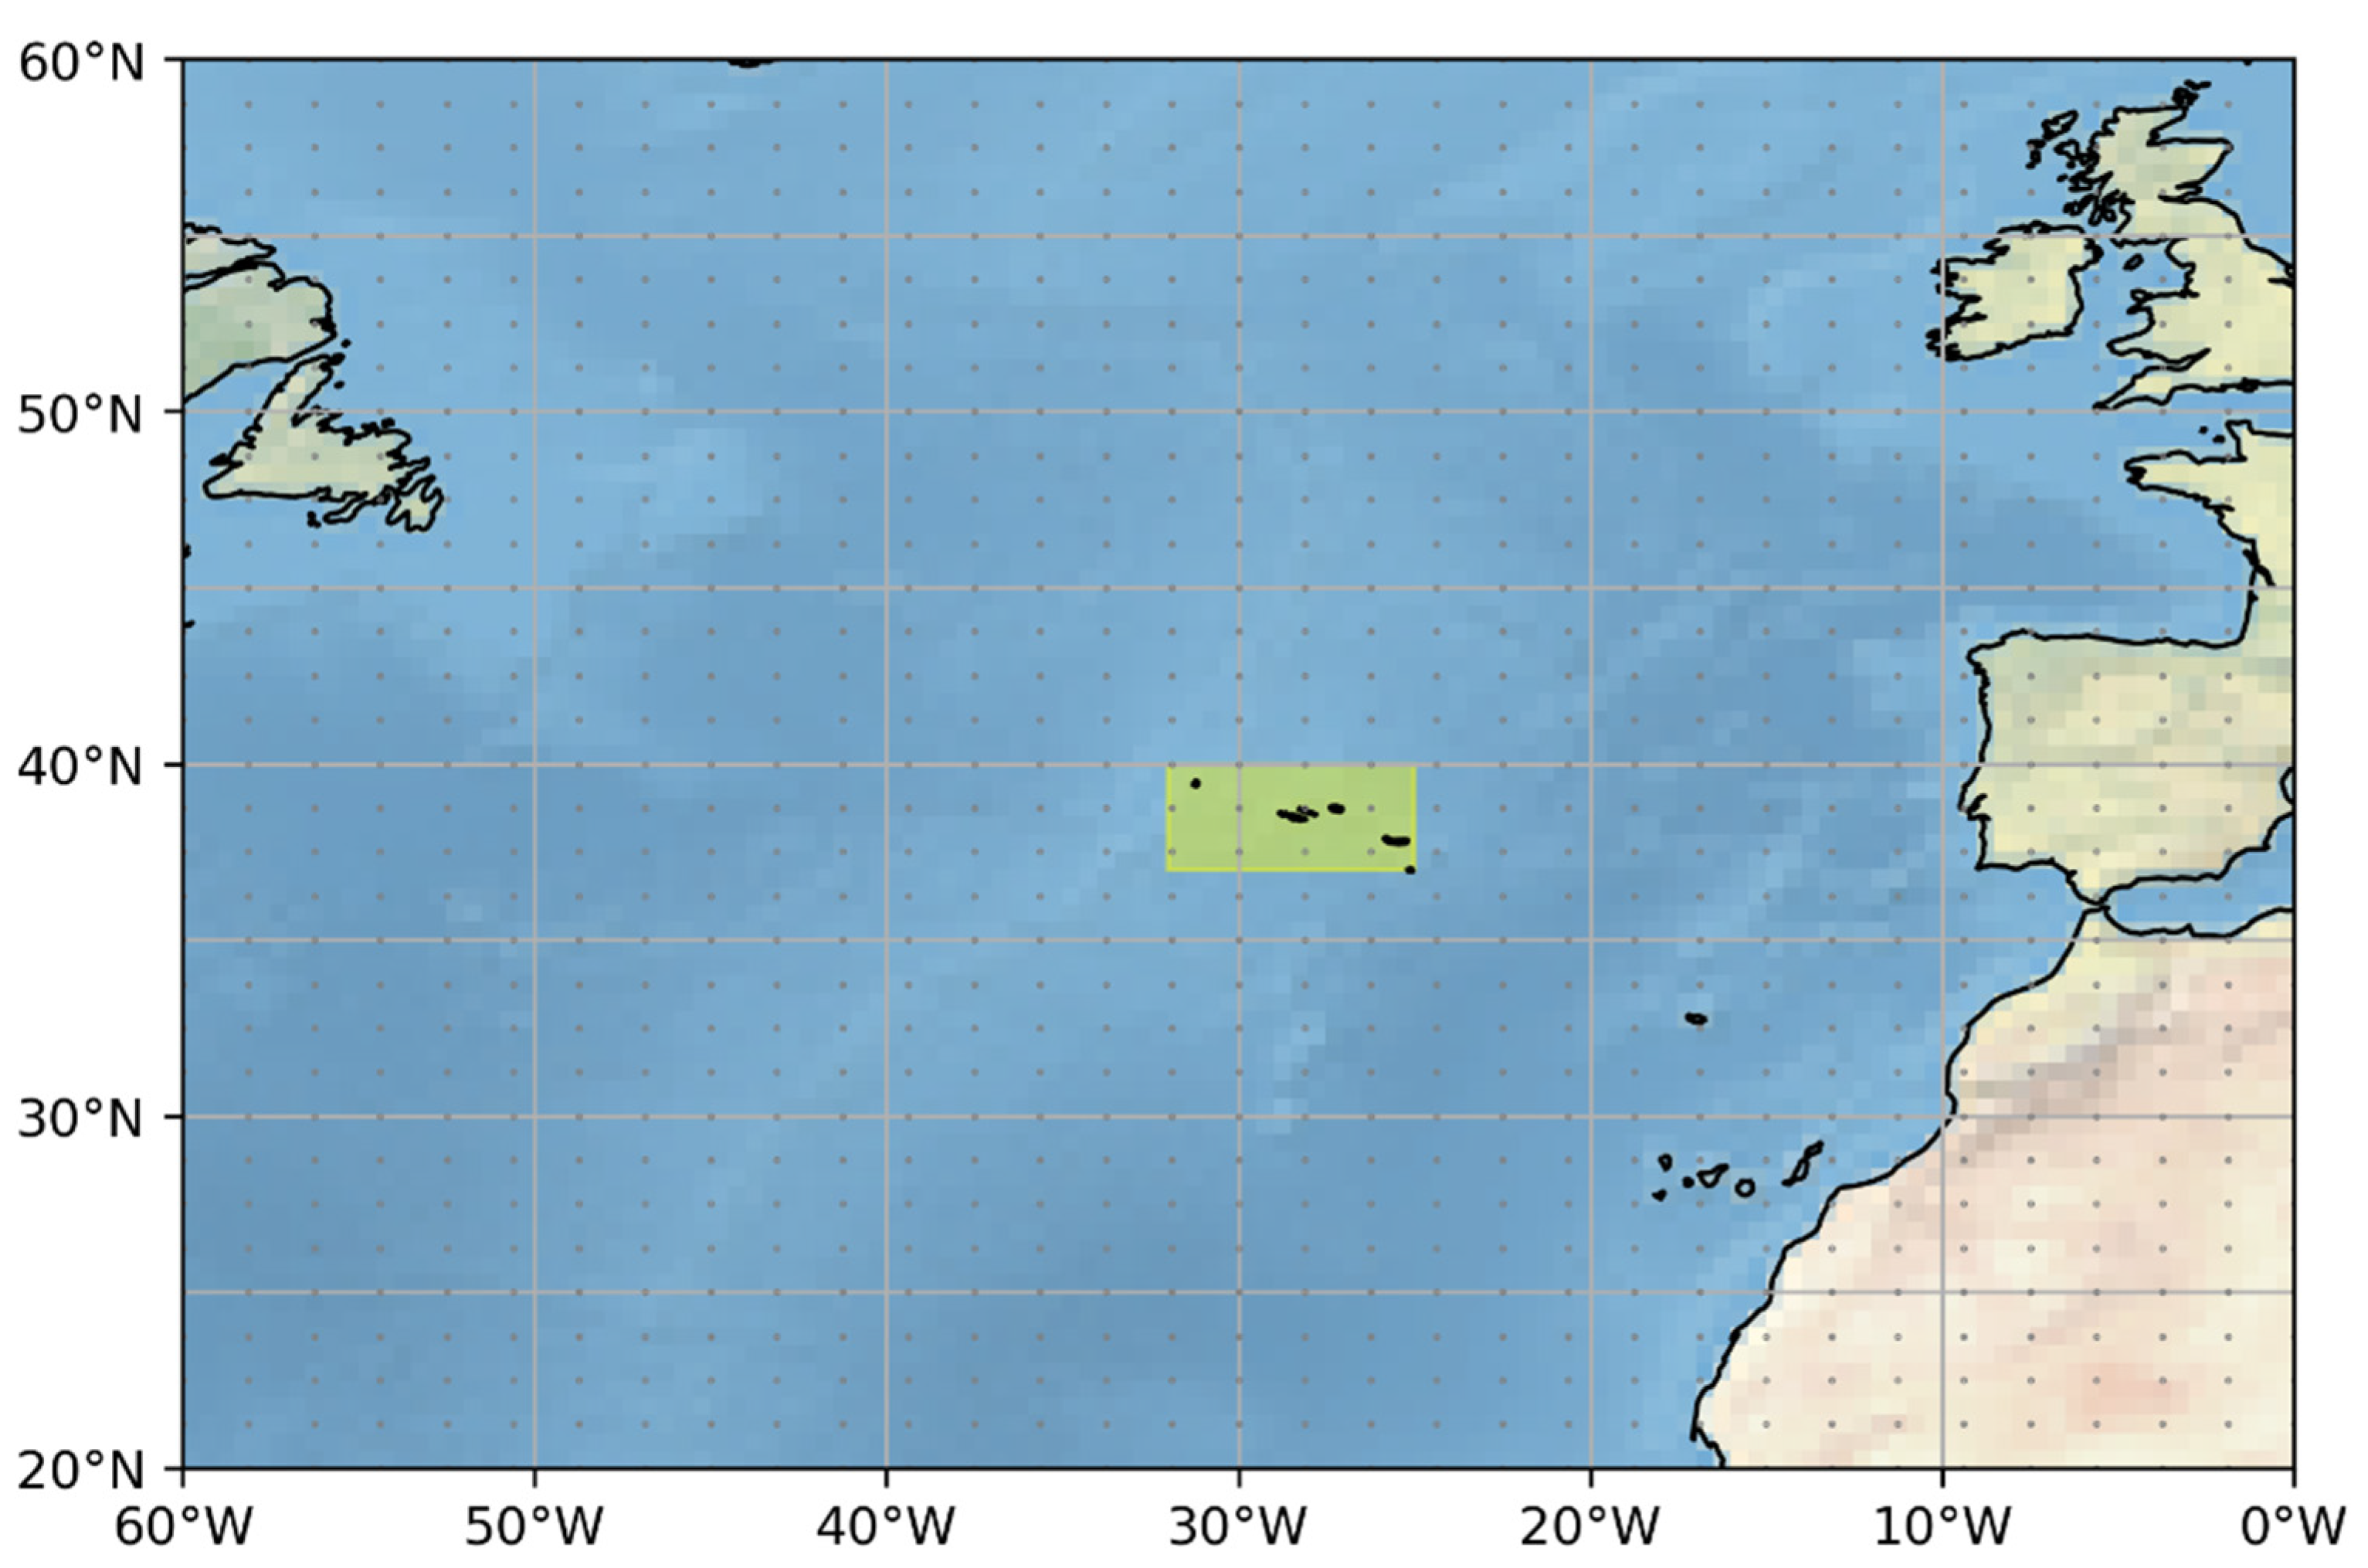
Results of the Coupled Model Intercomparison Phase 6 (CMIP6) were used for the Azores region, between parallels 37° N and 40° N and meridians 32° W and 25° W (
Figure 1), and for the SSP2 4.5 and SSP5 8.5 shared socioeconomic trajectories scenarios [
30], for the assessment of the essential climate variables changes driving RE. Global Coupled Climate Models are complex numerical/physical representations of the atmosphere, ocean, cryosphere, and land climate sub-systems, including their interactions, simulating the three-dimensional distribution of the climate over the globe [
31]. The CMIP6 is the 6th phase of a multi-model research activity started in 1996, under the auspices of the World’s Climate Research Programme’s (WCRP) Working Group on Coupled Modelling (WGCM), with the aim of a better understanding of the past, present and future CC due to natural, unforced variability or to radiative forcings in a multi-model context [
32,
33]. According to earlier IPCC assessments, it has been shown that, with some notable exceptions, the multi-model mean has better performance than individual model results [
34,
35]. The robustness of these models, in terms of mean state, variability and the response to external forcings has been carried out using the CMIP6 Diagnostic Evaluation and Characterization of Klima (DECK), concluding that the multi-model mean captures well most of the aspects of observed CC with high confidence [
36]. In summary, CMIP6 models perform better for a set of variables over historical climate across the atmosphere, ocean and land domains than previous CMIP phases and older models [
33].
Climate projections depend on scenarios. A scenario is a description of how the future may develop, based on a coherent and internally consistent set of assumptions about key drivers including demography, economic processes, technological innovation, governance, lifestyles and relationships among these driving forces [
37]. CMIP6 uses the so-called Shared Socio-economic Pathway (SSP) scenarios, i.e., the socio-economic developments based on (among other things) GDP, population, urbanization, economic collaboration and human and technological development projections that describe different future worlds in the absence of CC and additional climate policy [
37,
38]. The quantification of energy, land use and emissions in those developments is not part of the SSPX narratives but is included in the SSPX-RCPY scenarios that consist of socio-economic futures (SSPXs) and emissions and the earlier concentrations futures (RCPYs or Representative Concentration Pathways) developed separately before used in combination [
37].
Most of the CMIP6 climate data and projections used in this work are freely available on the Climate Explorer portal (
https://climexp.knmi.nl (accessed on 15 May 2022) of KNMI (Koninklijk Nederlands Meteorologisch Instituut, De Bilt, The Netherlands). For most of the variables, there were used 40 CMIP6 models from 49 modeling different groups. For the wind speed projections, only three CMIP6 models were used: NorESM2 mm (NCC, Oslo, Norway), ACCESS-CM2 (CSIRO-ARCCSS, Aspendale, Australia), GFDL-ESM4 (NOAA-GFDL, Princeton, NJ, USA). Each monthly mean variable field was computed from the ensemble mean of the models’ monthly means. Each variable field has 1.88° (lon) × 1.25° (lat) horizontal grid resolution.
4. Results
4.1. Air Temperature
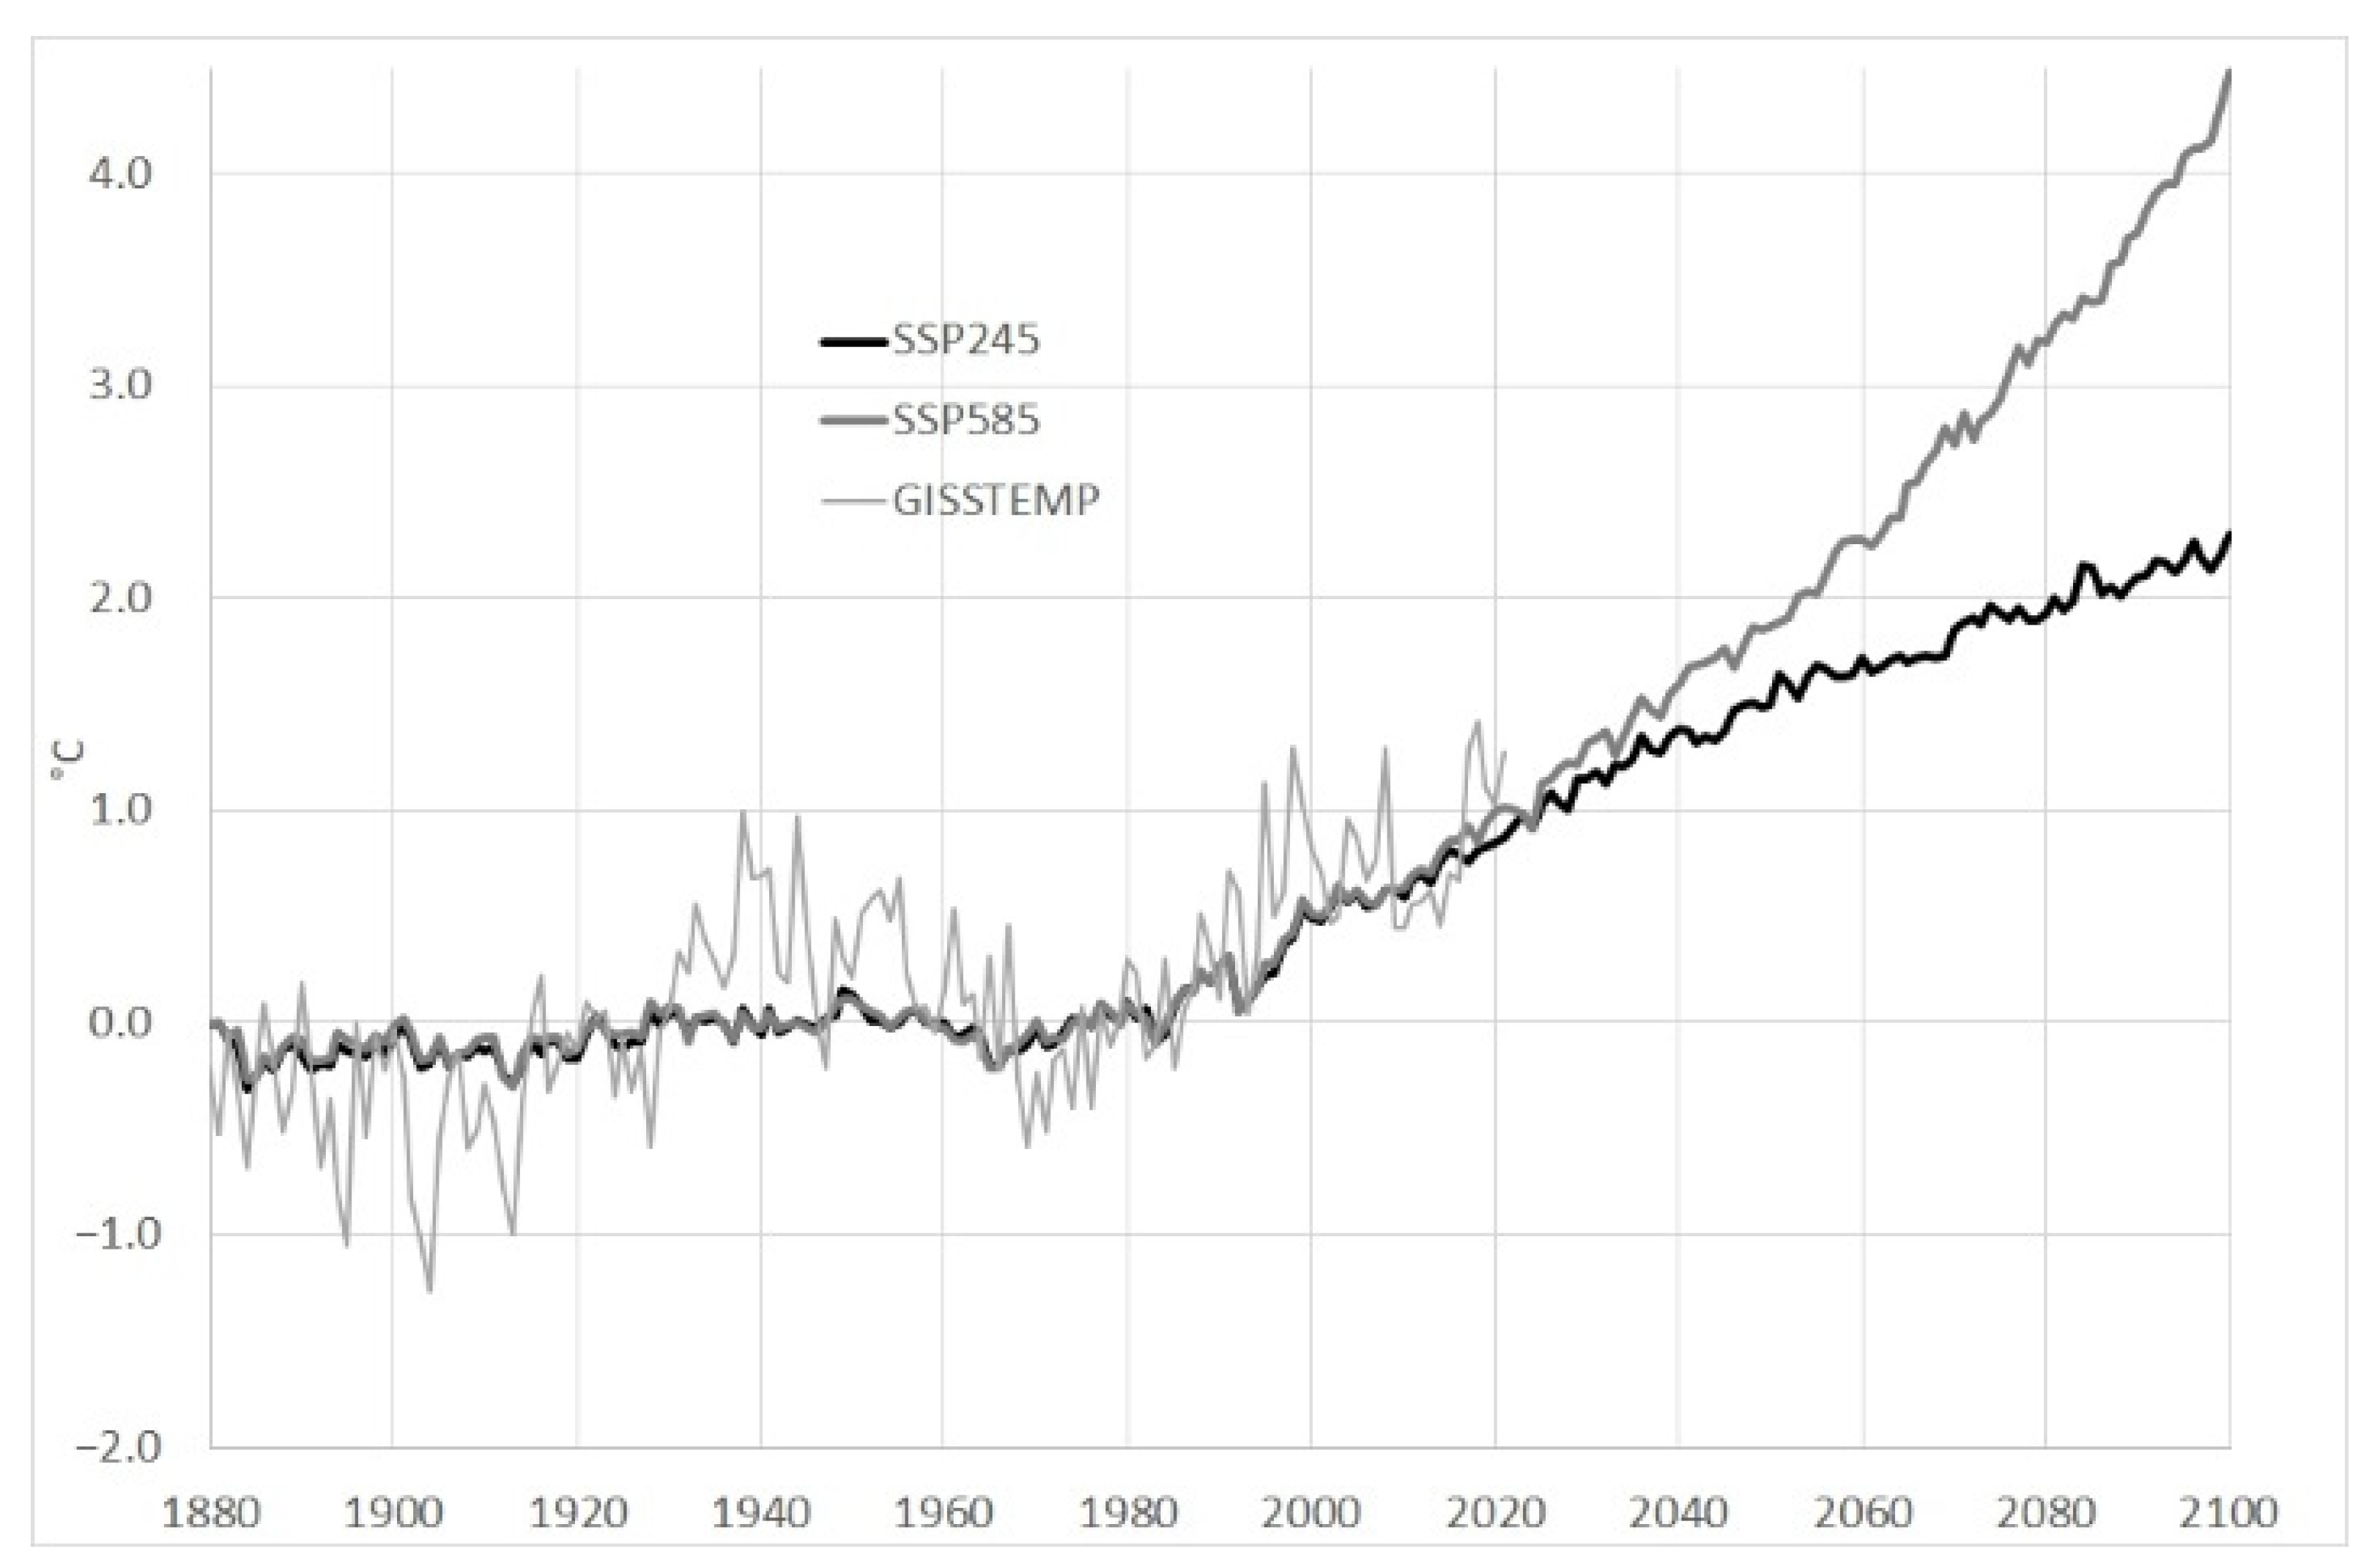
The increase in surface air temperature observed on a global scale during the last decades is also observed in the Azores region. The graph in
Figure 2 shows a subset of the time series of annual surface air temperature anomalies for the 1961–1990 reference period, estimated by NASA’s Goddard Institute for Space Studies (GISTEMP) for the geographical area under study.
The positive trend is noticeable, especially since the 70s of the last century. In the last 30 years, the surface air temperature in the Azores region is about 0.7 ± 0.3 °C higher than 50 years ago and, according to the available climate projections, this deviation will be even greater in the coming decades of this century [
22]. In the graph of
Figure 2, the projections of the surface air temperature anomalies are represented for the SSP2 4.5 and SSP5 8.5 scenarios for the Azores region until the end of the XXI century, obtained from the average of the ensemble of coupled models of the CMIP6 project. The differences between the projections and GISTEMP between 1880 and 2006 result mainly from the reduction of variability in the projections after averaging the various models. However, the models reproduce reasonably well the trend since the 1970s of the last century.
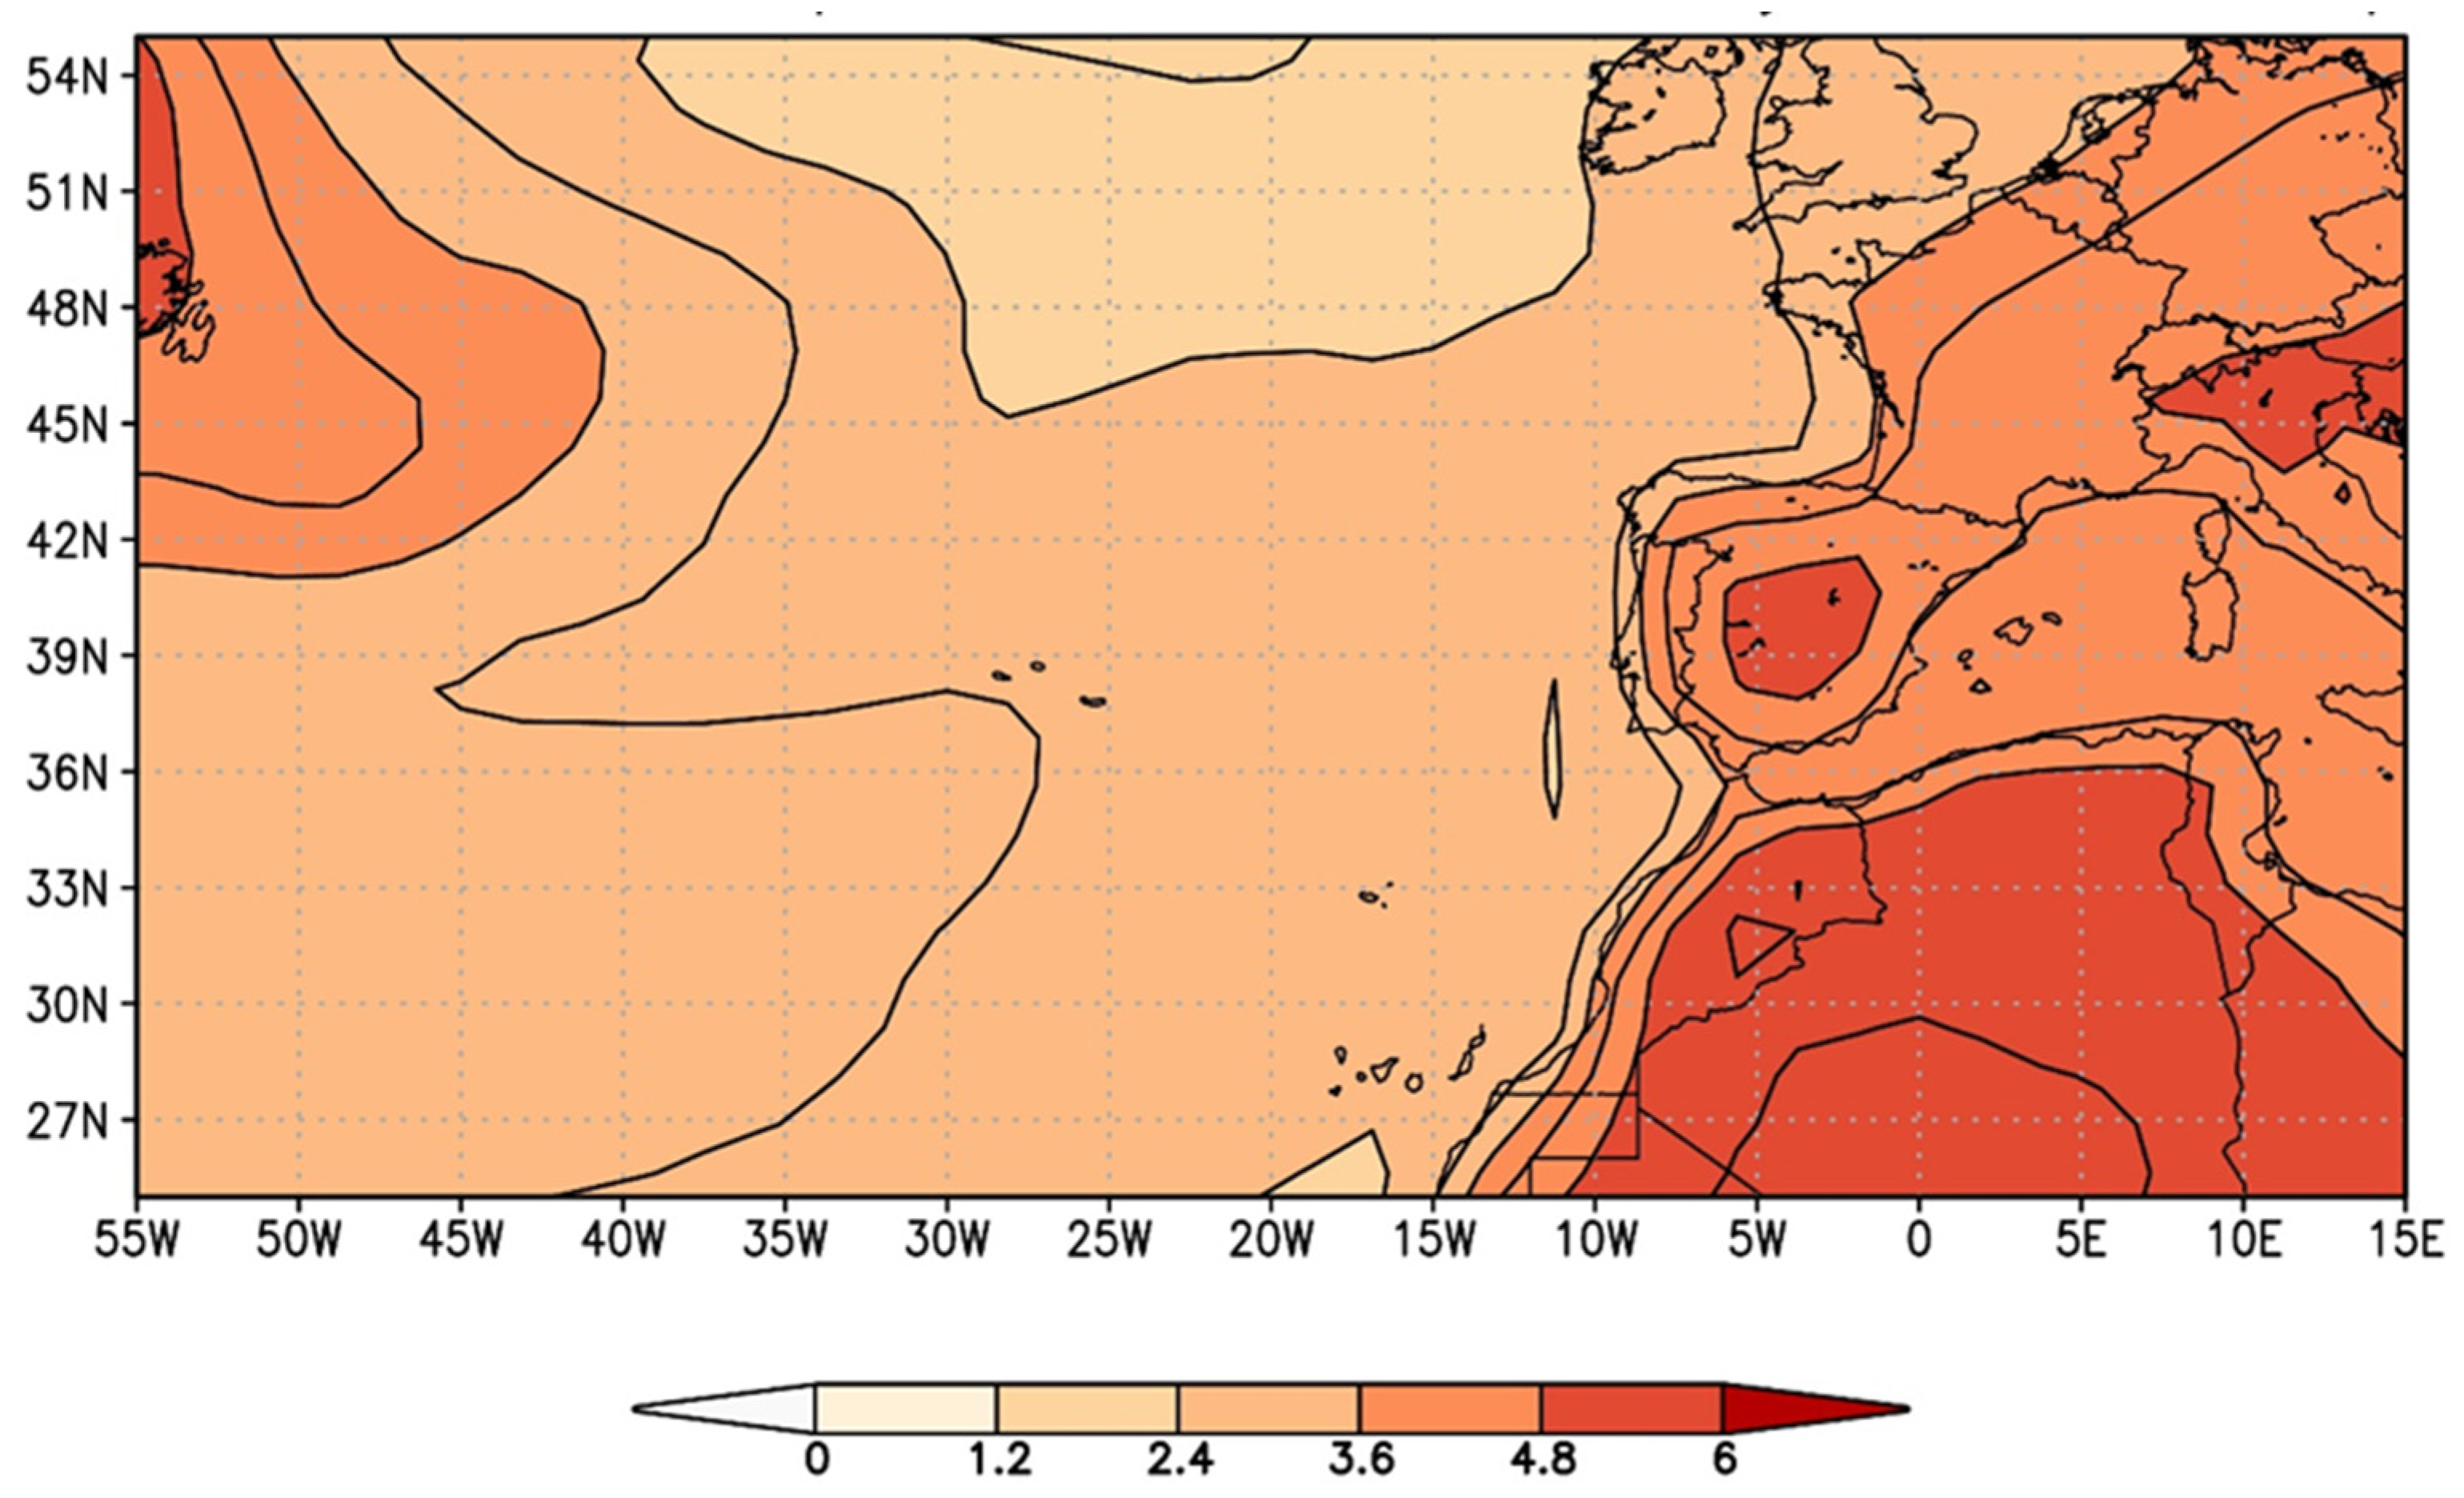
The projected temperature increase by the end of the 21st century (2071–2100) is between 2.1 ± 0.1 °C (SSP2 4.5) and 3.3 ± 0.5 °C (SSP5 8.5) relative to 1961–1990 reference values. In the worst-case scenario (SSP5 8.5), the difference between temperatures of the last 30 years (1991–2020) and the last 30 years of this century (2071–2100) is 2 to 4 °C for much of the North Atlantic (
Figure 3).
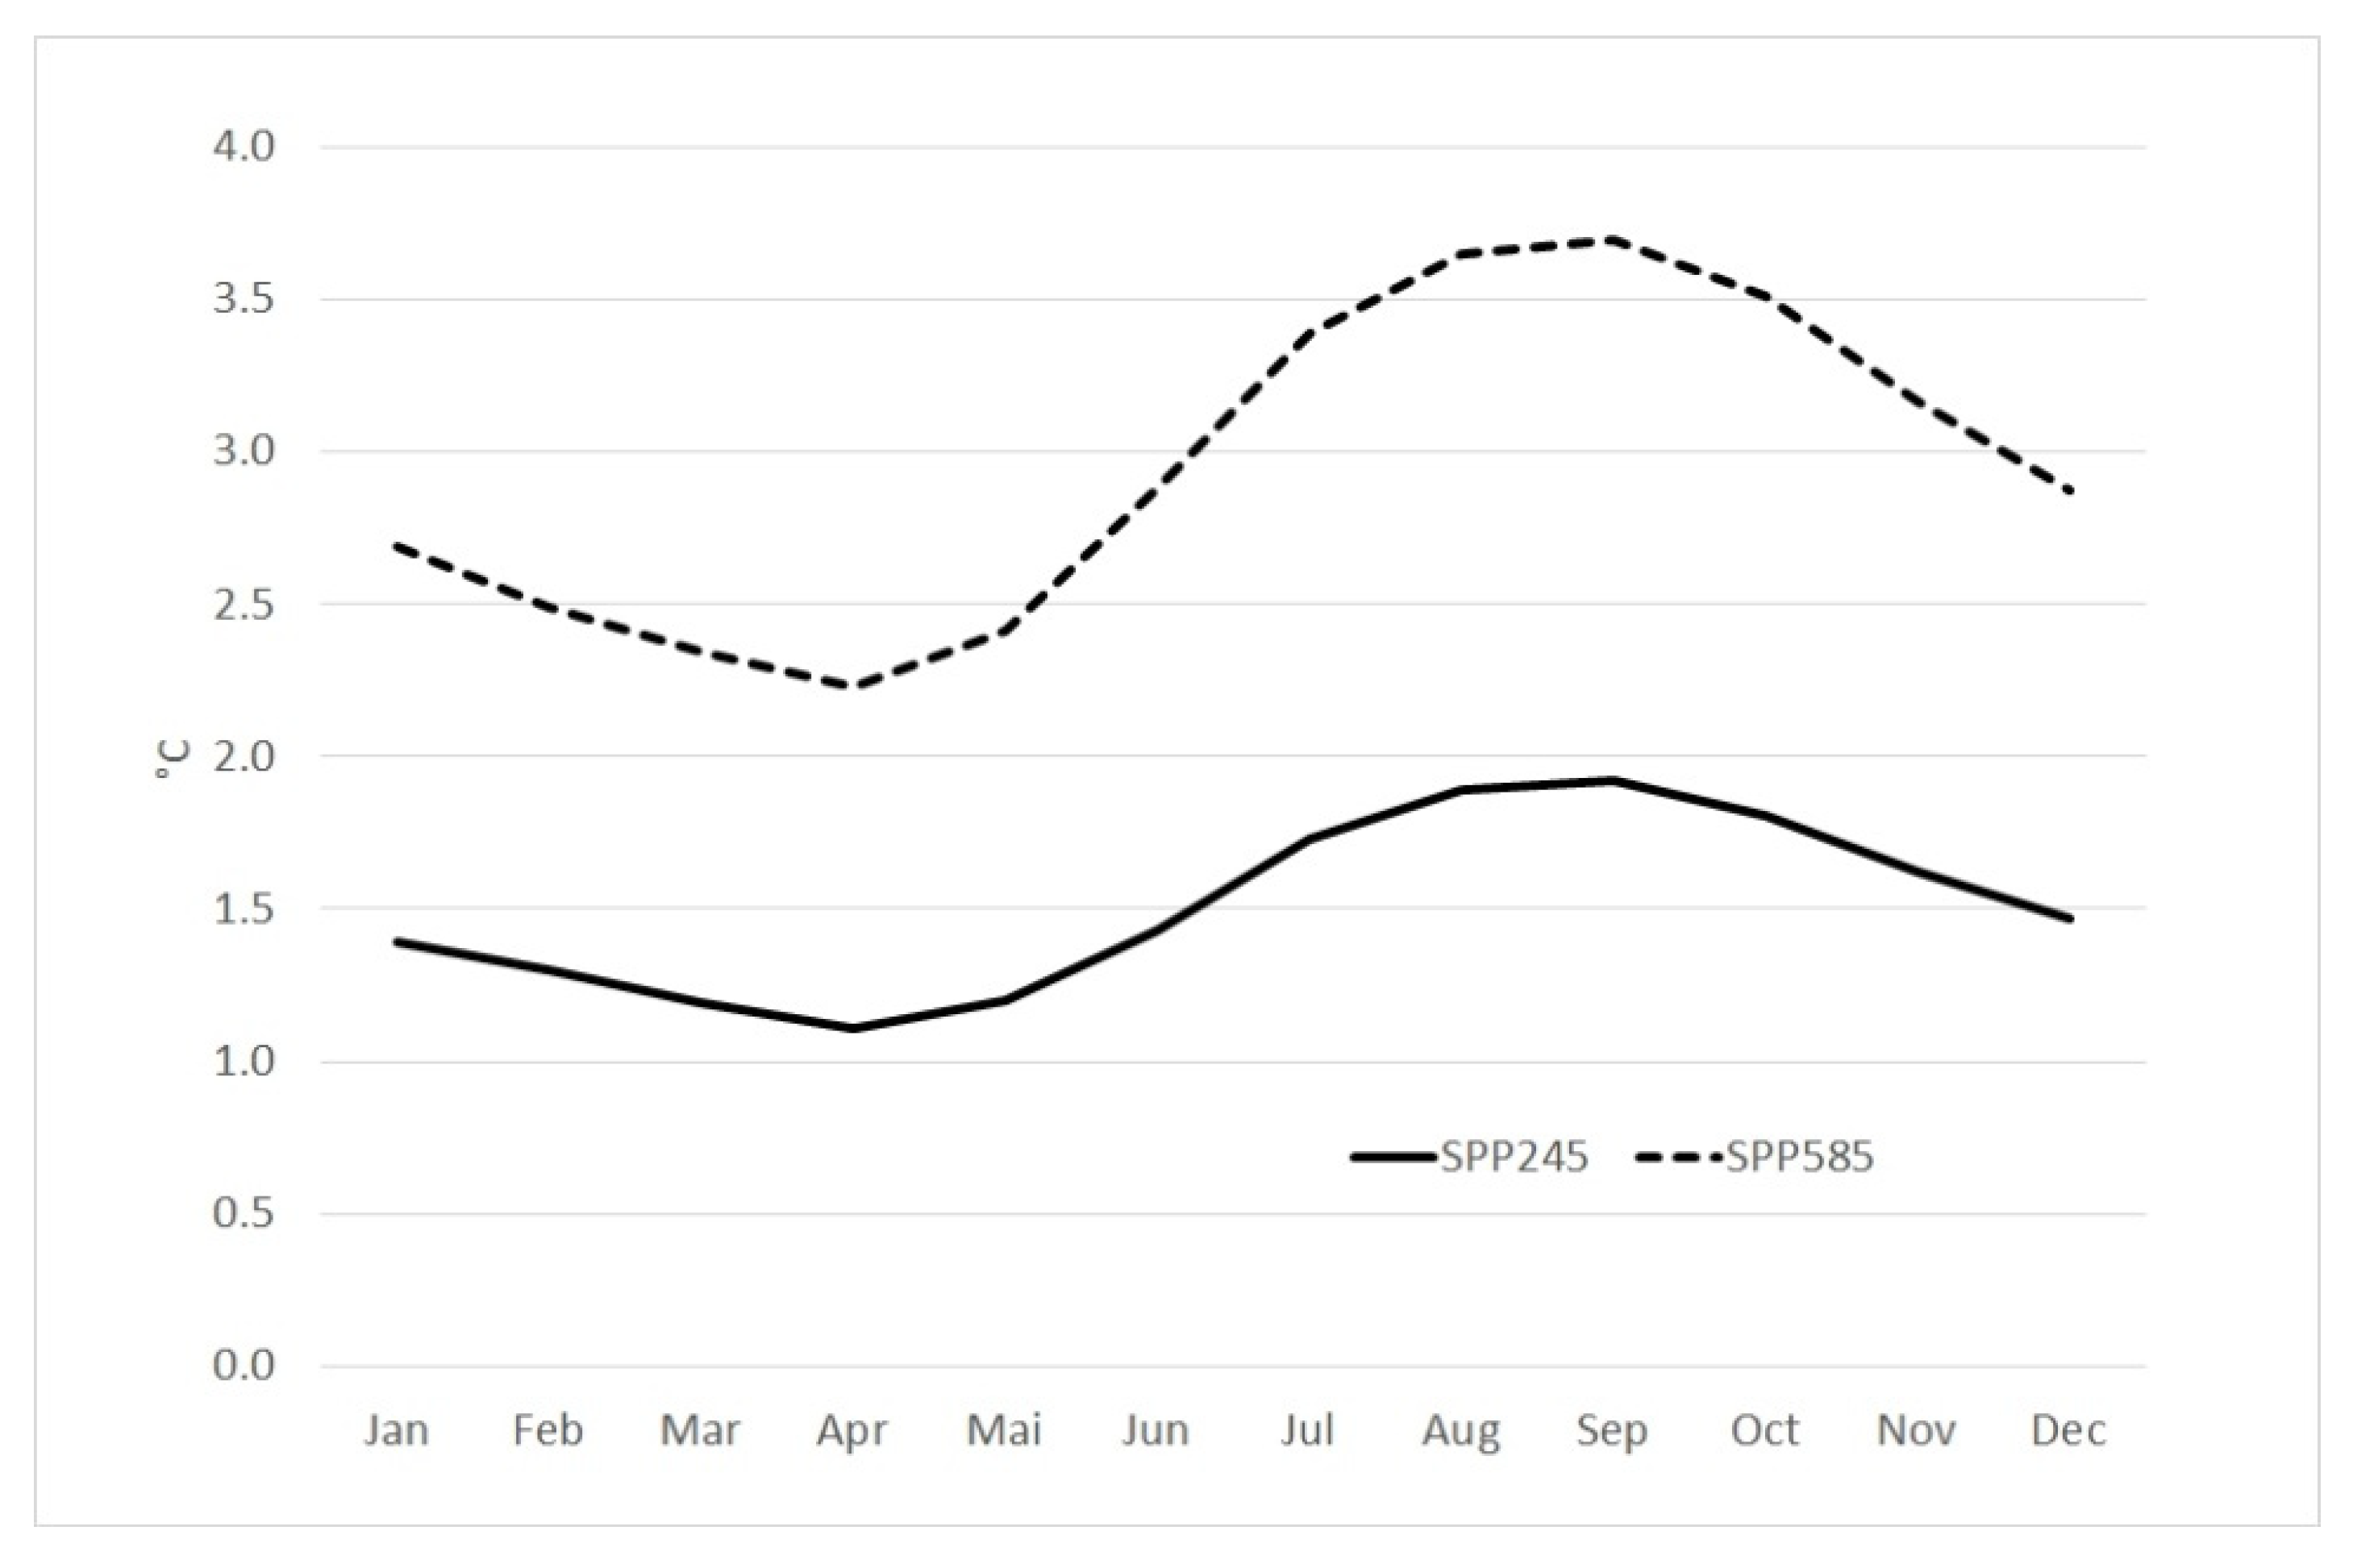
However, it is also interesting to analyze the evolution of air temperature changes throughout the year. In the graph of
Figure 4, the changes in average monthly temperatures projected for the end of XXI century (2071–2100) relative to the recent past (1991–2020) for scenarios SSP2 4.5 and SSP5 8.5 are represented. It can be seen that temperature increases in all months, but not in the same way. The increases between July and November are higher than in the other months and may even exceed 3.5 °C for the SSP5 8.5 scenario and around 2 °C in the SSP2 4.5 scenario. The smallest increase is verified in spring (April). On the other hand, it is estimated that an increase in the annual thermal amplitude of about 0.8 °C for SSP2 4.5 and 1.5 °C for SSP5 8.5. In short, the projected air temperature changes for the SSP5 8.5 scenario correspond to about twice those of the SSP2 4.5 scenario.
Geothermal and Thermal Energy
About 85.8% of the electricity produced in the RAA in 2019 was of thermal and geothermal origin [
11]. However, the efficiency of thermal machines generally depends on the ambient temperature conditions, and it decreases with the increase in air temperature. Under these conditions, it is expected that, in general, the efficiency of this form of energy production will decrease in the future, more in summer and less in spring. In the case of combustion power plants, more fuel will have to be consumed. The report of the “PRAC: Plano Regional para as Alterações Climáticas dos Açores” (Azores Regional Plan for Climate Change) [
29], presents a well-defined relationship between the average geothermal power produced on the island of São Miguel. The use of these relationships and the projection results obtained above allow us to estimate that the average reductions in geothermal power by the end of the century, due only to the increase in air temperature, are of the order of 0.5% to 2% for the RCP scenarios under study.
On the other hand, a large part of energy consumption goes towards running refrigeration and air conditioning systems. In a warmer climate, especially in summer, it will be necessary to consume more energy. Based on the PRAC results for the dependence on load energy, it is estimated that the increases in energy consumption due only to the average annual increase in air temperature in São Miguel until the end of the century, are of the order of 2.5% and 6% for the above-mentioned scenarios.
In summary, the impacts of CC on the production and consumption of thermal and geothermal energy are frankly negative for the RAA.
4.2. Precipitation
The effects of global warming on the evolution and distribution of precipitation are not evident. While an increase in evaporation and the amount of water vapor in the atmosphere is expected, it is not obvious that this will translate into an equivalent increase in precipitation [
6]. The processes of evaporation and precipitation are very complex, and the most advanced models still use parametrizations or crude representations to resolve these mechanisms in the atmosphere. Similarly to temperature,
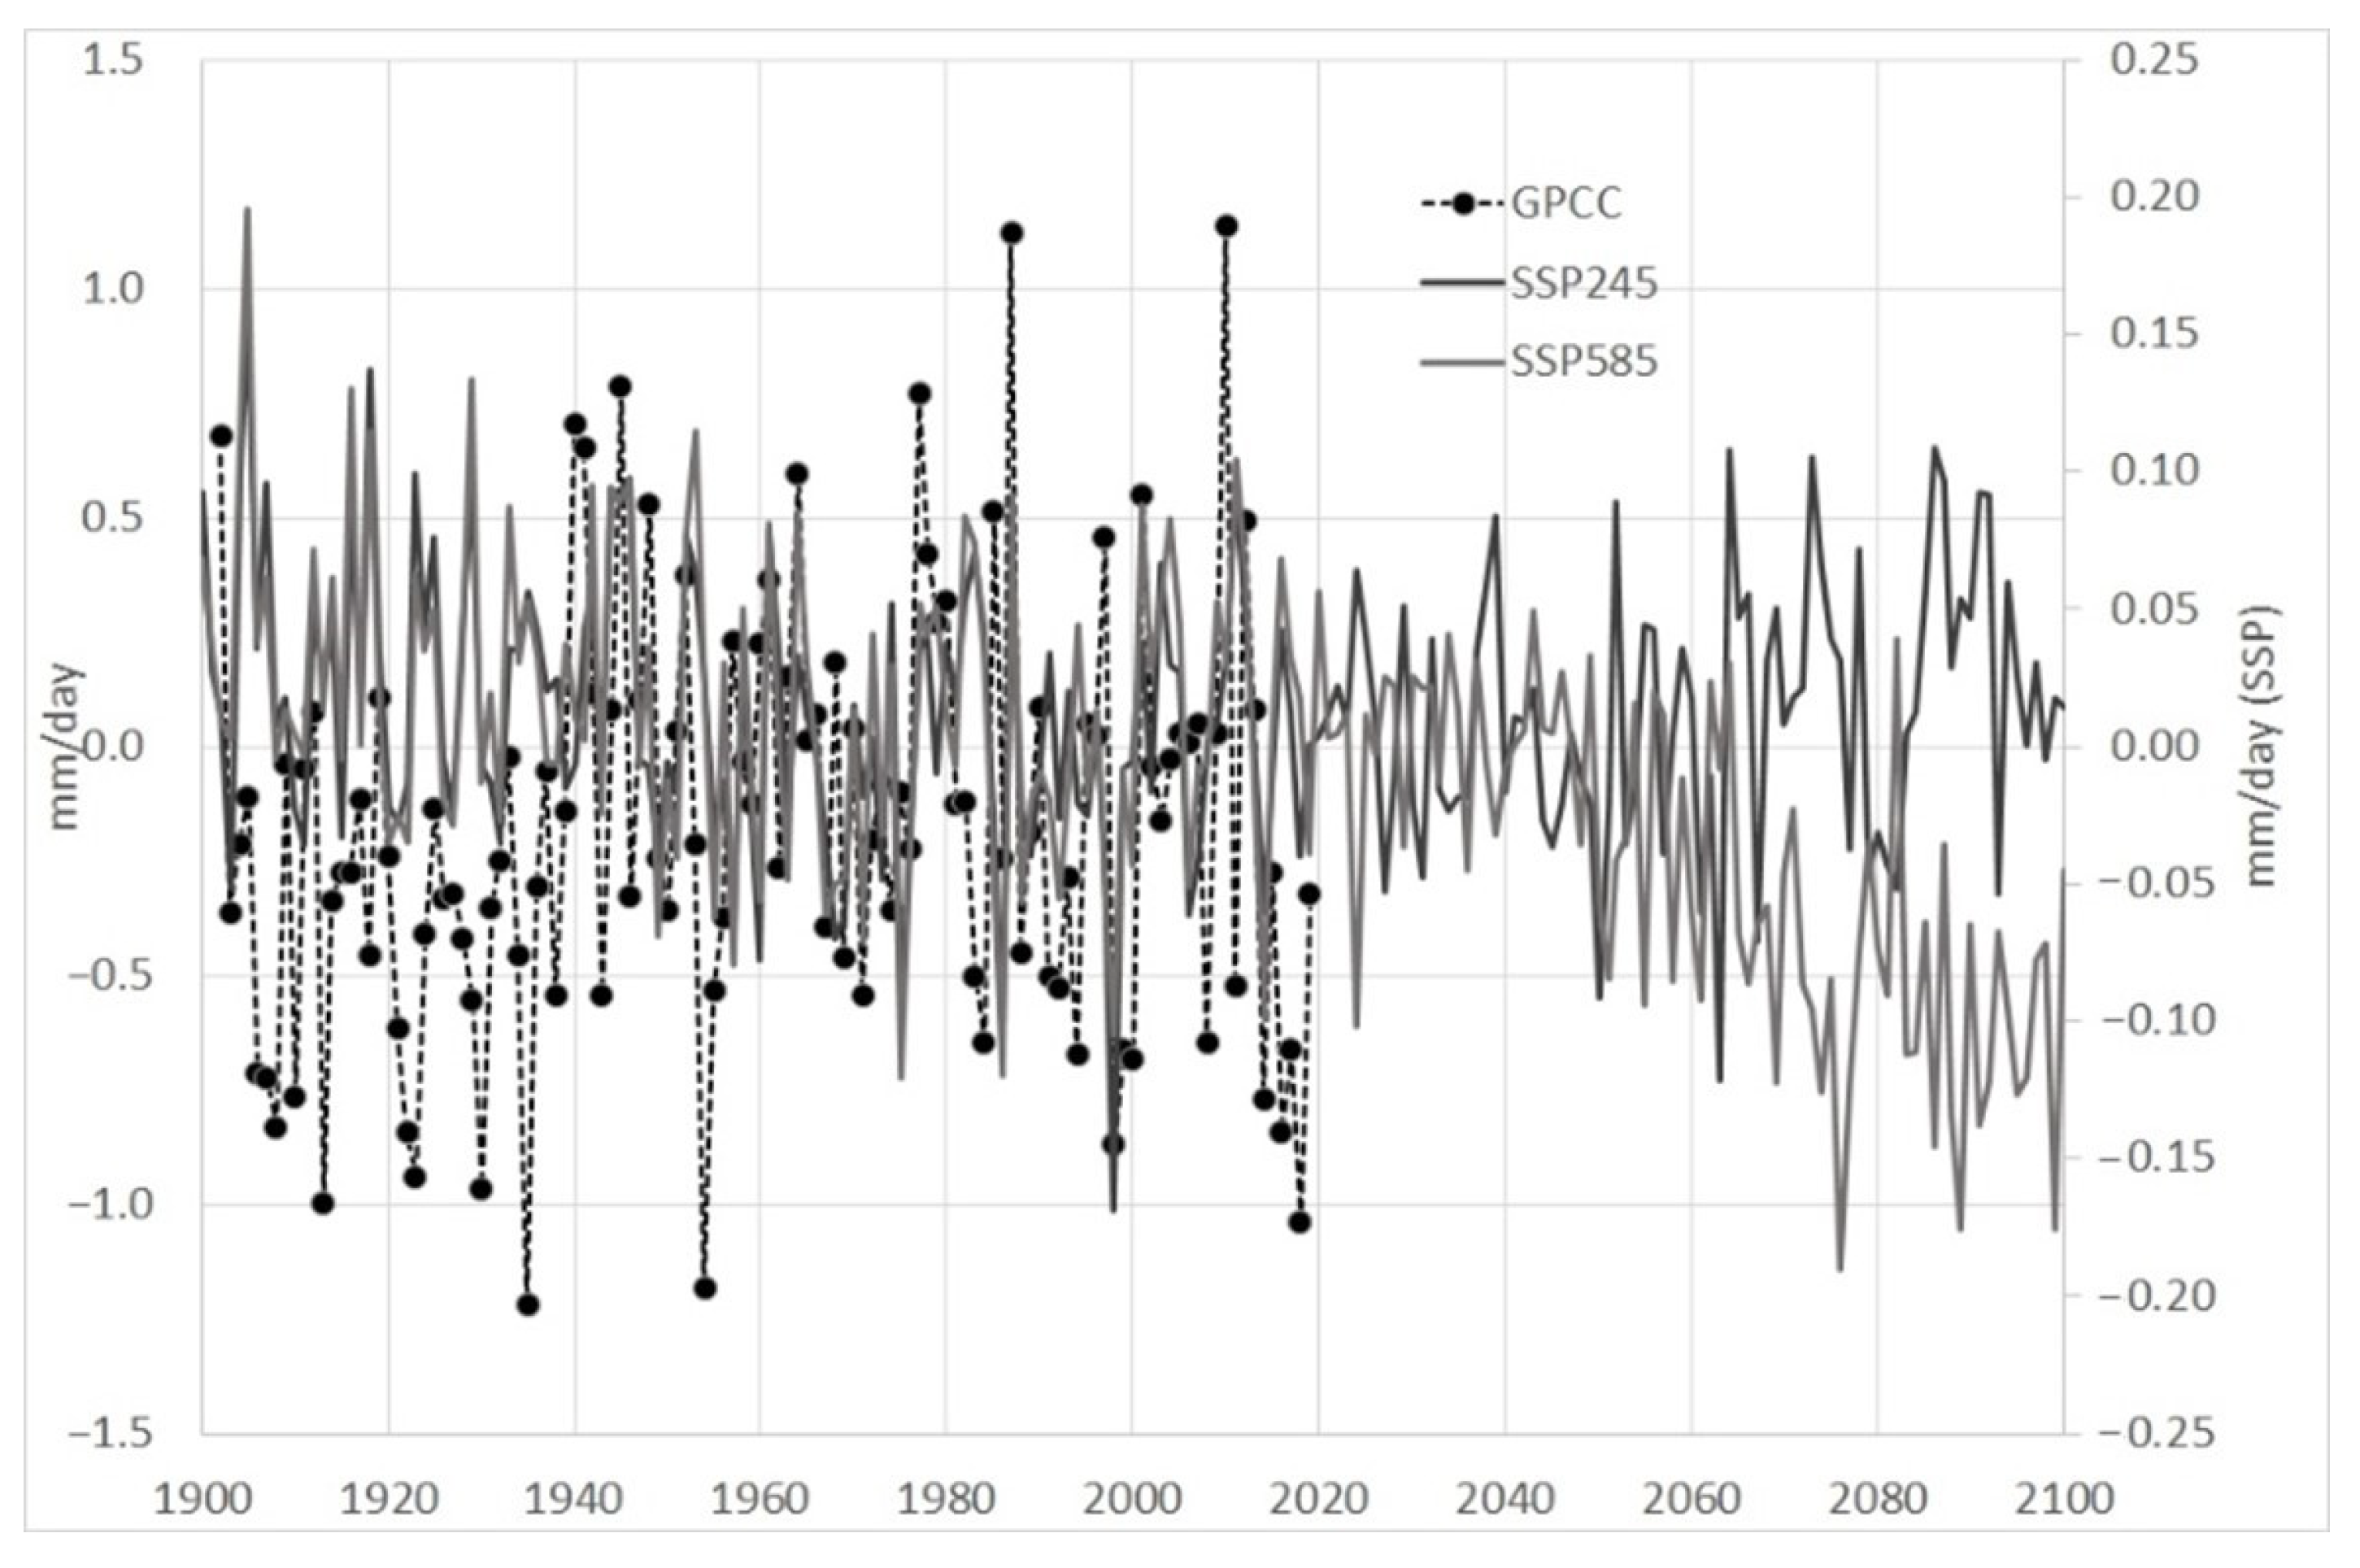
Figure 5 shows the annual anomalies of mean annual precipitation amount estimated for the Azores region since 1900 by the Global Precipitation Climatology Centre (GPCC) of the DWD (Deutsche Wetterdienst), as well as the historical simulations until 2014 and projections for the SSP2 4.5 and SSP5 8.5 scenarios until 2100 for the same study area.
In this case, it is not clear that there is a statistically significant trend; however, the annual precipitation amounts over the last 30 years of this series (1987–2016) are about 0.22 ± 0.48 mm/day (−79.4 ± 177 mm/year) lower than the 1961–1990 reference values.
However, the CMIP6 projections present distinct behaviors, pointing to a decrease until the 60s of the present century for the SSP5 8.5 scenario.
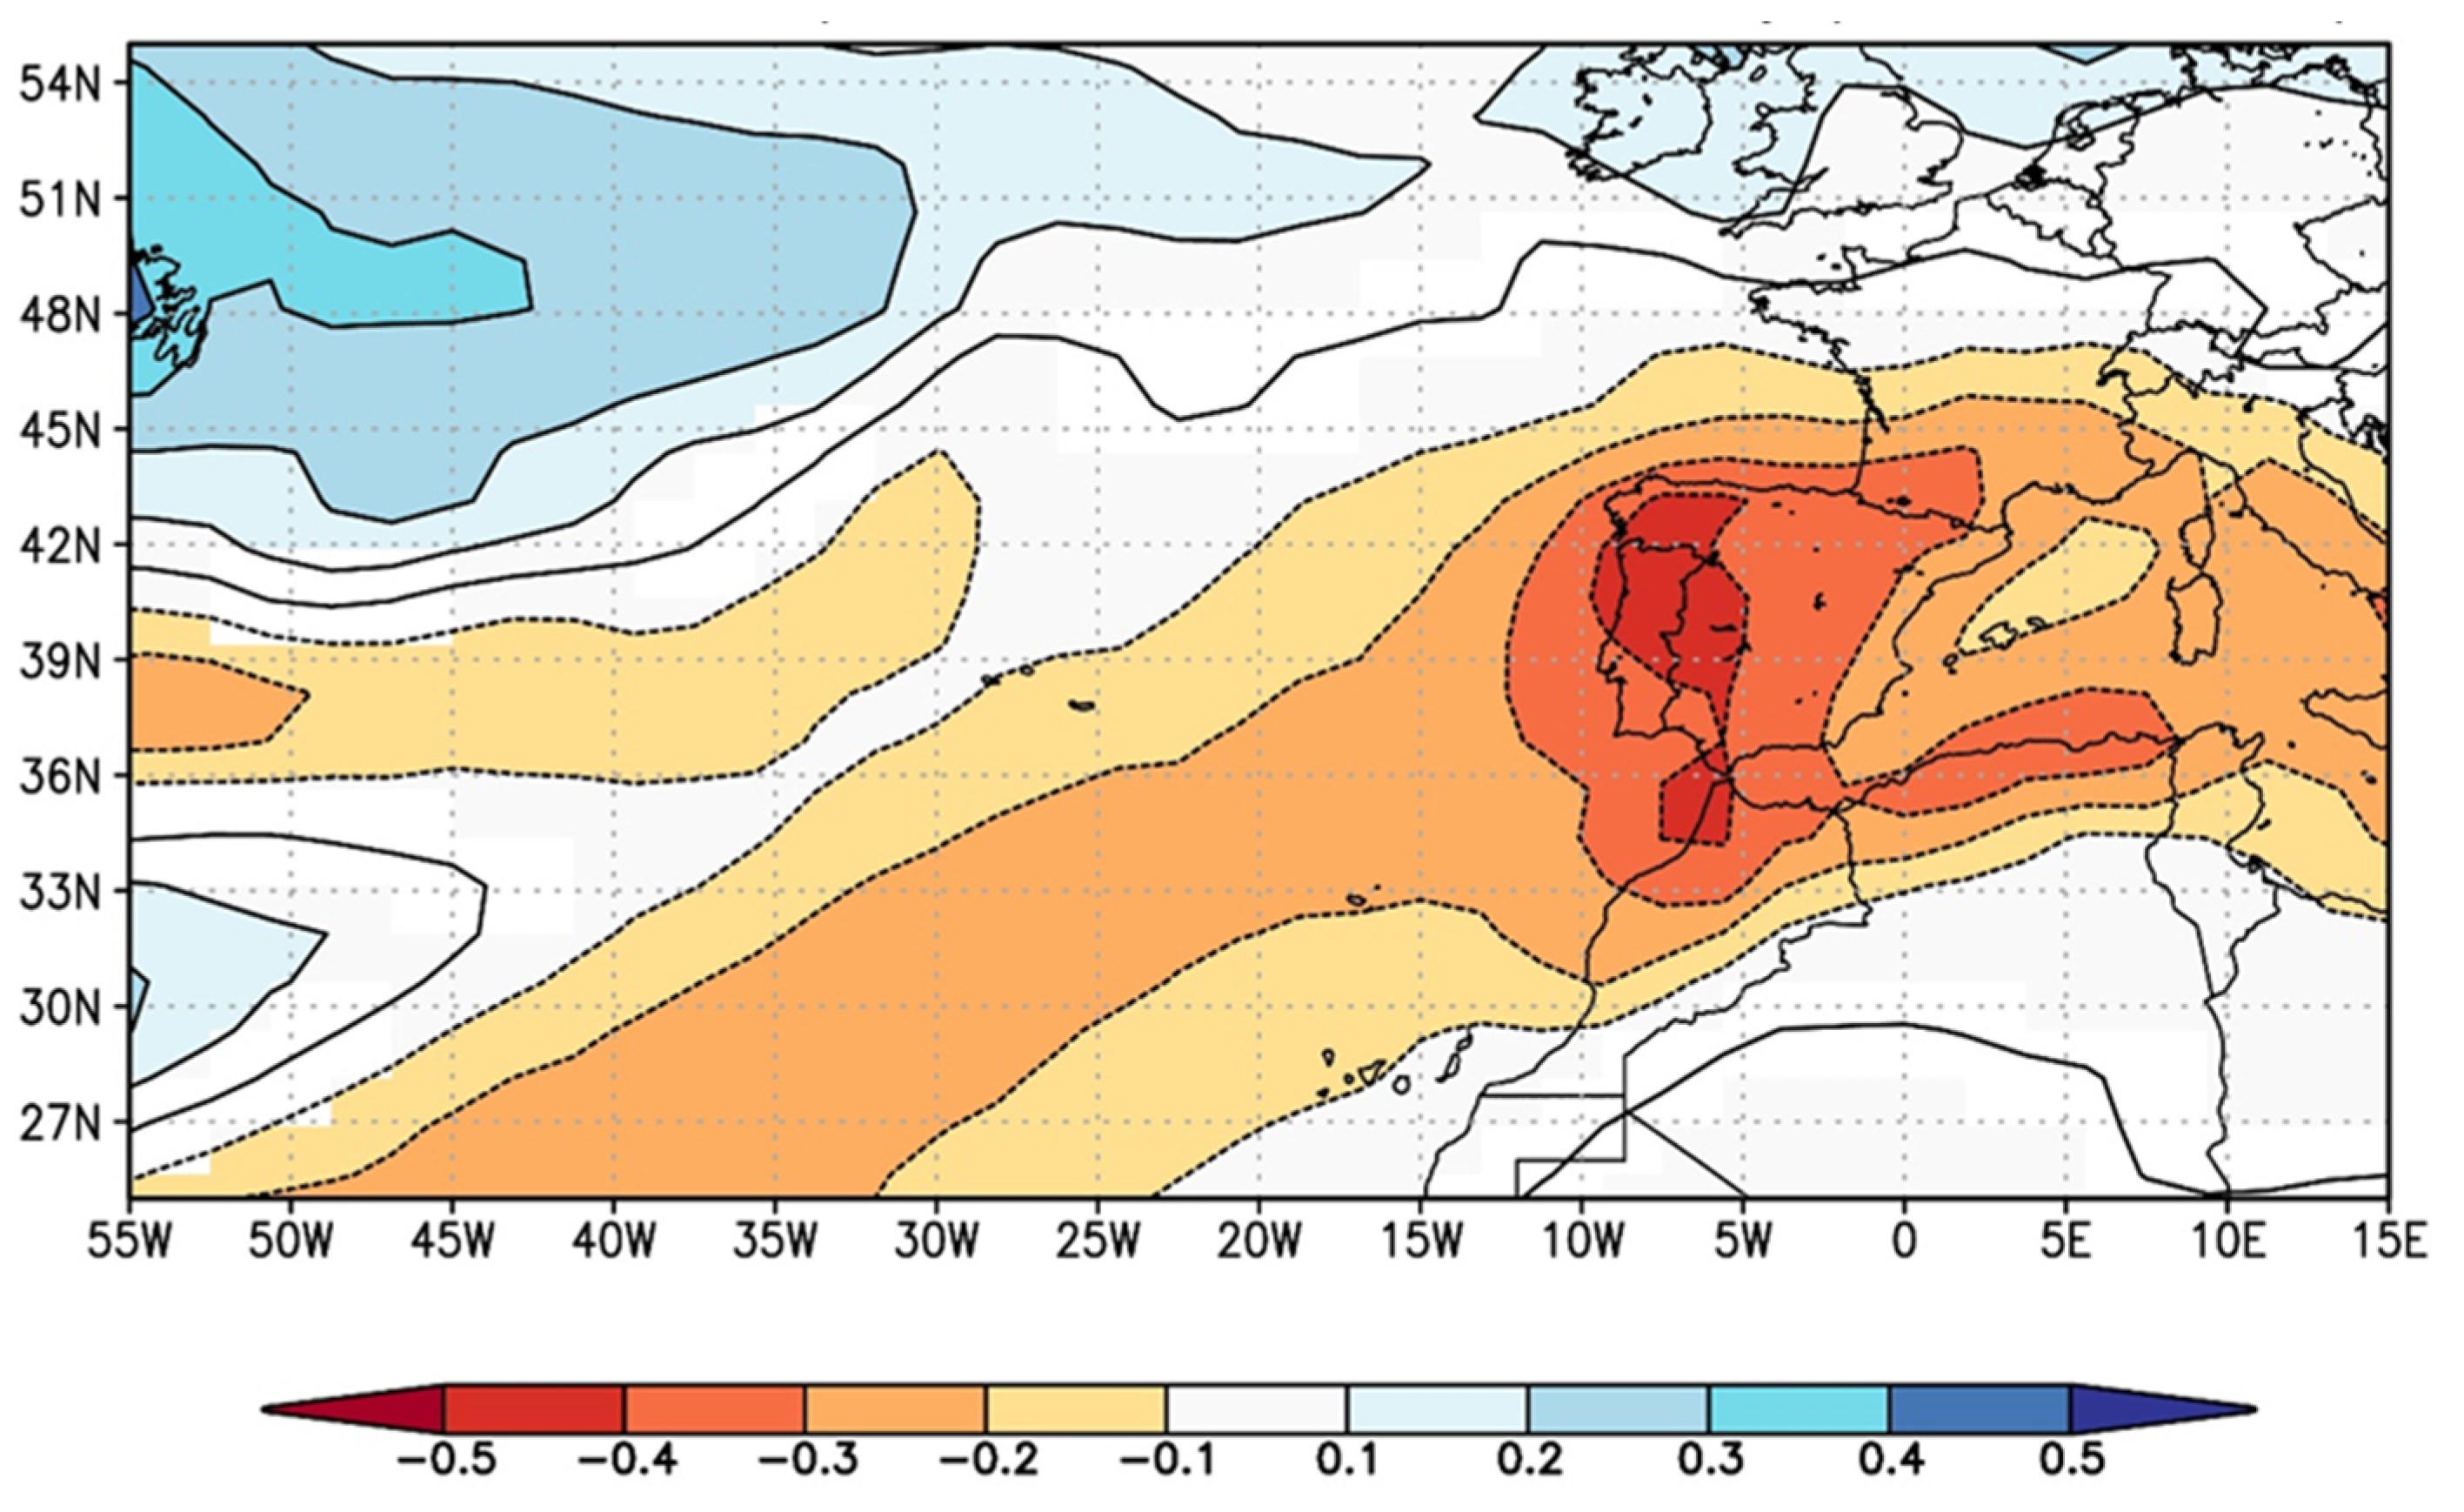
The projected precipitation variation until the end of the XXI century (2071–2100) is between −0.03 ± 0.05 mm/day and −0.09 ± 0.05 mm/day relative to the 1961–1990 reference values. In the worst-case scenario (SSP5 8.5), the difference between the average annual precipitation amounts of the last 30 years (1991–2020) and the last 30 years of this century (2071–2100) is −0.1 and −0.2 mm/day for the adjacent Atlantic region that includes the central and eastern groups of the Azores (
Figure 6). The projected differences for the western group are, however, within the natural variability of rainfall in this part of the Atlantic.
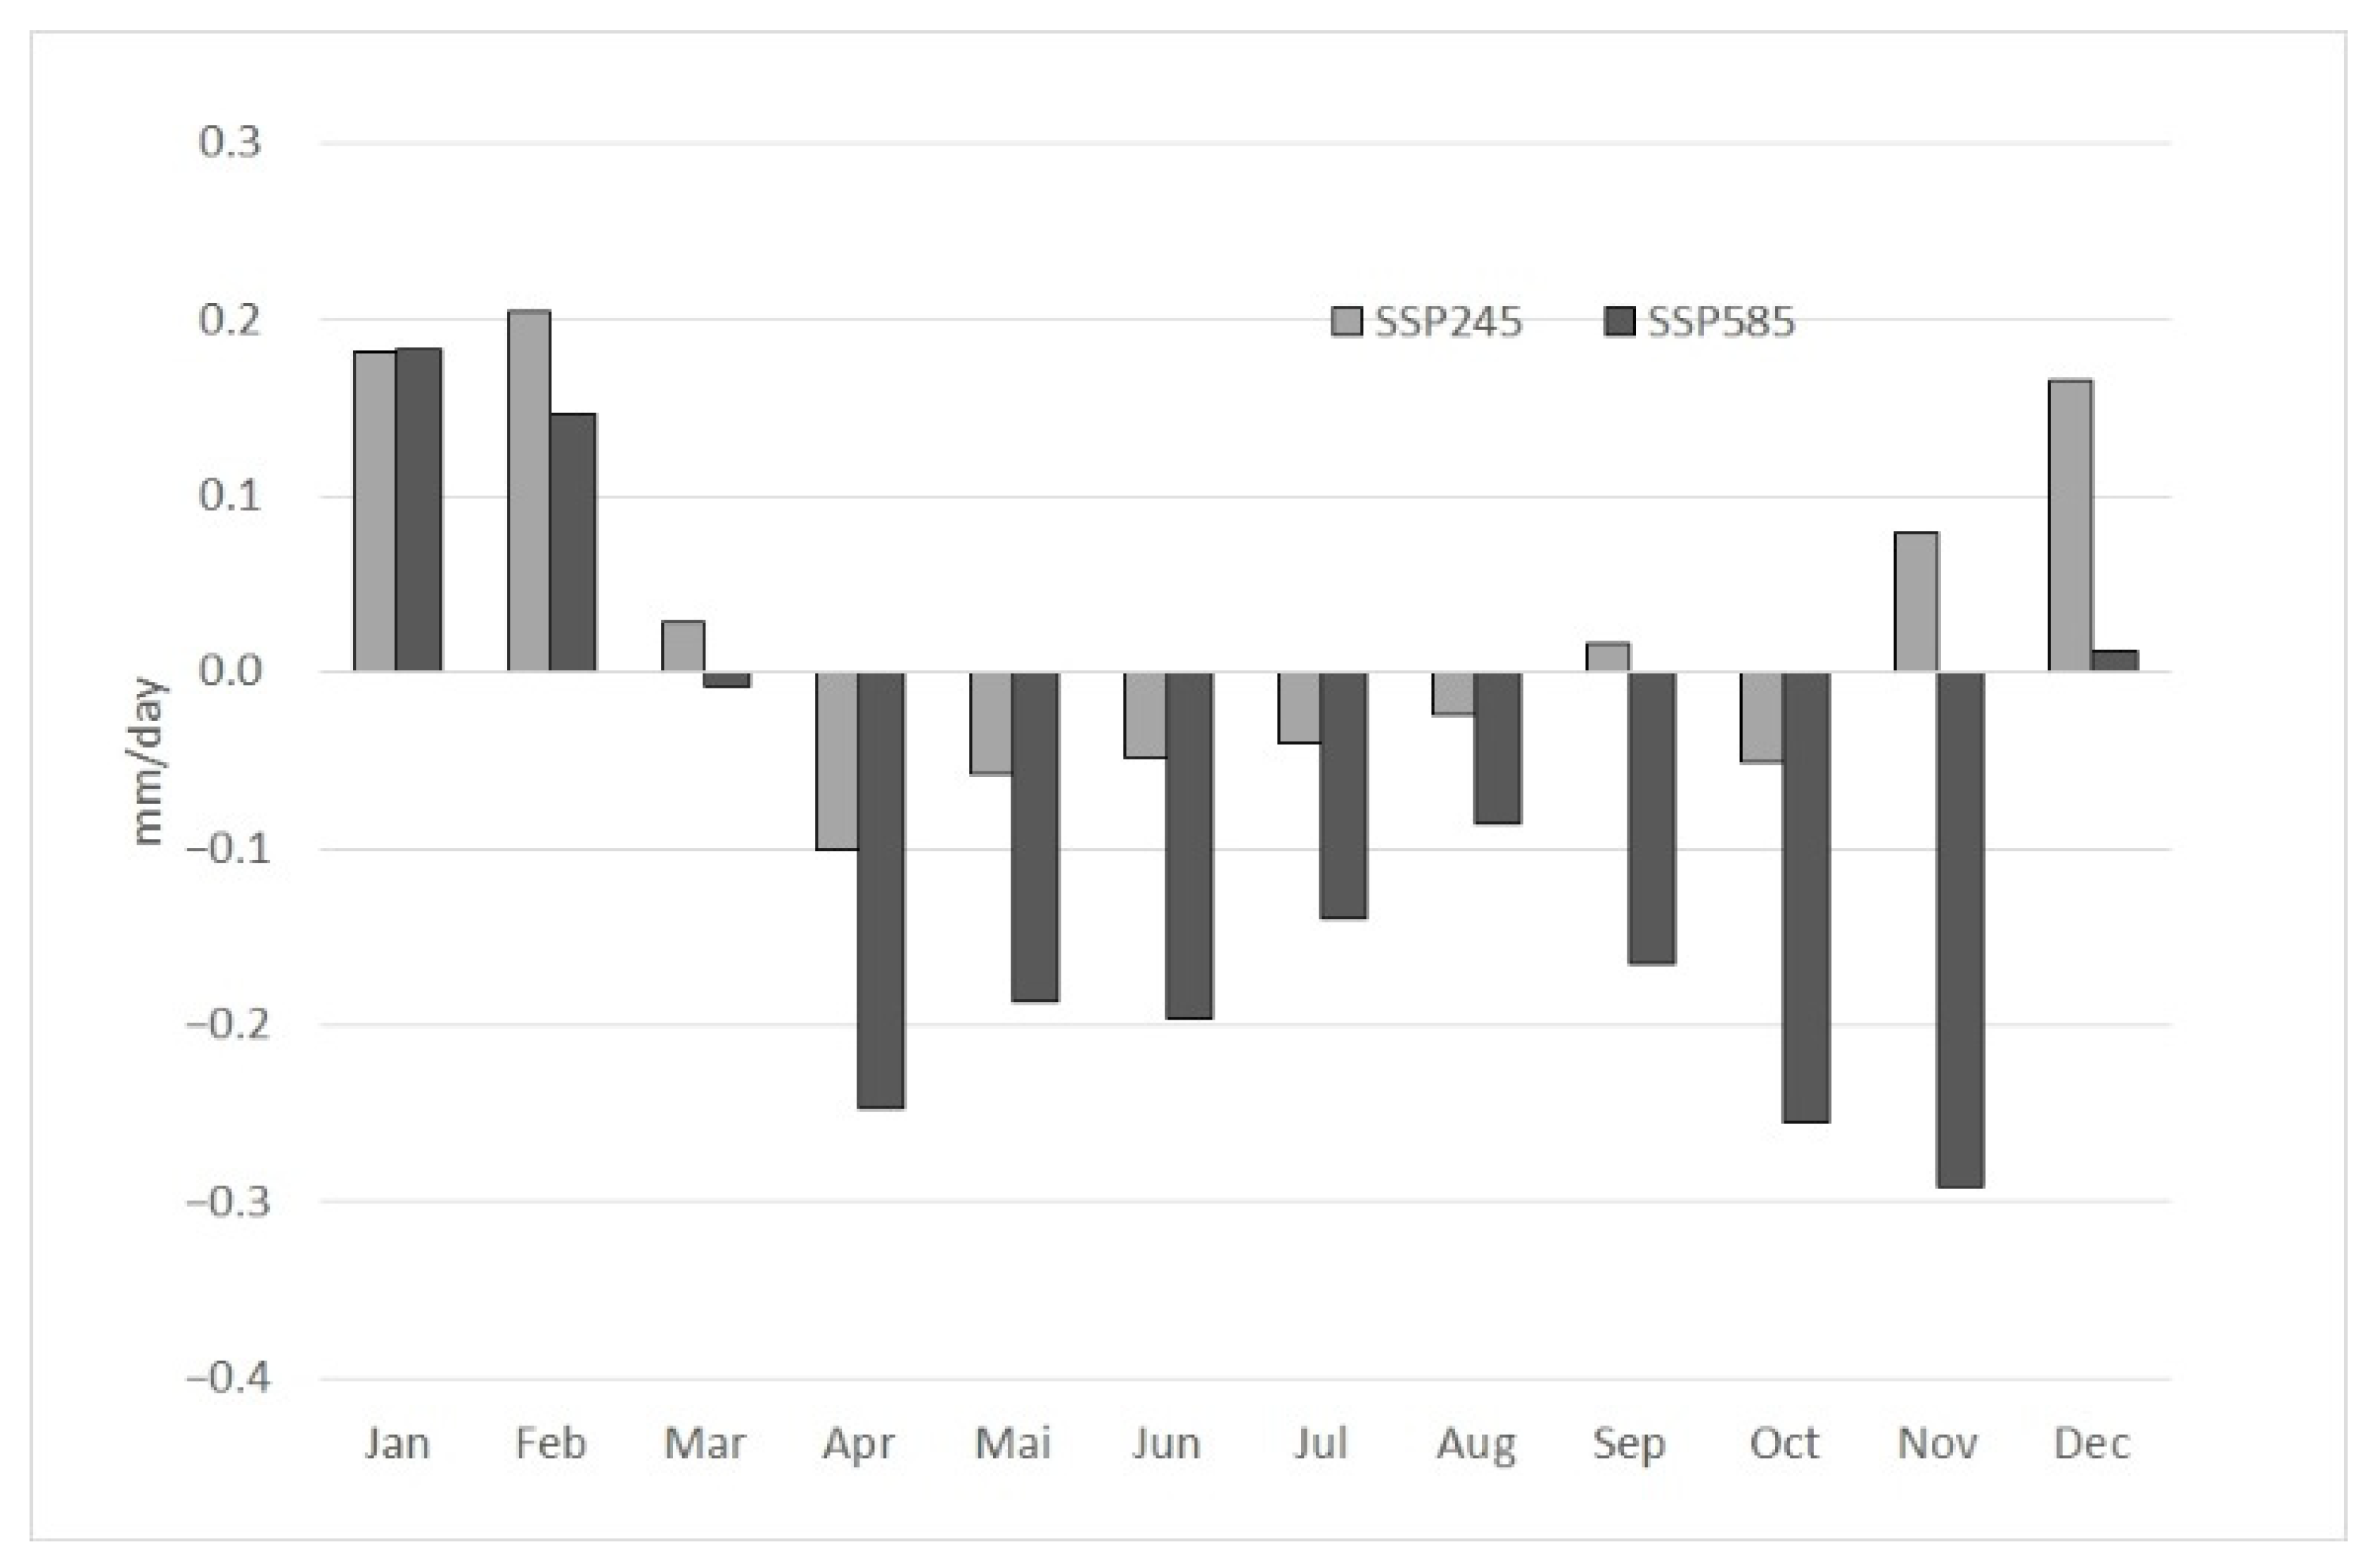
Regarding the evolution of precipitation changes along the year, the graph in
Figure 7 presents the changes in average monthly precipitation amounts projected for the end of the XXI century (2071–2100) relative to the recent past (1991–2020) for scenarios SSP2 4.5 and SSP5 8.5. It can be seen that for the months of December, January and August there is clearly an increase in precipitation in both scenarios while for the months of April to August and in October there is a decrease. For the month of November, the decrease in the SSP5 8.5 scenario is clear, as well as the increase in the month of November for SSP2 4.5. These results reveal, on the one hand, a reduction in precipitation from late spring to autumn, and on the other, an increase in winter precipitation, accentuating the seasonal differences. These differences are obviously greater for the SSP5 8.5 scenario by about 0.47 mm/day.
It is pertinent to remember at this point that the projections used in this work correspond to spatial scales larger than the scale of the Azorean islands and, in this context, should be interpreted with some caution.
Hydropower
Hydropower generation in the Azores currently represents an alternative RE source, along with wind energy, in most of the islands of the Azores. Precipitation is not the only factor to consider for the evaluation of the impact on water resources and more specifically its energy component; however, the RAA does not have surface water reservoirs for the storage of precipitation water in the form of potential energy for electricity production. The production of hydric energy relies only on water from springs and streams whose flow depends heavily on the precipitation that occurs at any given time. In these conditions, the hydric energy depends a lot on the regularity of the precipitation throughout the year. The results of the projections presented above point to a worsening of hydropower availability during some months of the year that may be accentuated in periods of absence of precipitation. For example, according to the SSP5 8.5 scenario, dry spells are estimated to increase by 4.8 days/year by the end of 2100 [
39].
4.3. Solar Radiation
Although the solar radiation directly absorbed by the atmosphere during a year is only about 20% of the total that falls on its top, about 50% is absorbed by the Earth’s surface. Clouds play a critical role in this balance because they reflect about 20 to 30% of this radiation into space. As in the case of precipitation, the effects of global warming on the amount and distribution of cloudiness and consequently on solar radiation at the surface are not evident.
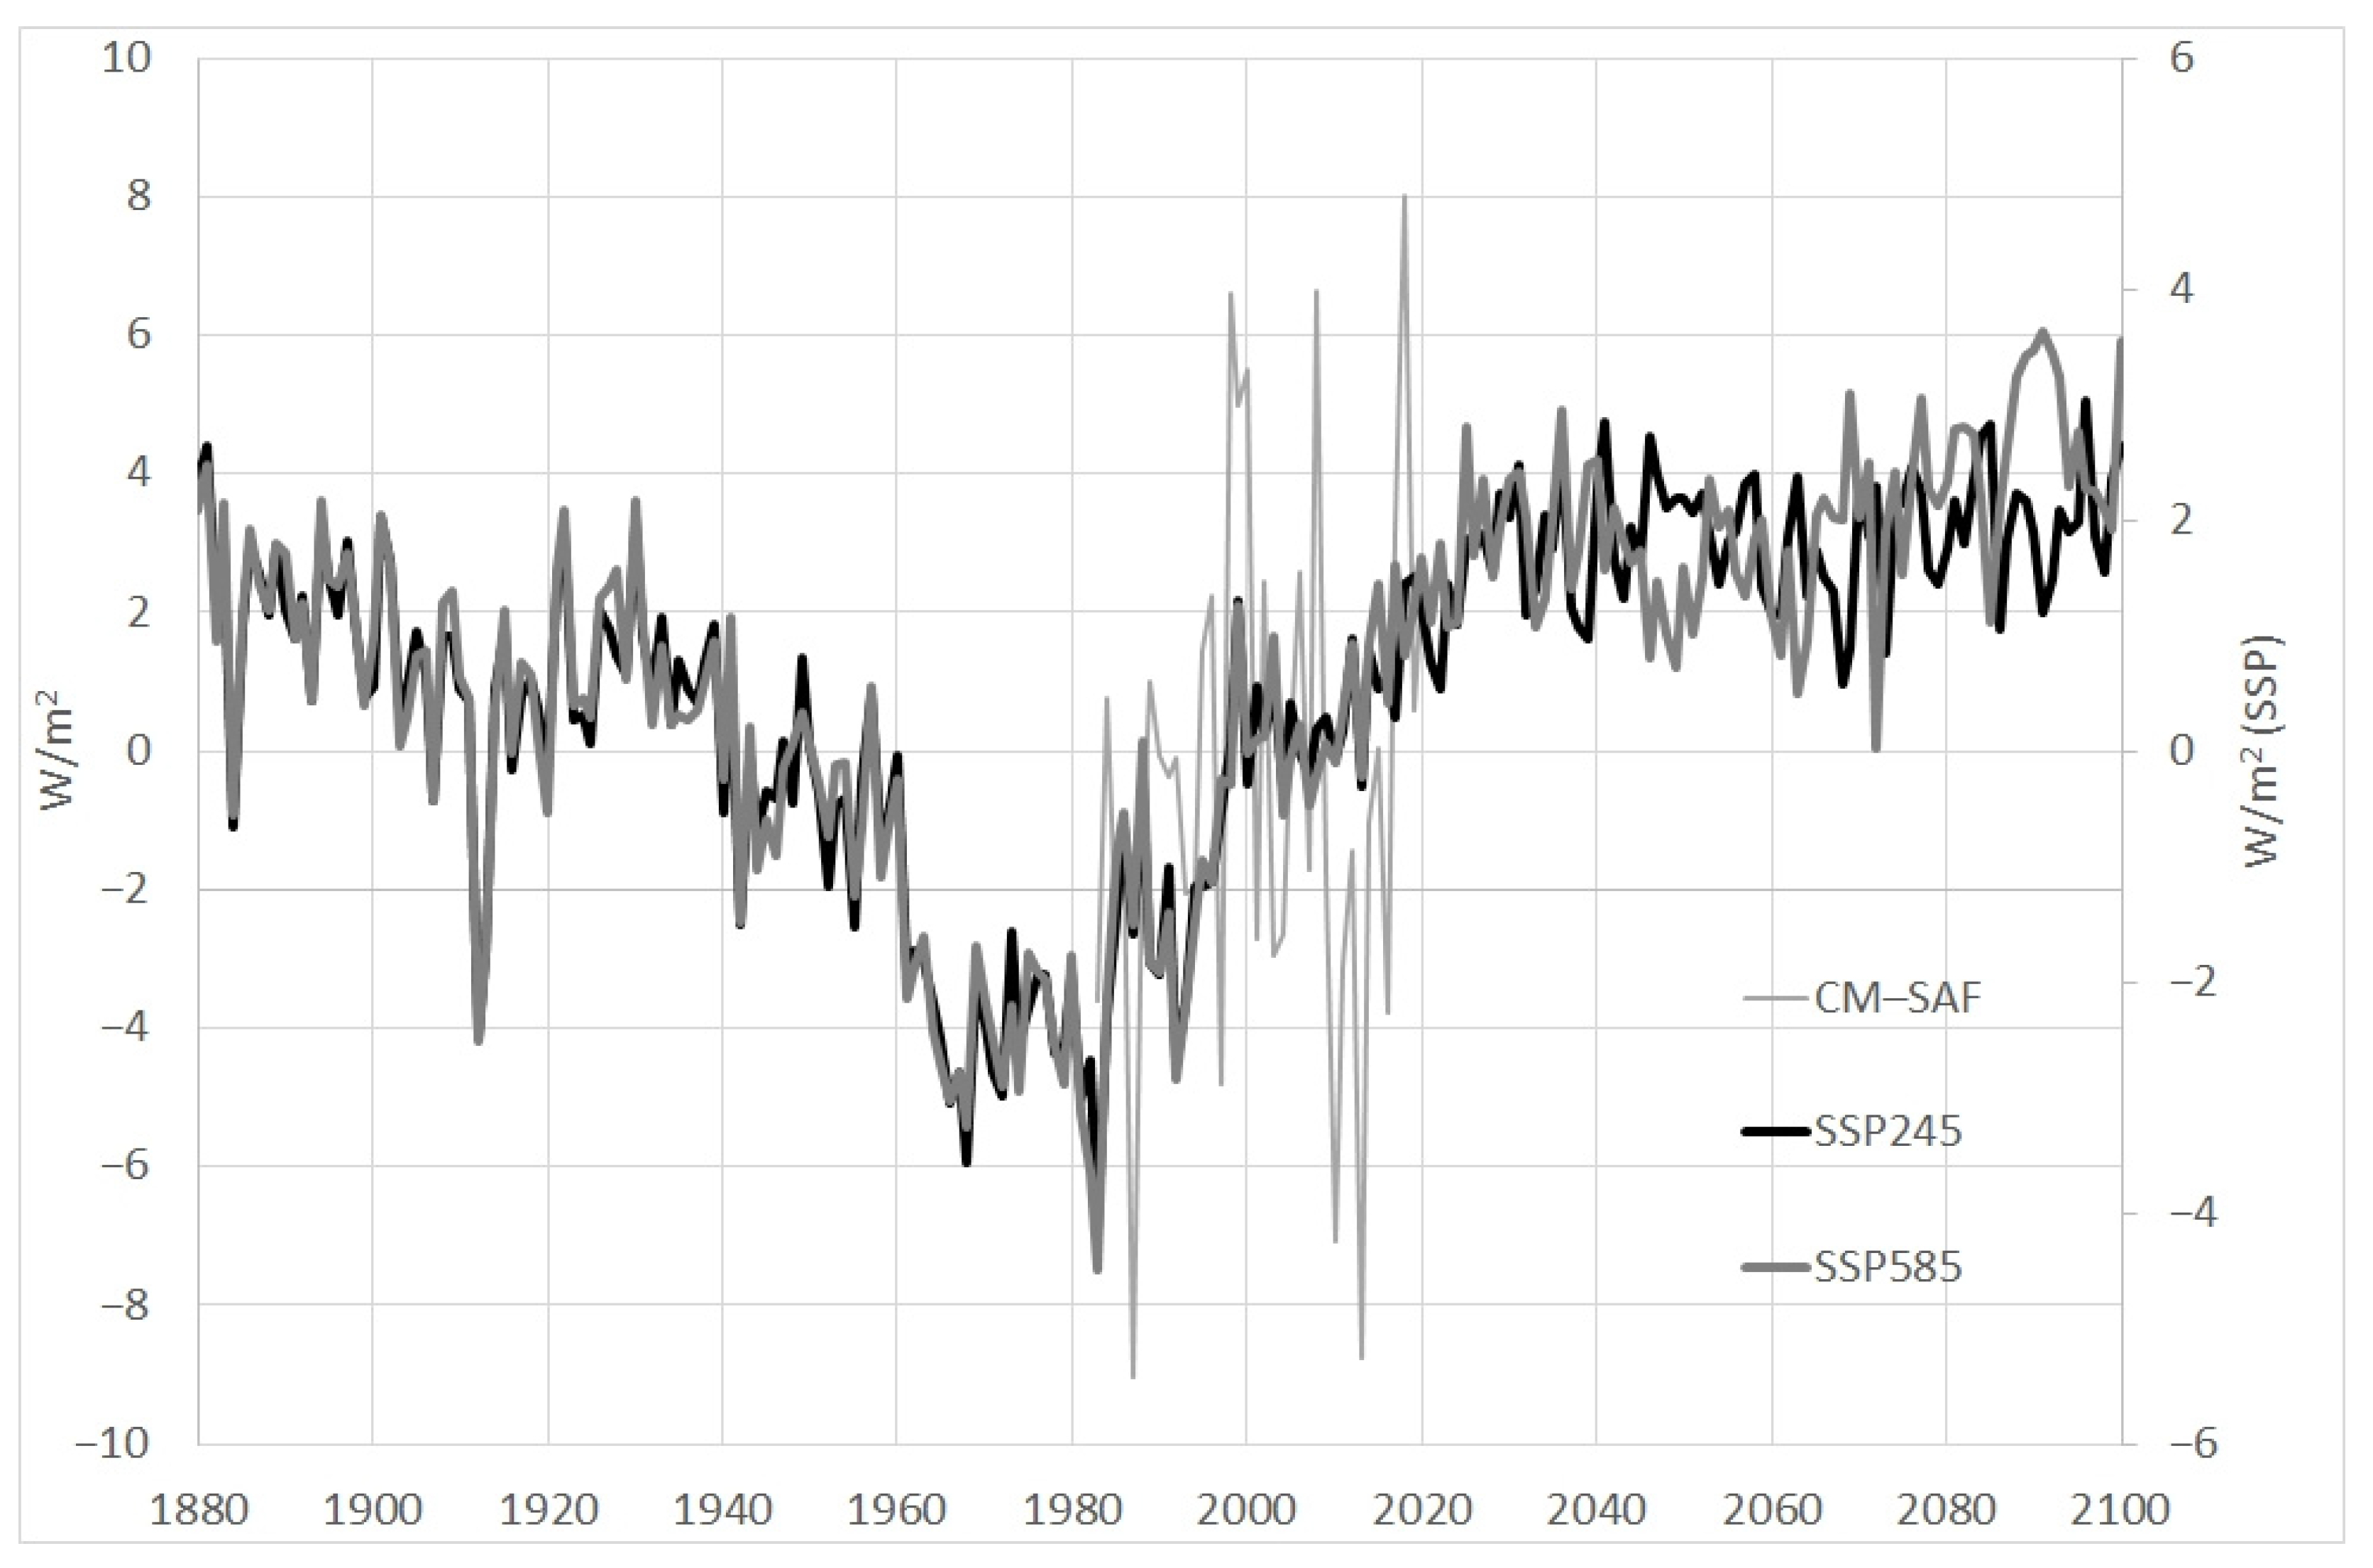
Figure 8 shows the annual anomalies of solar irradiance at the surface for the period 1981–2010 estimated for the Azores region since 1980 by the Climate Monitoring-Satellite Application Facility (CM-SAF) of the European Organization for the Exploitation of Meteorological Satellites (EUMETSAT), as well as the projections for the RCP 4.5 and RCP 8.5 scenarios up to 2100 for the same study area.
The available time series is about 40 years old and shows a small positive trend, but not statistically significant. However, the projections in both scenarios seem to confirm the existence of a positive trend during this period, which is maintained until the middle of this century, and then slows down until the end of the century; this suggests that this increase results from a decrease in large-scale cloudiness associated with synoptic scale systems, thus confirming the trend of decreasing precipitation discussed above. Climate projections point to an increase until the end of this century of 2.0 ± 0.5 Wm
−2 and 2.5 ± 0.8 Wm
−2 for the SSP2 4.5 and SSP5 8.5 scenarios, respectively, relative to the 1961–1991 reference period.
Figure 9 presents the relative difference between the annual mean surface irradiance fields for the North Atlantic region at the end of the 21st century (2071–2100) and in the recent past (1991–2020) for the SSP5 8.5 scenario. These projections show an increase in global annual mean irradiance up to 2 Wm
−2, which covers an extensive area of the subtropical North Atlantic and may be related to the expansion of the subtropical anticyclone to more northern latitudes.
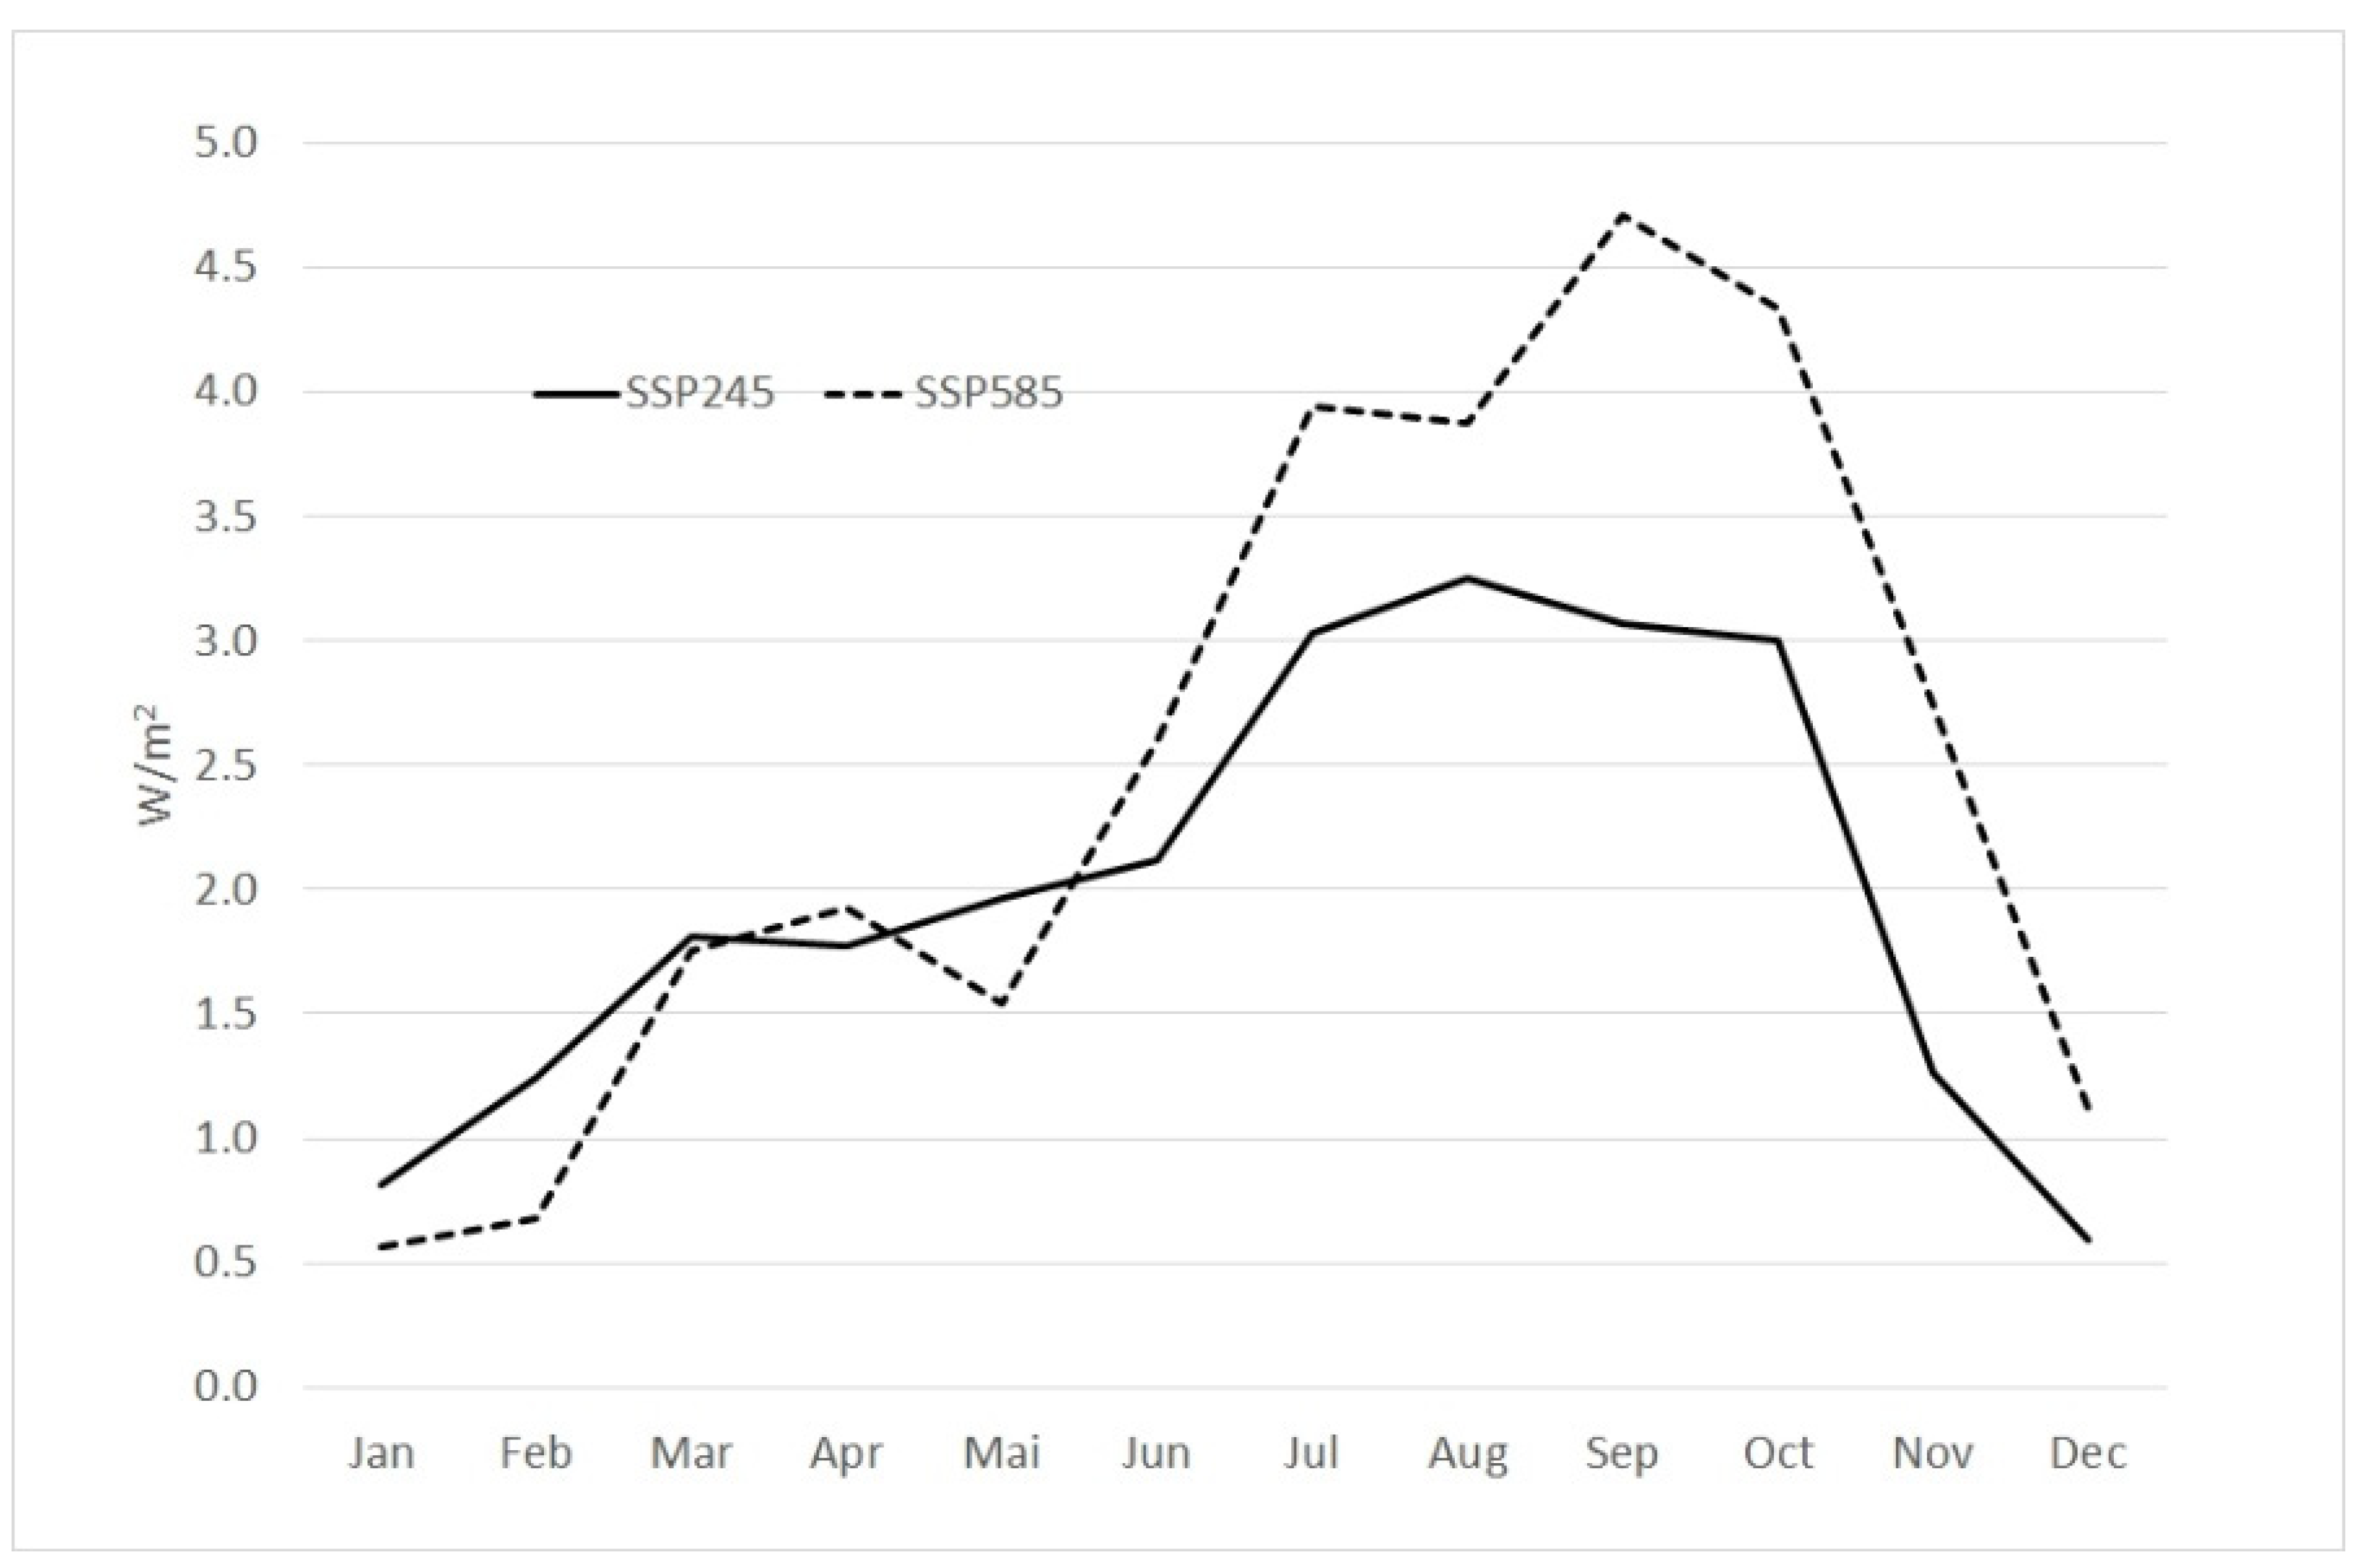
With respect to the changes in solar irradiance throughout the year,
Figure 10 presents the projected changes in monthly average solar irradiance at the surface in the period 2071–2100 for scenarios SSP2 4.5 and SSP5 8.5 relative to the period 1991–2020. The results obtained show an increase in irradiance throughout the year for both scenarios, with a maximum in the months of August (SSP2 4.5) and September (SSP5 8.5). This increase is only 3 to 4 Wm
−2 but indicates a clear large-scale signal, possibly related to the increase in particulate pollution resulting from the resumption of industrial activity following the Second World War [
40].
Solar Energy
The use of solar energy in the Azores Islands has been somewhat incipient and is limited, in most cases, to domestic production and consumption, especially with small thermal panels and very few photovoltaic installations. The high cost of photovoltaic installations in the face of the predominance and, at times, the persistence of cloudiness of orographic origin, has been a demotivating factor for the widespread implementation of this type of RE. However, although climate projections may be unfavorable for the exploitation of other types of RE (geothermal, hydro and wind) they may not be so unfavorable in the case of solar energy, where an increase of up to 2% per year is estimated and may be up to 7% in the month of August.
4.4. Wind
Global warming has as a direct consequence the weakening of the thermal gradient between the poles and the equator and may therefore change the global circulation patterns. The Fifth Assessment Report, AR6 of the Intergovernmental Panel on Climate Change (IPCC) is, however, scarce in analyses regarding wind and especially for oceanic regions such as the Azores.
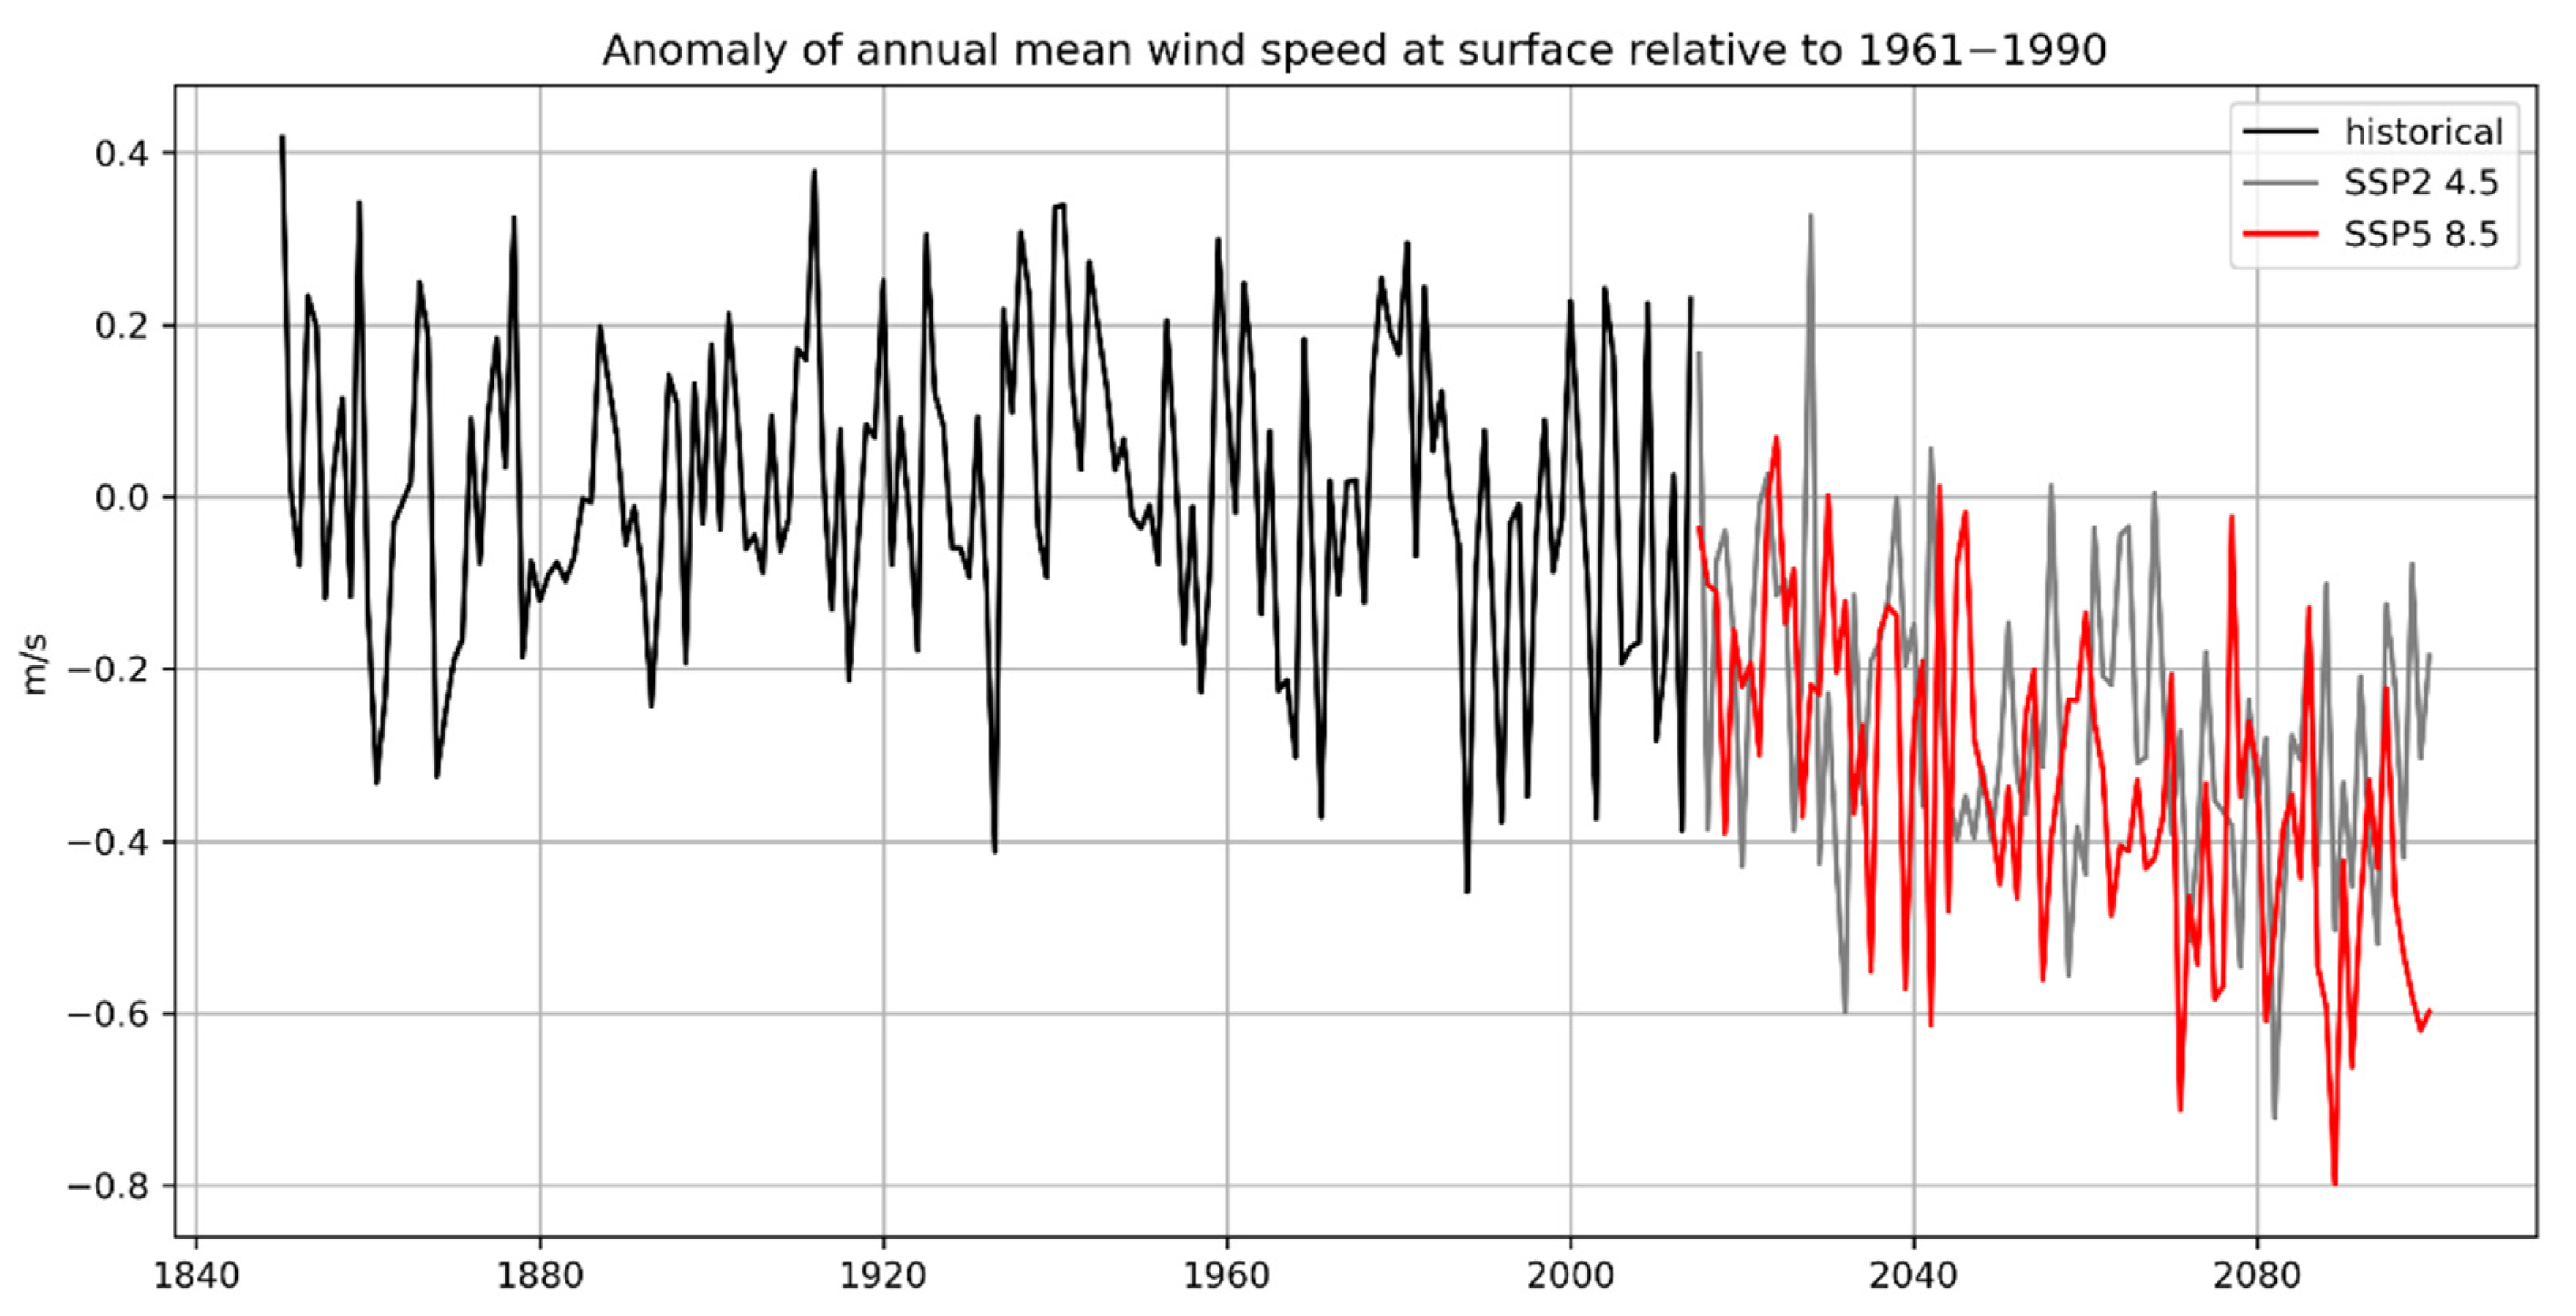
Figure 11 shows the time series of surface wind speed anomalies (10 m from the surface), for the period 1961–1990, from 1850 to 2014 and projected until 2100 by a set of three CMIP6 models: NorESM2-MM (NCC, Norway), ACCESS-CM2 (CSIRO-ARCCSS, Australia), GFDL-ESM4 (NOAA-GFDL, Princeton, NJ, USA). These projections show a negative trend until the end of the century, slightly more accentuated in the SSP5 8.5 scenario. Results from other studies based on CMPI5 also show a decrease until the end of the 21st century, probably due to the northward retreat of the jet stream and the consequent decrease in the westerly wind component [
41]. The projections obtained with the three models mentioned present an almost identical decrease by the end of the century for the two scenarios of 0.5 ± 0.1 m/s.
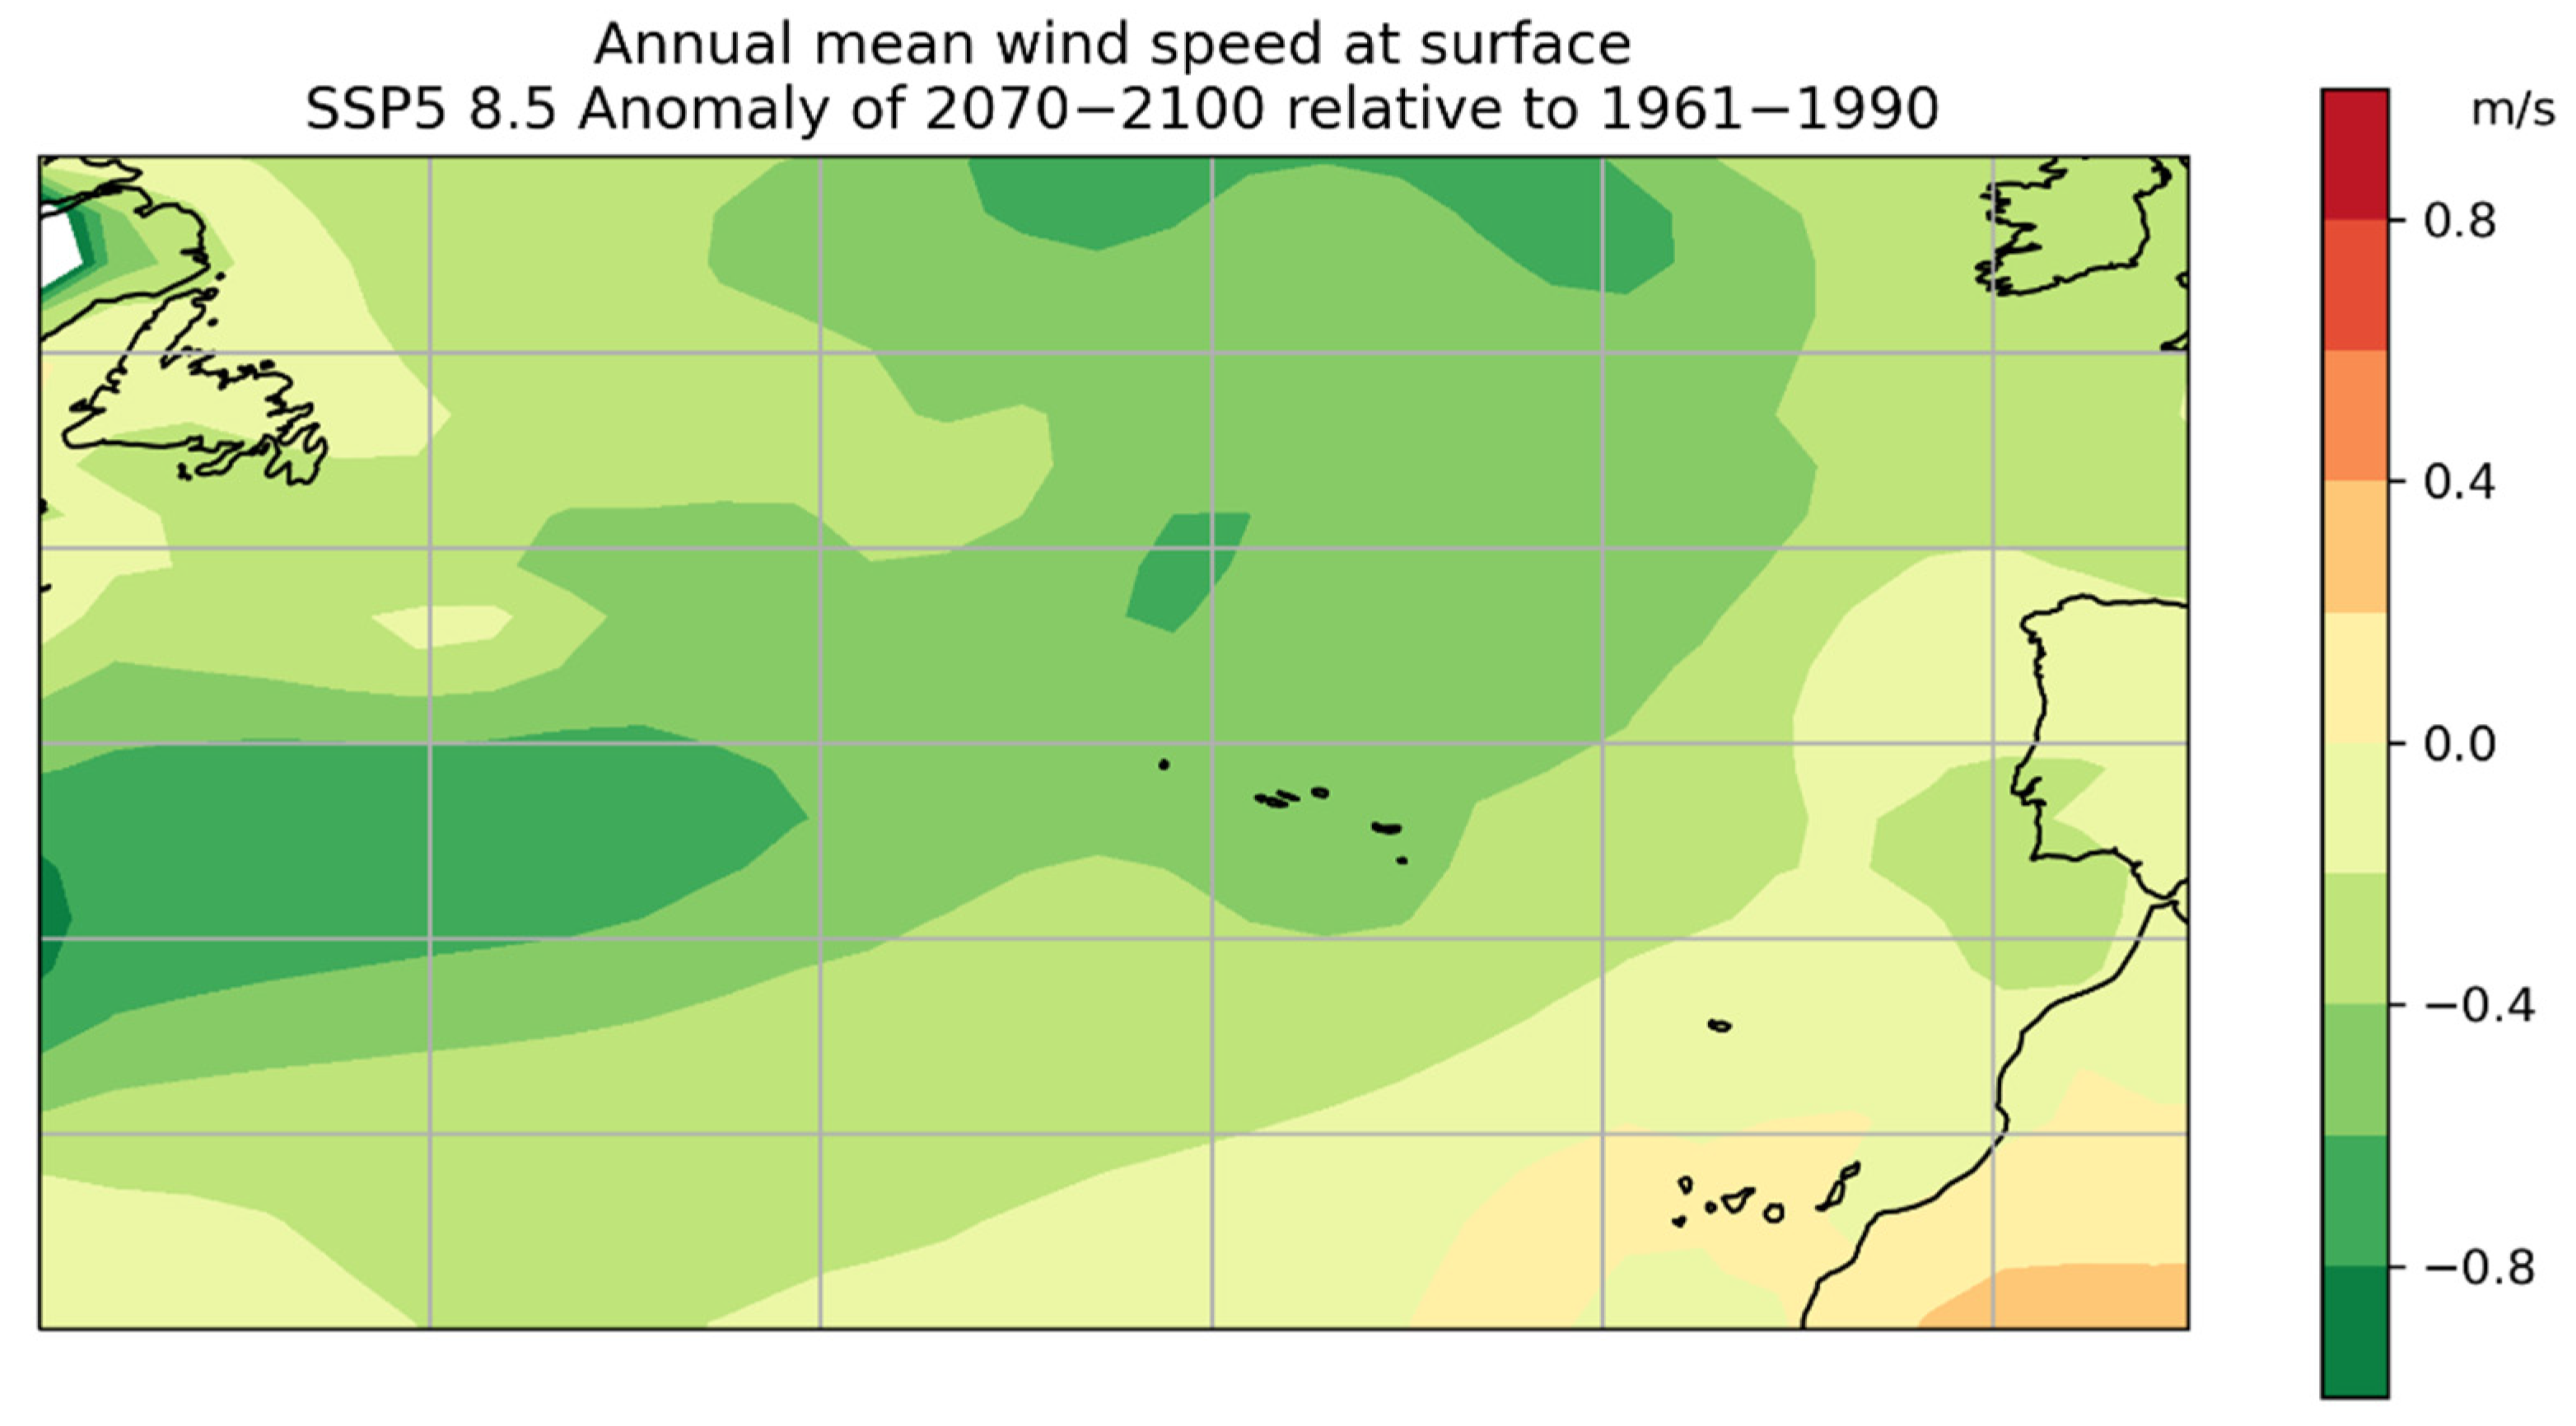
Figure 12 presents the relative differences in surface wind speed projected for 2071–2100 for the SSP5 8.5 scenario relative to the 1961–1990 period for the North Atlantic region. The projected differences for the Azores region are negative and vary between −0.4 to −0.5 ms
−1.
The CMIP6 climate projections show different variations throughout the year for the two SSP scenarios (
Figure 13). Both scenarios present negative variations from May to October and positive variations in the remaining months of the year. The decrease presented during the “warm” months is greater than the decrease in the remaining months, resulting in the negative annual balance referred to above. These results indicate a possible change in the pattern of wind energy available throughout the year. These results suggest that this decrease is related to a small change in the pattern of the general circulation towards the northward displacement of the jet stream and consequently the trajectories of the Polar Front.
Wind Energy
Wind energy has presented an interesting degree of implementation in the RAA, being currently one of the most important RE sources for electricity production. However, its profitability is highly dependent on the regularity of the wind. Although the increase in the average annual wind speed over the last 70 years may be positive for the exploitation of this type of energy, climate projections point to a decrease in wind energy density in the order of 15% by the end of the century and in some months, it may be of the order of 75%.
5. Discussions
The results show that long-term changes in climate essential variables must have significant impacts on natural resources and, therefore, on the sustainability of RE. A Strengths–Weaknesses–Opportunities–Threats (SWOT) analysis was performed to assess the best strategy to face the impact of CC on energy. SWOT analysis is a straightforward, popular and well-known technique, that implies that an organization’s resources (which constitute its strengths and weaknesses) should match the demands and pressures from its external environment (manifested as a set of opportunities and threats) as effectively as possible and, with change, stay matched in dynamic and turbulent times [
42]. Several authors have used this approach for similar studies [
43,
44] to evaluate the current situation and future prospects by simultaneously considering internal and external factors [
45].
Table 1 shows the internal factors identified as strengths and weaknesses as well as external factors identified as opportunities and threats. A quantitative approach was used to identify the more critical factors, depending on the scores results [
44]. Each score is computed from the product of the relative importance and the rating for each internal factor and the probability for each external one. Importance (Imp.), rating (Rat.) and probability (Prob.) values were attributed subjectively, based on the results of the energy demand and variable trends referred to in
Section 3. The SWOT analysis shows that temperature positive trend is the more important external factor, threatening thermal and geothermal energy production. On the other hand, the solar energy increases and the photovoltaic (PV) energy cost decreases are external opportunities that can offset this threat. However, the sum of the threats scores is larger than the opportunities, but the strengths are greater than the weaknesses. In summary, we can conclude that the current position of the RE vs CC in the Azores is positive (strengths > weaknesses), but the perspective is not (threats > opportunities), and therefore, the sustainability of the system must be improved toward a strong investment in solar energy production.
The prioritization of importance, ratings and probabilities, as well as the identification of the main factors, are subjective and therefore, can lead to different results. However, in this case, the results seem to be logical and coincide with the expected strategy towards a sustainable adaptation to CC.
6. Conclusions
In summary, the impacts of CC on the production and consumption of thermal and geothermal energy are frankly negative for the Autonomous Region of the Azores. In relation to hydropower, the results of the projections presented above point to a worsening of the availability of this type of energy during some months of the year. Climate projections are favorable for the case of solar energy, where an annual increase of 2% is estimated. However, climate projections point to a decrease in wind energy density of around 15% by the end of the century. Except for solar energy, the results for the Azores region show a negative impact of CC on the production and consumption of RE.
SWOT analysis showed that the current position of the RE vs CC in the Azores is positive, but the perspective is not, and therefore, the sustainability of the system must be improved toward a strong investment in solar energy production.
The results suggest the relevance of adjustments in public policies for energy transition and the decarbonization of island economies, considering medium-/long-term horizons, regarding electricity supply alternatives from endogenous renewable sources. From a geographical perspective, it is important to consider this issue in the outermost regions of the European Union and in the Macaronesian archipelagos. The expected developments of climate simulation models, the robustness of algorithms and the parameterization of input data, will dictate the spatial and temporal refinement of climate trajectories. In this field of scientific research, the Azores are laboratories for testing representative and precursor experiences with the potential for replication for other geographical realities with similar challenges and constraints.
Directions for Further Research
Although the results of this work are representative of a geographic area of the northeast Atlantic are very restricted, the authors recognize that, even so, it is relatively large compared to the scale of the Azores islands, so there may be significant differences at a smaller scale due to the importance of local effects (orography, slope exposure, etc.) in relation to those of large scale. In this sense, it will be interesting to the application of dynamic downscaling, using limited area models (LAM) for each island, and the results of CMIP6 models as boundary conditions.
On the other hand, the complete sustainability evaluation needs a deeper analysis that considers the viability of several existing and future technologies, including energy transport and storage, which in the case of the Azores islands may be a relevant factor.


 ,
, 


