1. Introduction
Tourism, with today’s characteristics, began around 1950, shortly after the end of the Second World War. The United Nations World Tourism Organization (UNWTO) estimates that in 1950 there were approximately 25 million international tourist arrivals. In 2019, 69 years later, this number had increased to almost 1.5 thousand million international arrivals. The steep growth observed in tourism numbers, especially in the last decades, has been a direct consequence of substantial improvements in domestic economies and, therefore, in people’s financial conditions in general. More recently, the emergence of low-cost airlines has also played an important role in the growth of tourism worldwide by providing cheaper travel and generating more competition between airlines. However, the COVID-19 pandemic caused a decrease in tourism activity, and in some cases, even a total stop, because most governments had to adopt drastic measures to control and lower the infection rate in their countries. One of the measures adopted involved major travel restrictions within borders and abroad. According to UNWTO ([
1]), only 406 million international arrivals were observed in the year 2020, representing a 72.3% drop compared to pre-pandemic 2019. Since tourism involves some form of travel (domestic or international), any measure taken to restrict people’s mobility will necessarily have a negative economic impact on the tourism sector and on other sectors that may depend on tourism activity to some degree. The World Travel & Tourism Council (WTTC) reports that, prior to the COVID-19 pandemic, travel and tourism were responsible for 1 in 4 of all new jobs created across the world ([
2]). In 2019, the travel and tourism sectors accounted for 10.6% of all jobs (334 million) and 10.4% of the global Gross Domestic Product (GDP). Moreover, WTTC estimates that in 2020, the year marked by the pandemic, 62 million jobs were lost in these sectors worldwide, corresponding to a 18.5% decrease compared to 2019, while their share of global GDP dropped to 5.5%.
In Portugal, the tourism sector has played an important role in its economy, but even more so from 2010 onward ([
3,
4]). Although Portugal has not been on the list of the top ten most visited countries in the world, it has been strongly consolidating its position in the international tourism scene in recent years. In 2019, Portugal was considered by the World Economic Forum the twelfth most competitive tourist destination among 140 countries ([
5]). In the same year, Portugal was distinguished by the World Travel Awards as the Best Destination in the World and the Best European Destination (Europe edition) for the third consecutive year and awarded other distinctions too. An overview of Portugal as a tourist destination between 1965 and 2016 is given in [
3]. On the other hand, Statistics Portugal (INE–“Instituto Nacional de Estatística”), which is responsible for disclosing official statistics, estimates that in 2019, the number of non-resident tourists arriving at the country reached 24.6 million, a 7.9% growth compared to 2018 ([
6,
7]). In INE’s tourism statistics report for 2020 ([
8]), this number is estimated to have reached only 6.5 million, representing a 73.7% drop compared to 2019. Moreover, INE’s tourism satellite account report ([
9]) indicates that the tourism sector’s contribution to Portugal’s GDP was 15.4% in 2019 (a 7.6% growth compared to 2018), which dropped to 8.4% in 2020. Furthermore, in the first quarter of 2020, the tourism sector in Portugal directly employed 323,000 people in the accommodation, restaurant and similar sectors (indirectly, 834,000), which dropped to 282,000 in the fourth quarter of 2020, thus representing a 12.7% decrease compared to the first quarter of the year ([
10]). As for provisional pandemic impact assessments, e.g., in [
4], the authors forecast that once total recovery of the tourism sector occurs from the pandemic, Portugal may have accumulated losses of 60,000 million euros in GDP and eliminated almost 600,000 jobs related to the sector. It is also forecasted in [
4] that the full recovery of the sector may take some years, with pre-pandemic levels not being observed before 2023.
In the last few years, the Azores, a Portuguese archipelago of nine islands located in the middle of the Atlantic Ocean, has become a popular tourist destination. One important explanation for this new status was the coming of low-cost airlines to the archipelago for the first time in March 2015, following the airspace liberalization granted by the Azores’ Autonomous Government. In order to respond to higher tourist demand, new hotels and local accommodation establishments, tourist animation companies and restaurants started activity in the region, therefore, creating new jobs and wealth. It is estimated that the Azores’ share of the total direct tourism contribution to Portugal’s GDP was 9% in 2019. The highest share was due to the Algarve region (28%), followed by Madeira (16%). In this national ranking, the Azores occupied third place, ahead of Lisbon (6%), which appeared in fourth position ([
4]). On the other hand, the “Serviço Regional de Estatística dos Açores” (SREA), which is a regional branch of Statistics Portugal, in its tourism statistics report for 2019 ([
11]), estimates that the number of overnight stays in the Azores was slightly over 3 million (68.9% in São Miguel Island), a 17.4% growth compared to 2018 ([
12]). In SREA’s tourism statistics report for 2020 ([
13]) this number drops to 866,221 (61.6% on São Miguel Island), corresponding to a 71.2% decrease compared to 2019. Moreover, SREA’s quarterly reports on employment figures in the Azores reveal that, in the first quarter of 2020, the number of jobs in the accommodation, restaurant and similar sectors in the region was 8864 ([
14]), which dropped to 7168 in the last quarter of 2020, thus representing a 19.1% decrease compared to the first quarter of the year ([
15]). In [
16], an overview of the importance of tourism in the economy of the Azores since the beginning of the 21st century until the COVID-19 pandemic is given.
The first lockdown in Portugal due to the COVID-19 pandemic took place between mid-March and late May of 2020, and, therefore, restrictions to mobility and to some economic activities were imposed during that period in the country. Although tourism activity resumed in the summer of 2020, after some travel restrictions were lifted by several countries around the world, this activity was quite below expectations. Therefore, Portuguese services strongly connected to tourism claim to have suffered significant adverse impacts on their profits in 2020, with the tourism accommodation and restaurant sectors among them. In order to assess the impact of the pandemic in 2020 on these two sectors of São Miguel, the biggest (area 744.6 km) and the most visited island of the Azores, two surveys were designed for this purpose. One survey was targeted at hotels and local accommodation establishments, and the other at restaurants, with bars and cafes included in this group. However, given the substantial growth in the number of local accommodation establishments over recent years on the island, and the nature of this type of accommodation, we decided to analyze this activity separately from the traditional hotel activity. Our main aim was to estimate the mean income drop, in percentage terms, for these sectors. This was accomplished by comparing the 2020 tourism high season with the homologous pre-pandemic 2019 period, where the tourism high season in the Azores is typically from June to September. The surveys were also designed so an estimate for the mean difference in occupancy rate from June to September between 2019 and 2020 could be obtained for the local accommodation and hotel sectors separately.
2. Literature Review
It is a well-known fact that the tourism sector has become one of the largest and fastest-growing economic sectors in the world, involving a multiplicity of economic activities, despite having suffered some occasional shocks over the years. According to UNWTO ([
17]), the total international tourism receipts in 2019 was 1481 billion USD, a 3% growth compared to 2018. Moreover, between 2009 and 2019, the real growth in international tourism receipts (54%) exceeded the growth in global GDP (44%). Furthermore, tourism was the world’s third-largest export category in 2019, behind fuels and chemicals and ahead of automotive products and food.
Prior to COVID-19, other tourism crises have occurred in the 21st century, financial or disease-related. One recent crisis is the financial crisis and economic downturn from 2007 through 2010, which affected the tourism industry ([
18]). On the other hand, infectious diseases outbreaks, with the potential to become pandemics, such as Severe Acute Respiratory Syndrome (SARS) in 2003, swine flu (H1N1) in 2009, Ebola in 2014 and Middle East Respiratory Syndrome (MERS) in 2015, have provoked crises in the tourism industry of the regions where the outbreaks occurred ([
19,
20]). As highlighted in [
18], crisis events of these sorts cast attention to the need for more sustainable and resilient responses from the tourism sector, since mobility and globalization, and therefore, interconnectedness, are becoming more and more important.
An extensive body of literature on tourism, exploring many of its aspects and impacts on the economy and society (positive or negative), either locally or globally, is available. Moreover, governmental and non-governmental agencies, such as national Statistics bureaus, the UNWTO and WTTC, produce regular reports and updates on important indicators for the tourism and travel sectors’ performances, which are frequently used as references by governments and the tourism industry for decision-making.
Since the very beginning of the COVID-19 pandemic, papers assessing its negative impacts on several economic sectors and countries have been published. One of the first papers was [
20], where an overview of what was happening globally in the beginning phase of the pandemic was given, as well as some initial estimates of the damage caused to the tourism economy. Several other papers focusing on the impacts on sectors known to be more drastically affected by global tourism crises, such as the hospitality industry, food services and labor market in many countries, have also become available (e.g., [
19,
21,
22,
23,
24,
25]). On the other hand, rebound and revival strategies from the pandemic have been the main focus of other works (e.g., [
26,
27,
28,
29]). In particular, Ref. [
27] analyzes the impacts of the COVID-19 pandemic during the second quarter of 2020 in European Union countries, as well as the effects of joint actions taken and public policies adopted in each country to fight the pandemic. However, as pointed out in [
30], even though the crises that affect tourism are crisis events that are of a specific duration and occur in an identifiable time and space, their impacts may be longer lasting. Therefore, the full extent of the COVID-19 pandemic impact will only start to be truly known after it is officially declared over.
With Portugal’s economy not being immune to the pandemic, the assessment of the impacts on its tourism accommodation and restaurant sectors and labor market has been the center of attention of some studies and reports. For example, in [
4], forecasts are made for when the total recovery of the Portuguese tourism sector may occur based on some initial estimates (most likely in 2023). In [
31], the evolution and impact of COVID-19 on tourism and travel sectors are reported, where a regional comparative analysis is performed using some indicators (e.g., number of guests, overnight stays). It is reported that the two Portuguese Autonomous Regions of Madeira and the Azores are the regions that experienced the most significant decrease in performance indicators, but even more so in the Azores. As for impacts on the labor market, e.g., [
32,
33] have similar findings in the sense that more populated and tourist regions are more affected, with the most vulnerable workers to COVID-19 unemployment being apparently the older, less educated and qualified, women and young people. As for impacts on the hospitality industry, e.g., [
34] present the perceptions of a focus group of experts, where assessments were made on economic, financial, organizational, operational and technological areas and hope for the future of tourism. However, one limitation of this last study is the small size of the focus group (six experts), which is pointed out by the authors. On the other hand, the findings in [
35] show that, after the first phase of the pandemic, there was a slight recovery of some tourism activity indicators, mainly in more consolidated tourist destinations, such as Algarve and Madeira. The low-density territories (Alentejo and Central Portugal) suffered a less severe impact on tourism demand, with domestic tourism being able to mitigate some negative effects. As expected, adverse impacts are the common denominator throughout all studies’ findings, regardless of region or country.
Some studies that we have encountered for Portugal are primarily focused on the impact perceived, in a qualitative manner, by mainland Portugal’s entrepreneurs, with very little attention being given to the Azores case when considered. For example, in [
36], the pandemic’s impact on the restaurant business in Portugal was assessed through a qualitative approach, but only 2% of the food services establishments in the sample are from the Azores. However, the authors’ findings are the existence of common concerns to all entrepreneurs in the restaurant business for the post-pandemic period, namely about measures and strategies to be implemented by the government in order to deal with future similar crises. To the best of our knowledge, Ref. [
37] is the only study that deals exclusively with the Azores situation, where an attempt is made to identify and assess the consequences of COVID-19 in the selection of accommodation by tourists in the Azores through the analysis of public perceptions.
During the first lockdown, the Azores’ Autonomous Government imposed very strict confinement rules on incomers to the islands. At that time, it was mandatory that travelers arriving at the Azores quarantine for 14 days at a hotel or at home (when residents) before being allowed to move around freely. These more drastic measures were implemented in the Azores than in the rest of the country in order to prevent the spread of the virus throughout the archipelago, since only three islands have a hospital, which most likely drove potential tourists away after the first lockdown was lifted. Therefore, a bigger impact on the tourism accommodation and restaurant sectors of the Azores was expected. Since no study we know of attempts to measure, in a quantitative manner, the impacts of the pandemic on those sectors of the Azores, our study seeks to fill this gap. In order to accomplish this task, two questions will be answered. The main question, applied to each sector, is “How big was the income drop in 2020 tourism high season, compared to pre-pandemic 2019, in percentage terms?”. A second question, applied only to the tourism accommodation sector, is “How big was the drop in the occupancy rate during 2020 tourism high season, compared to pre-pandemic 2019?”.
3. Materials and Methods
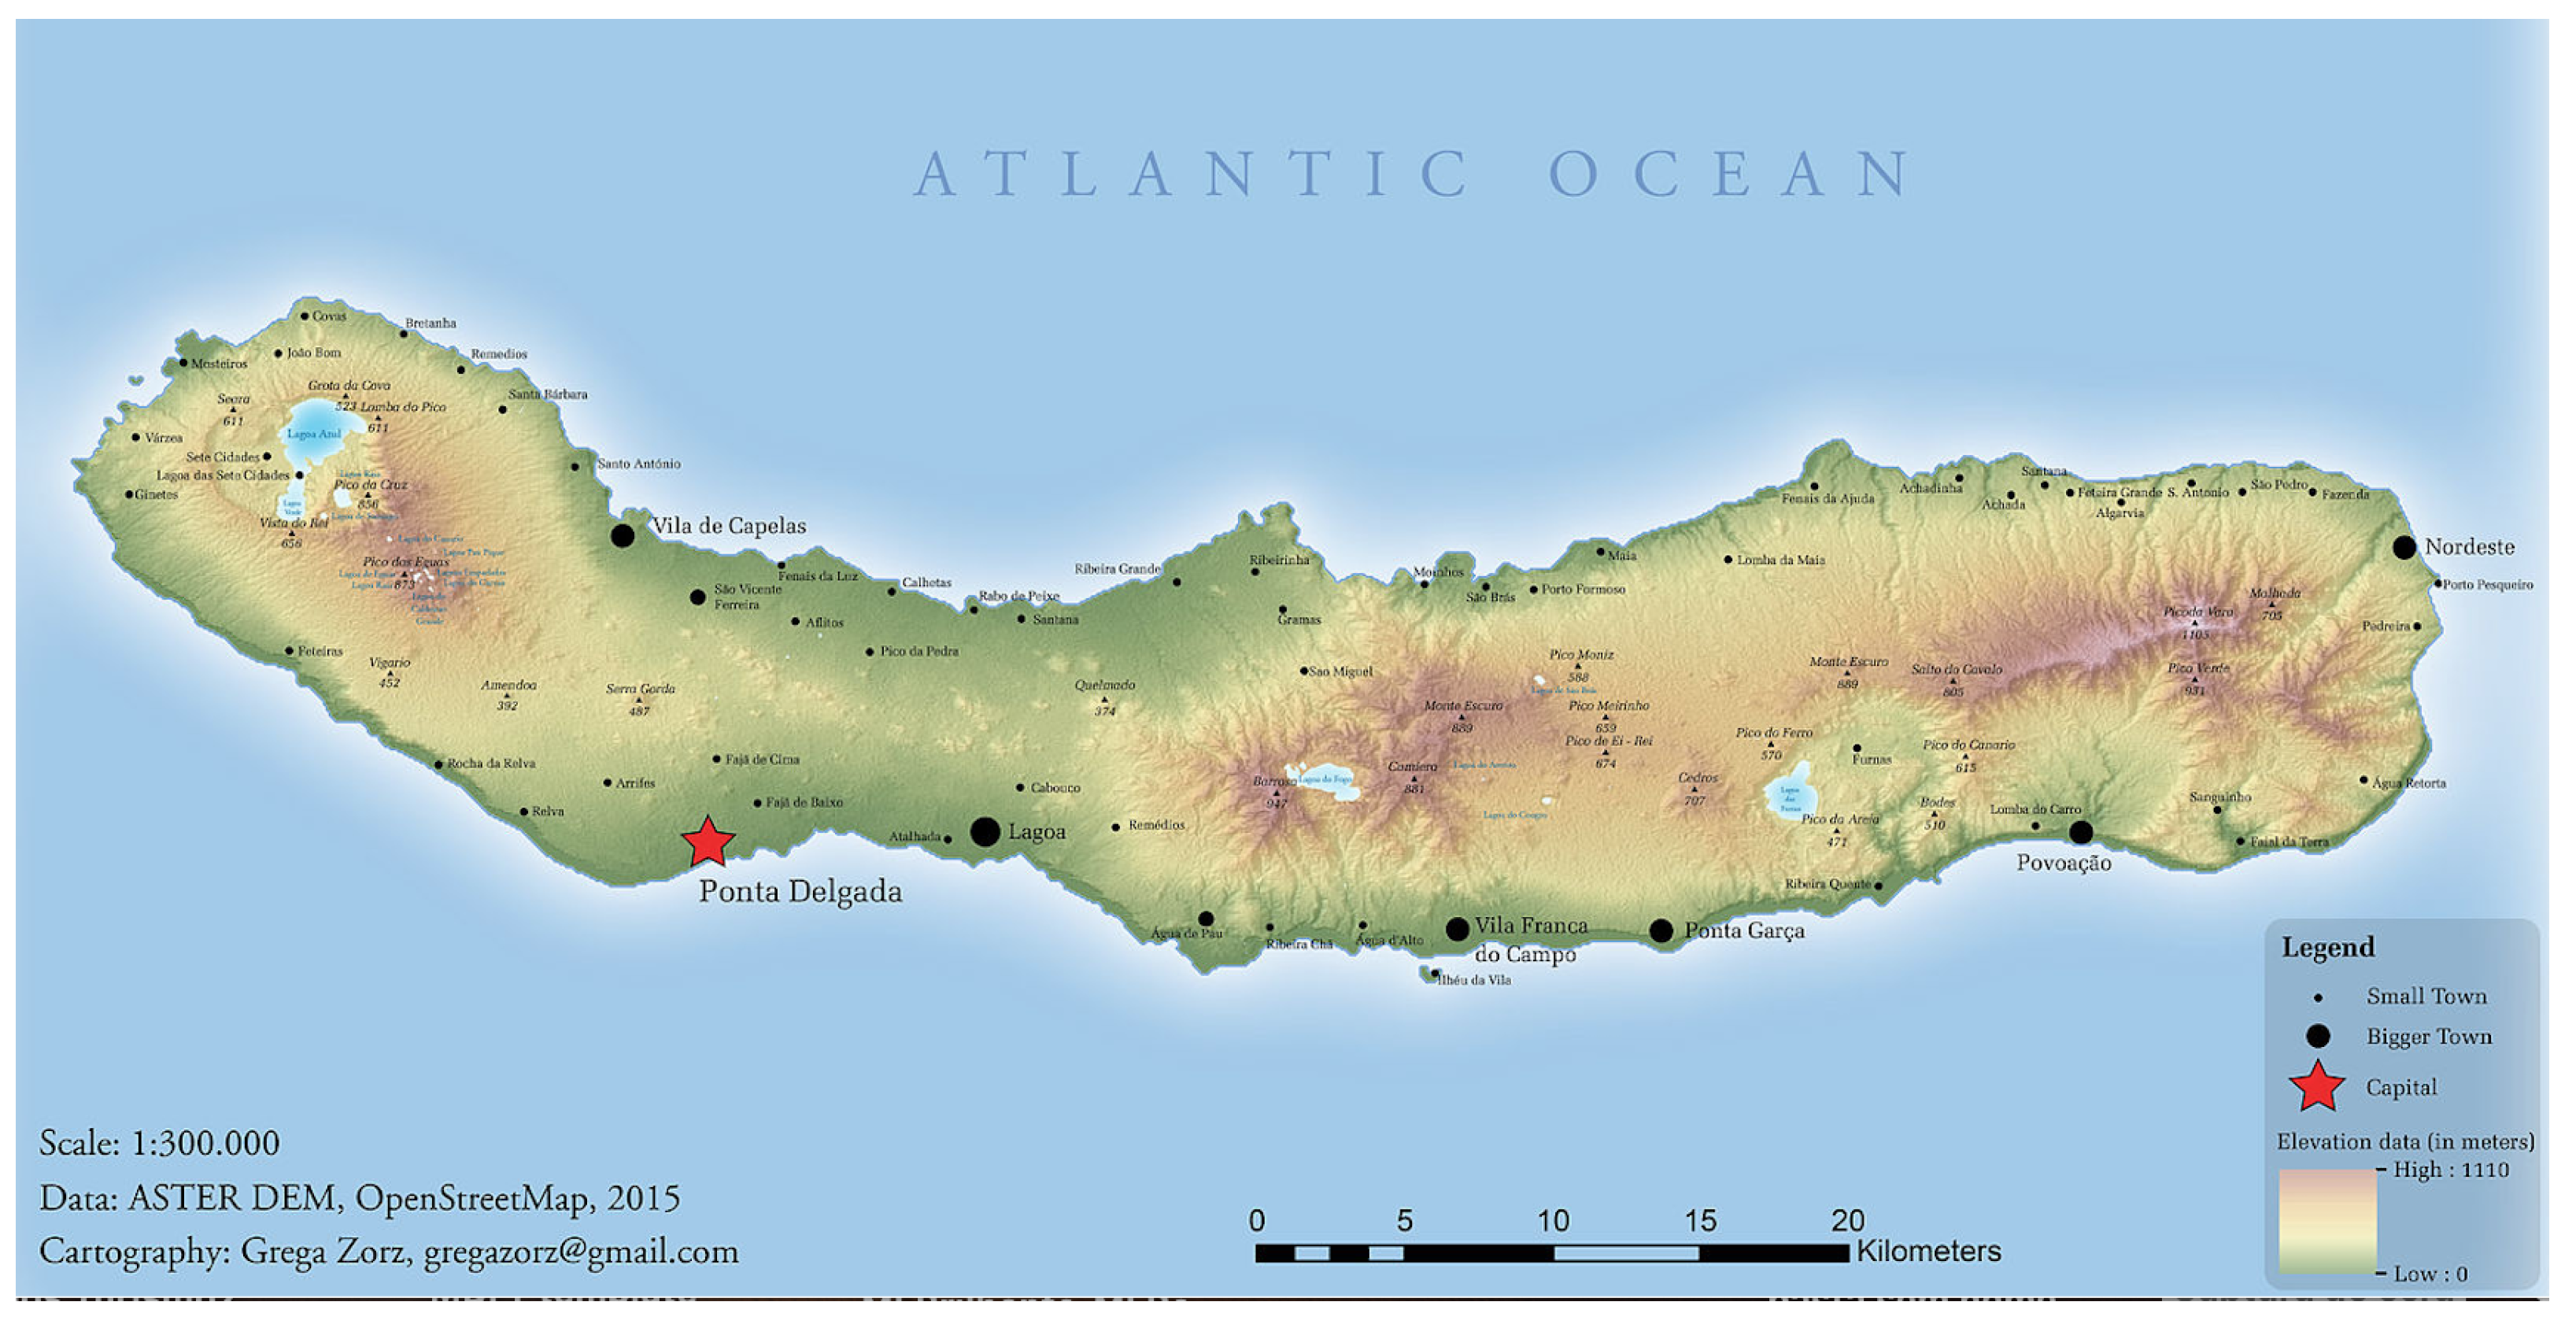
The socioeconomic reality of São Miguel Island suggests that the most appropriate survey design for our study should be based on stratified random sampling. This type of design is known to produce a smaller bound on the error of estimation than would an estimate from a simple random sample of comparable size. Moreover, it allows us to obtain separate estimates of population parameters of interest within each stratum. The criterion used to define the strata was based on the existing municipalities of the island; namely, Lagoa, Nordeste, Ponta Delgada, Povoação, Ribeira Grande and Vila Franca do Campo (hereinafter abbreviated to Vila Franca), and the overall weight that each economic activity represented on the municipalities individually prior to the pandemic. In
Figure 1, a map of São Miguel Island is shown. Aside from the main aim established for our study, the surveys were also intended to collect other information that could help portray some aspects of these sectors on the island, namely, decisions taken in order to lessen some negative effects caused by the pandemic.
Since our main aim is to estimate the mean income drop, in percentage terms, in the populations using a stratified survey design, the sample size required with a bound
B on the error of estimation was computed using the formula
where
L is the number of strata,
is the number of sampling units in stratum
i,
is the number of sampling units in the population,
is the population standard deviation for stratum
i and
is the allocation fraction associated with stratum
i (see, [
38,
39,
40]). For the allocation fractions, we used the weight proportions associated with each stratum per economic activity. Moreover, given that we had no previous information on the population standard deviations
, a rough estimate was used here, namely
, where
is the range of the observations within stratum
i.
As for the structure of the surveys itself, a set of common questions was considered for all sectors involved and a few ones specifically directed to each one. The set of common questions was intended to gather information on:
- i.
Location;
- ii.
Type of establishment;
- iii.
Number of full-time and part-time staff members;
- iv.
Did the activity stop during the pandemic (first year)?
- v.
Was temporary layoff used as a means to preserve jobs?
- vi.
Were staff members dismissed (fired)?
- vii.
Did profits in 2020 cover all activity expenses?
- viii.
Indication, in percentage terms, of the drop in the income in the 2020 tourism high season, compared to the equal period in 2019 (in the case where a drop occurred).
In order to determine the number of strata for each survey and, therefore, compute the sample size needed to have a 5% bound on the error of estimation (), a brief description of the target populations follows.
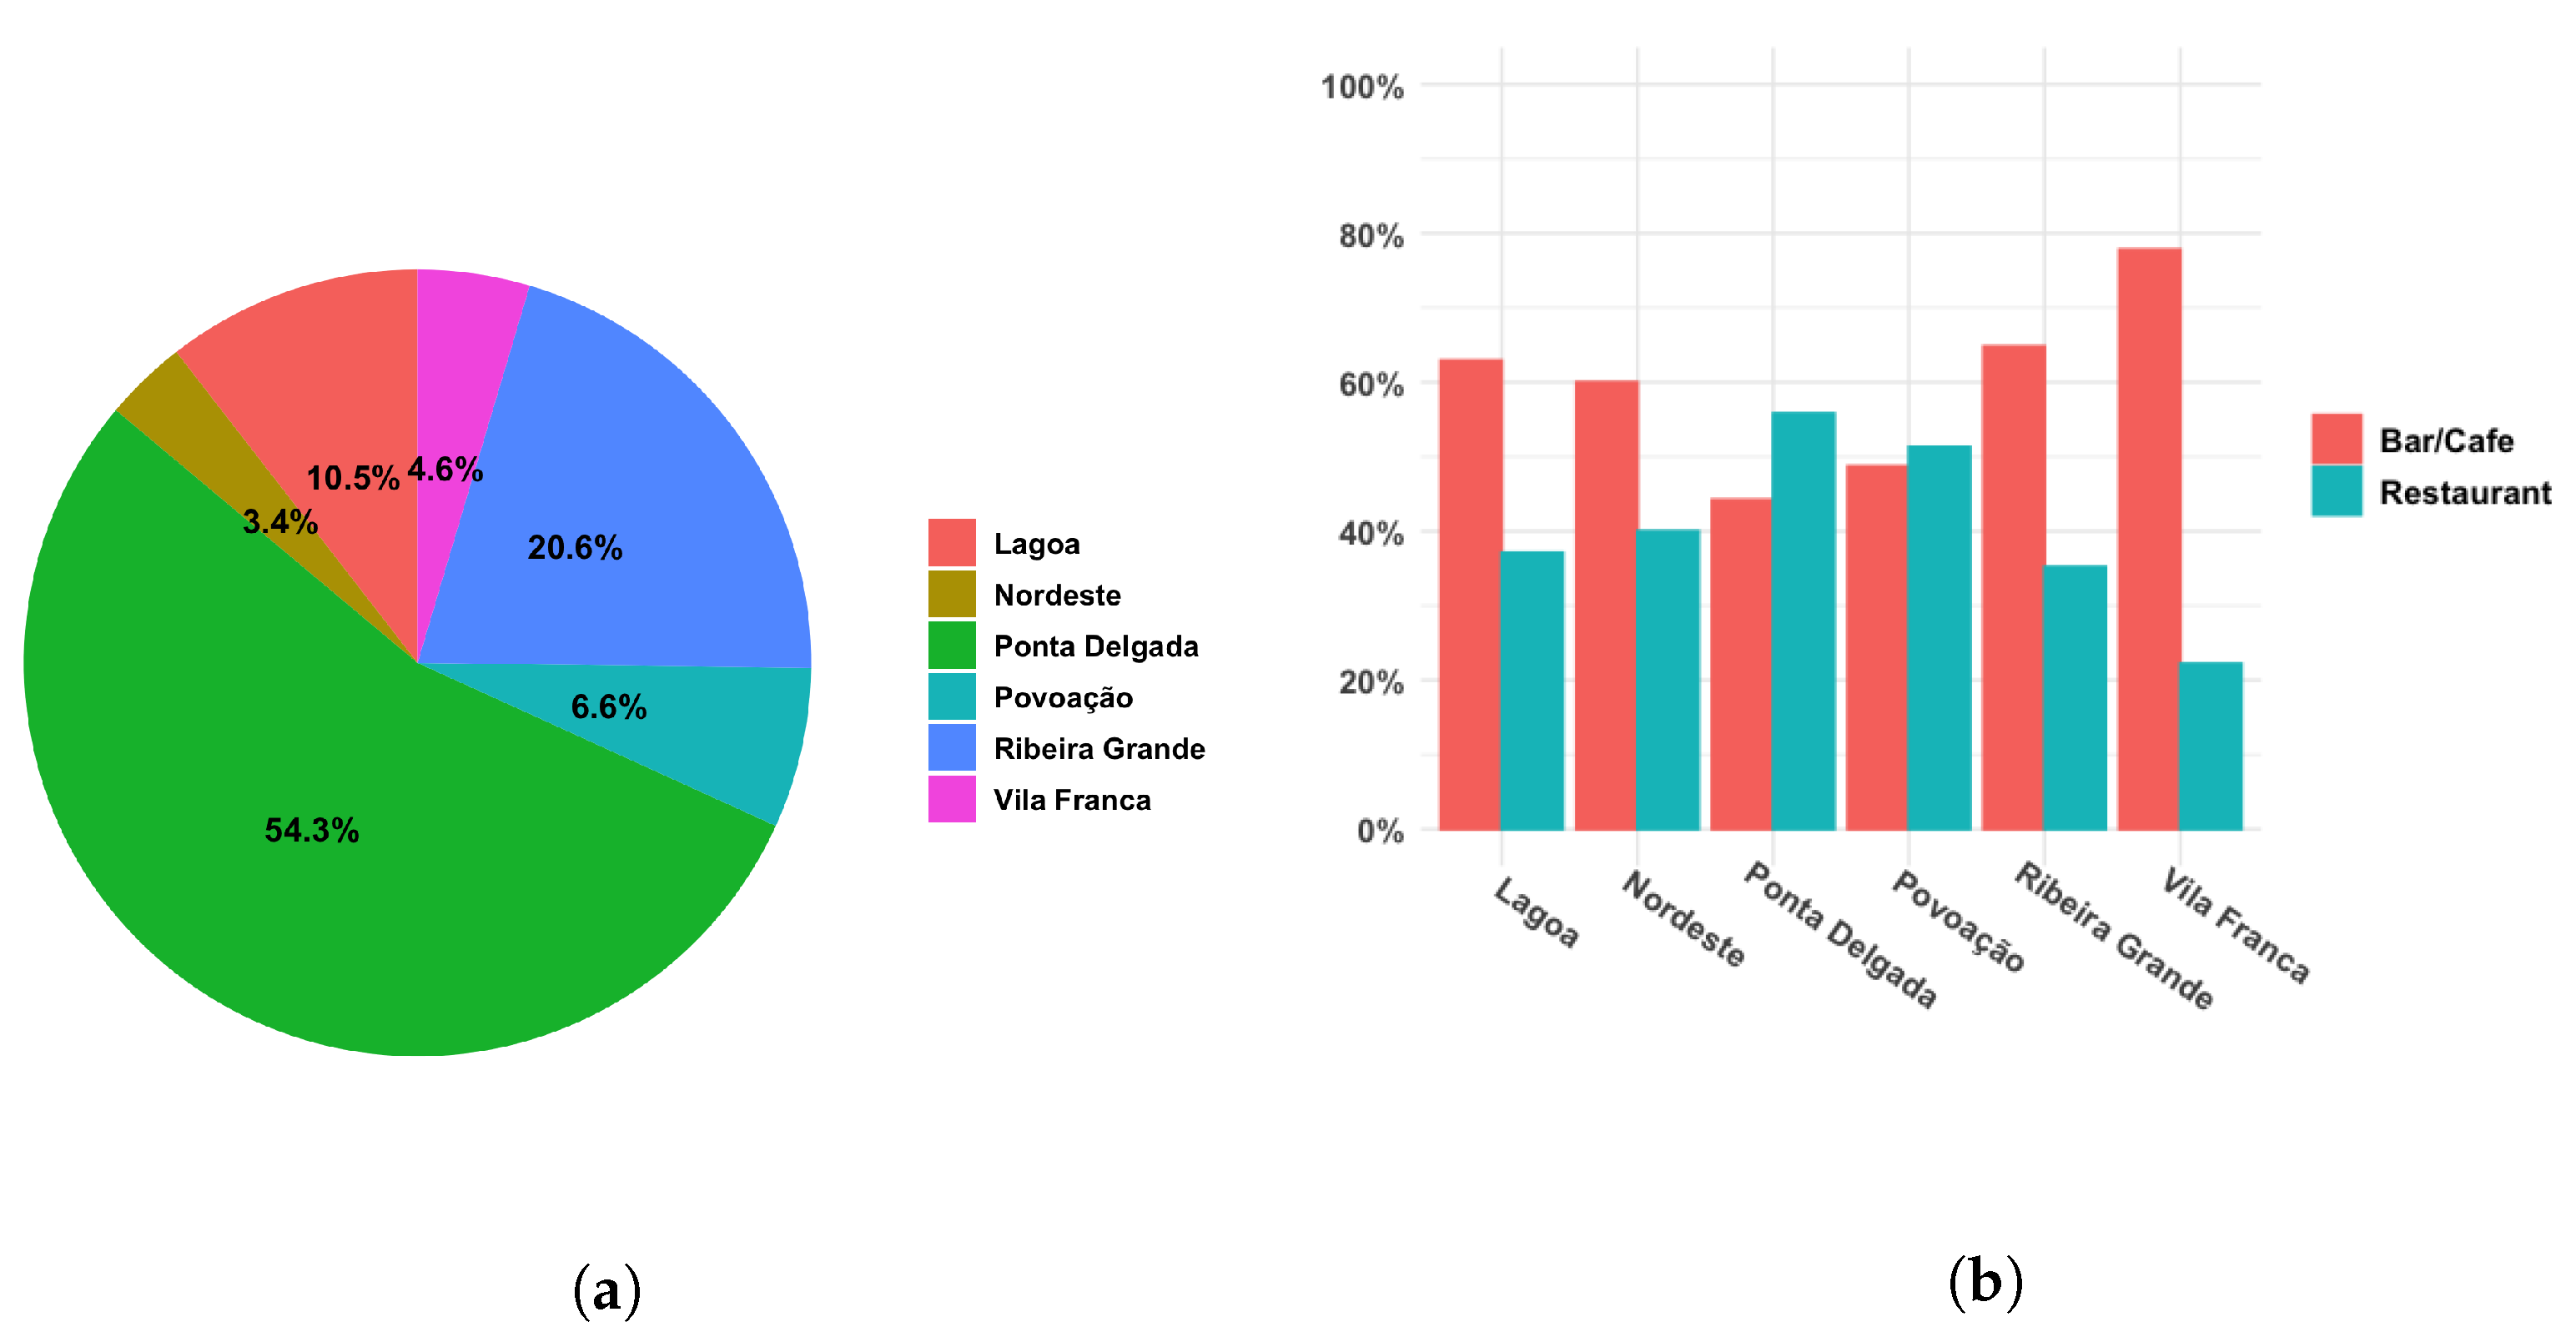
According to the data available at the beginning of 2021 (Source: SREA), there was a total of
sampling units linked to restaurants, bars and cafes in São Miguel Island. The distribution according to unit location and type of economic activity practiced is given in
Table 1, which is also represented in
Figure 2.
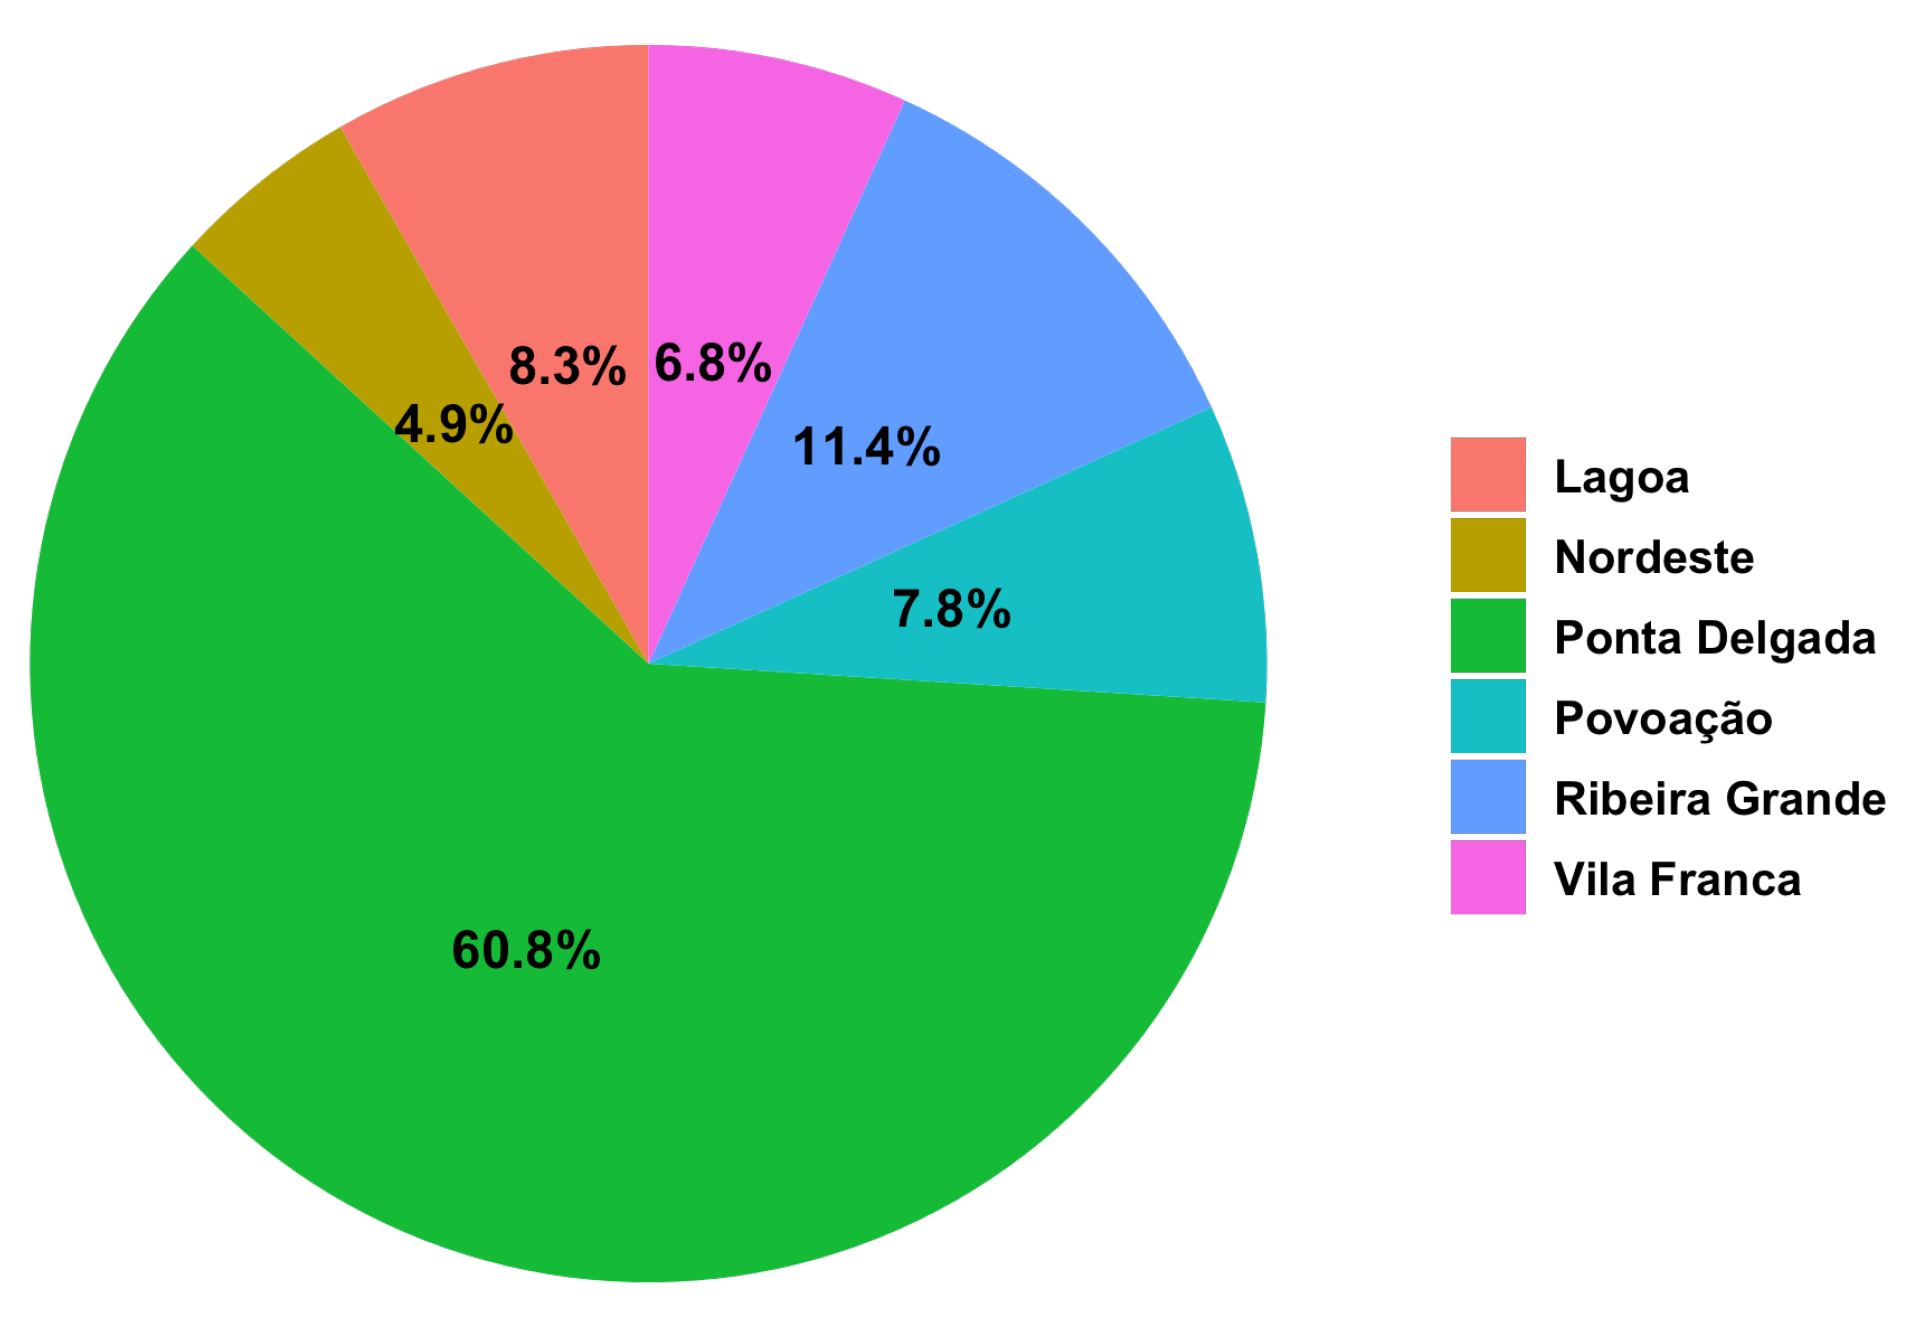
For the local accommodation sector, there was a total of
sampling units on the island, whose distribution is given in
Table 2 and depicted in
Figure 3.
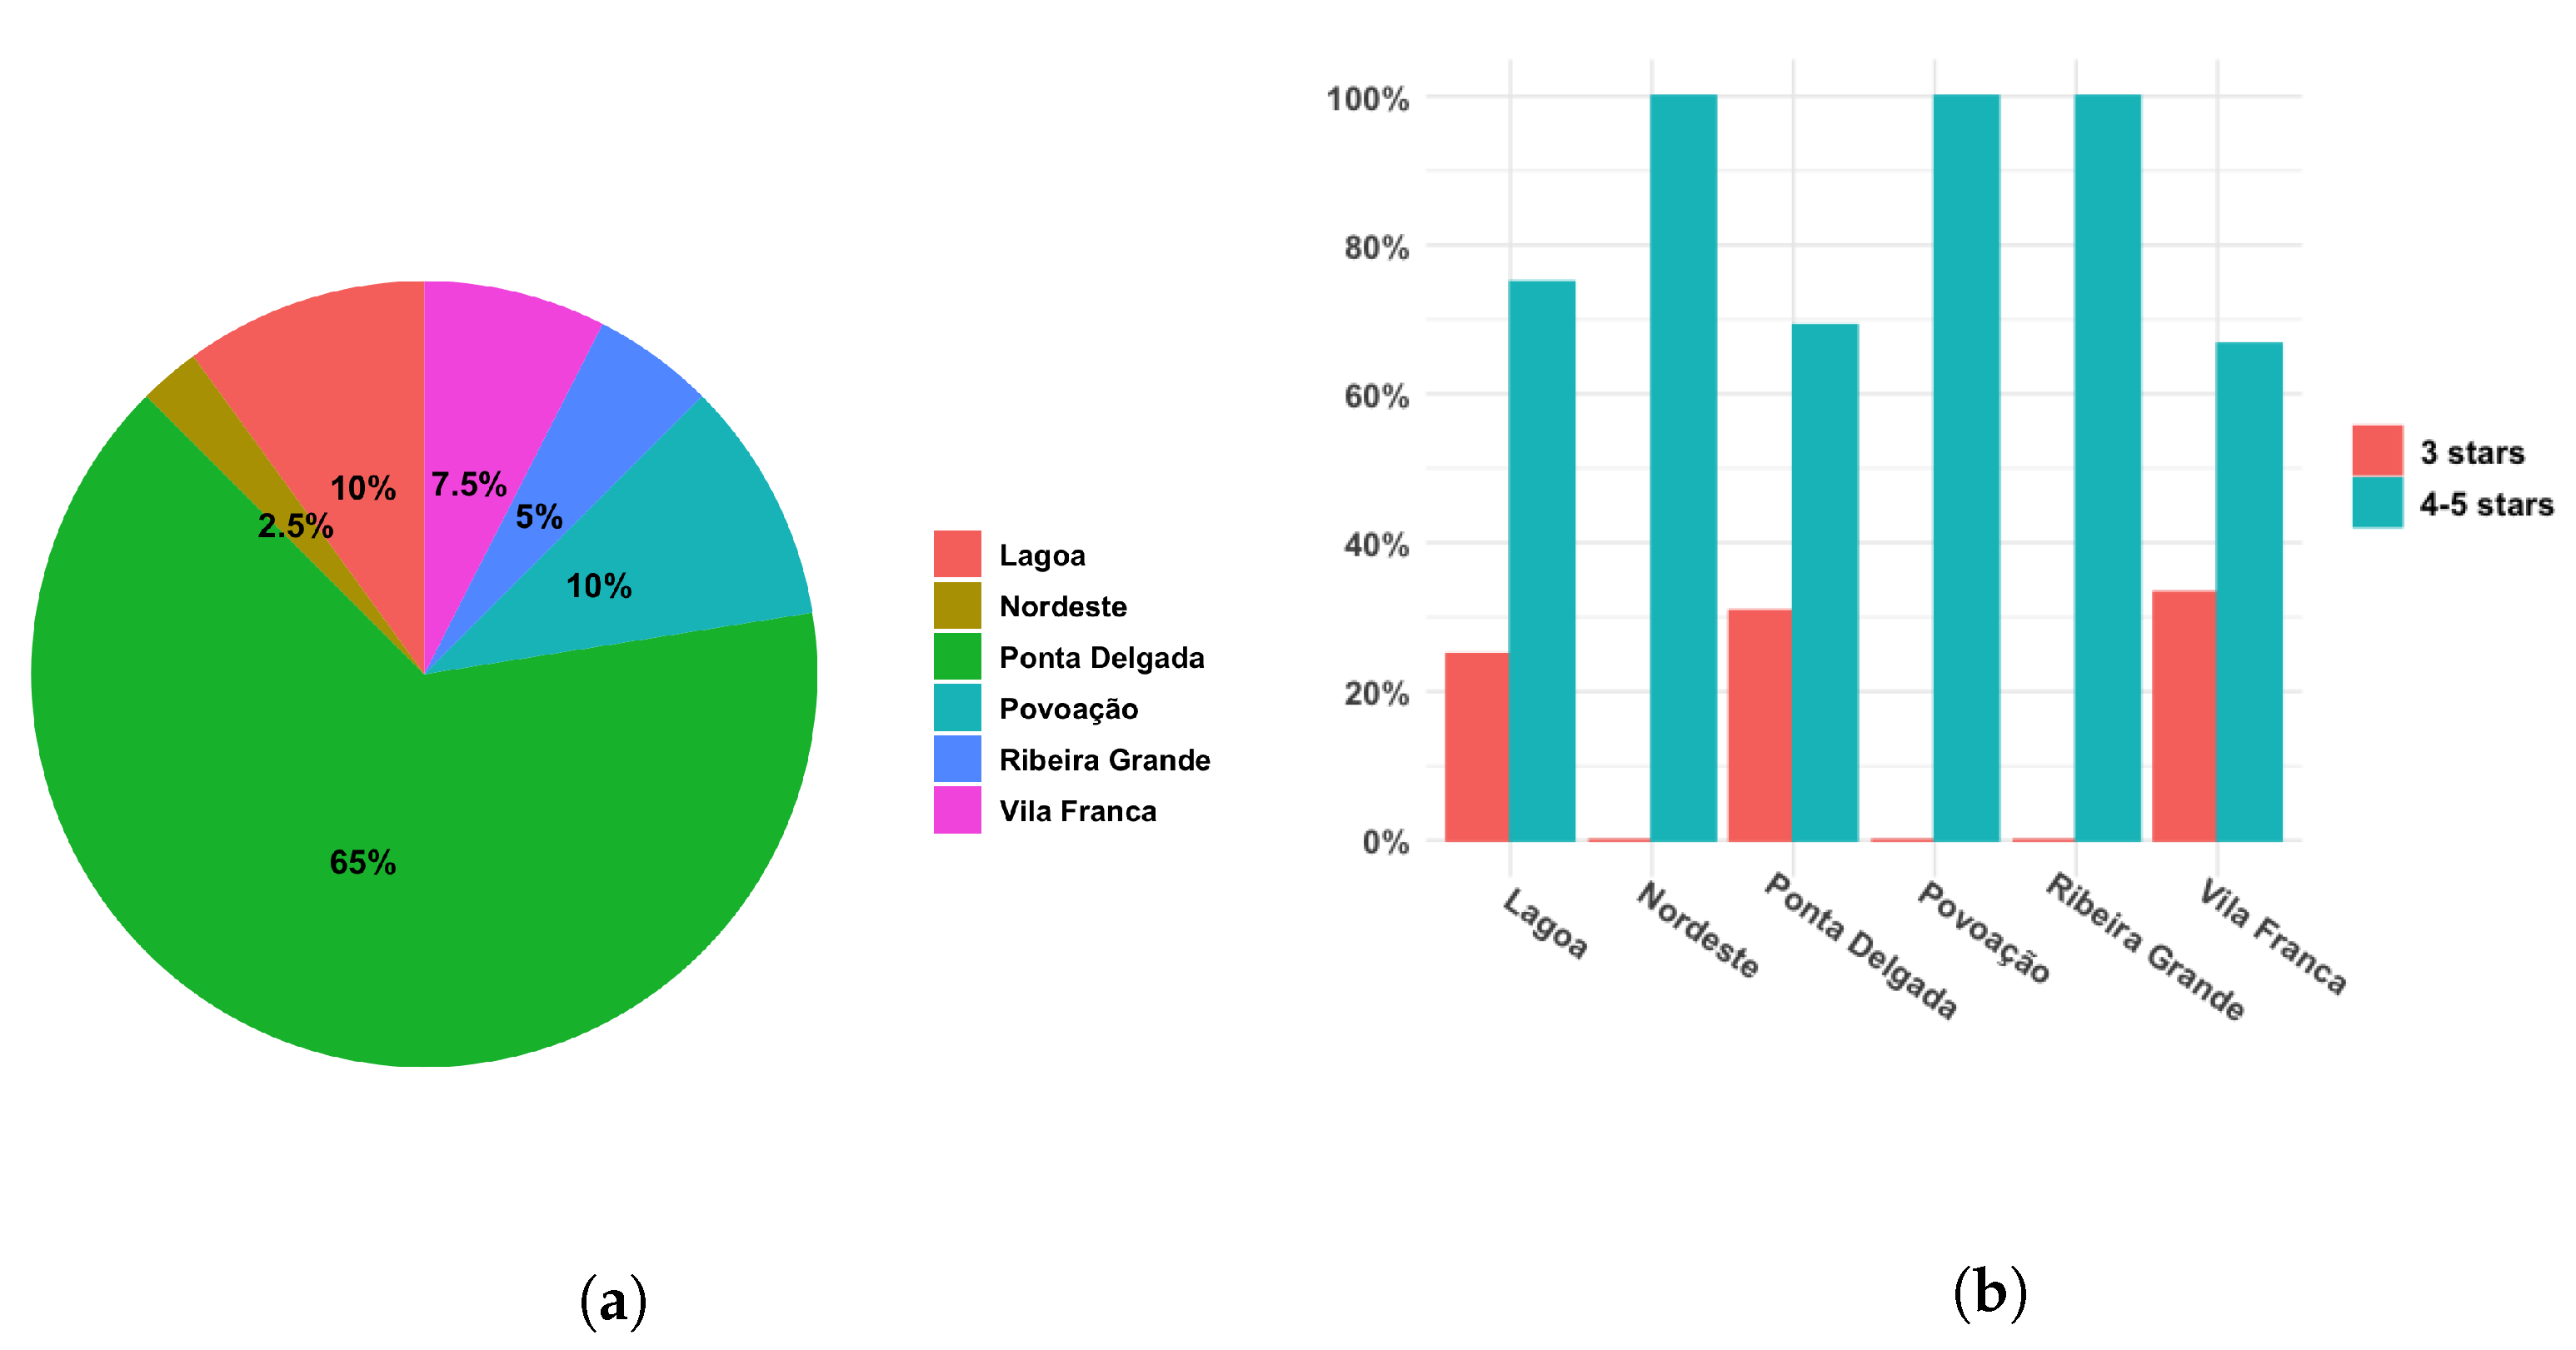
As for the traditional hotel sector, we decided to consider only hotels with 3 or more stars, which totaled
sampling units. Hotels of 1 and 2 stars (a total of 10 on the island) were left out of the survey since their staff showed no interest in participating in the survey when contacted to inform them about the survey. The distribution of the 3 or more stars hotels according to location and hotel category is given in
Table 3 and also represented in
Figure 4.
Table 1 suggested the use of three strata for the restaurant sector, “Ponta Delgada” (54.3%), “Ribeira Grande” (20.6%) and “Other” (25.1%). For the stratum “Other”, we joined together the municipalities of Lagoa, Nordeste, Povoação and Vila Franca. The decision to consider “Ribeira Grande” as a stratum by itself is due to the fact that Ribeira Grande is the second city of São Miguel Island (Ponta Delgada is the main city) and, therefore, has a wider range of other services that can directly, or indirectly, influence the restaurant, cafe or bar businesses. On a side note, according to the 2021 census, 50.4% and 23.6% of the island’s population live in the municipalities of Ponta Delgada and Ribeira Grande, respectively. However, most of the public services and economic activity of the island are located in Ponta Delgada. On the other hand,
Table 2 suggested the use of two strata for the local accommodation sector, “Ponta Delgada” (60.8%) and “Other” (39.2%), where, in the latter, we joined the other five municipalities together. The same previous two strata were suggested by
Table 3 for the hotel sector since 65% of the 3 or more stars hotels on the island are located in Ponta Delgada and the remaining 35% in the other municipalities together.
Therefore, applying Formula (
1) to each sector, we determined that for the restaurant survey, we needed a sample size of 86, for the local accommodation survey, a sample size of 92 and for the hotel survey, 29, distributed by the strata as indicated in
Table 4,
Table 5 and
Table 6, respectively.
Within each stratum for the local accommodation survey, the sampling units were selected based on a simple random sampling. However, within each stratum for the restaurant and hotel surveys, the sampling units were randomly selected in order to have a sample that would reflect approximately the same proportions of the sampling units in the populations in terms of restaurants and bars or cafes and hotel categories. On the other hand, given the small number of 5-star hotels on the island, we grouped these with the 4-star hotels. Moreover, in order to deal with the non-response phenomenon commonly associated with surveys, which can seriously affect the estimation precision if a high non-response rate is observed, a 20% non-response rate was considered for each sector, meaning that the sample sizes needed were increased by 20%.
The surveys were conducted online between February and April of 2021 and were implemented using Google Forms. The statistical analysis was performed with the software R: A language and environment for statistical computing (
https://www.R-project.org/).
4. Results
4.1. Restaurant Survey
The overall response rate for the restaurant survey was 33.7% (29 surveys), with 65.5% being from establishments from the stratum “Ponta Delgada”, 20.7% from the stratum “Ribeira Grande” and 13.8% from the stratum “Other”. With regard to the type of activity, 51.7% establishments in our survey are restaurants, and 48.3% are bars or cafes. Within the strata, the response rate was 40.4% for “Ponta Delgada”, 33.3% for “Ribeira Grande” and only 19.0% for “Other”. Since the survey was conducted online, one possible explanation for the low response rate observed outside the municipality of Ponta Delgada can be due to the low digital literacy of potential respondents related to this line of activity in other more rural strata. On the other hand, all surveys from the stratum “Ribeira Grande” are from bars or cafes, and, therefore, no information regarding the restaurant business is present for this stratum in the sample. In
Table 7, we summarize the distribution of the surveys received by strata and type of activity.
Concerning staff numbers, all establishments in our survey have full-time employees (at least one), with 39.3% also having part-time staff members (between 1 and 10 employees). In
Table 8, we indicate some summary statistics for the number of full-time employees, where Min,
, Med,
, Max and SD stand for minimum, first-quartile, median, third-quartile, maximum and standard deviation, respectively. Notice that both maxima indicated for stratum “Ponta Delgada” and stratum “Ribeira Grande” are extreme outliers and, therefore, are increasing the standard deviation values.
According to our survey, 86.2% of establishments temporarily stopped their activity during the pandemic. Of those that stopped, 64% are from the stratum “Ponta Delgada”, 20% from the stratum “Ribeira Grande” and 16% from the stratum “Other”. Overall, 92.9% of bars or cafes and 80% of restaurants stopped their activity. Within stratum “Ponta Delgada”, 84.2% of establishments closed their doors (all bars and cafes stopped their activity, and 76.9% of restaurants did the same), 83.3% of establishments stopped within stratum “Ribeira Grande”, and all establishments closed doors within stratum “Other”. Of all those that stopped activity, 52% are in the bar or cafe business. Of all those that did not stop, 75% are from the stratum “Ponta Delgada”, all of them being restaurants. In
Table 9, we summarize the information gathered on this topic.
As a mean to increase income during the pandemic, some establishments in the restaurant sector decided to resort to take-away and/or food delivery as extra services to their normal activity. In our survey, 27.6% of all establishments decided to do so. For those establishments that resorted to such extra services, 87.5% belonged to stratum “Ponta Delgada” and 12.5% to stratum “Ribeira Grande” (no establishment of stratum “Other” did). As for the type of activity, 14.3% of bars or cafes and 40% of restaurants resorted to take-away and/or food delivery. Within strata, 36.8% of establishments in “Ponta Delgada” and 16.7% in “Ribeira Grande” resorted to such extra services. Of those establishments that resorted to take-away and/or food delivery within “Ponta Delgada”, 85.7% are restaurants. On the other hand, for those establishments that stopped their normal activity, only 20% resorted to take-away and/or food delivery. Moreover, for those establishments that did not stop activity and that resorted to take-away and/or food delivery, 75% are from the stratum “Ponta Delgada”, all of them being restaurants. In
Table 10, we summarize the information gathered on this topic.
One extraordinary measure implemented by the Portuguese government during the pandemic in order to preserve jobs was the “simplified layoff” measure, which basically was a financed temporary layoff measure. In
Table 11, we summarize the information obtained on this topic from our survey.
As observed from
Table 11, 69.0% of the establishments surveyed used temporary layoff, and for those that did layoff, 60% were in the restaurant business. Of those establishments that used temporary layoff, 65% are from the stratum “Ponta Delgada”, 20% from the stratum “Ribeira Grande” and 15% from the stratum “Other”. Within stratum “Ponta Delgada”, 68.4% of establishments temporarily laid-off (76.9% are restaurants), within “Ribeira Grande”, this figure is 66.7%, and within“Other” it is 75% (66.7% of them are restaurants). For those establishments that temporarily laid-off employees, when asked if they applied it to all their staff members, 65% answered “yes”, of which 61.5% were in the restaurant business. Within stratum “Ponta Delgada”, 53.8% of establishments that temporarily laid-off staff applied it to all their employees (85.7% are restaurants), within stratum “Ribeira Grande” this figure is 75% and within stratum “Other” 100% (66.7% are restaurants).
When asked if another financed measure (besides temporary layoff) was used, 58.6% answered “yes”. This figure rises to 63.2% for establishments within “Ponta Delgada” and is 50% either within “Ribeira Grande” or within“Other”. Of those who used another financed measure within “Ponta Delgada”, 75% are restaurants, while within“Other”, there is an equal split between the number of restaurants and of bars or cafes.
As for dismissing staff members during the pandemic, 13.8% of the establishments surveyed say they did. Of those establishments that had to fire employees, 50% were from the stratum “Ponta Delgada” and 50% from the stratum “Ribeira Grande” (no establishment of stratum “Other” had to). On the other hand, 21.4% of bars or cafes and 6.7% of restaurants ended up dismissing employees. Of those establishments that dismissed employees, 75% are in the bar or cafe business. Related to strata, 10.5% of establishments from “Ponta Delgada” and 33.3% of “Ribeira Grande” dismissed staff members. In
Table 12, we summarize the information gathered on this topic from our survey.
Finally, when asked if profits in 2020 covered all activity expenses, 93.1% answered “no” to the question. Of those establishments that did not manage to cover their expenses, 48.1% are restaurants and 51.9% are bars or cafes. Of those establishments that answered “yes” to the question (6.9%), they were all from the stratum “Ponta Delgada” and in the restaurant business, of which 50% resorted to take-away and/or food delivery. Moreover, no bar or cafe in our survey stated that they managed to cover all their expenses. Information on this topic is given in
Table 13.
Estimation of the Mean Income Drop for the Restaurant Sector in 2020
All establishments in our restaurant survey claim to have had an income drop in the 2020 tourism high season compared to the equal period of 2019. In
Table 14, we indicate summary statistics for the income drop reported.
We estimate that the mean income drop in 2020 for the establishments of stratum “Ponta Delgada” was , for the establishments of stratum “Ribeira Grande” and for the establishments of stratum “Other” . Combining the information of the three strata according to our survey design, we estimate that the mean income drop in the 2020 tourism high season, compared to 2019, was for the restaurant sector.
4.2. Local Accommodation Survey
For the local accommodation survey, we obtained a total of 97 surveys, where 54 belonged to stratum “Ponta Delgada” (a 96.4% response rate within the stratum) and 43 to stratum “Other”. Since only 36 surveys were required for stratum “Other”, 7 surveys belonging to this stratum were randomly eliminated from the subsample. Henceforth, for the sake of simplicity, we shall refer to a local accommodation unit as an AL unit.
In our survey, the average number of beds offered by an AL unit, where double beds are counted as two beds, was 7.5 if from the stratum “Ponta Delgada”, and 5.7 if from the stratum “Other”. The information gathered on the number of beds from our survey is given in
Table 15. Notice again that the maxima indicated are extreme outliers.
As for staff numbers, only 40% of AL units mention having full-time employees (38.9% within stratum “Ponta Delgada” and 41.7% within stratum “Other”). Moreover, 42.7% of AL units mention having part-time staff (between 1 and 3 employees), with 30.3% having just one part-time employee. Of the AL units of stratum “Ponta Delgada”, 35.2% state that they have only one part-time staff member, while this figure decreases to 22.9% if they are of stratum “Other”. Furthermore, 32.2% report not having employees of any kind, with this figure being 27.8% within “Ponta Delgada” and 38.9% within“Other”. On a side note, to our knowledge, some AL unit owners only hire outside services to support their activity. In
Table 16, we summarize the information obtained on the number of full-time employees for the sector. Notice once more that the maximum value observed for stratum “Other” is an extreme outlier.
Concerning the stop of activity during the pandemic, overall, 46.7% of AL units temporarily closed their doors, this figure is 48.1% within “Ponta Delgada” and 44.4% within“Other”. Of all those AL units that closed their doors, 61.9% are from the stratum “Ponta Delgada”. When asked if temporary layoff was used, globally, 13.3% answered “yes”, this figure is 16.7% within stratum “Ponta Delgada” and 8.3% within stratum “Other”. Of those AL units either from the stratum “Ponta Delgada” or “Other” that temporarily laid-off staff members, 66.7% applied it to all their employees. When asked if another financed measure was used, 25.6% answered “yes”, this figure is 22.2% within stratum “Ponta Delgada” and 30.6% within stratum “Other”. The information gathered on these two topics is summarized in
Table 17.
As for dismissing staff members, only 5.9% of AL units in our survey with employees of any kind ended up doing so, of which all are from the stratum “Ponta Delgada”. Finally, when asked if they managed to cover all expenses associated with their activity in 2020, overall, 77.8% answered “no”. This figure is also reflected within stratum “Ponta Delgada” and within stratum “Other”. Of those AL units that did not manage to cover the activity’s expenses, 60% are from the stratum “Ponta Delgada”. The information above is summarized in
Table 18.
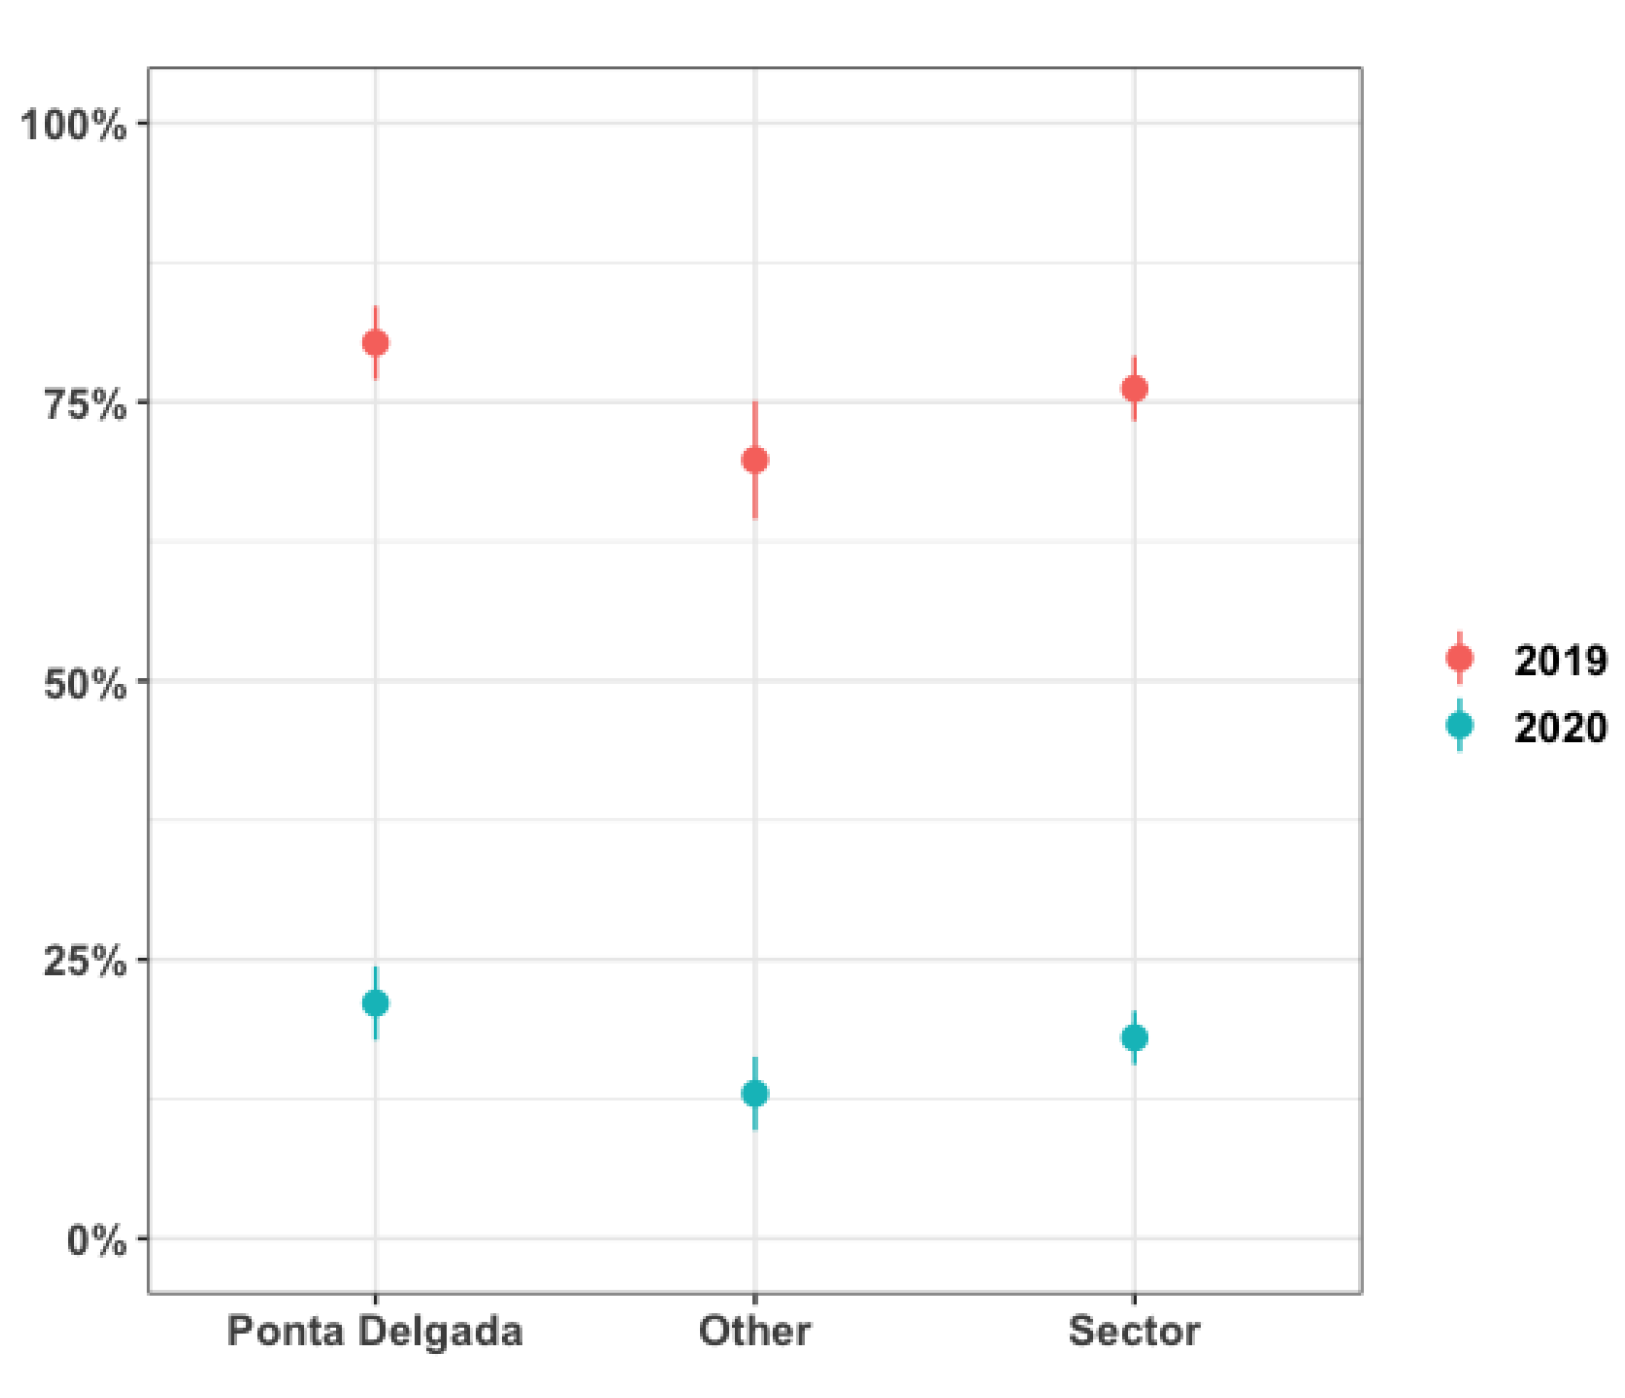
Since profits in this sector, and also in the hotel sector, depend on the occupancy rates, in
Table 19 and
Table 20, we summarize the occupancy rates observed for the months of June to September of 2019 and 2020 for an AL unit from each stratum. As expected, lower occupancy rates, on average, were observed in the 2020 tourism high season compared to the equal period of 2019.
In
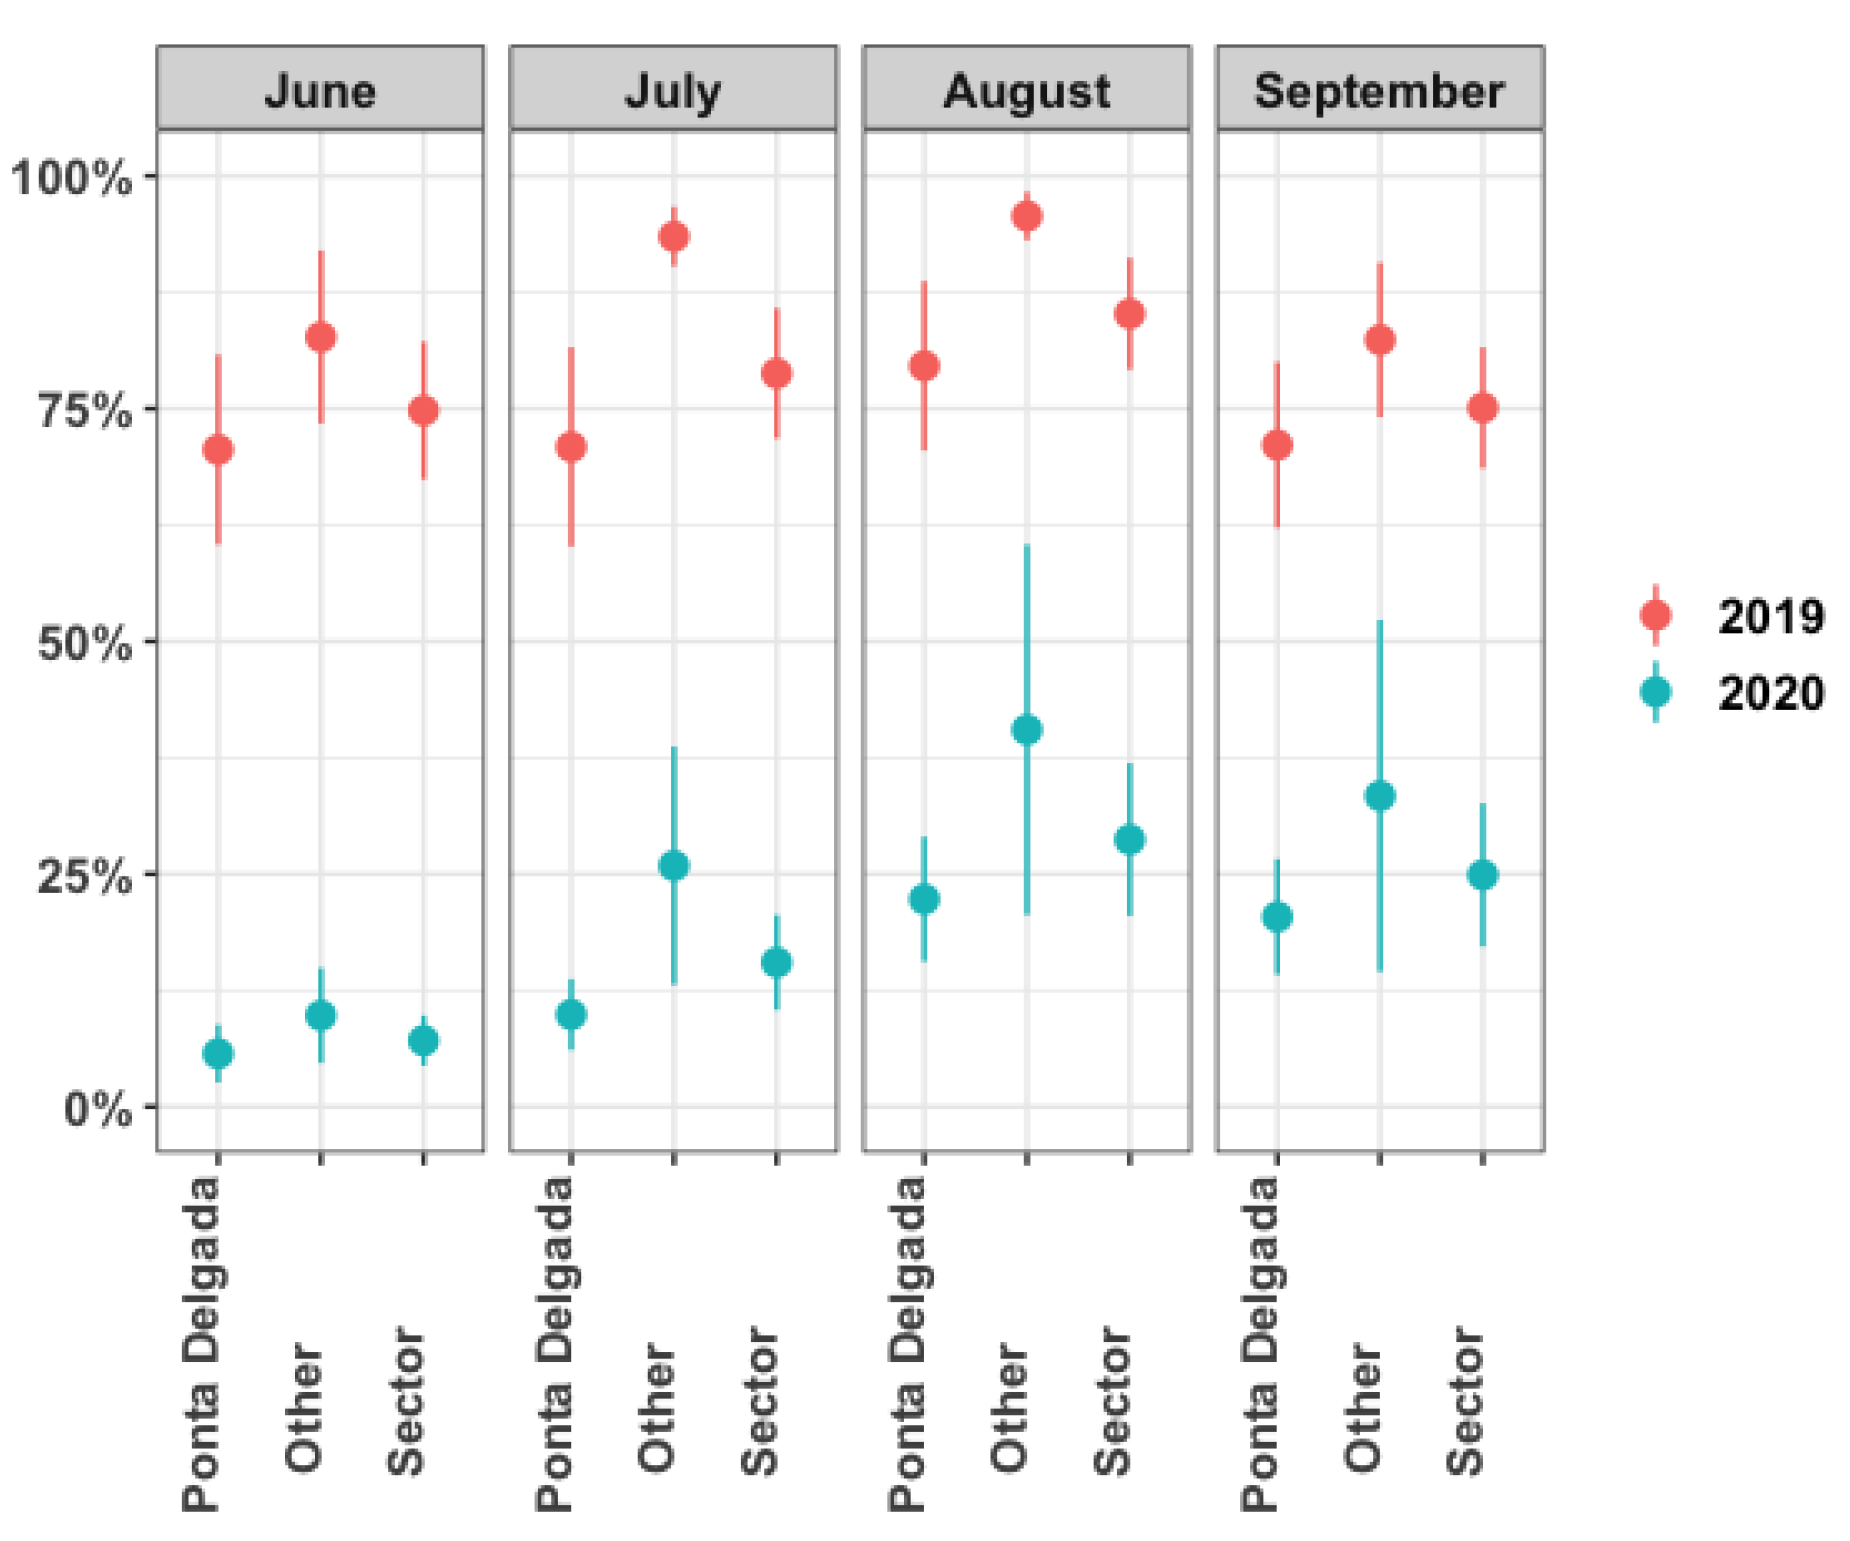
Table 21 the mean occupancy rate estimate is indicated for each month of June to September 2019 and 2020. As can be observed, the highest mean occupancy rate point estimate is for August, followed by July for both years. On the other hand, the highest drop in the mean occupancy rate in 2020 is estimated for June, which is expected since June was the first month after the lockdown was lifted. Moreover, the smallest drop in the mean occupancy rate in 2020 was estimated for September, which can probably be explained by the fact that tourists who normally travel around this month of the year continued to do so in 2020; now, with fewer reservations and travel restrictions than for those who usually decide to travel in the earlier months of summer. In
Figure 5, we represent the mean occupancy rates per month and year.
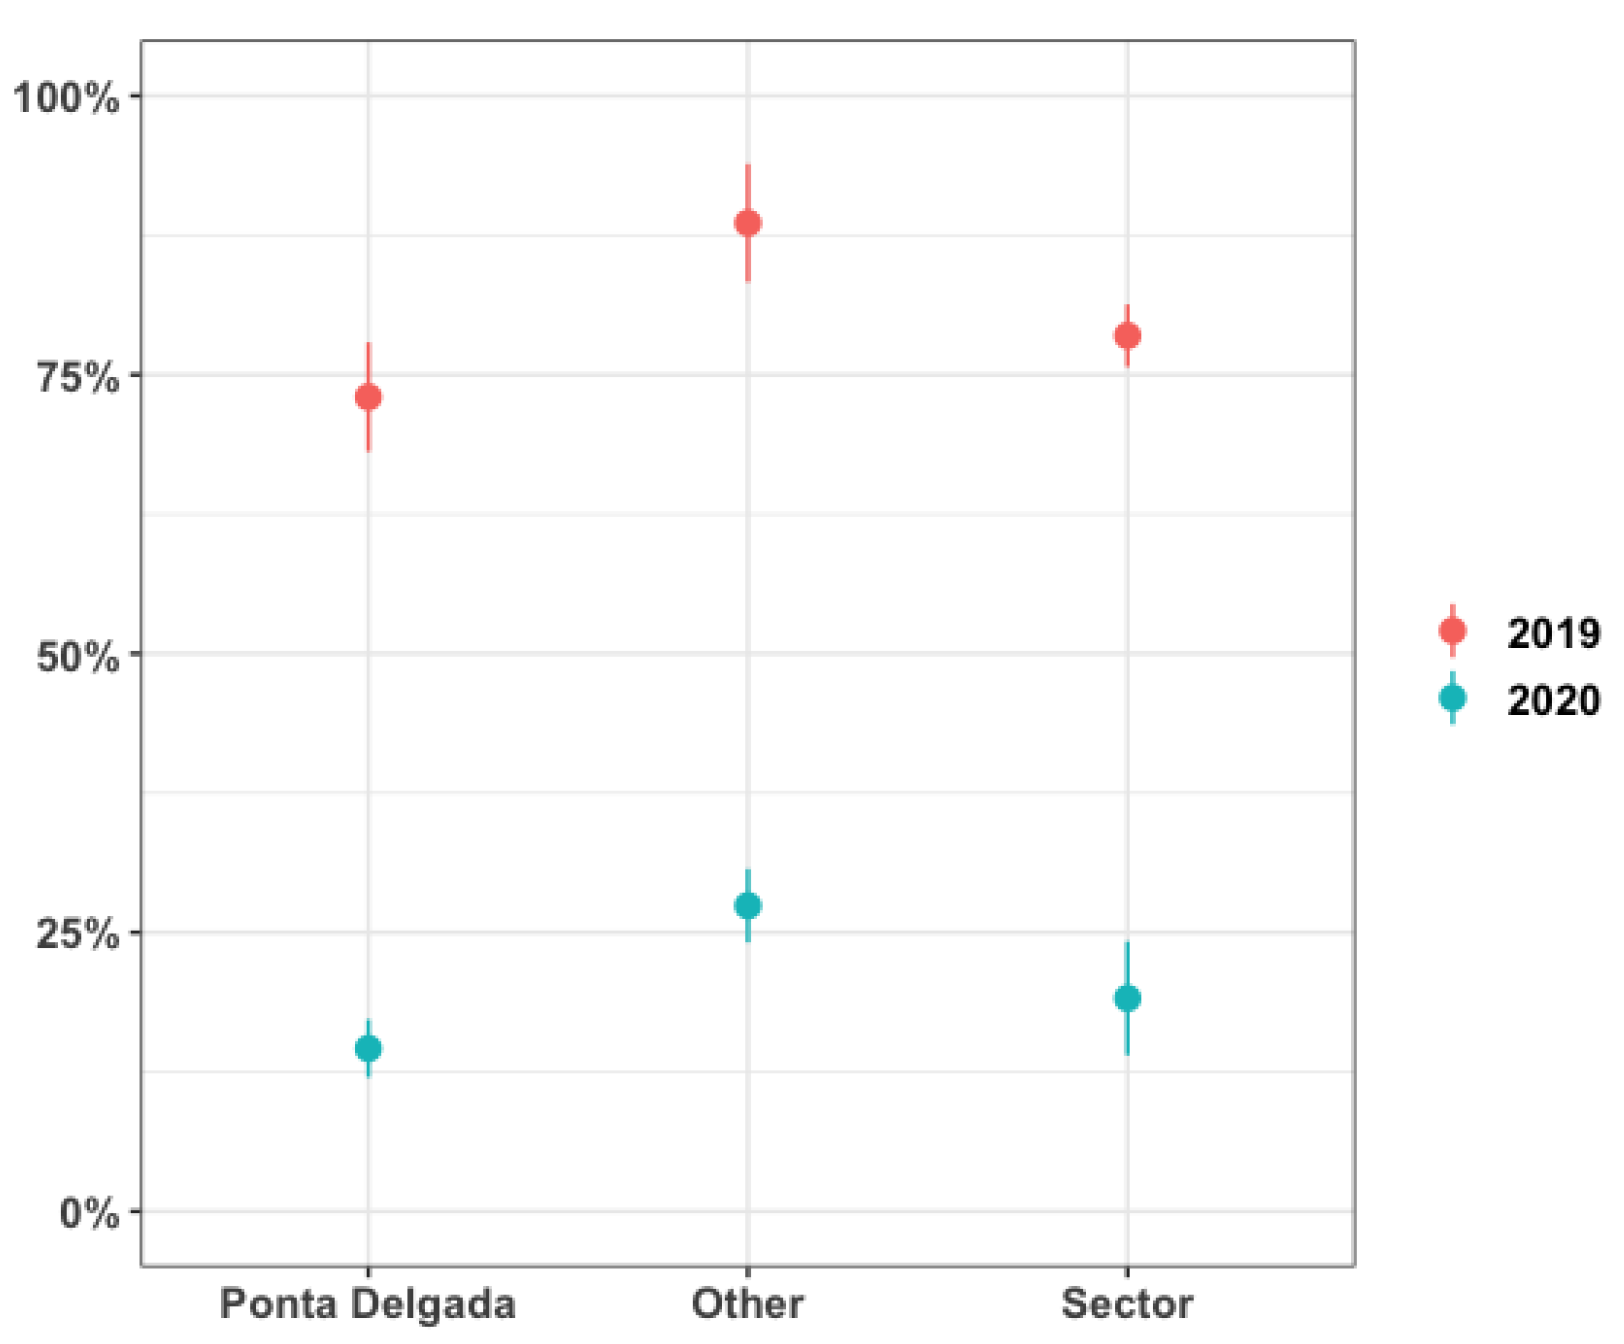
For the 2019 tourism high season, we estimate that the mean occupancy rate for an AL unit of stratum “Ponta Delgada” was
, and for “Other”, it was
. For the 2020 tourism high season, the mean occupancy rate is estimated to be
for an AL unit of stratum “Ponta Delgada” and
for stratum “Other”. Combining the information from both strata, we estimate that the mean occupancy rate for the 2019 tourism high season was
and
for the same period in 2020. Hence, the mean drop in the mean occupancy rate in the 2020 high season was
for the local accommodation sector. In
Table 22, we summarize the information above, which is also represented in
Figure 6.
Estimation of the Mean Income Drop for the Local Accommodation Sector in 2020
Contrarily to the restaurant survey, 96.7% of AL units claim to have had an income drop in the 2020 tourism high season compared to the same period of 2019. This figure is 98.1% within the stratum “Ponta Delgada” and 94.4% within the stratum “Other”. Of the three AL units that claim to not have had an income drop in 2020, one is from the stratum “Ponta Delgada” and the other two from the stratum “Other”. In
Table 23, we indicate the summary statistics for the income drop for the AL units that claim to have had an income drop.
For 2020, we estimate that the mean income drop for an AL unit of stratum “Ponta Delgada” was , and for stratum “Other”, it was . Combining the information from both strata, we estimate that the mean income drop in the 2020 tourism high season, compared to 2019, was for the local accommodation sector.
4.3. Hotel Survey
The overall response rate for the hotel survey was 79.3% (23 surveys), with the response rate being 89.5% within the stratum “Ponta Delgada” and 60% within the stratum “Other”. As for the hotel category, 78.3% of the surveys are from 4–5-star hotels. Within “Ponta Delgada” this figure is 76.5% and within“Other” it is 83.3%. In
Table 24, we summarize the distribution of the surveys received by strata and hotel category.
With regard to the number of full-time employees, summary statistics are indicated in
Table 25. Only 13.0% of the hotels surveyed say they have part-time staff, with this number varying between 4 and 14. Of those hotels that have part-time staff members, 66.7% are from the stratum “Ponta Delgada”.
Overall, 87.0% of hotels in our survey temporarily closed their doors during the pandemic, with all 3-star hotels and 83.3% of all 4–5-star hotels doing the same. Of those hotels that closed their doors, 75% are from the stratum “Ponta Delgada”, and 75% are 4–5-star hotels. Moreover, 88.2% of hotels within the stratum “Ponta Delgada” and 83.3% within the stratum “Other” closed their doors. Of the hotels that closed their doors within the stratum “Ponta Delgada”, 73.3% are 4–5-star hotels. In
Table 26, we summarize the information gathered on this topic.
As for the use of temporary layoffs, 95.7% of the hotels surveyed used it (100% within stratum “Ponta Delgada” and 83.3% within stratum “Other”). All 3-star hotels used temporary layoffs, while 94.4% of 4–5-star hotels did the same. On the other hand, the hotels that did not use temporary layoffs are from the stratum “Other”. Of those hotels that temporarily laid-off employees, 54.5% applied it to all their staff members (52.9% within “Ponta Delgada” and 60% within“Other”). When asked if another financed measure was used, 39.1% answered “yes” (35.3% within “Ponta Delgada” and 50% within“Other”). Concerning dismissing staff members, no hotel in our survey fired employees. In
Table 27, we summarize the information gathered on the use of temporary layoffs by the hotel sector.
Finally, when asked if expenses associated with the activity in 2020 were entirely covered, only 13.0% of the hotels answered “yes”. For the hotels from the stratum “Ponta Delgada”, this figure lowers to 5.9%, and for those from the stratum “Other” it is 33.3%. Of those hotels that managed to cover their expenses, none is a 3-star hotel. On the other hand, 66.7% of hotels that managed to cover all expenses belong to stratum “Other”. Moreover, only 16.7% of the 4–5-star hotels managed to do so (7.7% within “Ponta Delgada” and 40% within“Other”). In
Table 28, the information obtained on this topic is summarized.
In
Table 29 and
Table 30, the occupancy rates statistics are shown for the months of June to September 2019 and 2020 for a hotel of both strata (no distinction is made between hotel categories). As observed for the local accommodation survey, there is, on average, a much lower occupancy rate in the 2020 tourism high season, compared to 2019, for each month. If we compare figures between strata, higher occupancy rates are observed, on average, for each year for the hotels located outside the municipality of Ponta Delgada.
In
Table 31, the mean occupancy rate estimated is indicated for each month of June to September 2019 and 2020 for the hotel sector. For this sector, the highest mean occupancy rate in 2020 was also estimated for August, followed by September. As verified for the local accommodation sector, the highest drop in the mean occupancy rate was estimated for June, while the smallest drop was also estimated for September. In
Figure 7, we represent the mean occupancy rates per month and year.
For the 2019 tourism high season, we estimate that the mean occupancy rate for a hotel of stratum “Ponta Delgada” was
, and for one of “Other” it was
. For the 2020 tourism high season, the estimated mean occupancy rate was
for a hotel of stratum “Ponta Delgada” and
for one of stratum “Other”. Combining the information from both strata, the mean occupancy rate estimate for the 2019 tourism high season was
and
for the same period in 2020. Therefore, the mean drop in the mean occupancy rate in the 2020 tourism high season was
for the hotel sector. The information above is indicated in
Table 32, which is also represented in
Figure 8.
Estimation of the Mean Income Drop for the Hotel Sector in 2020
All hotels in our survey claim to have had an income drop in the 2020 tourism high season compared to 2019. In
Table 33, summary statistics are given for the income drop reported for the sector.
A smaller income drop is observed, on average, for the hotels from the stratum “Other”. This is a direct consequence of the higher occupancy rates observed in the 2019 and 2020 tourism high seasons for the hotels from this stratum compared to hotels from the stratum “Ponta Delgada”. We estimate that the mean income drop in 2020 for a hotel of stratum “Ponta Delgada” was and for one of stratum “Other” it was . Combining the information from both strata, we estimate that the mean income drop in the 2020 tourism high season, compared to 2019, was for the hotel sector.
5. Discussion and Conclusions
Our surveys show that the COVID-19 pandemic had an adverse impact on São Miguel Island’s tourism accommodation and restaurant sectors in the 2020 tourism high season, compared to the homologous pre-pandemic 2019 period. We estimate that the biggest drop in the mean income was observed for the local accommodation sector, an almost 79% point estimate drop (), although 3.3% of AL units reported not to have had an income drop, followed by the traditional hotel sector, with an almost 75% point estimate drop (), and the restaurant sector, with an almost 59% point estimate drop (). The relatively smaller mean income drop felt by the restaurant sector in 2020, compared to the other two sectors, can probably be explained by the fact that tourists are not the only customers of restaurants, bars and cafes. These establishments are also frequented by locals, although with a lower frequency during the summer of 2020 since many people feared getting infected by the virus when going out to eat or drink. Given that some establishments also resorted to take-away and/or food delivery as extra services to their normal activity (27.6%), this situation may also help explain the slightly better results for the restaurant sector in 2020. However, some caution should be considered when interpreting the restaurant sector figures because a low response rate was observed for the survey (33.7%). On the other hand, no information on the restaurant business within the stratum “Ribeira Grande” is present in the sample.
Contrarily to the restaurant sector, the tourism accommodation sector depends entirely on the number of tourists, either domestic or international. The bigger the number, the higher the occupancy rates will tend to be and, hence, the profits. Therefore, any measure taken to restrict people’s mobility, or dissuade the arrival of tourists, will necessarily have a more profound impact on this sector. Regardless of the type of accommodation offered, an almost 60% point estimate mean drop in the mean occupancy rate is observed for the 2020 tourism high season, compared to the equal period of 2019, which can be considered a significant drop for the sector in general. In particular, for the local accommodation sector, we estimate that the mean occupancy rate in the 2020 tourism high season was , while in 2019, it was . For the hotel sector, we estimate that the mean occupancy rate in the 2020 tourism high season was , while in 2019, it was .
As for the loss of jobs during the first year of the pandemic, our surveys show that 13.8% of establishments in the restaurant sector ended up dismissing staff members in 2020 (again, some caution should be considered when interpreting this figure). In the tourism accommodation sector, this percentage seems to be lower since, in our surveys, no hotel had to dismiss employees, and only 5.9% of AL units with staff members ended up doing so. These figures are probably not worse because many establishments used the temporary layoff measure as a means to preserve jobs. Moreover, the hotel sector seemed to be the sector where this measure was most used (95.7%), followed by the restaurant sector (69%) and the local accommodation sector (13.3%).
Before the arrival of low-cost airlines to the Azores in 2015, one of the biggest obstacles pointed out by tourists (domestic and international) for visiting the region was the price of air tickets. This situation has put the Azores at a disadvantage compared to other more competitive tourist destinations, even within Portugal (e.g., Lisbon, Porto, Algarve and Madeira). Despite the growth in tourism numbers in more recent years in the region, the weight that the Azores has had in the number of guests and overnight stays in Portugal has been quite small. According to INE’s tourism statistics reports, from 2000 to 2019, the Azores’ share of the country’s number of guests lay between 2.0% and 2.8%, and its share of overnight stays was between 1.7% and 3.2%. In 2020, the Azores’ share of the number of guests was 2.0% and of overnight stays 1.7%, i.e., values that were observed back in 2000. Moreover, investments that have been made lately in the hospitality sector of the region, in order to respond to higher tourist demand have been mainly for superior category hotels. For example, the first 5-star hotel that opened in Ponta Delgada was in 2016. On the other hand, several restaurant, bar and cafe establishments in the Azores are small family-run enterprises. Since the Azores are an ultra-peripheral region, greater challenges are posed to its economic activities, and even more so under a pandemic crisis. Therefore, if the Azores tourism industry wants to continue to grow in a sustainable manner, it has to adopt more robust growth strategies in order to face other possible tourism crises in the future. On the other hand, direct comparisons between the Azores’ reality and of other regions where tourism is already well established should be avoided, or at least made with caution.
Entering the last quarter of 2022, the pandemic still remains active due to a more infectious, although less harmful, variant of the virus (omicron). However, the high vaccination rate against the COVID-19 virus and vaccine booster, especially in more developed countries, combined with the easing of travel restrictions in many countries, are making people feel safer and more comfortable traveling in 2022, within borders and even more so abroad. Therefore, an interesting follow-up study to the one presented here is to see how the pandemic affected the tourism accommodation and restaurant sectors of São Miguel Island in the pandemic-following years of 2021 and 2022. This would allow a more accurate assessment of the pandemic’s economic impact on these sectors and determine if a turning point in the figures toward pre-pandemic levels occurs in 2022 since INE’s provisional estimates for June 2022 point to 2,667,700 guests and 7,152,300 overnight stays in tourist accommodation establishments in Portugal, when in June 2021, there were 1,352,400 guests (+97.3%) and 3,401,800 overnight stays (+110.2%).


