Research on Tourism Carrying Capacity and the Coupling Coordination Relationships between Its Influencing Factors: A Case Study of China
Abstract
1. Introduction
2. Literature Review
2.1. The Conception and Definition of TCC
2.2. The Construction of TCC Indicator System
2.3. The Coordinated Development of Tourism
3. Data and Methodology
3.1. Data Sources and Indicator Selection
3.2. Methodology
3.2.1. Indicator Weights Calculation based on Combined Weighting Method
3.2.2. Construction of Coupling Coordination Model
4. Results
4.1. Analysis of Spatio-Temporal Dynamic Evolution of TCC for Provinces and Cities in China
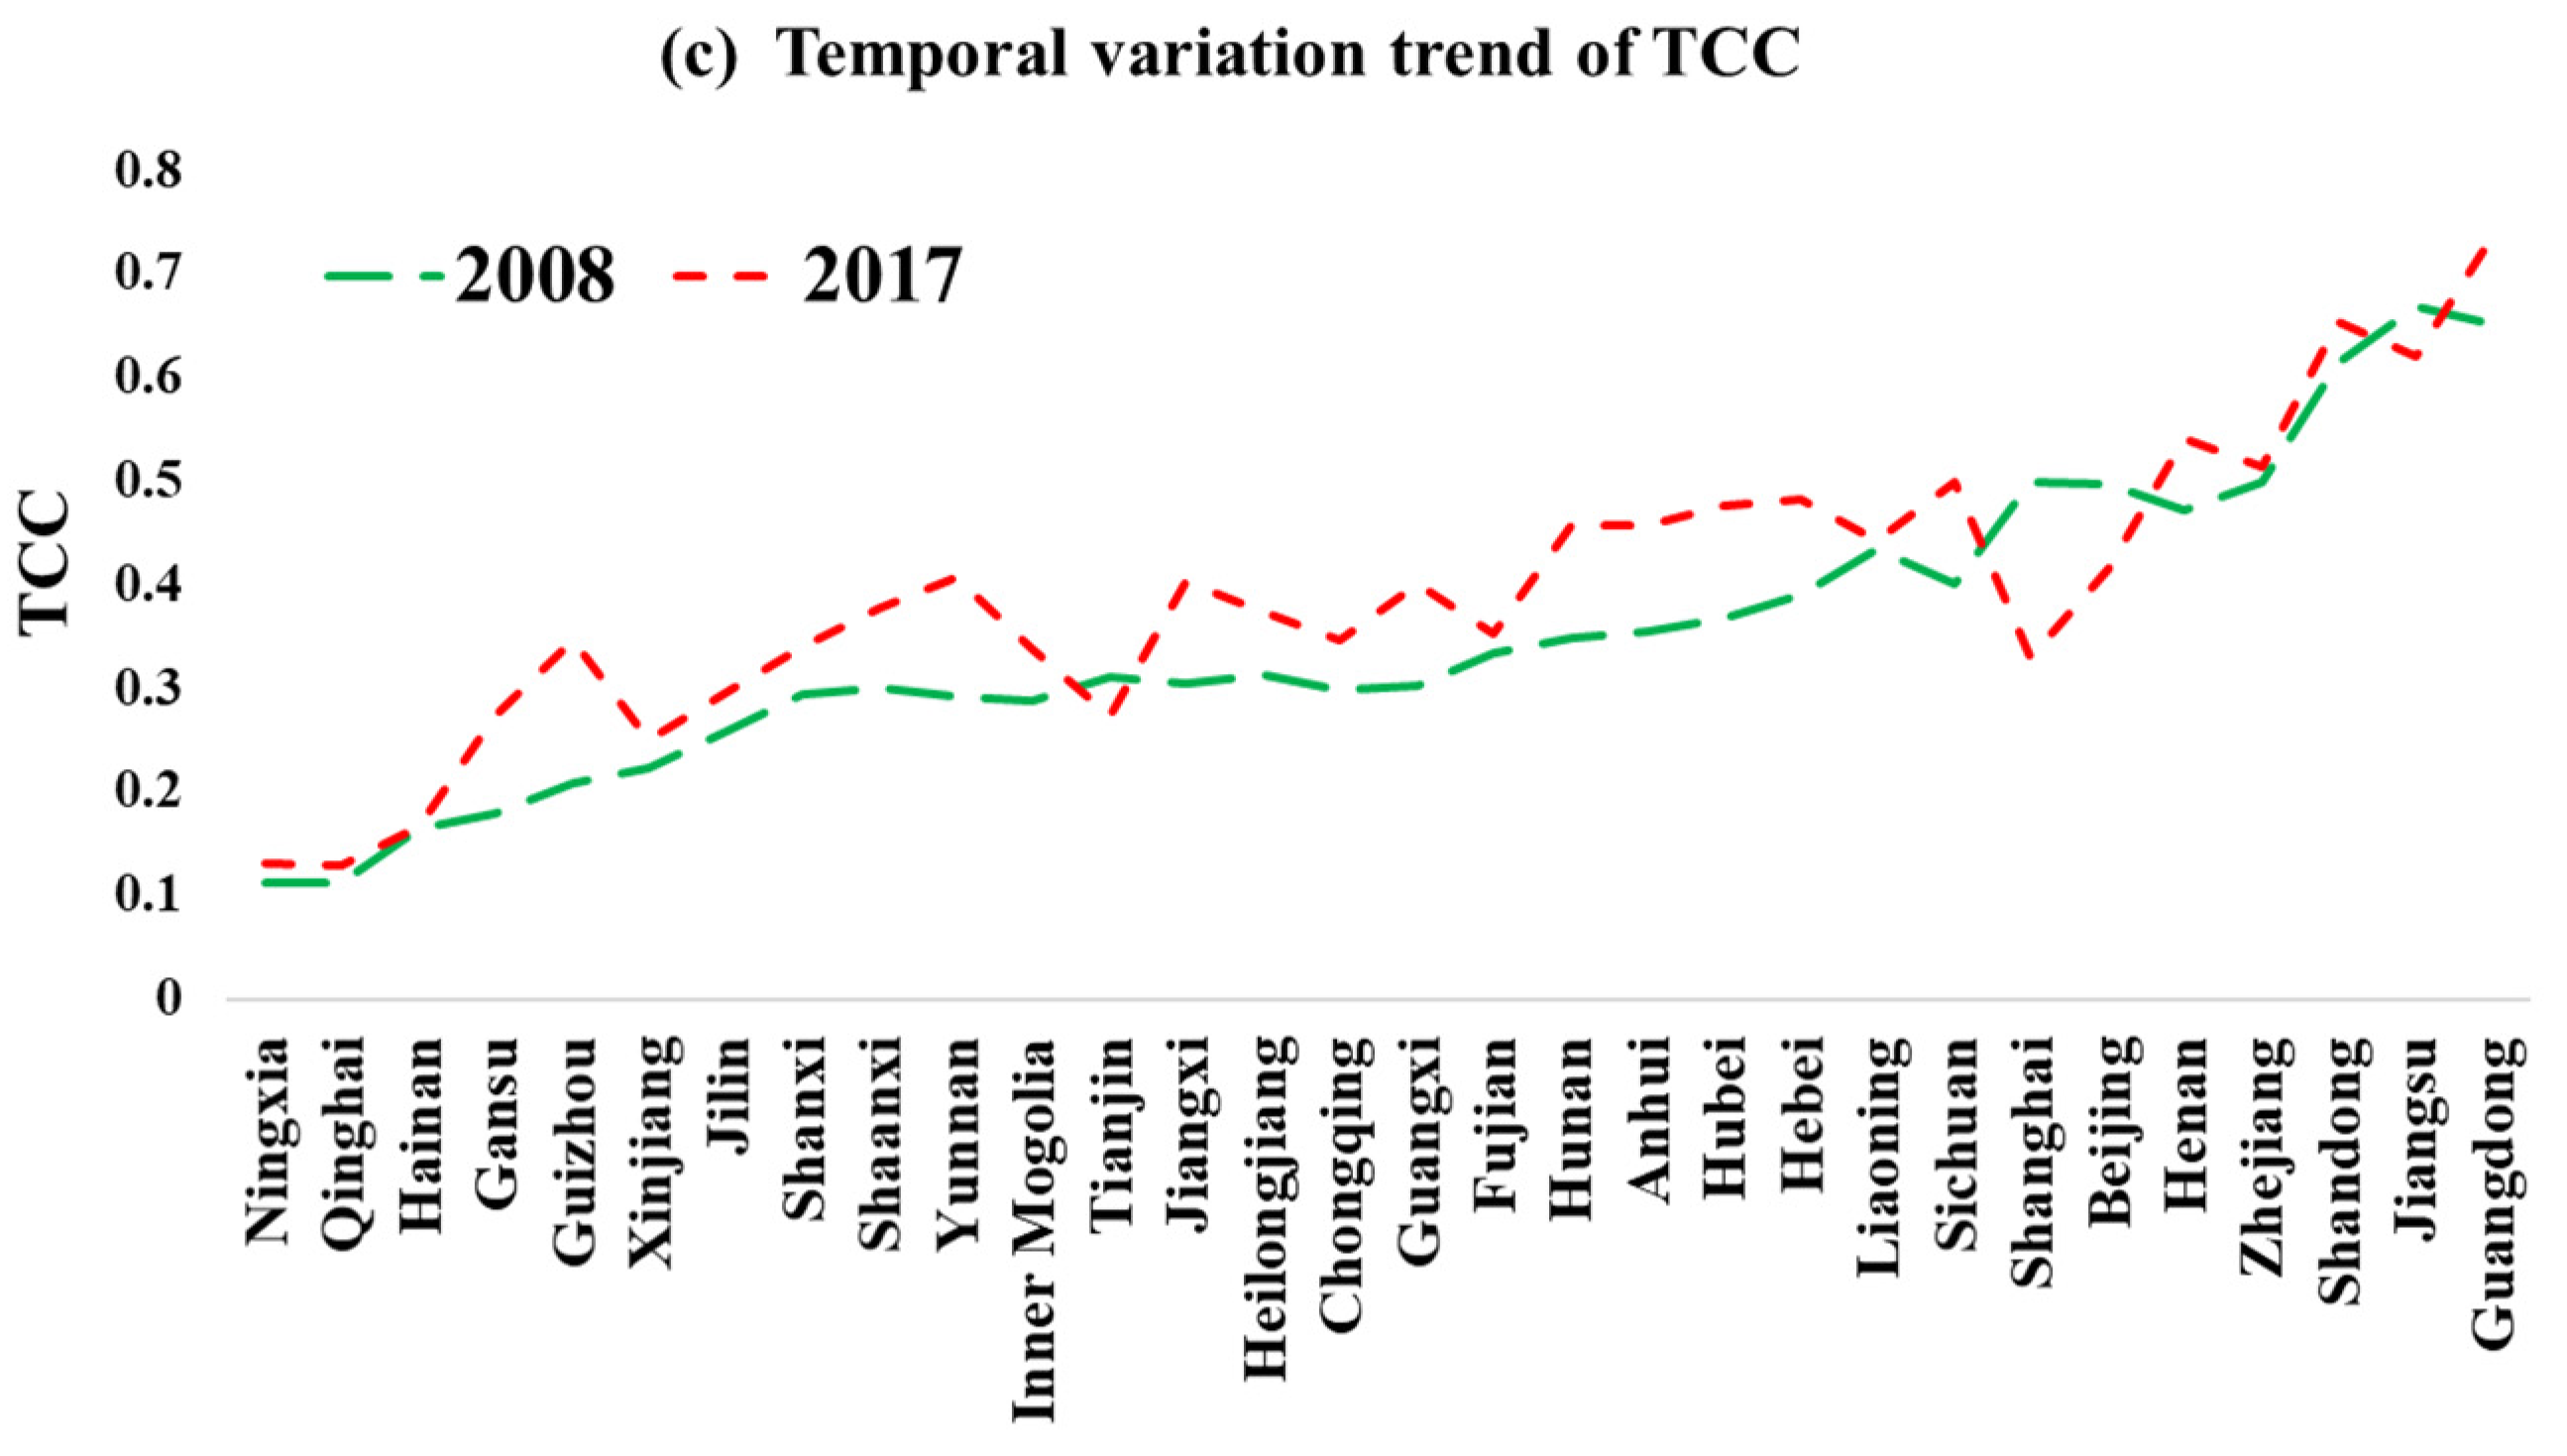
4.1.1. Analysis of the Spatio-Temporal Distribution of TCC
4.1.2. Comprehensive Evaluation of TCC for Provinces and Cities in China
4.1.3. Existence Test of the Development Trend of TCC, EFC, SCC, and ECC in Provinces and Cities in China
4.2. Analysis of the Spatio-Temporal Dynamic Evolution Characteristics of EFC–SCC–ECC for Provinces and Cities in China
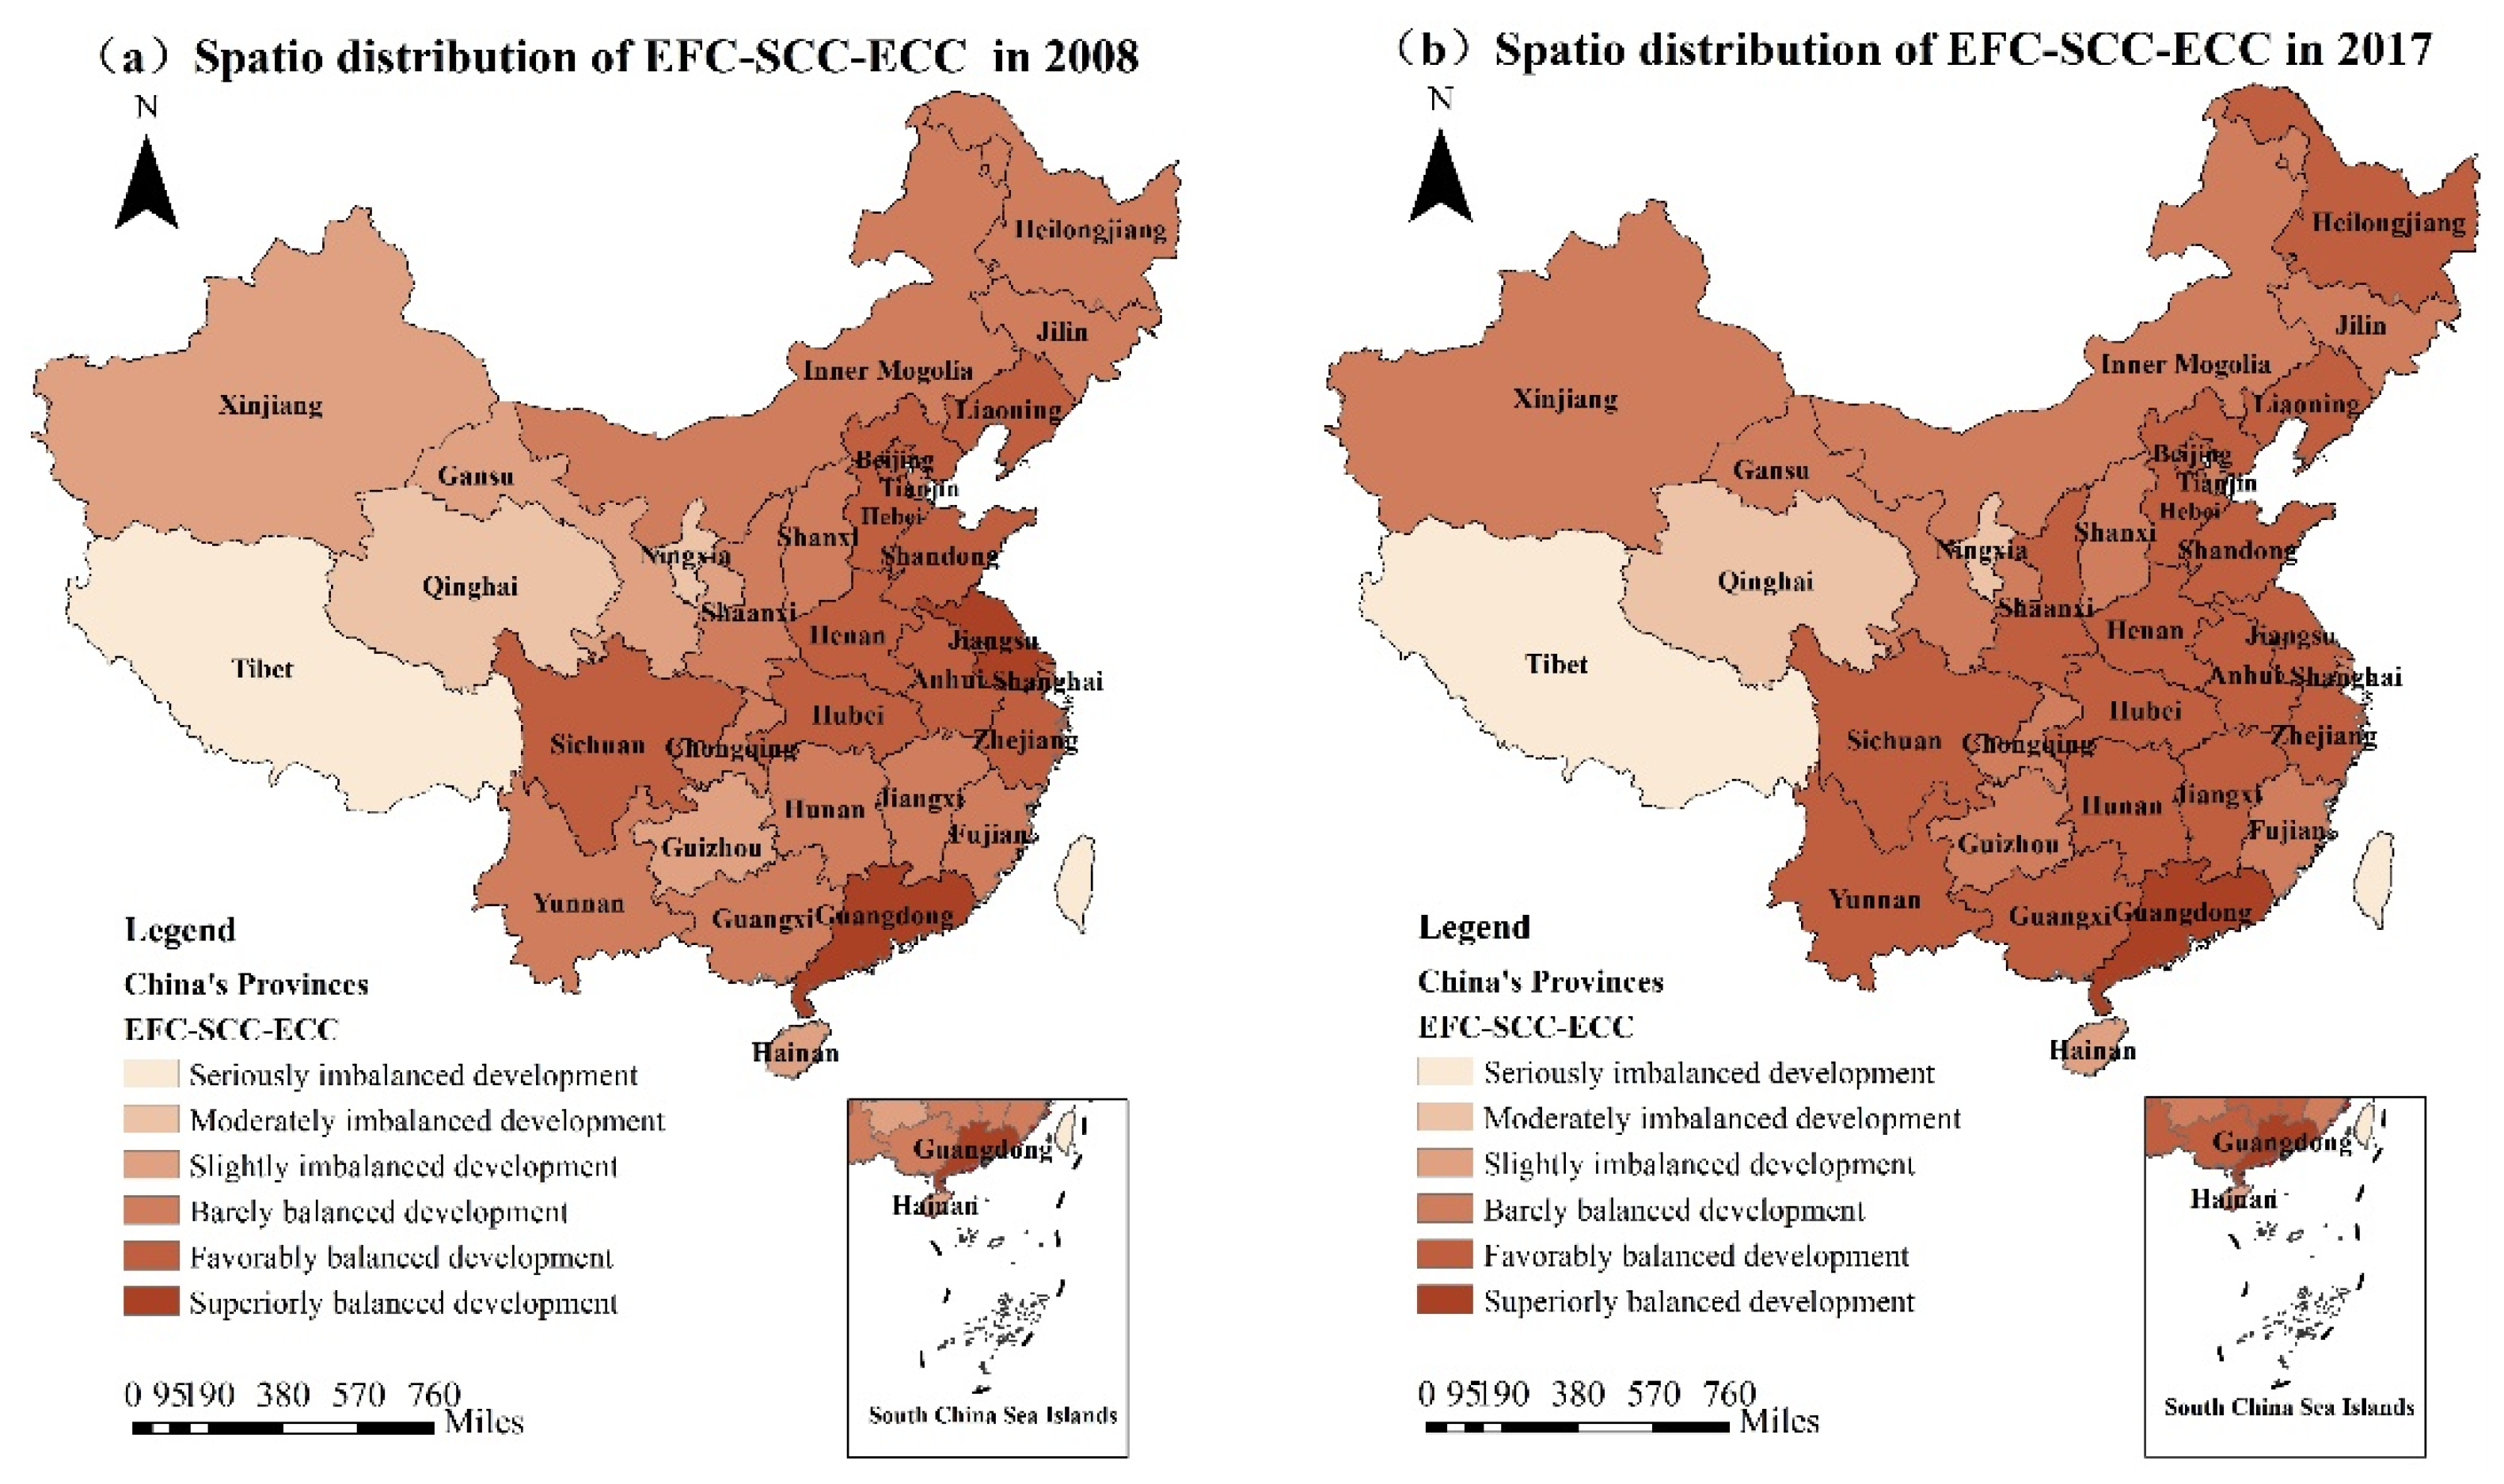
4.2.1. Analysis of the Spatio-Temporal Distribution Characteristics of EFC–SCC–ECC
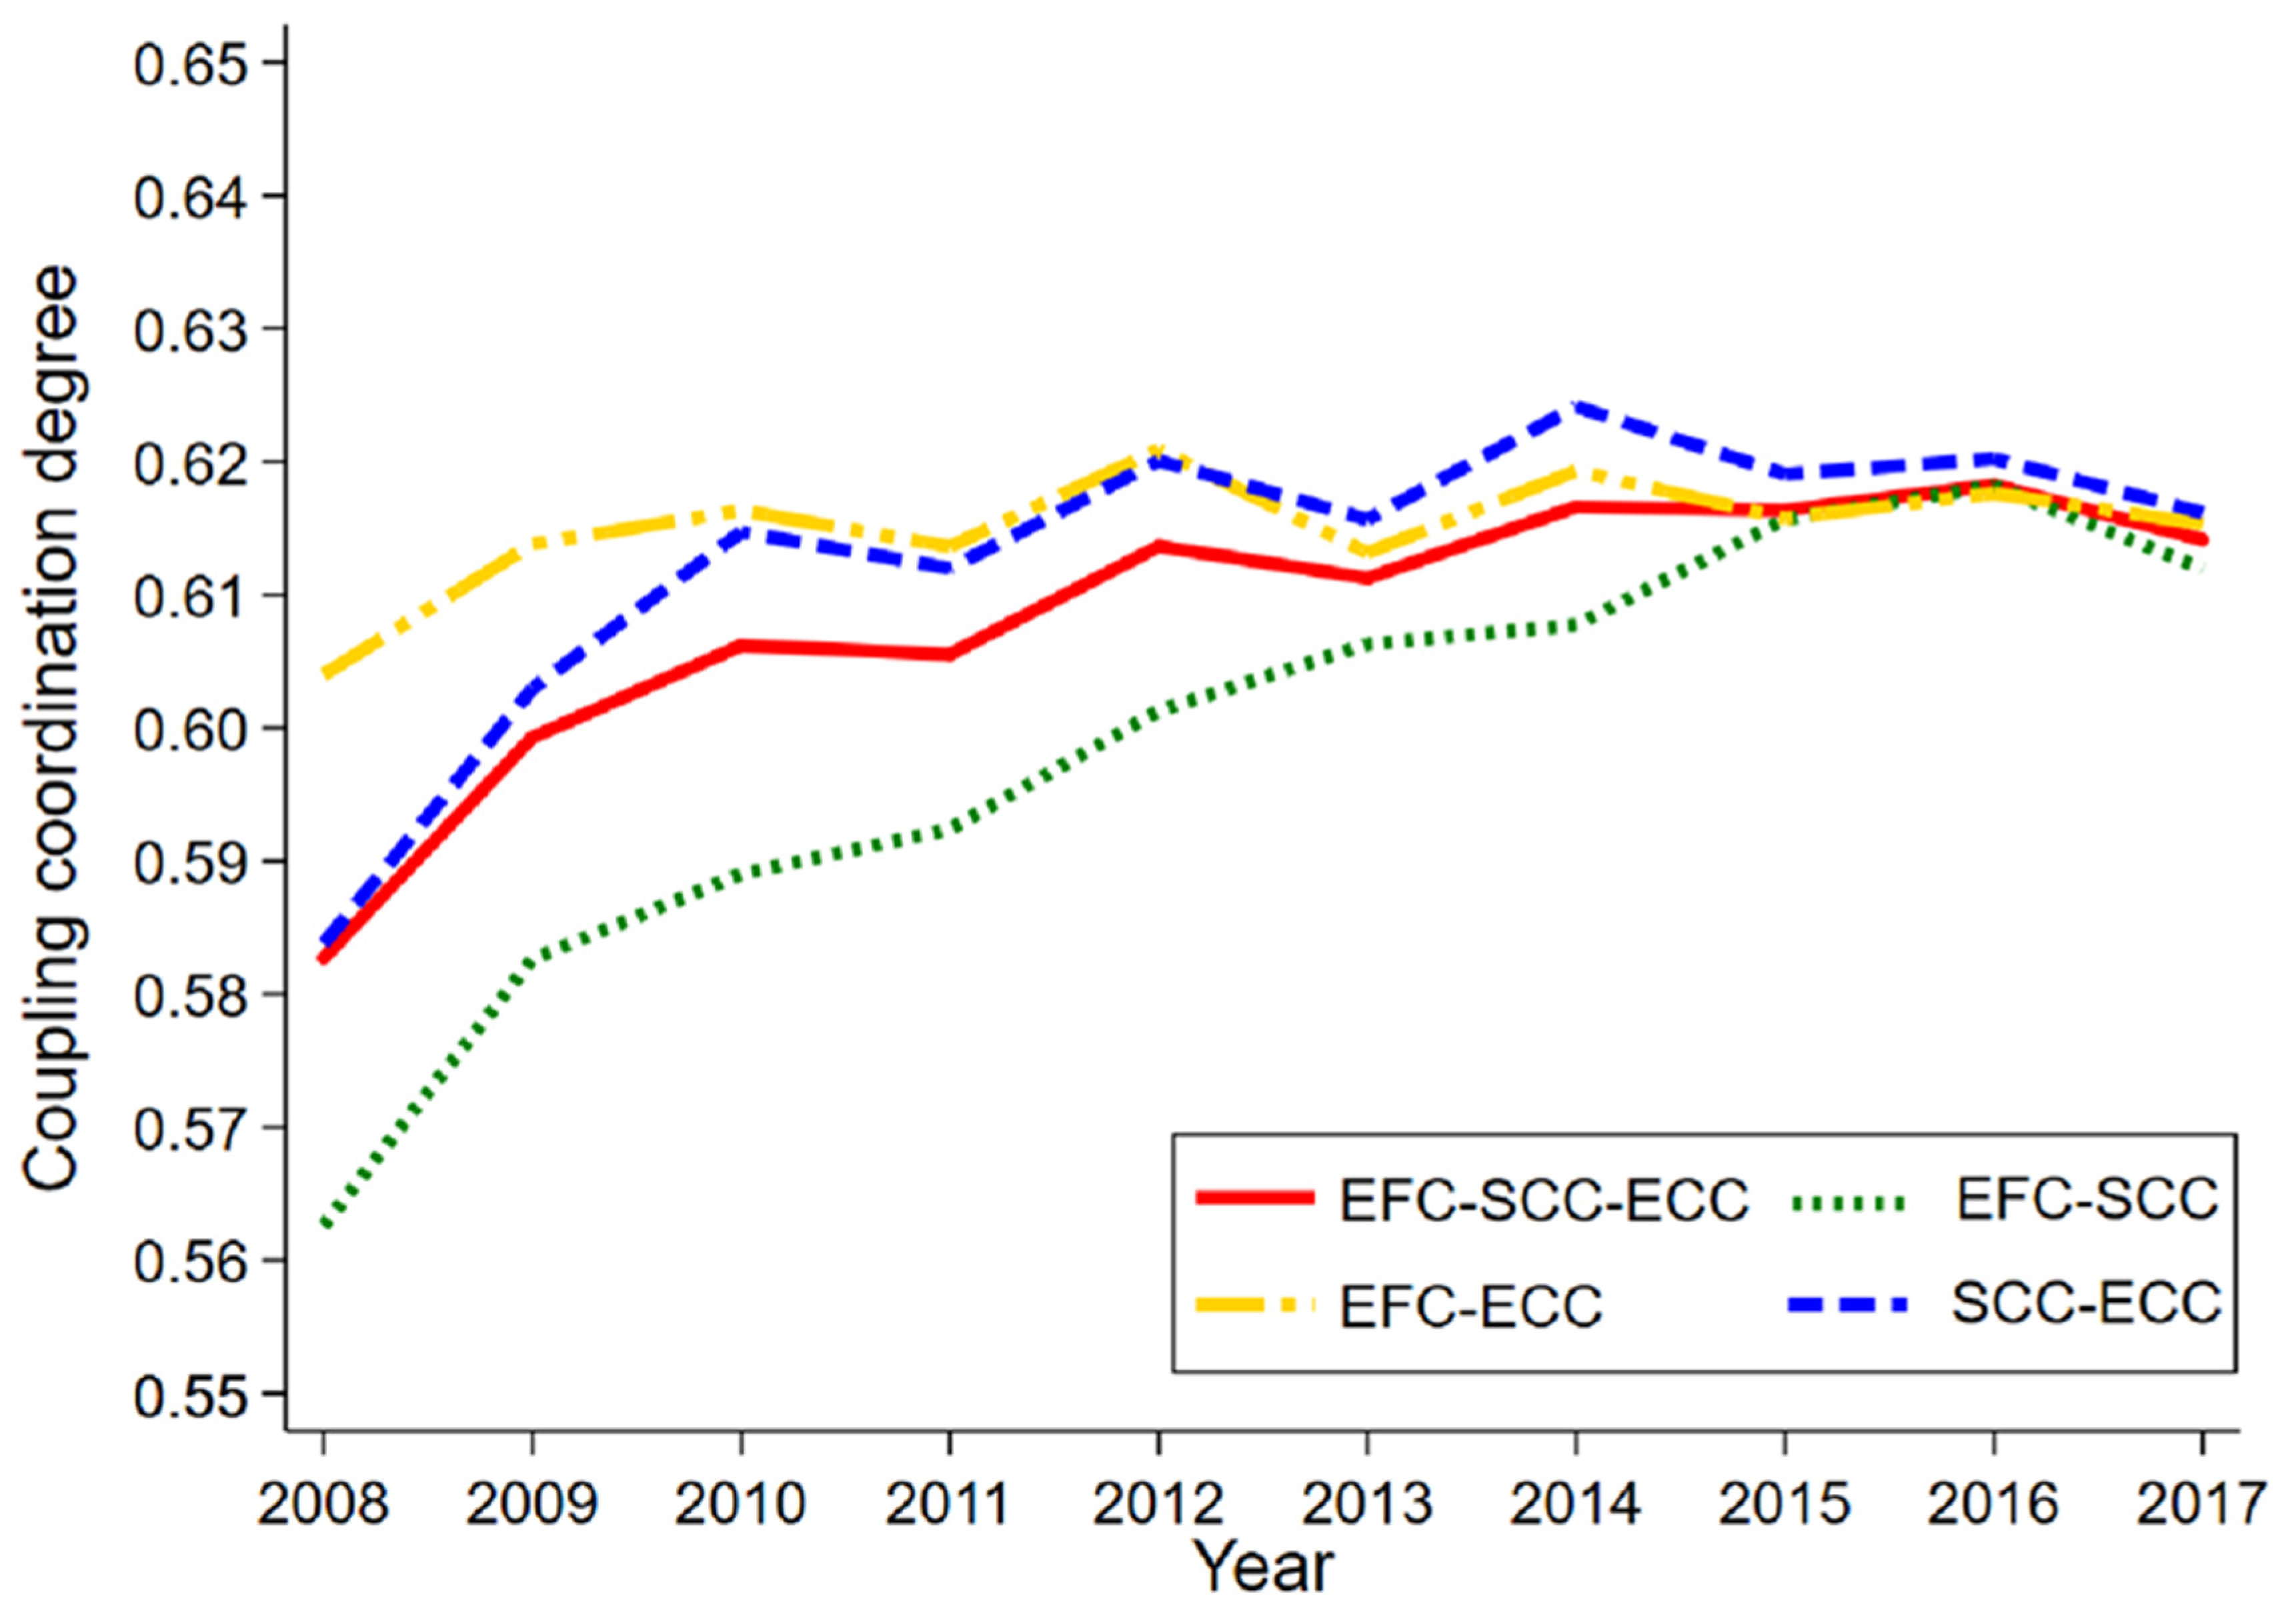
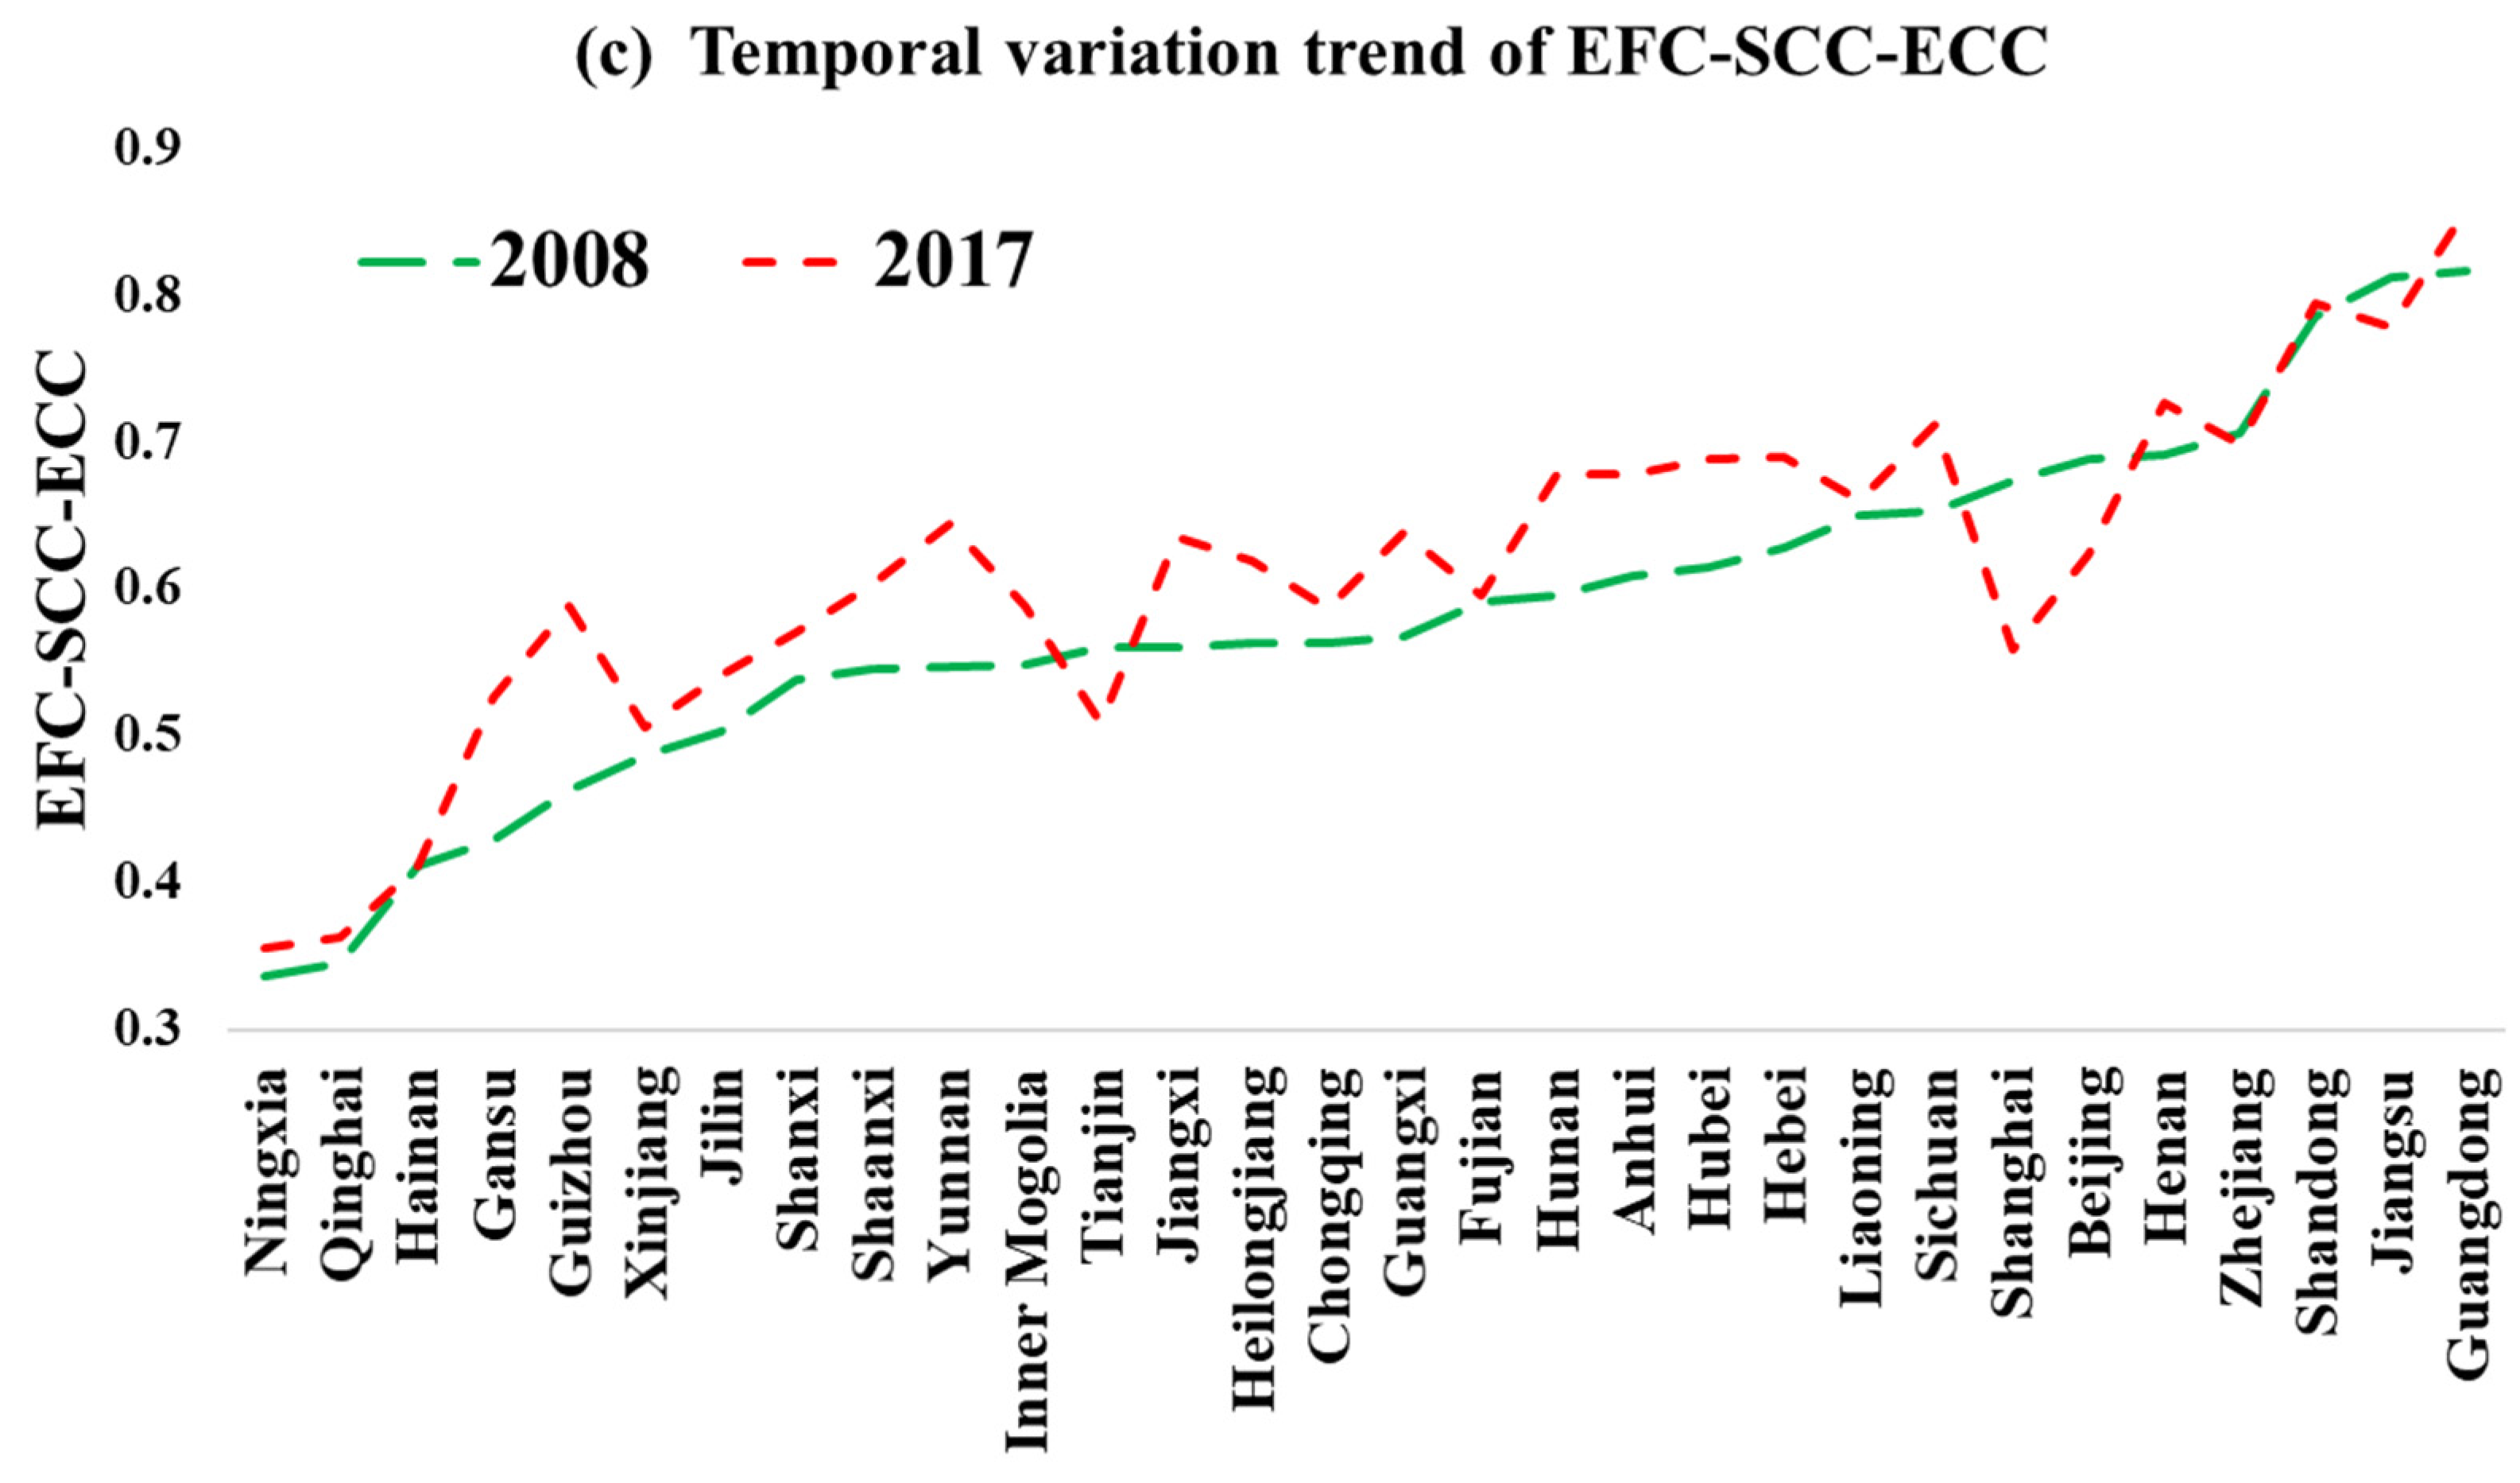
4.2.2. Comprehensive Evaluation of EFC–SCC–ECC for Provinces and Cities in China
4.2.3. Existence Test of Development Trend of EFC–SCC–ECC, EFC–SCC, EFC–ECC, and SCC–ECC in Provinces and Cities in China
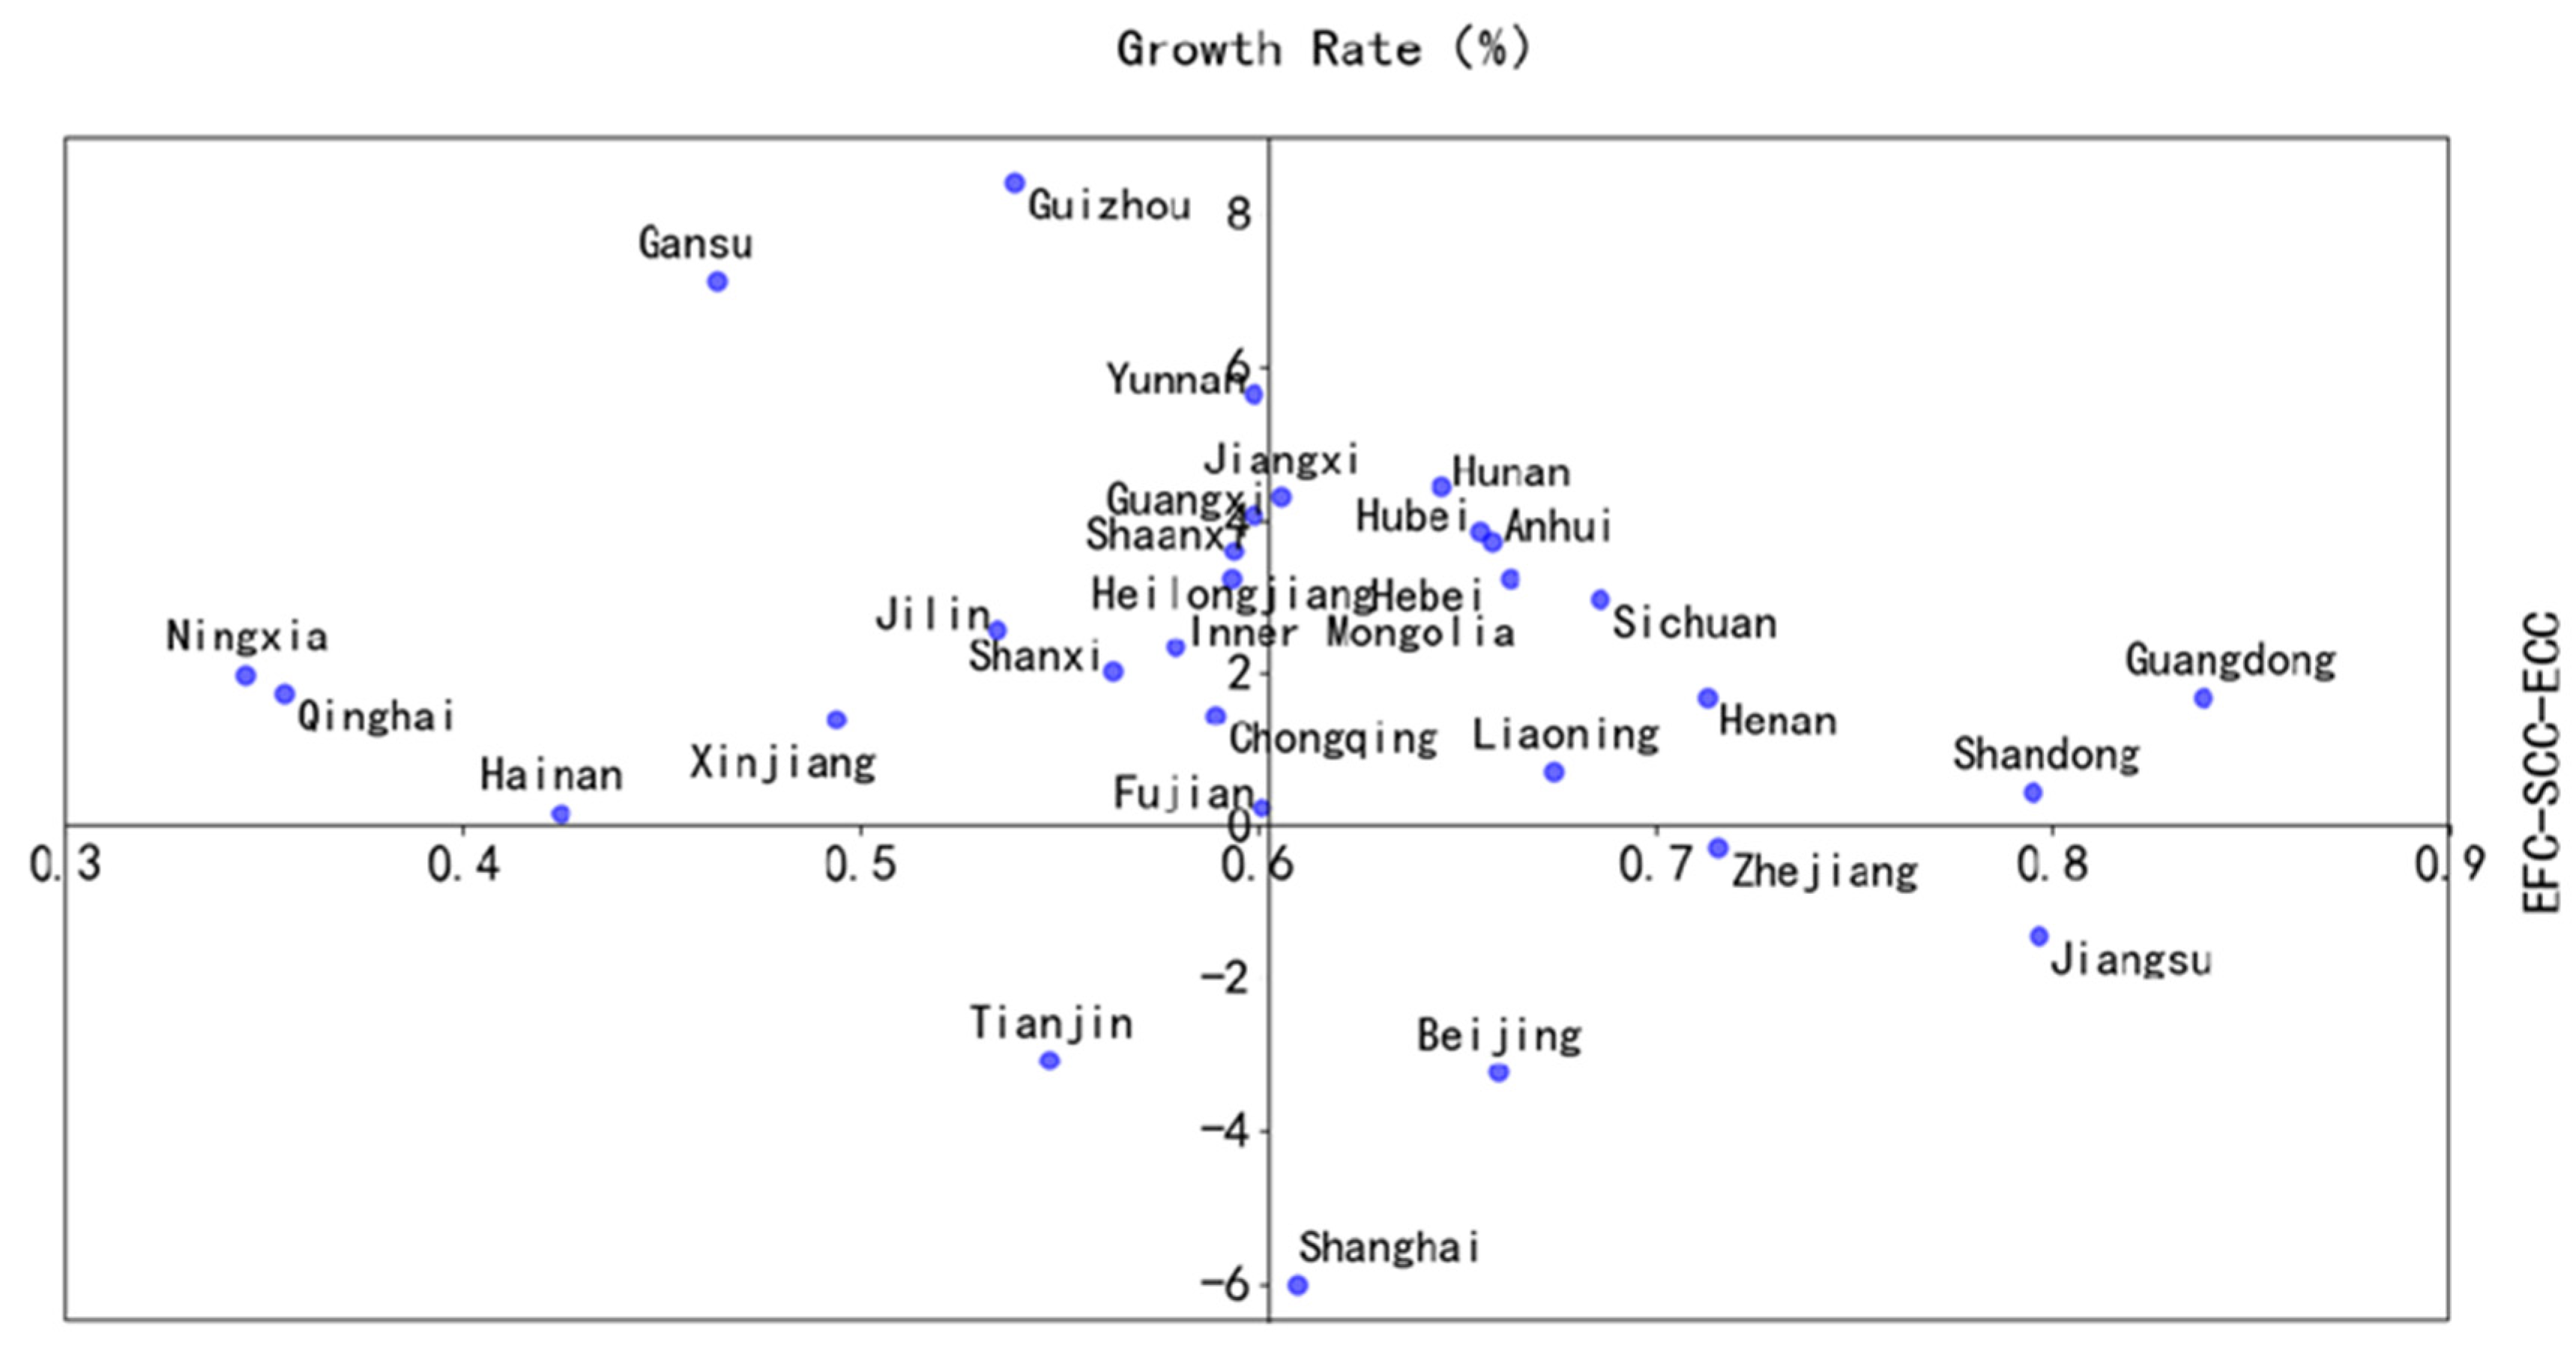
4.2.4. The Relationship between TCC and EFC–SCC–ECC
5. Discussion
6. Conclusions and Future Work
Author Contributions
Funding
Institutional Review Board Statement
Data Availability Statement
Conflicts of Interest
Appendix A
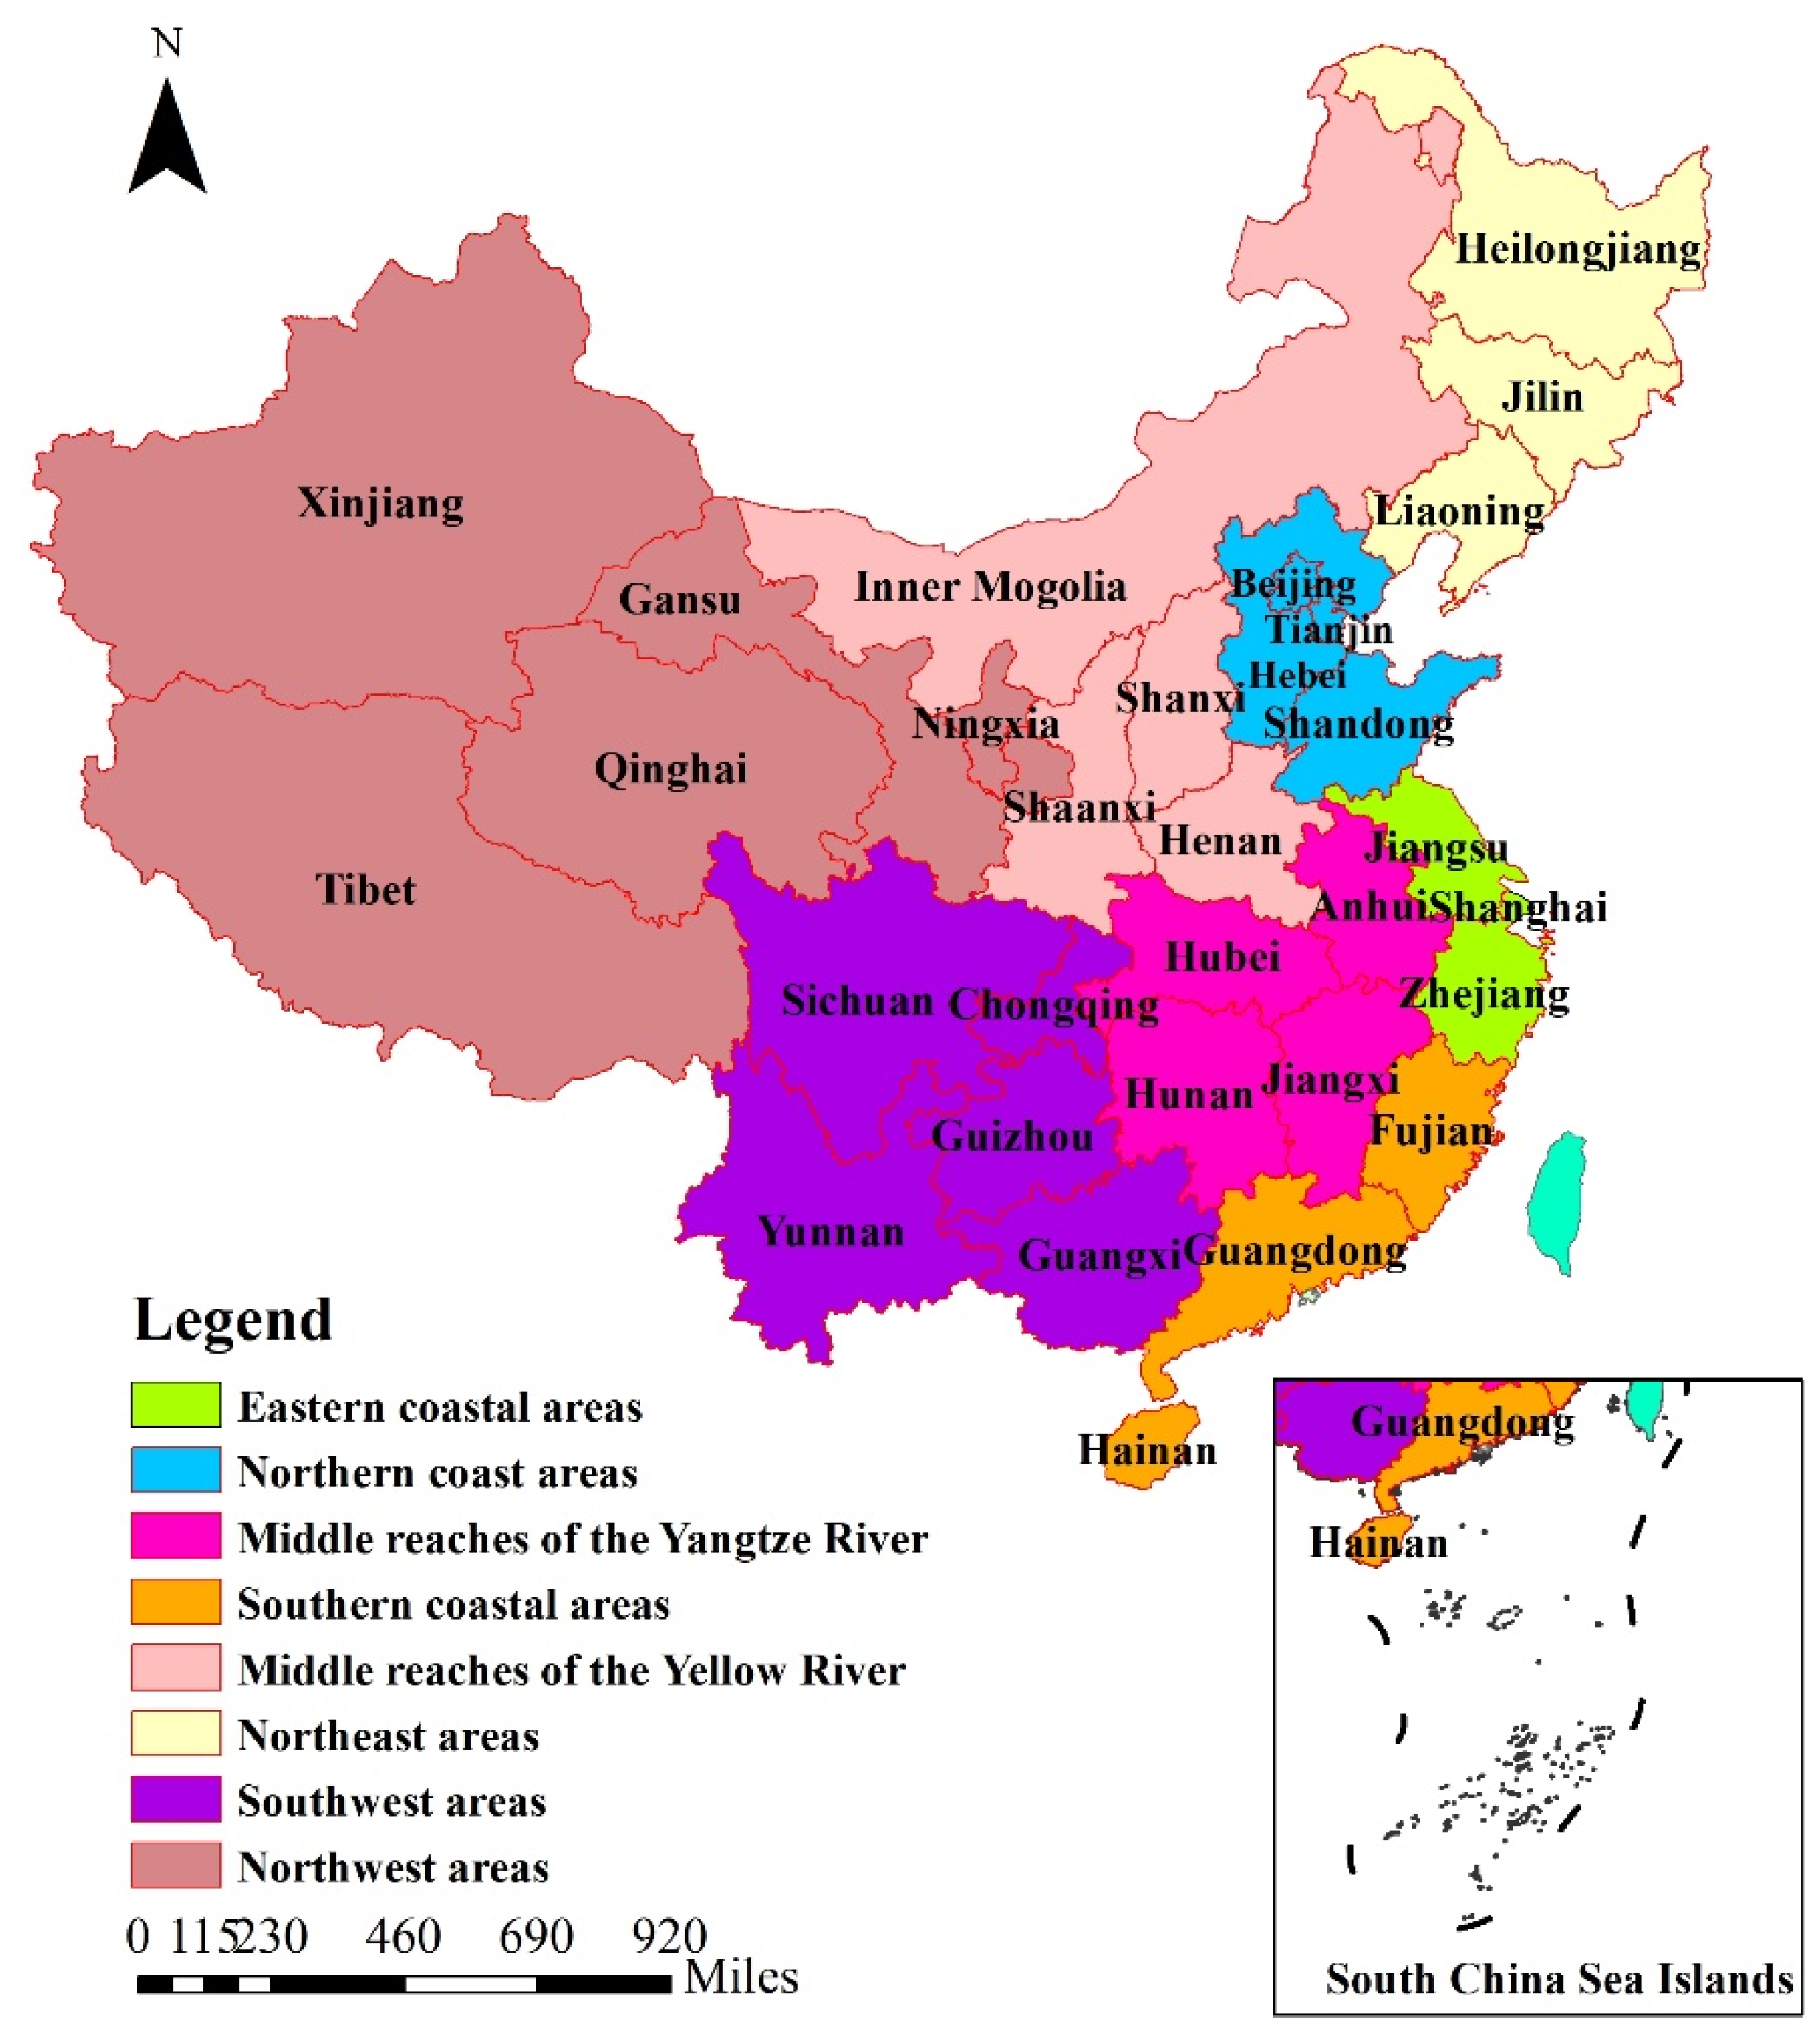
| Areas | Provinces and Cities |
|---|---|
| The Eastern coastal areas | Shanghai, Jiangsu, Zhejiang |
| The Northern coast areas | Beijing, Tianjin, Hebei, Shandong |
| The Middle reaches of the Yangtze River | Anhui, Jiangxi, Hubei, Hunan |
| The Southern coastal areas | Fujian, Guangdong, Hainan |
| The Middle reaches of the Yellow River | Shanxi, Inner Mongolia, Henan, Shaanxi |
| The Northeast areas | Liaoning, Jilin, Heilongjiang |
| The Southwest areas | Guangxi, Chongqing, Sichuan, Guizhou, Yunnan |
| The Northwest areas | Gansu, Qinghai, Ningxia, Xinjiang |
References
- Feng, X.X. All-for-one tourism: The transformation and upgrading direction of regional tourism industry. J. Soc. Sci. Res. 2017, 11, 2374–2378. [Google Scholar] [CrossRef]
- China Tourism Academy. China Domestic Tourism Development Report; China Tourism Academy: Beijing, China, 2020. [Google Scholar]
- Tang, C.F.; Tan, E.C. Does tourism effectively stimulate Malaysia’s economic growth? Tour. Manag. 2015, 46, 158–163. [Google Scholar] [CrossRef]
- Wang, J.; Huang, X.; Gong, Z.; Cao, K. Dynamic assessment of tourism carrying capacity and its impacts on tourism economic growth in urban tourism destinations in China. J. Destin. Mark. Manag. 2020, 15, 100383. [Google Scholar] [CrossRef]
- Szuster, B.; Needham, M.D.; Lesar, L.; Chen, Q. From a drone’s eye view: Indicators of overtourism in a sea, sun, and sand destination. J. Sustain. Tour. 2021, 1, 1–18. [Google Scholar] [CrossRef]
- Cheer, J.M.; Milano, C.; Novelli, M. Tourism and community resilience in the Anthropocene: Accentuating temporal overtourism. J. Sustain. Tour. 2019, 27, 554–572. [Google Scholar] [CrossRef]
- Deng, W.Z. Sociological Dictionary; Shanghai Lexicographical Publishing House: Shanghai, China, 2009. [Google Scholar]
- Mai, T.; Smith, C. Scenario-based planning for tourism development using system dynamic modelling: A case study of Cat Ba Island, Vietnam. Tour. Manag. 2018, 68, 336–354. [Google Scholar] [CrossRef]
- Tokarchuk, O.; Gabriele, R.; Maurer, O. Estimating tourism social carrying capacity. Ann. Tour. Res. 2021, 86, 102971. [Google Scholar] [CrossRef]
- Zhang, Y.; Li, X.; Su, Q.; Hu, X. Exploring a theme park’s tourism carrying capacity: A demand-side analysis. Tour. Manag. 2017, 59, 564–578. [Google Scholar] [CrossRef]
- Fu, B.J.; Liu, G.H.; Wang, X.K.; Ouyang, Z.Y. Ecological issues and risk assessment in China. Int. J. Sustain. Dev. World Ecol. 2009, 11, 143–149. [Google Scholar] [CrossRef]
- Zhou, X.H.; Chen, W.W. The impact of informatization on the relationship between the tourism industry and regional economic developmen. Sustainability 2021, 13, 9399. [Google Scholar] [CrossRef]
- Bishop, A.; Fullerton, H.; Crawford, A. Carrying Capacity in Regional Environmental Management; US Government Printing Office: Washington, DC, USA, 1974.
- Schneider, D.; Godschalk, R.D.; Axler, N. The carrying Capacity Concept as a Planning Tool; American Society of Planning Officials: Chicago, IL, USA, 1978. [Google Scholar]
- World Tourism Organization. Guidelines: Development of National Parks and Protected Areas for Tourism; Cabi: Wallingford, UK, 1992. [Google Scholar]
- McCool, S.F.; Lime, D.W. Tourism carrying capacity: Tempting fantasy or useful reality? J. Sustain. Tour. 2001, 9, 372–388. [Google Scholar] [CrossRef]
- Zelenka, J.; Kacetl, J. The concept of carrying capacity in tourism. Amfiteatru Econ. 2014, 16, 641–654. [Google Scholar]
- De Sousa, R.C.; Pereira, L.C.C. Tourism carrying capacity on estuarine beaches in the Brazilian Amazon region. J. Coast. Res. 2014, 70, 545–550. [Google Scholar] [CrossRef]
- Gasparini, M.L. Sustainable Tourism Indicators as Policy Making Tools: Lessons from ETIS Implementation at Destination Level. Master’s Thesis, University of Bologna, Bologna, Italy, 2018. [Google Scholar] [CrossRef]
- Li, L.; Tashi, Y.Z.; Dongru, D.; Champa, O.; Zeng, L. Study on tourist carrying capacity of Namco Scenic spot in Tibet. Tibet Sci. Technol. 2018, 5, 30–36. [Google Scholar]
- Saveriades, A. Establishing the social tourism carrying capacity for the tourist resorts of the east coast of the Republic of Cyprus. Tour. Manag. 2000, 21, 147–156. [Google Scholar] [CrossRef]
- Ye, F.; Park, J.; Wang, F.; Hu, X.H. Analysis of early warning spatial and temporal differences of tourism carrying capacity in China’s island cities. Sustainability 2020, 12, 1328. [Google Scholar] [CrossRef]
- Yang, X.P.; Weng, G.M.; Lin, J.; Hou, Y.J. Optimization of tourism environment carrying capacity in coastal cities: A case study of Qinhuangdao city. Geogr. Geo-Inf. Sci. 2019, 35, 134–140. [Google Scholar]
- Zhao, Y.; Jiao, L. Resources development and tourism environmental carrying capacity of ecotourism industry in Pingdingshan City, China. Ecol. Process. 2019, 8, 1–6. [Google Scholar] [CrossRef]
- Wang, Y.; Li, J.; Zhang, M. Evaluation of tourism environmental carrying capacity in Diaoshuihu National Forest Park. Int. J. Sustain. Dev. Plan. 2020, 15, 761–766. [Google Scholar] [CrossRef]
- Liao, K.C.; Yue, M.Y.; Sun, S.W.; Xue, H.B. An evaluation of coupling coordination between tourism and finance. Sustainability 2018, 10, 2320. [Google Scholar] [CrossRef]
- Liu, J.; Zhao, Y.C.; Jang, S.C. Environmental perceptions and willingness to pay for preservation: Evidence from beach destinations in China. Int. J. Tour. Res. 2021, 23, 792–804. [Google Scholar] [CrossRef]
- Zhang, F.T.; Sun, C.C.; An, Y.Z.; Luo, Y.G. Coupling coordination and obstacle factors between tourism and the ecological environment in Chongqing, China: A multi-model comparison. Asia Pac. J. Tour. Res. 2021, 26, 811–828. [Google Scholar] [CrossRef]
- Lai, Z.; Ge, D.; Xia, H.; Yue, Y.; Wang, Z. Coupling coordination between environment, economy and tourism: A case study of China. PLoS ONE 2020, 15, e0228426. [Google Scholar] [CrossRef] [PubMed]
- Xie, X.; Sun, H.; Gao, J.; Chen, F.F.; Zhou, C.S. Spatiotemporal differentiation of coupling and coordination relationship of tourism–urbanization–ecological environment system in China’s major tourist cities. Sustainability 2021, 13, 5867. [Google Scholar] [CrossRef]
- Yang, Y.; Wang, R.; Tan, J.L.; Calvo-Rolle, J.L. Coupling coordination and prediction research of tourism industry development and ecological environment in china. Discret. Dyn. Nat. Soc. 2021, 2021, 1–15. [Google Scholar] [CrossRef]
- Yang, X.P.; Weng, G.M.; Mei, Z.X. Evaluation on tourism environment bearing potential of provincial areas. Stat. Decis. 2019, 35, 44–48. [Google Scholar]
- He, H.; Shen, L.; Wong, S.W.; Cheng, G.; Shu, T. A “load-carrier” perspective approach for assessing tourism resource carrying capacity. Tour. Manag. 2023, 94, 104651. [Google Scholar] [CrossRef]
- Leka, A.; Lagarias, A.; Panagiotopoulou, M.; Stratigea, A. Development of a Tourism Carrying Capacity Index (TCCI) for sustainable management of coastal areas in Mediterranean islands–Case study Naxos, Greece. Ocean Coast. Manag. 2022, 216, 105978. [Google Scholar] [CrossRef]
- Xiao, Y.; Tang, X.; Wang, J.; Huang, H.; Liu, L. Assessment of coordinated development between tourism development and resource environment carrying capacity: A case study of Yangtze River economic Belt in China. Ecol. Indic. 2022, 141, 109125. [Google Scholar] [CrossRef]
- Li, S.J.; Wang, T.; Gao, N. A study of the evolution characteristics of tourism development quality in coastal cities of China. Rev. Econ. Manag. 2019, 35, 147–160. [Google Scholar]
- Wei, C.; Wang, Z.; Lan, X.; Zhang, H.; Fan, M. The spatial-temporal characteristics and dilemmas of sustainable urbanization in China: A new perspective based on the concept of five-in-one. Sustainability 2018, 10, 4733. [Google Scholar] [CrossRef]
- He, X.; Sheng, J. New evaluation system for the modernization level of a province or a city based on an improved entropy method. Environ. Monit Assess 2019, 192, 7. [Google Scholar] [CrossRef] [PubMed]
- Xia, X.; Lin, K.; Ding, Y.; Dong, X.; Sun, H.; Hu, B. Research on the coupling coordination relationships between urban function mixing degree and urbanization development level based on information Entropy. Int. J. Environ. Res. Public Health 2020, 18, 242. [Google Scholar] [CrossRef] [PubMed]
- Liu, H.; You, J.; You, X.; Shan, M. A novel approach for failure mode and effects analysis using combination weighting and fuzzy VIKOR method. Appl. Soft Comput. 2015, 28, 579–588. [Google Scholar] [CrossRef]
- Wang, M. A comprehensive analysis method on determining the coefficients in multiindex evaluation. Syst. Eng. 1999, 17, 56–61. [Google Scholar]
- Xu, D.; Hou, G. The spatiotemporal coupling characteristics of regional urbanization and its influencing factors: Taking the Yangtze River Delta as an example. Sustainability 2019, 11, 822. [Google Scholar] [CrossRef]
- Tang, Z. An integrated approach to evaluating the coupling coordination between tourism and the environment. Tour. Manag. 2015, 46, 11–19. [Google Scholar] [CrossRef]
- Chen, J.; Lian, X.; Su, H.; Zhang, Z.; Ma, X.; Chang, B. Analysis of China’s carbon emission driving factors based on the perspective of eight major economic regions. Environ. Sci. Pollut. Res. 2021, 28, 8181–8204. [Google Scholar] [CrossRef]
- Wang, S.; Zhang, Y.; Wen, H. Comprehensive measurement and regional imbalance of China’s green development performance. Sustainability 2021, 13, 1409. [Google Scholar] [CrossRef]
- Zhao, Y.; Wang, S.; Ge, Y.; Liu, Q.; Liu, X. The spatial differentiation of the coupling relationship between urbanization and the eco-environment in countries globally: A comprehensive assessment. Ecol. Model. 2017, 360, 313–327. [Google Scholar] [CrossRef]
- Hengky, S.H. Probing coastal eco-tourism in Pasir Putih Beach, Indonesia. Macrothink Inst. 2017, 5, 1–11. [Google Scholar] [CrossRef][Green Version]
| First-Class Indicator | Second-Class Indicator | Third-Class Indicator | IA | References | |
|---|---|---|---|---|---|
| EFC | Infrastructure status | Length of highways (km) | + | 0.17 | [4,32,33] |
| Total number of travel agencies (unit) | + | 0.19 | [4,22,23,32] | ||
| Amount of water supply (10,000 m3) | + | 0.24 | [4,22,23] | ||
| Number of taxis (10,000 units) | + | 0.19 | [22,32] | ||
| Number of road-operating car ownership (10,000 units) | + | 0.21 | [32] | ||
| Economic pressure indicator | Water consumption per 10,000 yuan of GDP (m3/10,000 yuan) | - | 0.33 | [34,35] | |
| Energy consumption per 10,000 yuan of GDP (tons of SCE) | - | 0.67 | [35] | ||
| Social economic development | Tourism revenue as a percentage of local GDP (%) | + | 0.22 | [22] | |
| Foreign exchange earnings from tourism (USD 10,000 million) | + | 0.62 | [33] | ||
| Natural population growth rate (%) | - | 0.16 | [35] | ||
| SCC | Harmony | Urbanization level (%) | + | 0.20 | [23,32] |
| Unemployment rate (%) | - | 0.17 | [35] | ||
| Possession of civil motor vehicles (10,000 units) | + | 0.23 | [22] | ||
| Passenger-kilometers (100 million passenger-km) | + | 0.22 | [33] | ||
| Number of hospital beds (unit) | + | 0.19 | [22,32] | ||
| Residents psychological | Ratio of tourists to residents (%) | - | 0.70 | [22,23,32,33] | |
| Resident Engel’s coefficient (%) | - | 0.30 | [35] | ||
| Social cultural atmosphere | Number of students enrolled in universities (persons) | + | 0.52 | [20,23] | |
| Number of cultural and art institutions (unit) | + | 0.48 | [32] | ||
| ECC | Ecological environment quality | Volume of garbage disposal (10,000 tons) | + | 0.54 | [4,23,36] |
| Waste water treatment rate (%) | + | 0.46 | [4,22,23,33,36] | ||
| State of natural resources | Total amount of water resources (m3) | + | 0.24 | [23,36] | |
| Green coverage area (hectare) | + | 0.19 | [4,33] | ||
| Area of parks and green land (hectare) | + | 0.21 | [23,32] | ||
| Cultivated land (hectare) | + | 0.18 | [23] | ||
| Land for construction (hectare) | + | 0.18 | [4,32] |
| Classification | |
|---|---|
| Superiorly balanced development | |
| Favorably balanced development | |
| Barely balanced development | |
| Slightly imbalanced development | |
| Moderately imbalanced development | |
| Seriously imbalanced development |
| Provinces (Cities) | TCC | EFC | SCC | ECC | |||||
|---|---|---|---|---|---|---|---|---|---|
| Z | Rho | Z | Rho | Z | Rho | Z | Rho | ||
| Entirety | 3.399 ** | 0.927 ** | 2.862 ** | 0.891 ** | 3.220 ** | 0.915 ** | −0.894 | −0.236 | |
| Eastern coastal areas | Shanghai | −3.936 ** | −1.000 ** | −3.757 ** | −0.988 ** | −2.862 ** | −0.855 ** | −2.147 * | −0.661 * |
| Jiangsu | −2.326 * | −0.794 ** | −1.073 | −0.588 | −1.252 | −0.406 | −3.041 ** | −0.903 ** | |
| Zhejiang | 0.358 | 0.127 | −0.179 | −0.152 | 2.504 * | 0.745 * | −2.326 * | −0.745 * | |
| Northern coast areas | Beijing | −3.220 ** | −0.952 ** | −3.757 ** | −0.988 ** | 0.179 | 0.079 | −2.683 ** | −0.855 ** |
| Tianjin | −1.968 * | −0.648 * | 1.610 | 0.576 | 1.431 | 0.430 | −3.041 ** | −0.903 ** | |
| Hebei | 3.757 ** | 0.988 ** | 3.757 ** | 0.988 ** | 2.326 * | 0.794 ** | 0.358 | 0.055 | |
| Shandong | −0.894 | −0.212 | 0.179 | 0.067 | 1.431 | 0.430 | −3.220 ** | −0.939 ** | |
| Middle reaches of the Yangt -ze River | Anhui | 3.399 ** | 0.927 ** | 3.220 ** | 0.939 ** | 3.220 ** | 0.915 ** | 1.610 | 0.576 |
| Jiangxi | 3.041 ** | 0.915 ** | 3.578 ** | 0.976 ** | 3.578 ** | 0.964 ** | 0.000 | 0.055 | |
| Hubei | 3.399 ** | 0.952 ** | 3.578 ** | 0.964 ** | 3.041 ** | 0.903 ** | 2.862 ** | 0.879 ** | |
| Hunan | 3.399 ** | 0.952 ** | 3.220 ** | 0.939 ** | 3.220 ** | 0.939 ** | 2.504 * | 0.794 ** | |
| Southern coastal areas | Fujian | 1.968 * | 0.564 | 2.504 * | 0.818 ** | 2.683 ** | 0.830 ** | −0.716 | −0.273 |
| Guangdong | 3.220 ** | 0.939 ** | −0.537 | −0.236 | 2.683 ** | 0.867 ** | 2.147 * | 0.770 * | |
| Hainan | 0.000 | 0.018 | 0.179 | 0.042 | 1.610 | 0.527 | −1.431 | −0.564 | |
| Middle reaches of the Yellow River | Shanxi | 3.041 ** | 0.867 ** | 2.683 ** | 0.806 ** | 3.220 ** | 0.879 ** | −1.073 | −0.321 |
| Inner Mongolia | 2.326 * | 0.782 * | 2.683 ** | 0.855** | 0.000 | −0.030 | 0.537 | 0.261 | |
| Henan | 2.147 * | 0.758 * | 0.894 | 0.273 | 3.399 ** | 0.952 ** | −1.252 | −0.479 | |
| Shaanxi | 2.504 * | 0.770 * | 3.757 ** | 0.988 ** | 3.220 ** | 0.879 ** | −0.358 | −0.091 | |
| Northeast areas | Liaoning | 0.179 | 0.091 | −1.968 * | −0.697 * | 1.252 | 0.406 | −0.358 | 0.055 |
| Jilin | 2.683 ** | 0.733 * | 3.220 ** | 0.927 ** | 1.968 * | 0.661 * | 1.252 | 0.394 | |
| Heilongjiang | 1.968 * | 0.709 * | 1.968 * | 0.673 * | −0.179 | −0.176 | 1.789 | 0.697 * | |
| Southwest areas | Guangxi | 3.399 ** | 0.952 ** | 3.578 ** | 0.976 ** | 3.757 ** | 0.988 ** | 0.716 | 0.248 |
| Chongqing | 2.504 * | 0.770 * | 3.041 ** | 0.903 ** | 3.041 ** | 0.867 ** | −2.862 ** | −0.891 ** | |
| Sichuan | 3.578 ** | 0.976 ** | 3.041 ** | 0.927 ** | 3.041 ** | 0.903 ** | 1.431 | 0.576 | |
| Guizhou | 3.757 ** | 0.988 ** | 3.399 ** | 0.939 ** | 3.578 ** | 0.976 ** | 0.358 | 0.224 | |
| Yunnan | 3.757 ** | 0.988 ** | 3.578 ** | 0.964 ** | 3.757 ** | 0.988 ** | −1.789 | −0.612 | |
| Northwest areas | Gansu | 3.578 ** | 0.964 ** | 3.757 ** | 0.988 ** | 3.041 ** | 0.891 ** | 1.610 | 0.539 |
| Qinghai | 2.147 * | 0.697 * | 1.789 | 0.539 | 3.041 ** | 0.891 ** | −1.431 | −0.648 * | |
| Ningxia | 1.789 | 0.564 | 3.578 ** | 0.976 ** | 1.252 | 0.333 | 0.000 | −0.055 | |
| Xinjiang | 1.431 | 0.539 | 1.431 | 0.467 | 0.716 | 0.309 | −1.252 | −0.479 | |
| Provinces (Cities) | EFC–SCC–ECC | EFC–SCC | EFC–ECC | SCC–ECC | |||||
|---|---|---|---|---|---|---|---|---|---|
| Z | Rho | Z | Rho | Z | Rho | Z | Rho | ||
| Entirety | 2.862 ** | 0.891 ** | 3.578 ** | 0.964 ** | 0.894 | 0.418 | 2.326 * | 0.770 * | |
| Eastern coastal areas | Shanghai | −3.578 ** | −0.976 ** | −3.399 ** | −0.952 ** | −2.683 ** | −0.818 ** | −3.220 ** | −0.915 ** |
| Jiangsu | −2.862 ** | −0.842 ** | −1.073 | −0.455 | −2.326 * | −0.806 ** | −3.220 ** | −0.927 ** | |
| Zhejiang | −0.179 | −0.103 | 1.431 | 0.309 | −2.326 * | −0.770 * | −0.358 | −0.042 | |
| Northern coast areas | Beijing | −3.220 ** | −0.939 ** | −2.862 ** | −0.891 ** | −3.041 ** | −0.927 ** | −2.862 ** | −0.915 ** |
| Tianjin | −2.683 ** | −0.830 ** | 2.326 * | 0.697 * | −3.578 ** | −0.976 ** | −2.683 ** | −0.830 ** | |
| Hebei | 3.578 ** | 0.976 ** | 3.936 ** | 1.000 ** | 2.683 ** | 0.842 ** | 1.789 | 0.636 | |
| Shandong | −1.610 | −0.382 | 0.716 | 0.273 | −2.504 * | −0.770 * | −1.431 | −0.358 | |
| Middle reaches of the Yangt -ze River | Anhui | 3.041 ** | 0.903 ** | 3.578 ** | 0.964 ** | 2.326 * | 0.770 * | 2.504 * | 0.782 * |
| Jiangxi | 3.041 ** | 0.903 ** | 3.578 ** | 0.964 ** | 2.147 * | 0.733 * | 2.326 * | 0.782 * | |
| Hubei | 3.578 ** | 0.976 ** | 3.220 ** | 0.915 ** | 3.399 ** | 0.952 ** | 3.399 ** | 0.964 ** | |
| Hunan | 3.220 ** | 0.939 ** | 3.399 ** | 0.964 ** | 3.220 ** | 0.939 ** | 3.041 ** | 0.903 ** | |
| Southern coastal areas | Fujian | 1.252 | 0.394 | 2.862 ** | 0.855 ** | −0.537 | −0.176 | 0.894 | 0.236 |
| Guangdong | 3.220 ** | 0.939 ** | 2.147 * | 0.709 * | 2.326 * | 0.782 * | 3.220 ** | 0.939 ** | |
| Hainan | −0.179 | −0.055 | 1.968 * | 0.612 | −1.431 | −0.515 | −0.358 | −0.127 | |
| Middle reaches of the Yellow River | Shanxi | 1.968 * | 0.612 | 3.578 ** | 0.976 ** | −0.716 | −0.188 | 0.894 | 0.321 |
| Inner Mongolia | 1.252 | 0.527 | 2.147 * | 0.733 * | 1.431 | 0.636 | 0.358 | 0.164 | |
| Henan | 0.894 | 0.333 | 3.399 ** | 0.952 ** | −0.358 | −0.164 | 0.894 | 0.345 | |
| Shaanxi | 1.789 | 0.612 | 3.399 ** | 0.927 ** | 0.179 | 0.188 | 0.894 | 0.418 | |
| Northeast areas | Liaoning | 0.179 | 0.152 | 0.179 | 0.091 | −0.358 | 0.055 | 0.000 | 0.139 |
| Jilin | 2.504 * | 0.721 * | 2.862 ** | 0.879 ** | 2.147* | 0.600 | 1.610 | 0.467 | |
| Heilongjiang | 1.968 * | 0.709 * | 0.179 | −0.030 | 2.326 * | 0.782 * | 2.147 * | 0.733 * | |
| Southwest areas | Guangxi | 3.220 ** | 0.939 ** | 3.757 ** | 0.988 ** | 2.683 ** | 0.855 ** | 3.041 ** | 0.903 ** |
| Chongqing | 1.789 | 0.600 | 3.041 ** | 0.867 ** | −2.504 * | −0.830 ** | 0.358 | 0.188 | |
| Sichuan | 3.578 ** | 0.976 ** | 3.399 ** | 0.952 ** | 3.399 ** | 0.939 ** | 3.041 ** | 0.891 ** | |
| Guizhou | 3.757 ** | 0.988 ** | 3.578 ** | 0.976 ** | 2.504 * | 0.830 ** | 3.757 ** | 0.988 ** | |
| Yunnan | 3.936 ** | 1.000 ** | 3.936 ** | 1.000 ** | 0.179 | 0.030 | 3.757 ** | 0.988 ** | |
| Northwest areas | Gansu | 3.220 ** | 0.915 ** | 3.578 ** | 0.976 ** | 2.504 * | 0.818 ** | 3.041 ** | 0.891 ** |
| Qinghai | 1.610 | 0.527 | 3.041 ** | 0.879 ** | −1.431 | −0.636 | 0.000 | −0.188 | |
| Ningxia | 1.610 | 0.515 | 2.683 ** | 0.842 ** | 0.716 | 0.285 | 1.073 | 0.358 | |
| Xinjiang | 0.000 | 0.006 | 1.431 | 0.491 | −0.358 | −0.236 | −0.358 | −0.115 | |
| Year | Pearson | Kendall’s Tau-b (K) | Spearman’s Rho |
|---|---|---|---|
| 2008 | 0.931 ** | 0.770 ** | 0.921 ** |
| 2011 | 0.931 ** | 0.793 ** | 0.919 * |
| 2014 | 0.933 ** | 0.747 ** | 0.888 ** |
| 2017 | 0.938 ** | 0.789 ** | 0.913 ** |
| Year | Pearson | Kendall’s Tau-b (K) | Spearman’s Rho |
|---|---|---|---|
| 2008–2011 | 0.971 ** | 0.830 ** | 0.950 ** |
| 2011–2014 | 0.967 ** | 0.880 ** | 0.973 ** |
| 2014–2017 | 0.989 ** | 0.931 ** | 0.988 ** |
Publisher’s Note: MDPI stays neutral with regard to jurisdictional claims in published maps and institutional affiliations. |
© 2022 by the authors. Licensee MDPI, Basel, Switzerland. This article is an open access article distributed under the terms and conditions of the Creative Commons Attribution (CC BY) license (https://creativecommons.org/licenses/by/4.0/).
Share and Cite
Dong, X.; Gao, S.; Xu, A.; Luo, Z.; Hu, B. Research on Tourism Carrying Capacity and the Coupling Coordination Relationships between Its Influencing Factors: A Case Study of China. Sustainability 2022, 14, 15124. https://doi.org/10.3390/su142215124
Dong X, Gao S, Xu A, Luo Z, Hu B. Research on Tourism Carrying Capacity and the Coupling Coordination Relationships between Its Influencing Factors: A Case Study of China. Sustainability. 2022; 14(22):15124. https://doi.org/10.3390/su142215124
Chicago/Turabian StyleDong, Xianlei, Shan Gao, Airong Xu, Zhikun Luo, and Beibei Hu. 2022. "Research on Tourism Carrying Capacity and the Coupling Coordination Relationships between Its Influencing Factors: A Case Study of China" Sustainability 14, no. 22: 15124. https://doi.org/10.3390/su142215124
APA StyleDong, X., Gao, S., Xu, A., Luo, Z., & Hu, B. (2022). Research on Tourism Carrying Capacity and the Coupling Coordination Relationships between Its Influencing Factors: A Case Study of China. Sustainability, 14(22), 15124. https://doi.org/10.3390/su142215124


