Spatiotemporal Characteristics and Factors Driving Exploration of Industrial Carbon-Emission Intensity: A Case Study of Guangdong Province, China
Abstract
1. Introduction
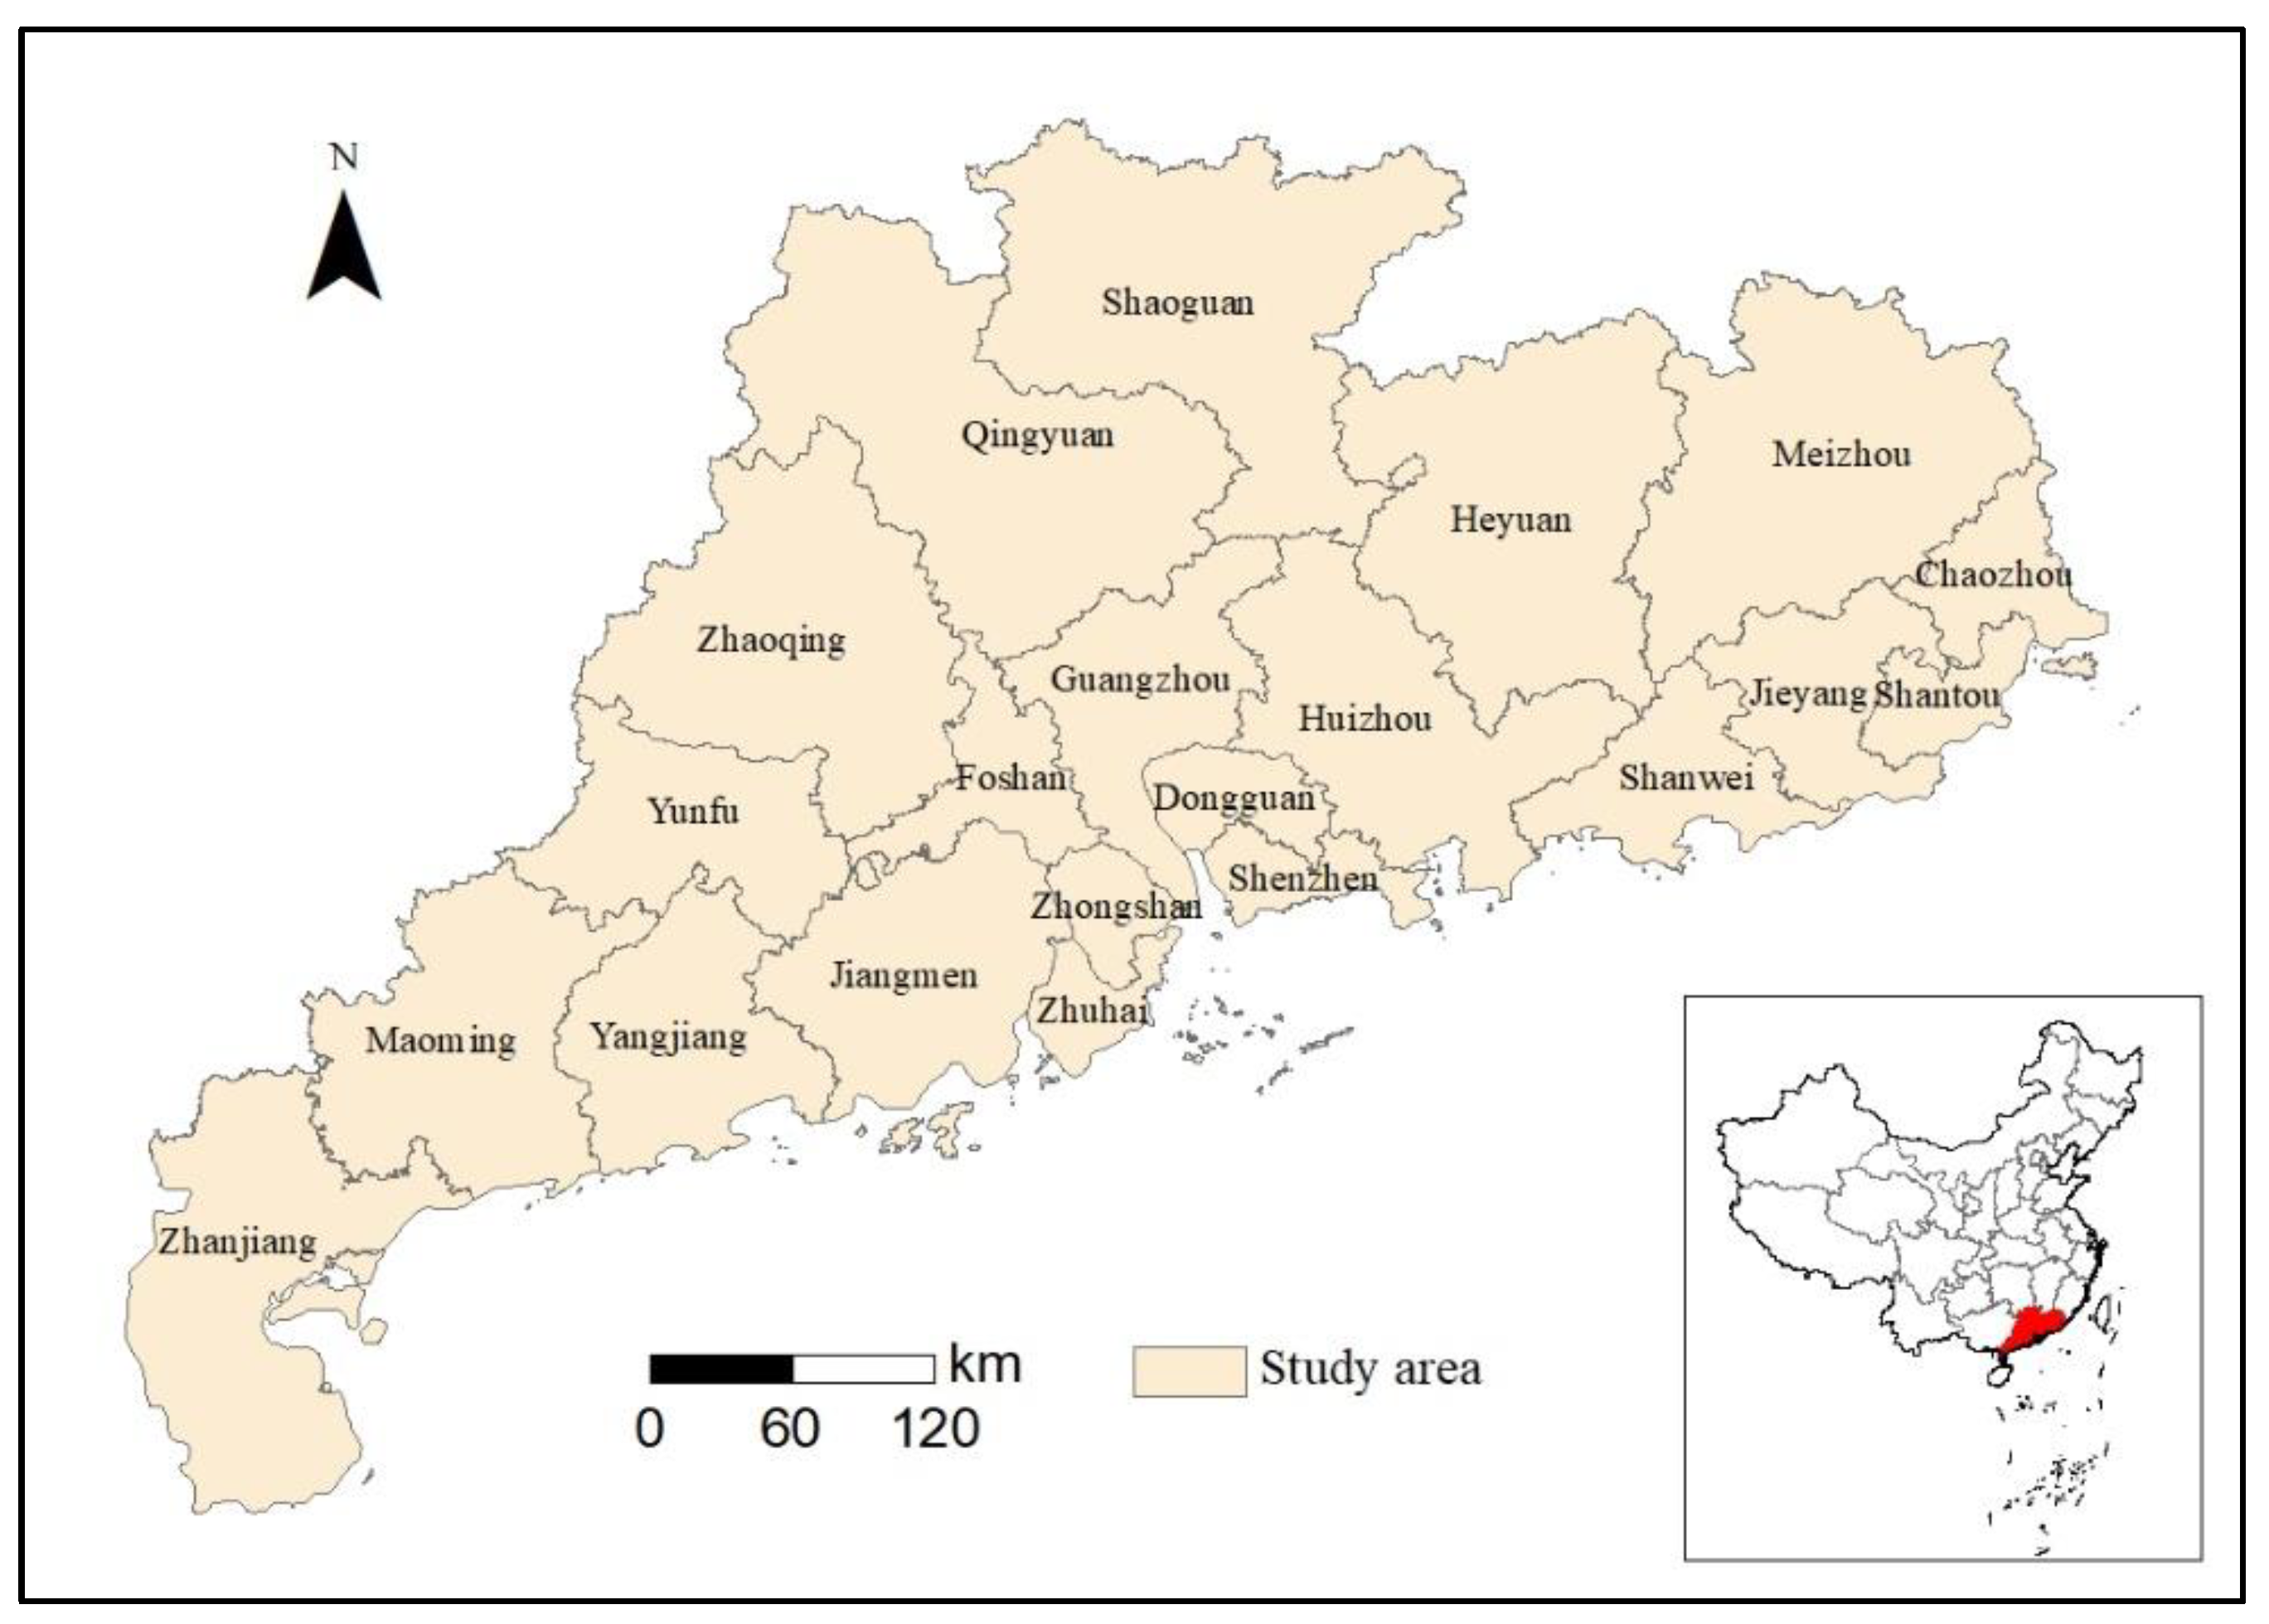
2. Study Area
3. Materials and Methods
3.1. Materials
3.2. Methods
3.2.1. Carbon-Emission Estimation Method
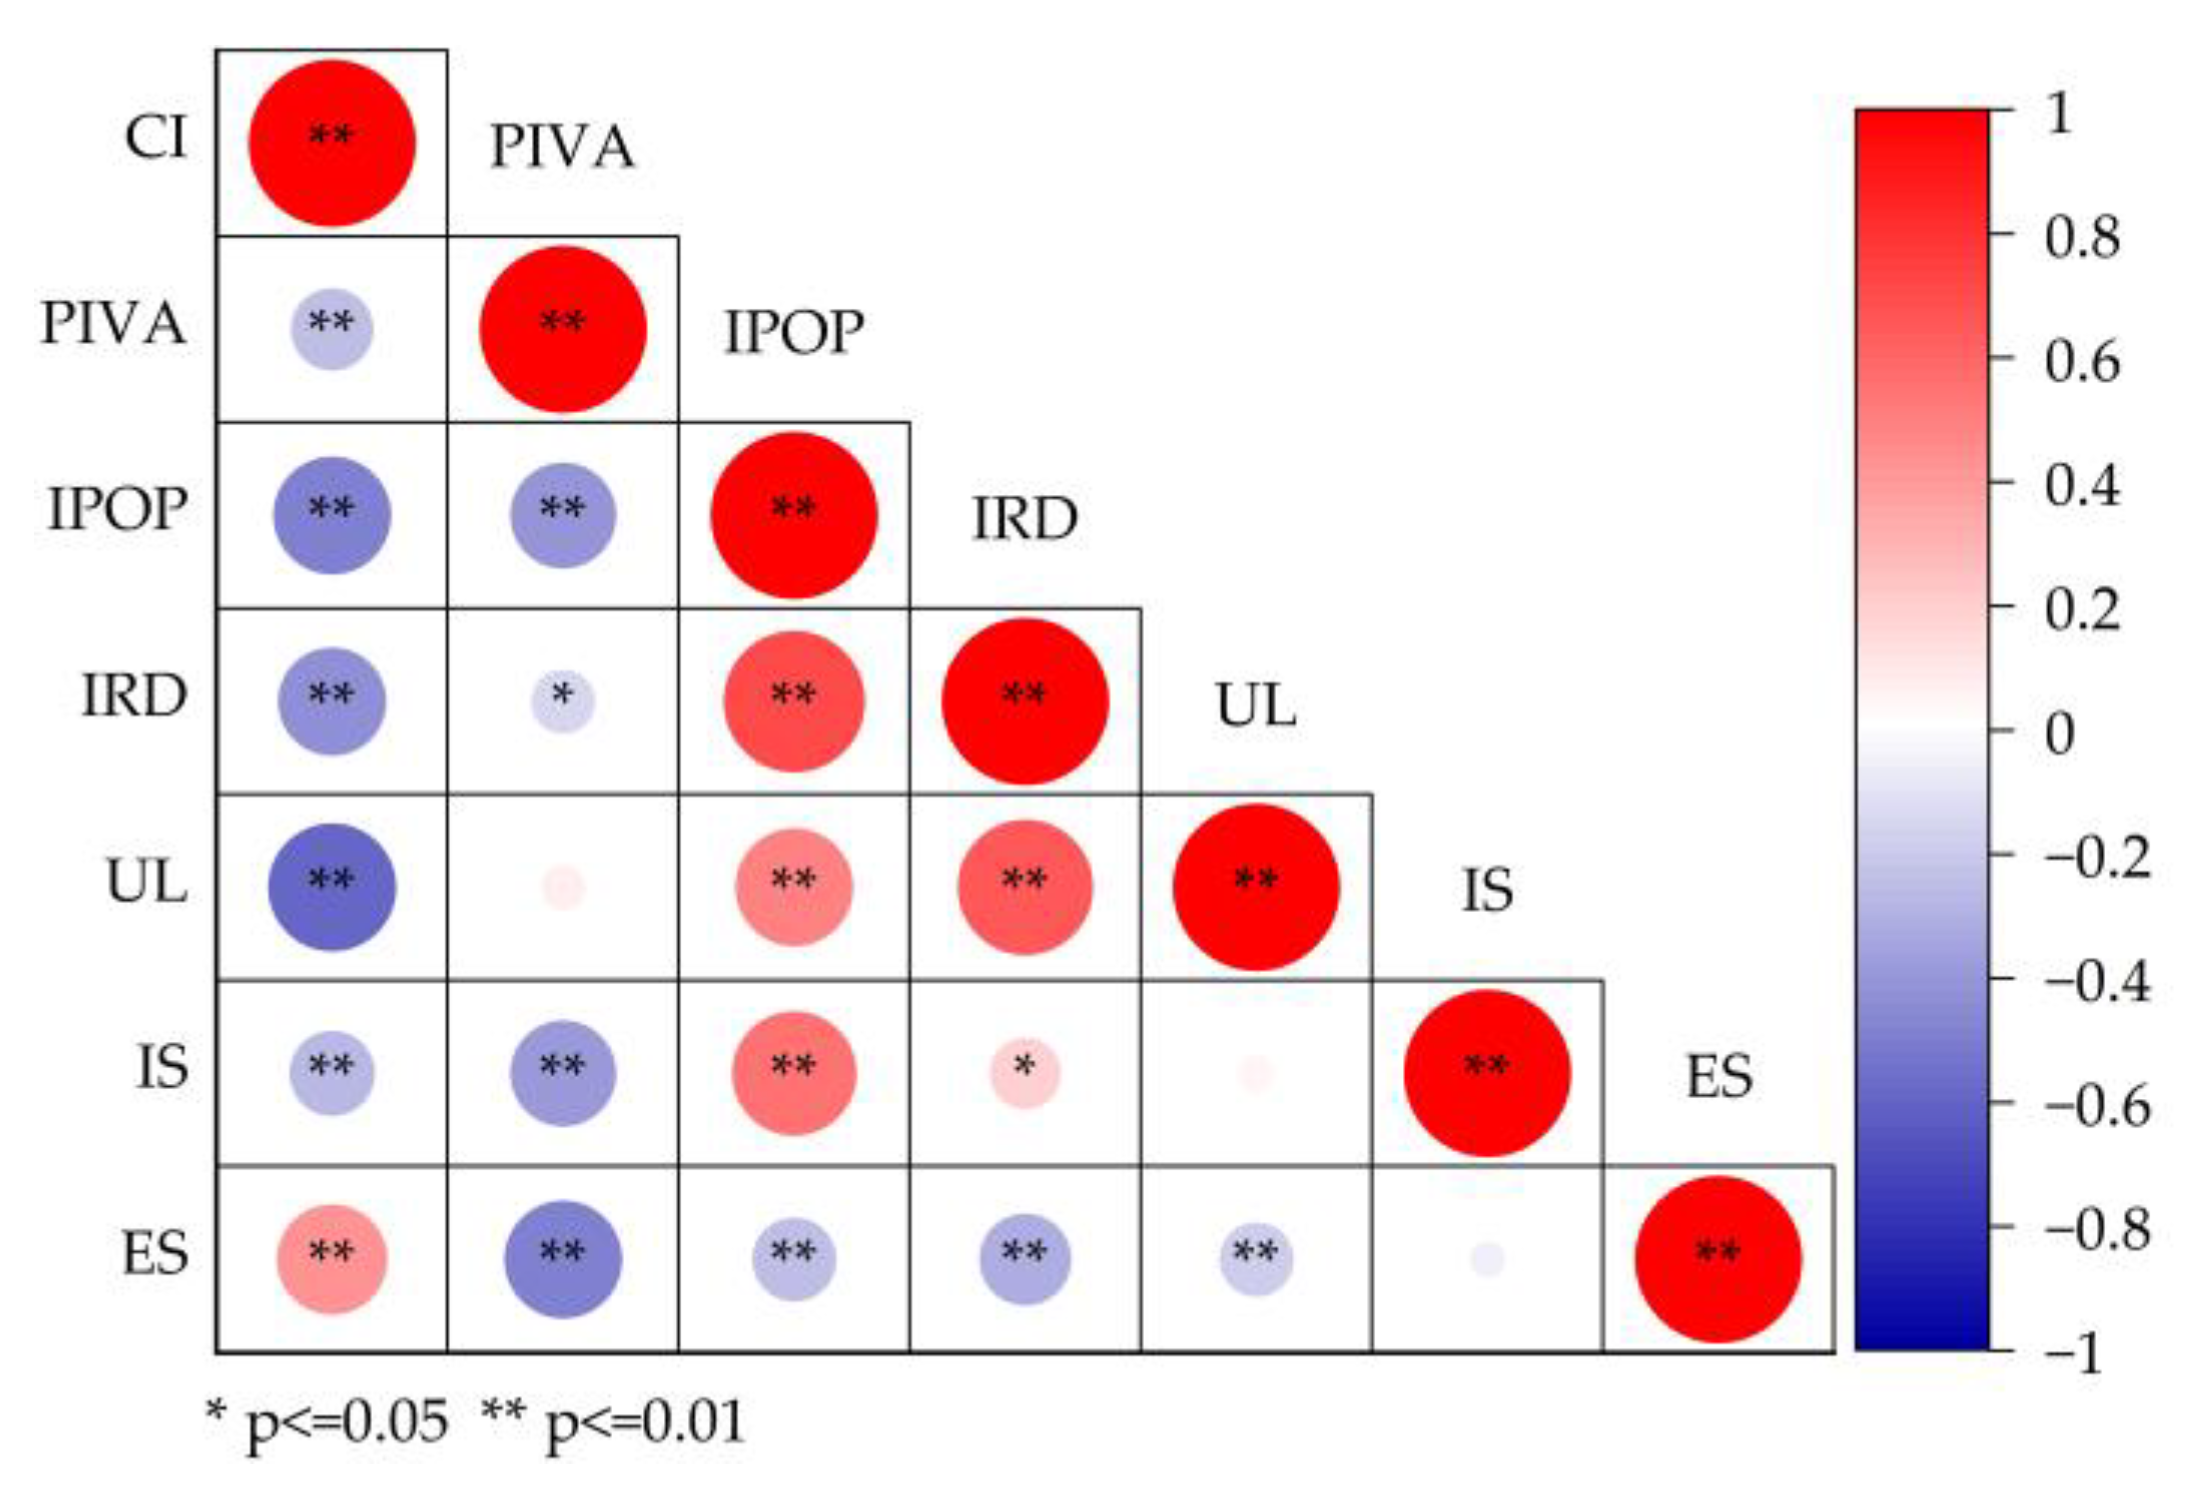
3.2.2. Empirical Model
3.2.3. Nighttime Light Data as a Proxy of Urbanization Level (UL)
4. Results
4.1. Estimation of Industrial Carbon-Emission Intensity of Guangdong
4.1.1. Time Series
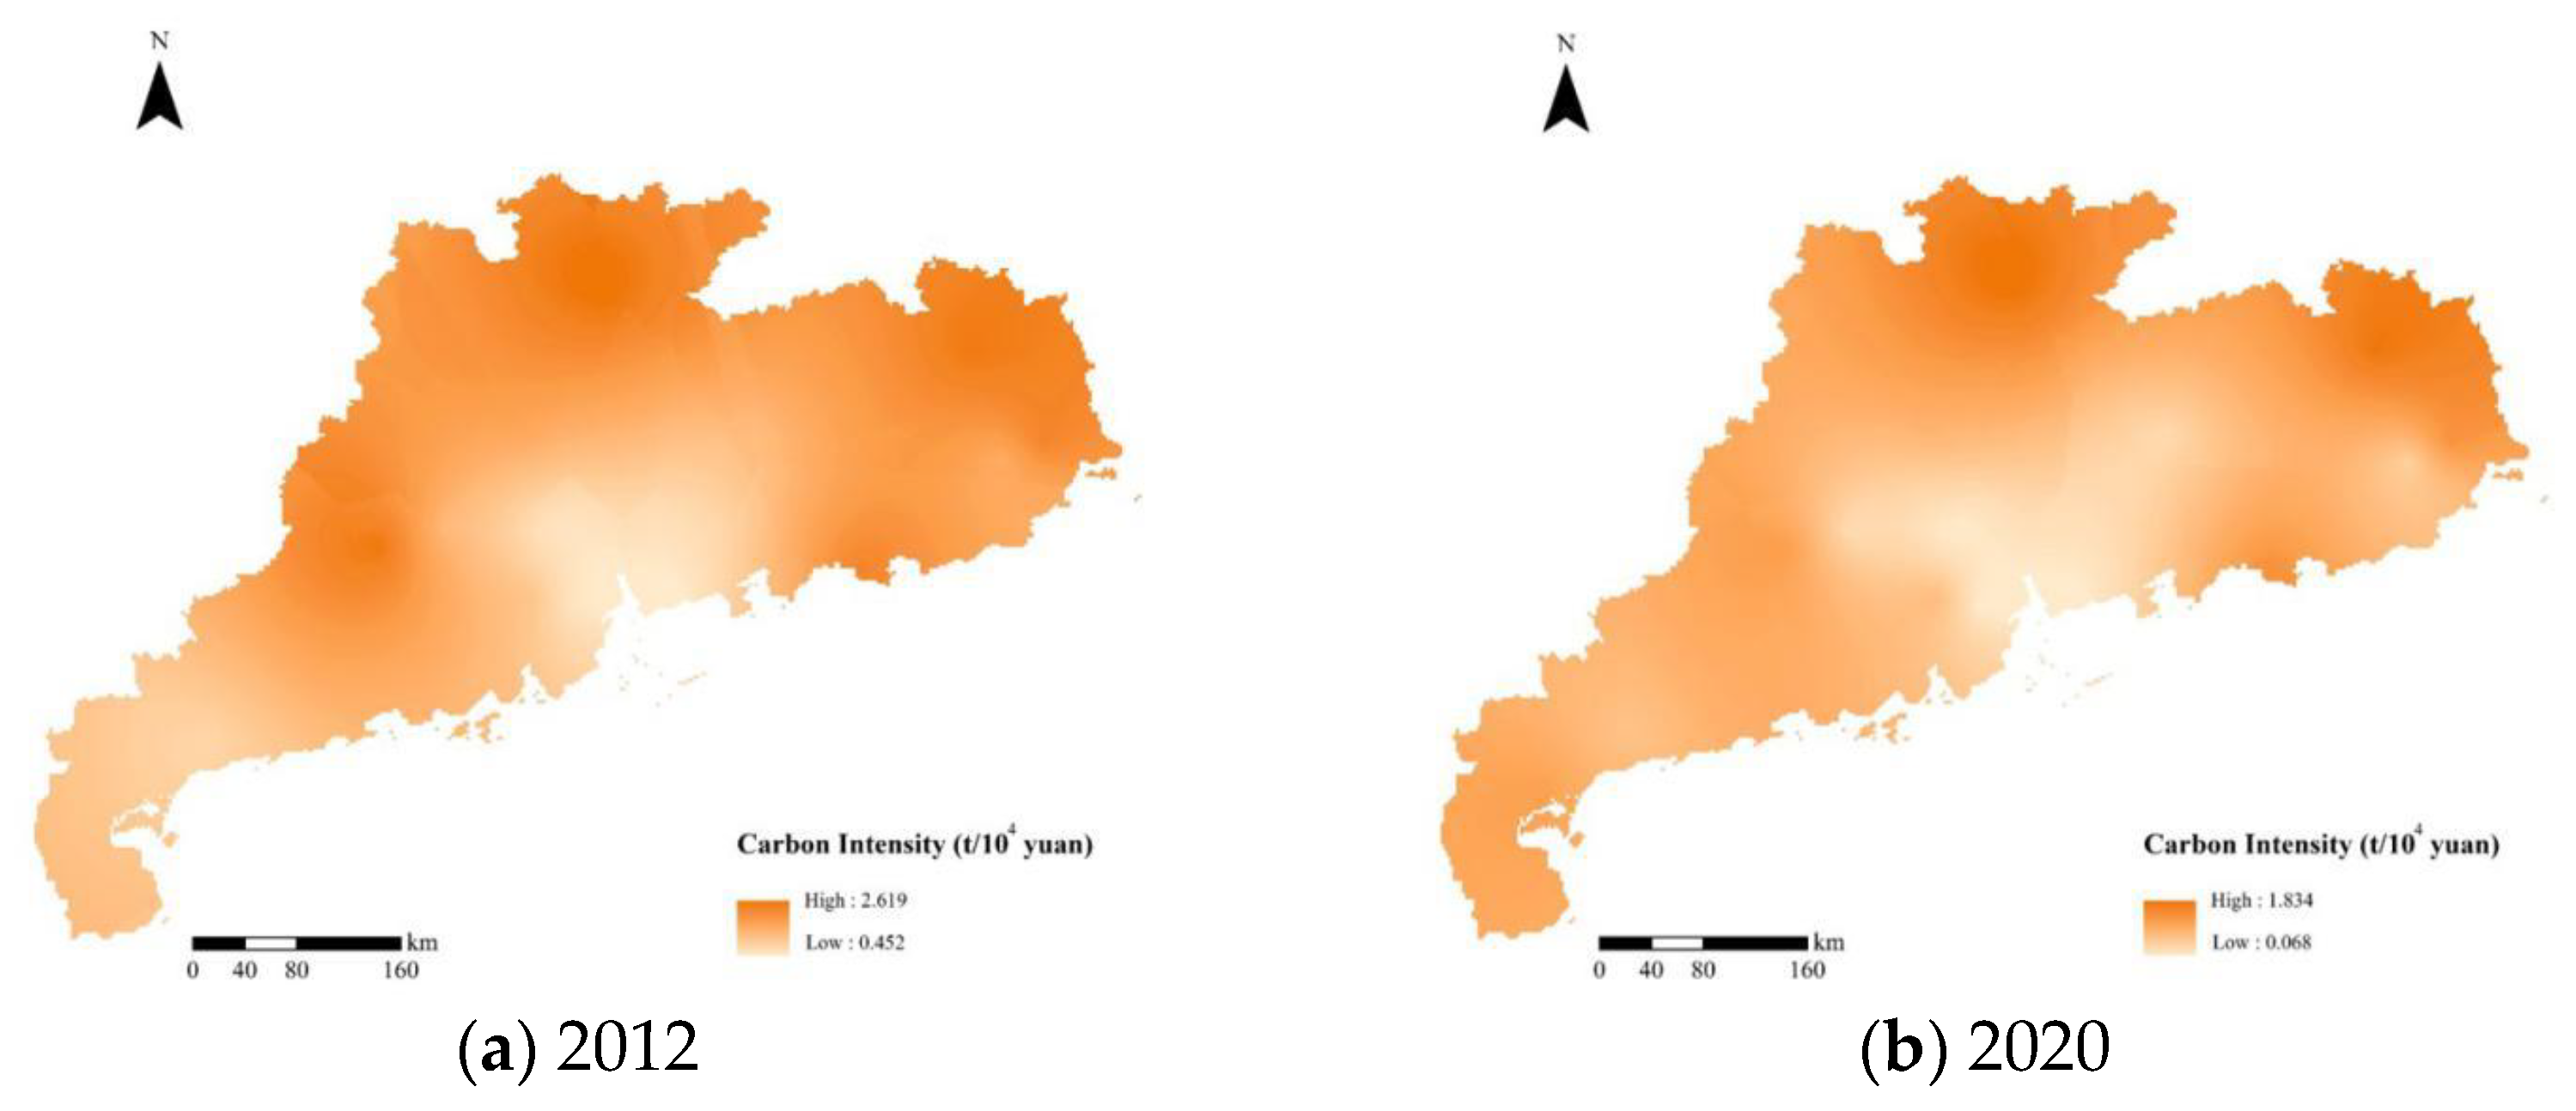
4.1.2. Spatial Series
4.2. Results of the GTWR Model
4.2.1. Comparisons with Other Conventional and Spatiotemporal Models
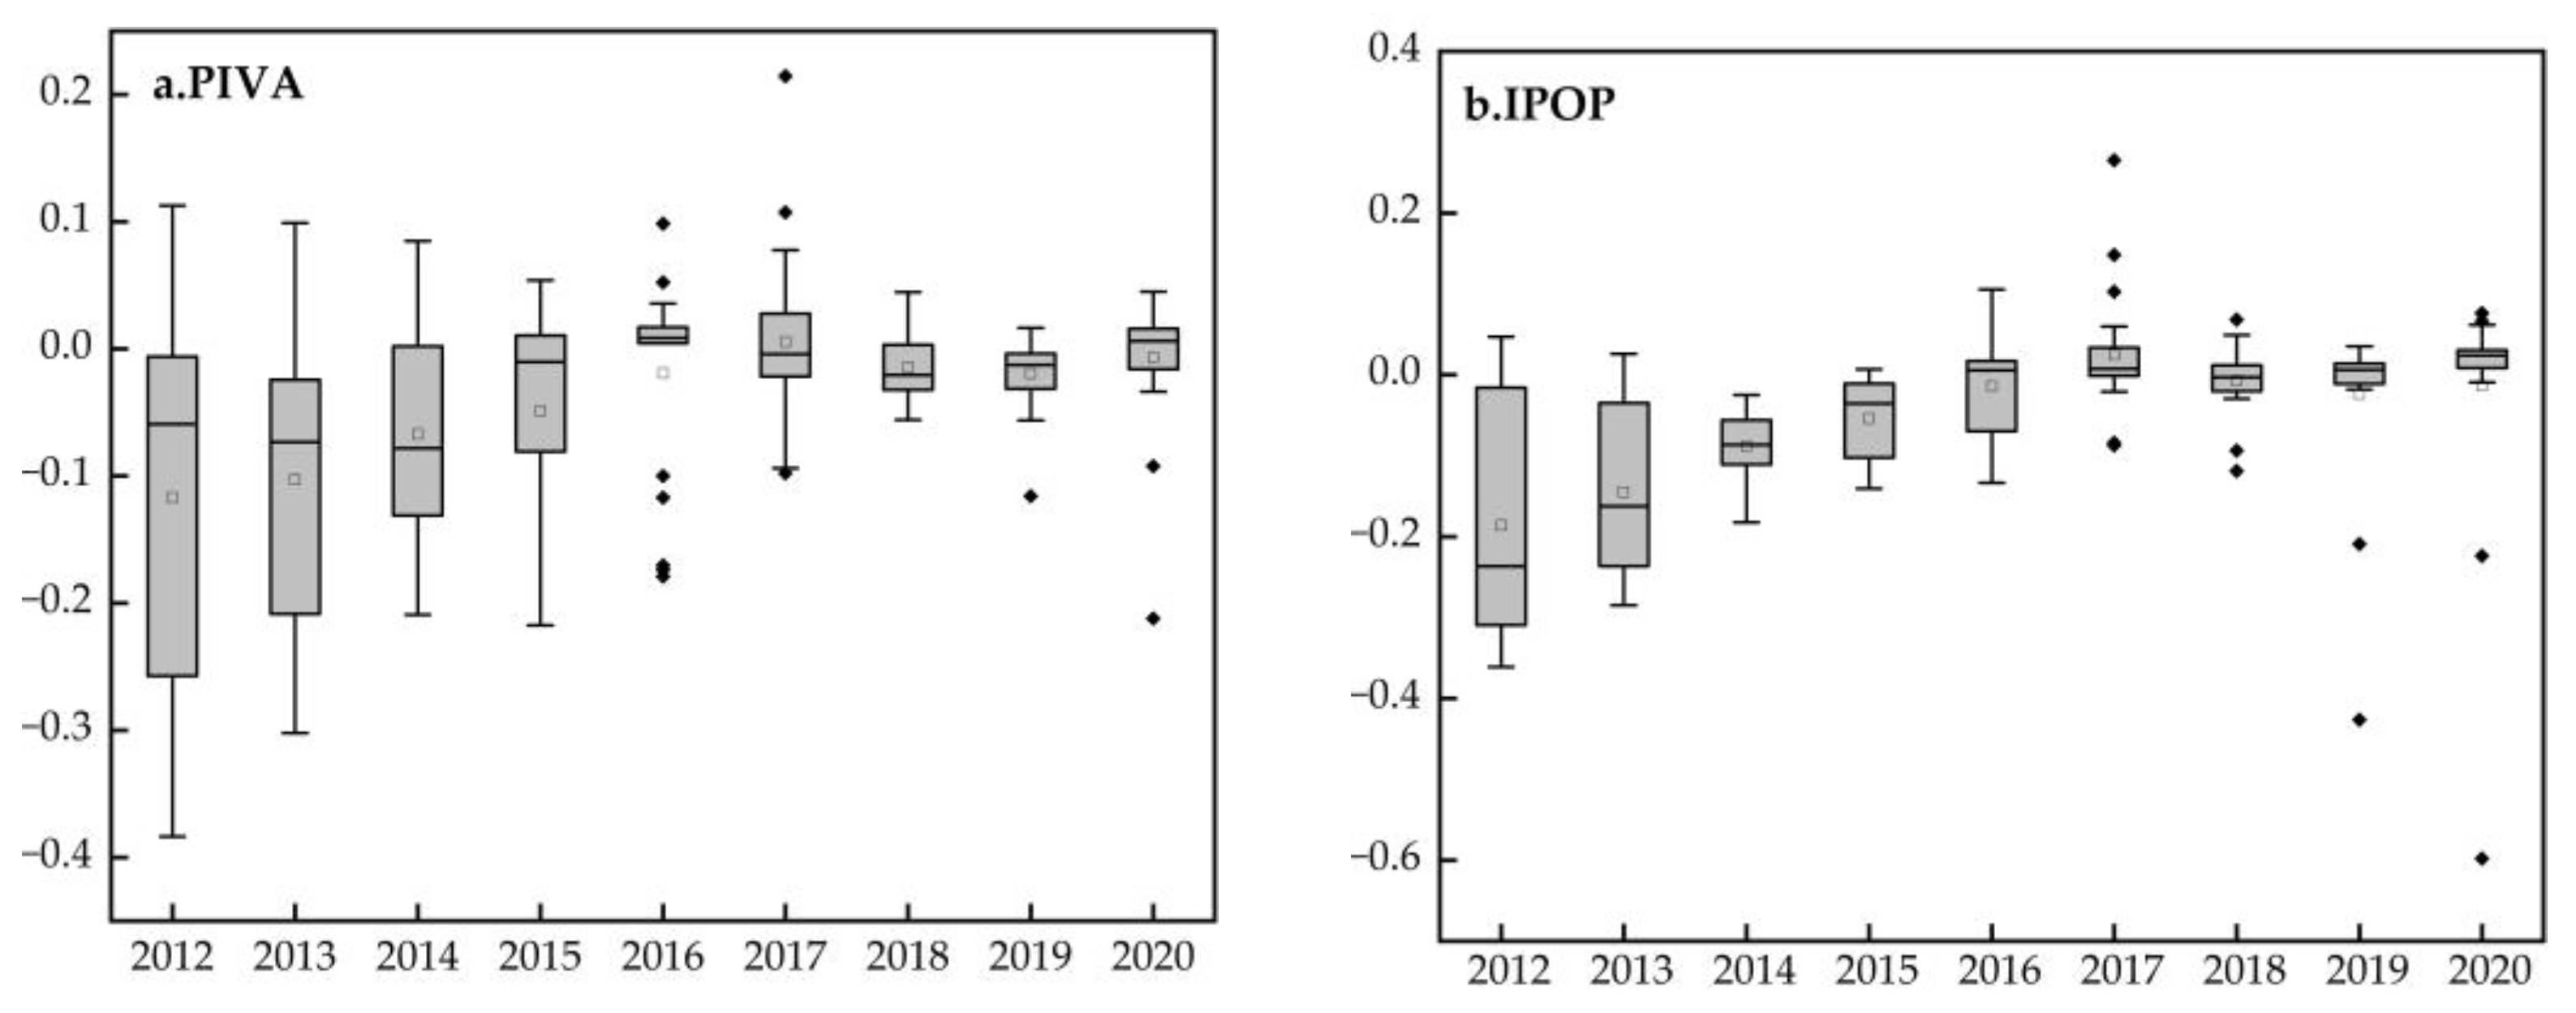
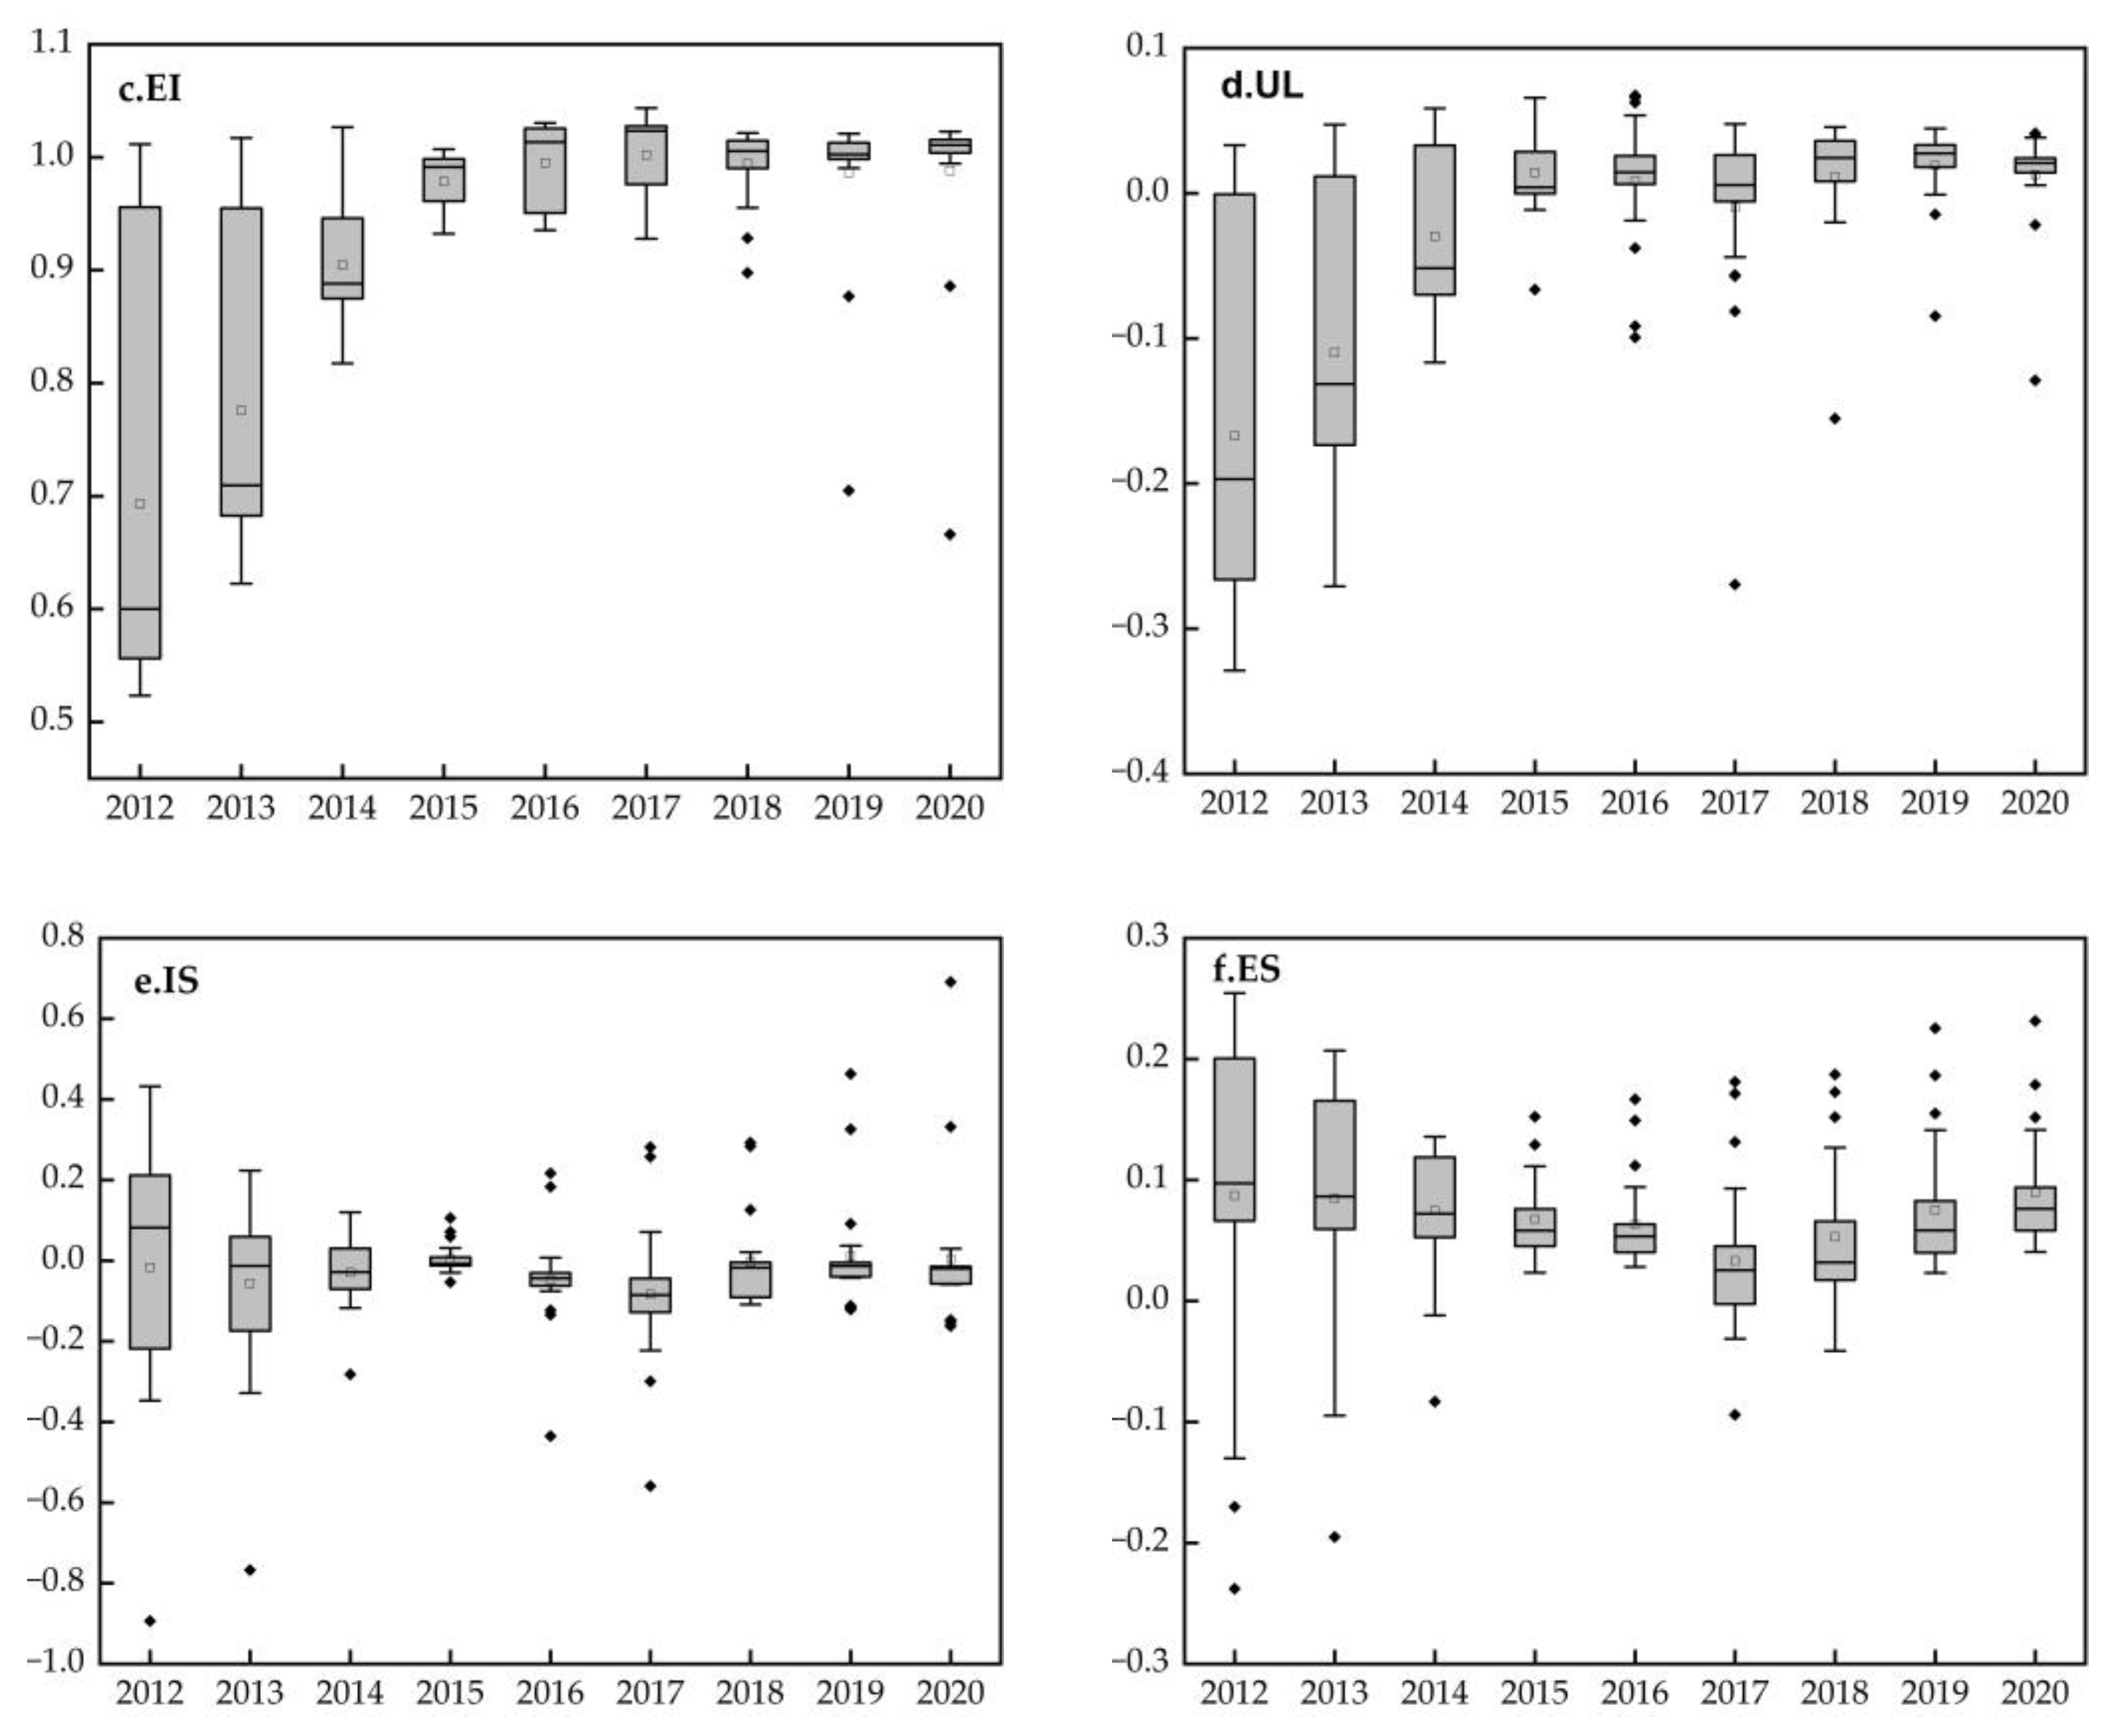
4.2.2. Time Evaluation of Carbon Intensity Influencing Factors
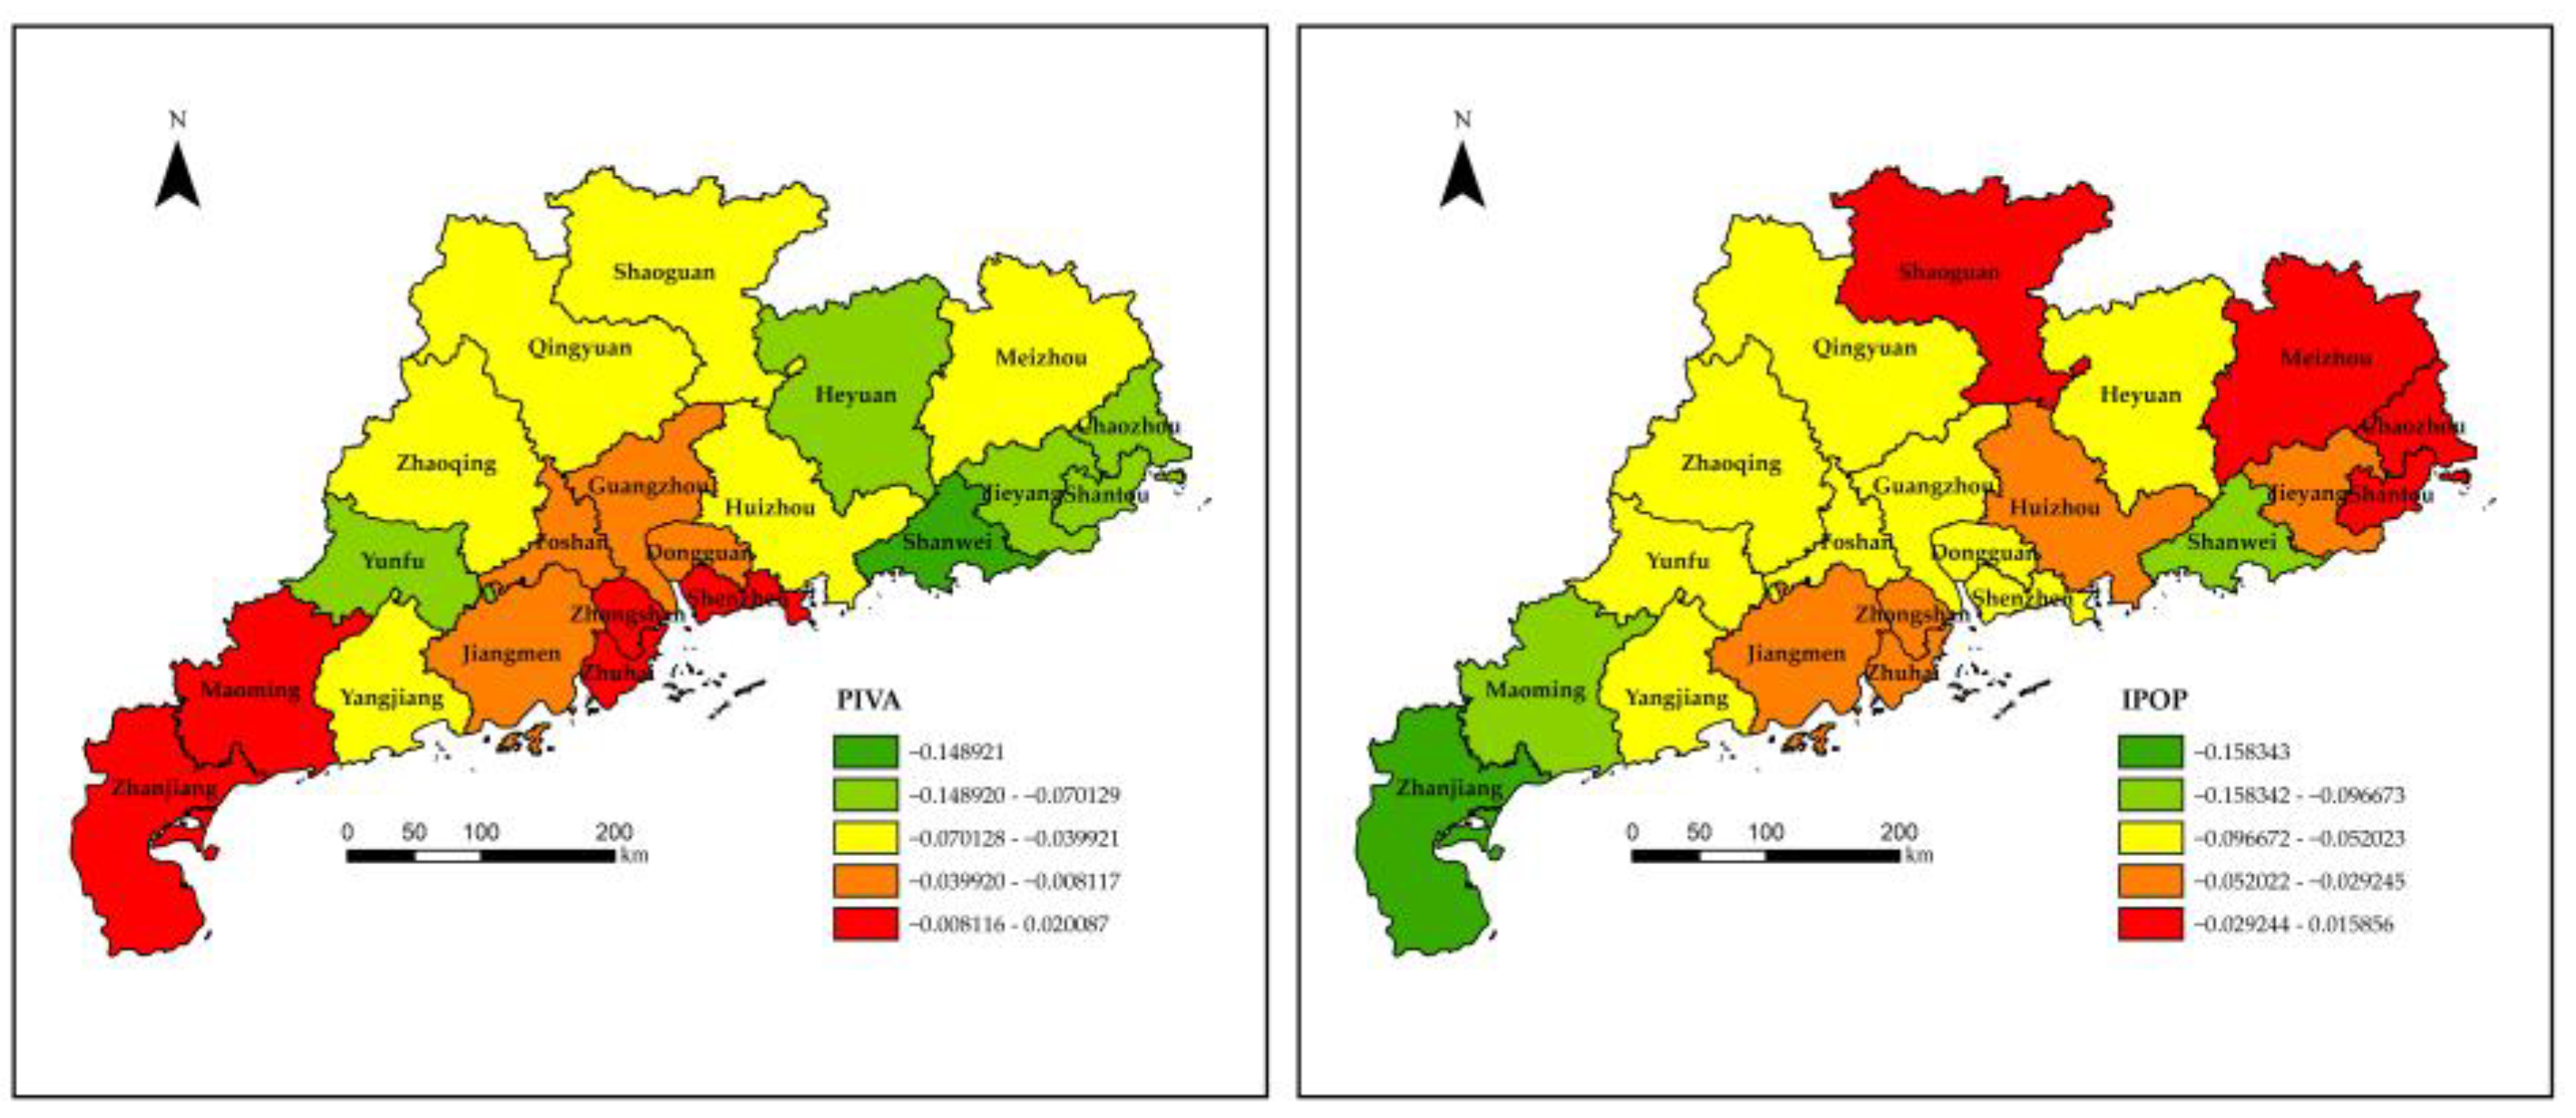
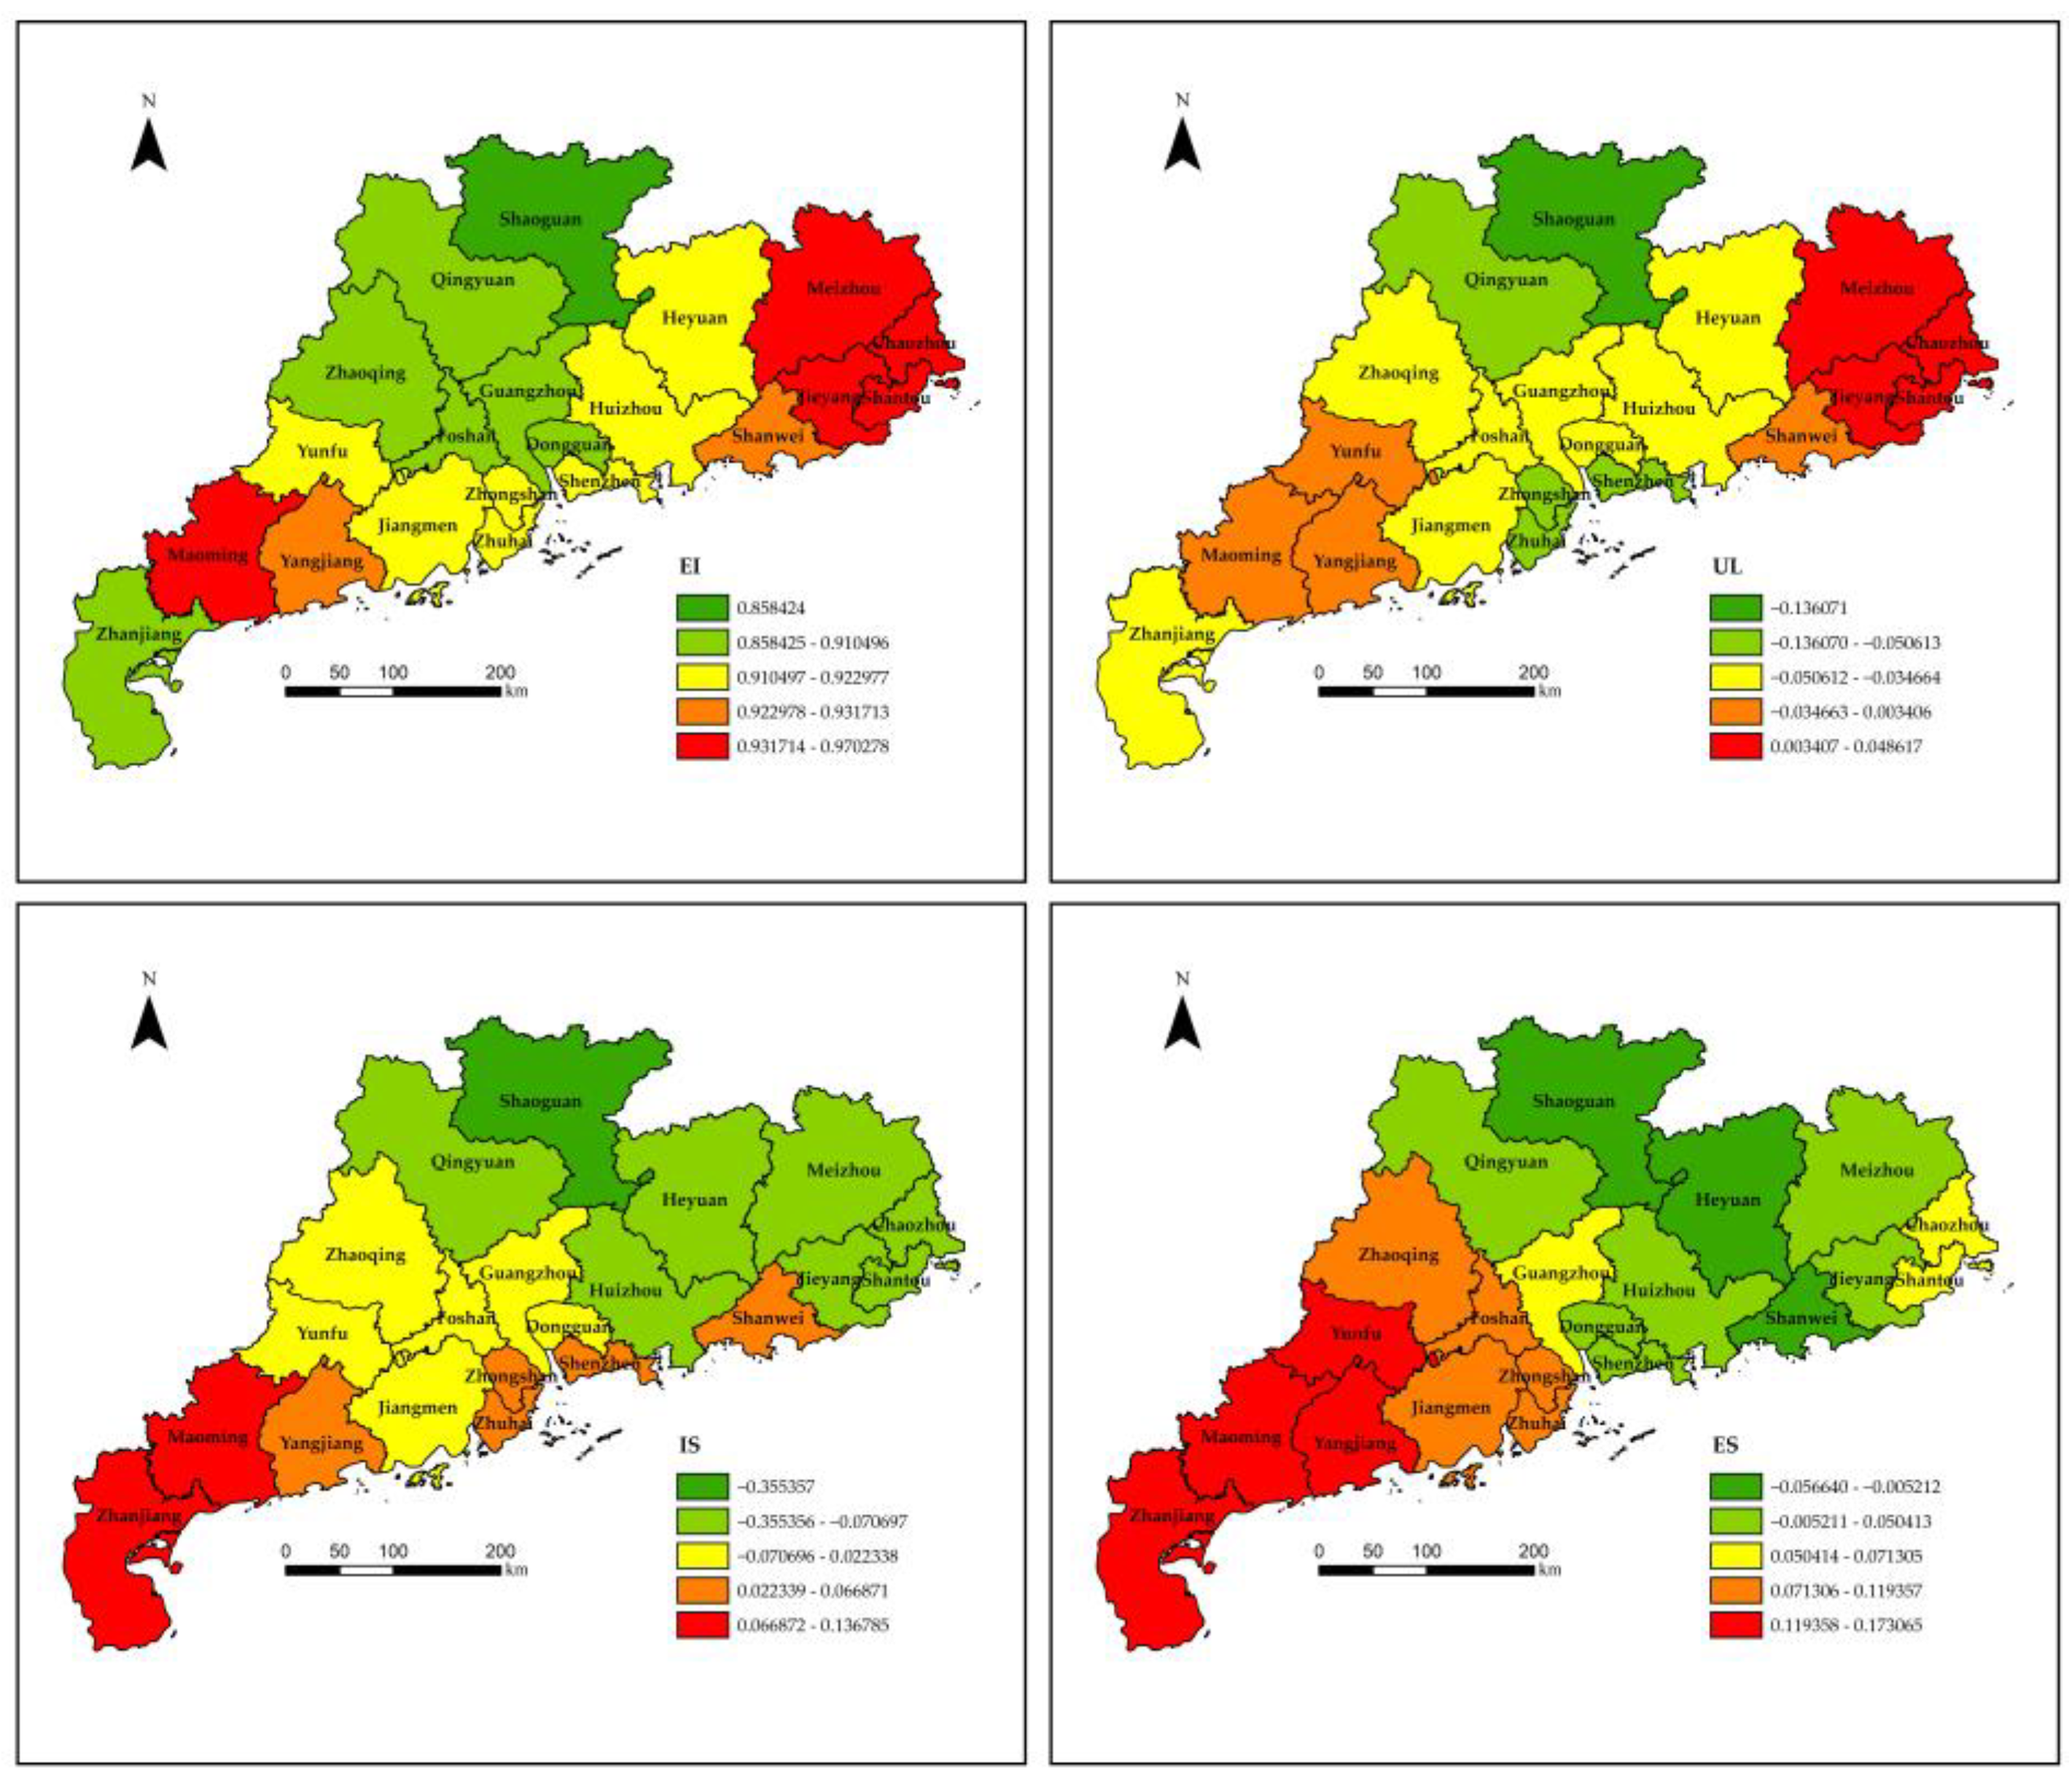
4.2.3. Spatial Heterogeneity of Carbon Intensity Influencing Factors
5. Discussion
5.1. Analysis of Carbon Emission Estimation Methods
5.2. Analysis of the Application of the GTWR Model on Carbon Emissions
5.3. Analysis of the Impact of the COVID-19 Pandemic on Carbon Emissions
6. Conclusions
Author Contributions
Funding
Institutional Review Board Statement
Informed Consent Statement
Data Availability Statement
Acknowledgments
Conflicts of Interest
References
- Ou, Y.; Roney, C.; Alsalam, J.; Calvin, K.; Creason, J.; Edmonds, J.; Fawcett, A.A.; Kyle, P.; Narayan, K.; O’Rourke, P.; et al. Deep mitigation of CO2 and non-CO2 greenhouse gases toward 1.5 degrees C and 2 degrees C futures. Nat. Commun. 2021, 12, 6245. [Google Scholar] [CrossRef] [PubMed]
- Raparthi, K. Assessing the Relationship between Urban Planning Policies, Gender, and Climate Change Mitigation: Regression Model Evaluation of Indian Cities. J. Urban Plan. Dev. 2021, 147, 05021007. [Google Scholar] [CrossRef]
- Cui, X.L.; Lei, Y.T.; Zhang, F.; Zhang, X.Y.; Wu, F. Mapping spatiotemporal variations of CO2 (carbon dioxide) emissions using nighttime light data in Guangdong Province. Phys. Chem. Earth 2019, 110, 89–98. [Google Scholar] [CrossRef]
- Wang, S.J.; Xie, Z.H.; Wu, R. Examining the effects of education level inequality on energy consumption: Evidence from Guangdong Province. J. Environ. Manag. 2020, 269, 110761. [Google Scholar] [CrossRef] [PubMed]
- Wang, J.Y.; Wang, S.J.; Li, S.J.; Feng, K.S. Coupling analysis of urbanization and energy-environment efficiency: Evidence from Guangdong province. Appl. Energy 2019, 254, 113650. [Google Scholar] [CrossRef]
- Zhang, X.; Li, M.; Li, Q.; Wang, Y.A.; Chen, W. Spatial Threshold Effect of Industrial Land Use Efficiency on Industrial Carbon Emissions: A Case Study in China. Int. J. Environ. Res. Public Health 2021, 18, 9368. [Google Scholar] [CrossRef] [PubMed]
- Duan, Z.Y.; Wang, X.N.; Dong, X.Z.; Duan, H.Y.; Song, J.N. Peaking Industrial Energy-Related CO2 Emissions in Typical Transformation Region: Paths and Mechanism. Sustainability 2020, 12, 791. [Google Scholar] [CrossRef]
- Wang, Q.; Wang, L.L. The nonlinear effects of population aging, industrial structure, and urbanization on carbon emissions: A panel threshold regression analysis of 137 countries. J. Clean. Prod. 2021, 287, 125381. [Google Scholar] [CrossRef]
- Ma, X.J.; Wang, C.X.; Dong, B.Y.; Gu, G.C.; Chen, R.M.; Li, Y.F.; Zou, H.F.; Zhang, W.F.; Li, Q.N. Carbon emissions from energy consumption in China: Its measurement and driving factors. Sci. Total Environ. 2019, 648, 1411–1420. [Google Scholar] [CrossRef]
- Xia, W.; Lijun, Z.; Yaochen, Q.; Jingfei, Z. Spatiotemporal changes of carbon emissions in high-carbon manufacturing industry in China and driving factors. Resour. Sci. 2020, 42, 323–333. [Google Scholar]
- Singpai, B.; Wu, D.S.D. An integrative approach for evaluating the environmental economic efficiency. Energy 2021, 215. [Google Scholar] [CrossRef]
- Chekouri, S.M.; Chibi, A.; Benbouziane, M. Examining the driving factors of CO2 emissions using the STIRPAT model: The case of Algeria. Int. J. Sustain. Energy 2020, 39, 927–940. [Google Scholar] [CrossRef]
- Jeong, K.; Kim, S. LMDI decomposition analysis of greenhouse gas emissions in the Korean manufacturing sector. Energy Policy 2013, 62, 1245–1253. [Google Scholar] [CrossRef]
- Griffin, P.W.; Hammond, G.P.; Norman, J.B. Industrial energy use and carbon emissions reduction: A UK perspective. WIREs Energy Environ. 2016, 5, 684–714. [Google Scholar] [CrossRef]
- Liu, Y.; Xiao, H.W.; Zhang, N. Industrial Carbon Emissions of China’s Regions: A Spatial Econometric Analysis. Sustainability 2016, 8, 210. [Google Scholar] [CrossRef]
- Liu, J.G.; Li, S.J.; Ji, Q. Regional differences and driving factors analysis of carbon emission intensity from transport sector in China. Energy 2021, 224, 120178. [Google Scholar] [CrossRef]
- Wen, L.; Zhang, Z.Q. Probing the affecting factors and decoupling analysis of energy industrial carbon emissions in Liaoning, China. Environ. Sci. Pollut. Res. 2019, 26, 14616–14626. [Google Scholar] [CrossRef] [PubMed]
- Wang, K.Y.; Wu, M.; Sun, Y.; Shi, X.P.; Sun, A.; Zhang, P. Resource abundance, industrial structure, and regional carbon emissions efficiency in China. Resour. Policy 2019, 60, 203–214. [Google Scholar] [CrossRef]
- Lu, Q.L.; Yang, H.; Huang, X.J.; Chuai, X.W.; Wu, C.Y. Multi-sectoral decomposition in decoupling industrial growth from carbon emissions in the developed Jiangsu Province, China. Energy 2015, 82, 414–425. [Google Scholar] [CrossRef]
- Dai, S.; Zhang, M.; Huang, W. Decomposing the decoupling of CO2 emission from economic growth in BRICS countries. Nat. Hazards 2016, 84, 1055–1073. [Google Scholar] [CrossRef]
- Lima, F.; Nunes, M.L.; Cunha, J.; Lucena, A.F.P. A cross-country assessment of energy-related CO2 emissions: An extended Kaya Index Decomposition Approach. Energy 2016, 115, 1361–1374. [Google Scholar] [CrossRef]
- Hwang, Y.; Um, J.S.; Schluter, S. Evaluating the Mutual Relationship between IPAT/Kaya Identity Index and ODIAC-Based GOSAT Fossil-Fuel CO(2)Flux: Potential and Constraints in Utilizing Decomposed Variables. Int. J. Environ. Res. Public Health 2020, 17, 5976. [Google Scholar] [CrossRef] [PubMed]
- Cansino, J.M.; Sanchez-Braza, A.; Rodriguez-Arevalo, M.L. Driving forces of Spain’s CO2 emissions: A LMDI decomposition approach. Renew. Sust. Energ. Rev. 2015, 48, 749–759. [Google Scholar] [CrossRef]
- Tavakoli, A. A journey among top ten emitter country, decomposition of “Kaya Identity”. Sustain. Cities Soc. 2018, 38, 254–264. [Google Scholar] [CrossRef]
- Zhang, W.; Jiang, L.; Cui, Y.; Xu, Y.; Wang, C.; Yu, J.; Streets, D.G.; Lin, B. Effects of urbanization on airport CO2 emissions: A geographically weighted approach using nighttime light data in China. Conserv. Recycl. 2019, 150, 104454. [Google Scholar] [CrossRef]
- Lin, B.Q.; Benjamin, N.I. Influencing factors on carbon emissions in China transport industry. A new evidence from quantile regression analysis. J. Clean. Prod. 2017, 150, 175–187. [Google Scholar] [CrossRef]
- Zhang, Y.J.; Liu, Z.; Zhang, H.; Tan, T.D. The impact of economic growth, industrial structure and urbanization on carbon emission intensity in China. Nat. Hazards 2014, 73, 579–595. [Google Scholar] [CrossRef]
- Wu, J.S.; Zheng, H.Q.; Zhe, F.; Xie, W.D.; Song, J. Study on the relationship between urbanization and fine particulate matter (PM2.5) concentration and its implication in China. J. Clean. Prod. 2018, 182, 872–882. [Google Scholar] [CrossRef]
- Zheng, Y.; He, Y.; Wang, X.; Gao, Y. Application Review and Prospect of Nighttime Light Remote Sensing Data. Remote Sens. 2020, 35, 3887. [Google Scholar]
- Ma, T.; Zhou, C.H.; Pei, T.; Haynie, S.; Fan, J.F. Quantitative estimation of urbanization dynamics using time series of DMSP/OLS nighttime light data: A comparative case study from China’s cities. Remote Sens. Environ. 2012, 124, 99–107. [Google Scholar] [CrossRef]
- Meng, X.; Han, J.; Huang, C. An Improved Vegetation Adjusted Nighttime Light Urban Index and Its Application in Quantifying Spatiotemporal Dynamics of Carbon Emissions in China. Remote Sens. 2017, 9, 829. [Google Scholar] [CrossRef]
- Chen, L.; Xu, L.; Cai, Y.; Yang, Z. Spatiotemporal patterns of industrial carbon emissions at the city level. Conserv. Recycl. 2021, 169, 105499. [Google Scholar] [CrossRef]
- Yian, Y.; Jiye, Z.; Shenfeng, L.; Qiuhui, Q. Correlation analysis of industrial carbon emissions and economic growth in Yangtze River Delta cities. Resour. Environ. Yangtze Val. 2013, 22, 257–262. [Google Scholar]
- Dietz, T.; Rosa, E.A. Effects of population and affluence on CO2 emissions. Proc. Natl. Acad. Sci. USA 1997, 94, 175–179. [Google Scholar] [CrossRef]
- Huang, J.B.; Wu, J.; Tang, Y.; Hao, Y. The influences of openness on China’s industrial CO2 intensity. Environ. Sci. Pollut. Res. 2020, 27, 15743–15757. [Google Scholar] [CrossRef]
- Zhong-hua, T.; Ze-liang, Y.; Rui-Xian, C. Analysis of Guangdong carbon emissions from energy consumption and the driving factors of its intensity change. China Environ. Sci. 2015, 35, 1885–1891. [Google Scholar]
- Yanan, W.; Yujia, N.; Meng, L.; Qianyu, Y.; Wei, C. Spatial structure and carbon emission of urban agglomerations: Spatiotemporal characteristics and driving forces. Sustain. Cities Soc. 2022, 78, 103600. [Google Scholar]
- Li, W.Y.; Ji, Z.S.; Dong, F.G. Spatio-temporal evolution relationships between provincial CO2 emissions and driving factors using geographically and temporally weighted regression model. Sustain. Cities Soc. 2022, 81, 103836. [Google Scholar] [CrossRef]
- Zhang, J.; Jiang, H.Q.; Liu, G.Y.; Zeng, W.H. A study on the contribution of industrial restructuring to reduction of carbon emissions in China during the five Five Year Plan periods. J. Clean. Prod. 2018, 176, 629–635. [Google Scholar] [CrossRef]
- Zhao, M.; Tan, L.R.; Zhang, W.G.; Ji, M.H.; Liu, Y.A.; Yu, L.Z. Decomposing the influencing factors of industrial carbon emissions in Shanghai using the LMDI method. Energy 2010, 35, 2505–2510. [Google Scholar] [CrossRef]
- Wang, Y.N.; Li, X.B.; Kang, Y.Q.; Chen, W.; Zhao, M.J.; Li, W. Analyzing the impact of urbanization quality on CO2 emissions: What can geographically weighted regression tell us? Renew. Sustain. Energy Rev. 2019, 104, 127–136. [Google Scholar] [CrossRef]
- Huang, B.; Wu, B.; Barry, M. Geographically and temporally weighted regression for modeling spatio-temporal variation in house prices. Int. J. Geogr. Inf. Sci. 2010, 24, 383–401. [Google Scholar] [CrossRef]
- Li, X.; Li, D.R.; Xu, H.M.; Wu, C.Q. Intercalibration between DMSP/OLS and VIIRS night-time light images to evaluate city light dynamics of Syria’s major human settlement during Syrian Civil War. Int. J. Remote. Sens. 2017, 38, 5934–5951. [Google Scholar] [CrossRef]
- Yongxian, S.; Xiuzhi, C.; Yuyao, Y.; Qitao, W.; Hongou, Z.; Ningsheng, H.; Yaoqiu, K. The characteristics and mechanisms of carbon emissions from energy consumption in China using DMSP/OLS night light imageries. J. Geogr Sci. 2013, 68, 1513–1526. [Google Scholar]
- Levin, N. The impact of seasonal changes on observed nighttime brightness from 2014 to 2015 monthly VIIRS DNB composites. Remote Sens. Environ. 2017, 193, 150–164. [Google Scholar] [CrossRef]
- Elvidge, C.D.; Zhizhin, M.; Ghosh, T.; Hsu, F.C.; Taneja, J. Annual Time Series of Global VIIRS Nighttime Lights Derived from Monthly Averages: 2012 to 2019. Remote Sens. 2021, 13, 922. [Google Scholar] [CrossRef]
- Zheng, Y.M.; Zhou, Q.; He, Y.R.; Wang, C.P.; Wang, X.R.; Wang, H.W. An Optimized Approach for Extracting Urban Land Based on Log-Transformed DMSP-OLS Nighttime Light, NDVI, and NDWI. Remote Sens. 2021, 13, 766. [Google Scholar] [CrossRef]
- Kai, L.; Weiqian, Y. Analysis on the decline of carbon intensity of various cities of Guangdong, China since the 13th Five Year Plan. Guangdong Sci. Technol. 2020, 29, 54–57. [Google Scholar]
- Liu, Z.; Guan, D.B.; Wei, W.; Davis, S.J.; Ciais, P.; Bai, J.; Peng, S.S.; Zhang, Q.; Hubacek, K.; Marland, G.; et al. Reduced carbon emission estimates from fossil fuel combustion and cement production in China. Nature 2015, 524, 335–338. [Google Scholar] [CrossRef]
- Wang, G.Z.; Han, Q.; de Vries, B. A geographic carbon emission estimating framework on the city scale. J. Clean. Prod. 2020, 244, 118793. [Google Scholar] [CrossRef]
- Wang, S.J.; Liu, X.P. China’s city-level energy-related CO2 emissions: Spatiotemporal patterns and driving forces. Appl. Energy 2017, 200, 204–214. [Google Scholar] [CrossRef]
- Wang, Q.; Wang, S.S. Preventing carbon emission retaliatory rebound post-COVID-19 requires expanding free trade and improving energy efficiency. Sci. Total Environ. 2020, 746, 141158. [Google Scholar] [CrossRef] [PubMed]
- Liu, Z.; Ciais, P.; Deng, Z.; Lei, R.X.; Davis, S.J.; Feng, S.; Zheng, B.; Cui, D.; Dou, X.Y.; Zhu, B.Q.; et al. Near-real-time monitoring of global CO2 emissions reveals the effects of the COVID-19 pandemic. Nat. Commun. 2020, 11, 5172. [Google Scholar] [CrossRef] [PubMed]


| Data Type | Contents | Data Sources |
|---|---|---|
| Industrial energy consumption | coal, coke, natural gas, gasoline, kerosene, diesel, fuel oil, and liquefied petroleum gas. | the statistical yearbooks of Guangdong and its 21 cities. |
| Economic panel data | industrial value-added data, driving factors (apart from urbanization) | the statistical yearbooks of Guangdong and its 21 cities |
| Night-time light data | NPP-VIIRS data | (https://eogdata.mines.edu/products/vnl/) accessed on 1 September 2021. |
| Geographical coordinates | 21 cities of Guangdong | (https://map.baidu.com/) accessed on 1 October 2021 |
| Energy | Raw Coal | Coke | Gasoline | Kerosene | Diesel | Fuel Oil | Liquefied Petroleum Gas | Natural Gas |
|---|---|---|---|---|---|---|---|---|
| Default carbon content coefficient of energy (kg/GJ) | 25.8 | 29.2 | 18.9 | 19.6 | 20.2 | 21.1 | 17.2 | 15.3 |
| Net calorific value (TJ/Gg) | 28.2 | 28.2 | 44.3 | 43.8 | 43.0 | 40.4 | 47.3 | 48.0 |
| Oxidation rate of carbon | 1 | 1 | 1 | 1 | 1 | 1 | 1 | 1 |
| Variable | Meaning |
|---|---|
| Carbon emission intensity (CI) | Ratio of carbon emissions from industrial sector to its industrial value added |
| Economic development level (PIVA) | Ratio of industrial value added to industrial population |
| Population scale (IPOP) | Industrial population split by total urban population |
| Energy intensity (EI) | Ratio of expenditure on research and development of industrial enterprises to its industrial value added |
| Urbanization level (UL) | Total NTL of a city |
| Industrial structure (IS) | Industrial added value of industrial sector accounts for the proportion of GDP |
| Energy consumption structure (ES) | Ratio of coal consumption to total energy consumption in industrial sector |
| Independent Variable | PIVA | IPOP | EI | UL | IS | ES |
|---|---|---|---|---|---|---|
| VIF | 2.613 | 4.222 | 2.951 | 2.062 | 1.738 | 2.098 |
| Tolerance | 0.383 | 0.237 | 0.339 | 0.485 | 0.575 | 0.477 |
| Variable | Min | Lower Quartile | Median | Higher Quartile | Max | Mean |
|---|---|---|---|---|---|---|
| PIVA | −0.3837 | −1.3345 | −0.0160 | −0.0574 | 0.7694 | −0.4332 |
| IPOP | −0.5978 | −1.4989 | −0.0129 | −0.1783 | 0.4061 | −0.5627 |
| EI | 0.5234 | 0.1101 | 0.9904 | 0.6644 | 1.1230 | 0.9242 |
| UL | −0.3289 | −0.8350 | 0.0111 | −0.0925 | 0.6051 | −0.0279 |
| IS | −0.8936 | −0.3623 | −0.2000 | 1.3348 | 2.6832 | −0.2420 |
| ES | −0.2378 | 0.1482 | 0.0617 | 1.1176 | 6.3089 | 0.0699 |
| Intercept | −1.9457 | 3.3702 | 0.1917 | 13.9788 | 23.7568 | 0.6986 |
| R2 | 0.9819 | |||||
| R2 Adjusted | 0.9916 | |||||
| Residual Squares | 1.4732 | |||||
| AICc | −188.899 | |||||
| Sigma | 0.0882 | |||||
| Bandwidth | 0.1150 | |||||
| Indicators | OLS | GWR | TWR | GTWR |
|---|---|---|---|---|
| AICc | −104.005 | −110.395 | −153.922 | −188.899 |
| R2 | 0.9671 | 0.9710 | 0.9816 | 0.9916 |
Publisher’s Note: MDPI stays neutral with regard to jurisdictional claims in published maps and institutional affiliations. |
© 2022 by the authors. Licensee MDPI, Basel, Switzerland. This article is an open access article distributed under the terms and conditions of the Creative Commons Attribution (CC BY) license (https://creativecommons.org/licenses/by/4.0/).
Share and Cite
Li, S.; Xu, Z.; Wang, H. Spatiotemporal Characteristics and Factors Driving Exploration of Industrial Carbon-Emission Intensity: A Case Study of Guangdong Province, China. Sustainability 2022, 14, 15064. https://doi.org/10.3390/su142215064
Li S, Xu Z, Wang H. Spatiotemporal Characteristics and Factors Driving Exploration of Industrial Carbon-Emission Intensity: A Case Study of Guangdong Province, China. Sustainability. 2022; 14(22):15064. https://doi.org/10.3390/su142215064
Chicago/Turabian StyleLi, Shoutiao, Zhibang Xu, and Haowei Wang. 2022. "Spatiotemporal Characteristics and Factors Driving Exploration of Industrial Carbon-Emission Intensity: A Case Study of Guangdong Province, China" Sustainability 14, no. 22: 15064. https://doi.org/10.3390/su142215064
APA StyleLi, S., Xu, Z., & Wang, H. (2022). Spatiotemporal Characteristics and Factors Driving Exploration of Industrial Carbon-Emission Intensity: A Case Study of Guangdong Province, China. Sustainability, 14(22), 15064. https://doi.org/10.3390/su142215064


