
Performance of Self-Compacted Geopolymer Concrete Containing Fly Ash and Slag as Binders


Abstract
1. Introduction
2. Materials
3. Mixing Procedure
3.1. Mixing and Casting
3.2. Curing Method
4. Testing Procedure
4.1. Fresh Properties
4.2. Mechanical Properties
4.3. Correlation between Splitting Tensile and Compressive Strength
4.4. Durability Properties
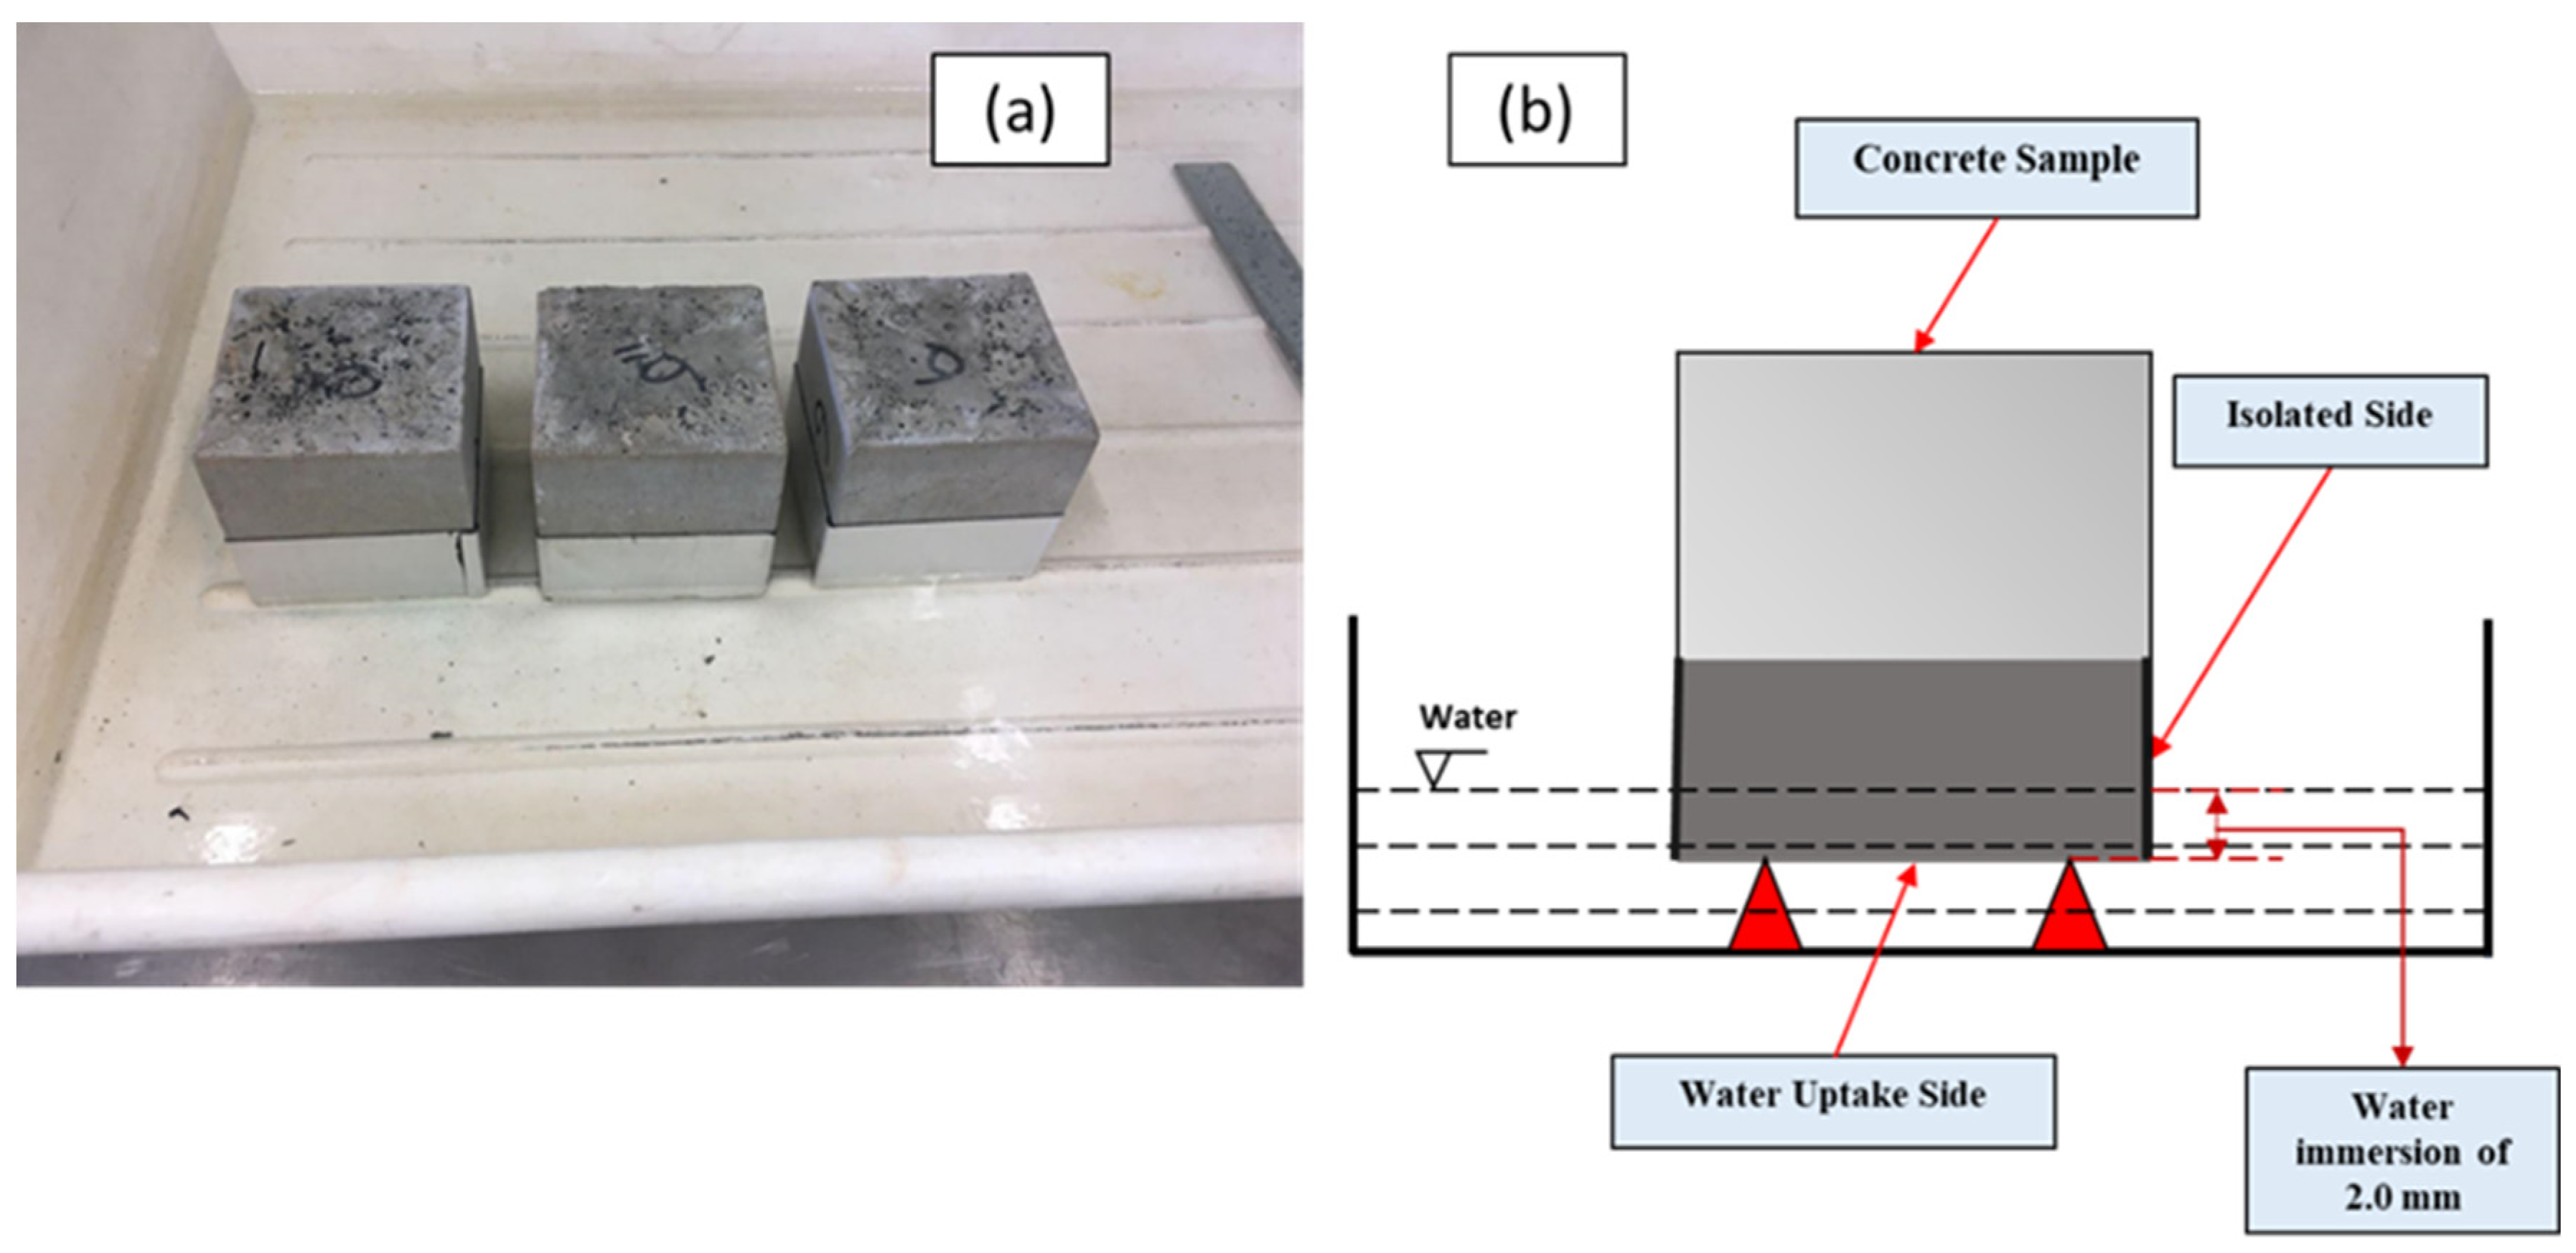
4.4.1. Capillary Water Absorption (Sorptivity)
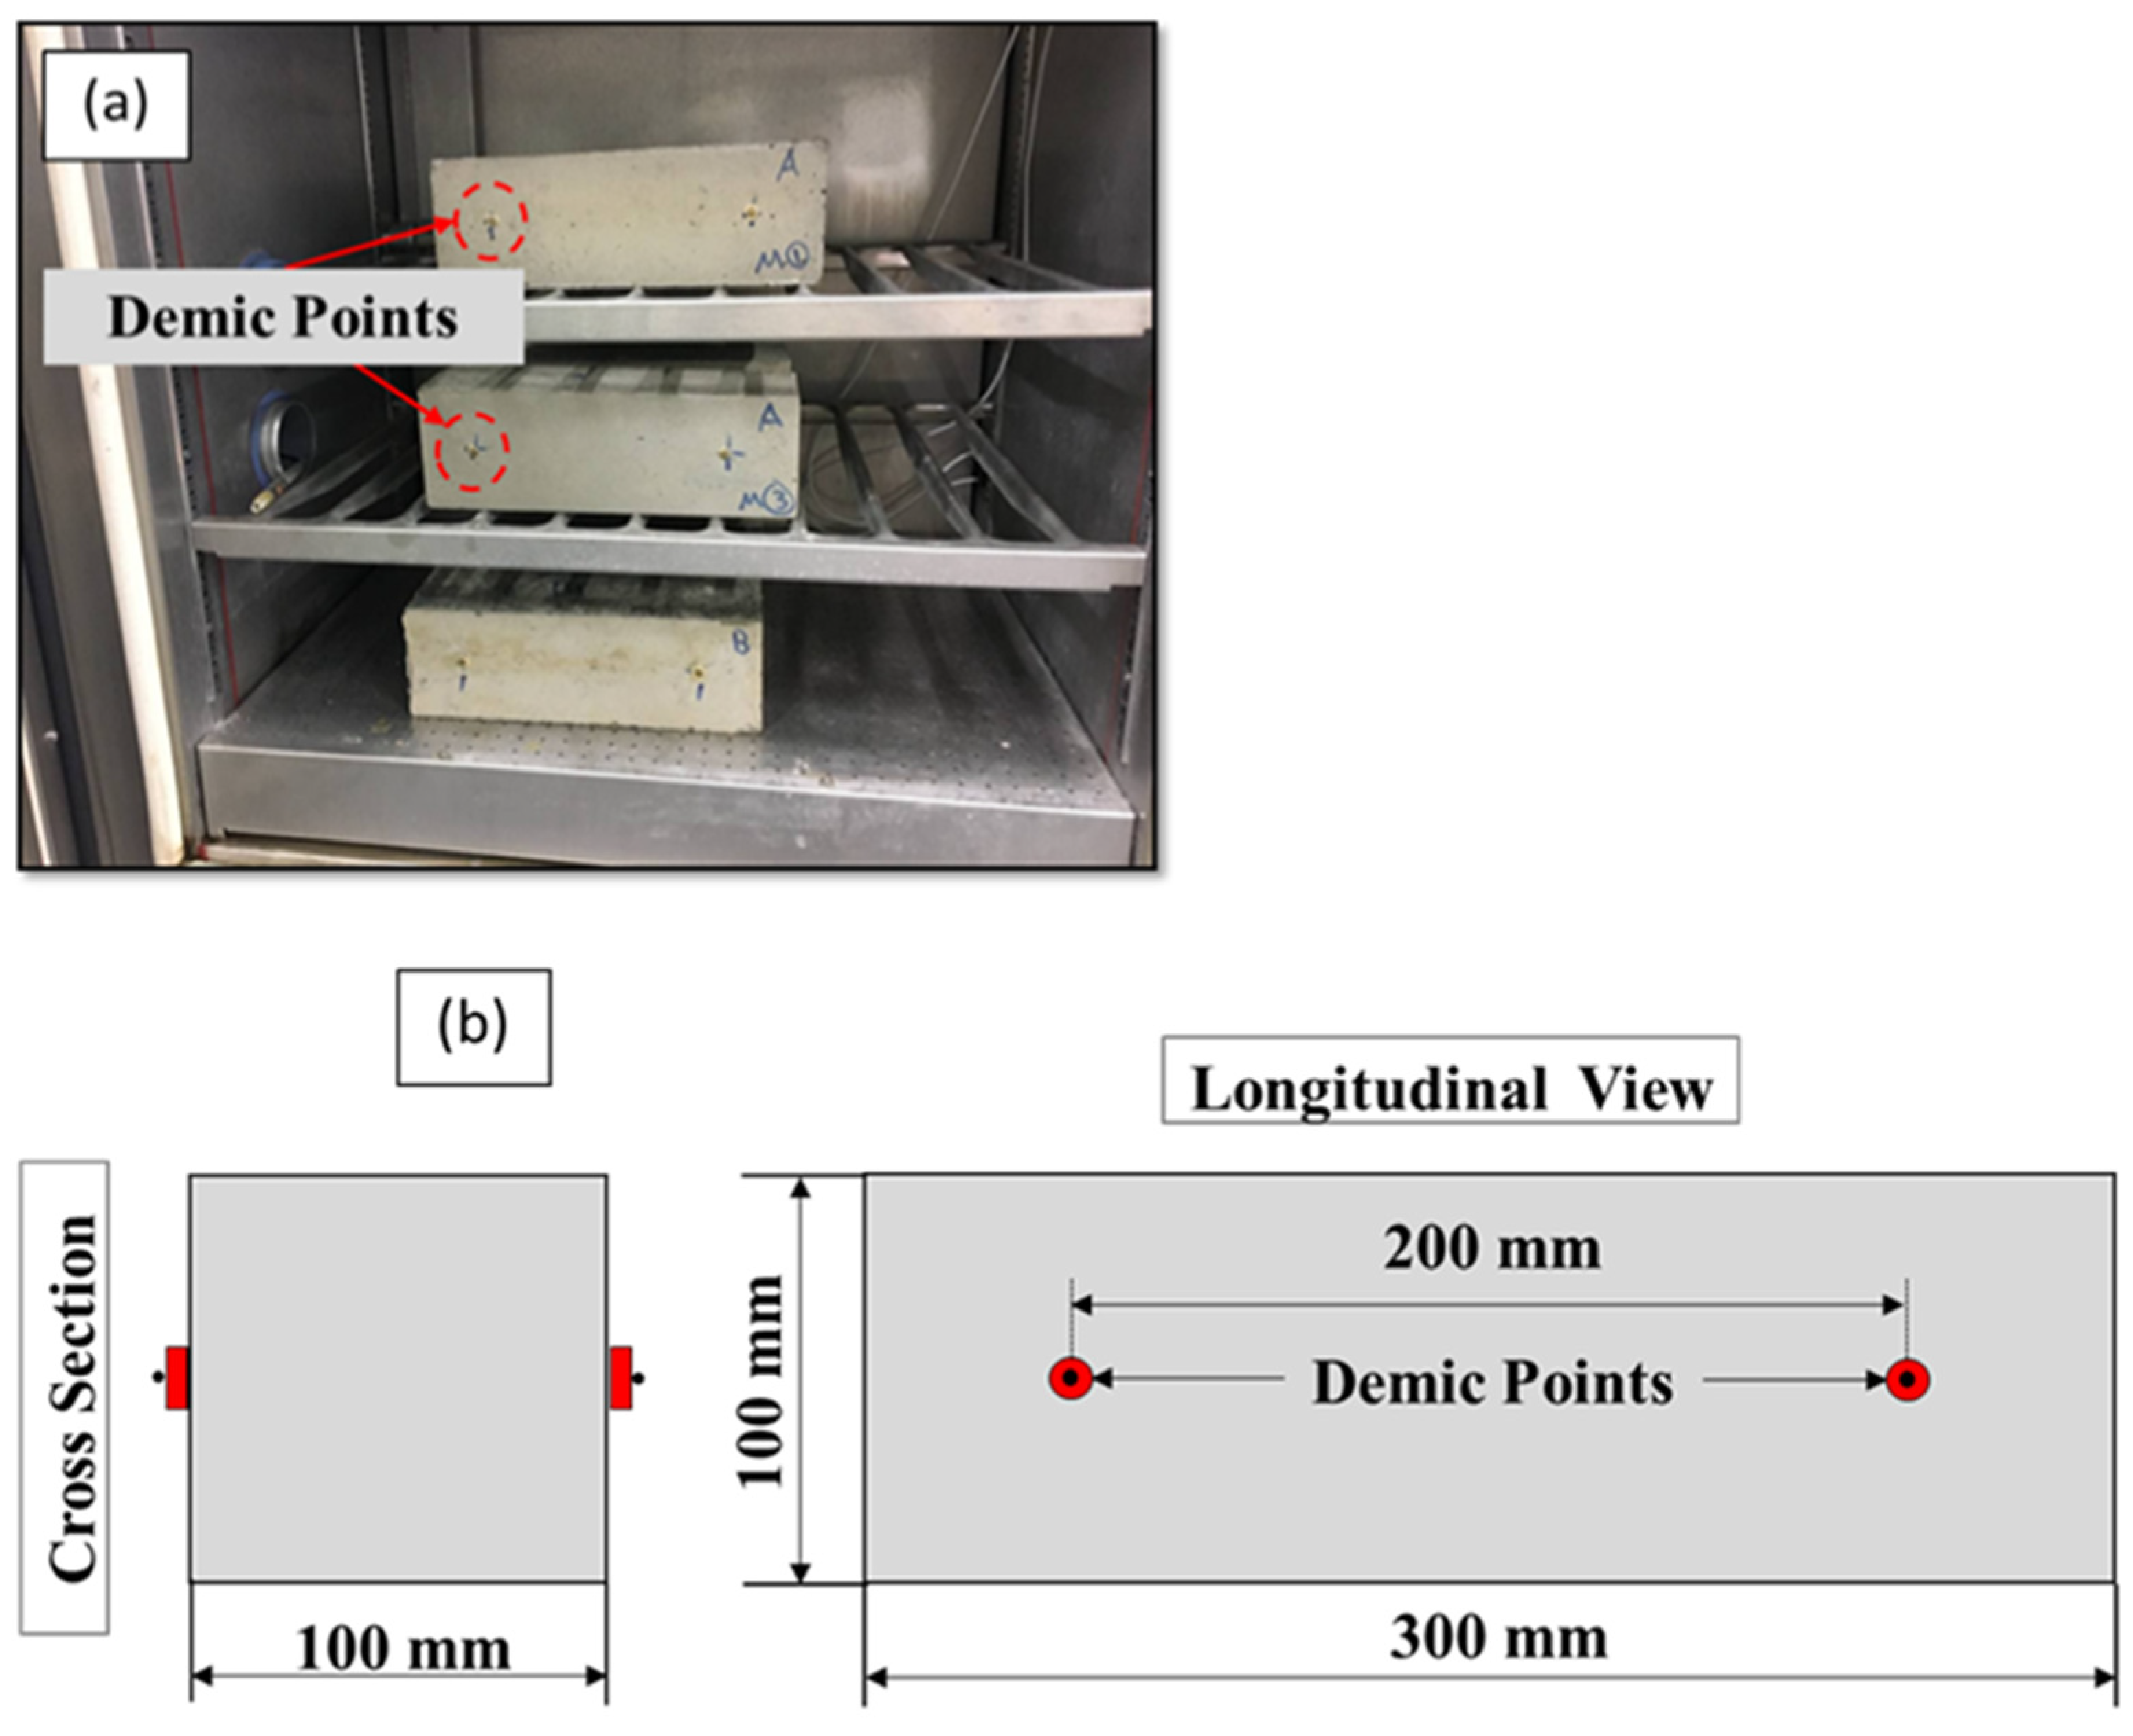
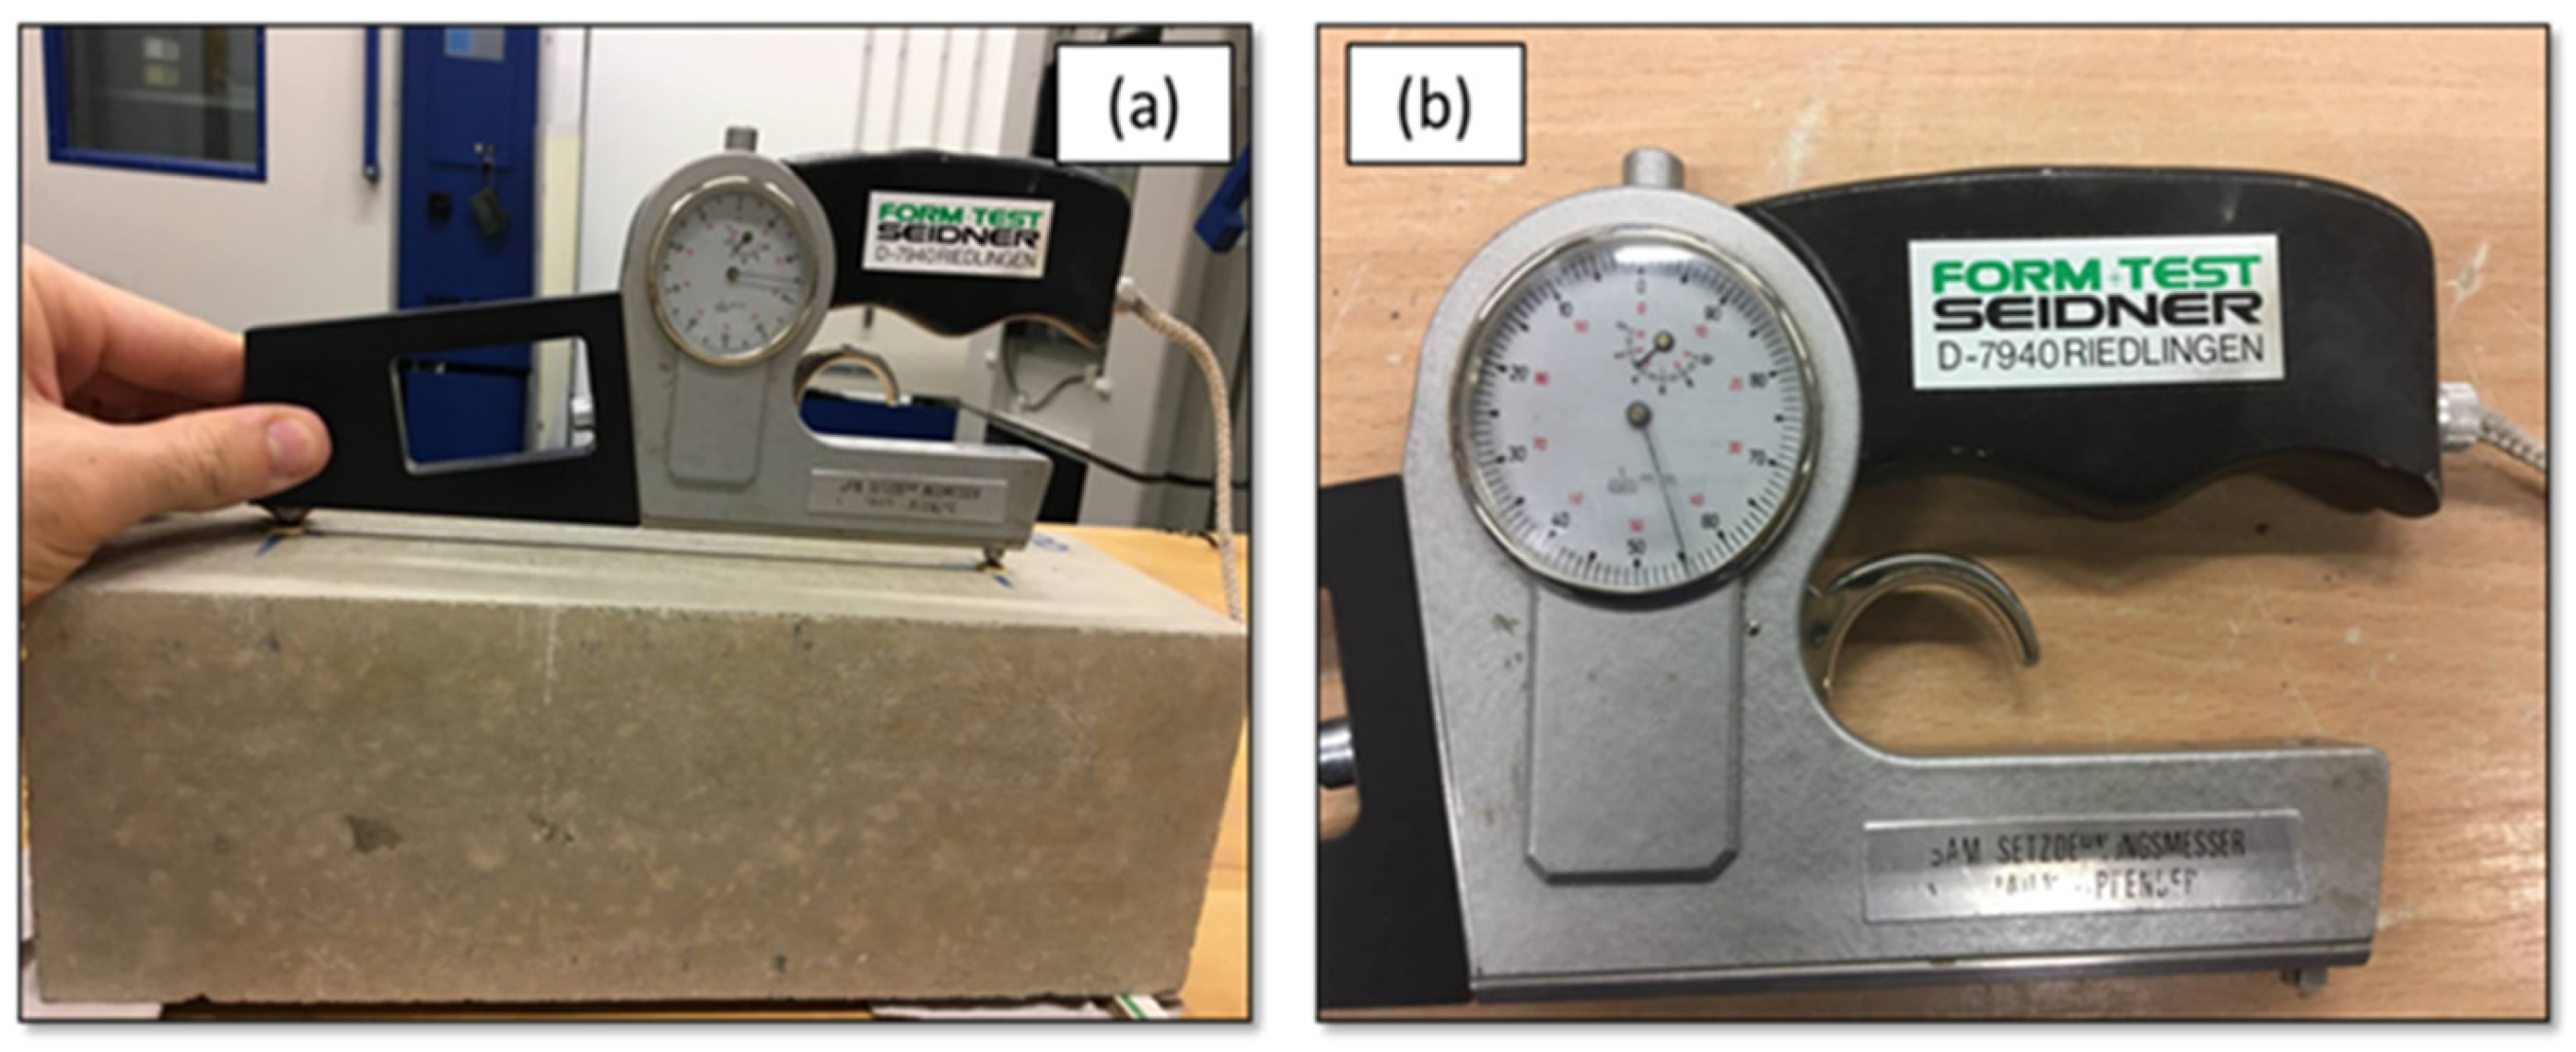
4.4.2. Free Drying Shrinkage
5. Result and Discussion
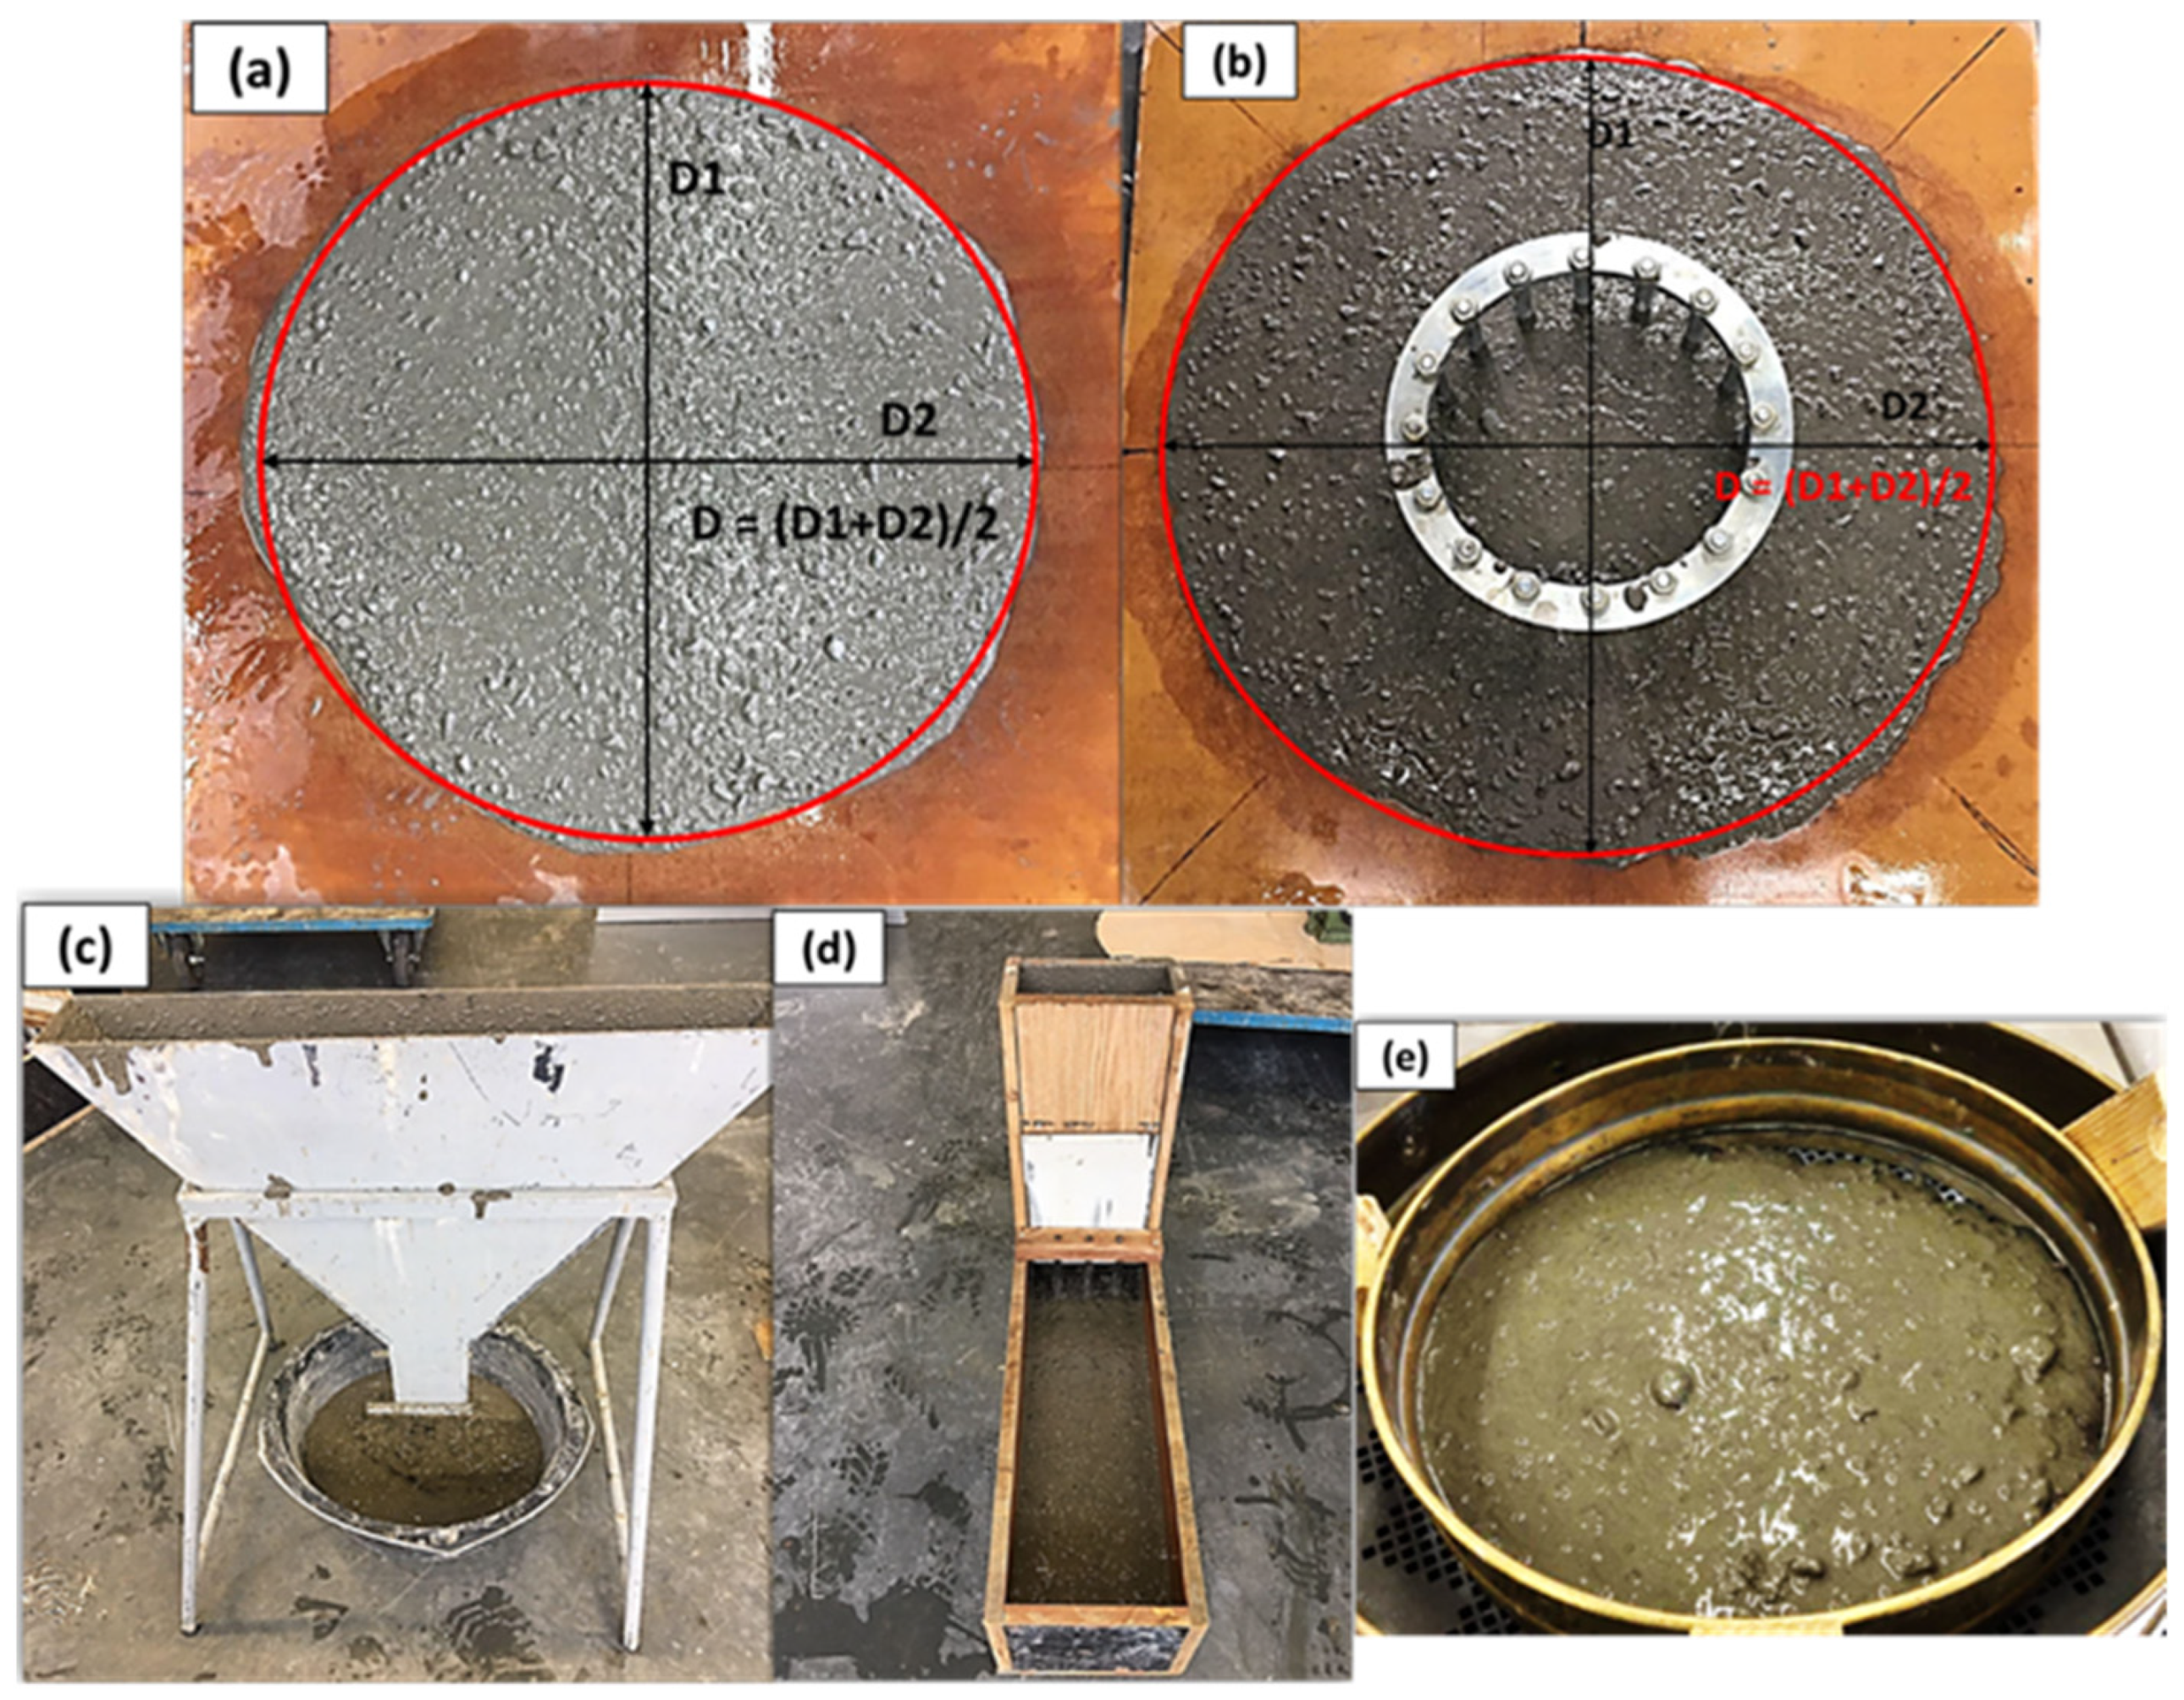
5.1. Fresh Properties
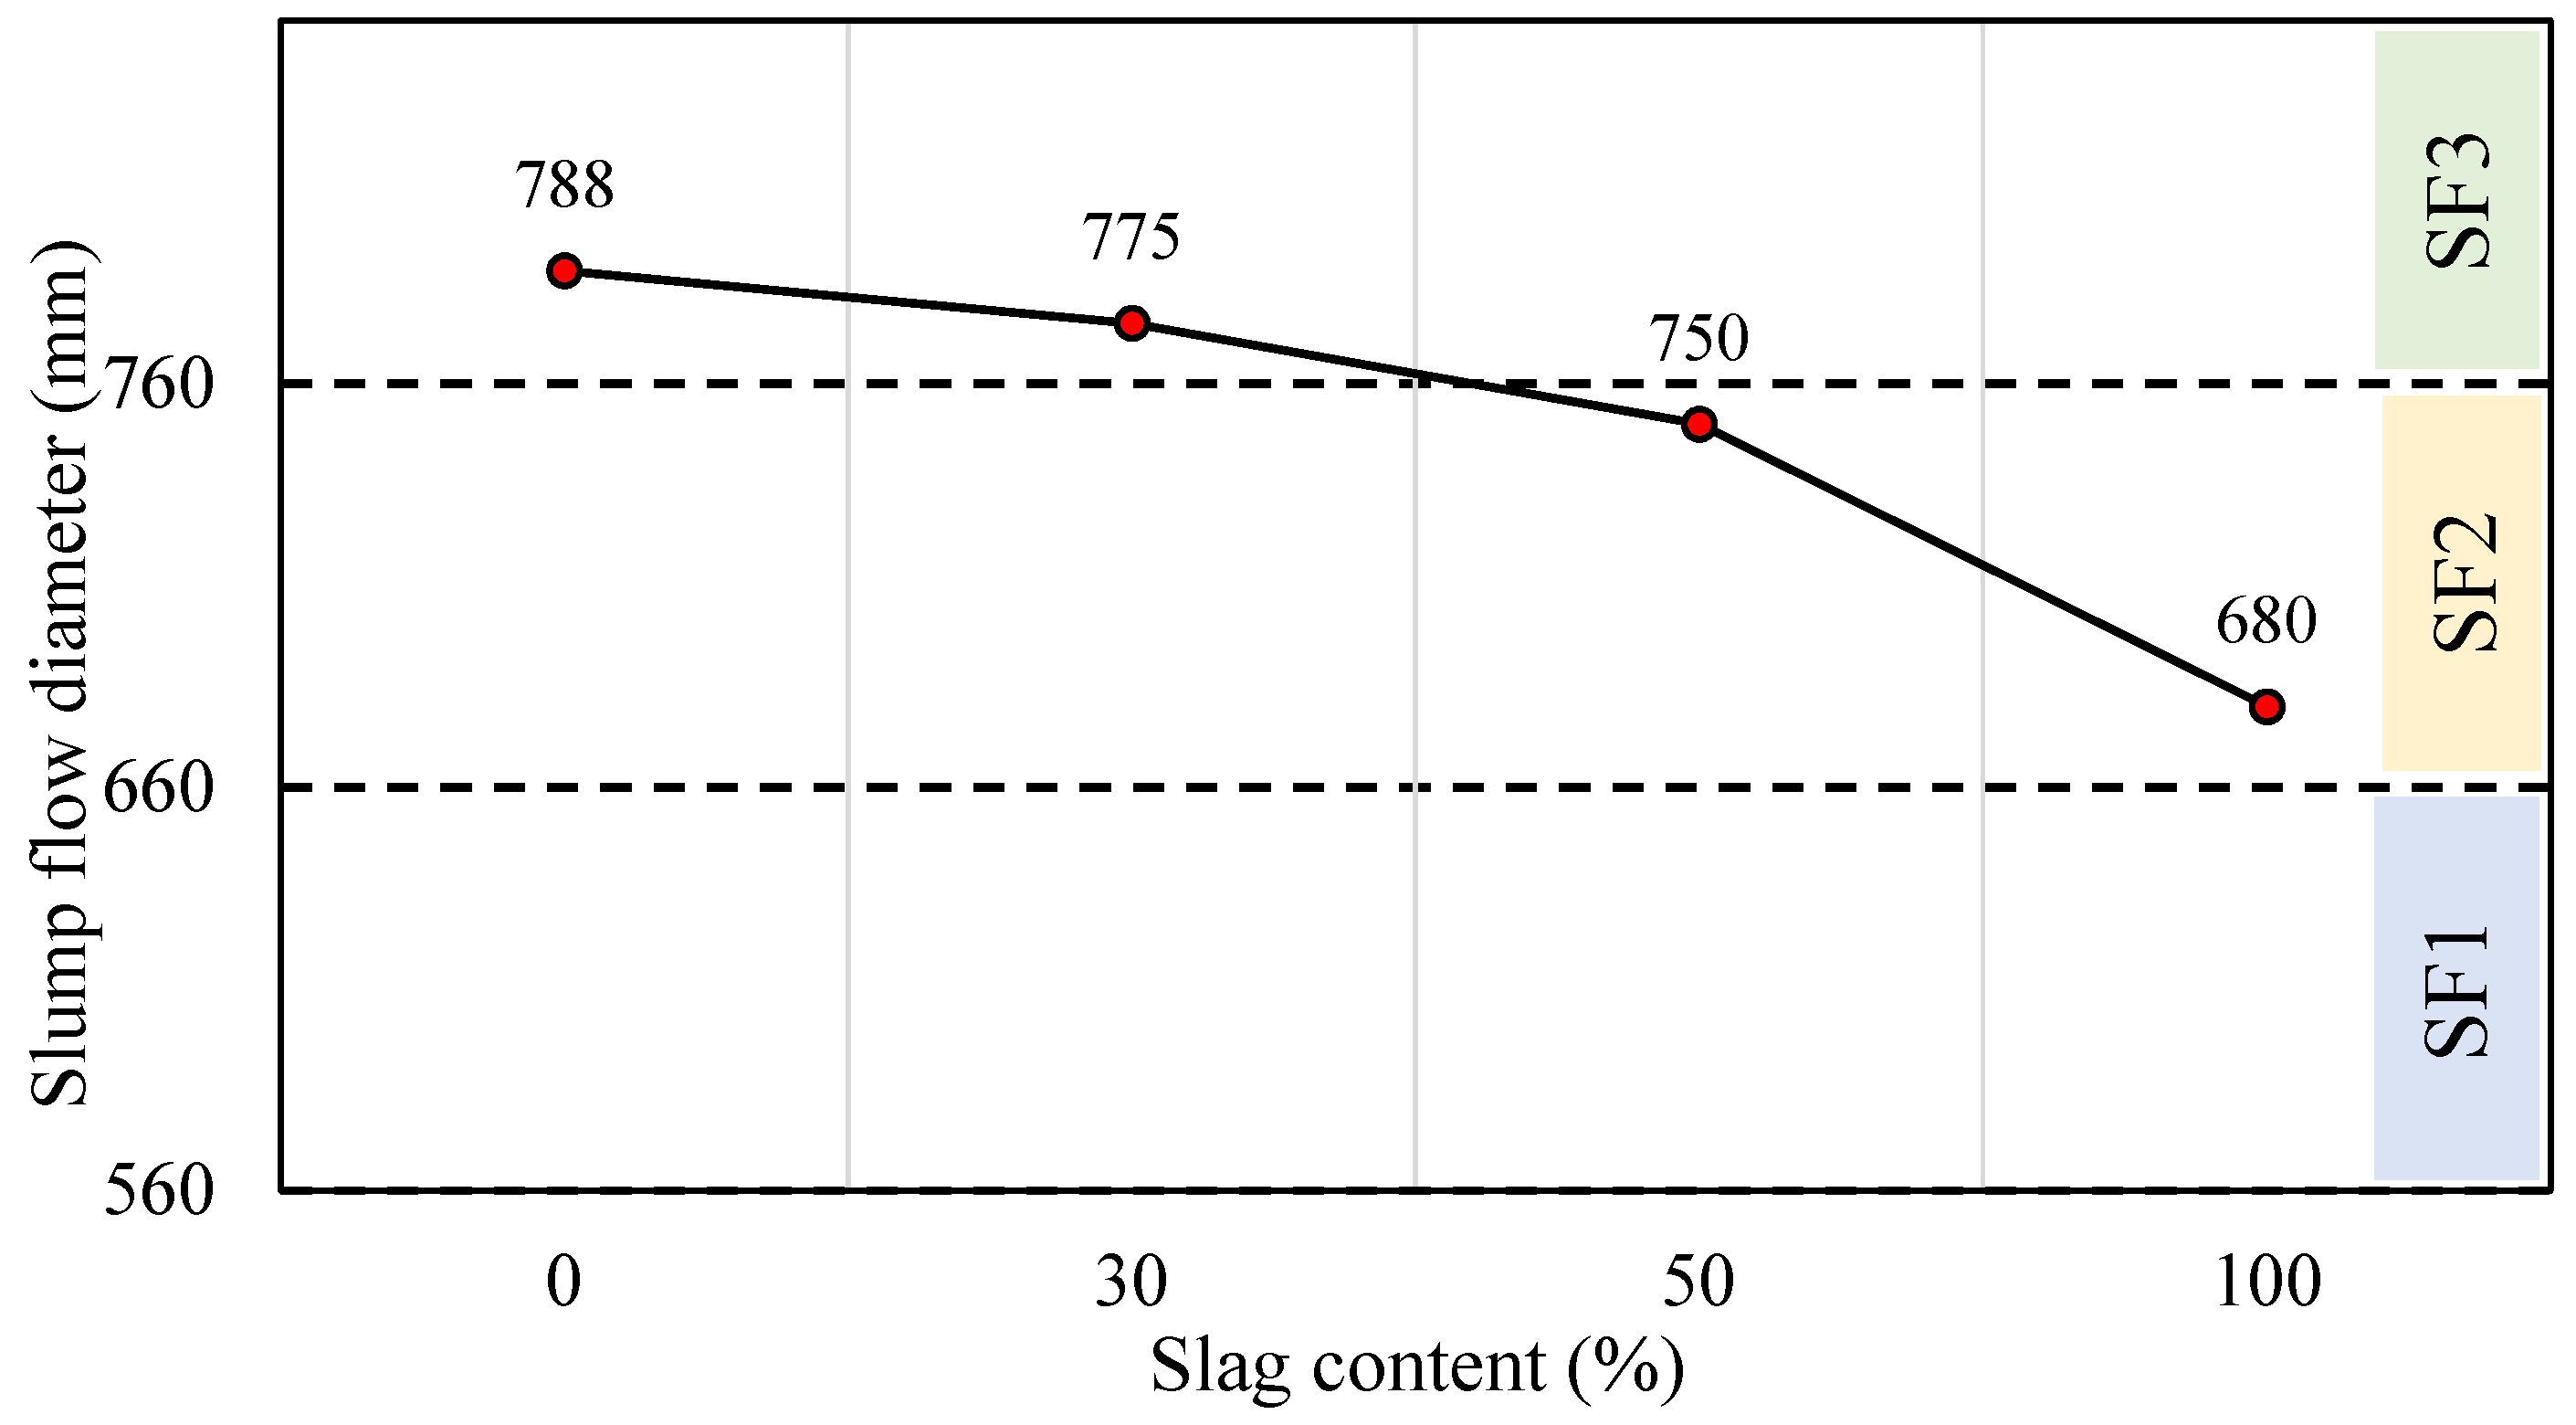
5.1.1. Slump Flow Diameter
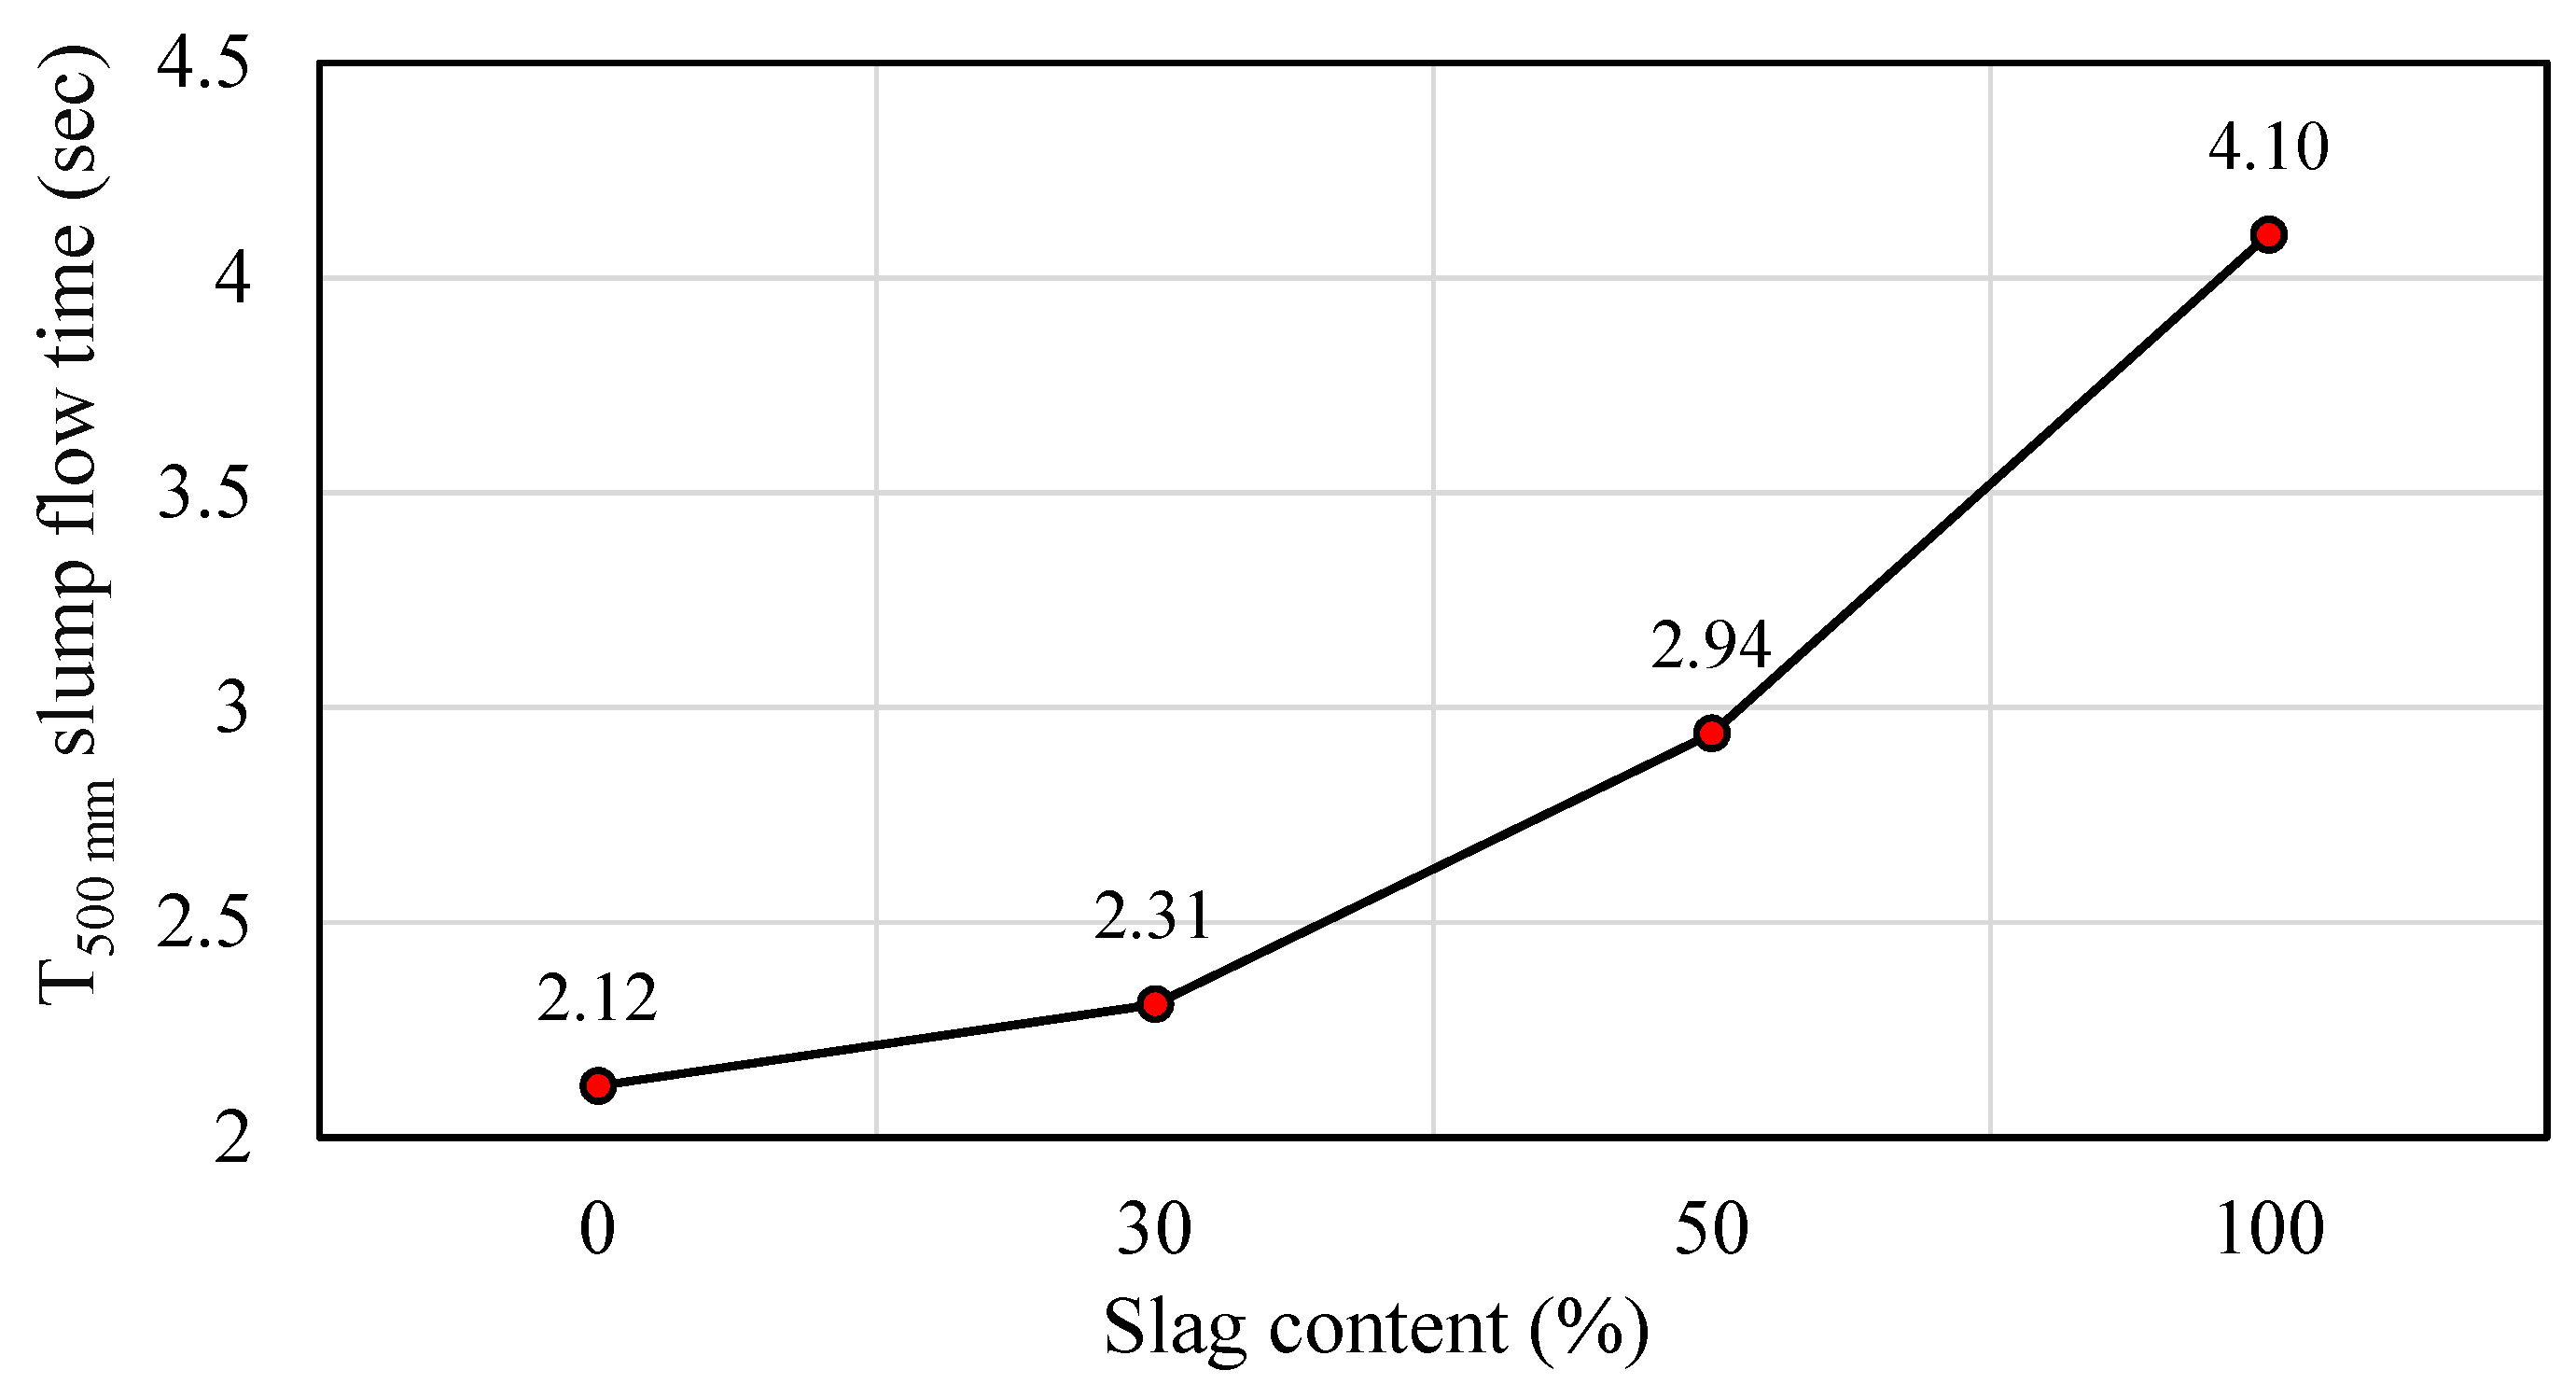
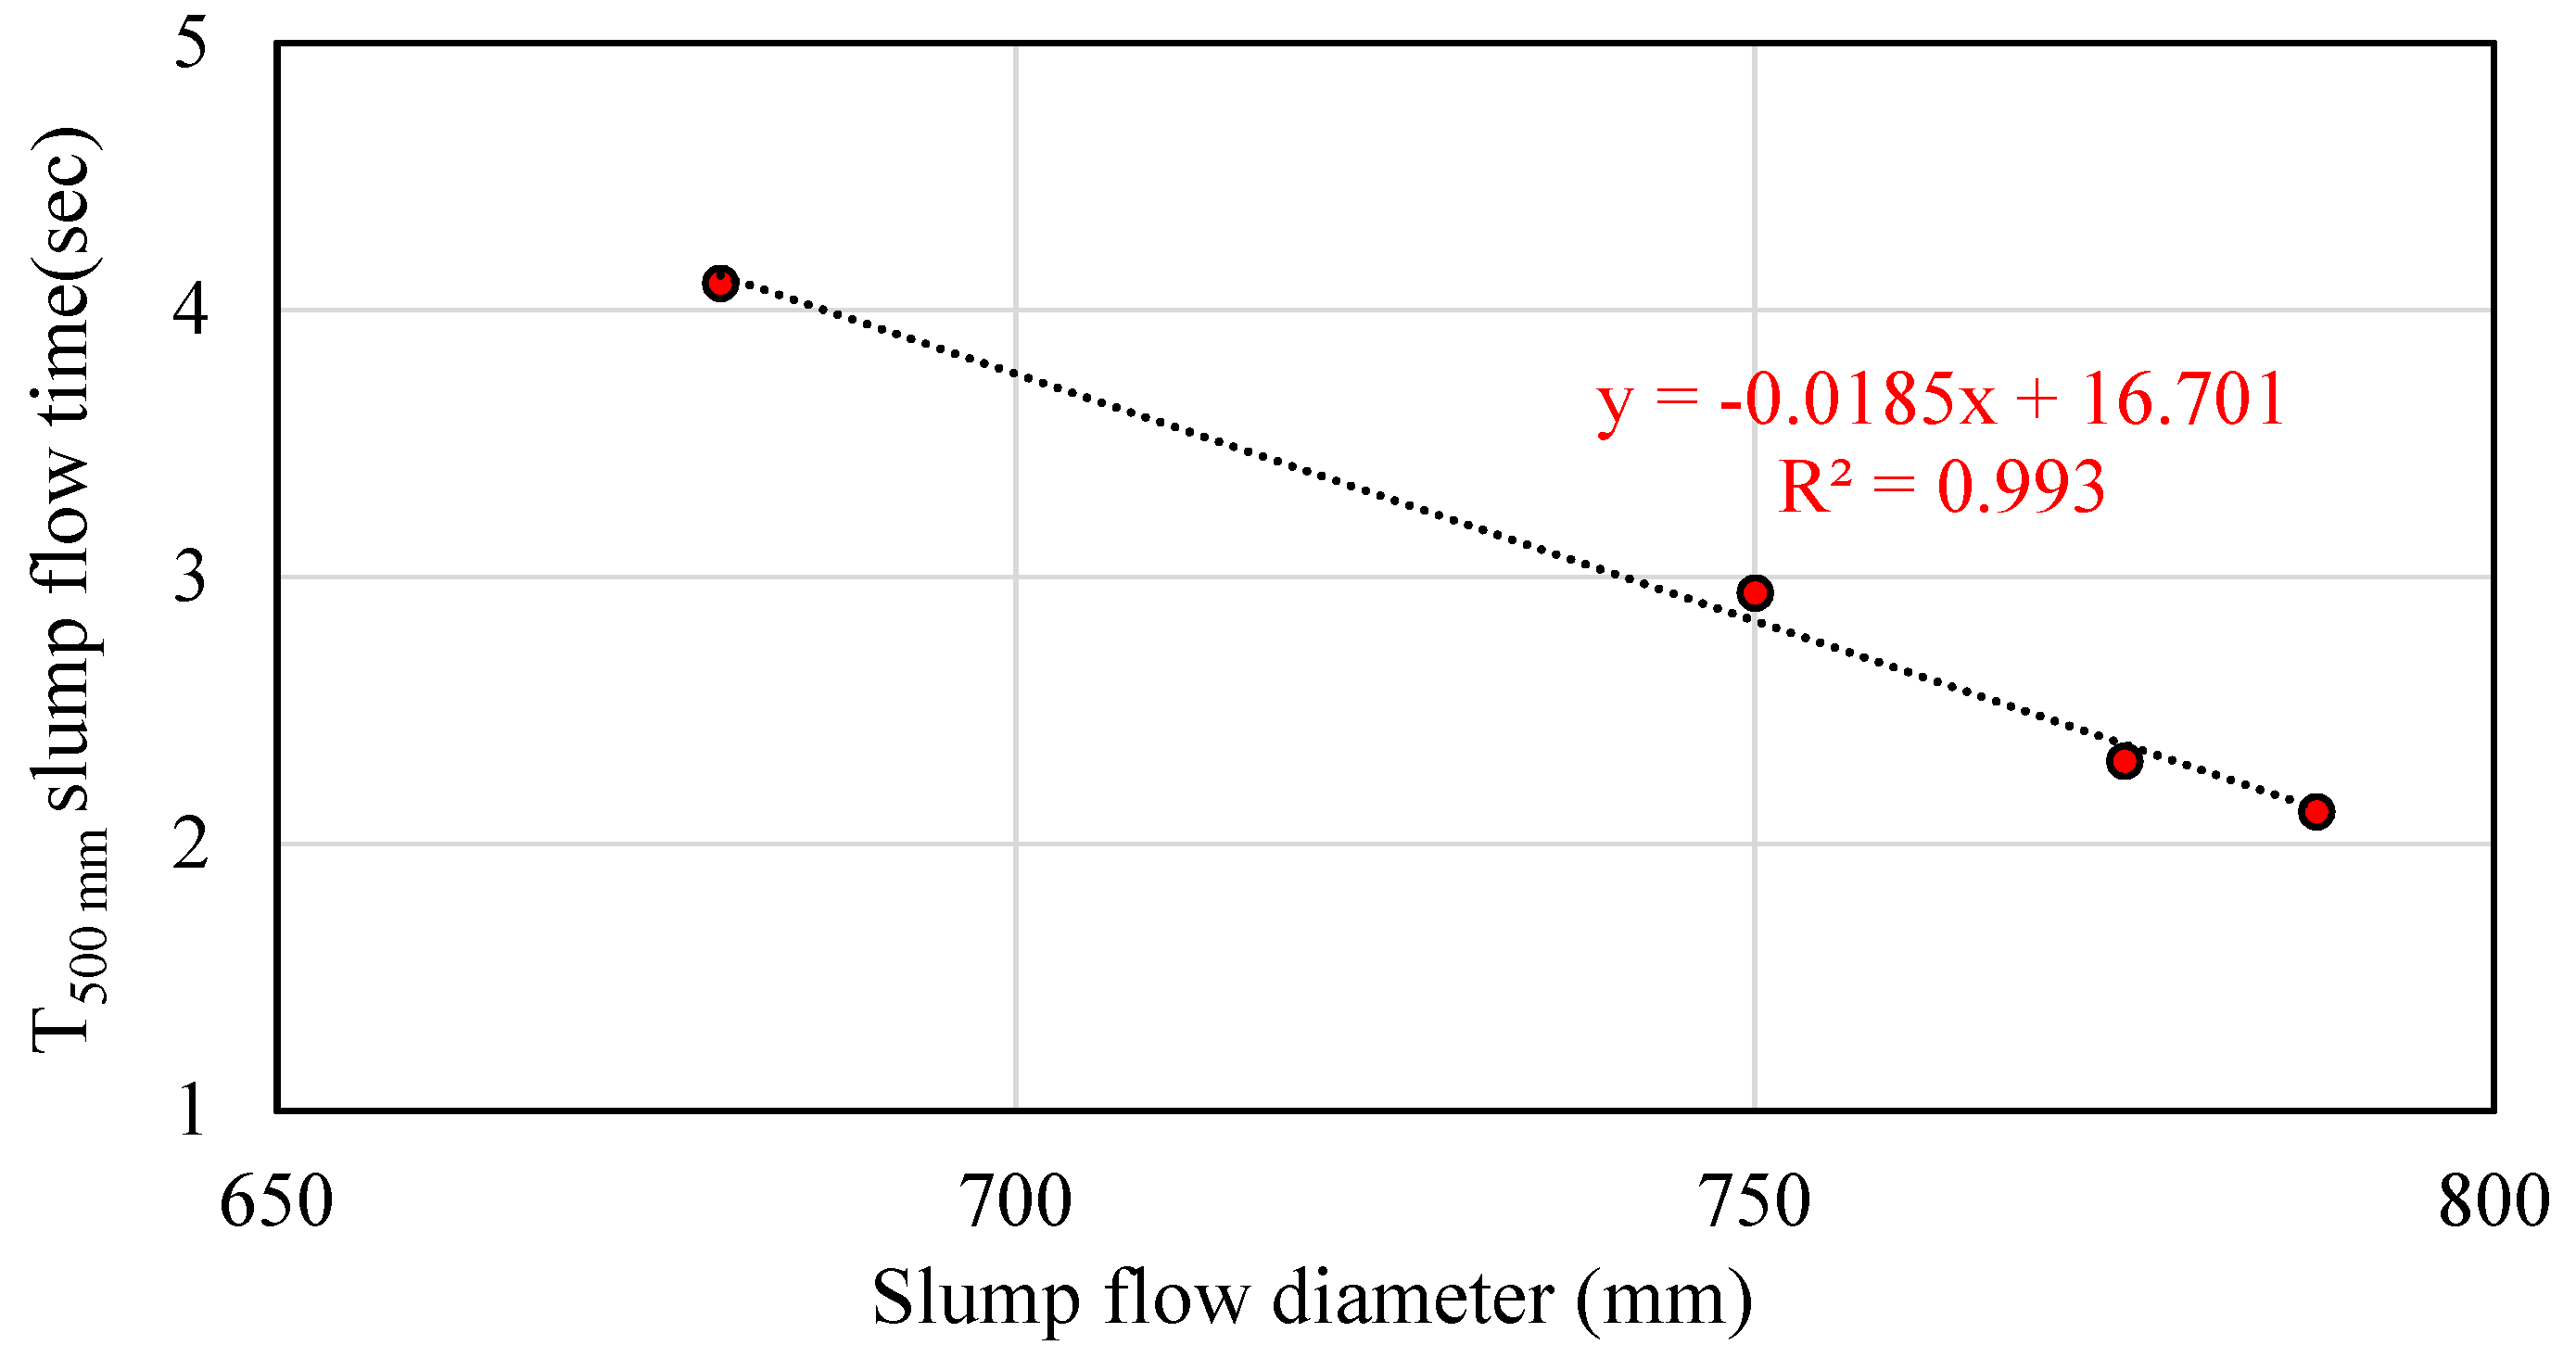
5.1.2. T500 mm Slump Flow Time
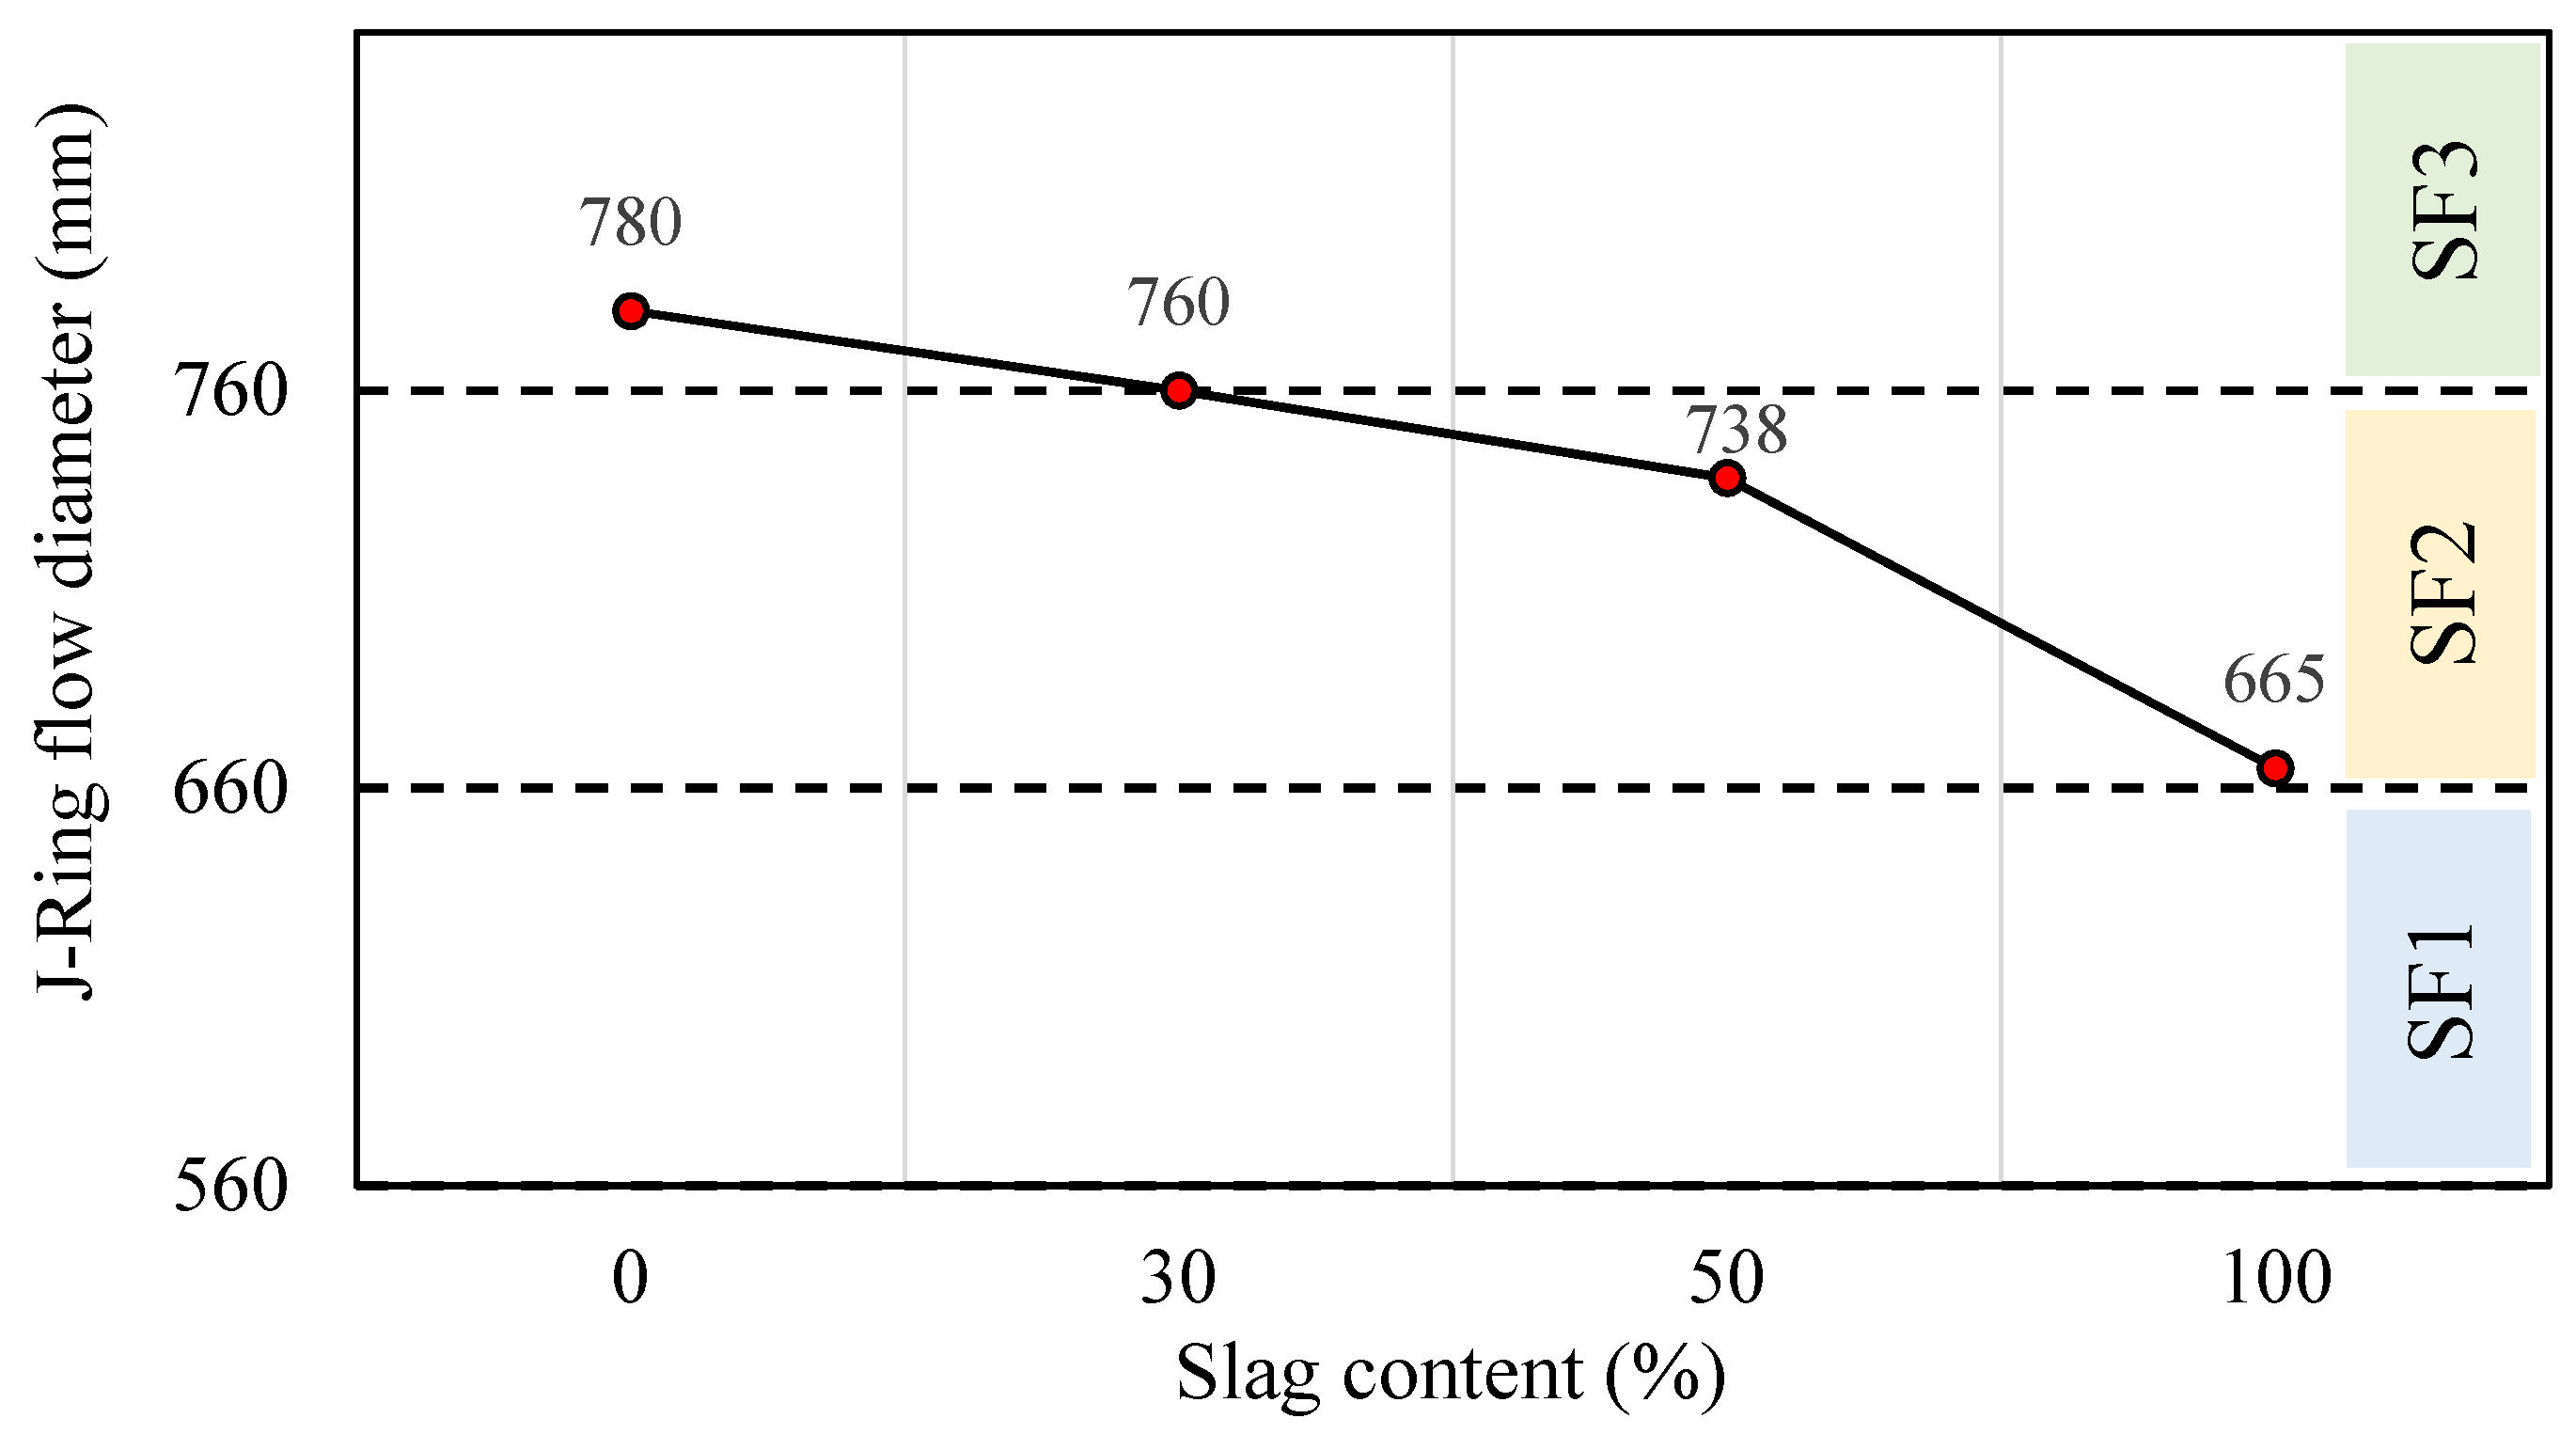
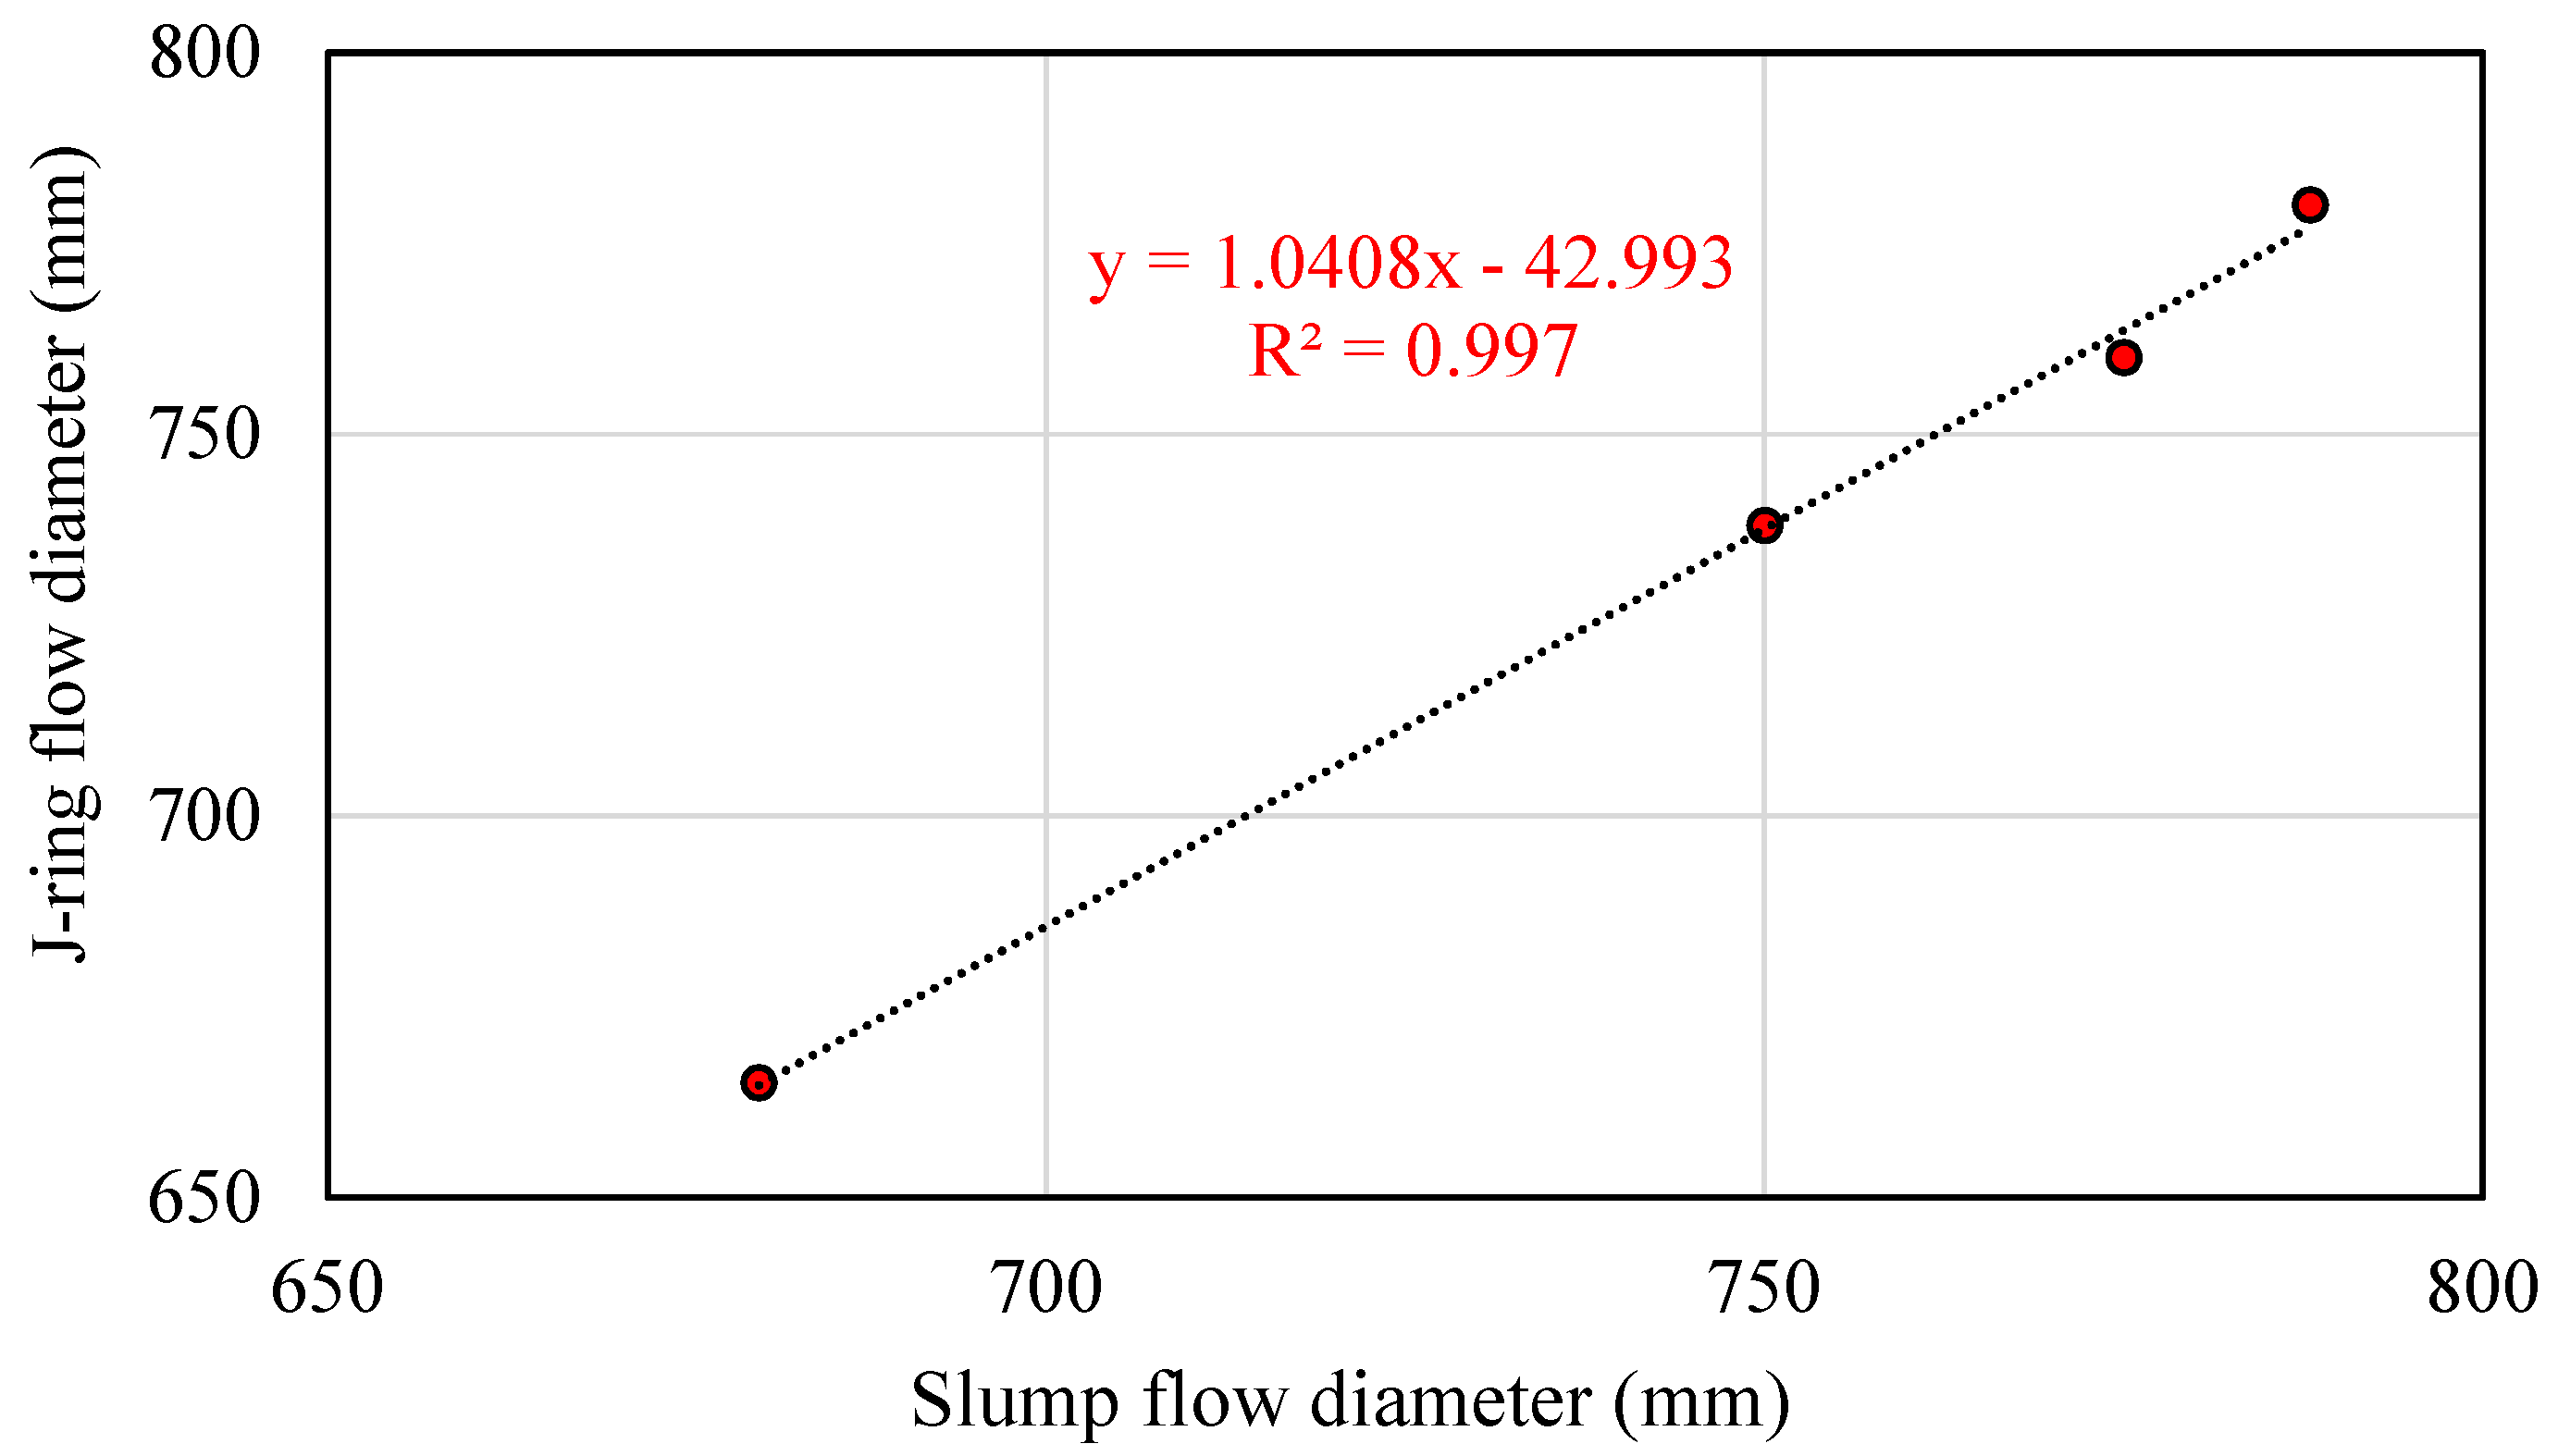
5.1.3. J-Ring Flow Diameter
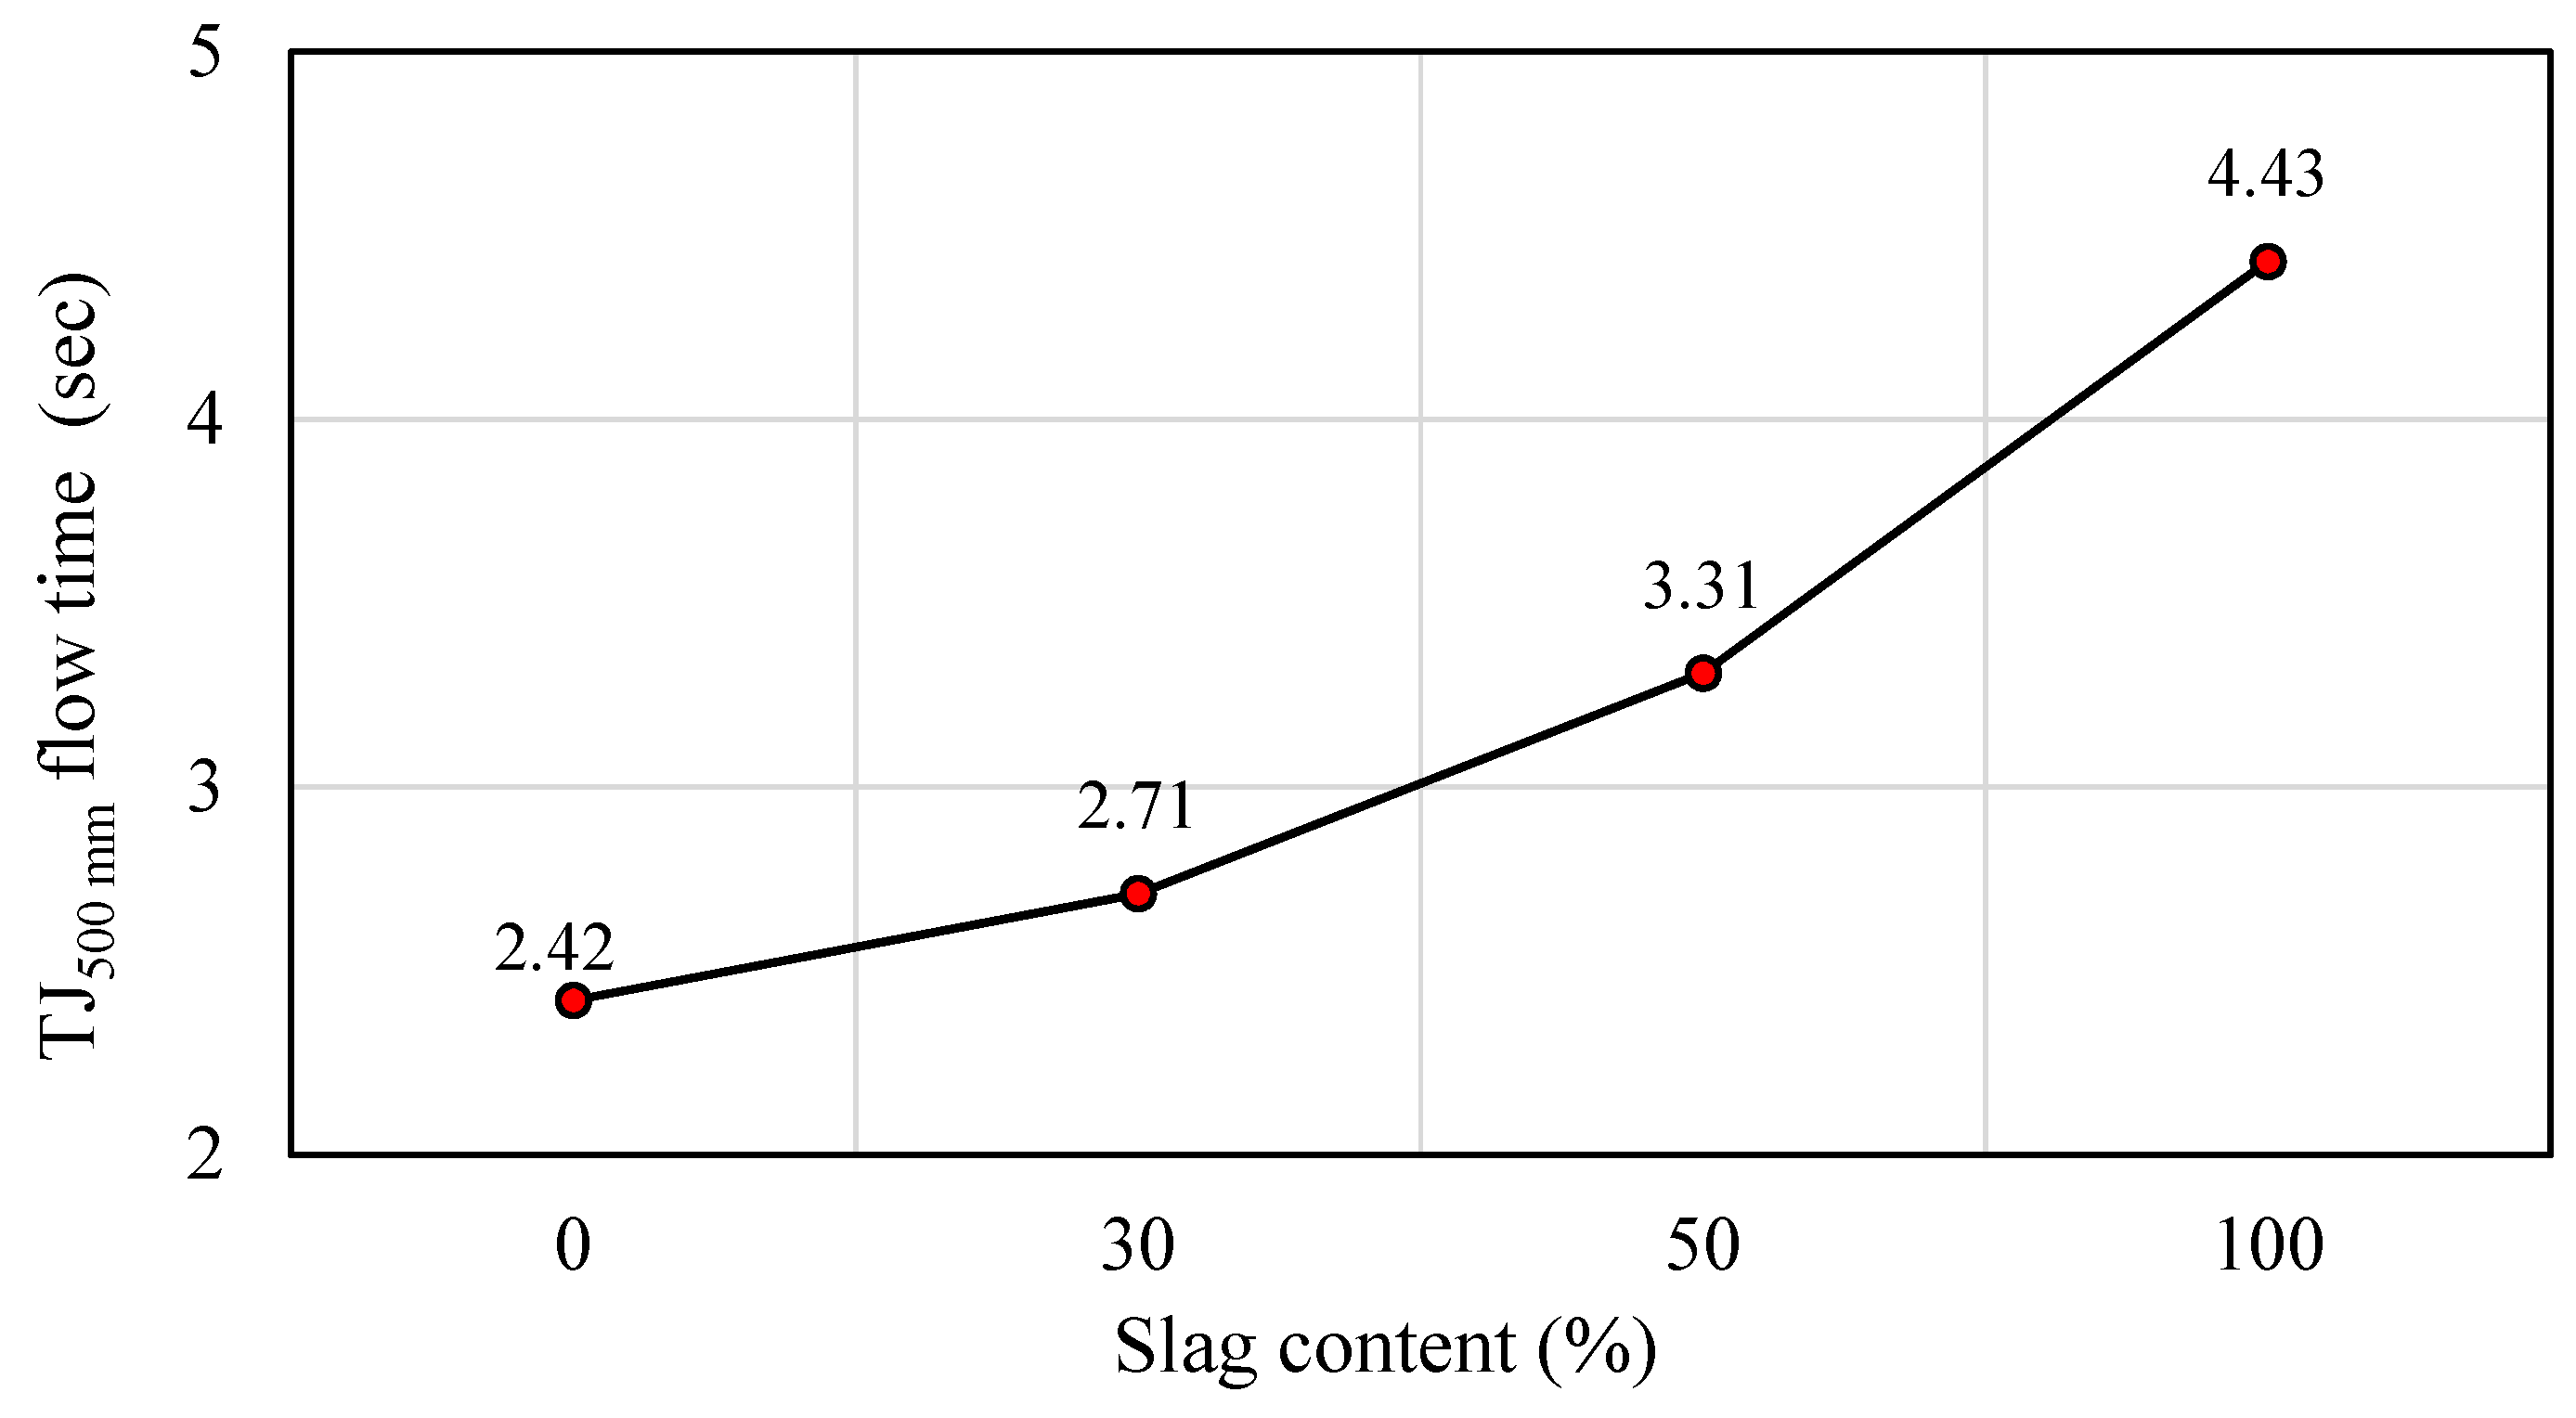
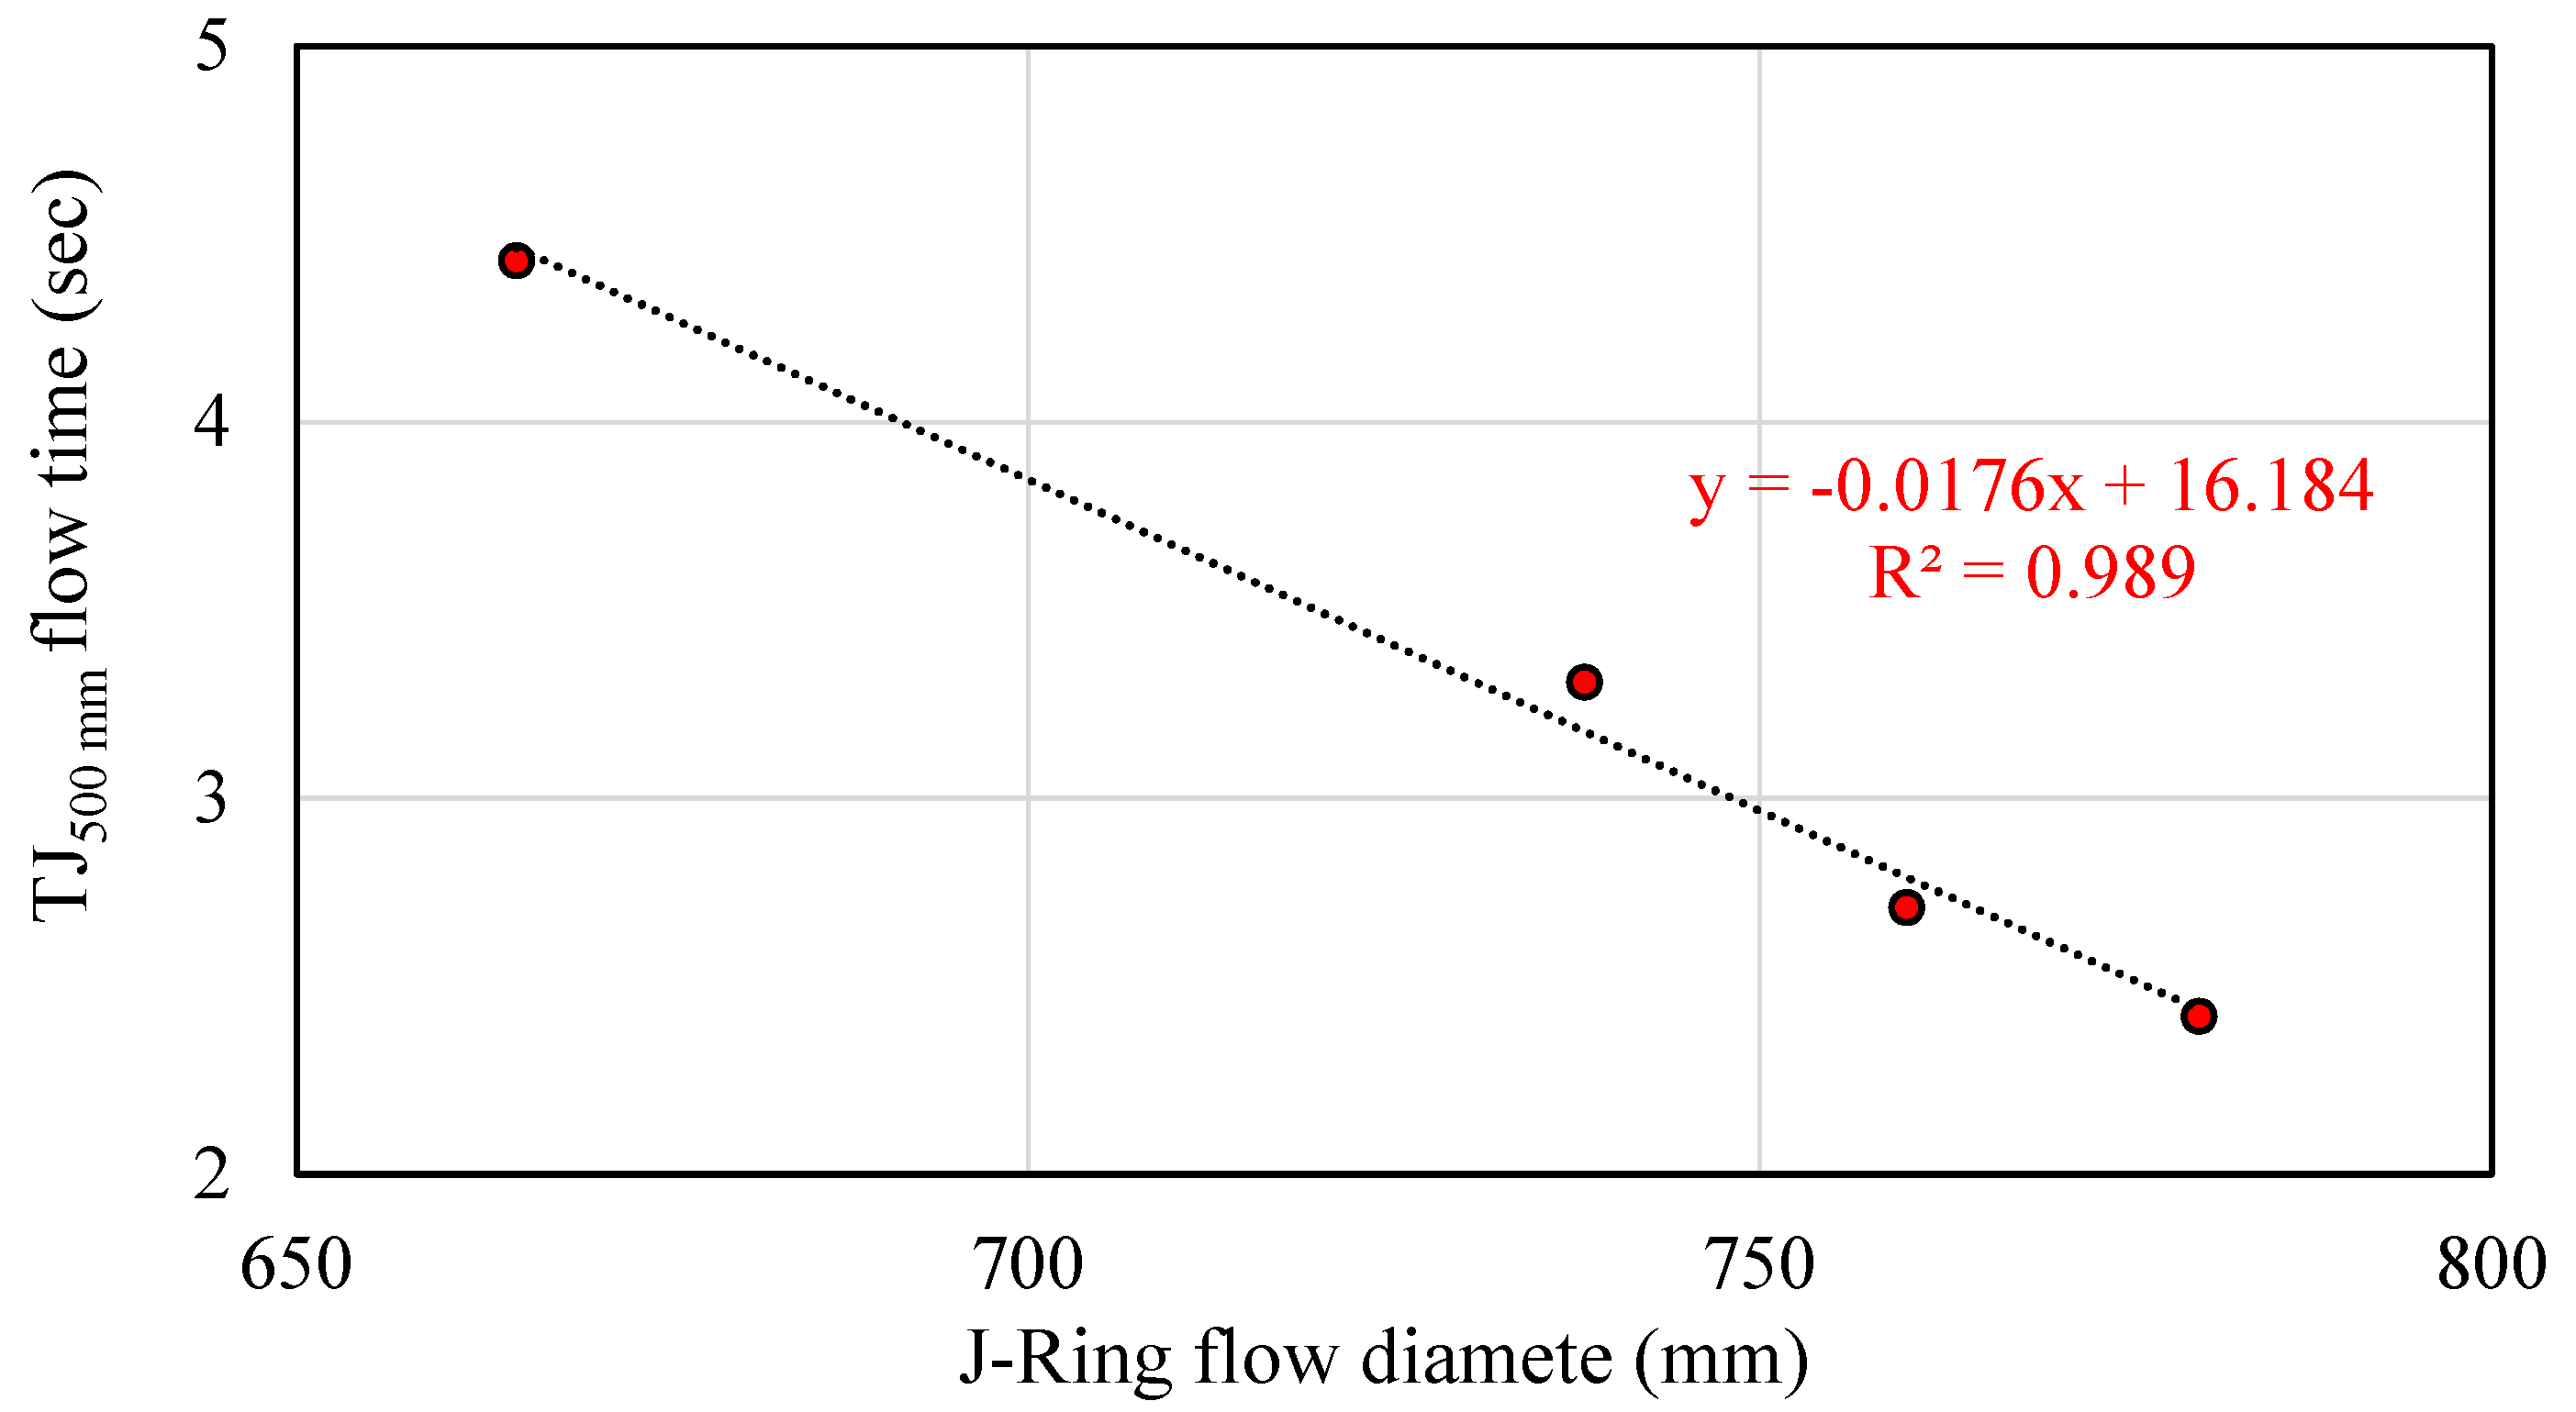
5.1.4. TJ500 mm Flow Time
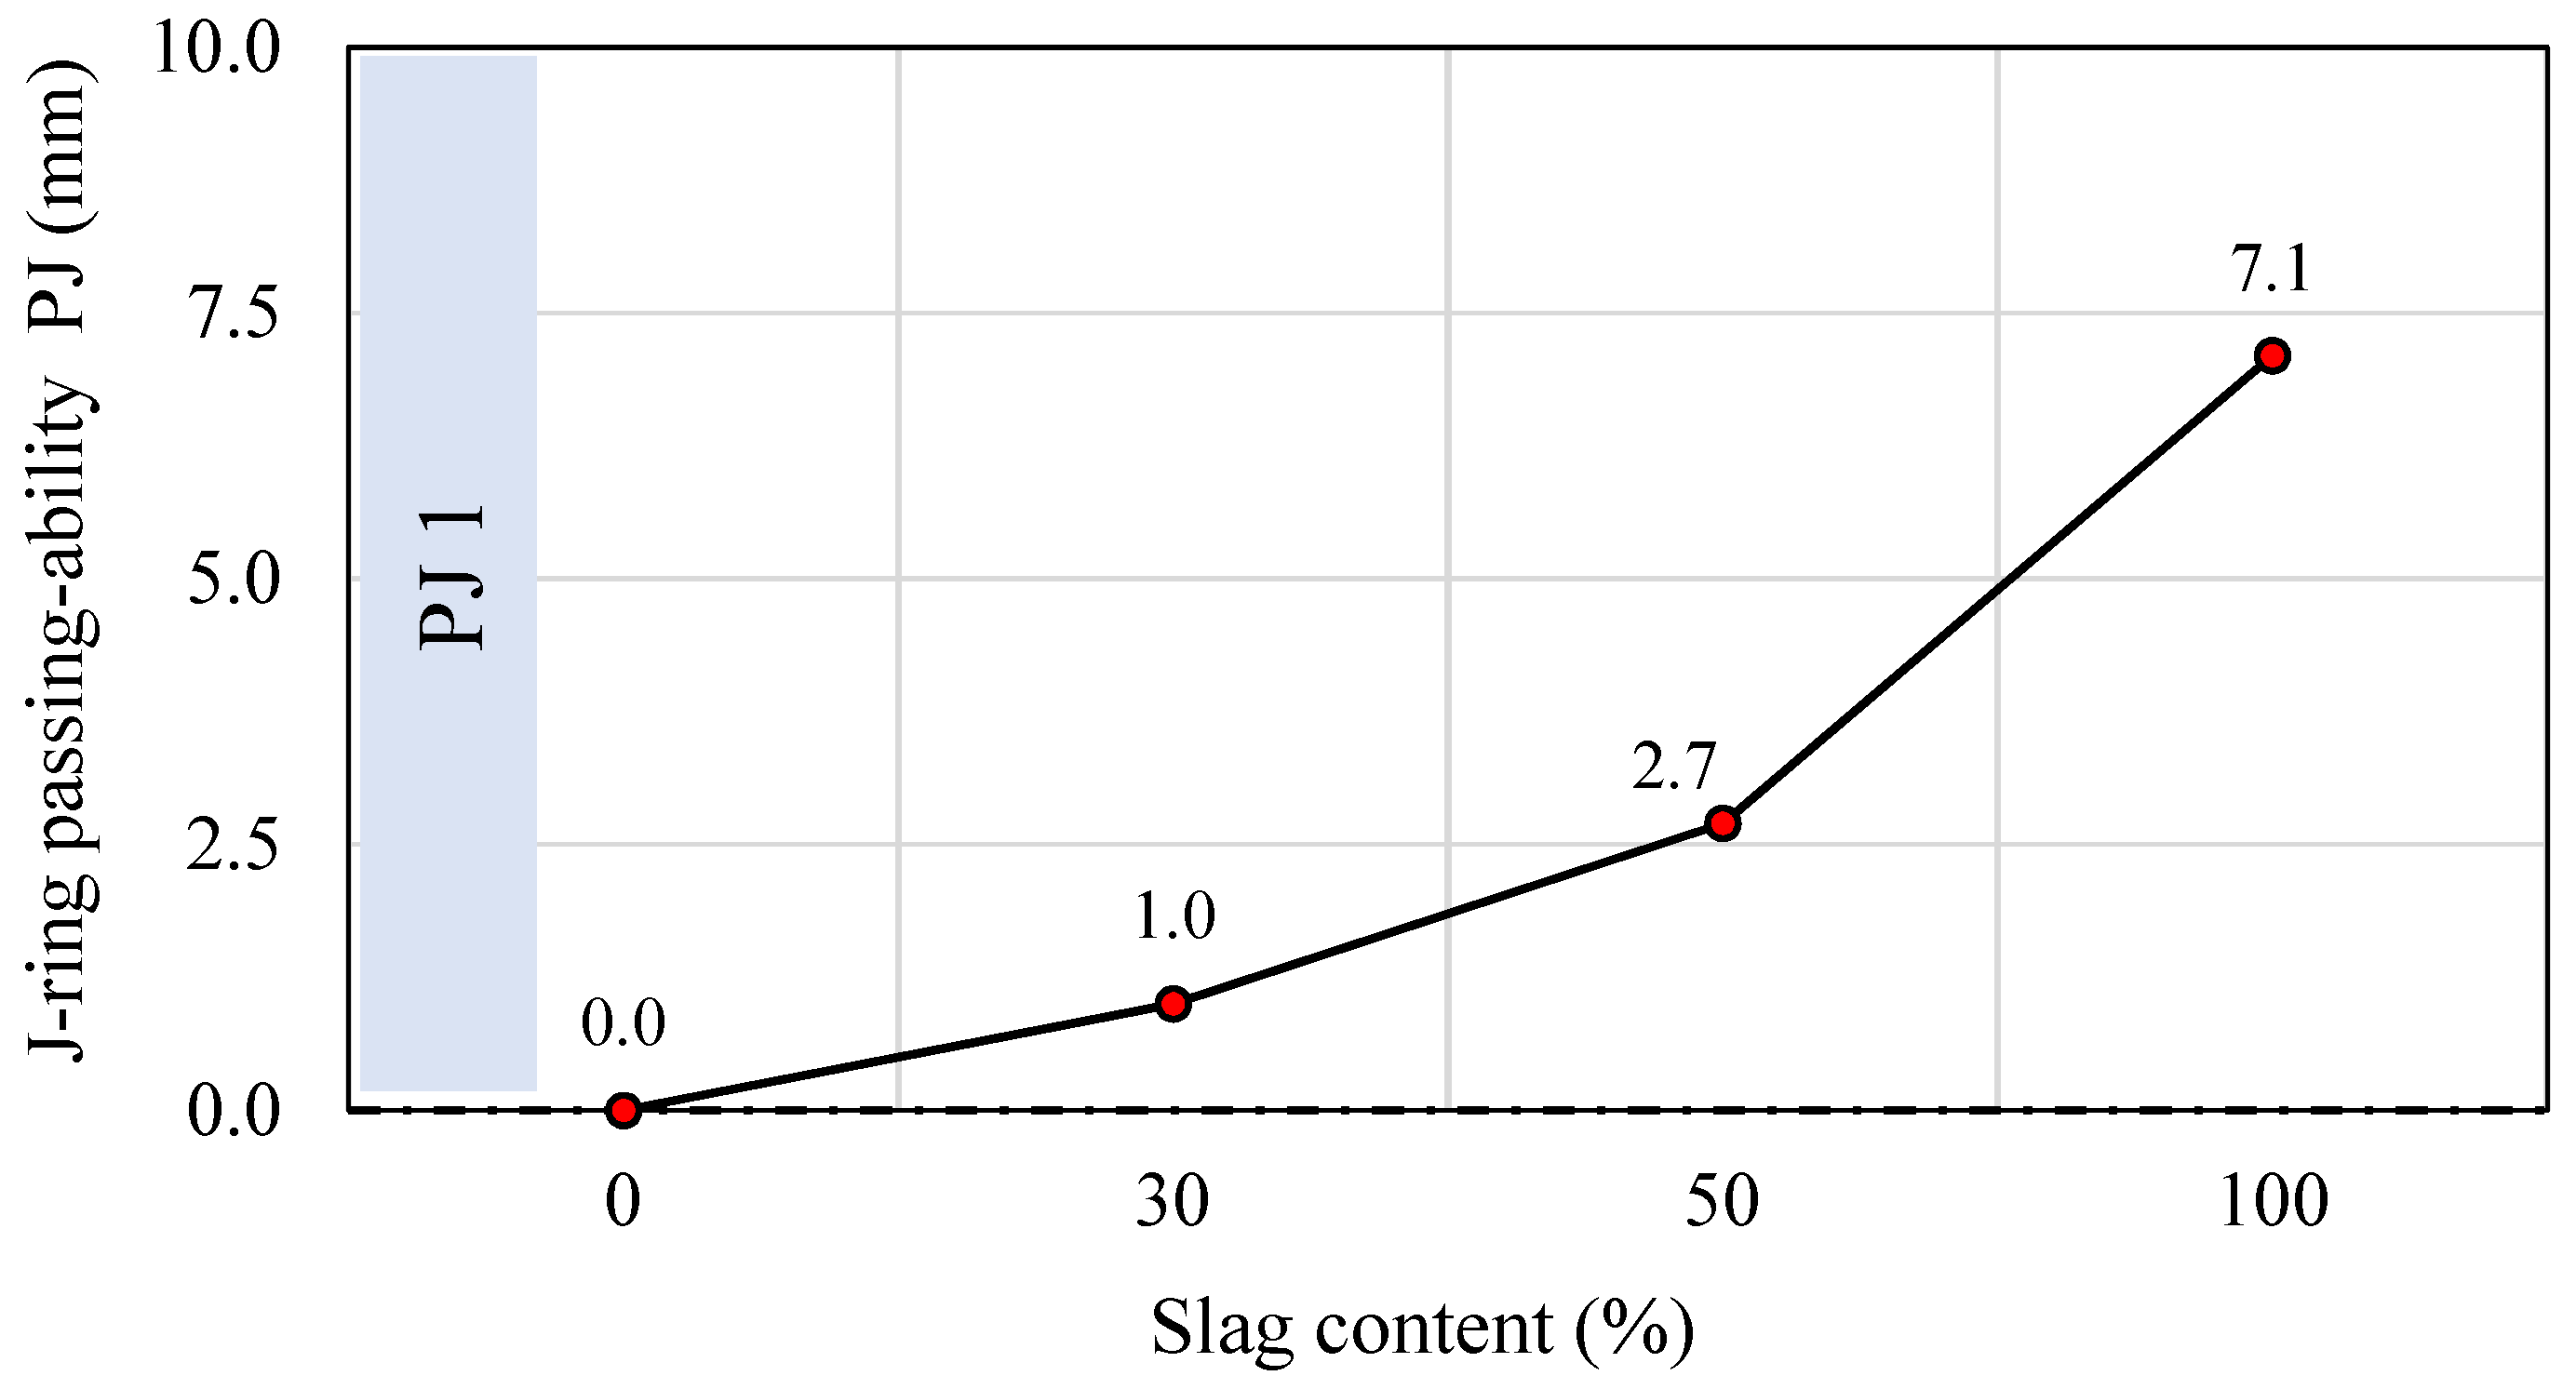
5.1.5. J-Ring Passing-Ability
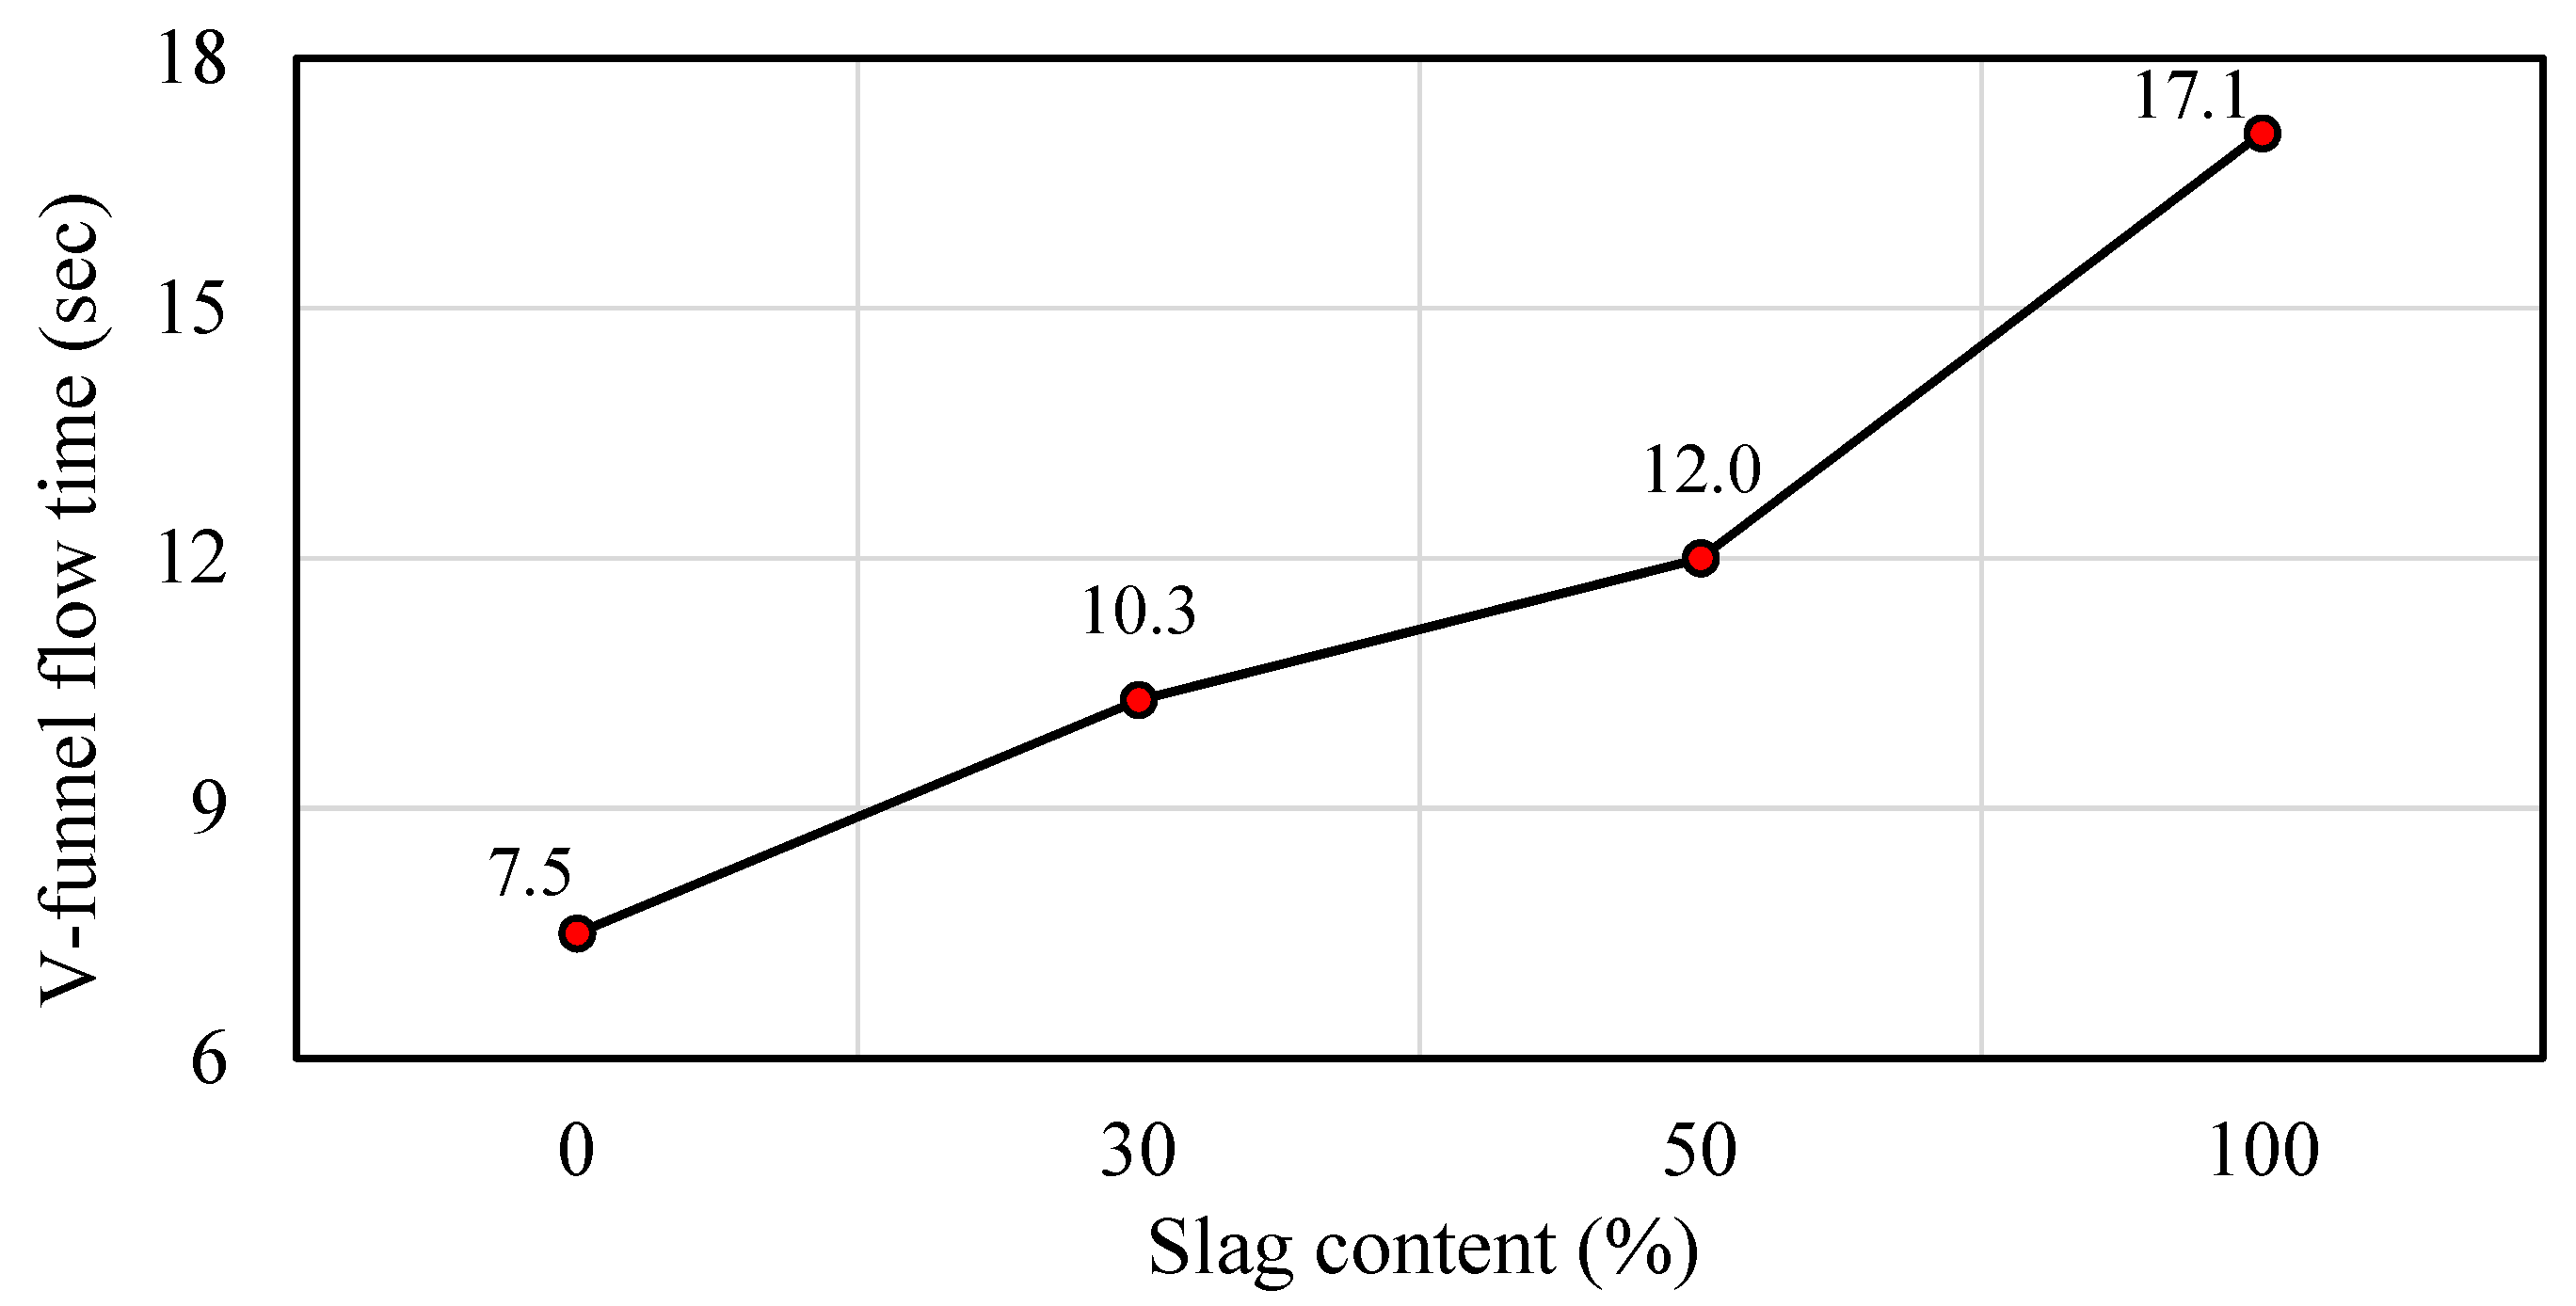
5.1.6. V-Funnel Flow Time
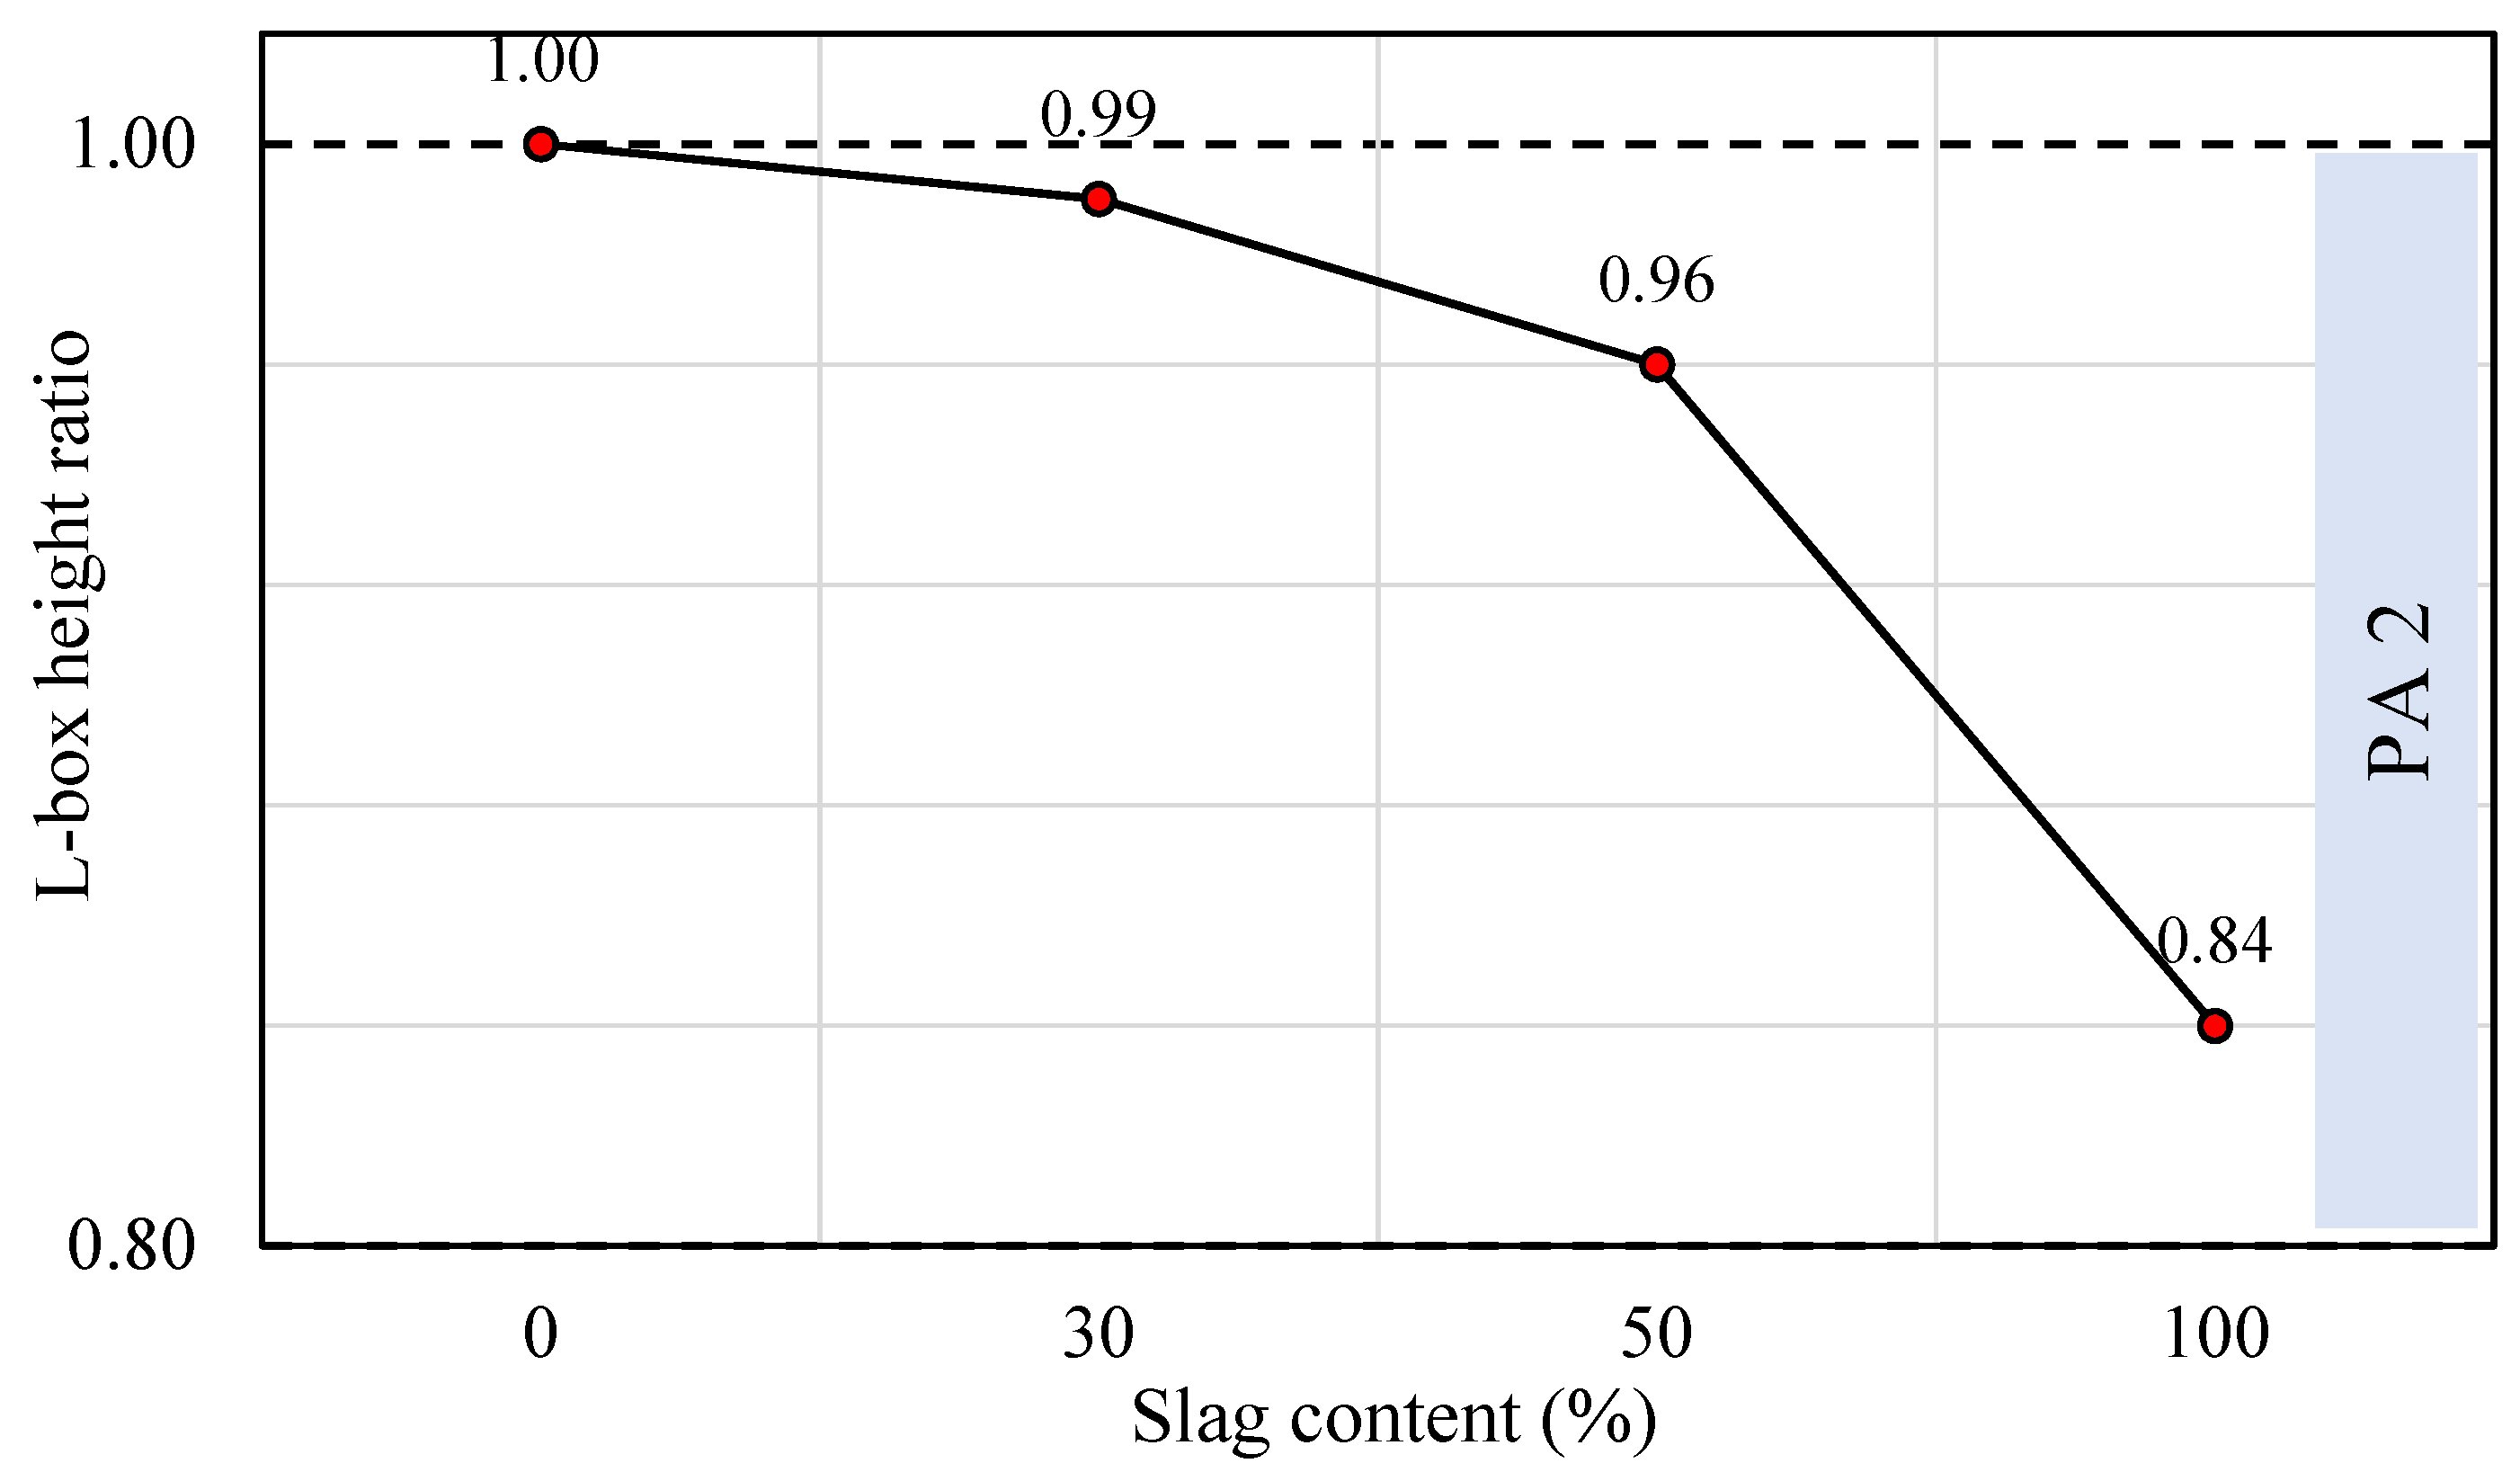
5.1.7. L-Box Height Ratio
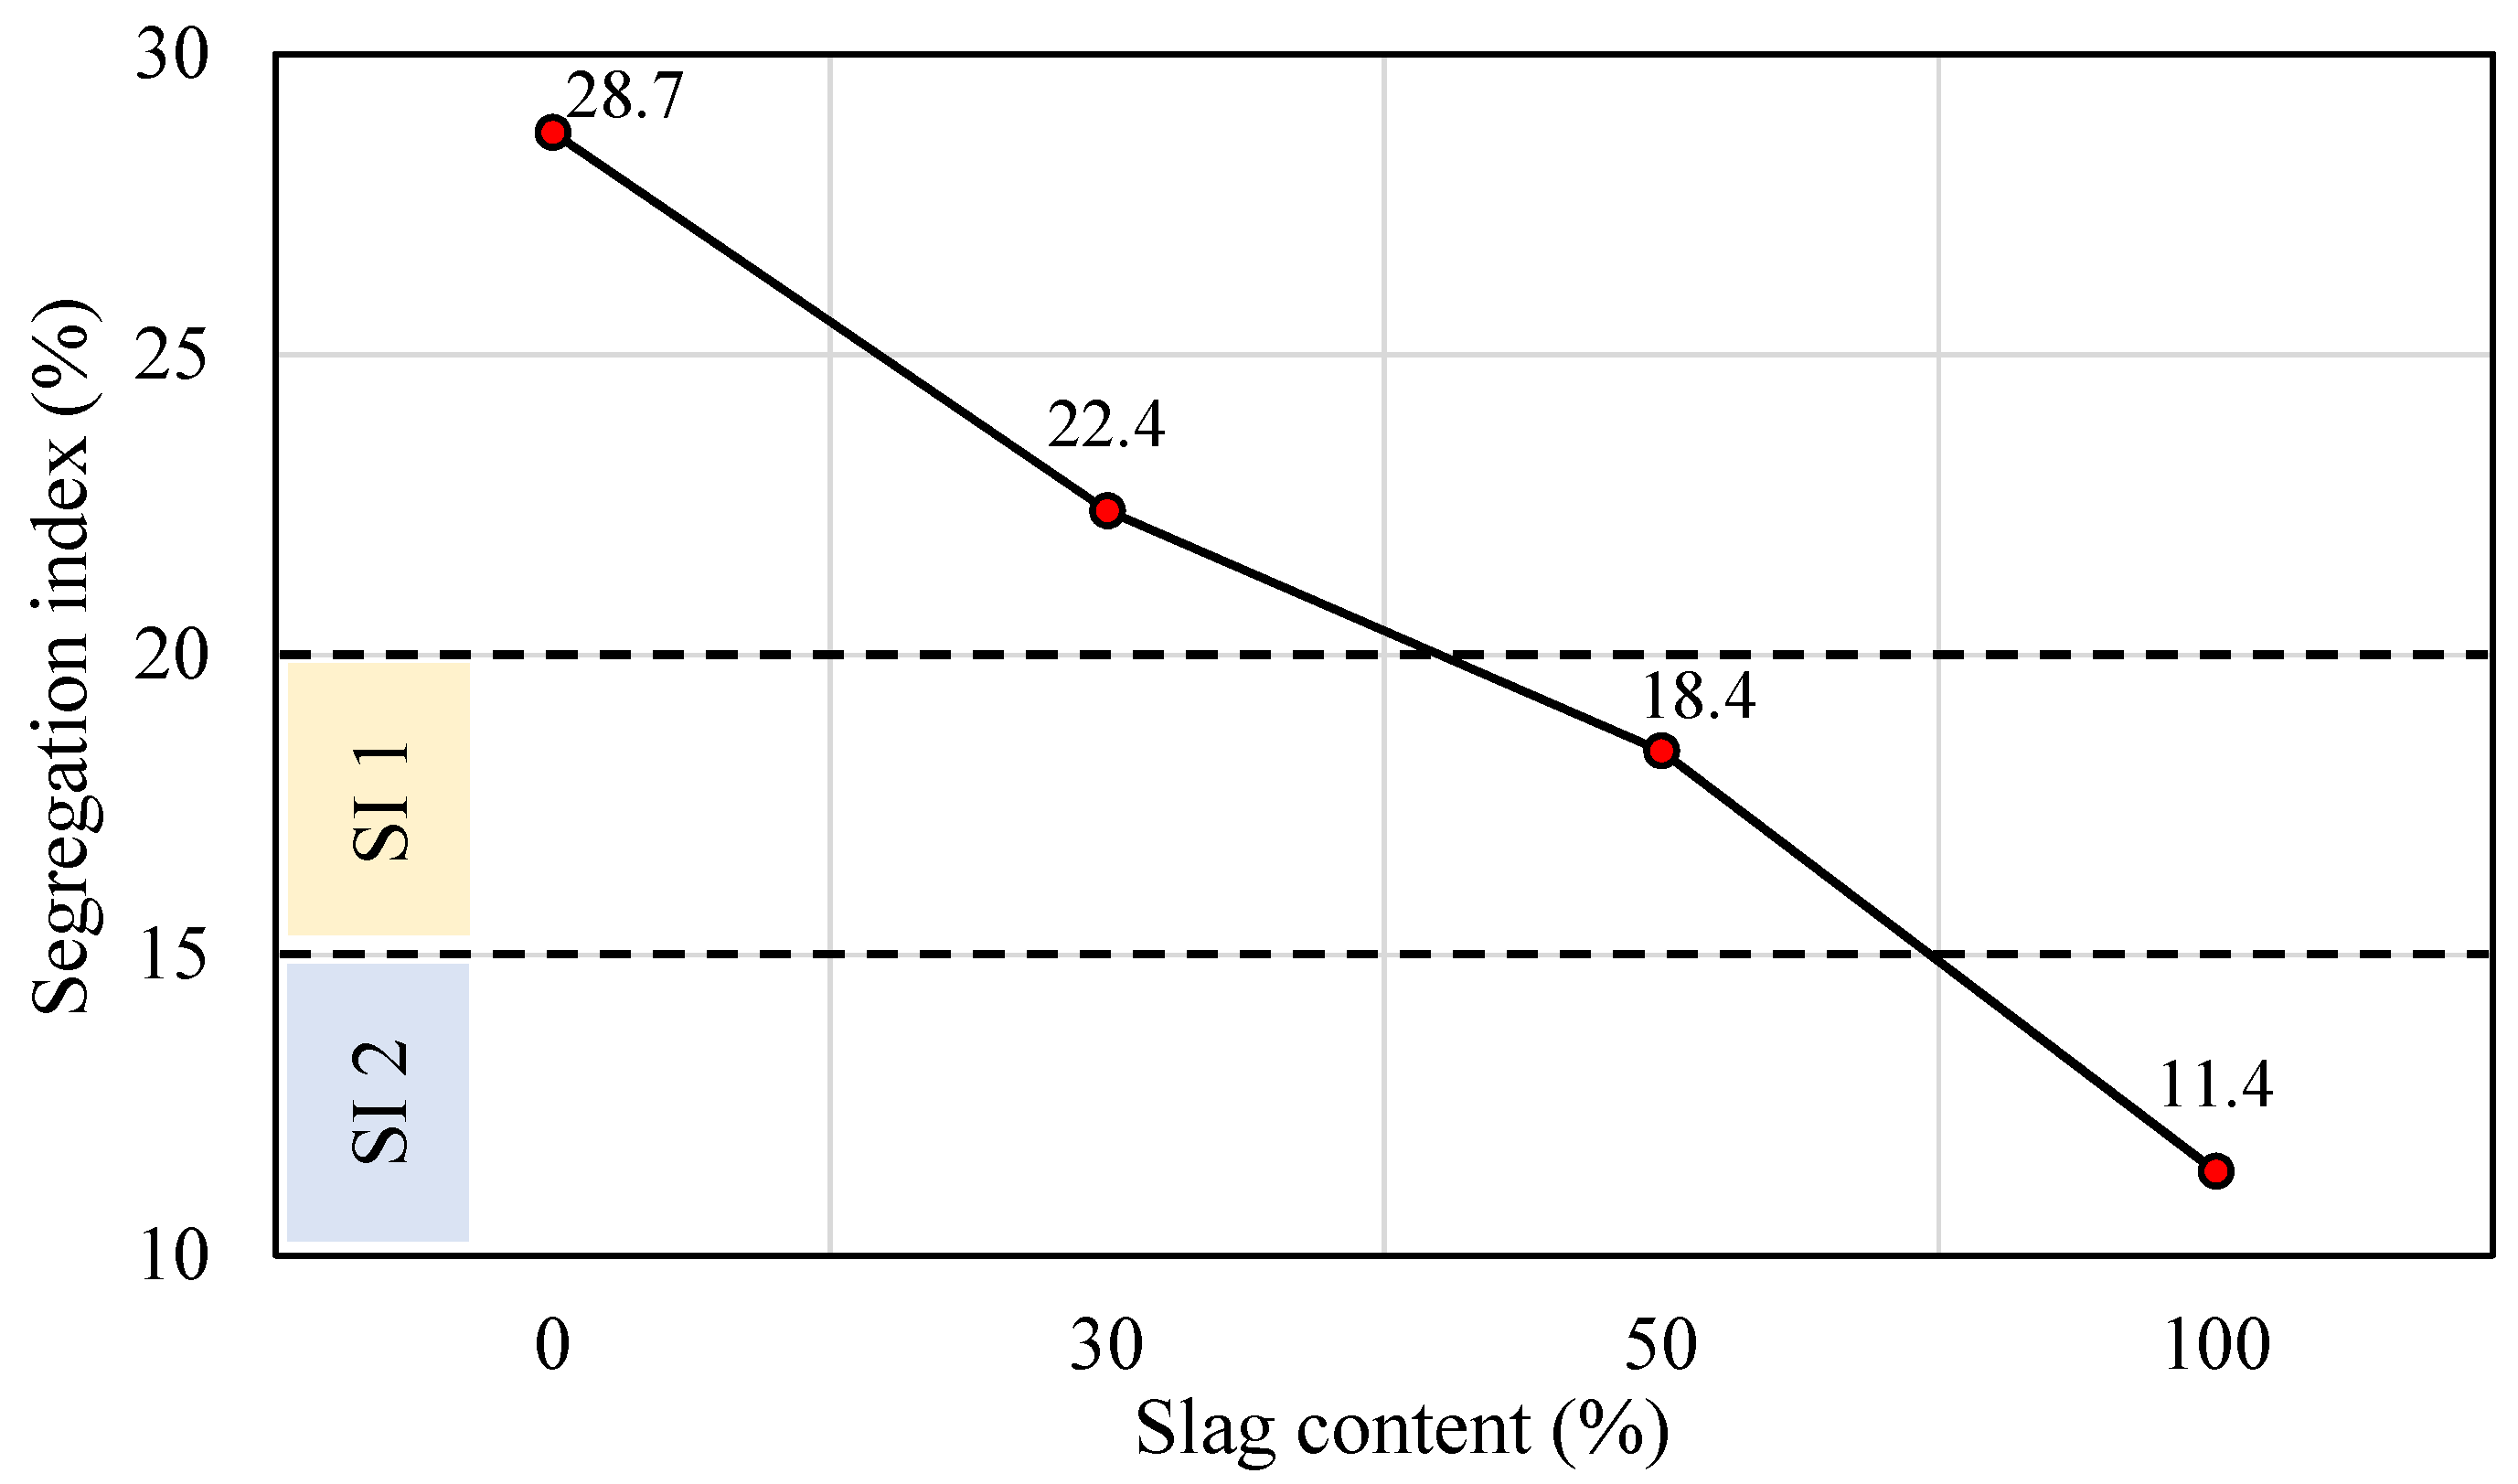
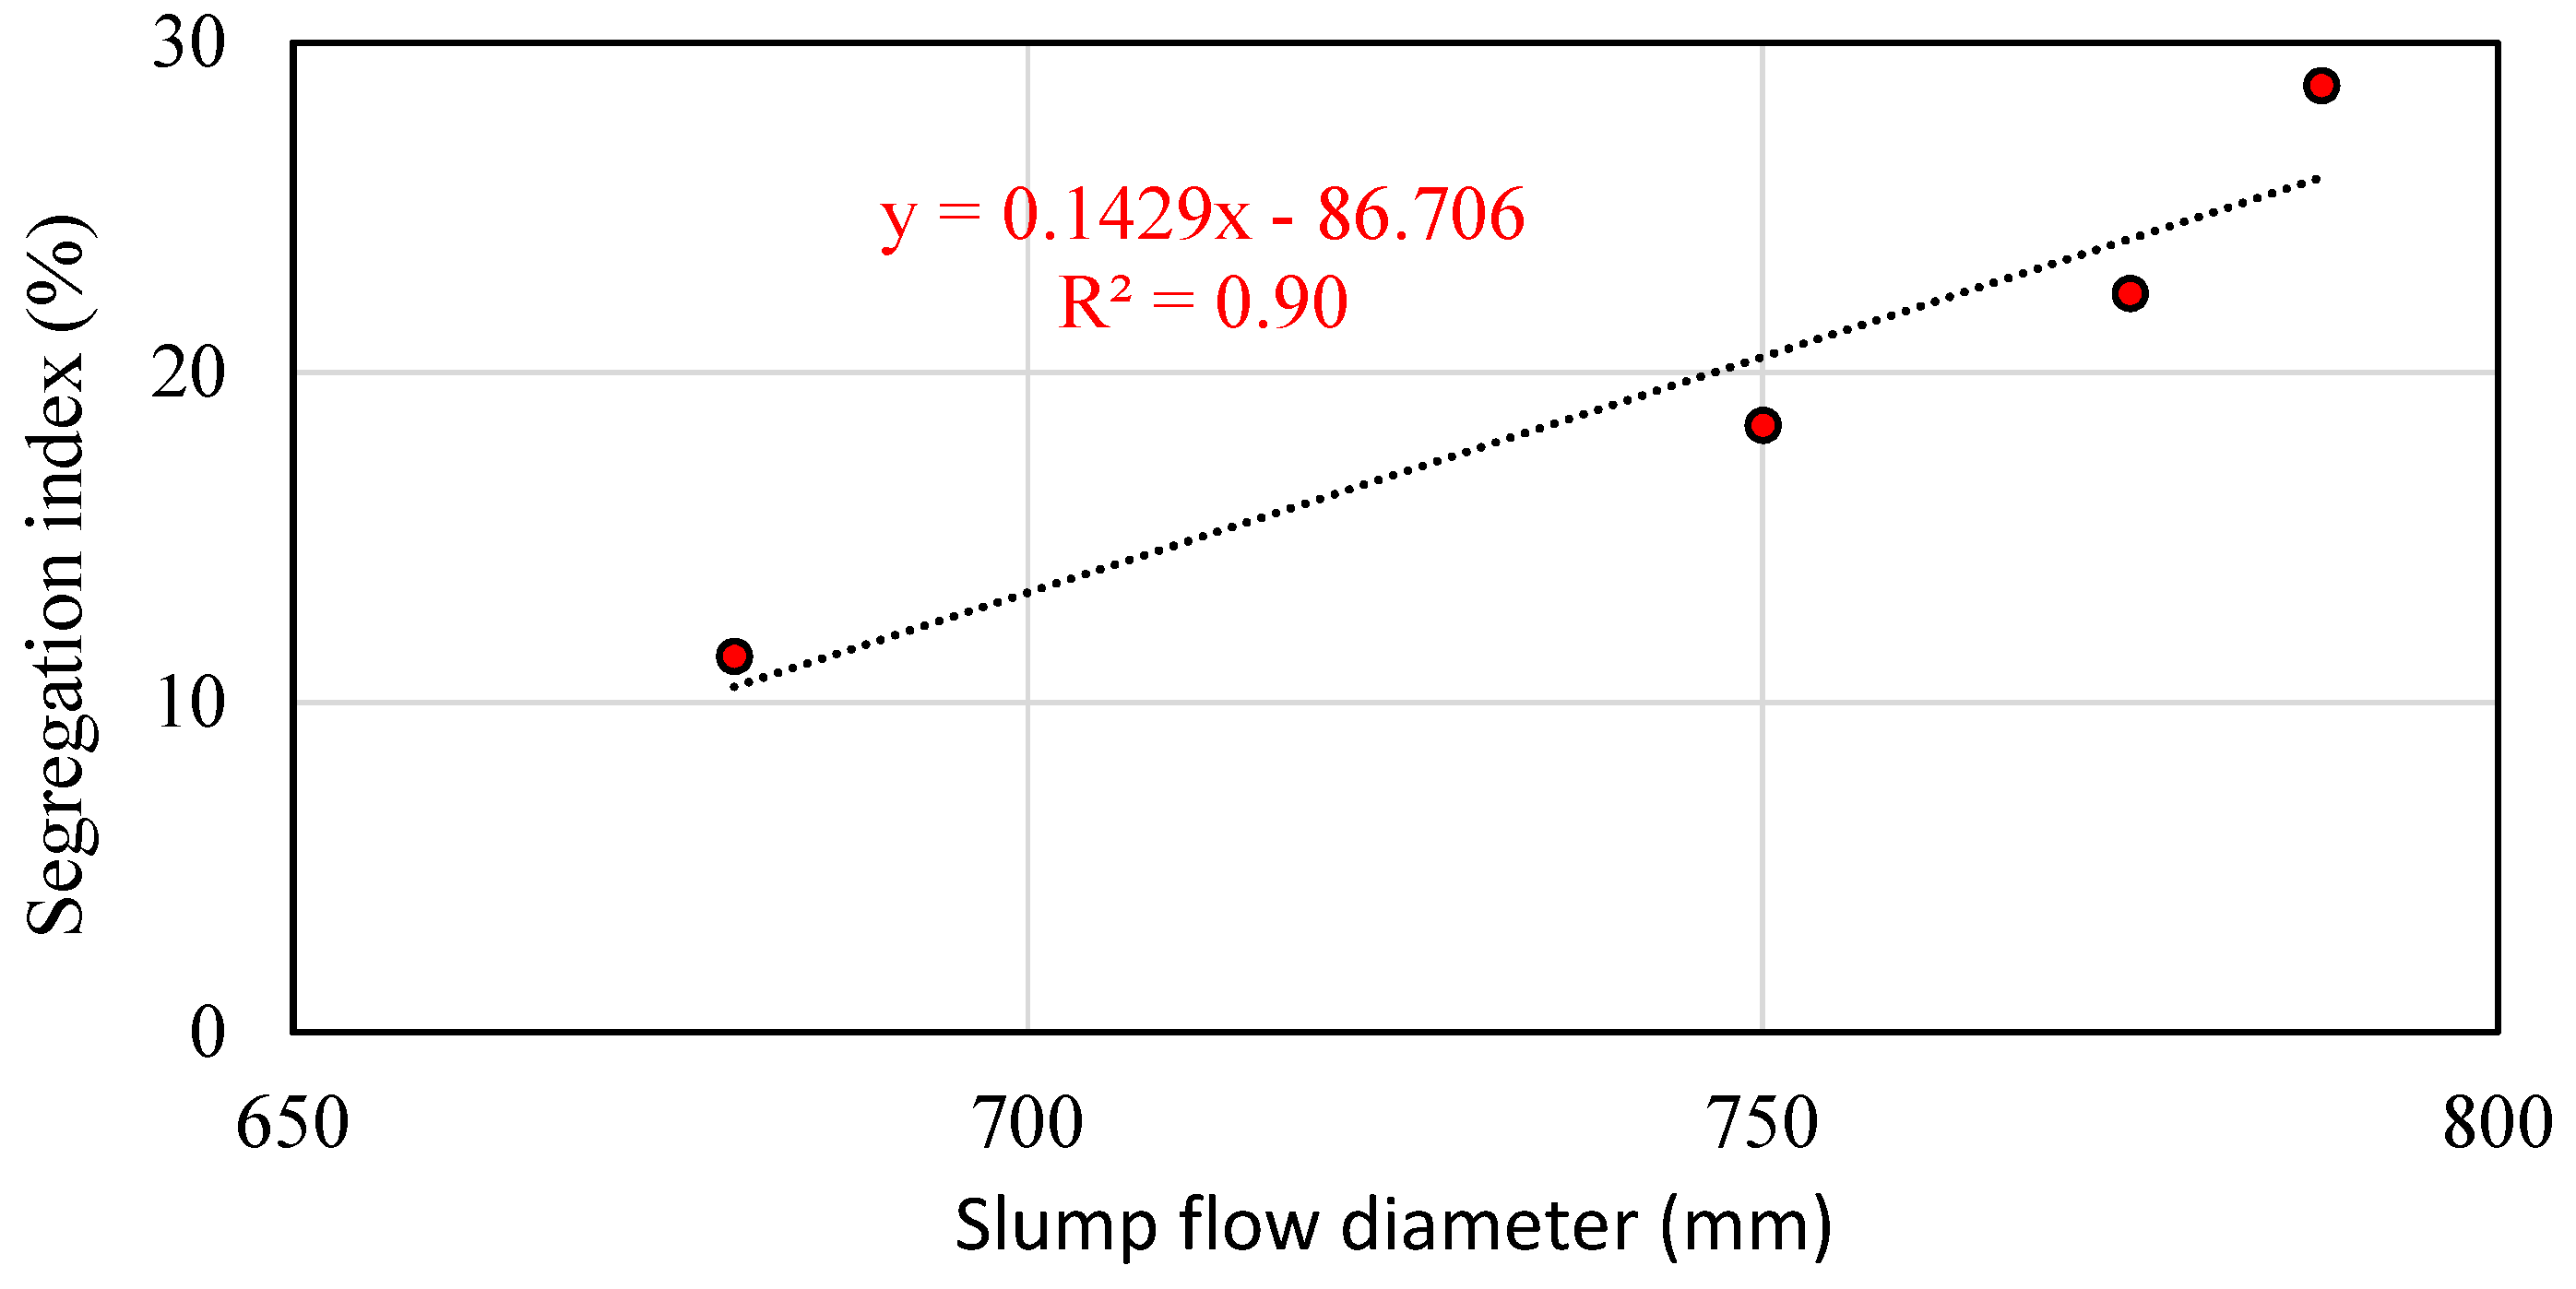
5.1.8. Sieve Segregation
5.2. Mechanical Properties
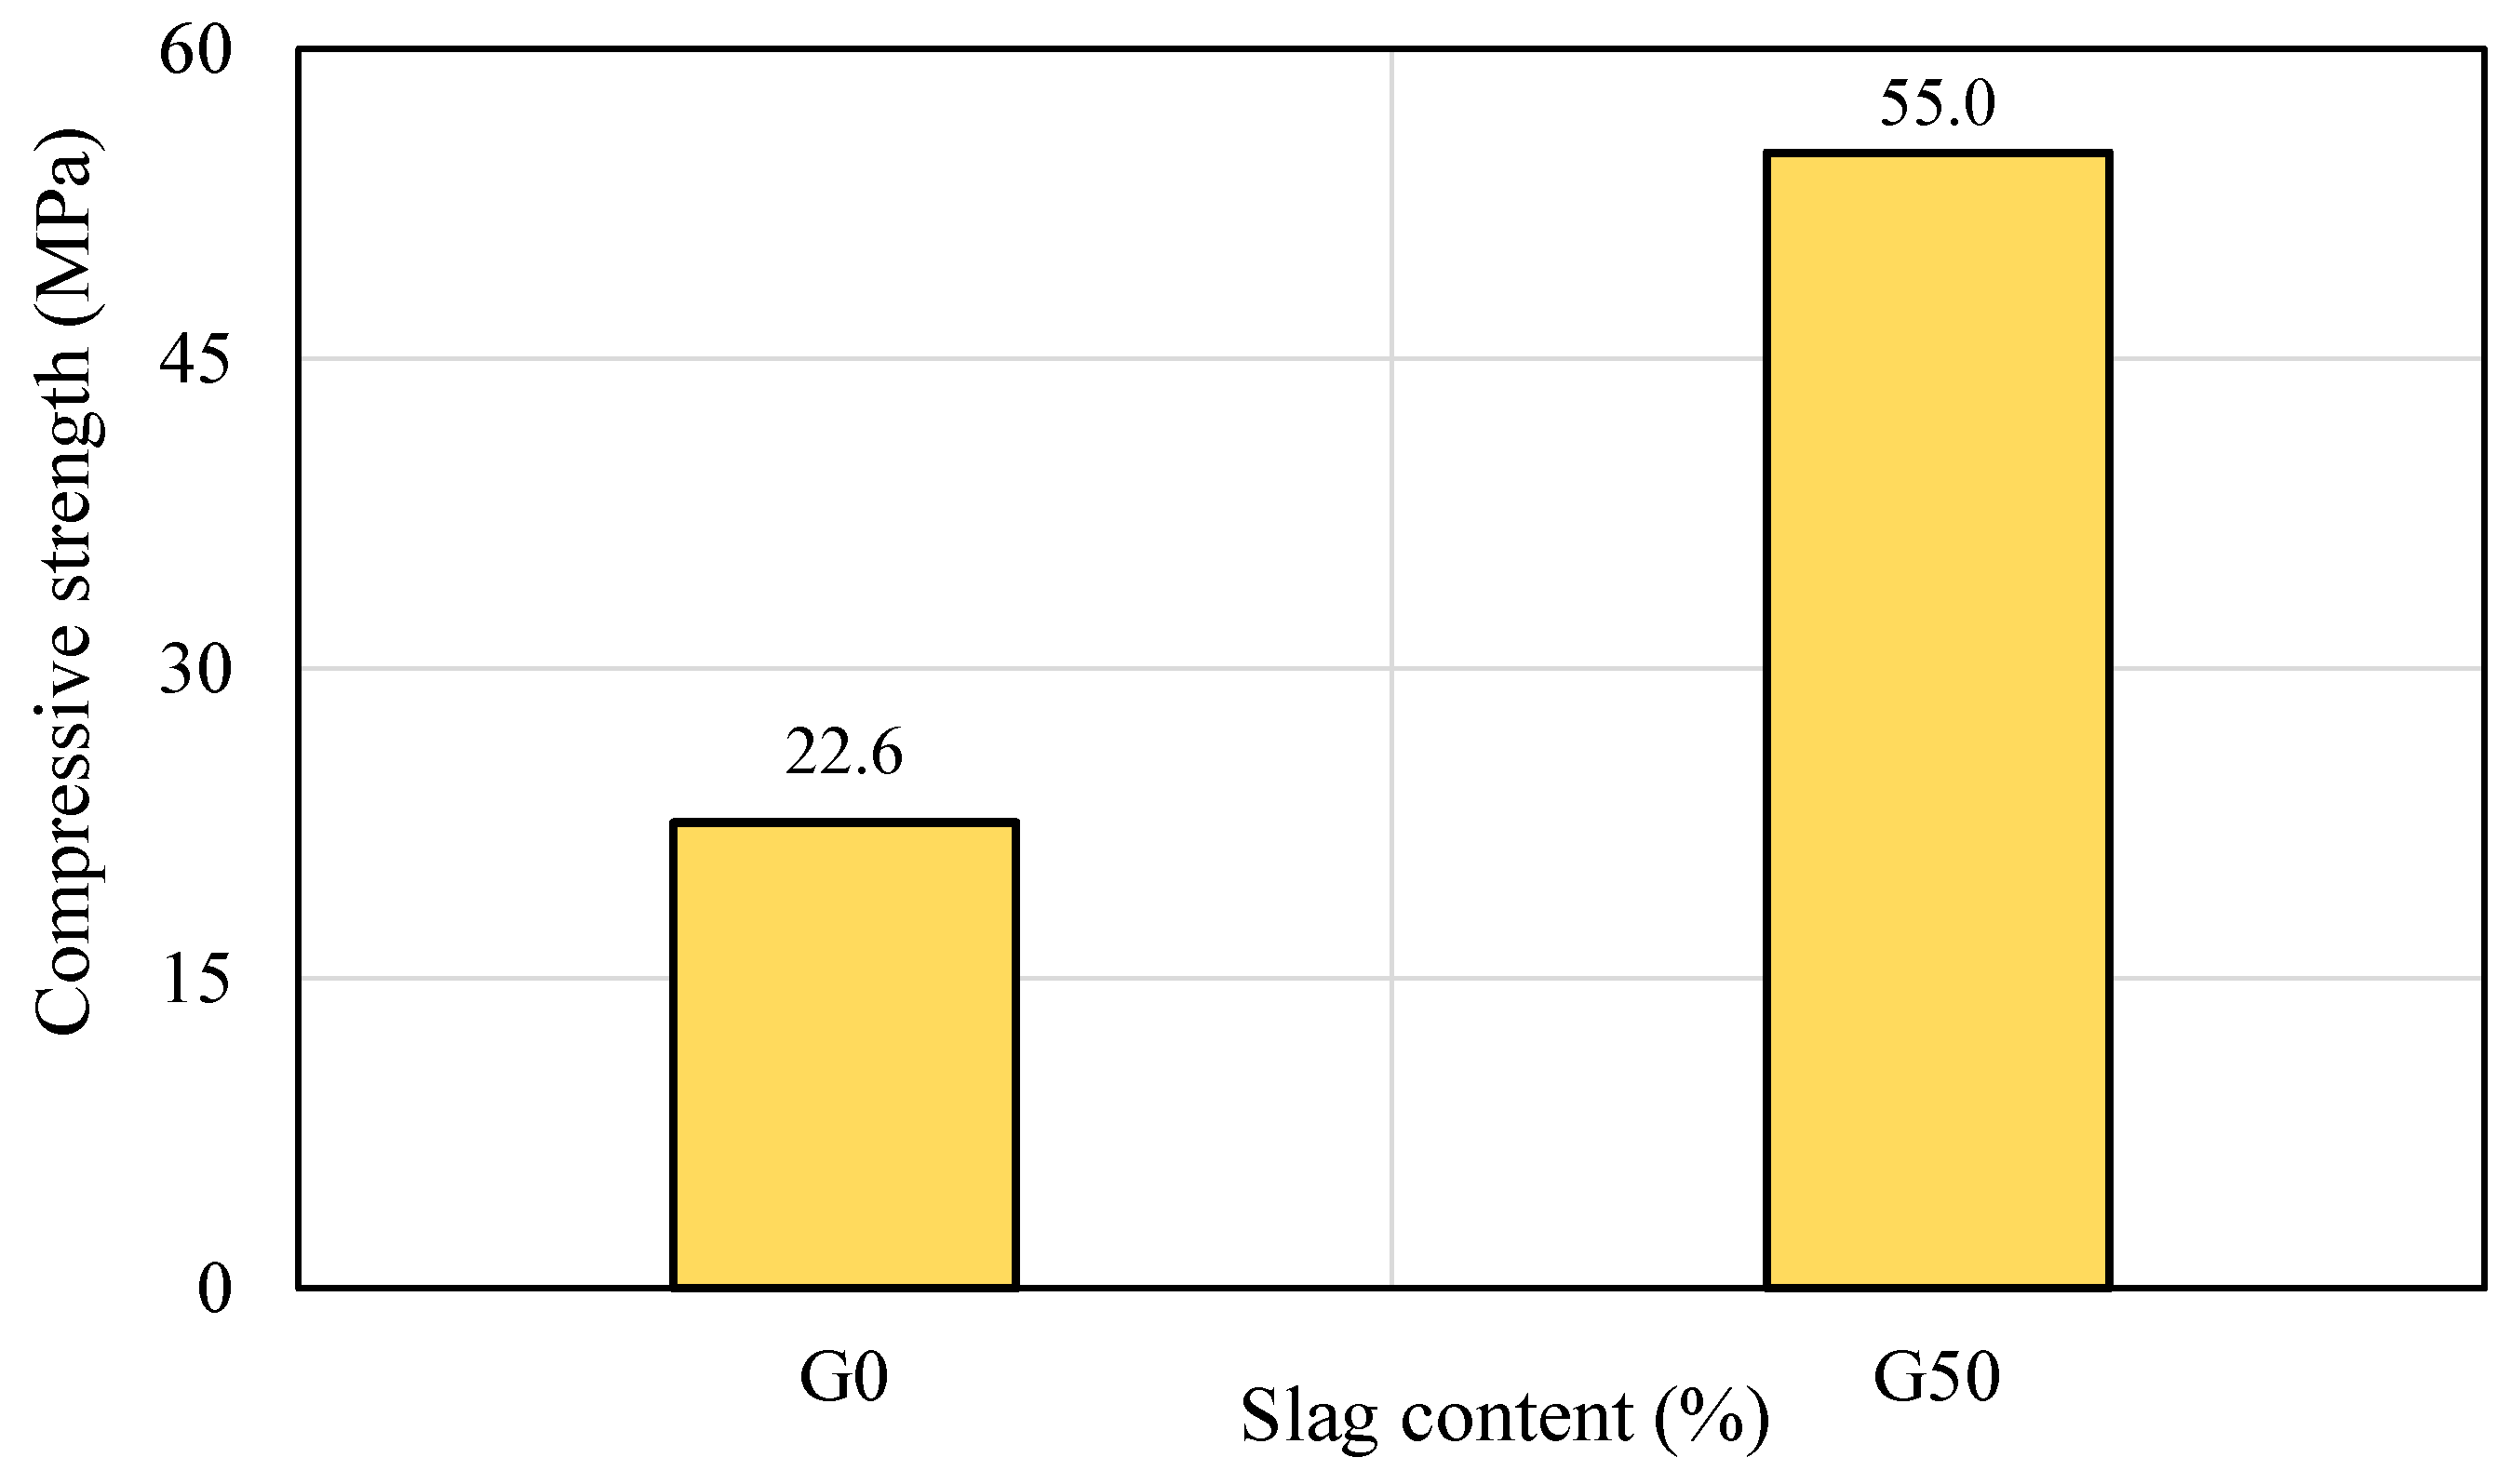
5.2.1. Compressive Strength (fcu)
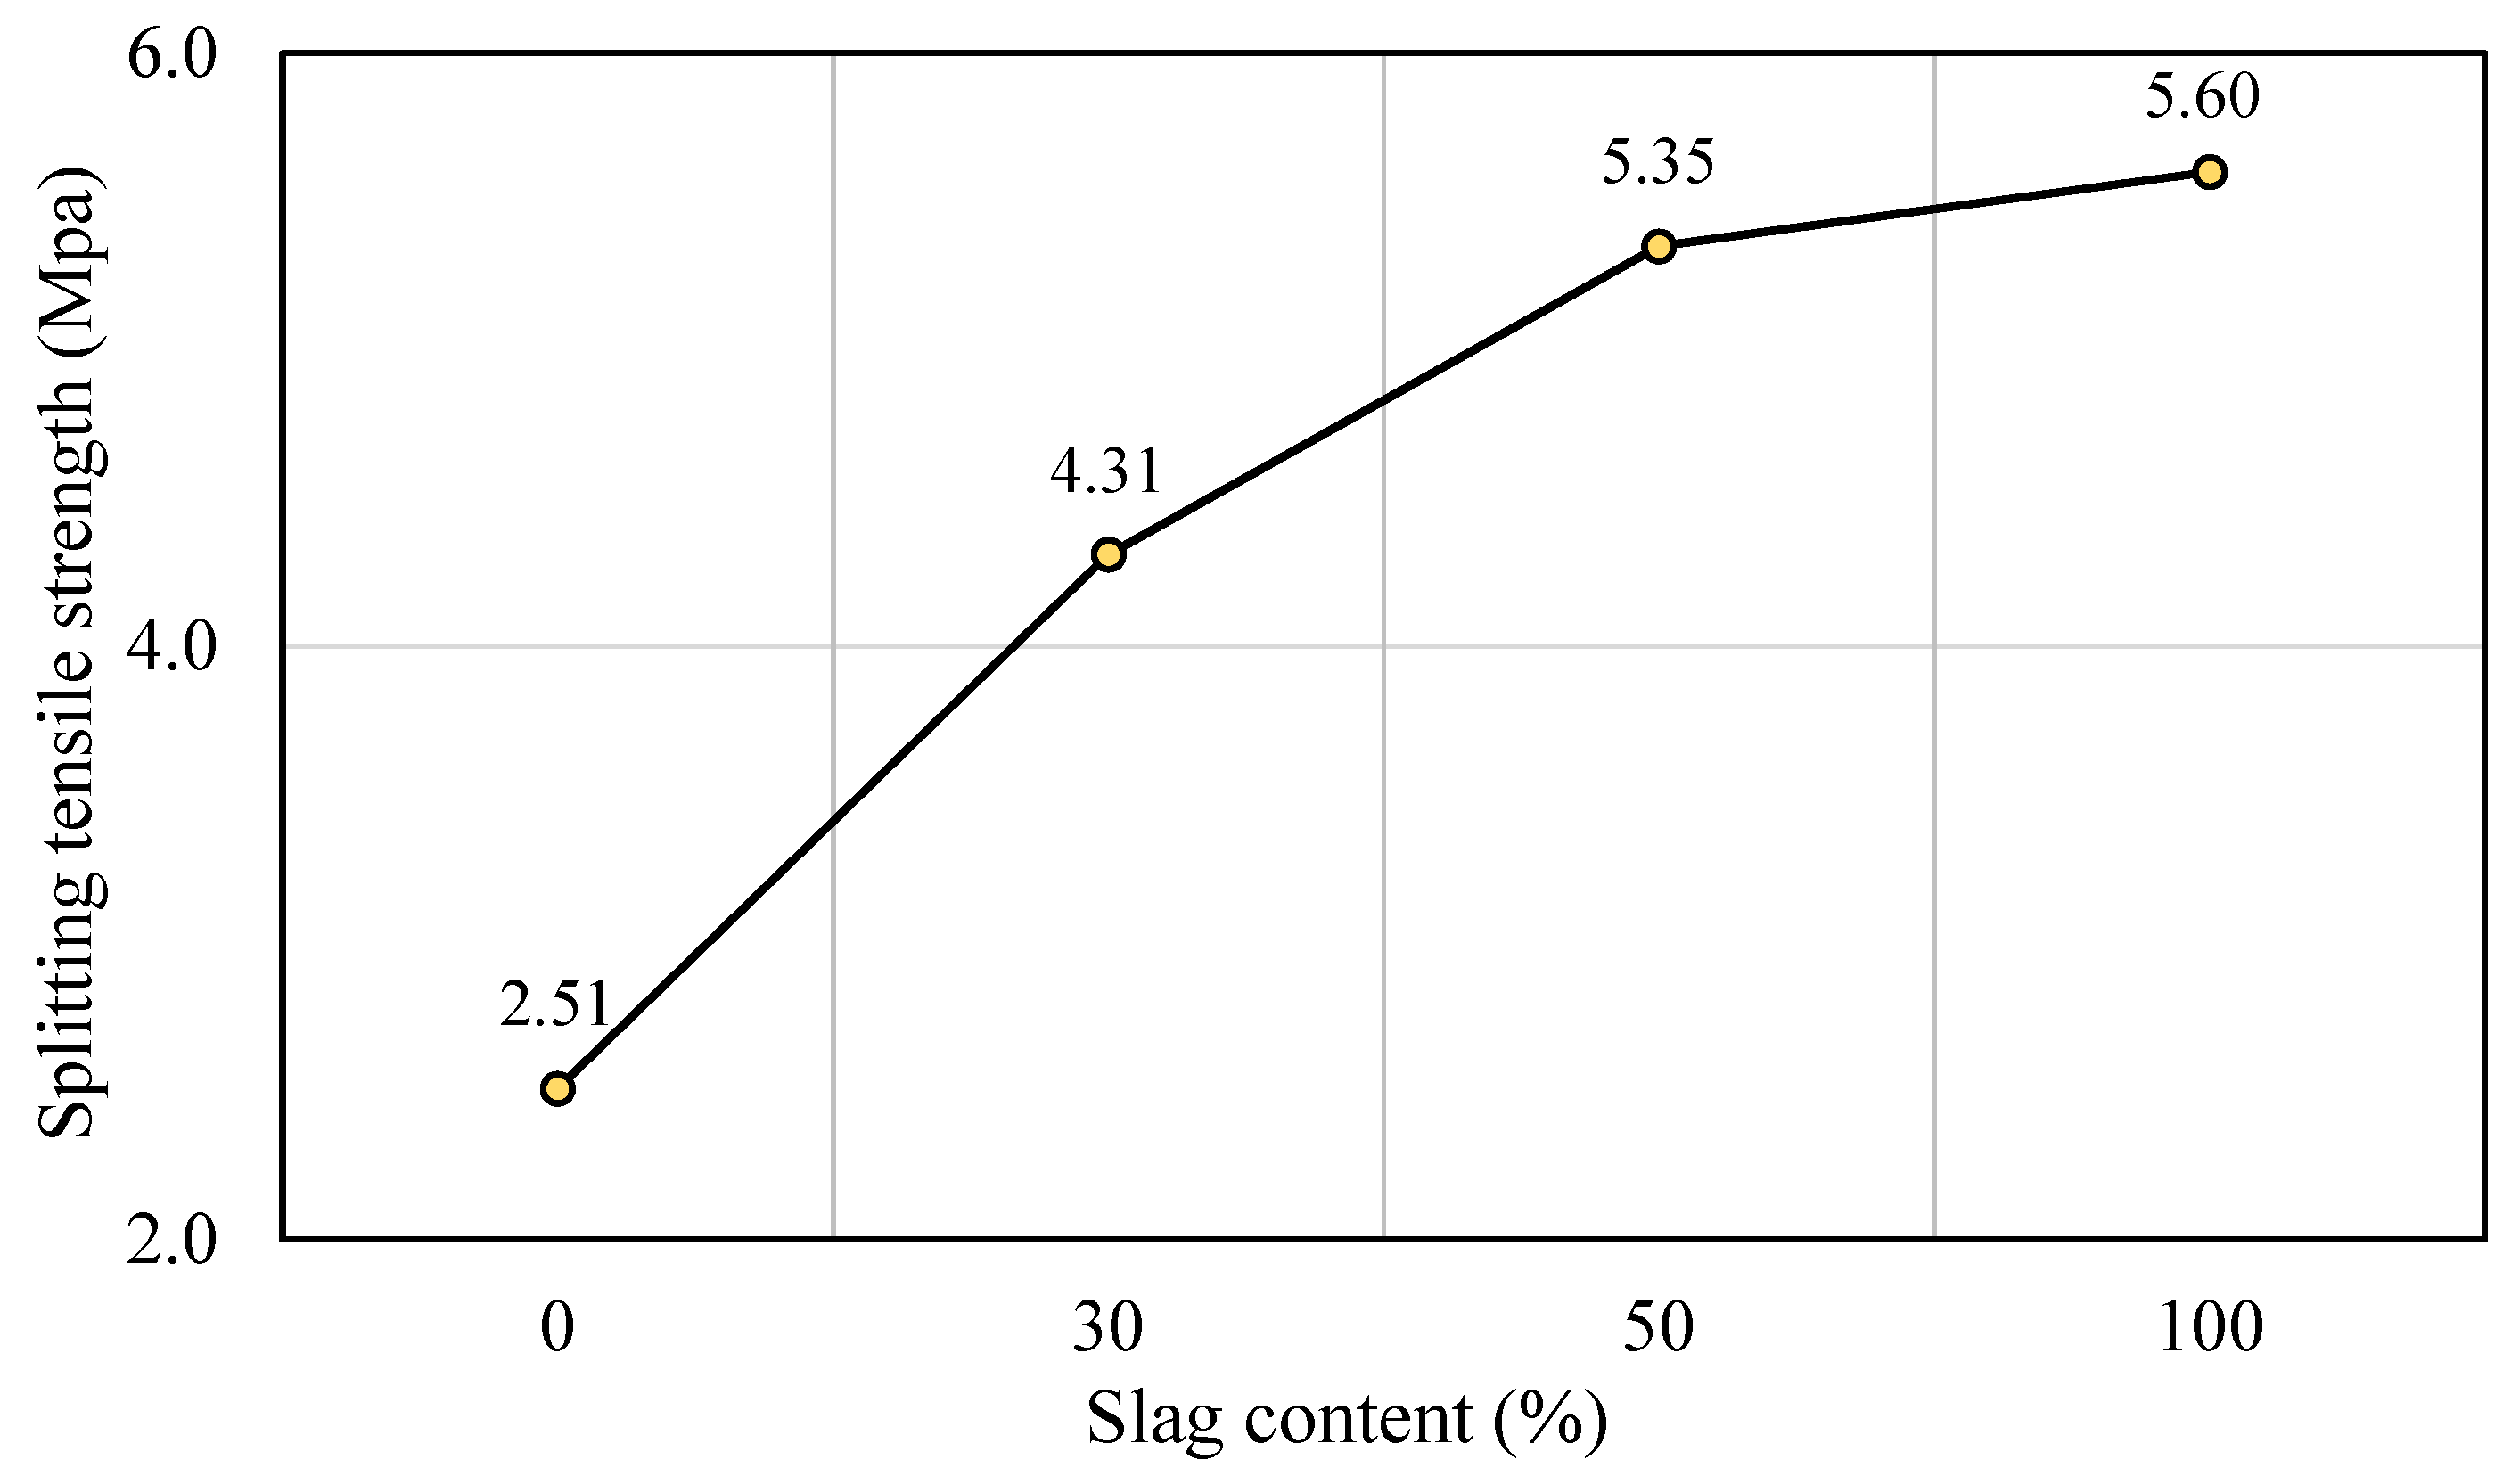
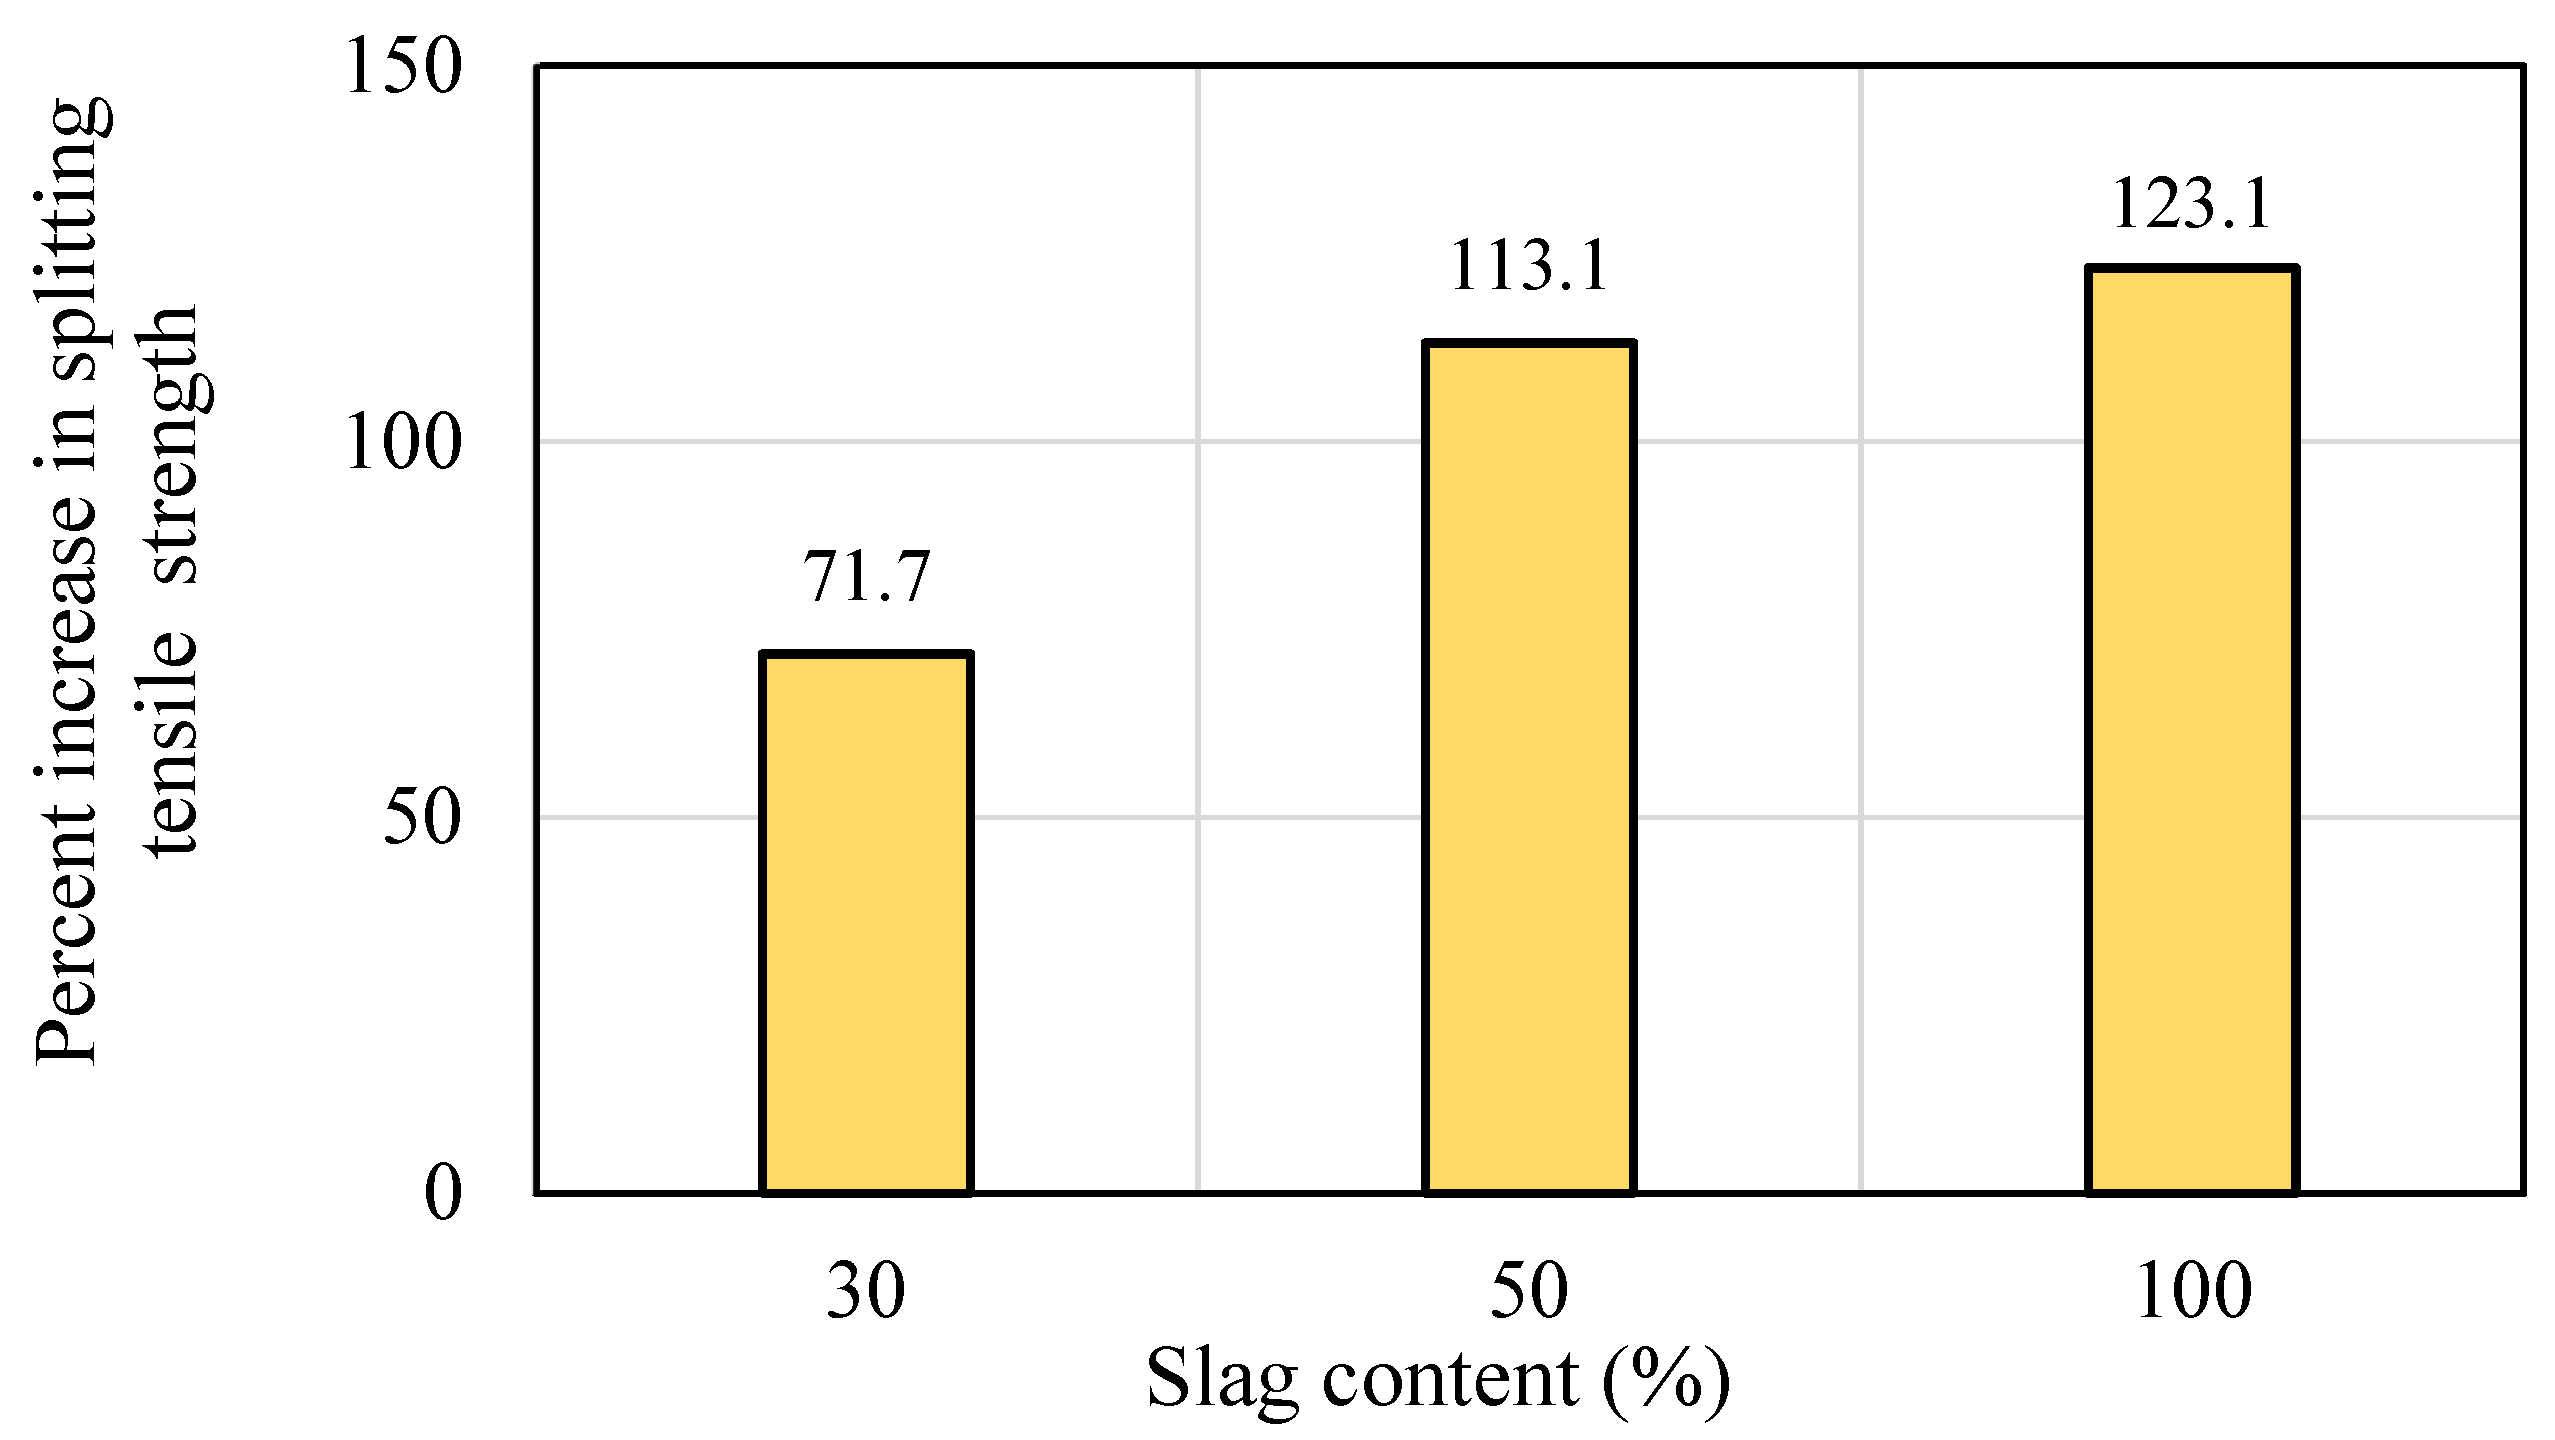
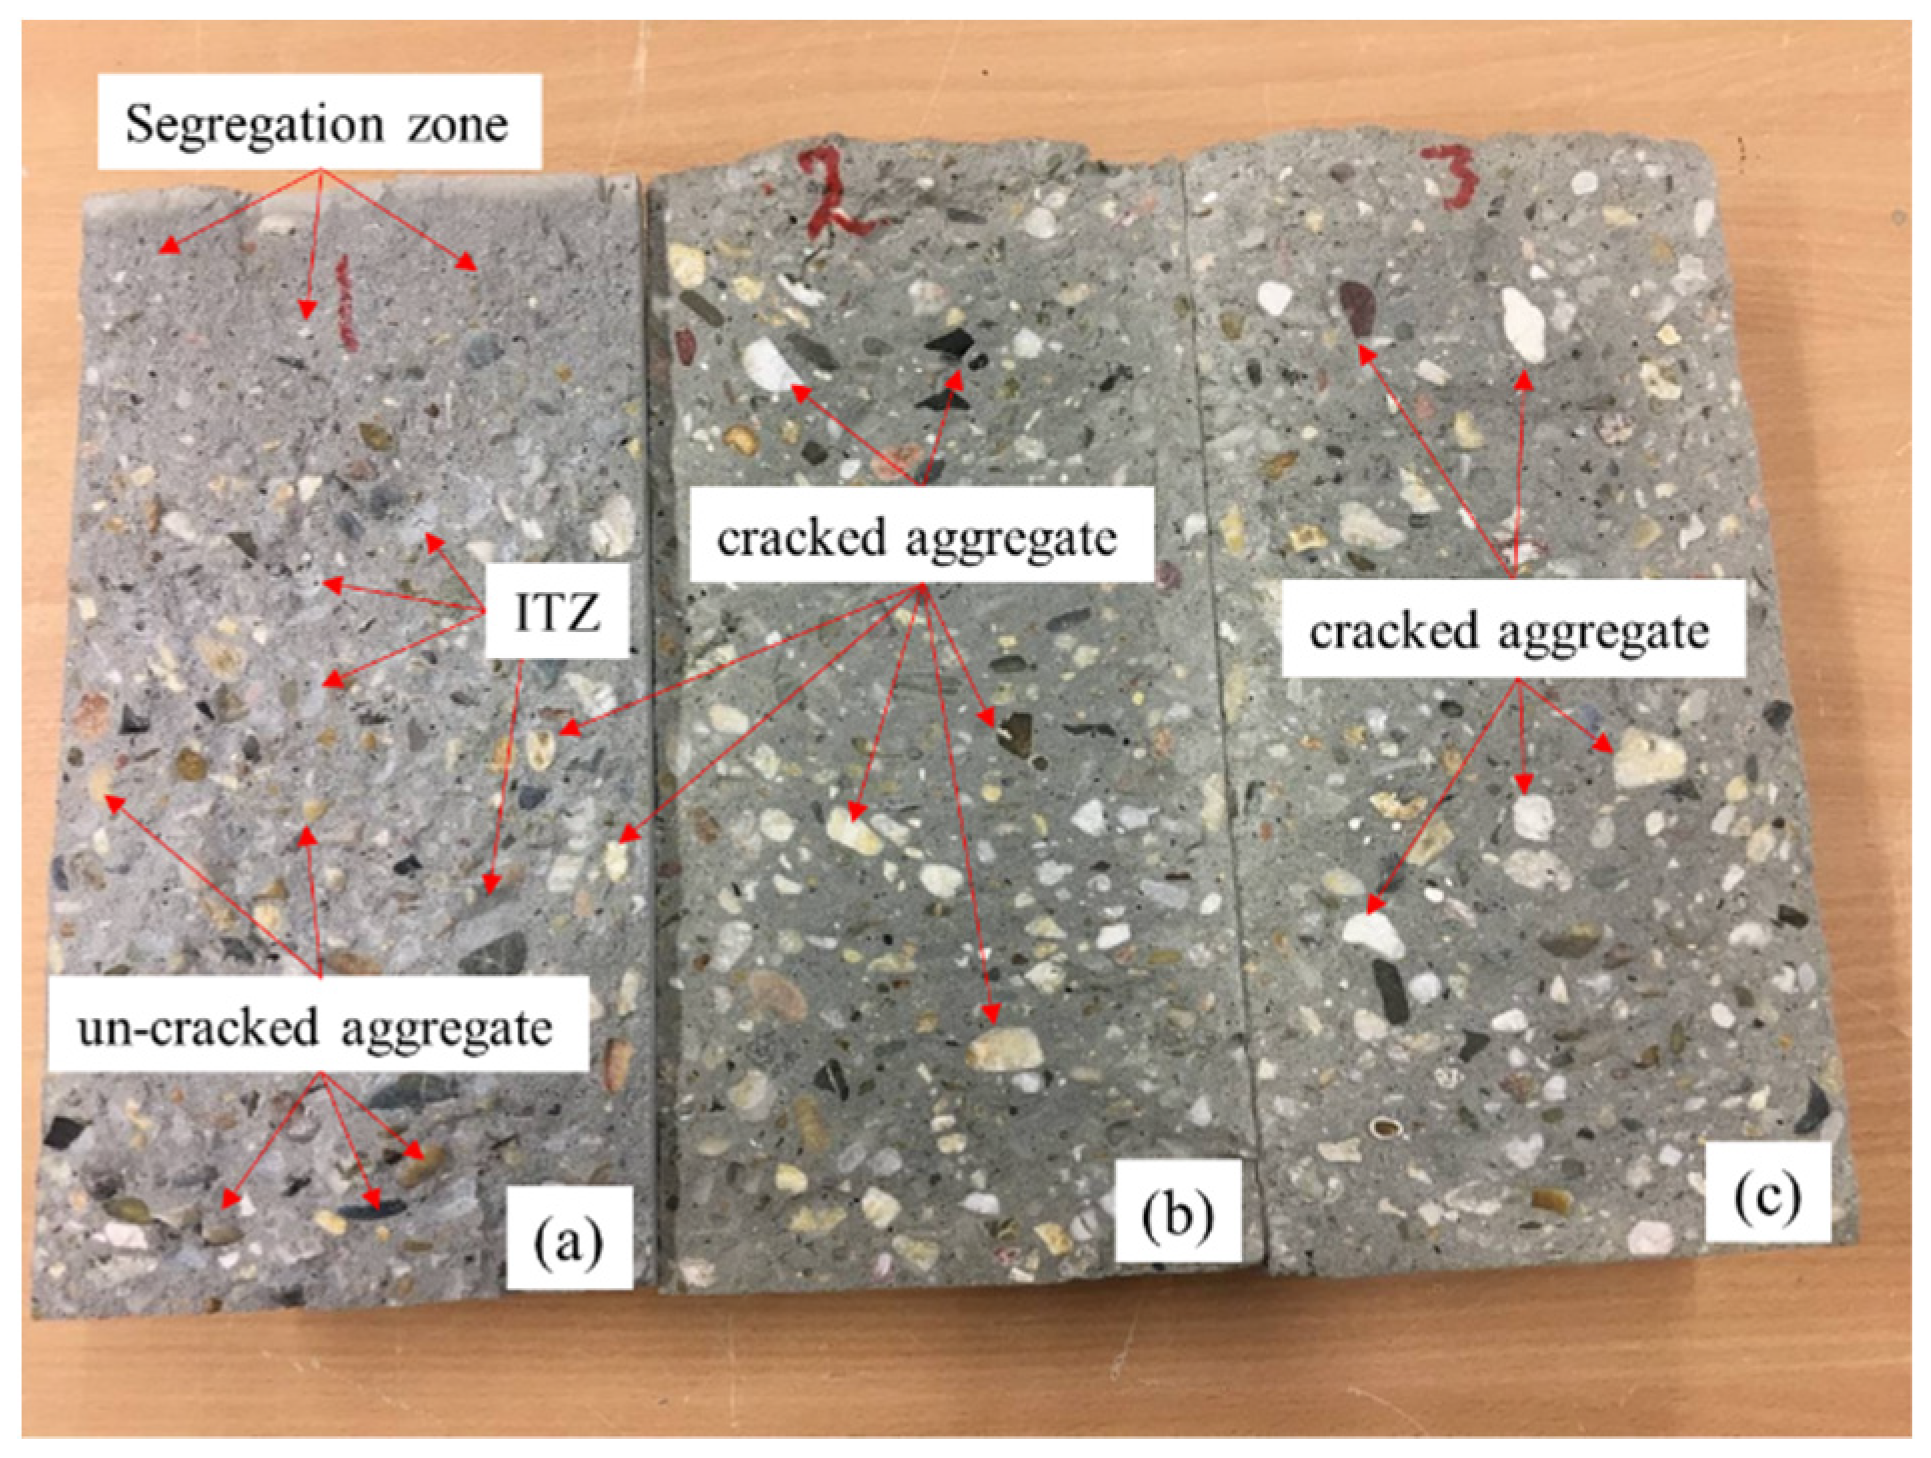
5.2.2. Splitting Tensile Strength (ft)
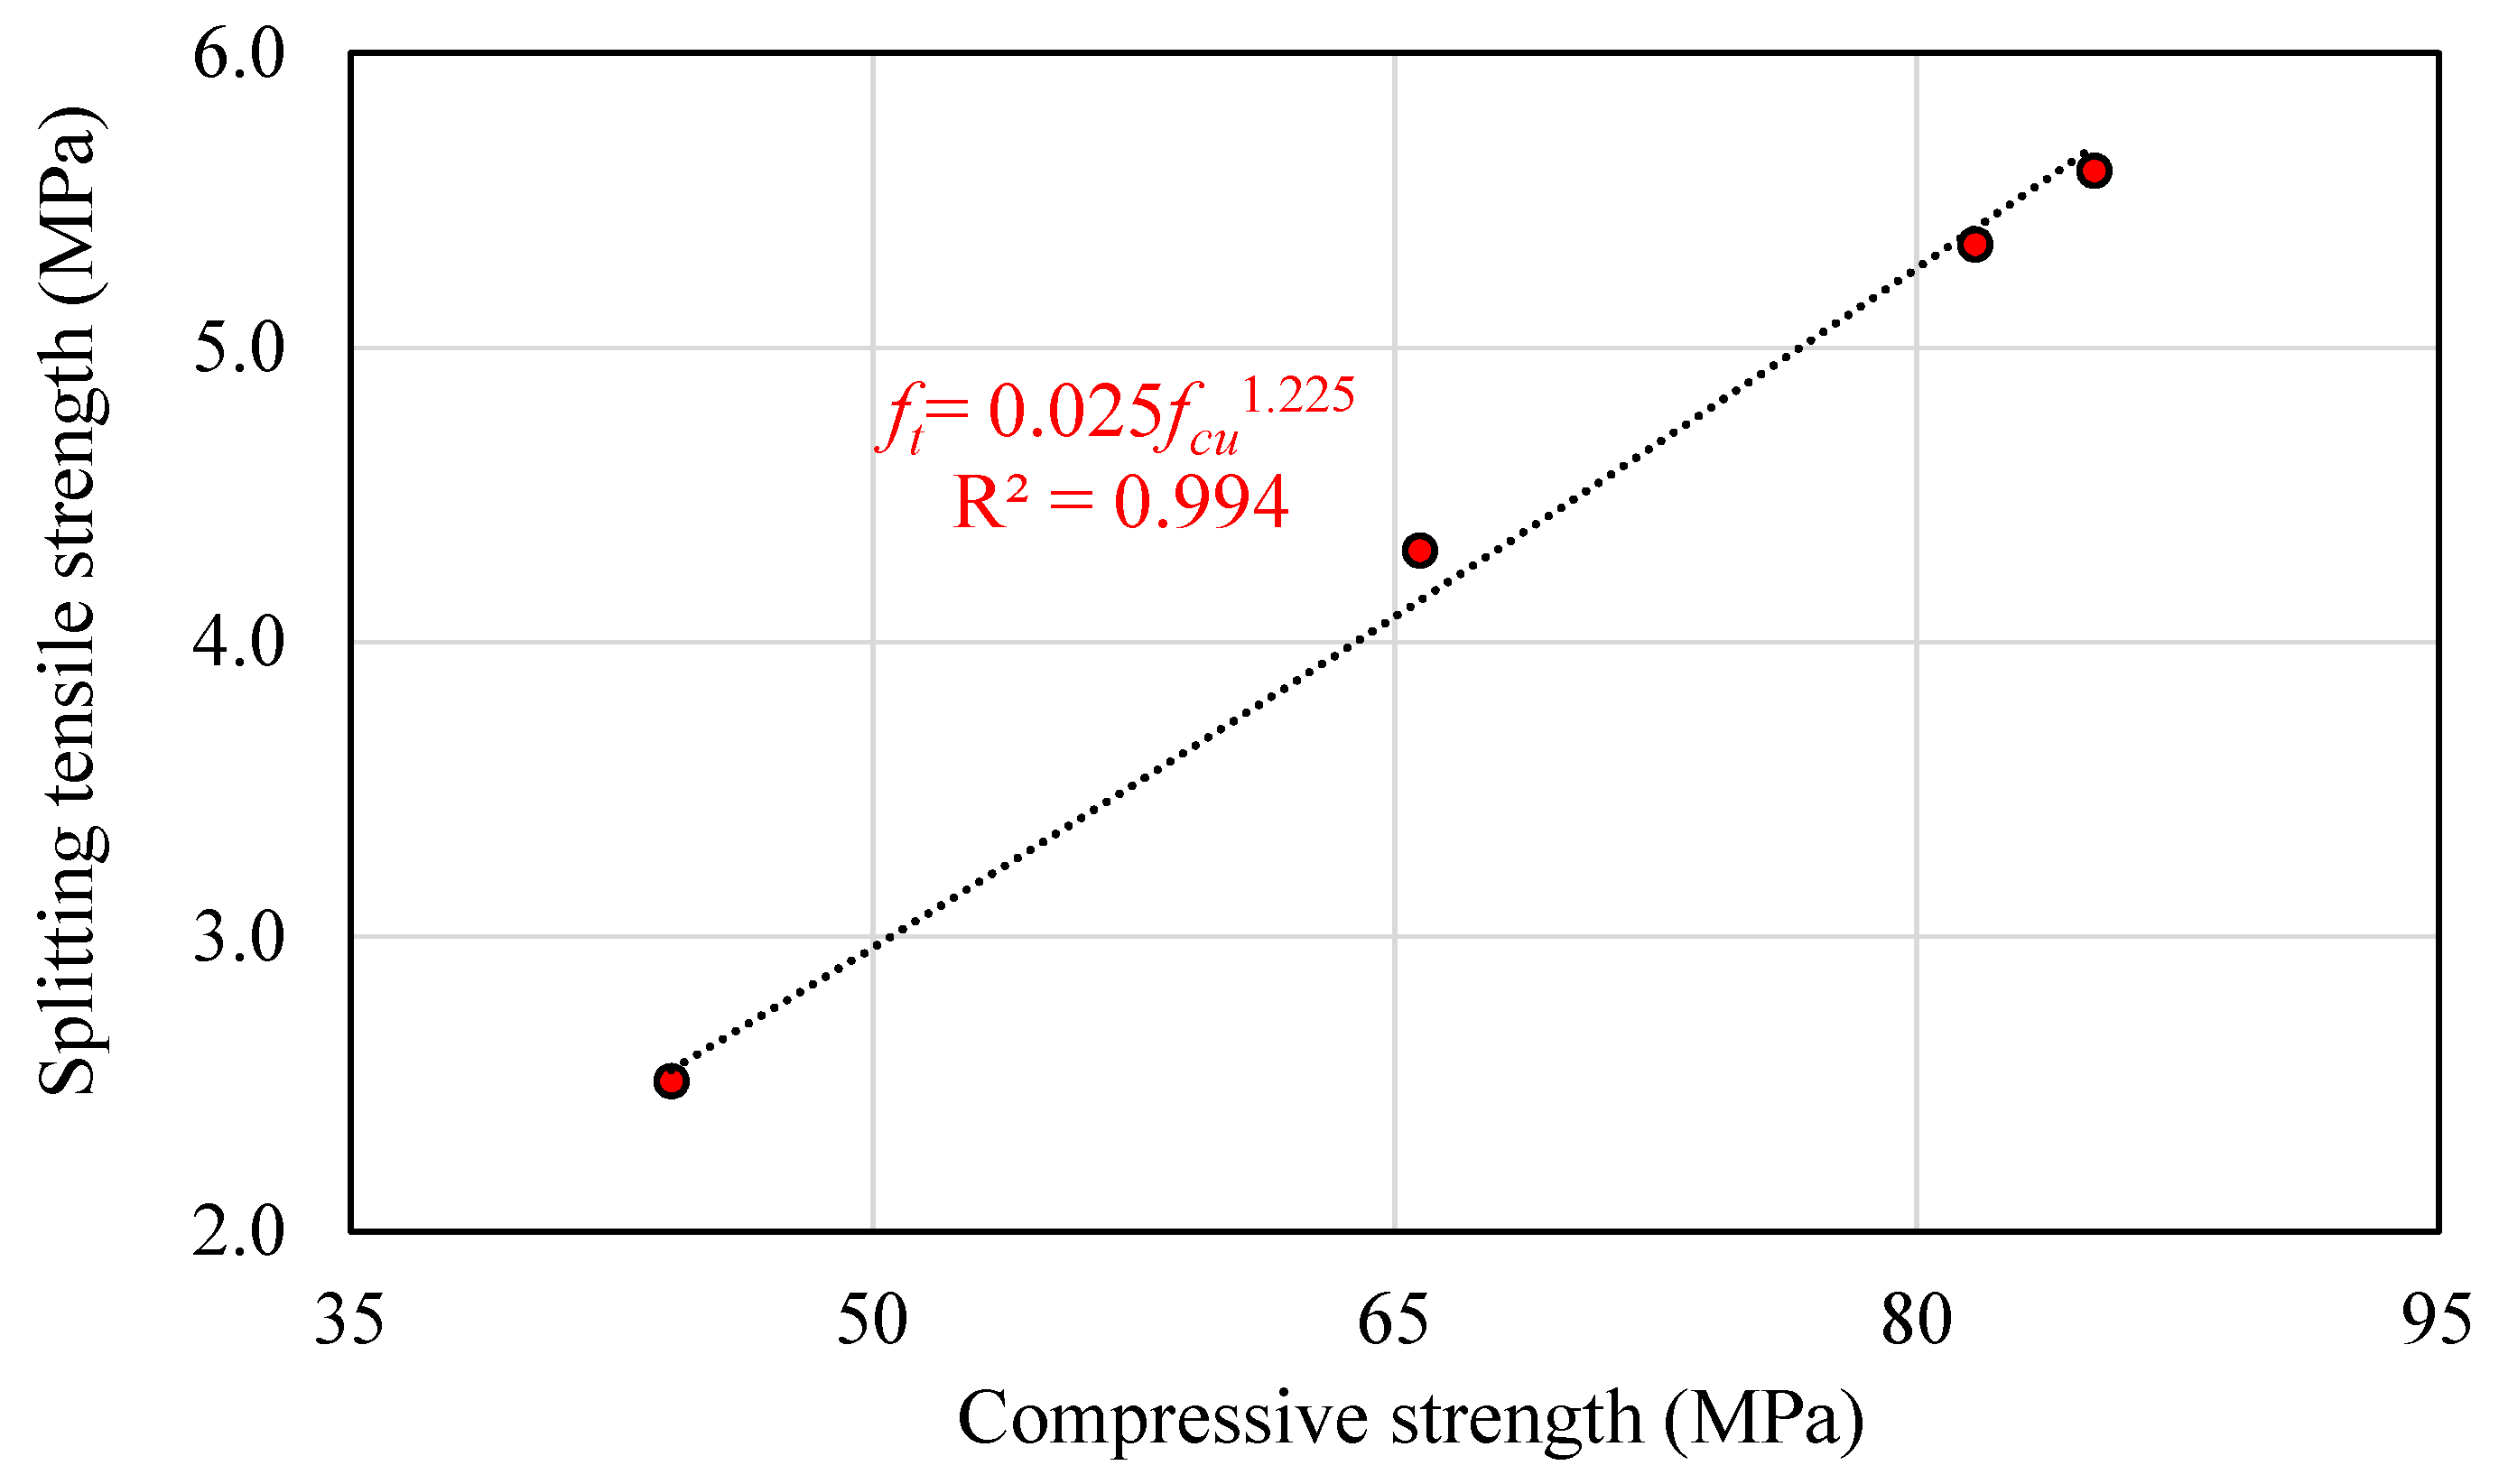
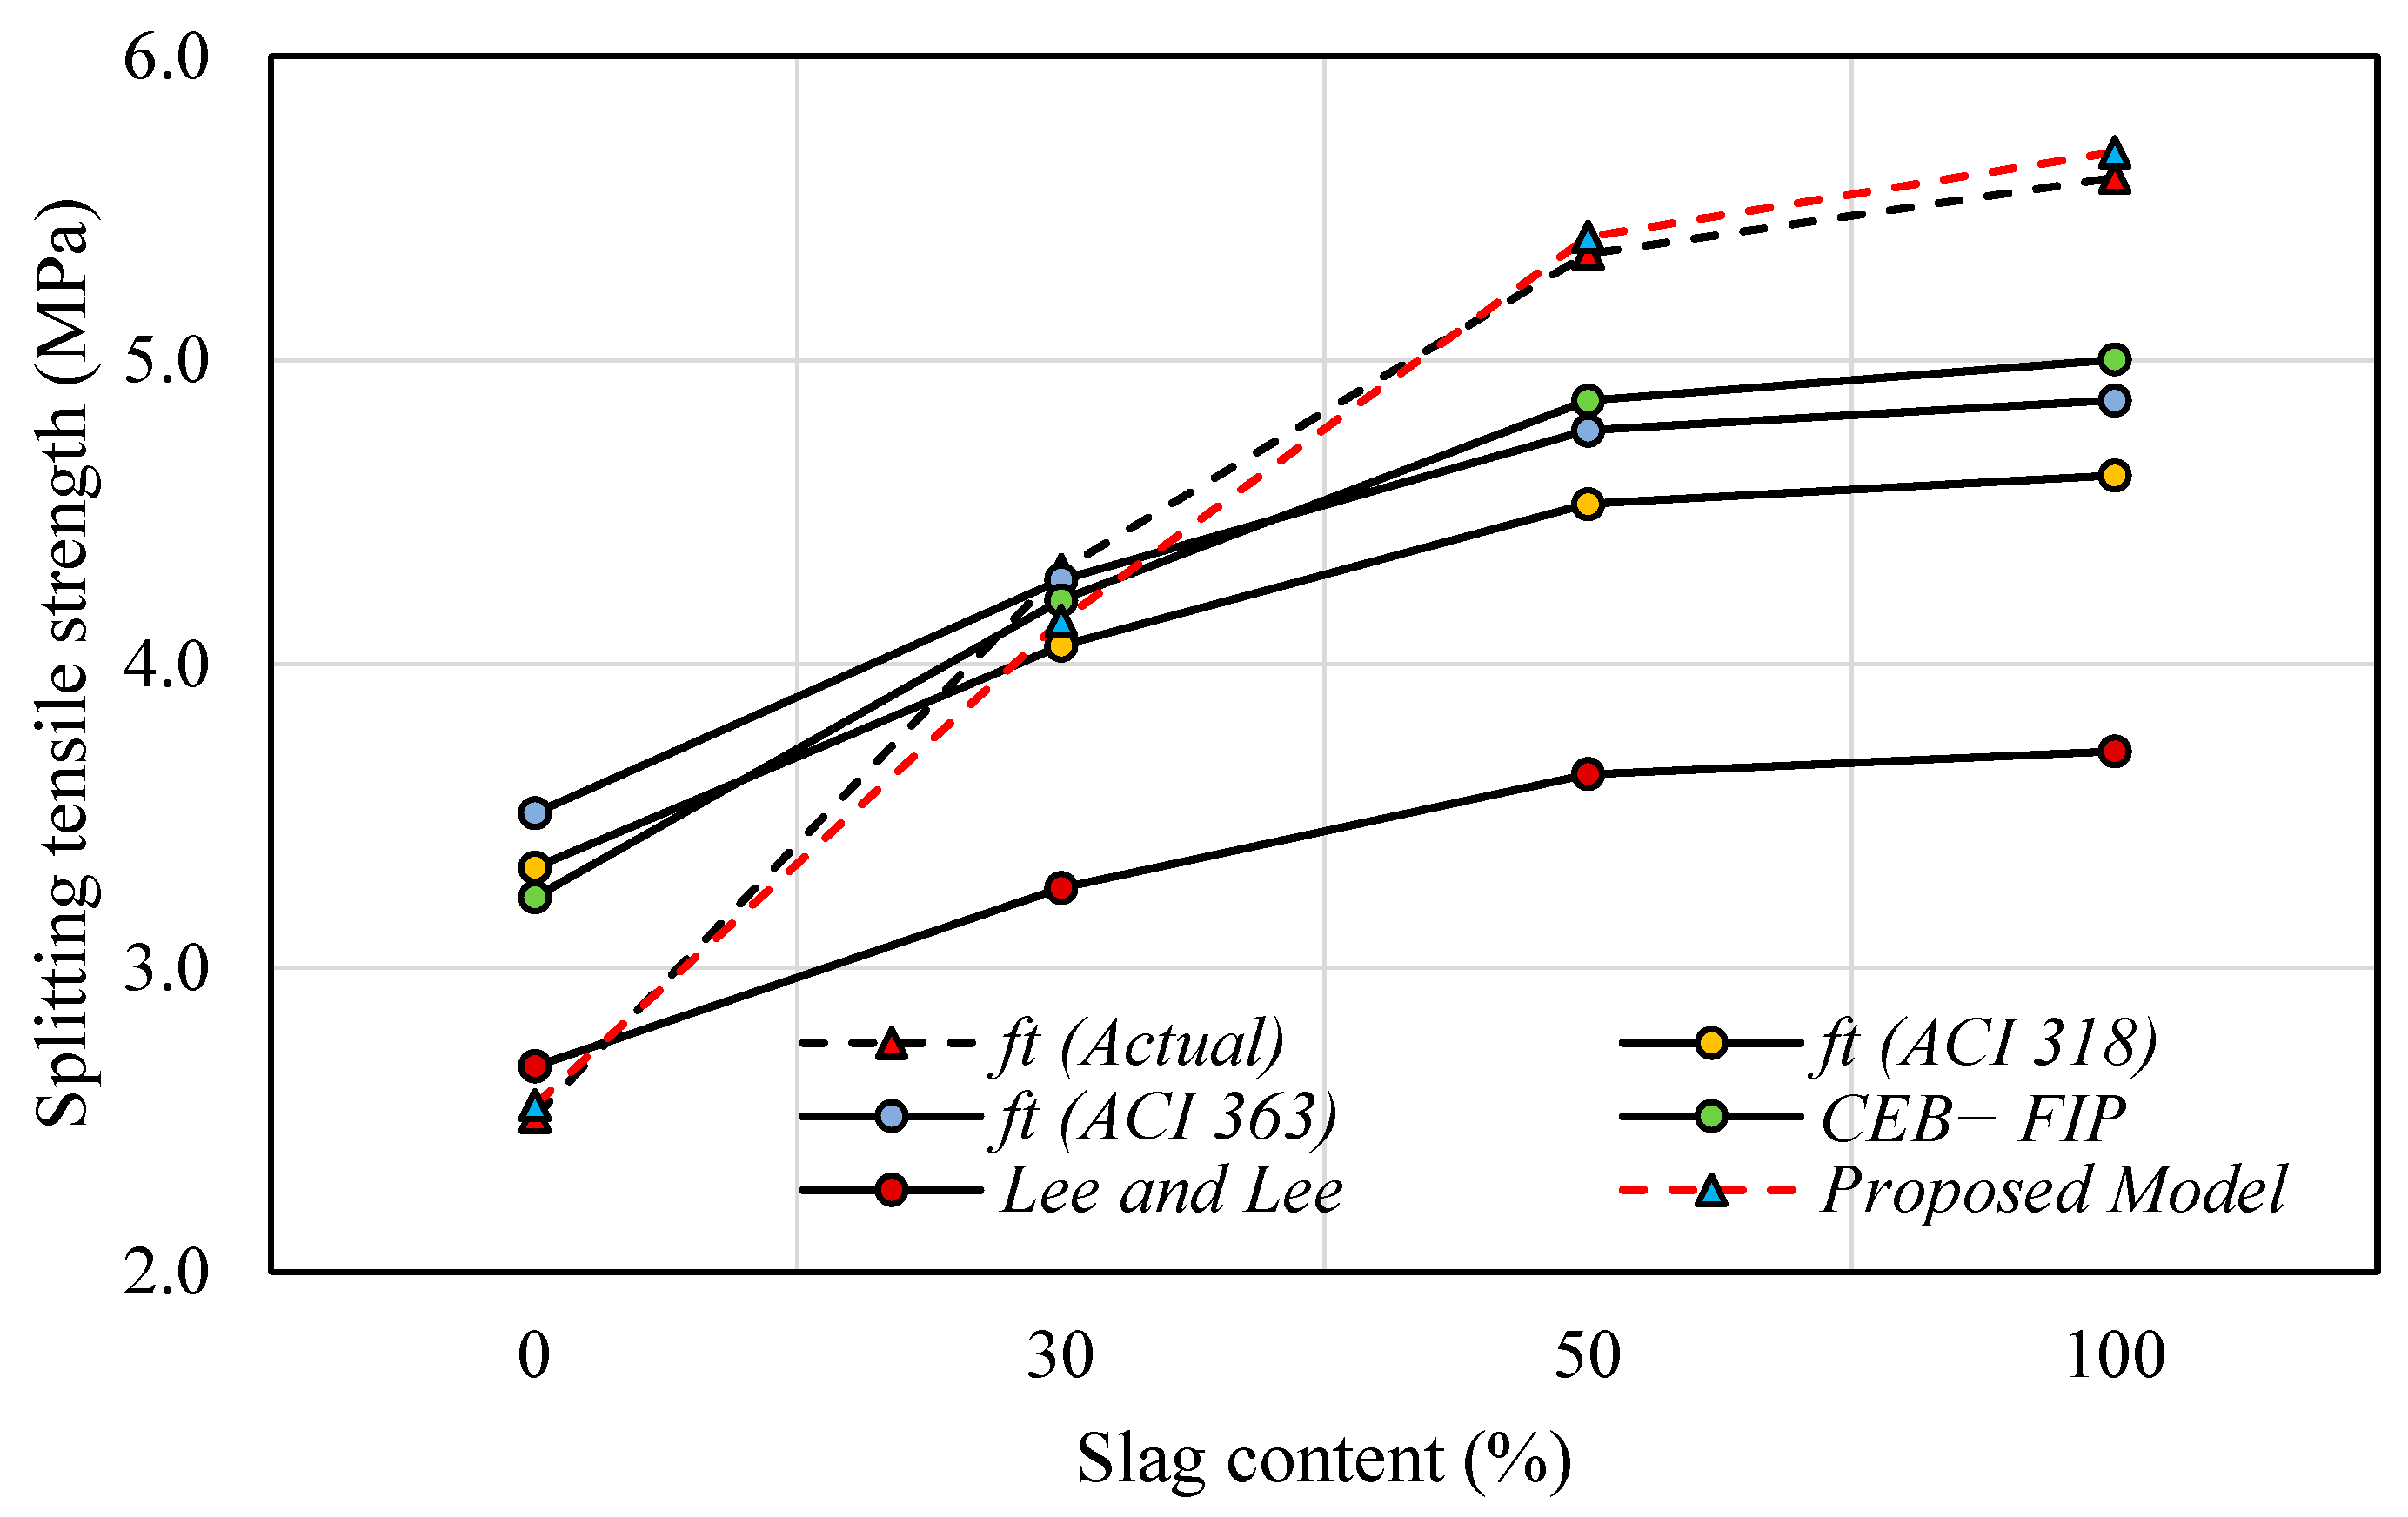
5.3. Prediction of Splitting Tensile Strength
Splitting Tensile Strength (ft)
5.4. Durability Properties
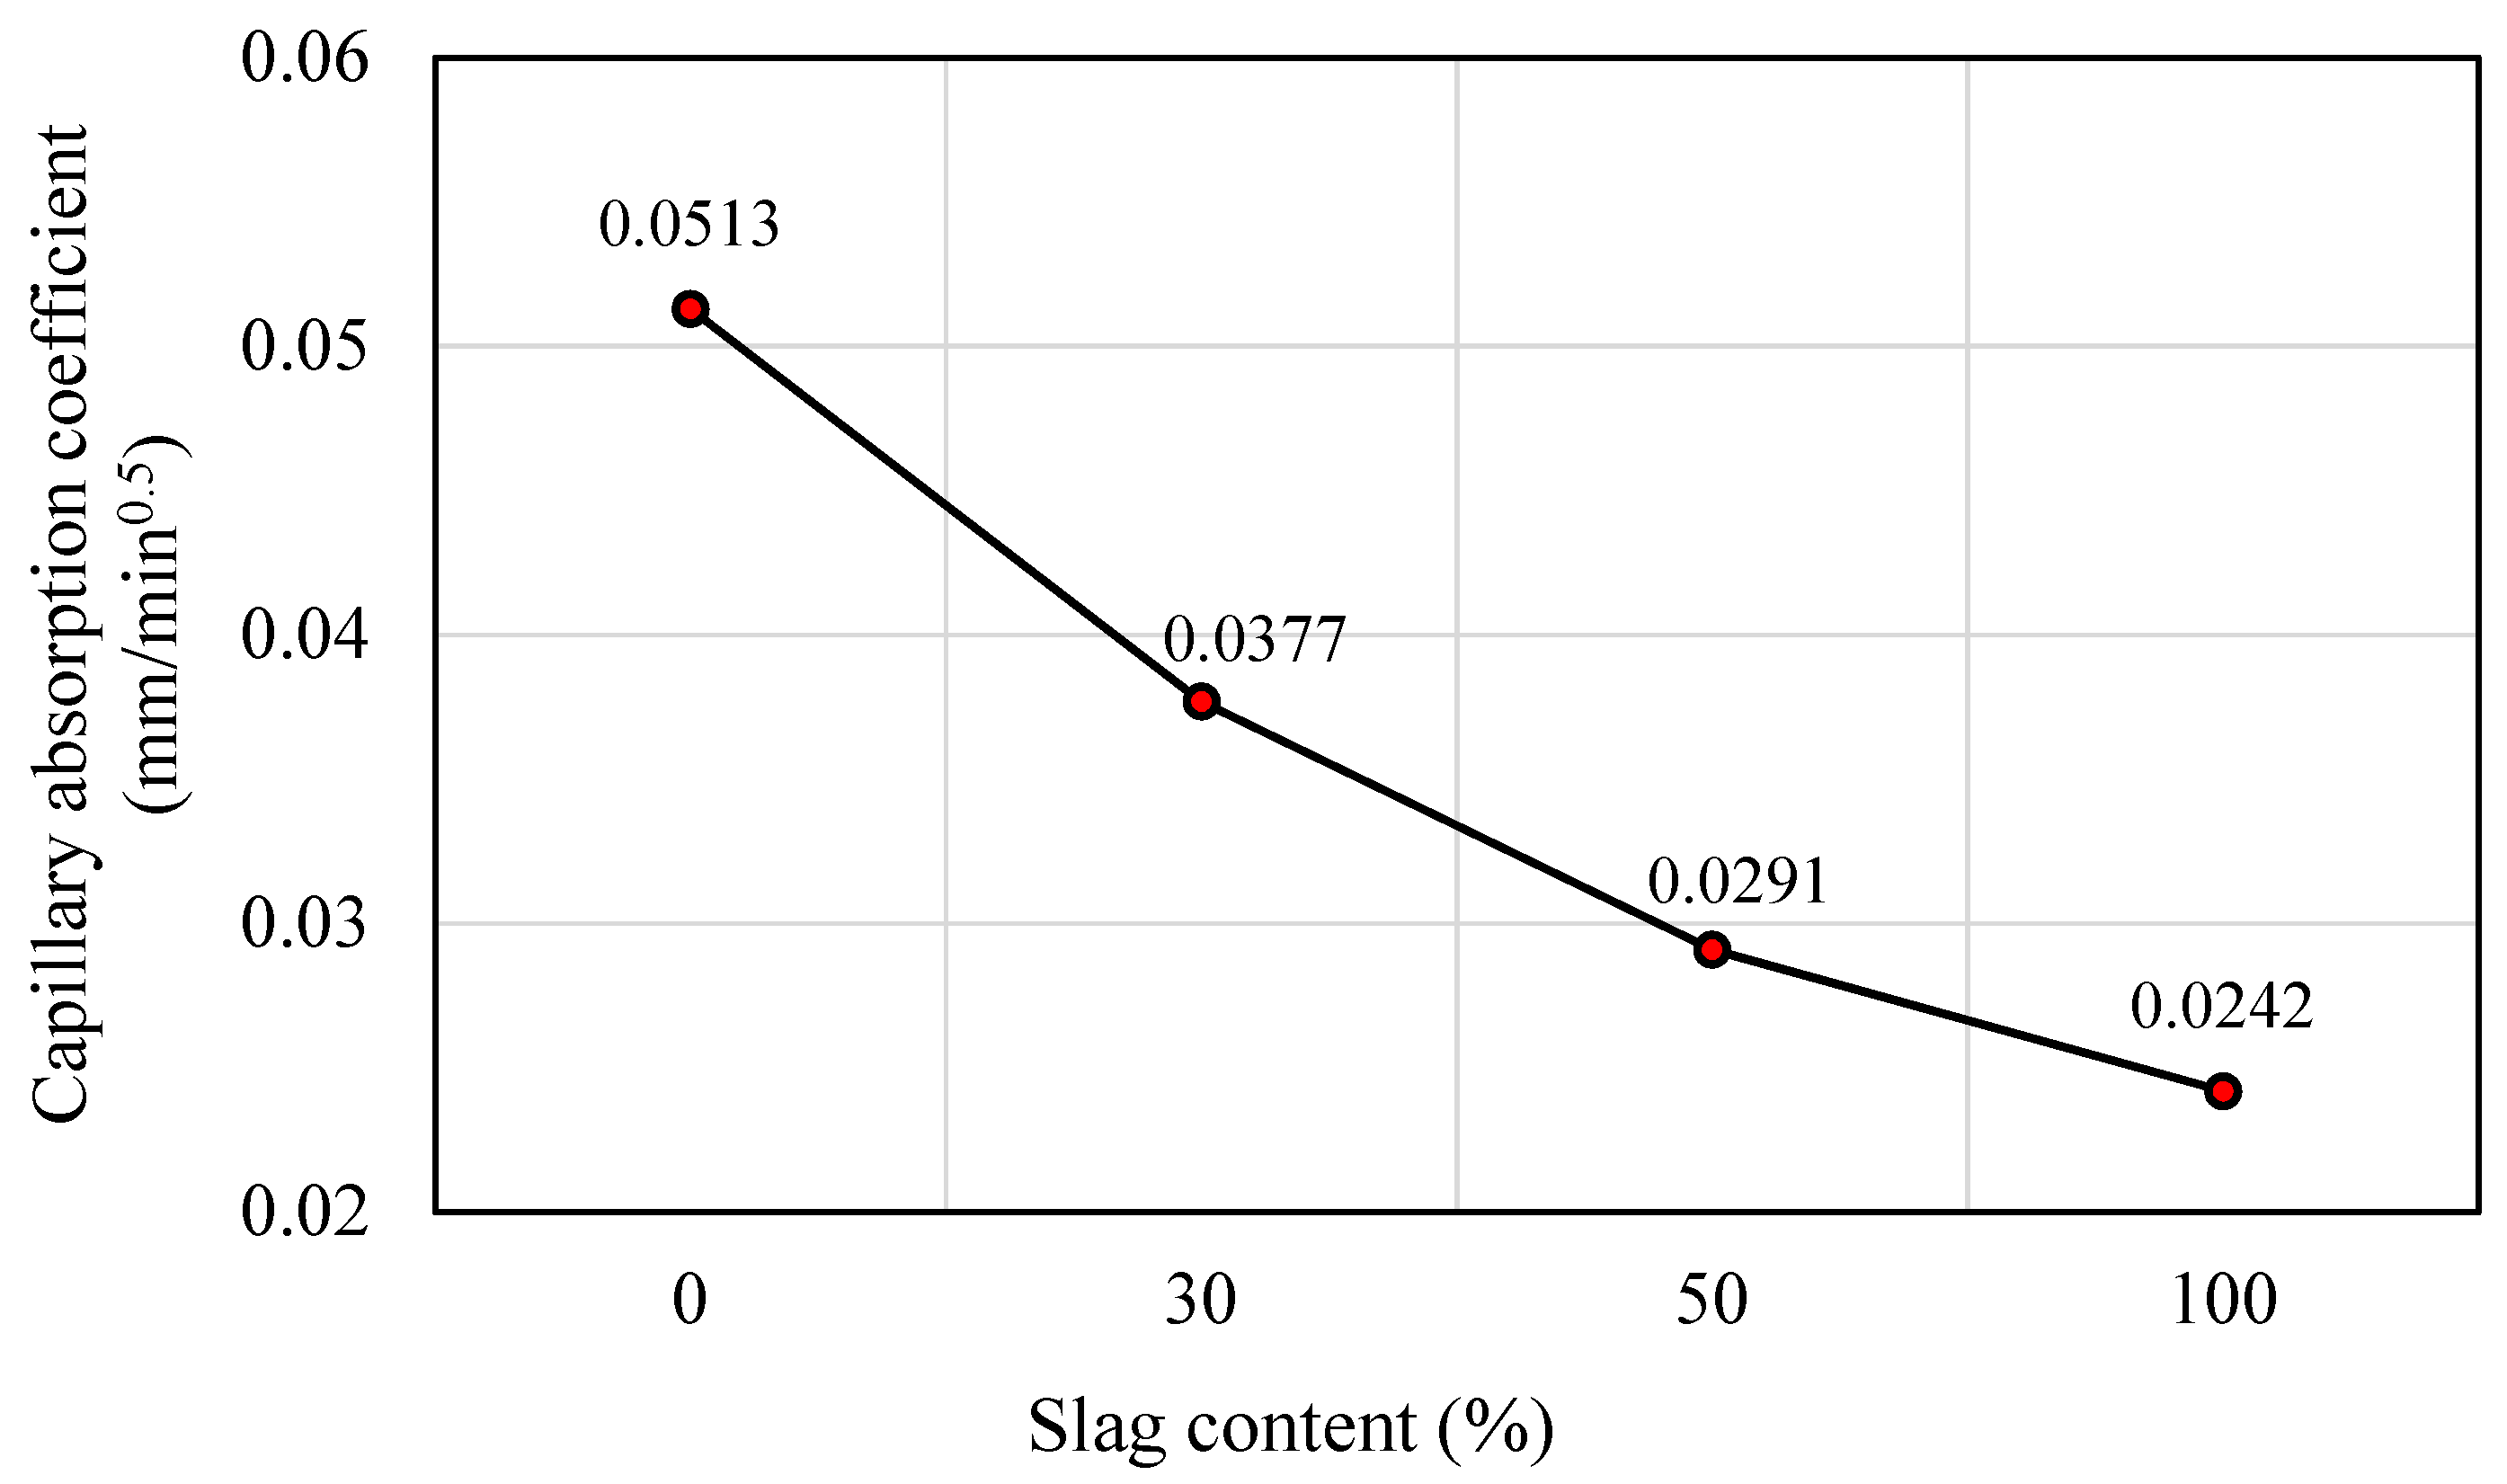
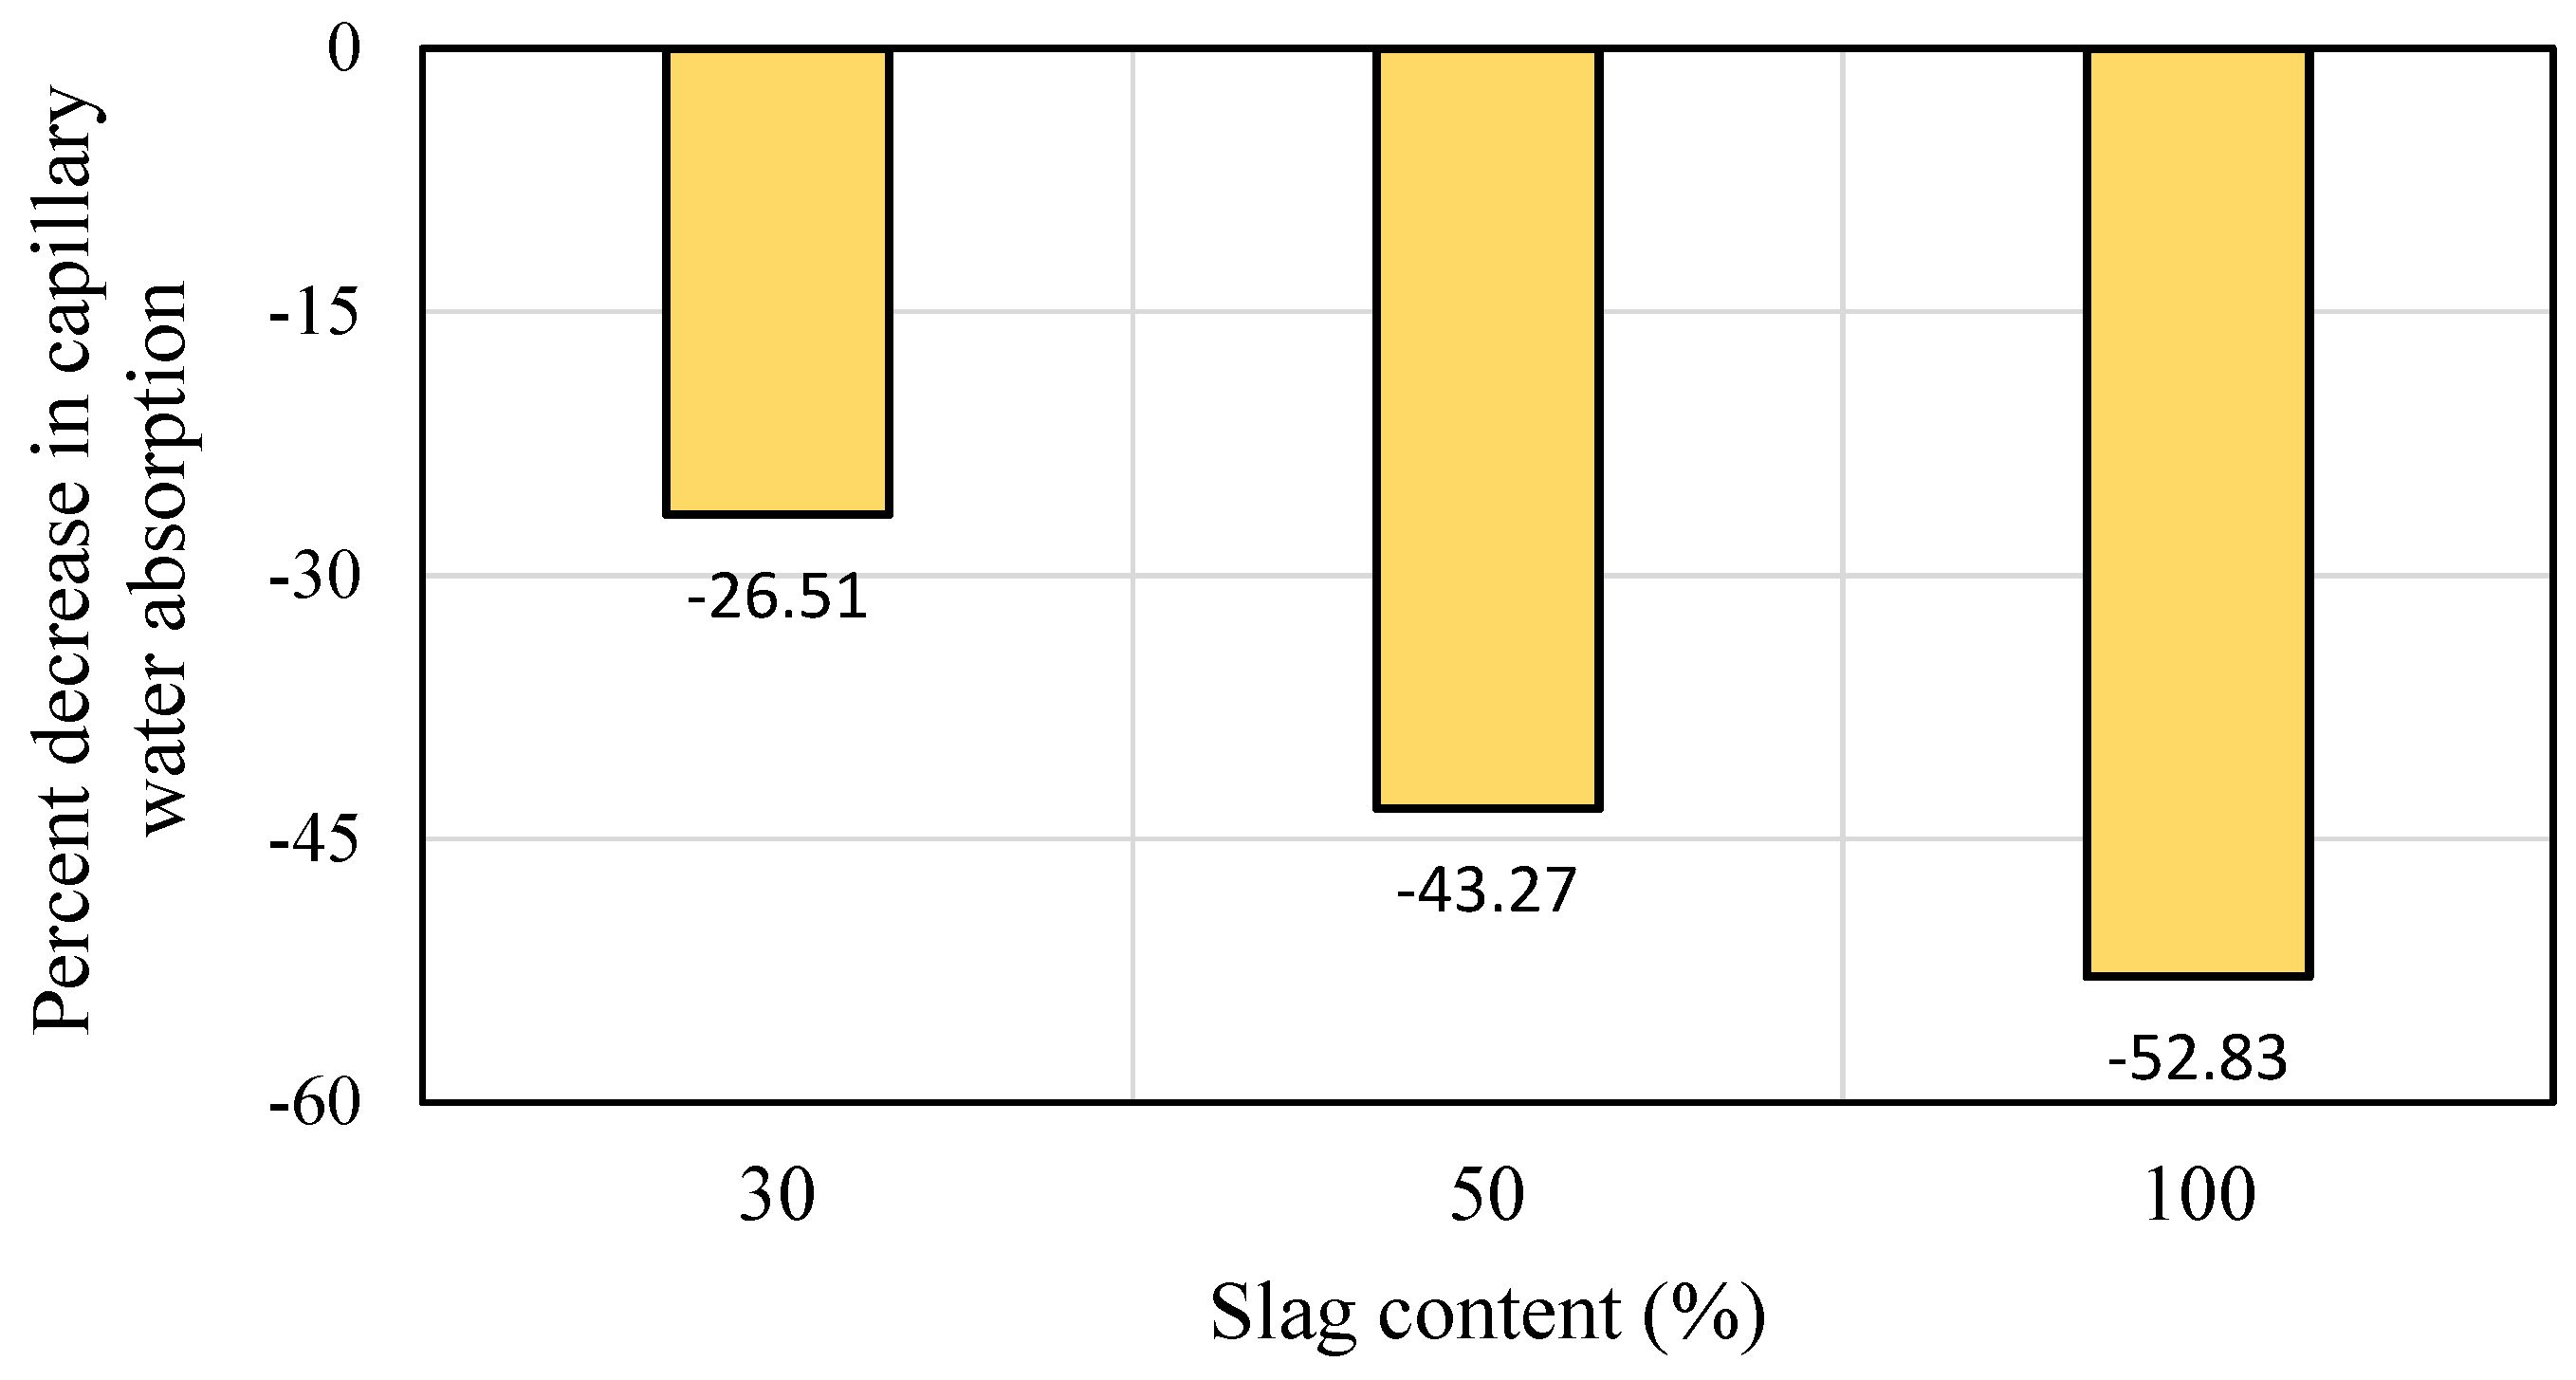
5.4.1. Capillary Water Absorption (Sorptivity)
5.4.2. Drying Shrinkage and Mass Loss
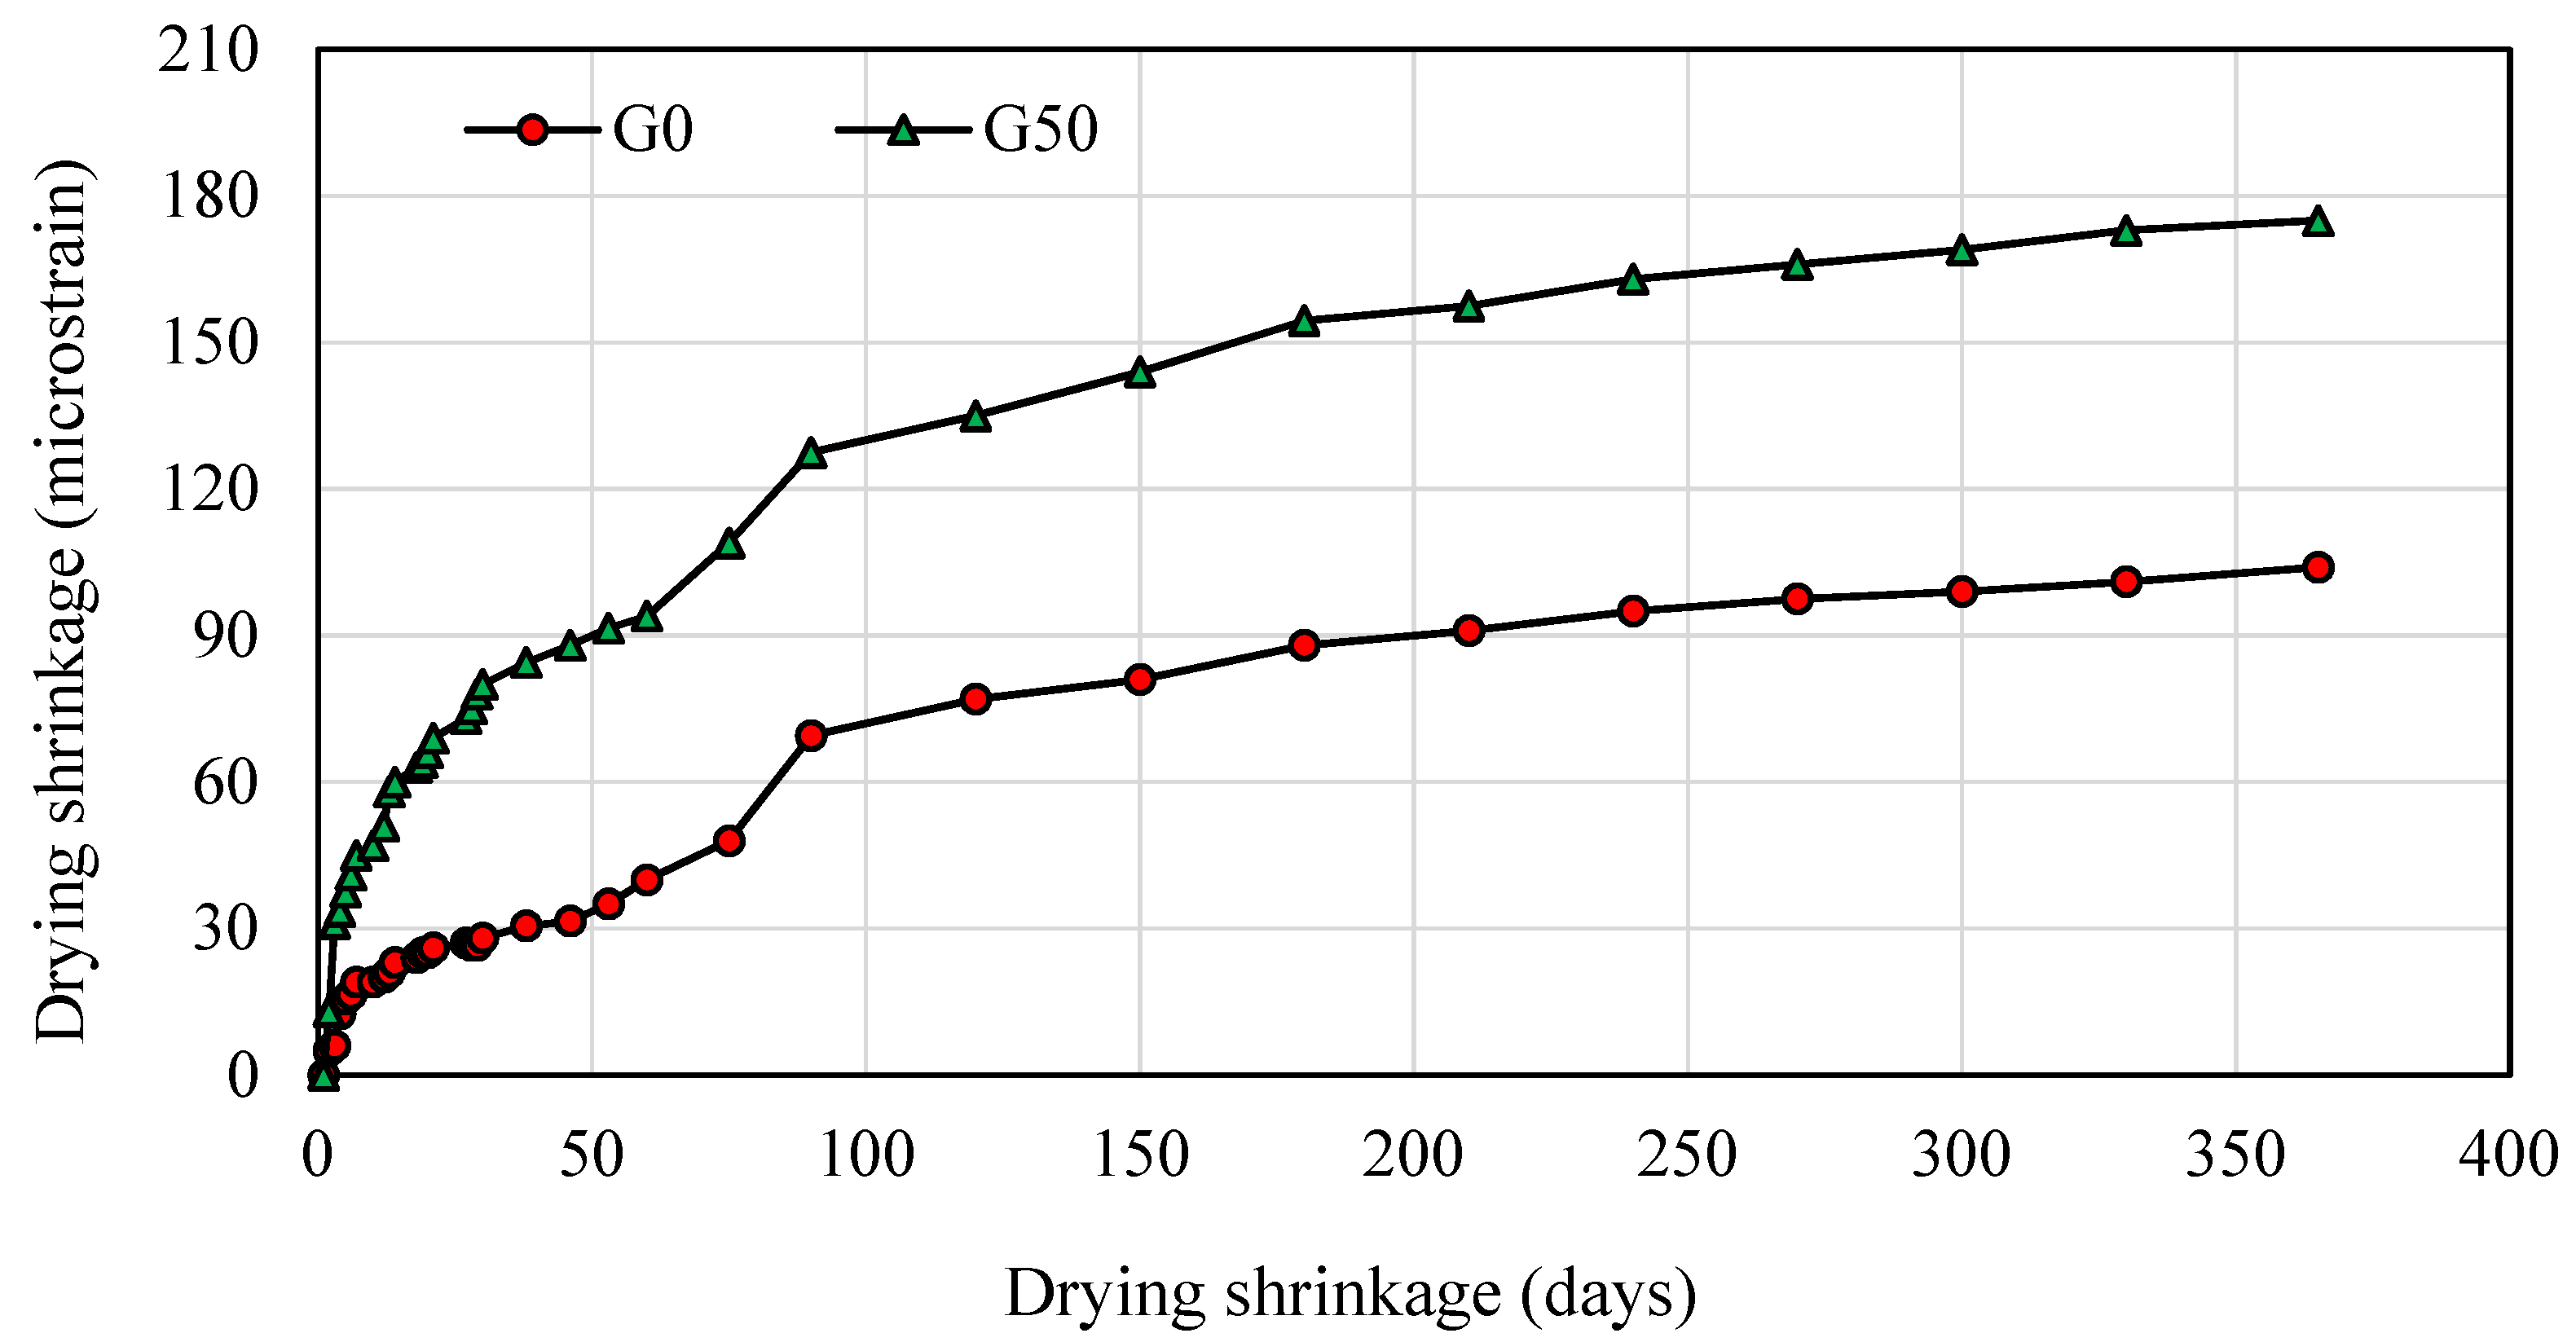
Free Drying Shrinkage
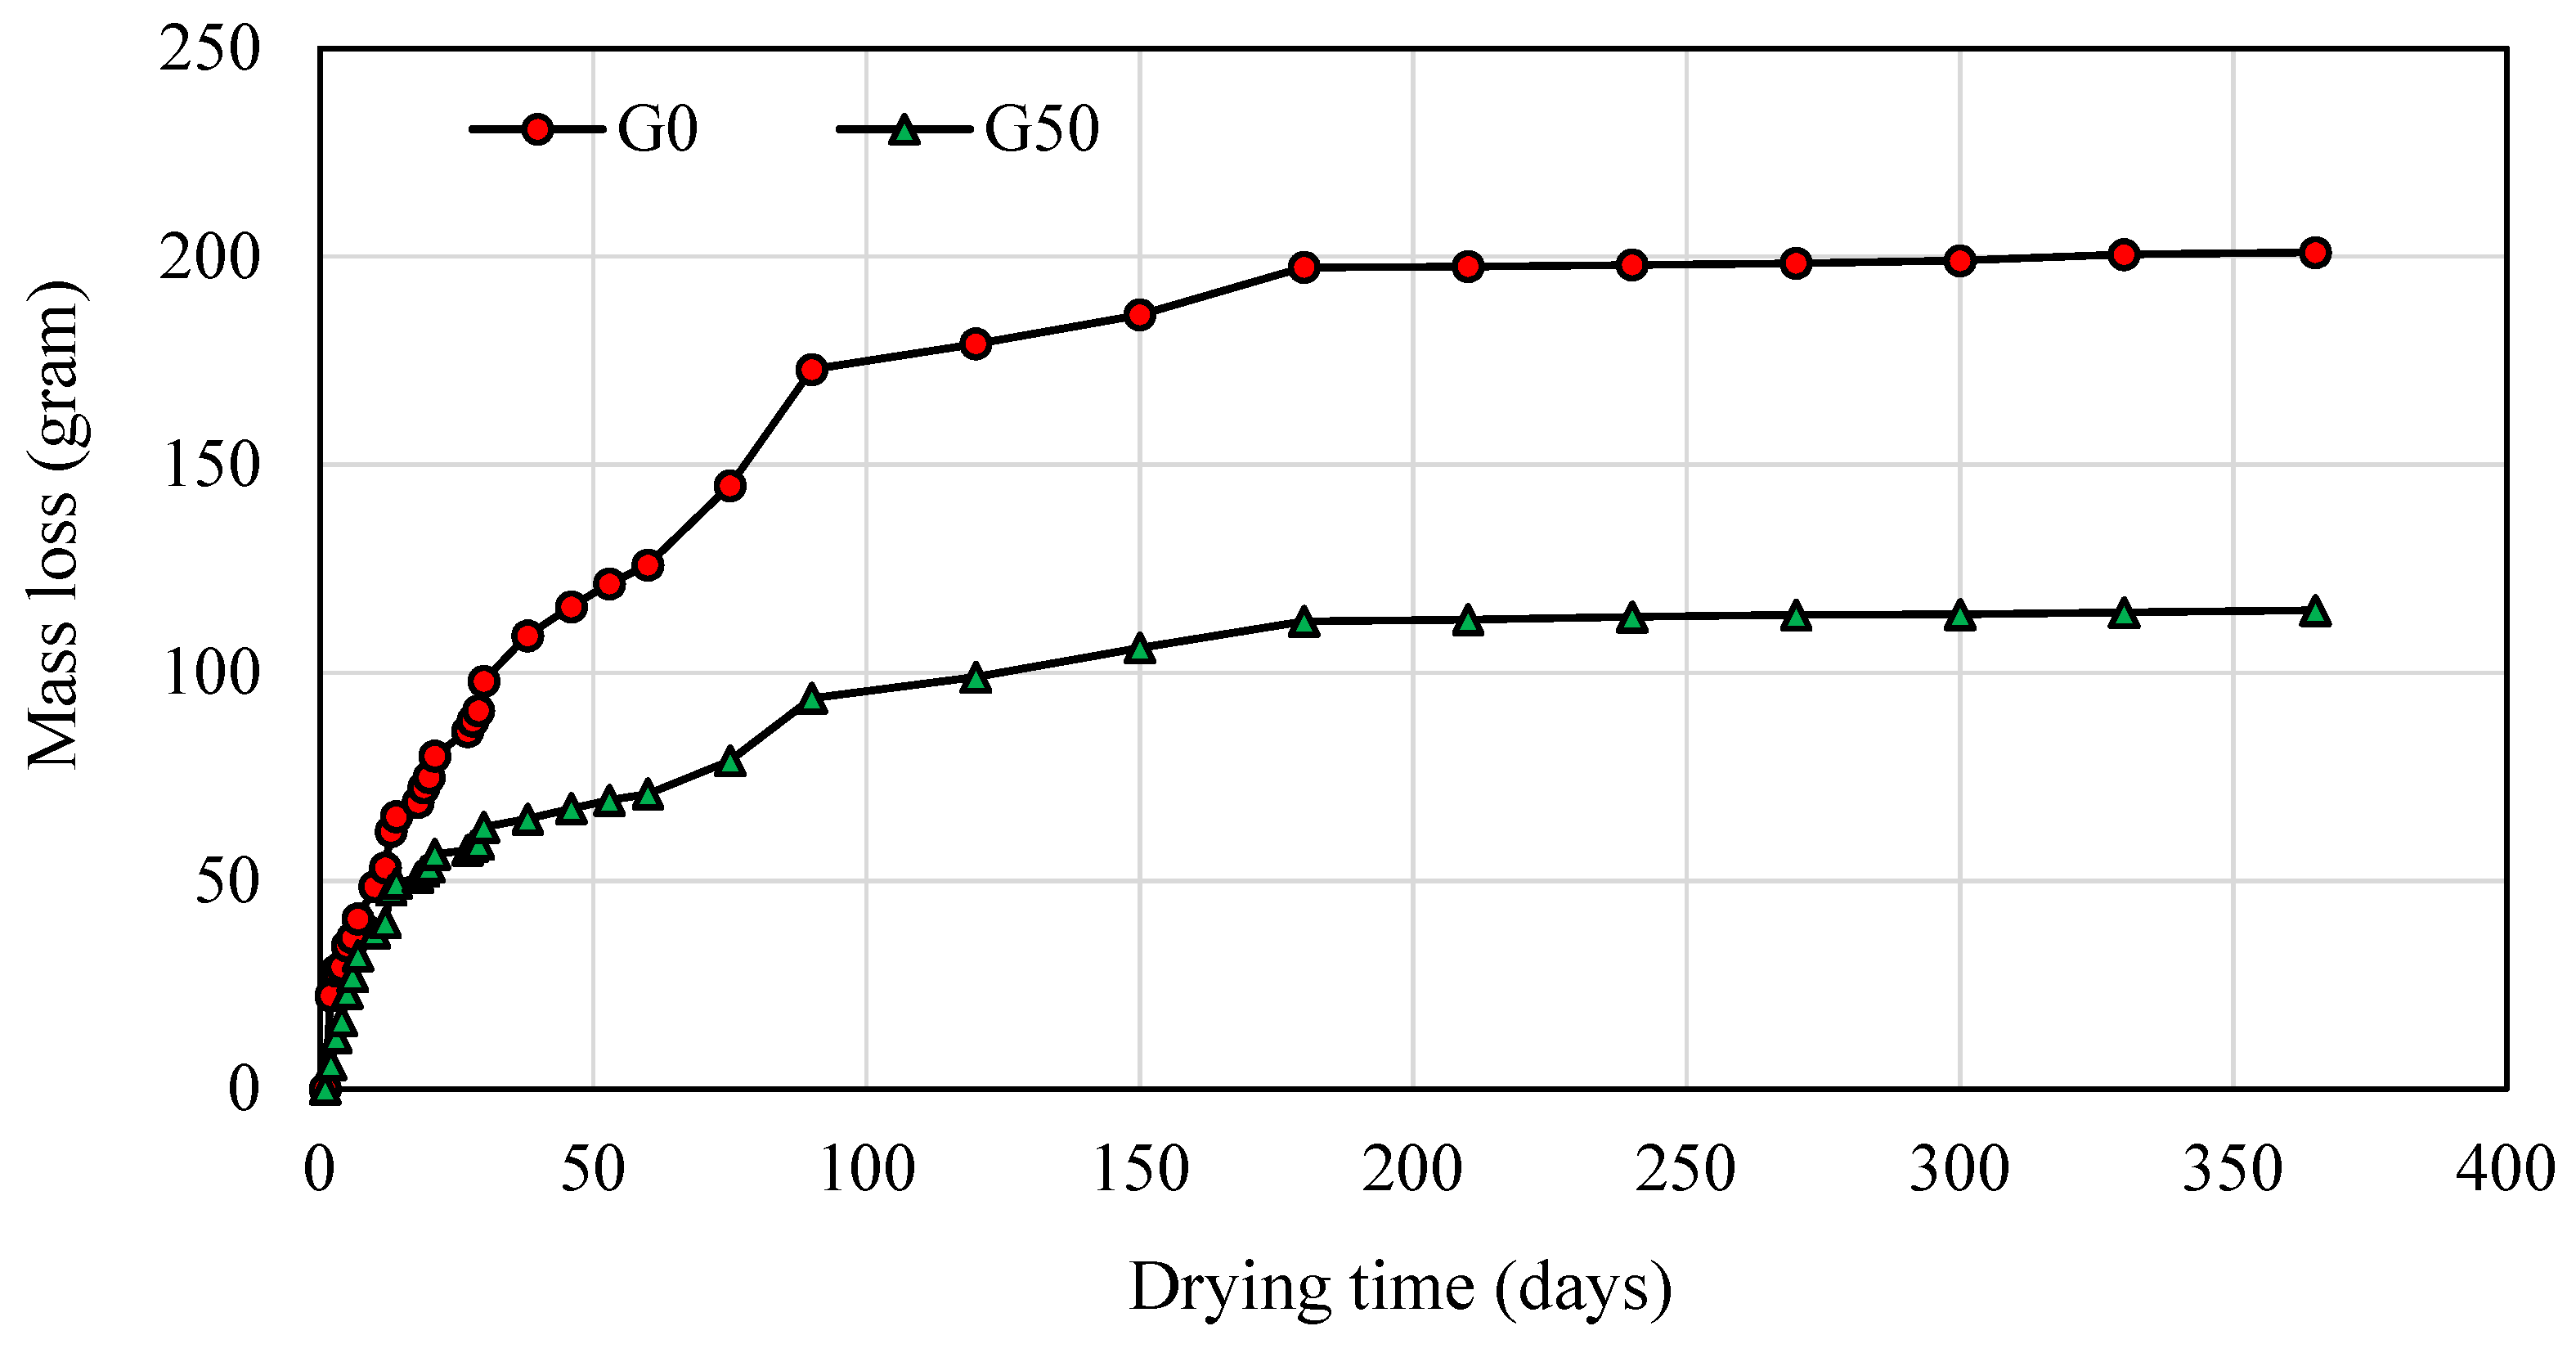
Mass Loss
6. Conclusions
- Slag inclusion has a negative impact on the flowability of SCGC in terms of slump flow and J-ring flow diameter. The slump and J-ring flow values decrease by increasing the slag in the mixes, but this is still within EFNARC’s acceptable limits. This may be due to the morphology, lower specific surface area, and lesser reactivity of the FA binder compared to slag.
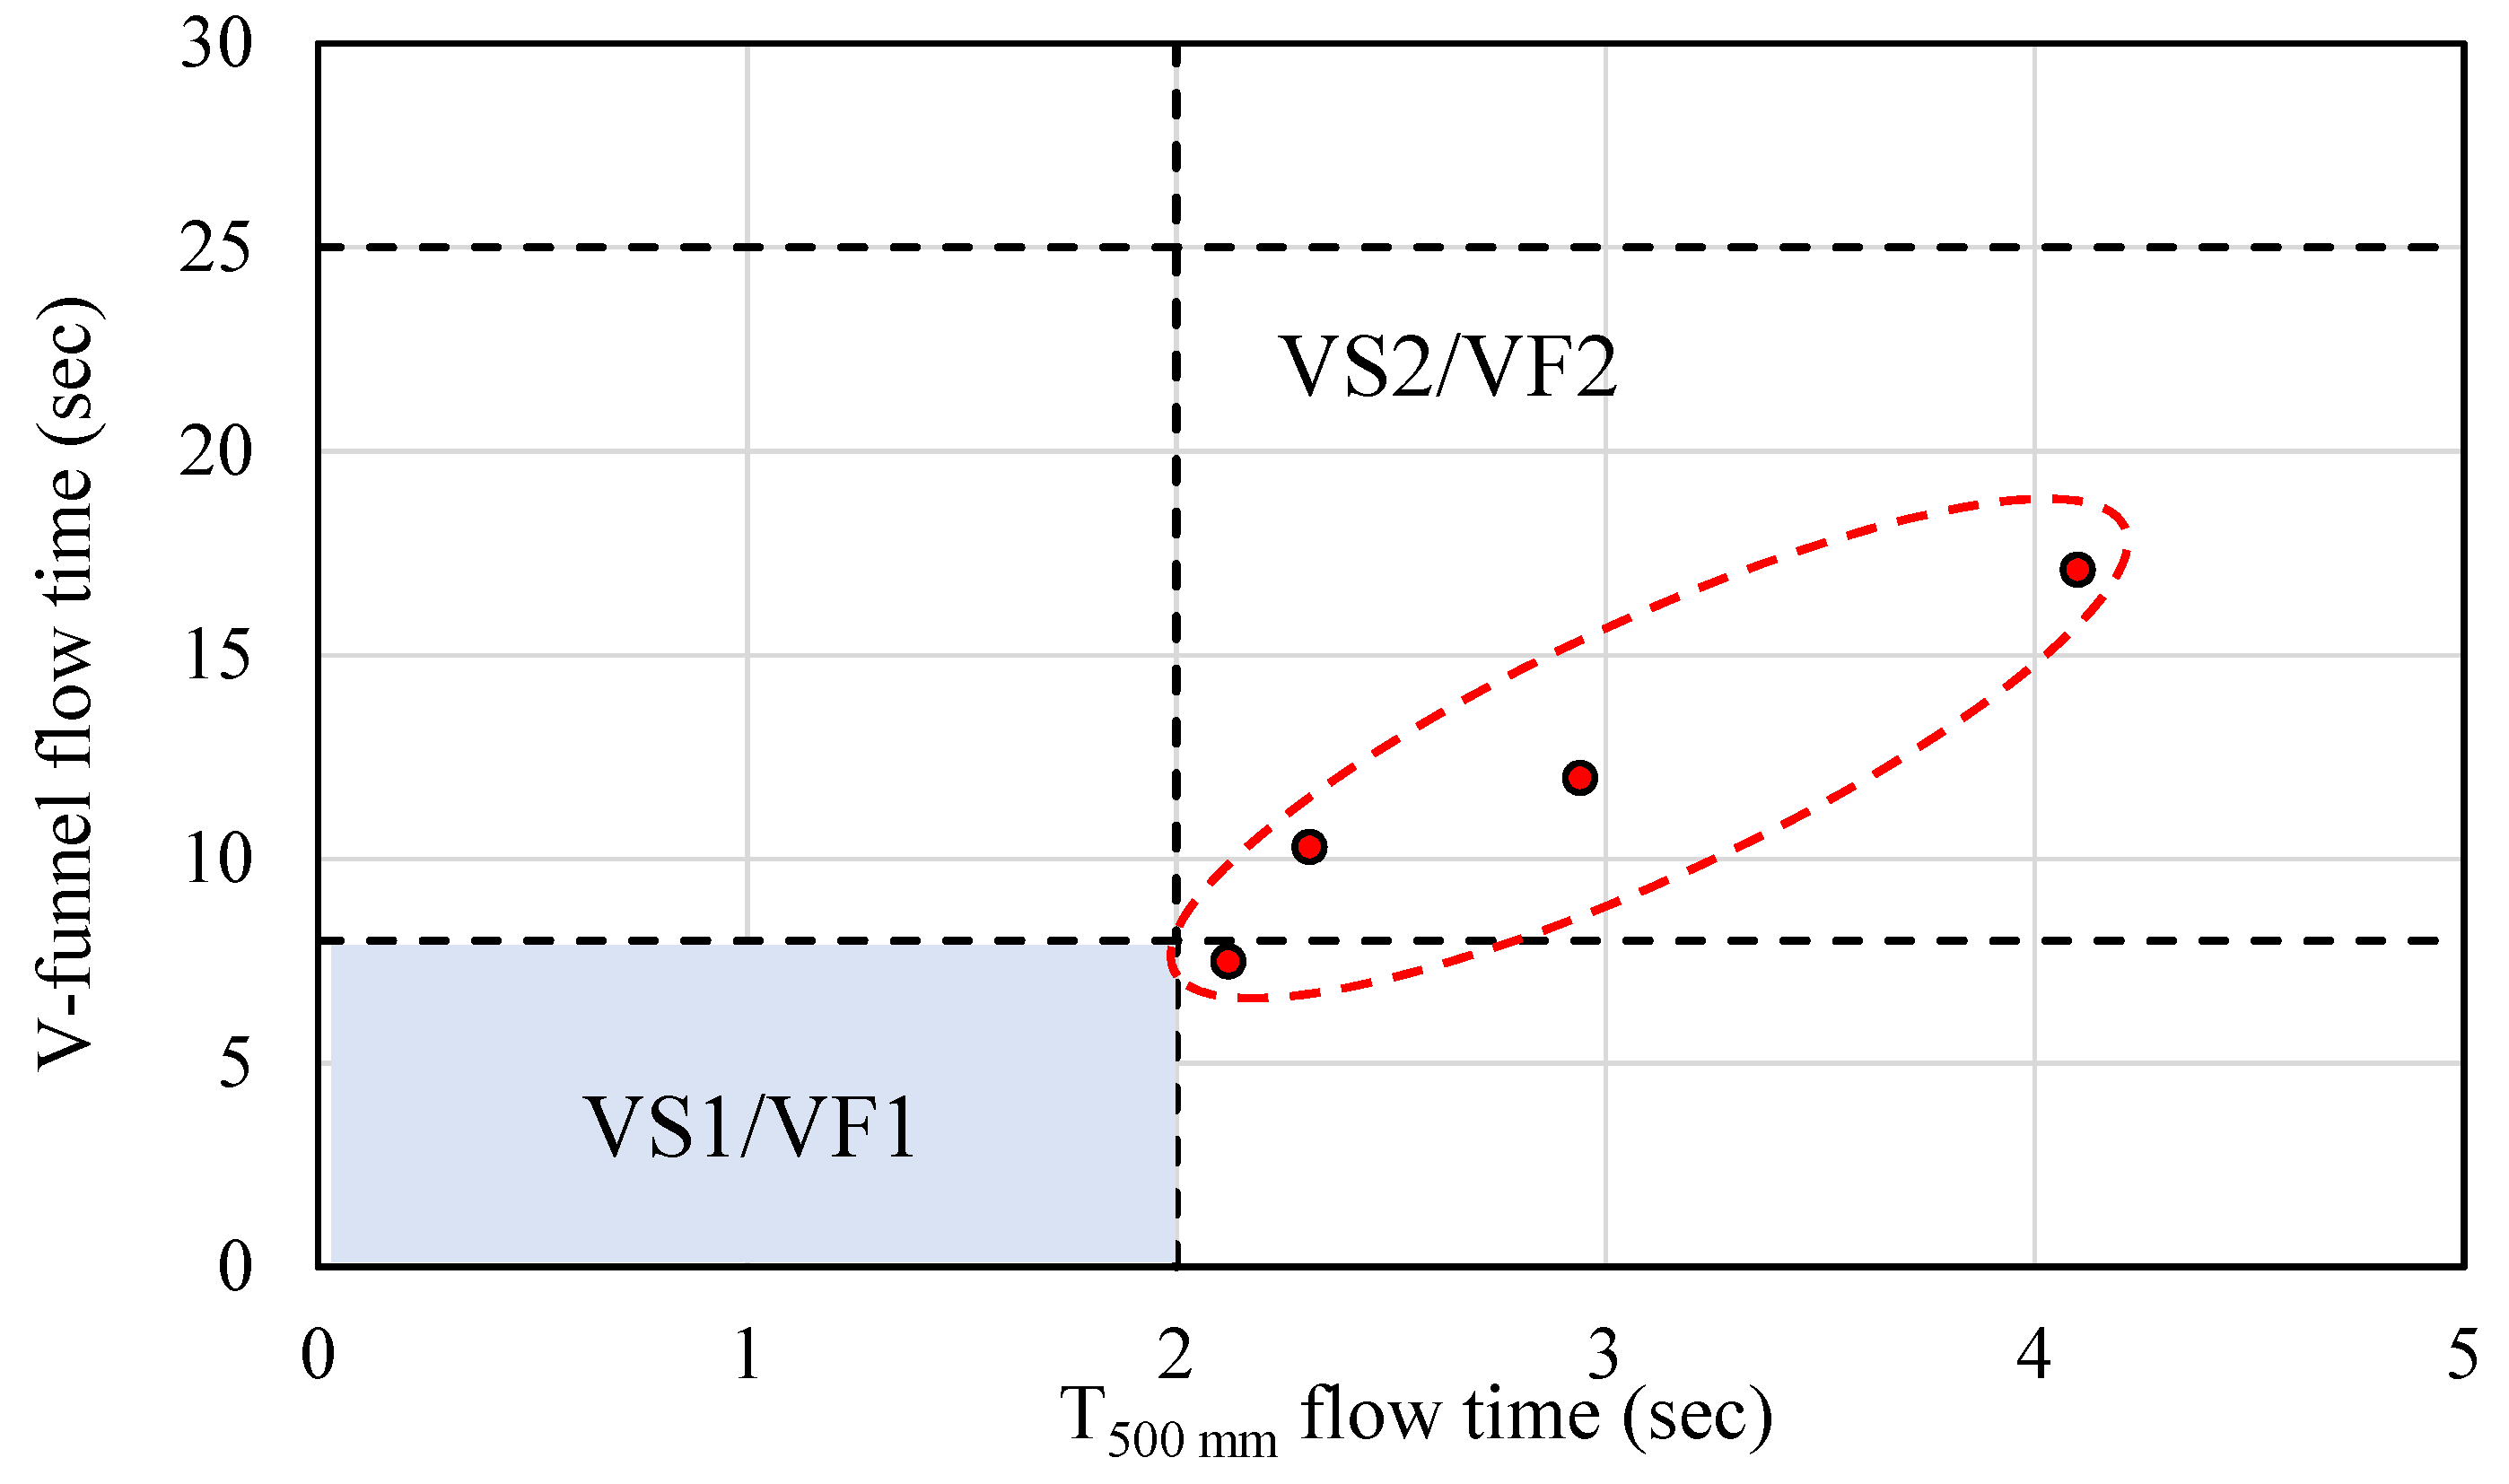
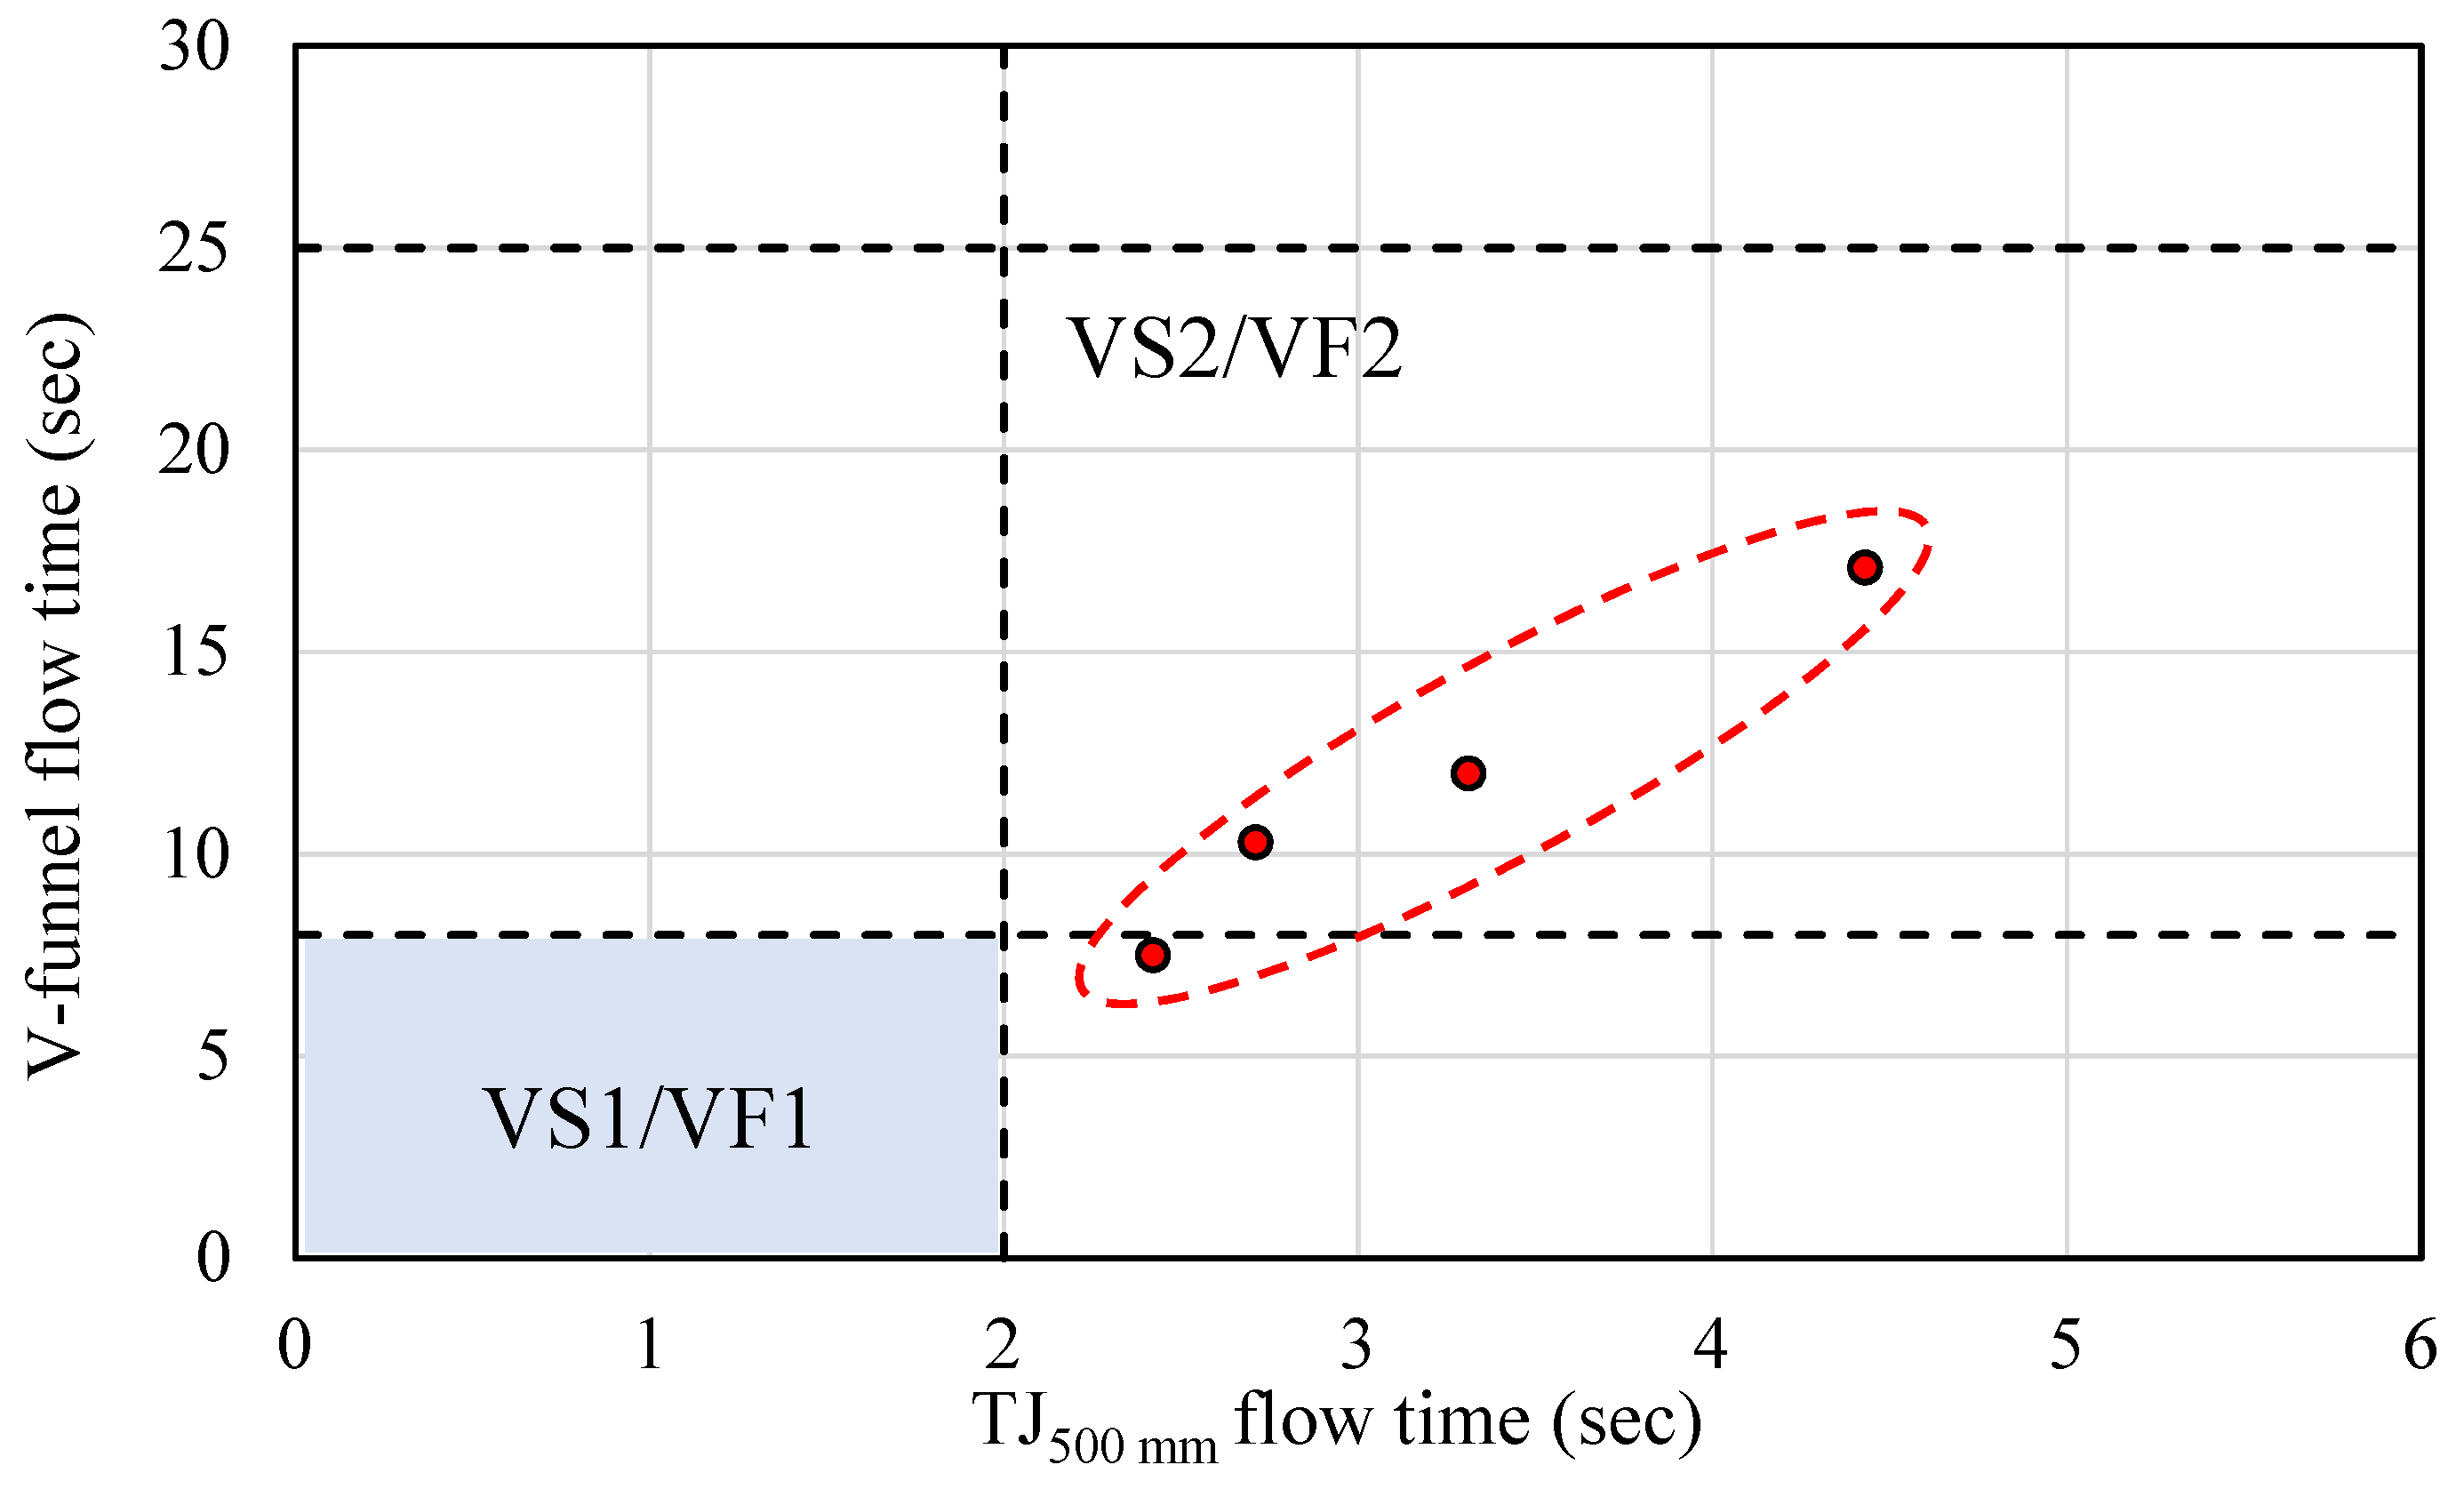
- T500, TJ500, and V-funnel flow times increase with the increase in slag replacement levels. The relationship of V-funnel via T500 and V-funnel via TJ500 also indicates that slag-rich SCGCs mixtures belong to the viscosity class (VS2/VF2) as defined by EFNARC. It can also be concluded that this kind of concrete might help improve resistance to segregation or reduce pressure on the formwork.
- Slag leads to a reduction in the passing-ability of fresh concrete.
- Slag has a significant impact on the segregation resistance of SCGC mixes. The allowable range of segregation index (%) is attained when the usage of slag exceeds 30% of the total binder content.
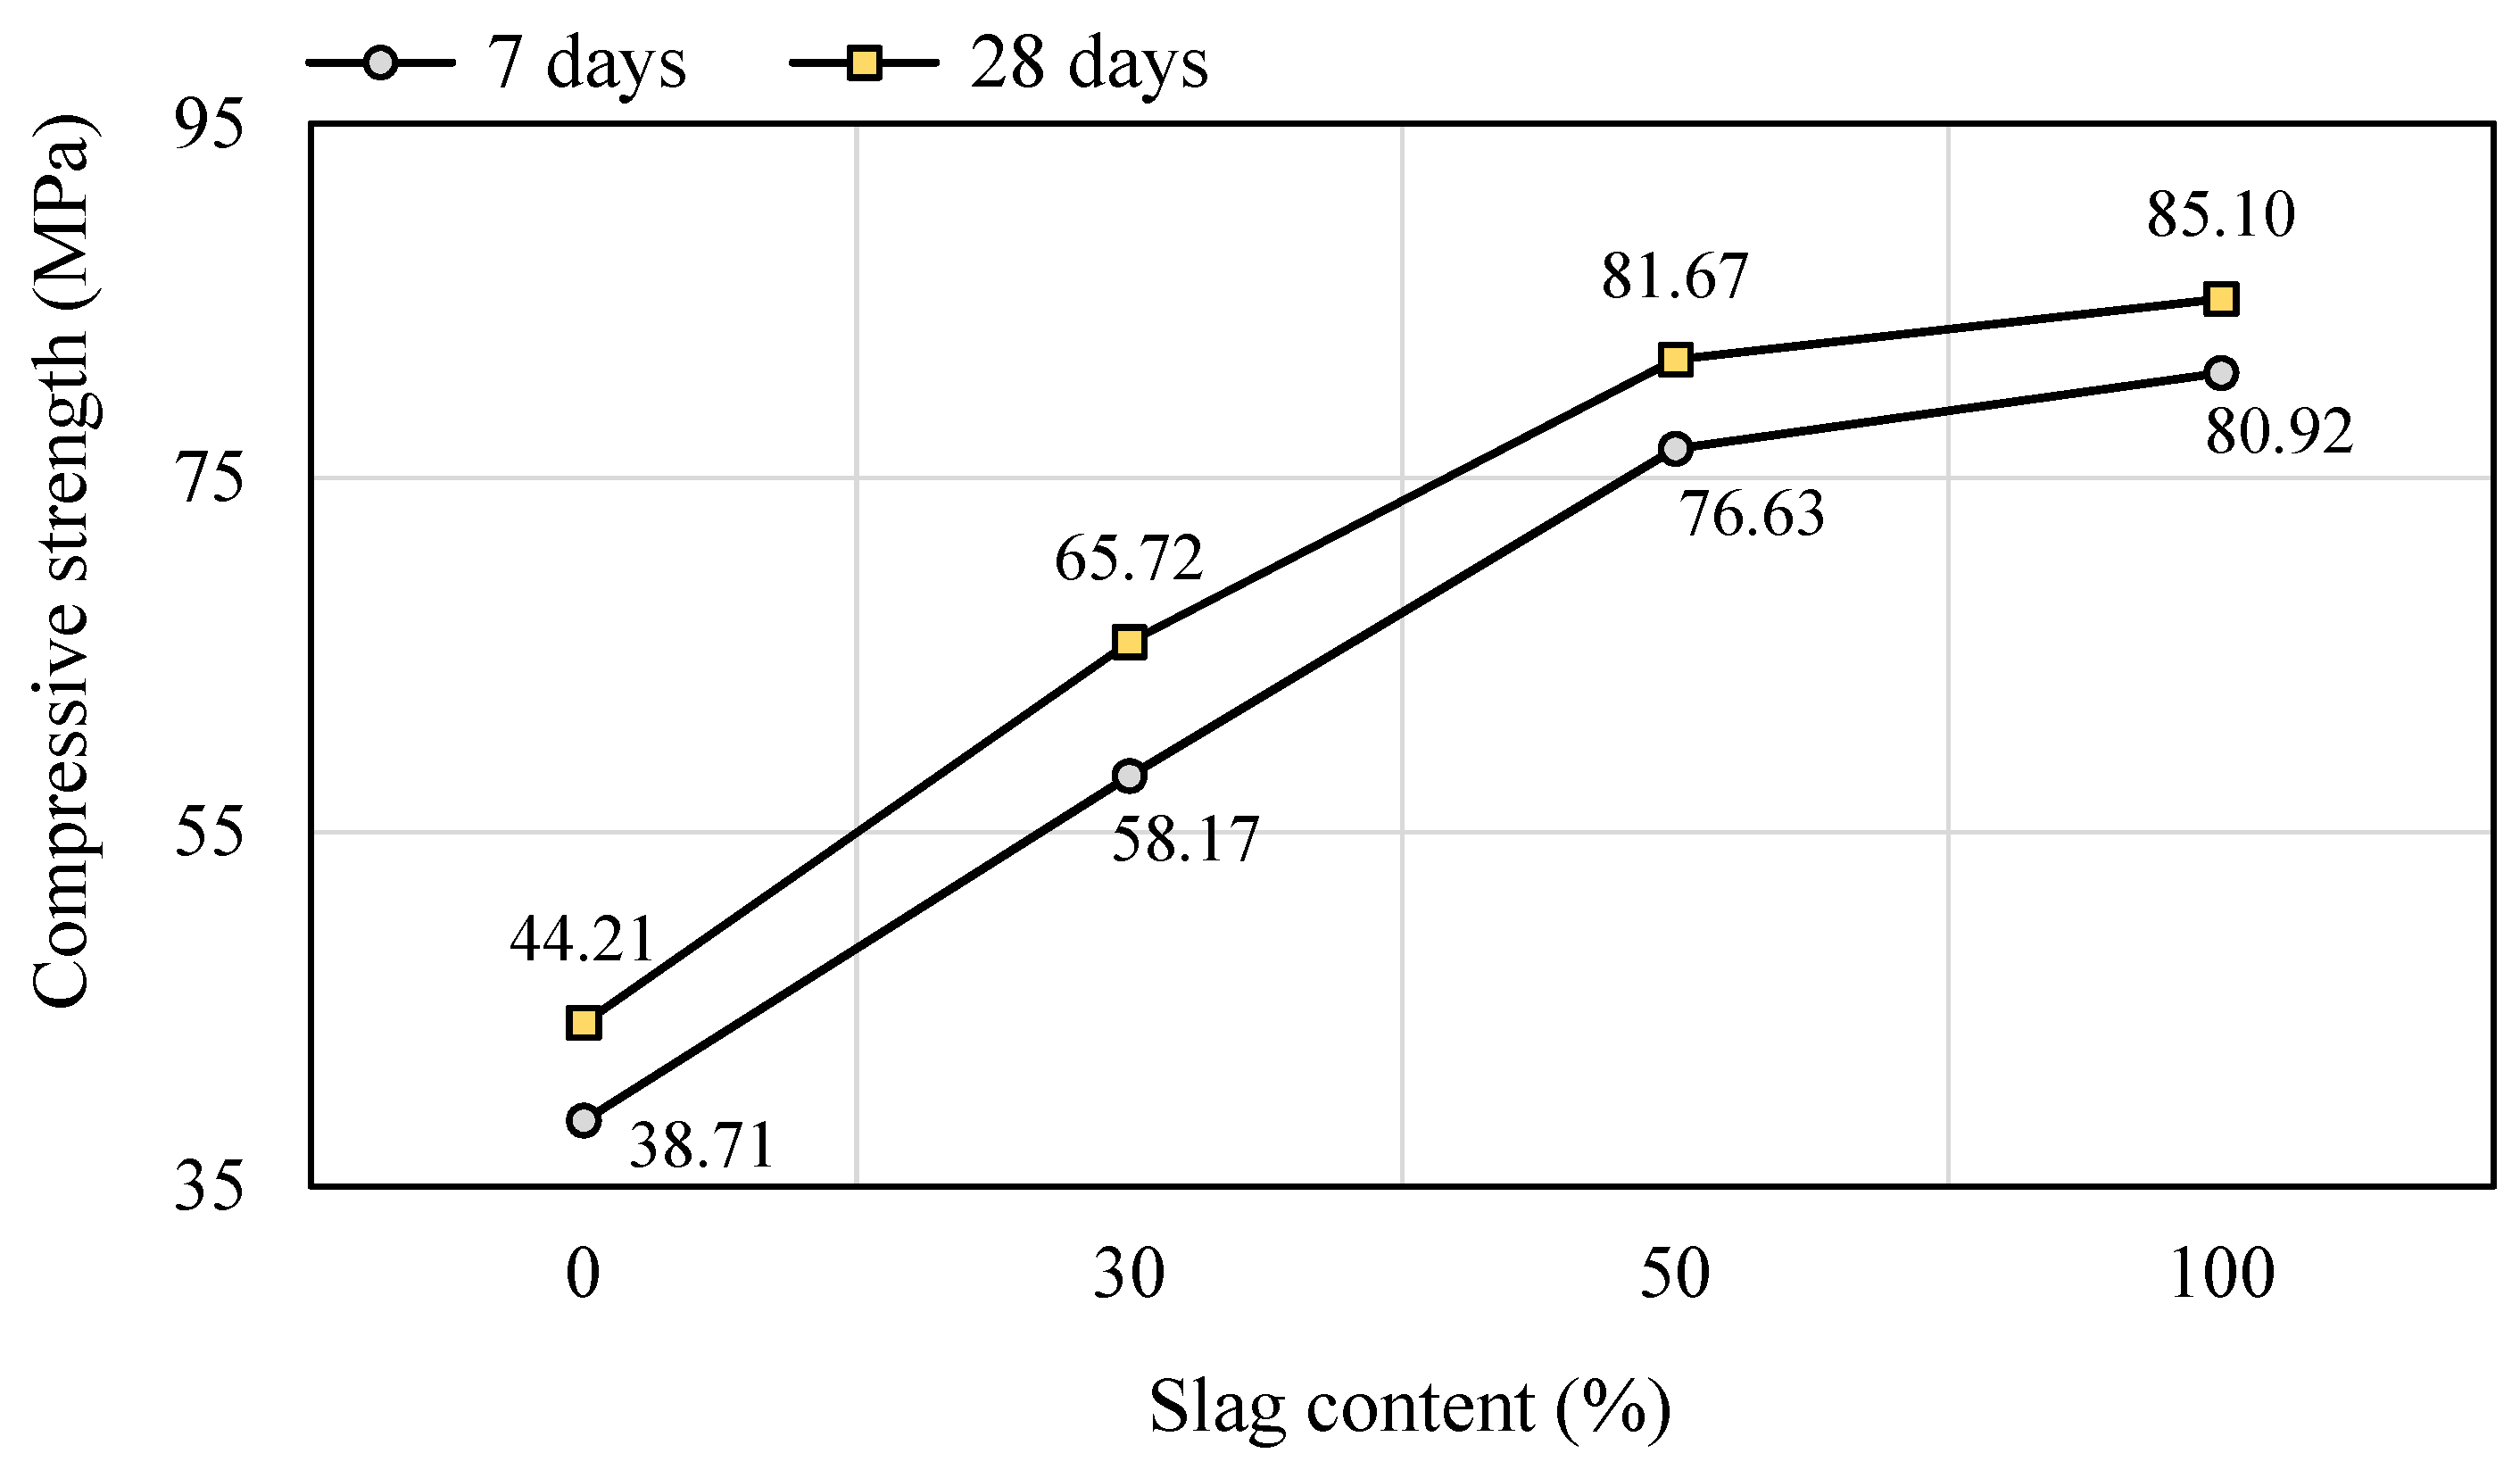
- The low-calcium content of FA binders delays hardening, and using slag in geopolymer concrete mixes can help accelerate strength gain.
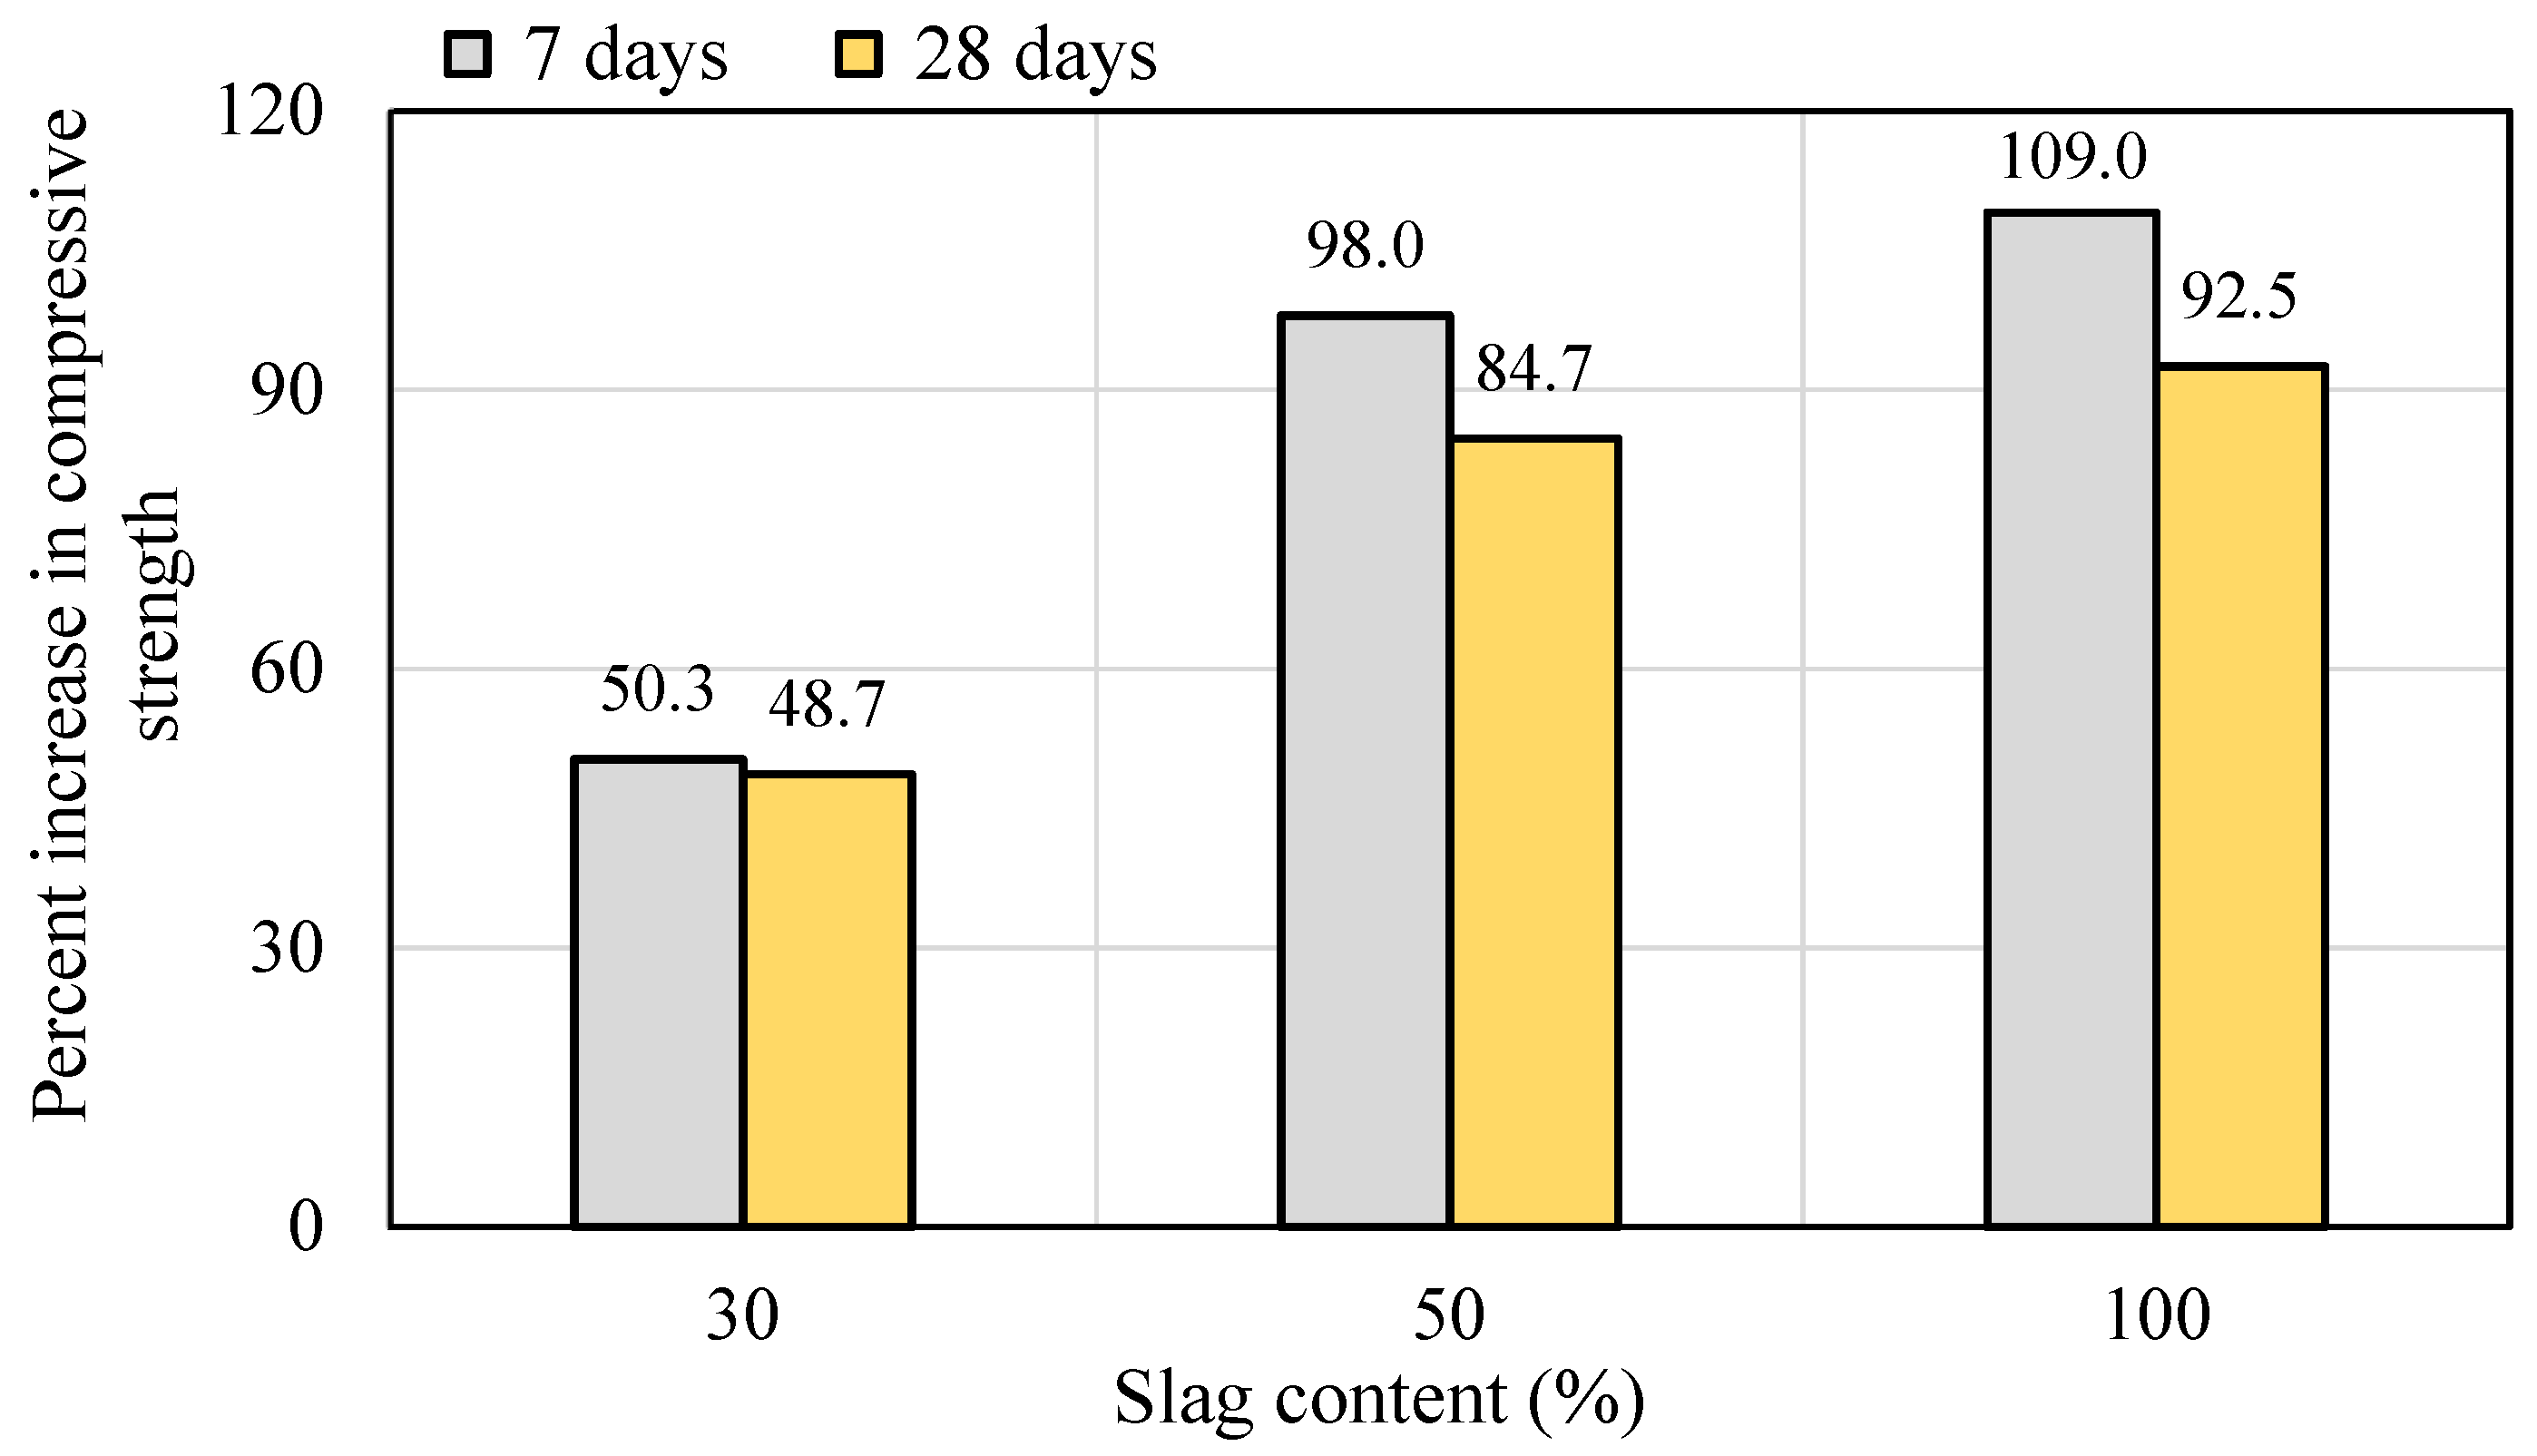
- The utilization of slag results in a considerable increase in compressive and splitting tensile strength. The highest relative benefit is observed at 50% replacement.
- The splitting tensile strength was found to increase faster than the compressive strength, indicating a potential enhancement of the ITZ. A new predictive equation is proposed for these mixes.
- Based on the sorptivity test, a higher slag content enhances the durability of SCGC. By utilizing slag, SCGA specimens can achieve a higher rate of resistance to absorption. As the percentage of slag climbed from 0% to 100%, the sorptivity value declined to 48.5%.
- FA-based SCGC made with or without slag exhibits low free drying shrinkage. SCGC made with 100% FA displays lower shrinkage strains than the mix made with 50% FA and 50% slag due to the lower reactivity of the FA binder compared to slag. After one year of exposing samples to drying conditions, the free drying shrinkage values of SCGC specimens cured at 40 °C were 104 and 175 microstrain for the G0 and G50 mixes, respectively.
- Fully FA-based SCGC specimens show greater mass loss than the mix with 50% slag content. Therefore, it may be inferred that the mass loss parameter does not provide sufficient information about the variety in free drying shrinkage results.
7. Recommendations
Author Contributions
Funding
Institutional Review Board Statement
Informed Consent Statement
Acknowledgments
Conflicts of Interest
Abbreviations
References
- Antiohos, S.K.; Tapali, J.G.; Zervaki, M.; Sousa-Coutinho, J.; Tsimas, S.; Papadakis, V.G. Low Embodied Energy Cement Containing Untreated RHA: A Strength Development and Durability Study. Constr. Build. Mater. 2013, 49, 455–463. [Google Scholar] [CrossRef]
- Prasittisopin, L.; Trejo, D. Hydration and Phase Formation of Blended Cementitious Systems Incorporating Chemically Transformed Rice Husk Ash. Cem. Concr. Compos. 2015, 59, 100–106. [Google Scholar] [CrossRef]
- Aprianti, E.; Shafigh, P.; Bahri, S.; Farahani, J.N. Supplementary Cementitious Materials Origin from Agricultural Wastes—A Review. Constr. Build. Mater. 2015, 74, 176–187. [Google Scholar] [CrossRef]
- Patel, Y.J.; Shah, N. Enhancement of the Properties of Ground Granulated Blast Furnace Slag Based Self Compacting Geopolymer Concrete by Incorporating Rice Husk Ash. Constr. Build. Mater. 2018, 171, 654–662. [Google Scholar] [CrossRef]
- Rangan, B.V. Fly Ash-Based Geopolymer Concrete; Curtin University of Technology: Perth, Australia, 2010. [Google Scholar]
- Davidovits, J. Geopolymer CHemistry and Applications, 3rd ed.; Geopolymer Institute: Saint-Quentin, France, 2011. [Google Scholar]
- Ahmed, H.U.; Mahmood, L.J.; Muhammad, M.A.; Faraj, R.H.; Qaidi, S.M.; Sor, N.H.; Mohammed, A.S.; Mohammed, A.A. Geopolymer Concrete as a Cleaner Construction Material: An Overview on Materials and Structural Performances. Clean. Mater. 2022, 5, 100111. [Google Scholar] [CrossRef]
- Ahmed, H.U.; Mohammed, A.S.; Faraj, R.H.; Qaidi, S.M.A.; Mohammed, A.A. Compressive Strength of Geopolymer Concrete Modified with Nano-Silica: Experimental and Modeling Investigations. Case Stud. Constr. Mater. 2022, 16, e01036. [Google Scholar] [CrossRef]
- Ahmed, H.U.; Mohammed, A.S.; Qaidi, S.M.A.; Faraj, R.H.; Hamah Sor, N.; Mohammed, A.A. Compressive Strength of Geopolymer Concrete Composites: A Systematic Comprehensive Review, Analysis and Modeling. Eur. J. Environ. Civ. Eng. 2022, 26, 1–46. [Google Scholar] [CrossRef]
- Ahmed, H.U.; Mohammed, A.A.S.; Rafiq, S.; Mohammed, A.A.S.; Mosavi, A.; Sor, N.H.; Qaidi, S.M.A.A. Compressive Strength of Sustainable Geopolymer Concrete Composites: A State-of-the-Art Review. Sustainability 2021, 13, 13502. [Google Scholar] [CrossRef]
- Wongpa, J.; Kiattikomol, K.; Jaturapitakkul, C.; Chindaprasirt, P. Compressive Strength, Modulus of Elasticity, and Water Permeability of Inorganic Polymer Concrete. Mater. Des. 2010, 31, 4748–4754. [Google Scholar] [CrossRef]
- Li, C.; Sun, H.; Li, L. A Review: The Comparison between Alkali-Activated Slag (Si + Ca) and Metakaolin (Si + Al) Cements. Cem. Concr. Res. 2010, 40, 1341–1349. [Google Scholar] [CrossRef]
- Chindaprasirt, P.; De Silva, P.; Sagoe-Crentsil, K.; Hanjitsuwan, S. Effect of SiO2 and Al2O3 on the Setting and Hardening of High Calcium Fly Ash-Based Geopolymer Systems. J. Mater. Sci. 2012, 47, 4876–4883. [Google Scholar] [CrossRef]
- Mehta, A.; Williams, V.; Parajuli, B. Child with Dysuria and/or Hematuria. Indian J. Pediatr. 2017, 84, 792–798. [Google Scholar] [CrossRef] [PubMed]
- Saha, S.; Rajasekaran, C. Enhancement of the Properties of Fly Ash Based Geopolymer Paste by Incorporating Ground Granulated Blast Furnace Slag. Constr. Build. Mater. 2017, 146, 615–620. [Google Scholar] [CrossRef]
- Nath, P.; Sarker, P.K.; Rangan, V.B. Early Age Properties of Low-Calcium Fly Ash Geopolymer Concrete Suitable for Ambient Curing. Procedia Eng. 2015, 125, 601–607. [Google Scholar] [CrossRef]
- Nath, P.; Sarker, P.K. Effect of GGBFS on Setting, Workability and Early Strength Properties of Fly Ash Geopolymer Concrete Cured in Ambient Condition. Constr. Build. Mater. 2014, 66, 163–171. [Google Scholar] [CrossRef]
- Hadi, M.N.S.; Farhan, N.A.; Sheikh, M.N. Design of Geopolymer Concrete with GGBFS at Ambient Curing Condition Using Taguchi Method. Constr. Build. Mater. 2017, 140, 424–431. [Google Scholar] [CrossRef]
- Sherwani, A.F.H.; Younis, K.H.; Arndt, R.W. Fresh, Mechanical, and Durability Behavior of Fly Ash-Based Self Compacted Geopolymer Concrete: Effect of Slag Content and Various Curing Conditions. Polymers 2022, 14, 3209. [Google Scholar] [CrossRef]
- Okamura, H.; Ouchi, M. Self Compacting Concrete—Research Paper. J. Adv. Concr. Technol. 2003, 1, 5–15. [Google Scholar] [CrossRef]
- Faraj, R.H.; Ali, H.F.H.; Sherwani, A.F.H.; Hassan, B.R.; Karim, H. Use of Recycled Plastic in Self-Compacting Concrete: A Comprehensive Review on Fresh and Mechanical Properties. J. Build. Eng. 2020, 30, 101283. [Google Scholar] [CrossRef]
- Faraj, R.H.; Sherwani, A.F.H.; Daraei, A. Mechanical, Fracture and Durability Properties of Self-Compacting High Strength Concrete Containing Recycled Polypropylene Plastic Particles. J. Build. Eng. 2019, 25, 100808. [Google Scholar] [CrossRef]
- Faraj, R.H.; Sherwani, A.F.H.; Jafer, L.H.; Ibrahim, D.F. Rheological Behavior and Fresh Properties of Self-Compacting High Strength Concrete Containing Recycled PP Particles with Fly Ash and Silica Fume Blended. J. Build. Eng. 2020, 34, 101667. [Google Scholar] [CrossRef]
- Memon, F.A.; Nuruddin, F.; Shafiq, N.; Fareed Ahmed, M.; Nuruddin, M.F.; Shafiq, N. Compressive Strength and Workability Characteristics of Low-Calcium Fly Ash-Based Self-Compacting Geopolymer Concrete. World Acad. Sci. Eng. Technol. 2011, 74, 8–14. [Google Scholar]
- Younis, K.H.; Salihi, K.; Mohammedameen, A.; Sherwani, A.F.H.; Alzeebaree, R. Factors Affecting the Characteristics of Self-Compacting Geopolymer Concrete. IOP Conf. Ser. Earth Environ. Sci. 2021, 856, 012028. [Google Scholar] [CrossRef]
- Astuti, P.; Afriansya, R.; Anisa, E.A.; Randisyah, J. Mechanical Properties of Self-Compacting Geopolymer Concrete Utilizing Fly Ash. AIP Conf. Proc. 2022, 2453, 020028. [Google Scholar] [CrossRef]
- Nazari, A.; Torgal, F.; Cevik, A.; Sanjayan, J. Compressive Strength of Tungsten Mine Waste- and Metakaolin-Based Geopolymers. Ceram. Int. 2014, 40, 6053–6062. [Google Scholar] [CrossRef]
- Gilbert, R.I. Creep and Shrinkage Models for High Strength Concrete—Proposals for Inclusion in AS3600. Aust. J. Struct. Eng. 2002, 4, 95–106. [Google Scholar] [CrossRef]
- Srishaila, J.M.; Ahamed, P.U.; Vishwanath, K.N.; Prakash, P. Experimental Study on Workability and Strength Characteristics of Fly Ash and GGBS Based Self-Compacting Geo Polymer Concrete. Int. J. Eng. Res. Dev. 2014, 10, 68–77. [Google Scholar]
- Wallah, S.E.; Rangan, B.V. Low-Calcium Fly Ash-Based Geopolymer Concrete: Long-Term Properties; Curtin University of Technology: Perth, Australia, 2006. [Google Scholar]
- Olivia, M.; Nikraz, H. Properties of Fly Ash Geopolymer Concrete Designed by Taguchi Method. Mater. Des. 2012, 36, 191–198. [Google Scholar] [CrossRef]
- Nuruddin, M.F.; Memon, F.A.; Shafiq, N.; Demie, S. Drying Shrinkage of Fly Ash-Based Self-Compacting Geopolymer Concrete. Appl. Mech. Mater. 2014, 567, 362–368. [Google Scholar] [CrossRef]
- Wang, S.-D.; Pu, X.-C.; Scrivener, K.L.; Pratt, P.L. Alkali-Activated Slag Cement and Concrete: A Review of Properties and Problems. Adv. Cem. Res. 1995, 7, 93–102. [Google Scholar] [CrossRef]
- Al-Rawi, S.; Tayşi, N. Performance of Self-Compacting Geopolymer Concrete with and without GGBFS and Steel Fiber. Adv. Concr. Constr. 2018, 6, 323–344. [Google Scholar] [CrossRef]
- Gülşan, M.E.; Alzeebaree, R.; Rasheed, A.A.; Niş, A.; Kurtoğlu, A.E. Development of Fly Ash/Slag Based Self-Compacting Geopolymer Concrete Using Nano-Silica and Steel Fiber. Constr. Build. Mater. 2019, 211, 271–283. [Google Scholar] [CrossRef]
- Nagaraj, V.K.; Babu, D.L.V. Assessing the Performance of Molarity and Alkaline Activator Ratio on Engineering Properties of Self-Compacting Alkaline Activated Concrete at Ambient Temperature. J. Build. Eng. 2018, 20, 137–155. [Google Scholar] [CrossRef]
- Saini, G.; Vattipalli, U. Assessing Properties of Alkali Activated GGBS Based Self-Compacting Geopolymer Concrete Using Nano-Silica. Case Stud. Constr. Mater. 2020, 12, e00352. [Google Scholar] [CrossRef]
- Ganeshan, M.; Venkataraman, S. Durability and Microstructural Studies on Fly Ash Blended Self-Compacting Geopolymer Concrete. Eur. J. Environ. Civ. Eng. 2019, 25, 2074–2088. [Google Scholar] [CrossRef]
- Patel, Y.J.; Shah, N. Development of Self-Compacting Geopolymer Concrete as a Sustainable Construction Material. Sustain. Environ. Res. 2018, 28, 412–421. [Google Scholar] [CrossRef]
- Manjunath, R.; Ranganath, R.V. Performance Evaluation of Fly-Ash Based Self-Compacting Geopolymer Concrete Mixes. IOP Conf. Ser. Mater. Sci. Eng. 2019, 561, 012006. [Google Scholar] [CrossRef]
- Nuruddin, M.F.; Demie, S.; Shafiq, N. Effect of Mix Composition on Workability and Compressive Strength of Self-Compacting Geopolymer Concrete. Can. J. Civ. Eng. 2011, 38, 1196–1203. [Google Scholar] [CrossRef]
- Demie, S.; Nuruddin, M.F.; Shafiq, N. Effects of Micro-Structure Characteristics of Interfacial Transition Zone on the Compressive Strength of Self-Compacting Geopolymer Concrete. Constr. Build. Mater. 2013, 41, 91–98. [Google Scholar] [CrossRef]
- Reddy, K.M.; Kumar, G.N. Experimental Study on Self Compacting Geopolymer Concrete. Int. J. Eng. Res. 2017, 4, 953–957. [Google Scholar]
- Bheel, N.; Awoyera, P.; Tafsirojjaman, T.; Hamah Sor, N.; sohu, S. Synergic Effect of Metakaolin and Groundnut Shell Ash on the Behavior of Fly Ash-Based Self-Compacting Geopolymer Concrete. Constr. Build. Mater. 2021, 311, 125327. [Google Scholar] [CrossRef]
- Kamseu, E.; Ponzoni, C.; Tippayasam, C.; Taurino, R.; Chaysuwan, D.; Sglavo, V.M.; Thavorniti, P.; Leonelli, C. Self-Compacting Geopolymer Concretes: Effects of Addition of Aluminosilicate-Rich Fines. J. Build. Eng. 2016, 5, 211–221. [Google Scholar] [CrossRef]
- Muttashar, H.L.; Ariffin, M.A.M.; Hussein, M.N.; Hussin, M.W.; Ishaq, S. Bin Self-Compacting Geopolymer Concrete with Spend Garnet as Sand Replacement. J. Build. Eng. 2018, 15, 85–94. [Google Scholar] [CrossRef]
- Nurudin, M.F.; Memon, F.A.; Nuruddin, M.F.; Memon, F.A.; Nurudin, M.F.; Memon, F.A. Properties of Self-Compacting Geopolymer Concrete. Mater. Sci. Forum 2015, 803, 99–109. [Google Scholar] [CrossRef]
- Sashidhar, C.; Guru Jawahar, J.; Neelima, C.; Pavan Kumar, D. Preliminary Studies on Self Compacting Geopolymer Concrete Using Manufactured Sand. Asian J. Civ. Eng. 2016, 17, 277–288. [Google Scholar]
- Ushaa, T.G.; Anuradha, R.; Venkatasubramani, G.S. Performance of Self-Compacting Geopolymer Concrete Containing Different Mineral Admixtures; NISCAIR-CSIR: New Delhi, India, 2015; Volume 22. [Google Scholar]
- Eren, N.A.; Alzeebaree, R.; Çevik, A.; Niş, A.; Mohammedameen, A.; Gülşan, M.E. Fresh and Hardened State Performance of Self-Compacting Slag Based Alkali Activated Concrete Using Nanosilica and Steel Fiber. J. Compos. Mater. 2021, 55, 4125–4139. [Google Scholar] [CrossRef]
- Memon, F.A.; Nuruddin, M.F.; Demie, S.; Shafiq, N. Effect of Superplasticizer and Extra Water on Workability and Compressive Strength of Self-Compacting Geopolymer Concrete. Res. J. Appl. Sci. Eng. Technol. 2012, 4, 407–414. [Google Scholar]
- Arun, B.R.; Nagaraja, P.S.; Srishaila, J.M. An Effect of NaOH Molarity on Fly Ash—Metakaolin-Based Self-Compacting Geopolymer Concrete; Springer: Singapore, 2019; Volume 25, ISBN 9789811333170. [Google Scholar]
- Faridmehr, I.; Nehdi, M.L.; Huseien, G.F.; Baghban, M.H.; Sam, A.R.M.; Algaifi, H.A. Experimental and Informational Modeling Study of Sustainable Self-Compacting Geopolymer Concrete. Sustainability 2021, 13, 7444. [Google Scholar] [CrossRef]
- BS EN 933-1+A1 2005; Tests for Geometrical Properties of Aggregates—Part 1: Determination of Particle Size Distribution—Sieving Method. BSI Standards Publication: London, UK, 2008.
- BS EN 1097-6; Tests for Mechanical and Physical Properties of Aggregates—Part 6: Determination of Particle Density and Water Absorption. BSI Standards Publication: London, UK, 2013.
- Sata, V.; Wongsa, A.; Chindaprasirt, P. Properties of Pervious Geopolymer Concrete Using Recycled Aggregates. Constr. Build. Mater. 2013, 42, 33–39. [Google Scholar] [CrossRef]
- EFNARC. The European Guidelines for Self-Compacting Concrete. Eur. Guidel. Self Compact. Concr. 2005, 22, 63. [Google Scholar]
- BS EN 12350-11; Testing Fresh Concrete—Part 11: Self-Compacting Concrete—Sieve Segregation Test. BSI Standards Publication: London, UK, 2010.
- BS EN 12390-3; Testing Hardened Concrete—Part 3: Compressive Strength of Test Specimens. BSI Standards Publication: London, UK, 2009.
- BS EN 12390-6:2000; Testing Hardened Concrete—Part 6: Tensile Splitting Strength of Test Specimens. BSI Standards Publication: London, UK, 1993.
- ACI 318M-11; Building Code Requirements for Structural Concrete and Commentary. American Concrete Institute: Farmington Hills, MI, USA, 2011.
- ACI 363 R-10; Report on High-Strength Concrete. American Concrete Institute: Farmington Hills, MI, USA,, 2010.
- Comité Euro-International du Béton. CEB-FIP Model Code 1990: Design Code; Thomas Telford Publishing: London, UK, 1993; ISBN 978-0-7277-3944-5. [Google Scholar]
- Lee, N.K.; Lee, H.K. Setting and Mechanical Properties of Alkali-Activated Fly Ash/Slag Concrete Manufactured at Room Temperature. Constr. Build. Mater. 2013, 47, 1201–1209. [Google Scholar] [CrossRef]
- İpek, S.; Ayodele, O.A.; Mermerdaş, K. Influence of Artificial Aggregate on Mechanical Properties, Fracture Parameters and Bond Strength of Concretes. Constr. Build. Mater. 2020, 238, 117756. [Google Scholar] [CrossRef]
- BS EN 13057; Products and Systems for the Protection and Repair of Concrete Structures—Test Methods—Determination of Resistance of Capillary Absorption. BSI Standards Publication: London, UK, 2002.
- Khatib, J.M.; Mangat, P.S. Absorption Characteristics of Concrete as a Function of Location Relative to Casting Position. Cem. Concr. Res. 1995, 25, 999–1010. [Google Scholar] [CrossRef]
- Khatib, J.M.; Clay, R.M. Absorption Characteristics of Metakaolin Concrete. Cem. Concr. Res. 2004, 34, 19–29. [Google Scholar] [CrossRef]
- ASTM:C157/C157M-08; Test Method for Length Change of Hardened Hydraulic-Cement Mortar and Concrete. ASTM International: West Conshohocken, PA, USA, 2008; Volume 8, pp. 1–7. [CrossRef]
- Deb, P.S.; Nath, P.; Sarker, P.K. Drying Shrinkage of Slag Blended Fly Ash Geopolymer Concrete Cured at Room Temperature. Procedia Eng. 2015, 125, 594–600. [Google Scholar] [CrossRef]
- BS EN 12350-8; Testing Self Compacting Concrete: Slump Flow Test. British Standards Institution: London, UK, 2010; pp. 5–8.
- Mohammed, N.; Sarsam, K.; Hussien, M. The Influence of Recycled Concrete Aggregate on the Properties of Concrete. MATEC Web Conf. 2018, 162, 02020. [Google Scholar] [CrossRef]
- BS EN 12350-9; Testing Fresh Concrete Self-Compacting Concrete. V-Funnel Test. British Standards Institution: London, UK, 2010.
- Akgaoglu, T.; Qubukguoglu, B.; Awad, A. A Critical Review of Slag and Fly-Ash Based Geopolymer Concrete. Comput. Concr. 2019, 24, 453–458. [Google Scholar] [CrossRef]
- Chi, M.; Huang, R. Binding Mechanism and Properties of Alkali-Activated Fly Ash/Slag Mortars. Constr. Build. Mater. 2013, 40, 291–298. [Google Scholar] [CrossRef]
- Puertas, F.; Martínez-Ramírez, S.; Alonso, S.; Vázquez, T.; Martínez-Ramírez, S.; Alonso, S.; Vázquez, T.; Martínez-Ramírez, S.; Alonso, S.; Vázquez, T. Alkali-Activated Fly Ash/Slag Cements: Strength Behaviour and Hydration Products. Cem. Concr. Res. 2000, 30, 1625–1632. [Google Scholar] [CrossRef]
- Qiu, J.; Zhao, Y.; Xing, J.; Sun, X. Fly Ash/Blast Furnace Slag-Based Geopolymer as a Potential Binder for Mine Backfilling: Effect of Binder Type and Activator Concentration. Adv. Mater. Sci. Eng. 2019, 2019, 2028109. [Google Scholar] [CrossRef]
- Wang, W.C.; Wang, H.Y.; Lo, M.H. The Fresh and Engineering Properties of Alkali Activated Slag as a Function of Fly Ash Replacement and Alkali Concentration. Constr. Build. Mater. 2015, 84, 224–229. [Google Scholar] [CrossRef]
- Sasui, S.; Kim, G.; Nam, J.; Koyama, T.; Chansomsak, S. Strength and Microstructure of Class-C Fly Ash and GGBS Blend Geopolymer Activated in NaOH & NaOH + Na2SiO3. Materials 2020, 13, 59. [Google Scholar] [CrossRef]
- Ismail, I.; Bernal, S.A.; Provis, J.L.; San Nicolas, R.; Hamdan, S.; Van Deventer, J.S.J. Modification of Phase Evolution in Alkali-Activated Blast Furnace Slag by the Incorporation of Fly Ash. Cem. Concr. Compos. 2014, 45, 125–135. [Google Scholar] [CrossRef]
- Samantasinghar, S.; Singh, S.P. Effect of Synthesis Parameters on Compressive Strength of Fly Ash-Slag Blended Geopolymer. Constr. Build. Mater. 2018, 170, 225–234. [Google Scholar] [CrossRef]
- Shen, Q.; Chen, W.; Liu, C.; Zou, W.; Pan, L. The Tensile Strength and Damage Characteristic of Two Types of Concrete and Their Interface. Materials 2020, 13, 16. [Google Scholar] [CrossRef]
- Atewi, Y.R.; Hasan, M.F.; Güneyisi, E. Fracture and Permeability Properties of Glass Fiber Reinforced Self-Compacting Concrete with and without Nanosilica. Constr. Build. Mater. 2019, 226, 993–1005. [Google Scholar] [CrossRef]
- Shaikh, F.U.A. Effects of Alkali Solutions on Corrosion Durability of Geopolymer Concrete. Adv. Concr. Constr. 2014, 2, 109–123. [Google Scholar] [CrossRef]
- Jindal, B.B.; Jangra, P.; Garg, A. Effects of Ultra Fine Slag as Mineral Admixture on the Compressive Strength, Water Absorption and Permeability of Rice Husk Ash Based Geopolymer Concrete. Mater. Today Proc. 2020, 32, 871–877. [Google Scholar] [CrossRef]
- Ridtirud, C.; Chindaprasirt, P.; Pimraksa, K. Factors Affecting the Shrinkage of Fly Ash Geopolymers. Int. J. Miner. Metall. Mater. 2011, 18, 100–104. [Google Scholar] [CrossRef]
- Caron, R.; Patel, R.A.; Dehn, F. Extension of the Fib MC 2010 for Basic and Drying Shrinkage of Alkali-Activated Slag Concretes. Struct. Concr. 2022, 1–14. [Google Scholar] [CrossRef]
- Neville, A.M. Concrete: Neville’s Insights and Issues; Thomas Telford Ltd.: London, England, 2006; ISBN 0727734687. [Google Scholar]
- Shh, S.P.; Krguller, M.E.; Sarigaphuti, M. Effects of Shrinkage-Reducing Admixtures on Restrained Shrinkage Cracking of Concrete. ACI Mater. J. 1992, 89, 289–295. [Google Scholar] [CrossRef]
- Wiegrink, K.; Surendra, P.; Shah, S.M. Shrinkage Cracking of High-Strength Concrete. ACI Mater. J. 1996, 93, 409–415. [Google Scholar] [CrossRef]
- Gesoğlu, M.; Ozturan, T.; Güneyisi, E.; Gesoglu, M.; Özturan, T.; Güneyisi, E.; Gesoğlu, M.; Ozturan, T.; Güneyisi, E. Shrinkage Cracking of Lightweight Concrete Made with Cold-Bonded Fly Ash Aggregates. Cem. Concr. Res. 2004, 34, 1121–1130. [Google Scholar] [CrossRef]
- Brito, M.E.; Case, E.; Kriven, W.M.; Salem, J.; Zhu, D. (Eds.) Developments in Porous, Biological and Geopolymer Ceramics. In Proceedings of the 31st International Conference on Advanced Ceramics and Composites, Daytona Beach, FL, USA, 21–26 January 2007; Volume 28. [Google Scholar]
- Hossain, D.S.; Strength, K.M.A. Shrinkage and Early Age Characteristics of One-Part Alkali-Activated Binders with High-Calcium Industrial Wastes, Solid Reagents and Fibers. J. Compos. Sci. 2021, 5, 315. [Google Scholar]
- Adesina, A.; Das, S. Drying Shrinkage and Permeability Properties of Fibre Reinforced Alkali-Activated Composites. Constr. Build. Mater. 2020, 251, 119076. [Google Scholar] [CrossRef]
- Öz, H.Ö.; Gesoglu, M.; Güneyisi, E.; Sor, N.H. Self-Consolidating Concretes Made with Cold-Bonded Fly Ash Lightweight Aggregates. ACI Mater. J. 2017, 114, 385–395. [Google Scholar] [CrossRef]


| Refs | Binder Type | Fresh Properties | Mechanical Properties | Durability Properties | Others |
|---|---|---|---|---|---|
| [34] | FA (100,75,50,25,0%) slag (0,25,50,75,100%) | Slump, T500 and V-funnel flow time, L-box height | Compressive, splitting, fracture parameters | - | Statistical Evaluation, correlation |
| [35] | FA (50%), slag (50%), NS 1 (5–10 kg/m3) | Slump, T500 and V-funnel flow time, L-box height | Compressive, fracture parameters, bond strength, | - | Statistical Evaluation, correlation |
| [36] | FA (25%), slag (75%) | Slump, T500 and V-funnel flow time, L-box and J-ring height, U-box | Compressive | Rapid chloride and water permeability, Sorptivity, Abrasion, Acid and sulphate attack, shrinkage | |
| [37] | slag,NS (9–10 kg/m3) | Slump, T500 and V-funnel flow time, and J-ring height | Compressive, flexural, bond strength | Sorptivity | XRD |
| [38] | FA (Class F & C) | Slump, T500 flow time, L-box height, U-box | Compressive | Rapid chloride permeability, Sorptivity, Acid and sulphate attack, corrosion | SEM |
| [4] | FA (100%), slag (100,95,85, 75%), RHA 2 (5, 15, 25%) | Slump, T500 and V-funnel flow time, L-box and J-ring height | Compressive, splitting, flexural | Sorptivity | SEM |
| [39] | FA (100%), slag (100,95,85, 75%), RHA (5, 15, 25%) | Slump, T500 and V-funnel flow time, L-box and J-ring height | Compressive, splitting, flexural | - | SEM |
| [40] | FA | Slump, V-funnel flow time, L-box height | Compressive, splitting | Water absorption | |
| [24] | FA | Slump, T500 and V-funnel flow time, L-box and J-ring height | Compressive | - | - |
| [41] | FA | Slump, T500 and V-funnel flow time, L-box and J-ring height | Compressive | - | - |
| [42] | FA | Slump, T500 and V-funnel flow time, L-box and J-ring height | Compressive | - | SEM |
| [43] | FA (100,80,60,40,20,0%) , slag (100,80,60,40,20,0%) | Slump, T500 and V-funnel flow time, L-box height | Compressive, splitting, flexural | - | - |
| [25] | FA | Slump, T500 and V-funnel flow time, L-box and J-ring height, sieve segregation | Compressive | - | - |
| [44] | FA (100,95,90,85,80%) MK 3 (5,10,15,20%) GSA 4 (5,10,15,20%) | Slump, T500 and V-funnel flow time, L-box and J-ring height | Compressive, splitting, flexural | Water permeability | - |
| [45] | MK | - | Flexural strength | Water absorption | SEM |
| [46] | slag | Slump, T500 and V-funnel flow time, L-box height | Compressive, splitting, flexural | Carbonation depth, drying shrinkage, acid resistance, water absorption, | SEM |
| [47] | FA | Slump, T500 and V-funnel flow time, J-ring height | Compressive, splitting, flexural strength | - | - |
| [48] | FA (50%), slag (50%) | Slump, T500 and V-funnel flow time, L-box height | Compressive | - | - |
| [49] | FA (100–70%), slag (10,20,30%), SF 5 (5,10,15%) | Slump, T500 and V-funnel flow time, L-box height, U-box | Compressive, splitting, flexural strength | - | - |
| [50] | Slag (100, 98%), NS (2%) | Slump, T500 and V-funnel flow time, L-box height | Compressive, splitting, fracture parameters, modulus of elasticity | - | - |
| [51] | FA | Slump, T500 and V-funnel flow time, L-box and J-ring height | Compressive | - | - |
| [52] | FA (100,90,80,70%), MK (10,20,30%) | Slump, T500 and V-funnel flow time, L-box height | Compressive, splitting, flexural | - | - |
| [32] | FA (100,90%), SF (10%) | - | - | Shrinkage | - |
| [53] | Slag (100,70,60,50,40,30%)FA (30,40,50,60,70%) | Slump, T500 and V-funnel flow time, L-box and J-ring height | Compressive, splitting, flexural | - | XRD, SEM, correlation, modeling |
| The current study | FA (100,70,50,0%) slag (0,30,50,100%) | Slump and J-ring flow, T500, TJ500, and V-funnel flow time, L-box and J-ring height sieve segregation | Compressive, splitting | Sorptivity, long-term free drying shrinkage, long-term mass loss | Correlation, an empirical equation |
| Component % | CaO | SiO2 | Al2O3 | Fe2O3 | MgO | Various | Specific Gravity | Loss on Ignition | Blain Fineness (cm2/g) |
|---|---|---|---|---|---|---|---|---|---|
| FA | 4.0 | 56 | 24 | 7.0 | 2.0 | 7.0 | 2.28 | 3.0 | 3098 |
| Slag | 40 | 36 | 11 | 0.4 | 7.6 | 5.0 | 2.80 | 2.3 | 4250 |
| Type of FA | Size (mm) | Specific Gravity | Water Absorption (%) |
|---|---|---|---|
| Gravel | 4–16 | 2.70 | 0.5 |
| Sand | 0–4 | 2.66 | 0.8 |
| Standard | BS EN 933-1+ A1 2005 [54] | BS EN 1097-6:2013 [55] | BS EN 1097-6:2013 [55] |
| Mix Code | Binder (kg/m3) | FA (%) | Slag (%) | Gravel (kg/m3) | Sand (kg/m3) | Alkaline/Binder | Molarity (M) | SP (%) | Water (kg/m3) |
|---|---|---|---|---|---|---|---|---|---|
| G0 | 450 | 100 | 0 | 800 | 825 | 0.5 | 12 | 7 | 40 |
| G30 | 70 | 30 | |||||||
| G50 | 50 | 50 | |||||||
| G100 | 100 | 100 |
| Flowability Classes | |||
| Classes | Slump Flow and J-Ring Flow Diameter (mm) | ||
| Slump flow (SF) 1 | 550–650 | ||
| Slump flow (SF) 2 | 660–750 | ||
| Slump flow (SF) 3 | 760–850 | ||
| Viscosity Classes | |||
| Class | T500 (sec) | TJ500 (sec) | V-Funnel time (sec) |
| Viscosity (VS1/VF1) Viscosity (VS2/VF2) | ≤2 >2 and ≤5 | ≤2 >2 and ≤6 | ≤8 9 to 25 |
| Passing ability | |||
| Classes | J-Ring passing ability | ||
| Passing-ability (PJ) 1 | ≤10 mm | ||
| Passing-ability (PJ) 2 | ≥10, 20 mm | ||
| Classes | L-Box height ratio | ||
| Passing-ability (PA) 1 | ≥0.8 with two rebar | ||
| Passing-ability (PA) 2 | ≥0.8 with three rebar | ||
| Segregation resistance [58] | |||
| Classes | Sieve segregation resistance (%) | ||
| SI 1 | ≤20% | ||
| SI 2 | ≤15% | ||
| Property | Standard | Equation | |
|---|---|---|---|
| Splitting Tensile Strength, ft (MPa) | ACI 318 [61] | (4) | |
| ACI 363 [62] | (5) | ||
| for 21 MPa < fć < 83 MPa | |||
| CEB-FIB [63] | (6) | ||
| Lee and Lee [64] | (7) |
| Mix Code | Slag (%) | Slump (mm) | J-Ring (mm) | T500 (s) | TJ500 (sec) | PJ (mm) | V-Funnel (s) | L-Box | Segregation Index (%) |
|---|---|---|---|---|---|---|---|---|---|
| G0 | 0 | 788 | 780 | 2.12 | 2.42 | 0.0 | 7.5 | 1.00 | 28.7 |
| G30 | 30 | 775 | 760 | 2.31 | 2.71 | 1.0 | 10.3 | 0.99 | 22.4 |
| G50 | 50 | 750 | 738 | 2.94 | 3.31 | 2.7 | 12.0 | 0.96 | 18.4 |
| G100 | 100 | 680 | 665 | 4.10 | 4.43 | 7.1 | 17.1 | 0.84 | 11.4 |
| Mix Code | Slag Content (%) | Compressive (MPa) | Splitting Tensile (MPa) | |
|---|---|---|---|---|
| 7 Days | 28 Days | |||
| G0 | 0 | 38.70 | 44.21 | 2.51 |
| G30 | 30 | 58.17 | 65.72 | 4.31 |
| G50 | 50 | 76.63 | 81.67 | 5.35 |
| G100 | 100 | 80.92 | 85.10 | 5.60 |
| Mix Code | Slag Content (%) | Splitting Tensile Strength (MPa) | |||||
|---|---|---|---|---|---|---|---|
| Actual Result | ACI 318 | ACI 363 | CEB−FIP | Lee and Lee | Proposed Model (Equation (8)) | ||
| G0 | 0 | 2.51 | 3.33 | 3.51 | 3.23 | 2.68 | 2.55 |
| G30 | 30 | 4.31 | 4.06 | 4.28 | 4.21 | 3.26 | 4.14 |
| G50 | 50 | 5.35 | 4.53 | 4.77 | 4.87 | 3.64 | 5.41 |
| G100 | 100 | 5.60 | 4.62 | 4.87 | 5.00 | 3.71 | 5.68 |
| Mix Code | Slag Content (%) | Capillary Absorption(mm/min0.5) | Free Drying Shrinkage after 365 Days | |
|---|---|---|---|---|
| Max. Shrinkage (Microstrain) | Max. Mass Loss (g) | |||
| G0 | 0 | 0.0513 | 104 | 201 |
| G30 | 30 | 0.0377 | ------- | ------- |
| G50 | 50 | 0.0291 | 175 | 115 |
| G100 | 100 | 0.0242 | ------- | ------- |
Publisher’s Note: MDPI stays neutral with regard to jurisdictional claims in published maps and institutional affiliations. |
© 2022 by the authors. Licensee MDPI, Basel, Switzerland. This article is an open access article distributed under the terms and conditions of the Creative Commons Attribution (CC BY) license (https://creativecommons.org/licenses/by/4.0/).
Share and Cite
Sherwani, A.F.H.; Younis, K.H.; Arndt, R.W.; Pilakoutas, K. Performance of Self-Compacted Geopolymer Concrete Containing Fly Ash and Slag as Binders. Sustainability 2022, 14, 15063. https://doi.org/10.3390/su142215063
Sherwani AFH, Younis KH, Arndt RW, Pilakoutas K. Performance of Self-Compacted Geopolymer Concrete Containing Fly Ash and Slag as Binders. Sustainability. 2022; 14(22):15063. https://doi.org/10.3390/su142215063
Chicago/Turabian StyleSherwani, Aryan Far H., Khaleel H. Younis, Ralf W. Arndt, and Kypros Pilakoutas. 2022. "Performance of Self-Compacted Geopolymer Concrete Containing Fly Ash and Slag as Binders" Sustainability 14, no. 22: 15063. https://doi.org/10.3390/su142215063
APA StyleSherwani, A. F. H., Younis, K. H., Arndt, R. W., & Pilakoutas, K. (2022). Performance of Self-Compacted Geopolymer Concrete Containing Fly Ash and Slag as Binders. Sustainability, 14(22), 15063. https://doi.org/10.3390/su142215063