Article

Attribution and Sensitivity Analysis of Runoff Variation in the Yellow River Basin under Climate Change

1
China Institute of Water Resources and Hydropower Research, Beijing 100038, China
2
State Key Laboratory of Simulation and Regulation of Water Cycle in River Basin, Beijing 100038, China
3
College of Civil Engineering, Tianjin University, Tianjin 300072, China
4
China South-To-North Water Diversion Corporation Limited, Beijing 100036, China
*
Authors to whom correspondence should be addressed.
Sustainability 2022, 14(22), 14981; https://doi.org/10.3390/su142214981
Submission received: 10 October 2022 / Revised: 5 November 2022 / Accepted: 11 November 2022 / Published: 12 November 2022

Abstract

:
The Yellow River Basin is a typical arid and semi-arid area, which is very sensitive to climate change. In recent years, it has become the area with the greatest shortage of water resources in China. In this study, a new two-way coupling model of land surface and hydrology has been explored to analyze the impacts of climate change and human activities on the runoff. It is of great theoretical and practical significance for making better management countermeasures and strategies to cope with climate change in the Yellow River Basin. The results showed that: (1) the annual average precipitation in the basin was 470.1 mm, which was higher in the lower reaches than in the middle and upper reaches. The annual average temperature is 5.8 °C. The entire basin showed a remarkable warming speed. The annual average pan evaporation is 1067.3 mm showing a downward trend throughout the basin; (2) from 1987 to 2009, the contribution rate of climate change to runoff change has not fluctuated by more than 5%. Since 2010, the precipitation caused by climate factors has increased runoff by 12~15%. The impact of land use change on runoff has been increasing annually. The influence of projects on runoff change was the leading factor of runoff reduction in the Yellow River Basin, with the contribution rate around 50%; and (3) for every 10% decrease in precipitation, the runoff decreases by 13~15.7%. When the temperature rises by 1.0 °C, the runoff decreases by 2.1~4.2%. The runoff in the upper reaches of the Yellow River was most sensitive to precipitation and temperature changes. This showed that the runoff in the plateau and mountainous areas were highly sensitive to climate change.

1. Introduction

The Yellow River is an important ecological barrier and economic development zone in China, and plays a key role in the country’s social development and ecological security. Under the dual influence of climate change and human activities, the hydrological process in the Yellow River Basin has undergone dramatic changes [1,2,3,4,5,6] and the resulting ecological and environmental problems are continually exacerbating. Typically, with the effects of global warming, the runoff in the Yellow River Basin is decreasing day by day, and the development and utilization of water resources in the basin are gradually improving, thus leading to frequent river blanking.
Since the last century, the global climate has shown an obvious warming trend [7,8,9,10,11]. More and more scholars have begun to pay attention to the multi-faceted response and the change of water resources in the context of climate change. A large number of studies have shown that climate change has brought new challenges to the water environment, which may be affected by changing water quantity, quality and aquatic biodiversity [12,13,14,15,16,17,18]. Studies on the impact of climate change on water environment have been conducted holding that global warming will cause a series of water quality problems, such as eutrophication, which is mainly manifested by algae increase and nutrient circulation acceleration [19,20,21,22,23]. Quantitative research on the response of water resources under the background of climate change has also been carried out holding that climate change will lead to serious threats to water resource systems [24,25,26,27] such as aggravates global hydrological drought [28,29,30]. The mechanism of water resource changes and its attribution analysis is another focus of attention. Some scholars have adopted hydrological models to study the comprehensive impact of main influencing factors from climate change and human activities on runoff [31,32,33,34].
At present, statistical methods, coupled heat-fluid balance models and hydrological models are commonly used to explore the changes in water resources affected by climate. Correlation analysis in statistical method is one of the typical tools, but this method requires a strong physical basis and high accuracy of statistical data. On this basis, a model of coupled heat-fluid transport was established. The coupled equation of moisture and heat has always been adopted to evaluate the influence of precipitation and potential evapotranspiration on runoff [35,36,37]. With the rapid development of GIS and remote sensing technology [38,39,40], it is possible to select typical and representative watersheds for digital processing [41,42], and construct hydrological models, such as TOPMODLE [43] and the SWAT model [44,45,46], with a certain physical basis that can reflect the spatial heterogeneity, as well as the runoff generation and routing process. On the other hand, since the 1990s, the upsurge of global change research has promoted the rapid development of GCM and RCM [47,48], and a variety of land surface process models have emerged, the most typical of which include LSX and VIC [49,50,51].
Due to the lack of mutual feedback and connection between the traditional hydrological model and land surface process, at present it is difficult to meet the demands of water cycle research, particularly in the context of climate change. The two-way coupling model of land surface and hydrology has become a new exploration. Through the effective integration with RS, GIS and computer technology, the simulation of hydrological cycle and energy exchange process under changing environment, as well as the evaluation and prediction of the impact on water resources, are realized [52,53,54,55,56]. This model completely solves the land hydrological cycle, and can be effectively fed back to the land surface model, though it is still in the stage of continuous exploration and improvement.
In this study, based on long-time serial observation data, the temporal and spatial variation of the key climate elements of precipitation, temperature and evaporation in the Yellow River Basin were analyzed. In addition, aiming at protecting water resources and improving ecological environment, two-way coupling between land surface and hydrological model is constructed to analyze the impacts of climate change and human activities on the runoff. Studying the response of runoff under climate change is of great significance for making better management countermeasures and strategies to cope with climate change for sustainable development in the Yellow River Basin.

2. Materials and Methods
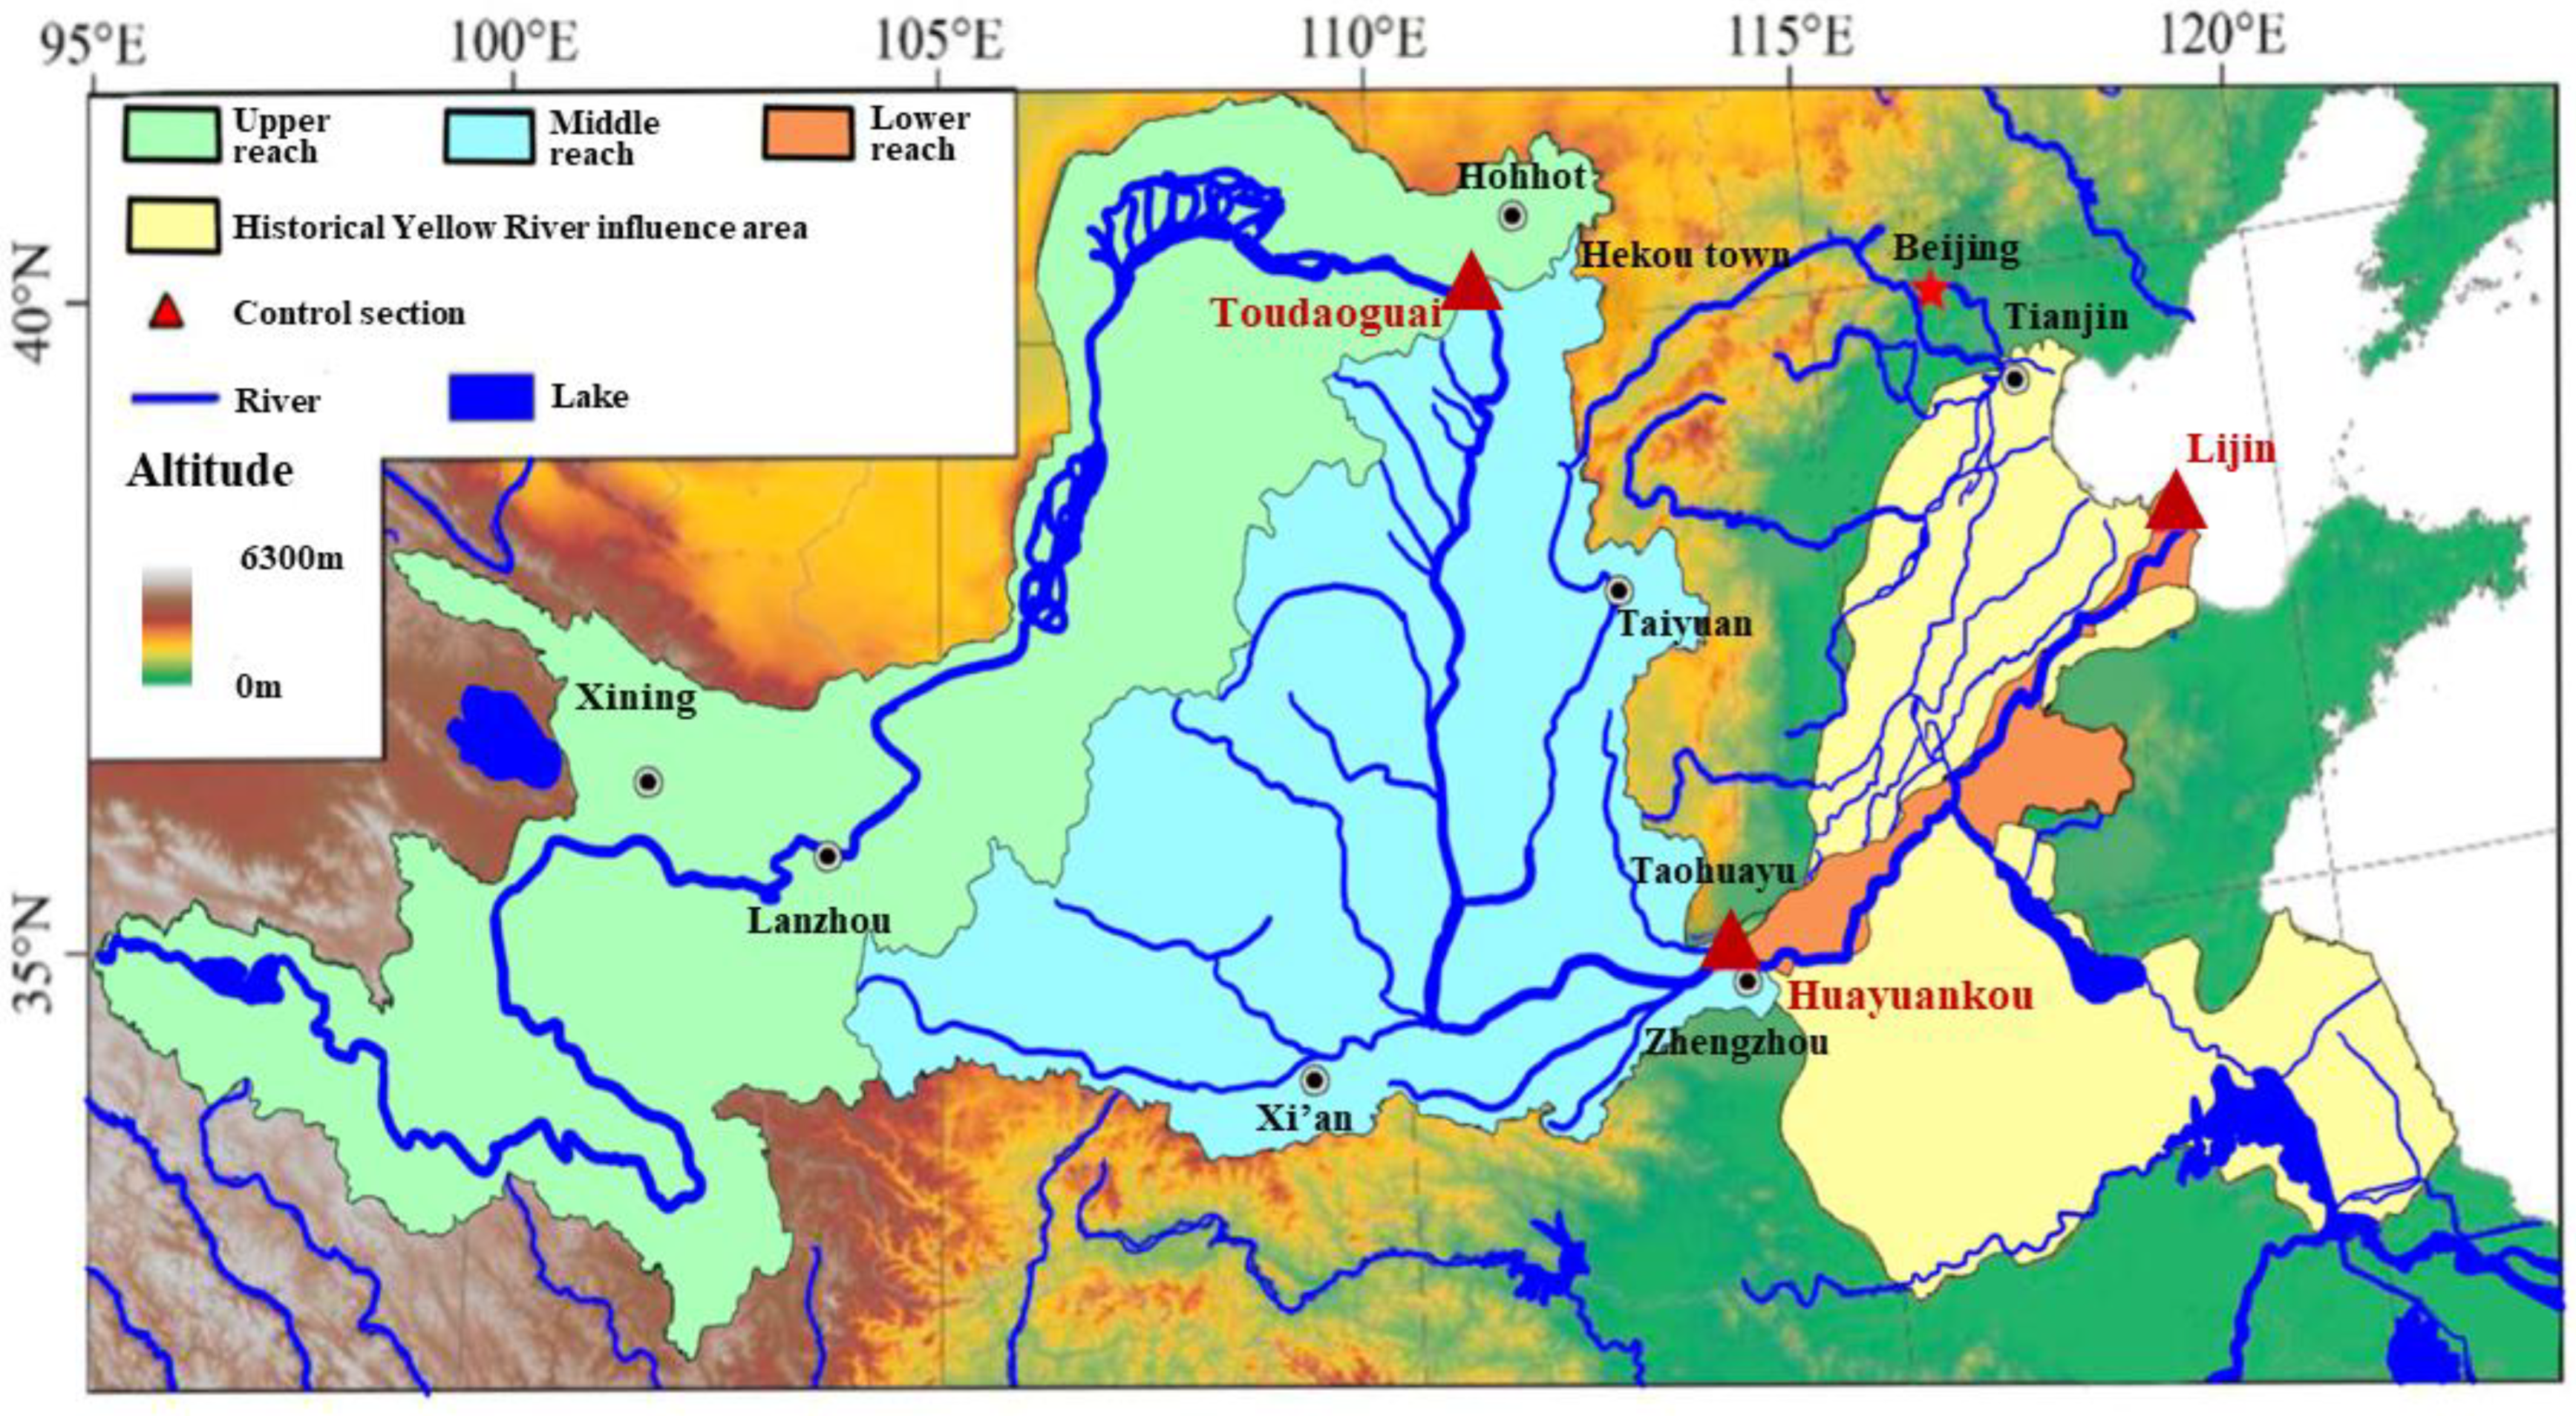
2.1. Study Area

The Yellow River is the second largest river in China, with a total length of 5464 km and a total basin area of 800,000 km2 (Table 1). River source to Hekou Town is the upper reaches of the Yellow River, accounting for 53.8% of the whole river basin area; Hekou Town to Taohuayu is the middle reaches area, accounting for 43.3% of the total basin area; and below Taohuayu is the lower reaches, accounting for 2.9% of the total basin area. The average annual runoff of the basin is 53.48 billion m3, accounting for 2% of the national river runoff.
The Yellow River Basin faces the coast in the east and lives in the inland plateau in the west. The difference in height between east and west is significant, and the difference in climate in the basin is extremely obvious. The areas above Lanzhou belong to the monsoon area of the Tibetan Plateau, while the rest are temperate and subtropical monsoon areas. There are mainly mountains in the middle and upper reaches of the Yellow River, and plains and hills in the middle and lower reaches. The northwest is close to the arid Gobi Desert; the central part flows through the Loess Plateau, which covers the largest area of loess in the world, carrying a large amount of sediment; the east is located in the Huang-Huai-Hai alluvial plain, where the sediment accumulates to form an “overground river”. The threat of flood disaster in rainy season is great.
The Yellow River Basin is located in the middle latitudes, and most areas of the basin belongs to arid and semi-arid climate (Figure 1). The total change of temperature in the basin decreases from southeast to northwest and from plain to alpine. The annual average temperature is between 1 °C and 14 °C, and the diurnal range is 10–15 °C in most areas. With global warming, the temperature change of the Yellow River also showed a fluctuating rise. The annual average temperature in the basin increased by from 1961 to 2000, which was significantly higher than that of the global temperature change in the same period. Due to the influence of atmospheric circulation and monsoon circulation, the distribution of precipitation is significantly different. In all, 70% of the precipitation occurs in summer and autumn (from June to September). The precipitation in most parts of the basin is between 200–650 mm, and the highest precipitation is in the south of upper and middle reaches as well as the lower reaches, which can reach 700–1000 mm. However, in some northwest areas as Ningxia and Inner Mongolia, the precipitation is less than 150 mm, with a difference of as much as 5 times between them. The evaporation in the basin is strong, and the maximum annual evaporation in Ningxia and Inner Mongolia can exceed 2500 mm. The precipitation in most areas is between 200–650 mm, which shows a downward trend as a whole.

2.2. Data Material

In this study, the precipitation and air temperature data from the latest 2472 national meteorological observatories in China are selected to generate daily precipitation and temperature grid data, and the daily source data is then processed by the downscaling method to driving the model. The data of specific humidity, wind speed, air pressure, infrared radiation, direct visible light, direct near infrared, scattered visible light, scattered near infrared and cloud amount were obtained from NCEP/NCAR reanalysis data, and the evaporation data were measured from 45 evaporation stations based on large evaporation dishes in the basin. In addition, we also selected the national 90 m resolution digital elevation and cumulative flow distribution data from Hydro SHEDS, 1 km resolution grid land use data from MODIS, and 1 km resolution soil type data from HWSD, as the initial data sources, which are upgraded to obtain the surface elevation, river depth, vegetation and land use, as well as sand and clay content for the model. See Table 2 for data sources and processing of this study.
It is observed that the development of land surface hydrological processes is closely related to the rapid development of RS, GIS, DEM and computer technology. The spatial collection and analysis functions of RS and GIS are effectively integrated in the hydrological model, and combined with four-dimensional data assimilation system technology, tracer and isotope technology, to obtain grid rainfall, the spatial parameters of various underlying surface characteristics or atmospheric forcing data, so as to realize the two-way driving between land and air. The rational application of these new technologies is an important technical support to improve the coupling ability of land surface and hydrological model.

2.3. LSX-HMS Coupling Modeling

In this paper, a two-way coupling model of land surface model LSX and distributed hydrological model HMS is constructed (Figure 2). Next, combined with numerical simulation and attribution analysis, the impacts of climate change and human activities on runoff changes in the upper, middle and lower reaches of the Yellow River are quantitatively analyzed. Then, the runoff yield, evapotranspiration and water flux at the lower boundary of the soil are calculated by means of meteorological elements, such as precipitation, solar radiation, air temperature, wind speed, air pressure, specific humidity and the cloud area of land surface model LSX, then transmitted to the distributed hydrological model HMS. The water content and groundwater level calculated by the HMS model after confluence are fed back to the land surface model LSX again, so as to update the water flux at the lower boundary of the soil.
In the surface water part, the runoff yield and potential evapotranspiration as calculated by the land surface model LSX are taken as the source-sink terms of the two-dimensional diffusion wave Equation (2) to realize the coupling of surface water.
d h l d t = ( d h l u x d x + d h l u y d y ) + ( 1 f b ) R + f b ( p E C u C g ) C l
as:
d h l d t = 1 w · ( d Q x d x + d Q y d y ) + ( 1 f b ) R + f b ( P E C u C g ) C l
where h l is the grid surface water depth; ux and uy are the surface water velocity, respectively; Qx and Qy are the surface water flux; fb is the water surface area coefficient; R, P, E, Cu, Cg and Cl are the runoff yield, precipitation, potential evapotranspiration, river-vadose zone flux, river-groundwater flux and lake-groundwater flux, respectively; and when h l e, w is the width of the river channel.
In the soil water, the water flux at the lower boundary of the LSX soil layer is regarded as the water flux between LSX soil layer and HMS aquifer. This is no longer the commonly used zero flux or free drainage flux in the land surface model, and is determined by the water content of LSX bottom soil and the gradient of matrix potential between the bottom soil and HMS groundwater level. According to Darcy’s law of unsaturated soil, the water flux I between LSX and HMS, namely the amount of deep soil leakage I in Equation (2), can be determined by the following equation:
I = K ( θ ) ( d Ψ d z + 1 )
It is assumed that the matrix potential Ψ changes linearly between the lower boundary of LSX soil and the groundwater level of HMS, namely:
d Ψ d z = Ψ s a t Ψ ( θ ) Z g Z i
where Zg and Zi n are the distance between the HMS groundwater level and the ground and that between the LSX soil lower boundary and the ground, respectively, which is negative in the downward direction. According to Equations (2)–(4), LSX and HMS realize bidirectional coupling, i.e., land surface hydrological coupling model LSX-HMS.

2.4. Attribution Analysis Method

In this paper, Toudaoguai, Huayuankou and Lijin hydrological stations, which are the boundary points of the upper, middle and lower reaches of the Yellow River Basin, are taken as the research object. The Mann-Kendall (MK) mutation test method is used to comprehensively identify the runoff mutation points [57] of the above three stations, from 1961 to 2016. Based on this, the runoff of the upper, middle and lower reaches of the Yellow River are divided into several time series, that is, reference period before the mutation point and change periods after the mutation point.
The contribution rate of climate change, land use and water conservancy projects to runoff change before and after mutation point was analyzed by monthly coupling model simulation, from 1961 to 2016 in the present research. Q s denotes “reference flow”, which is the simulated flow of the reference period. It represents the background runoff without the impact of climate change, land use and water conservancy projects; Q s denotes “simulated flow”, which is obtained after the model driven by the meteorological conditions of each change period on the basis of Q s in the reference period. It represents the simulated runoff under the influence of climate change; Q r denotes “naturalized flow”, which is restored by model simulation in the scenario without water conservancy projects above Toudaoguai, Huayuankou and Lijin stations. It represents the natural runoff without the influence of human water resources development and utilization activities such as reservoir construction, agricultural irrigation and water intake etc. Q o denotes “observed flow”, which is the measured data. It represents the actual runoff under the impact of climate change, land use and water conservancy projects.
In summary, the above parameters and their corresponding attribution types and effects are as follows, in Table 3.
The flow changes caused by climate change, land use and water conservancy projects can be expressed by the following:
Δ Q c l i m a t e = Q s Q s
Δ Q l a n d = Q r Q s = Q r Q s Δ Q c l i m a t e
Δ Q p r o j e c t = Q o Q r
where Δ Q c l i m a t e , Δ Q l a n d and Δ Q p r o j e c t denotes, respectively, the flow changes caused by climate change, land use and water conservancy projects. Therefore, the total runoff changes of each change period relative to the base period is the sum of the influence of three major factors. The contribution rate is used to describe the influence of various factors on runoff variation. The equation is as follows:
Δ Q = Δ Q c l i m a t e + Δ Q l a n d + Δ Q p r o j e c t = Q o Q s
C x ( % ) = Δ Q x Δ Q × 100 %
where C x ( % ) denotes the contribution rate of factor x, and Δ Q x denotes the variation value of runoff caused by factor x.

3. Results

3.1. Temporal and Spatial Variation of Climatic Elements

Climate change in the Yellow River Basin is becoming increasingly severe, and climate elements are influenced by many factors, as characterized by trend, periodicity and spatial heterogeneity. In the present study, the deep temporal and spatial evolution of key climate elements from 1961 to 2018 is mainly analyzed from three aspects, namely, precipitation, temperature and evaporation.

3.1.1. Trend and Periodicity

The Mann-Kendall method is used to analyze the trend change of climate elements in the time series. The Morlet wavelet analysis method is used to analyze the change characteristics of climate elements in the multi-time scale, which is proved to clearly reveal a variety of change periods hidden in the time series and fully reflects the change trend of the system in multi-time scale. The left side of Figure 3 shows the temporal variation trend of the three climatic elements (precipitation, temperature and evaporation) in the upper, middle and lower reaches of the Yellow River; the right side shows the result of Morlet wavelet analysis of the three climatic elements. The left y-axis is the time scale, and the right y-axis is the modulus of wavelet coefficients with their corresponding color bars. The modulus of Morlet wavelet coefficients is the reflection of the distribution of energy density in the time domain corresponding to different time scales. The larger the modulus of wavelet coefficients is, the stronger the periodicity of the corresponding time scale is.
The annual average precipitation in the Yellow River Basin is 470.1 mm, and the average annual precipitation increases from the upper to lower reaches. However, according to the linear fitting results of the long time series (Figure 3), the annual precipitation in the upper reaches of the Yellow River increases at a rate of 4.0 mm/10a, while it decreases at a rate of 3.1 mm/10a and 8.3 mm/10a in the middle and lower reaches, respectively. In the process of precipitation evolution, its change cycle alters correspondingly with different research scales, namely, there are multi-level time scale structure and local change characteristics in the time domain. The periodicity of 18–32 years is the strongest, and its periodic variation is also the most stable.
The annual average temperature in the Yellow River Basin is 5.8 °C, and it gradually increases from upstream to downstream. The whole basin conforms to the general trend of global warming, and the temperature increases in the upper, middle and lower reaches are 0.4 °C/10a, 0.2 °C/10a and 0.3 °C/10a, respectively, with the temperature increase in the upper reaches being the most significant. Among them, the periodicity of 22–32 years is the strongest, which mainly occurred in 1960–1970 and after 2010.
The annual average pan evaporation in the Yellow River Basin is 1067.3 mm, which decreases at the rates of 13.3, 13.1 and 28.4 mm/10a in the upper, middle and lower reaches, respectively. Although the temperature in the Yellow River Basin is on the rise, the pan evaporation is on the decline. This shows that there is a phenomenon of “evaporation paradox” present in the Yellow River Basin. Put simply, the evaporation paradox means that in the current situation of a significant increase in global temperatures, it is expected that warming may lead to an increase in evaporation and accelerate the water cycle. However, the fact shows that the evaporation of water, measured using evaporation pan, has shown a steady downward trend in many parts of the world in the past 50 years. This is especially true in arid and semi-arid regions. The decline of pan evaporation in the Yellow River Basin is mainly caused by the decrease of precipitation and decline of evaporation meteorological dynamics such as wind speed and sunshine. The periodicity of 22–32 years is the strongest, and it occurs on a global scale.

3.1.2. Spatial Heterogeneity

The Kriging interpolation method is selected to obtain the spatial distribution of precipitation, temperature and evaporation in different regions of Yellow River Basin. The annual average precipitation in the Yellow River Basin is affected by weather system and topography showing a spatial distribution pattern of “greater in the south and less in the north, and greater in the east and less in the west”. It can be seen from Figure 4 that the annual precipitation decreases from southeast to northwest, and it is significantly higher in the downstream area than the middle and upper reaches. The annual average rainfall is the highest (1017.1 mm) in the Jing River, Wei River and Luo River, and the lowest (130 mm) in Lanto District. Contrary to the spatial distribution, the annual precipitation of the Yellow River decreases from the northwest to southeast, and changes from upward to downward. Among them, the annual precipitation of some stations in the area above Lanzhou in the upper reaches of the Yellow River and in Shanxi and Shaanxi in the middle reaches increased by more than 10 mm/10 a, with a large growth rate. Meanwhile, the annual precipitation of some stations in the northeast region of the upper reaches of the Yellow River, the Sanhua area of the middle reaches and the lower reaches of the Yellow River decreased greatly, with a reduction amplitude greater than 10 mm/10 a.
The annual average temperature in the Yellow River Basin shows a spatial distribution pattern of “higher in the east and lower in the west, higher in the south and lower in the north”. The annual average temperature in the middle and lower reaches of the Yellow River Basin is significantly higher than that in the upper reaches, with the highest annual average temperature being in the Sanhua area (14.9 °C) and the lowest in the source area of the Yellow River (−6.5 °C). The annual average maximum temperature difference throughout the basin reaches up to 21.4 °C. The spatial variation of annual average temperature shows a trend of warming throughout the basin, in which the annual average temperature in northwestern China rises more than 0.3 °C/10a, while that in southeastern China it is slower. Combined with the spatial distribution results of precipitation, it is further indicated that the northwest region in the upper reaches of the Yellow River is warm and humid, while the downstream region is warm and dry.
The topography of the Yellow River Basin varies quite widely, and the altitude can be roughly divided into three gradients. The first gradient is the Qinghai-Tibet Plateau, located at greater than 4000 m above sea level; the second gradient is the Loess Plateau, ranging between 1000 and 2000 m above sea level; and the third gradient is the North China Great Plain, below 100 m above sea level. The climate types in different regions vary widely, with humid, semi-humid, semi-arid and arid climate in turn from south to north. There are some regional differences observed in pan evaporation. The average pan evaporation ranges from 754.9 mm to 1424.0 mm, showing a spatial pattern of “greater in the north and less in the south, greater in the east and less in the west”. Figure 4 shows that the pan evaporation decreases from northeast to southwest. The highest value is 1424.0 mm in Lanto, while the lowest value is 754.9 mm in Lanzhou. The change trend of pan evaporation in the Yellow River Basin is mainly downward, among which the pan evaporation in some stations above Lanzhou in the upper reaches of the Yellow River and the lower reaches of the Yellow River is on the rise, and the rising speed is less than 5 mm/10 a; the pan evaporation in some stations in the middle reaches of the Yellow River is greater than 5 mm/10a.

3.2. Impact of Climate Change and Human Activities on Runoff

3.2.1. Model Calibration

Considering the fact that before 1970 the influence of human activities on the Yellow River Basin was miniscule, the monthly average discharge of Lanzhou, Toudaoguai, Huayuankou and Lijin control sections from 1961 to 1969 were selected in this paper, taking 1961–1965 as the calibration period and 1966–1969 as the verification period to evaluate the simulation ability of the LSX-HMS large-scale land surface hydrological coupling model (Figure 5).
Nash efficiency coefficient (NSE) and bias coefficient (BIAS) is used to evaluate the runoff simulation ability of the LSX-HMS coupling model. The equation is as follows:
BIAS = S i O i
NSE = 1 ( S i O i ) 2 ( O i O ¯ ) 2
where S i , O i and O ¯ denotes, respectively, the simulated runoff, observed runoff, and the average value of observed runoff in each time period.
The model calibration and verification results are shown in Table 4. During the calibration period, the NSE coefficients are all above 0.85, and the BIAS deviation coefficients are 0.98 and 1.02, respectively. During the verification period, the NSE coefficients are all above 0.84, and the BIAS deviation coefficients are 0.97, 1.02 and 1.10, respectively. Furthermore, it shows that the LSX-HMS coupling model constructed in this paper is suitable for the study basin and has a good simulation effect.

3.2.2. Attribution Analysis of Runoff Change

In order to compare the causes of runoff variation in the Yellow River Basin, the annual runoff variation points of Toudaoguai, Huayuankou and Lijin sections are identified by the MK mutation test. UF denotes a standard normal distribution and α represents a given significance level (α = 0.05). UF > 0 indicates a continuous increasing trend. UF < 0 indicates a continuous decreasing trend. If the intersection of UF and UB curve is within the confidence level interval [−1.96, 1.96], it passes the 0.05 significance test, and the specific year corresponding to the intersection is just the mutation point. On the contrary, if the intersection is not located in the confidence level interval, it fails to pass the significance test, and there is no mutability in this corresponding year.
The results of the MK mutation test (Figure 6) show that the intersection of UF and UB curves in the upper, middle and lower reaches are all located in the confidence level interval [−1.96, 1.96], passing the significance test. The mutation points of three regions of the Yellow River Basin all occurred in 1987. Therefore, 1987 was taken as the segmentation point of runoff sequence in this paper, and the runoff sequence of the Yellow River Basin from 1961 to 2016 was divided into four stages, i.e., 1961–1986 (reference period), 1987–1999 (change period I), 2000–2009 (change period II) and 2010–2016 (change period III).
On this basis, combined with numerical simulation results and using attribution analysis method, the influence and contribution rate of climate change, land use and water conservancy projects on runoff change in the upper, middle and lower reaches of the Yellow River are quantitatively analyzed, as shown in Table 5.
According to the results of the attribution analysis, it can be seen that the runoff changes in all periods of the Yellow River Basin are negative, that is, compared with the reference period, the average annual runoff decreases in three periods. The causes of its changes are generally consistent, and follow the order of project > land use > climate change, with project impact and land use change being the leading factors of runoff reduction in the Yellow River Basin. Among them, the impact of climate change and project shows a steady and slight downward trend throughout basin scale with time, and the impact of land use increases significantly. By comparison, it is found that the impacts of climate change, land use and water conservancy projects on runoff change show a gradual increasing trend from upstream to downstream, which leads to the runoff change ranges of 174.2–207.2 m3/s, 618.5–1050.1 m3/s and 440.3–841.5 m3/s in the middle and downstream, respectively, which is significantly larger than the impact value of runoff in the upstream (101.5–106.4 m3/s, 426.4–445.8 m3/s and 149.1–211.9 m3/s), indicating that all impacts occur in the middle and lower reaches of the Yellow River Basin.
In the upper reaches of the Yellow River, the change of total runoff in period II is greater than that in period I, in which the contribution rate of climate change to runoff has little difference, and the impact of land use change on underlying surface is increased, while the impact of water conservancy projects is slightly reduced by the implementation of water-saving irrigation and restrictions on human access to water. In the middle reaches of the Yellow River Basin, the impact of land use on runoff change is increasing year by year, and the maximum contribution rate in period III is 65.3%, exceedingly even that of project impact (49.9%). Runoff changes caused by water conservancy projects are basically maintained at a stable level with small fluctuations. However, in general, the amount of runoff change in period III is equivalent to that in period I, mainly due to the fact that the impact of climate change factors was significantly negative (−15.2%) from 2010 to 2016. Although the impact of land use is intensified, the increase of precipitation caused by climate factors slows down the decrease of runoff. The causes of runoff change in the lower reaches of the Yellow River are similar to those in the middle reaches. The impact of climate change on runoff in period III is negative, which is the same as that in the middle reaches, i.e., climate change increases runoff. Runoff changes caused by land use increase significantly, and the influence of project tends to be stable, but it is still the greatest factor of downstream runoff changes.

3.2.3. Sensitivity Analysis to Climate Change

In this paper, the LSX-HMS model is used to assume four scenarios, namely the temperature changes of +0.5 °C, 1.0 °C and precipitation changes of ±10% are assumed for historical meteorological data, so as to comparatively analyze the sensitivity of water resources system in the Yellow River Basin to climate change. Figure 7 shows the annual average flow process of the Yellow River Basin from 1961 to 2016 under the temperature and precipitation change, and the sensitivity response to climate change are shown in Table 6.
Overall, the runoff in the Yellow River Basin is more sensitive to precipitation changes, and less sensitive to air temperature. For every 10% increase in precipitation, the runoff increases by 14.3~17.8%. For every 10% decrease in precipitation, the runoff decreases by 13~15.7%. When the temperature rises by 0.5 °C, the runoff decreases by 1.1~2.2%. When the temperature rises by 1.0 °C, the runoff decreases by 2.1~4.2%. The increase of temperature increases the evaporation loss in the basin, yet accelerates the supplement of glacier snow melting to runoff to a certain extent. The two effects cancel one another out, so that the runoff is less greatly affected by the change of temperature.
The sensitivity of runoff to precipitation change in each region of the Yellow River is in the following order: upstream (−15.7% and 17.8%) > downstream (−13.0% and 14.6%) > midstream (−12.8% and 14.3%). The response of the runoff to temperature change in the upper reaches of the Yellow River is the most sensitive (−2.2% and −4.2%), followed by the middle and lower reaches, and in the upper reaches it is twice as sensitive as that in the middle and lower reaches. It can be seen that the sensitivity in the upper reaches of the Yellow River to precipitation and air temperature is the highest, thus indicating that the runoff in the plateau mountainous areas has greater response intensity to climate change.

4. Discussion

4.1. Comparison and Justification

The previous studies on the attribution of runoff change in the Yellow River Basin have shown that, since the 1950s, due to the influence of climate change and human activities such as water conservancy projects, the runoff in the basin has shown a significant downward trend, and the attenuation in the lower reaches is more significant than that in the upper reaches, in which human activities are the main influencing factors [58]. Some studies indicate that the contribution rates of human activities in the Weihe River, the largest tributary of the basin, are 64%, 72%, 47% and 90%, respectively [59], and the land use change in eight of the 11 sub-basins of the Yellow River Basin leads to more than 50% reduction of annual runoff [60]. Wang et al. [61] believe that, during 1986 to 2018, human activities contributed 76.2% of the runoff reduction in Huayuankou, and the contribution rate of climate change is 23.8%. Feng et al. [62] believe that, from 1957 to 2018, human activities contributed 63% and 80% of the runoff change in Longmen and Tongguan, respectively. The research by Kong et al. [63] show that more than 90% of the runoff reduction in the Yellow River Basin in 2012 can be attributed to the influence of human activities. Referring to the previous studies on the attribution analysis of runoff changes in the Yellow River Basin, the effects of human activities are dominant, and the contribution rate of most studies is more than 70%; some are even more than 90%. This is consistent with the results of this study (84.0%~90%) as a whole.
Furthermore, this study found that the runoff in the middle and lower reaches of the Yellow River Basin has decreased sharply since 2000, and the range of flow change caused by land use is 440~842 m3/s, while the impact of land use on runoff change in upper reaches is relatively small. The main reason lies in the ecological restoration policy of the Yellow River Basin since the 21st century. According to the data of soil and water conservation measures in the middle and lower reaches from 2000 to 2012 (Table 7), compared with 2000, the area of terrace increased by only 17%, the area of plantation increased by 37%, and the area of artificial grass sharply increased by 128%. A series of measures, such as afforestation and returning farmland to forest, have altered the distribution pattern of energy and water on the land surface of the basin, then changed the water cycle process, resulting in a significant increase in the impact of land use change on runoff.
It is clear to see from the result that the influence of water conservancy projects on the runoff cannot be ignored. The contribution rate of the upper, middle and lower reaches of the Yellow River is about 40 billion m3/s, 60 billion m3/s and 100 billion m3/s, respectively. It shows a gradual increasing trend from upstream to downstream. According to the data of the First National Water Conservancy Census in China, the human water intake and agricultural irrigation projects were the main reason of runoff change in the Yellow River Basin. In addition, in the past 10 years, China has vigorously managed the soil erosion in the Yellow River Plateau, and implemented a series of comprehensive measures for soil and water conservation, particularly the construction of sediment storage dams for farmland building. This has made significant changes in the underlying surface in the middle and lower reaches of the Yellow River. The sediment storage dams play an important role in intercepting the sediment and improving the ecological environment in the Yellow River Basin, but they also seriously reduce the water level, which has a greater negative impact on the runoff against the background of climate change.
In terms of the sensitivity study of runoff to climate change in the Yellow River Basin, previous research results are in good agreement with this paper. The sensitivity analysis in the middle reaches from 1950 to 2005 [64] shows that when the temperature increases by 1 °C, the runoff will reduce by 3.6% to 6.6%, and when the precipitation reduces by 10% in that year, the runoff will reduce by 17% to 22%. Wang et al. [65] analyzed four sub-basins with significant differences in climatic conditions between the upper and middle reaches. The results show that when the precipitation increases by 10%, the runoff will increase by 17% to 24%, and when the temperature rises by 1 °C, the runoff will only decrease by 3% to 8%. Runoff in arid areas is more sensitive to climate change than in humid areas.
They all further confirm the result of this study, that is, runoff is more sensitive to precipitation than temperature, and the upper reaches are more sensitive to climate change than the middle and lower reaches. The sensitivity to precipitation and temperature is both the highest in the upper reaches, which is mainly located in the southwest of the basin and is dominated by the grassland ecosystem. The material and energy flow in the system is slow, and the ecosystem is very fragile and sensitive. In general, the runoff coefficient in semi-arid and arid areas varies significantly with the change of precipitation, but the regulation and storage capacity of the watershed is strengthened under the influence of large-scale human activities, such as soil and water conservation, as well as water conservancy project construction. The variation of runoff with precipitation is resisted to a certain extent, thus weakening the sensitivity of runoff to climate change. The upper reaches are the source of the Yellow River and also an important water supply area, including many core areas of Sanjiangyuan National Natural Reserve. Human activities are obviously less than those in the middle and lower reaches, and the ability to adjust climate change is the weakest. On the other hand, precipitation is the main source of runoff in the basin, and accounts for 95.9% supply of the total annual runoff especially in the upper reaches. So, the impact of precipitation change on runoff is much greater than temperature.

4.2. Limitations and Recommendations

The two-way coupling of land surface process and the distributed hydrological model plays an important role in the research of global change, and its coupling effect will directly affect the ability of the whole model framework to simulate and predict climate change. Although different forms of coupling schemes from different angles have been put forward, the problems of scale and uncertainty are still the main limitations in the current research. At the same time, they are also the mainstream direction and focus of the future research in this domain.
In terms of scale problem, the spatio-temporal scale of atmosphere and hydrology is very different, and the variation of atmospheric process is uniform in space and intense in time, while the hydrological process is just the opposite. Three possible ways to solve the scale problem, that are key for model coupling, can be focused on: (1) the disaggregation method of data, such as ungathering the monthly rainfall runoff data to the day and the daily data to the hour, which provides a feasible way for solving the mismatch between hydrological and climate model on the time scale; (2) the spatial statistical relations of various hydrological and meteorological elements at different resolutions should be mathematically expressed; and (3) the coupling information of different scale models can be obtained by using methods such as the grey system method, so as to obtain the most appropriate simplified relationship of scale transformation.
In terms of the uncertainty problem, a large number of uncertain parameters in the hydrological model and land surface model, as well as various uncertain factors in real-time transmission and the mutual feedback of model simulation results, will directly lead to the uncertainty of the whole model system. The multi-criteria integration technology of uncertain factors, the risk estimation method and the multivariate data comparison method should be actively promoted to quantify the uncertainty of the model, and the data assimilation technology should be used to improve the optimization ability of data and parameters.

5. Conclusions

Climate change is related to the common destiny of humankind. Countries all over the world have even regarded mitigation and adaptation to climate change as important parts of the global strategy to actively respond to climate change. They have given increasing attention to climate change and its profound impact in water resources, infrastructure, agriculture, ecosystems and other fields. The Yellow River Basin is a typical arid and semi-arid area which is very sensitive to climate change. In recent years, significant changes have taken place in the climate elements, water resources and ecological environment. The contradiction between the supply and demand of water resource in the basin is more prominent and it has become the area with the greatest shortage of water resources in China. Therefore, research on the multifaceted response of water resources in the basin under climate change has become the focus of interest and attention, which has worldwide importance and significance.
In order to reveal the evolution law of climate and water resources in recent decades, define the main water resources problems, and evaluate the effects of climate change and human activities on the temporal and spatial distribution of water resources in the Yellow River Basin, a new two-way coupling model of land surface and hydrology has been explored in our present research. Unlike the traditional hydrological model and land surface process, without mutual feedback and connection between them, this two-way coupling model completely solves the land hydrological cycle, and can be effectively fed back to the land surface model. It is of great theoretical and practical significance for making better management countermeasures and strategies to cope with climate change in the Yellow River Basin.
The annual average precipitation in the Yellow River Basin is 470.1 mm, which is higher in the lower reaches than in the middle and upper reaches, and the annual precipitation changes from northwest to southeast. The annual average temperature in the Yellow River Basin is 5.8 °C, which is significantly higher in the middle and lower reaches than in the upper reaches. The entire basin shows a warming trend and a remarkable warming speed, which indicates that the northwest region in the upper reaches of the Yellow River is warm and humid, while the southeast region in the lower reaches is warm and dry. The annual average pan evaporation in the Yellow River Basin is 1067.3 mm, showing a downward trend throughout the basin. The 28-year time scale has the strongest periodic fluctuation, with an average change period of 19 years.
From 1987 to 2009, the impact of climate change on runoff in the Yellow River Basin tends to be stable, and the contribution rate to runoff change has not fluctuated by more than 5%. In the time since 2010, the precipitation caused by climate factors has increased, which has increased runoff by 12~15%. In addition, due to the implementation of soil and water conservation projects and the policy of returning farmland to forest (grassland), the impact of land use change on runoff in various regions of the Yellow River has been increasing annually, and the impact in the middle and lower reaches is significantly higher than that in the upper reaches. In addition, the influence of water conservancy projects on runoff change is relatively stable, which is the leading factor of runoff reduction in the Yellow River Basin; its contribution rate fluctuates around 50%, and the runoff change value follows the order of downstream > midstream > upstream.
The sensitivity of runoff to precipitation change in the Yellow River Basin is higher than that of temperature change. Under the same condition, the runoff in the upper reaches of the Yellow River is most sensitive to precipitation and temperature changes, and the response of the runoff in the upstream runoff to temperature changes is about twice that of both the middle and lower reaches. This shows that the runoff in the plateau and mountainous areas is highly sensitive to climate change.

Author Contributions

Data curation, funding acquisition, methodology, writing-original draft, writing-review and editing, L.C.; funding acquisition, methodology, supervision, M.Y.; data curation, formal analysis, investigation, X.L. (Xuan Liu); investigation, X.L. (Xing Lu). All authors have read and agreed to the published version of the manuscript.

Funding

This research was funded by the Major Project for Climate Change (No.20190306); Lift Program for Young Scientists of IWHR (SD0145B102021).

Institutional Review Board Statement

Not applicable.

Informed Consent Statement

Not applicable.

Data Availability Statement

Not applicable.

Conflicts of Interest

The authors declare no conflict of interest.

References

  1. Bao, Z.X.; Zhang, J.Y.; Wang, G.Q.; Chen, Q.W.; Guan, T.S.; Yan, X.L.; Liu, C.S.; Liu, J.; Wang, J. The impact of climate variability and land use/cover change on the water balance in the Middle Yellow River Basin, China. J. Hydrol. 2019, 577, 123942. [Google Scholar] [CrossRef]
  2. Shi, X.; Chen, F.; Ding, H.; Shi, M.; Li, Y. Assessing Vegetation Ecosystem Resistance to Drought in the Middle Reaches of the Yellow River Basin, China. Int. J. Environ. Res. Public Health 2022, 19, 4180. [Google Scholar] [CrossRef] [PubMed]
  3. Tao, B.; Zhang, B.; Dong, J.; Liu, C.; Cui, Q. Antagonistic effect of nitrogen additions and warming on litter decomposition in the coastal wetland of the Yellow River Delta, China. Ecol. Eng. 2019, 131, 1–8. [Google Scholar] [CrossRef]
  4. Wang, W.; Zhang, Y.Y.; Tang, Q.H. Impact assessment of climate change and human activities on stream flow signatures in the Yellow River Basin using the Budyko hypothesis and derived differential equation. J. Hydrol. 2020, 591, 125460. [Google Scholar] [CrossRef]
  5. Wang, F.; Wang, Z.; Yang, H.; Di, D.; Zhao, Y.; Liang, Q.; Hussain, Z. Comprehensive evaluation of hydrological drought and its relationships with meteorological drought in the Yellow River Basin, China. J. Hydrol. 2020, 584, 124751. [Google Scholar] [CrossRef]
  6. Omer, A.; Elagib, N.A.; Ma, Z.; Saleem, F.; Mohmmed, A. Water scarcity in the yellow river basin under future climate change and human activities. Sci. Total Environ. 2020, 749, 141446. [Google Scholar] [CrossRef]
  7. Guo, H.; Xia, Y.; Pan, C.; Lei, Q.; Pan, H. Analysis in the Influencing Factors of Climate-Responsive Behaviors of Maize Growers: Evidence from China. Int. J. Environ. Res. Public Health 2022, 19, 4274. [Google Scholar] [CrossRef]
  8. Gsa, B.; Jrl, B.; Gk, C. Eco-engineering strategies for soil restoration and water conservation: Investigating the application of soil improvements in a semi-arid climate in a medical facility case study, Abu Dhabi. Ecol. Eng. 2018, 121, 53–64. [Google Scholar] [CrossRef]
  9. Ding, Y.; Zhang, S.; Zhao, L.; Li, Z.; Kang, S. Global warming weakening the inherent stability of glaciers and permafrost. Sci. Bull. 2019, 64, 37–45. [Google Scholar] [CrossRef] [Green Version]
  10. Ashiq, W.; Nadeem, M.; Ali, W.; Zaeem, M.; Wu, J.H.; Galagedara, L.; Thomas, R.; Kavanagh, V.; Cheema, M. Biochar amendment mitigates greenhouse gases emission and global warming potential in dairy manure based silage corn in boreal climate. Environ. Pollut. 2020, 265, 114869. [Google Scholar] [CrossRef]
  11. Ndehedehe, C.E.; Ferreira, V.G. Identifying the footprints of global climate modes in time-variable gravity hydrological signals. Clim. Chang. 2020, 159, 481–502. [Google Scholar] [CrossRef]
  12. Yin, L.; Zhang, S.; Zhang, B. Do Ecological Restoration Projects Improve Water-Related Ecosystem Services? Evidence from a Study in the Hengduan Mountain Region. Int. J. Environ. Res. Public Health 2022, 19, 3860. [Google Scholar] [CrossRef] [PubMed]
  13. Zhuang, X.W.; Li, Y.P.; Nie, S.; Fan, Y.R.; Huang, G.H. Analyzing climate change impacts on water resources under uncertainty using an integrated simulation-optimization approach. J. Hydrol. 2017, 556, 523–538. [Google Scholar] [CrossRef]
  14. Fuoco, R.; Giannarelli, S. Integrity of aquatic ecosystems: An overview of a message from the South Pole on the level of persistent organic pollutants (pops). Microchem. J. 2019, 48, 230–239. [Google Scholar] [CrossRef]
  15. Kim, J.J.; Ryu, J.H. Modeling hydrological and environmental consequences of climate change and urbanization in the Boise River watershed, Idaho. J. Am. Water Resour. Assoc. 2019, 55, 133–153. [Google Scholar] [CrossRef] [Green Version]
  16. Mcdonough, L.K.; Santos, I.R.; Andersen, M.S.; O’Carroll, D.M.; Baker, A. Changes in global groundwater organic carbon driven by climate change and urbanization. Nat. Commun. 2020, 11, 1279. [Google Scholar] [CrossRef] [Green Version]
  17. Wehn, U.; Vallejio, B.; Seijger, C.; Tlhagale, M.; Amorsi, N.; Sossou, S.K.; Genthe, B.; Onema, J.M.K. Strengthening the knowledge base to face the impacts of climate change on water resources in Africa: A social innovation perspective. Environ. Sci. Pollut. Res. 2021, 116, 292–300. [Google Scholar] [CrossRef]
  18. Peters, L.C.D.; Rose, K.C.; Kiang, J.E.; Strobel, M.L.; Arndt, D.S. Indicators of climate change impacts on the water cycle and water management. Clim. Chang. 2021, 165, 36. [Google Scholar] [CrossRef]
  19. Luo, Z.L.; Zuo, Q.T. Evaluating the coordinated development of social economy, water, and ecology in a heavily disturbed basin based on the distributed hydrology model and the harmony theory. J. Hydrol. 2019, 574, 226–241. [Google Scholar] [CrossRef]
  20. Darling, J.A.; Martinson, J.; Lohan, K.M.P.; Carney, K.J.; Pilgrim, E.; Banerji, A.; Holzer, K.K.; Ruiz, G.M. Metabarcoding quantifies differences in accumulation of ballast water borne biodiversity among three port systems in the United States. Sci. Total. Environ. 2020, 749, 141456. [Google Scholar] [CrossRef]
  21. Soma, D.S.; Uttam, K.S.; Lianthuamluaia, L.; Bandana, D.G.; Koushik, R.; Puthiyottil, M.; Basanta, K.D. Pattern of the state of eutrophication in the floodplain wetlands of eastern India in context of climate change: A comparative evaluation of 27 wetlands. Environ. Monit. Assess. 2020, 192, 183. [Google Scholar] [CrossRef]
  22. Fiorentino, F.; Lasinio, G.J.; Careddu, G.; Caputi, S.S.; Costantini, M.L. New epilithic δ15n-based analytical protocol for classifying nitrogen impact in Lake Bracciano. Ecol. Indic. 2020, 117, 106663. [Google Scholar] [CrossRef]
  23. Flanagan, A.; Priyadarshini, A. A study of consumer behaviour towards food-waste in Ireland: Attitudes, quantities and global warming potentials. J. Environ. Manag. 2021, 284, 112046. [Google Scholar] [CrossRef]
  24. Zhang, H.; Wang, B.; Liu, D.L.; Zhang, M.; Feng, P.; Cheng, L.; Yu, Q.; Eamus, D. Impacts of future climate change on water resource availability of eastern Australia. J. Hydrol. 2019, 573, 49–59. [Google Scholar] [CrossRef]
  25. Yu, Y.; Pi, Y.Y.; Yu, X.; Ta, Z.J.; Sun, L.X. Climate change, water resources and sustainable development in the arid and semi-arid lands of central Asia in the past 30 years. J. Arid Land 2019, 11, 3–16. [Google Scholar] [CrossRef] [Green Version]
  26. Lv, H.; Yang, L.; Zhou, J.; Zhang, X.; Jiang, D. Water resource synergy management in response to climate change in China: From the perspective of urban metabolism. Resour. Conserv. Recycl. 2020, 163, 105095. [Google Scholar] [CrossRef]
  27. Demoury, C.; Aerts, R.; Vandeninden, B.; Van Schaeybroeck, B.; De Clercq, E.M. Impact of Short-Term Exposure to Extreme Temperatures on Mortality: A Multi-City Study in Belgium. Int. J. Environ. Res. Public Health 2022, 19, 3763. [Google Scholar] [CrossRef] [PubMed]
  28. Javadinejad, S.; Hannah, D.; Ostad, A.A.K.; Krause, S.; Zalewski, M.; Boogaard, F.C. The impact of future climate change and human activities on hydro-climatological drought, analysis and projections: Using cmip5 climate model simulations. Water Environ. Res. 2019, 4, 71–88. [Google Scholar] [CrossRef]
  29. Jehanzaib, M.; Kim, T.W. Exploring the influence of climate change induced drought propagation on wetlands. Ecol. Eng. 2020, 149, 105799. [Google Scholar] [CrossRef]
  30. Guo, M.; Ma, S.; Wang, L.J.; Lin, C. Impacts of future climate change and different management scenarios on water-related ecosystem services: A case study in the Jianghuai ecological economic Zone, China. Ecol. Indic. 2021, 127, 107732. [Google Scholar] [CrossRef]
  31. Kay, A.L.; Rudd, A.C.; Fry, M.; Nash, G.; Allen, S. Climate change impacts on peak river flows: Combining national-scale hydrological modelling and probabilistic projections. Clim. Risk Manag. 2021, 31, 100263. [Google Scholar] [CrossRef]
  32. Singh, J.A.; Baru, D.; Kour, R.; Ahmad, S.; Kour, K. Hydrological modeling to simulate stream flow under changing climate conditions in Jhelum catchment, Western Himalaya. J. Hydrol. 2020, 593, 125887. [Google Scholar] [CrossRef]
  33. Jiao, Y.; Liu, J.; Li, C.; Wang, W.; Yu, F.L.; Wang, Y.Z. Quantitative attribution of runoff attenuation to climate change and human activity in typical mountainous areas: An enlightenment to water resource sustainable utilization and management in north China. Sustainability 2020, 12, 10395. [Google Scholar] [CrossRef]
  34. Liu, J.L.; Chen, J.; Xu, J.J.; Lin, Y.R.; Yuan, Z.; Zhou, M.Y. Attribution of runoff variation in the headwaters of the Yangtze River based on the Budyko hypothesis. Int. J. Env. Res. Public Health 2019, 16, 2506. [Google Scholar] [CrossRef] [PubMed] [Green Version]
  35. Zhang, Y.F.; He, B.; Guo, L.L.; Liu, J.J.; Xie, X.M. The relative contributions of precipitation, evapotranspiration, and runoff to terrestrial water storage changes across 168 river basins. J. Hydrol. 2019, 579, 124194. [Google Scholar] [CrossRef]
  36. Menberg, K.; Bidarmaghz, A.; Gregory, A.; Choudhary, R.; Girolami, M. Multi-fidelity approach to Bayesian parameter estimation in subsurface heat and fluid transport models. Sci. Total Environ. 2020, 745, 140846. [Google Scholar] [CrossRef] [PubMed]
  37. Jiang, S.H.; Wei, L.Y.; Ren, L.L.; Xu, C.Y.; Zhong, F.; Wang, M.H.; Zhang, L.Q.; Yuan, F.; Liu, Y. Utility of integrated IMERG precipitation and GLEAM potential evapotranspiration products for drought monitoring over mainland China. Atmos. Res. 2020, 247, 105141. [Google Scholar] [CrossRef]
  38. Malik, S.; Pal, S.C.; Chowdhuri, I.; Chakrabortty, R.; Roy, P.; Das, B. Prediction of highly flood prone areas by GIS based heuristic and statistical model in a monsoon dominated region of Bengal Basin. Remote Sens. Appl. 2020, 19, 100343. [Google Scholar] [CrossRef]
  39. Ruidas, D.; Chakrabortty, R.; Islam, A.R.M.T.; Saha, A.; Pal, S.C. A novel hybrid of meta-optimization approach for flash flood-susceptibility assessment in a monsoon-dominated watershed, Eastern India. Environ. Earth Sci. 2022, 81, 145. [Google Scholar] [CrossRef]
  40. Ruidas, D.; Saha, A.; Islam, A.R.M.T.; Costache, R.; Pal, S.C. Development of geo-environmental factors controlled flash flood hazard map for emergency relief operation in complex hydro-geomorphic environment of tropical river, India. Environ. Sci. Pollut. Res. 2022, 10, 1–16. [Google Scholar] [CrossRef]
  41. Roy, P.; Pal, S.C.; Chakrabortty, R.; Chowdhuri, I.; Malik, S.; Das, B. Threats of climate and land use change on future flood susceptibility. J. Clean. Prod. 2020, 272, 122757. [Google Scholar] [CrossRef]
  42. Pal, S.C.; Chowdhuri, I.; Das, B.; Chakrabortty, R.; Roy, P.; Saha, A.; Shit, M. Threats of climate change and land use patterns enhance the susceptibility of future floods in India. J. Environ. Manag. 2022, 305, 114317. [Google Scholar] [CrossRef] [PubMed]
  43. Xue, L.; Yang, F.; Yang, C.; Wei, G.; Li, W.; He, X. Hydrological simulation and uncertainty analysis using the improved TOPMODEL in the arid Manas River Basin, China. Sci. Rep. 2018, 8, 452. [Google Scholar] [CrossRef] [PubMed] [Green Version]
  44. Ahn, C.J.; Jongjin, B.; Daeha, K.; Minha, C. A comparative assessment of SWAT-model-based evapotranspiration against regional-scale estimates. Ecol. Eng. 2018, 122, 1–9. [Google Scholar] [CrossRef]
  45. Aqnouy, M.; Jamal, S.; Hilal, I.; Bouadila, A.; Reda, A. Assessment of the SWAT model and the parameters affecting the flow simulation in the watershed of Oued Laou (northern Morocco). Ecol. Eng. 2019, 20, 104–113. [Google Scholar] [CrossRef]
  46. Čerkasova, N.; Umgiesser, G.; Ertürk, A. Development of a hydrology and water quality model for a large transboundary river watershed to investigate the impacts of climate change—A SWAT application. Ecol. Eng. 2018, 124, 99–115. [Google Scholar] [CrossRef]
  47. Chakrabortty, R.; Pal, S.C.; Janizadeh SSantosh, M.; Roy, P.; Chowdhuri, I.; Saha, A. Impact of Climate Change on Future Flood Susceptibility: An evaluation based on Deep Learning Algorithms and GCM Model. Water Resour. Manag. 2021, 35, 4251–4274. [Google Scholar] [CrossRef]
  48. Malik, S.; Pal, S.C. Potential flood frequency analysis and susceptibility mapping using CMIP5 of MIROC5 and HEC-RAS model: A case study of lower Dwarkeswar River, Eastern India. SN Appl. Sci. 2021, 3, 31. [Google Scholar] [CrossRef]
  49. Umair, M.; Kim, D.; Ray, R.L.; Choi, M. Estimating land surface variables and sensitivity analysis for CLM and VIC simulations using remote sensing products. Sci. Total Environ. 2018, 633, 470–483. [Google Scholar] [CrossRef]
  50. Melsen, L.A.; Guse, B. Hydrological drought simulations: How climate and model structure control parameter sensitivity. Water Resour. Res. 2019, 55, 10527–10547. [Google Scholar] [CrossRef]
  51. Lilhare, R.; Pokorny Scott Déry, S.J.; Stadnyk, T.A.; Koenig, K.A. Sensitivity analysis and uncertainty assessment in water budgets simulated by the variable infiltration capacity model for Canadian subarctic watersheds. Hydrol. Process. 2020, 34, 2057–2075. [Google Scholar] [CrossRef]
  52. Brad, P.; Schneid, A.; Christopher, J.; Anderson, B.; Jack, W.; Feminella, A. The influence of low-intensity watershed development on the hydrology, geomorphology, physicochemistry and macroinvertebrate diversity of small coastal plains streams. Ecol. Eng. 2017, 108, 380–390. [Google Scholar] [CrossRef]
  53. Jung, C.G.; Kim, S.J. Assessment of the water cycle impact by the Budyko curve on watershed hydrology using SWAT and CO2 concentrations derived from terra MODIS GPP. Ecol. Eng. 2018, 118, 179–190. [Google Scholar] [CrossRef]
  54. Bechtold, M.; Lannoy, G.J.M.D.; Koster, R.D.; Reichle, R.H.; Tiemeyer, B. PEAT-CLSM: A specific treatment of peatland hydrology in the NASA catchment land surface model. J. Adv. Model. Earth Syst. 2019, 11, 2130–2162. [Google Scholar] [CrossRef] [Green Version]
  55. Kuczynska, S.J.; Piretzidis, D.; Sideris, M.G.; Olszak, T.; Szabo, V. Monitoring of extreme land hydrology events in central Poland using grace, land surface models and absolute gravity data. J. Appl. Geod. 2019, 13, 229–243. [Google Scholar] [CrossRef]
  56. Anwar, S.A.; Diallo, I. The influence of two land-surface hydrology schemes on the terrestrial carbon cycle of Africa: A regional climate model study. Int. J. Climatol. 2020, 41, 1202–1216. [Google Scholar] [CrossRef]
  57. Wang, J. Determining the most accurate program for the Mann-Kendall method in detecting climate mutation. Theor. Appl. Climatol. 2020, 142, 847–854. [Google Scholar] [CrossRef]
  58. Liu, C.M.; Tian, W.; Liu, X.M.; Liang, K.; Bai, P. Analysis and understanding on runoff variation of the Yellow River in recent 100 years. Yellow River 2019, 41, 11–15. (In Chinese) [Google Scholar] [CrossRef]
  59. Chang, J.X.; Wang, Y.M.; Istanbulluoglu, E.; Bai, T.; Huang, Q.; Yang, D.W.; Huang, S.Z. Impact of climate change and human activities on runoff in the Weihe River basin, China. Quat. Int. 2015, 380, 169–179. [Google Scholar] [CrossRef]
  60. Zhang, X.P.; Zhang, L.; Zhao, J.; Rustomji, P.; Hairsine, P. Responses of streamflow to changes in climate and land use/cover in the Loess Plateau, China. Water Resour. Res. 2008, 44, W00A07. [Google Scholar] [CrossRef]
  61. Wang, G.Q.; Zhang, J.Y.; Guan, X.X.; Bao, Z.X.; Liu, Y.L.; He, R.M.; Jin, J.L.; Liu, C.S.; Chen, X. Quantifying attribution of runoff change for major rivers in China. Adv. Water Sci. 2020, 31, 313–323. (In Chinese) [Google Scholar] [CrossRef]
  62. Feng, J.H.; Zhao, G.J.; Mu, X.M.; Tian, P.; Tian, X.J. Analysis on runoff regime in middle Yellow River and its driving factors. J. Hydroelectr. Eng. 2020, 39, 90–103. (In Chinese) [Google Scholar] [CrossRef]
  63. Kong, D.X.; Miao, C.Y.; Wu, J.W.; Duan, Q.Y. Impact assessment of climate change and human activities on net runoff in the Yellow River basin from 1951 to 2012. Ecol. Eng. 2016, 91, 566–573. [Google Scholar] [CrossRef]
  64. Zhang, J.Y.; Wang, G.Q.; He, R.M.; Liu, C.S. Variation trends of runoffs in the Middle Yellow River basin and its response to climate change. Adv. Water Sci. 2009, 20, 6. (In Chinese) [Google Scholar] [CrossRef]
  65. Wang, G.Q.; Wang, Y.Z. Sensitivity Analysis About Runoff of upper and Middle of the Yellow River to Climate Change. J. Appl. Meteorol. Sci. 2002, 13, 5. (In Chinese) [Google Scholar] [CrossRef]
Figure 1. Schematic diagram of the Yellow River Basin.
Sustainability 14 14981 g001
Figure 2. Diagram of LSX-HMS coupling model.
Sustainability 14 14981 g002
Figure 3. Temporal variation trend (left side) and periodicity (right side) of climatic elements in the Yellow River Basin from 1961 to 2018.
Sustainability 14 14981 g003
Figure 4. Spatial heterogeneity of climatic elements (precipitation, temperature and evaporation) in the Yellow River Basin from 1961 to 2018.
Sustainability 14 14981 g004
Figure 5. Observed and simulated monthly average discharge values of Lanzhou, Toudaoguai, Huayuankou and Lijin sections from 1961 to 1969.
Sustainability 14 14981 g005
Figure 6. MK mutation test of the annual runoff in Yellow River Basin.
Sustainability 14 14981 g006
Figure 7. Annual average flow process of the Yellow River Basin under different climate change scenarios.
Sustainability 14 14981 g007
Table 1. Overview of Yellow River Basin (unit: km, 10,000 km2).
ReachControl SectionRegion DivisionRiver LengthBasin AreaProportion
Upper reachToudaoguaiAbove Hekou Town, Tuoketuo County, Inner Mongolia3471.642.853.8%
Middle reachHuayuankouFrom Hekou Town to Taohuayu, Zhengzhou City, Henan Province1206.434.443.3%
Lower reachLijinBelow Taohuayu785.62.32.9%
Total5463.679.5100%
Table 2. Data source and processing.
Data TypeInitial Source DataAfter the Model Is Applied
SourceSpatial ResolutionTime ResolutionSpatial ResolutionTime ResolutionTime-Space Sequence
Meteorological dataPrecipitation and temperatureThe latest 2472 national meteorological observatories on the ground in China (http://data.cma.cn accessed on 9 October 2022)0.5° × 0.5°24 h0.5° × 0.5°6 h
(downscaling)
1961~2018
Specific humidity, wind speed, air pressure, infrared radiation, direct visible light, direct near infrared, scattered visible light, scattered near infrared, cloud coverNCEP/NCAR reanalysis data1.875° × 1.875°24 h1.875° × 1.875°6 h
(downscaling)
1948~2018
Evaporation capacityMeasured data of large evaporating dishes in 45 evaporation stations in basin II 1961~2017
Digital elevation and river depthDigital elevation, cumulative flow distributionHydro SHEDS90 m 20 km (upscaling) Whole country
Vegetation and land useEvergreen broad-leaved forest, deciduous broad-leaved forest, evergreen and deciduous mixed forest, coniferous broad-leaved forest, high-altitude deciduous forest, grassland, grassland/sporadic cultivated land, grassland/sporadic woodland, shrub and bare soil, lichen/moss, bare land and cultivated landMODIS1 km 20 km
(upscaling)
Whole country
SoilSand and clay contentHWSD1 km 20 km
(upscaling)
Whole country
Table 3. Simulated/measured parameters and the corresponding attribution types and effects.
Simulated/Measured ParametersAttribution Types and EffectsTime Series
Climate ChangeLand UseWater Conservancy Projects
Reference   flow   Q s ×××Reference period
Simulated flow Q s ××Change periods
Naturalized flow Q r ×
Observed flow Q o
Note: “×” shows the parameter without the impact of corresponding type of attribution. ”√” shows the parameter with the impact of corresponding type of attribution.
Table 4. LXS-HMS calibration and verification results.
Hydrologic StationLanzhouToudaoguaiHuayuankouLijin
IndicatorsNSEBIASNSEBIASNSEBIASNSEBIAS
Calibration period0.900.980.891.020.851.020.851.02
Verification period0.900.970.891.020.861.0670.841.10
Table 5. Results of attribution analysis of runoff change in the upper, middle and lower reaches.
SectionTimeMeasured Flow
m3/s
Runoff Variation m3/sClimate ChangeLand UseWater Conservancy Project
Flow Change m3/sContribution Rate %Flow Change m3/sContribution Rate %Flow Change m3/sContribution Rate %
Toudaoguai
(Upper reach)
1987–1999510.3−696.5−101.514.6−149.121.4−445.864.0
2000–2009462.1−744.7−106.414.3−211.928.5−426.457.3
Huayuankou
(Middle reach)
1987–1999861.6−1281.5−192.215.0−440.334.4−649.050.6
2000–2009735.2−1407.9−174.212.4−615.243.7−618.543.9
2010–2016874.5−1268.6193.2−15.2−828.465.3−633.549.9
Lijin
(Lower reach)
1987–1999474.0−1728.4−207.212.0−471.227.3−1050.160.7
2000–2009446.8−1755.7−175.210.0−670.038.2−910.551.8
2010–2016558.1−1644.3191.5−11.6−841.551.2−994.360.4
Table 6. Sensitivity analysis result under different climate change scenarios.
SectionScenarioToudaoguai
(Upper Reach)
Huayuankou
(Middle Reach)
Lijin
(Lower Reach)
Water Flow
(m3/s)
Sensitivity
(%)
Water Flow
(m3/s)
Sensitivity
(%)
Water Flow
(m3/s)
Sensitivity
(%)
Precipitation changeMeasured precipitation1198.2 2148.6 2227.8
Reduced by 10%1009.7−15.71873.7−12.81937.7−13.0
Increased by 10%1412.017.82454.914.32554.014.6
Temperature changeMeasured temperature1198.2 2148.6 2227.8
Increased by 0.5 °C1171.2−2.22123.0−1.22202.3−1.1
Increased by 1.0 °C1148.1−4.22101.2−2.22180.8−2.1
Table 7. Area of soil and water conservation measures in the middle and upper reaches of the Yellow River Basin from 2000 to 2012 (unit: hm2).
YearTerracePlantationArtificial Grass
20002,989,5835,439,5621,129,242
20013,018,0065,626,1391,180,396
20023,127,1095,942,3151,251,785
20033,187,1736,353,7271,340,012
20043,249,5996,688,0221,400,168
20053,315,3776,930,3511,455,666
20063,376,5767,124,4521,510,179
20073,408,8427,318,9271,510,064
20083,415,1457,383,9691,881,860
20093,423,7307,471,4402,102,674
20103,458,8807,487,9072,330,178
20113,472,4427,222,9392,512,108
20123,493,7377,467,6132,578,059
Publisher’s Note: MDPI stays neutral with regard to jurisdictional claims in published maps and institutional affiliations.

