


Outage Survivability Investigation of a PV/Battery/CHP System in a Hospital Building in Texas


Abstract
:1. Introduction
2. Method
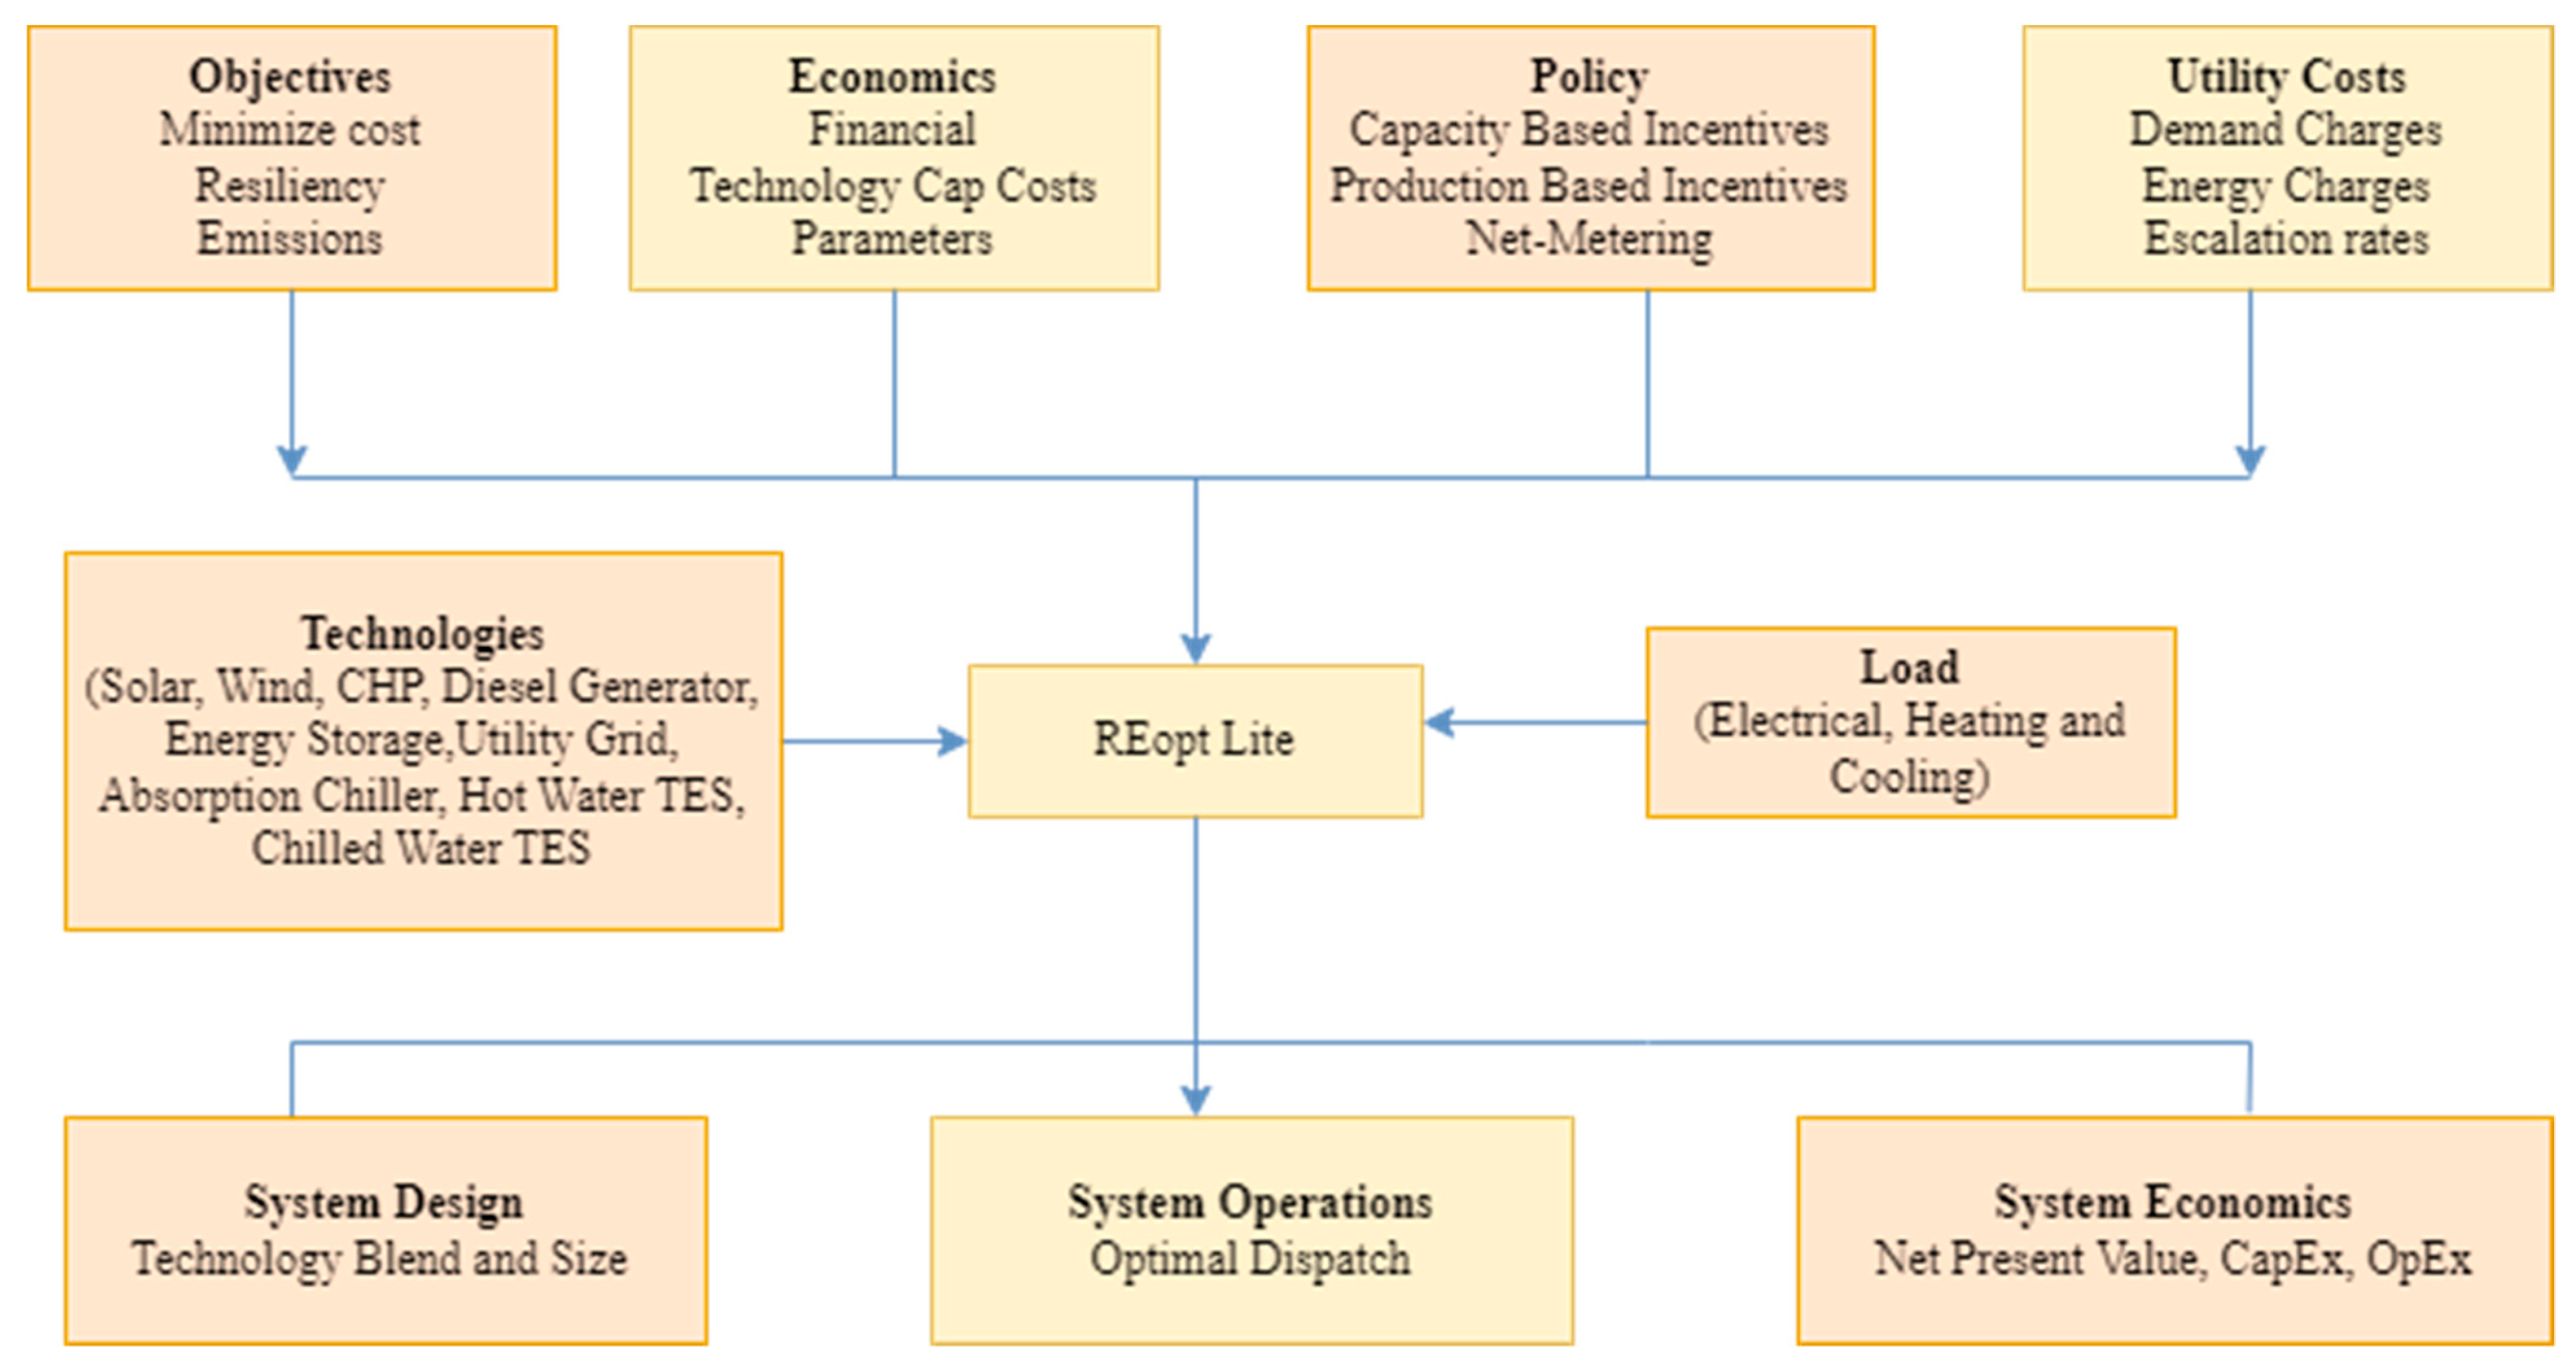
2.1. REopt Lite
2.2. Modelling of the System
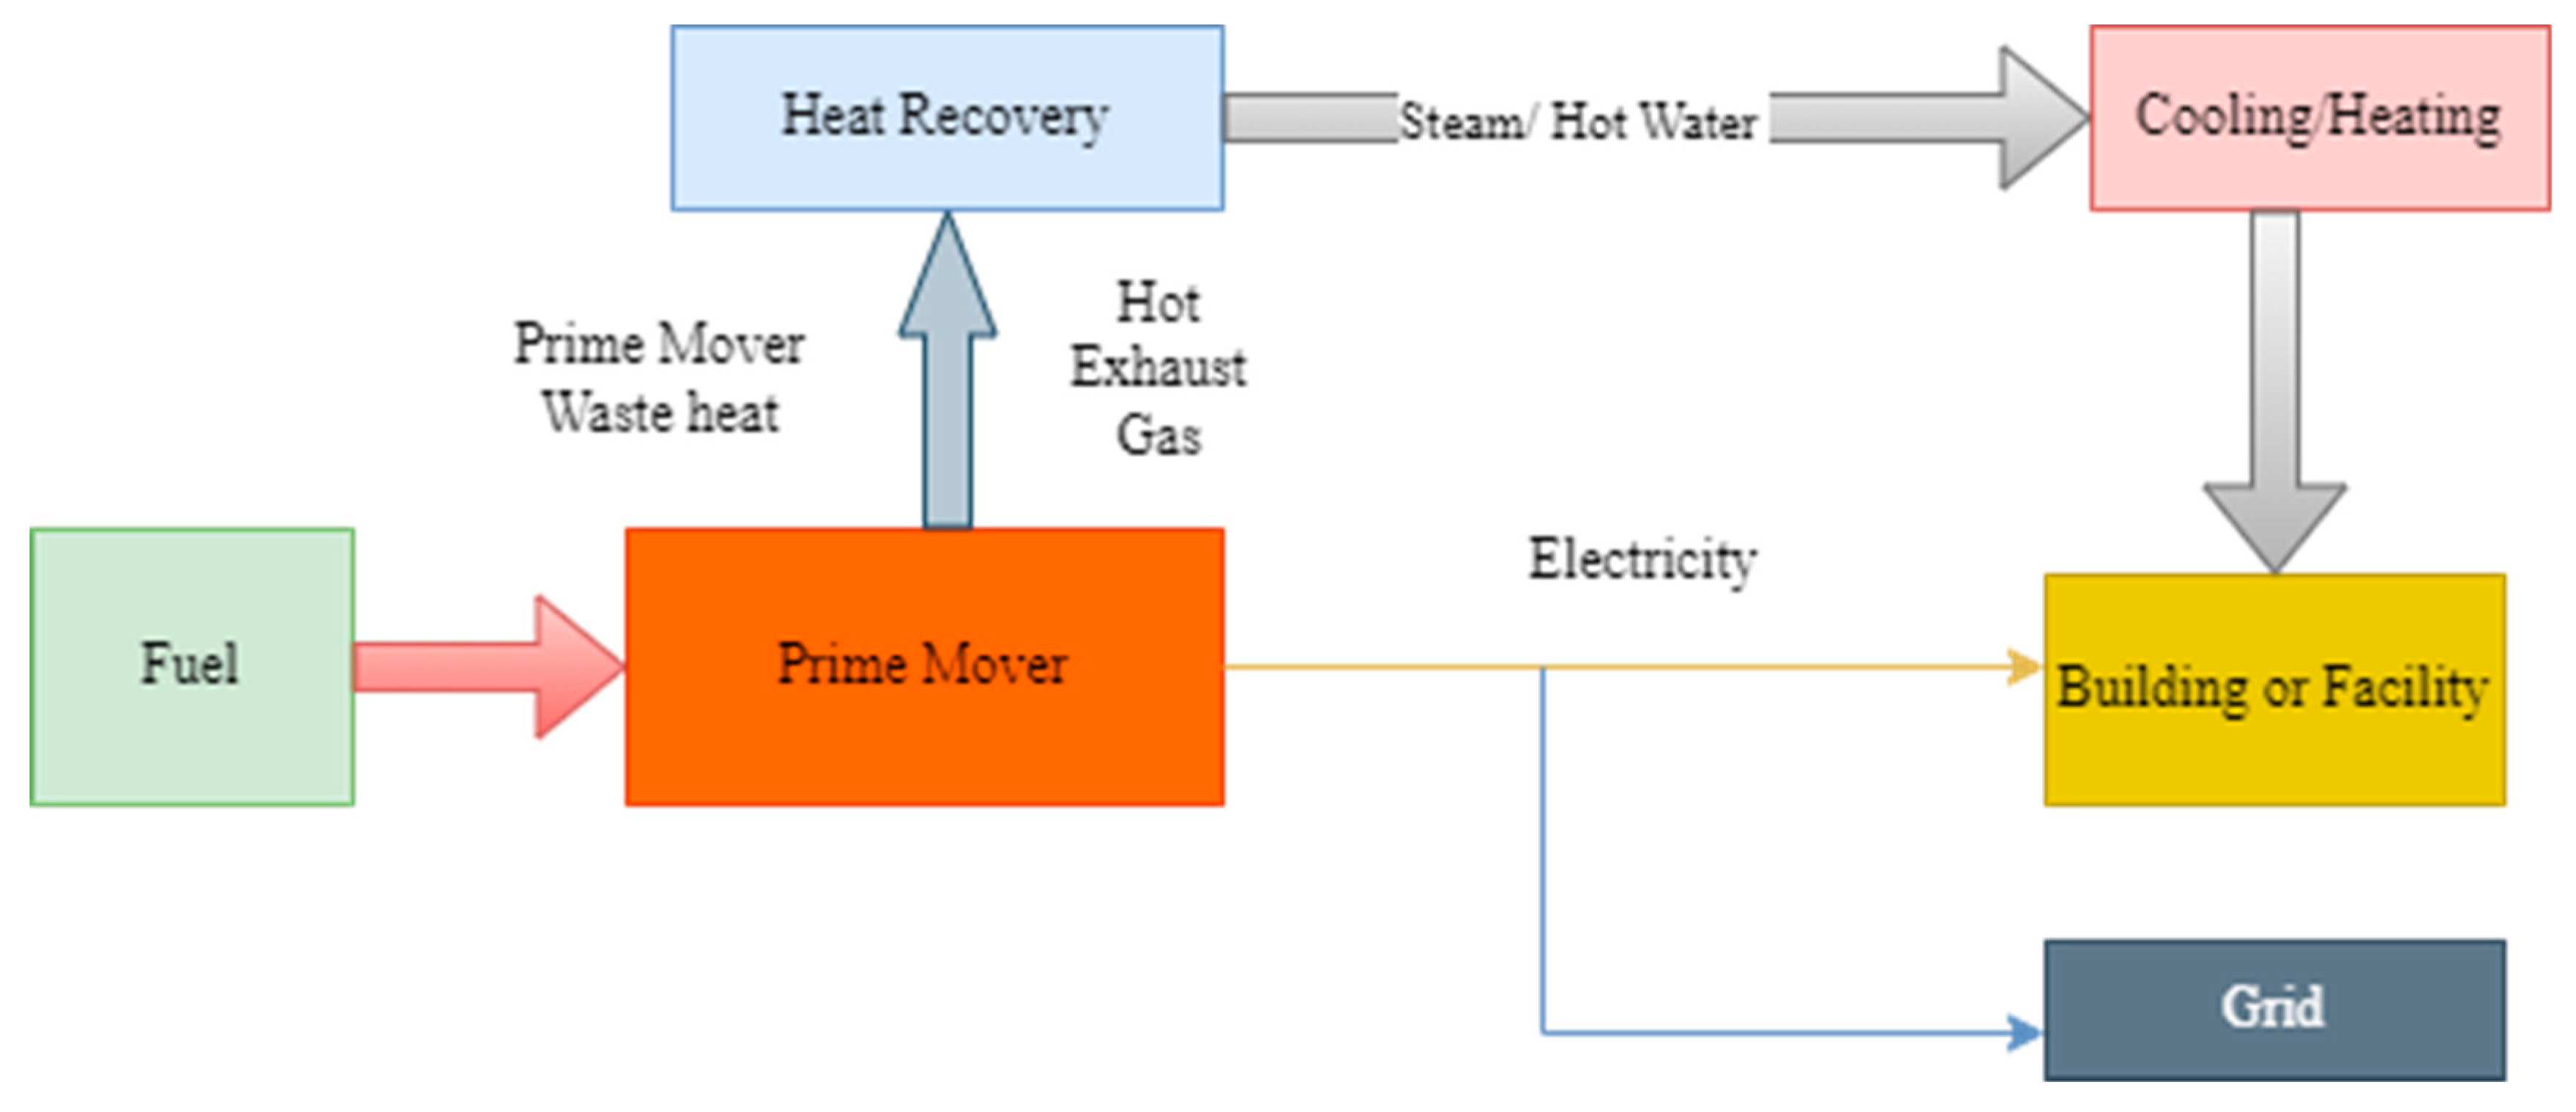
2.2.1. CHP
2.2.2. Battery
2.2.3. Grid
2.2.4. PV Module
2.2.5. Probabilistic Approach
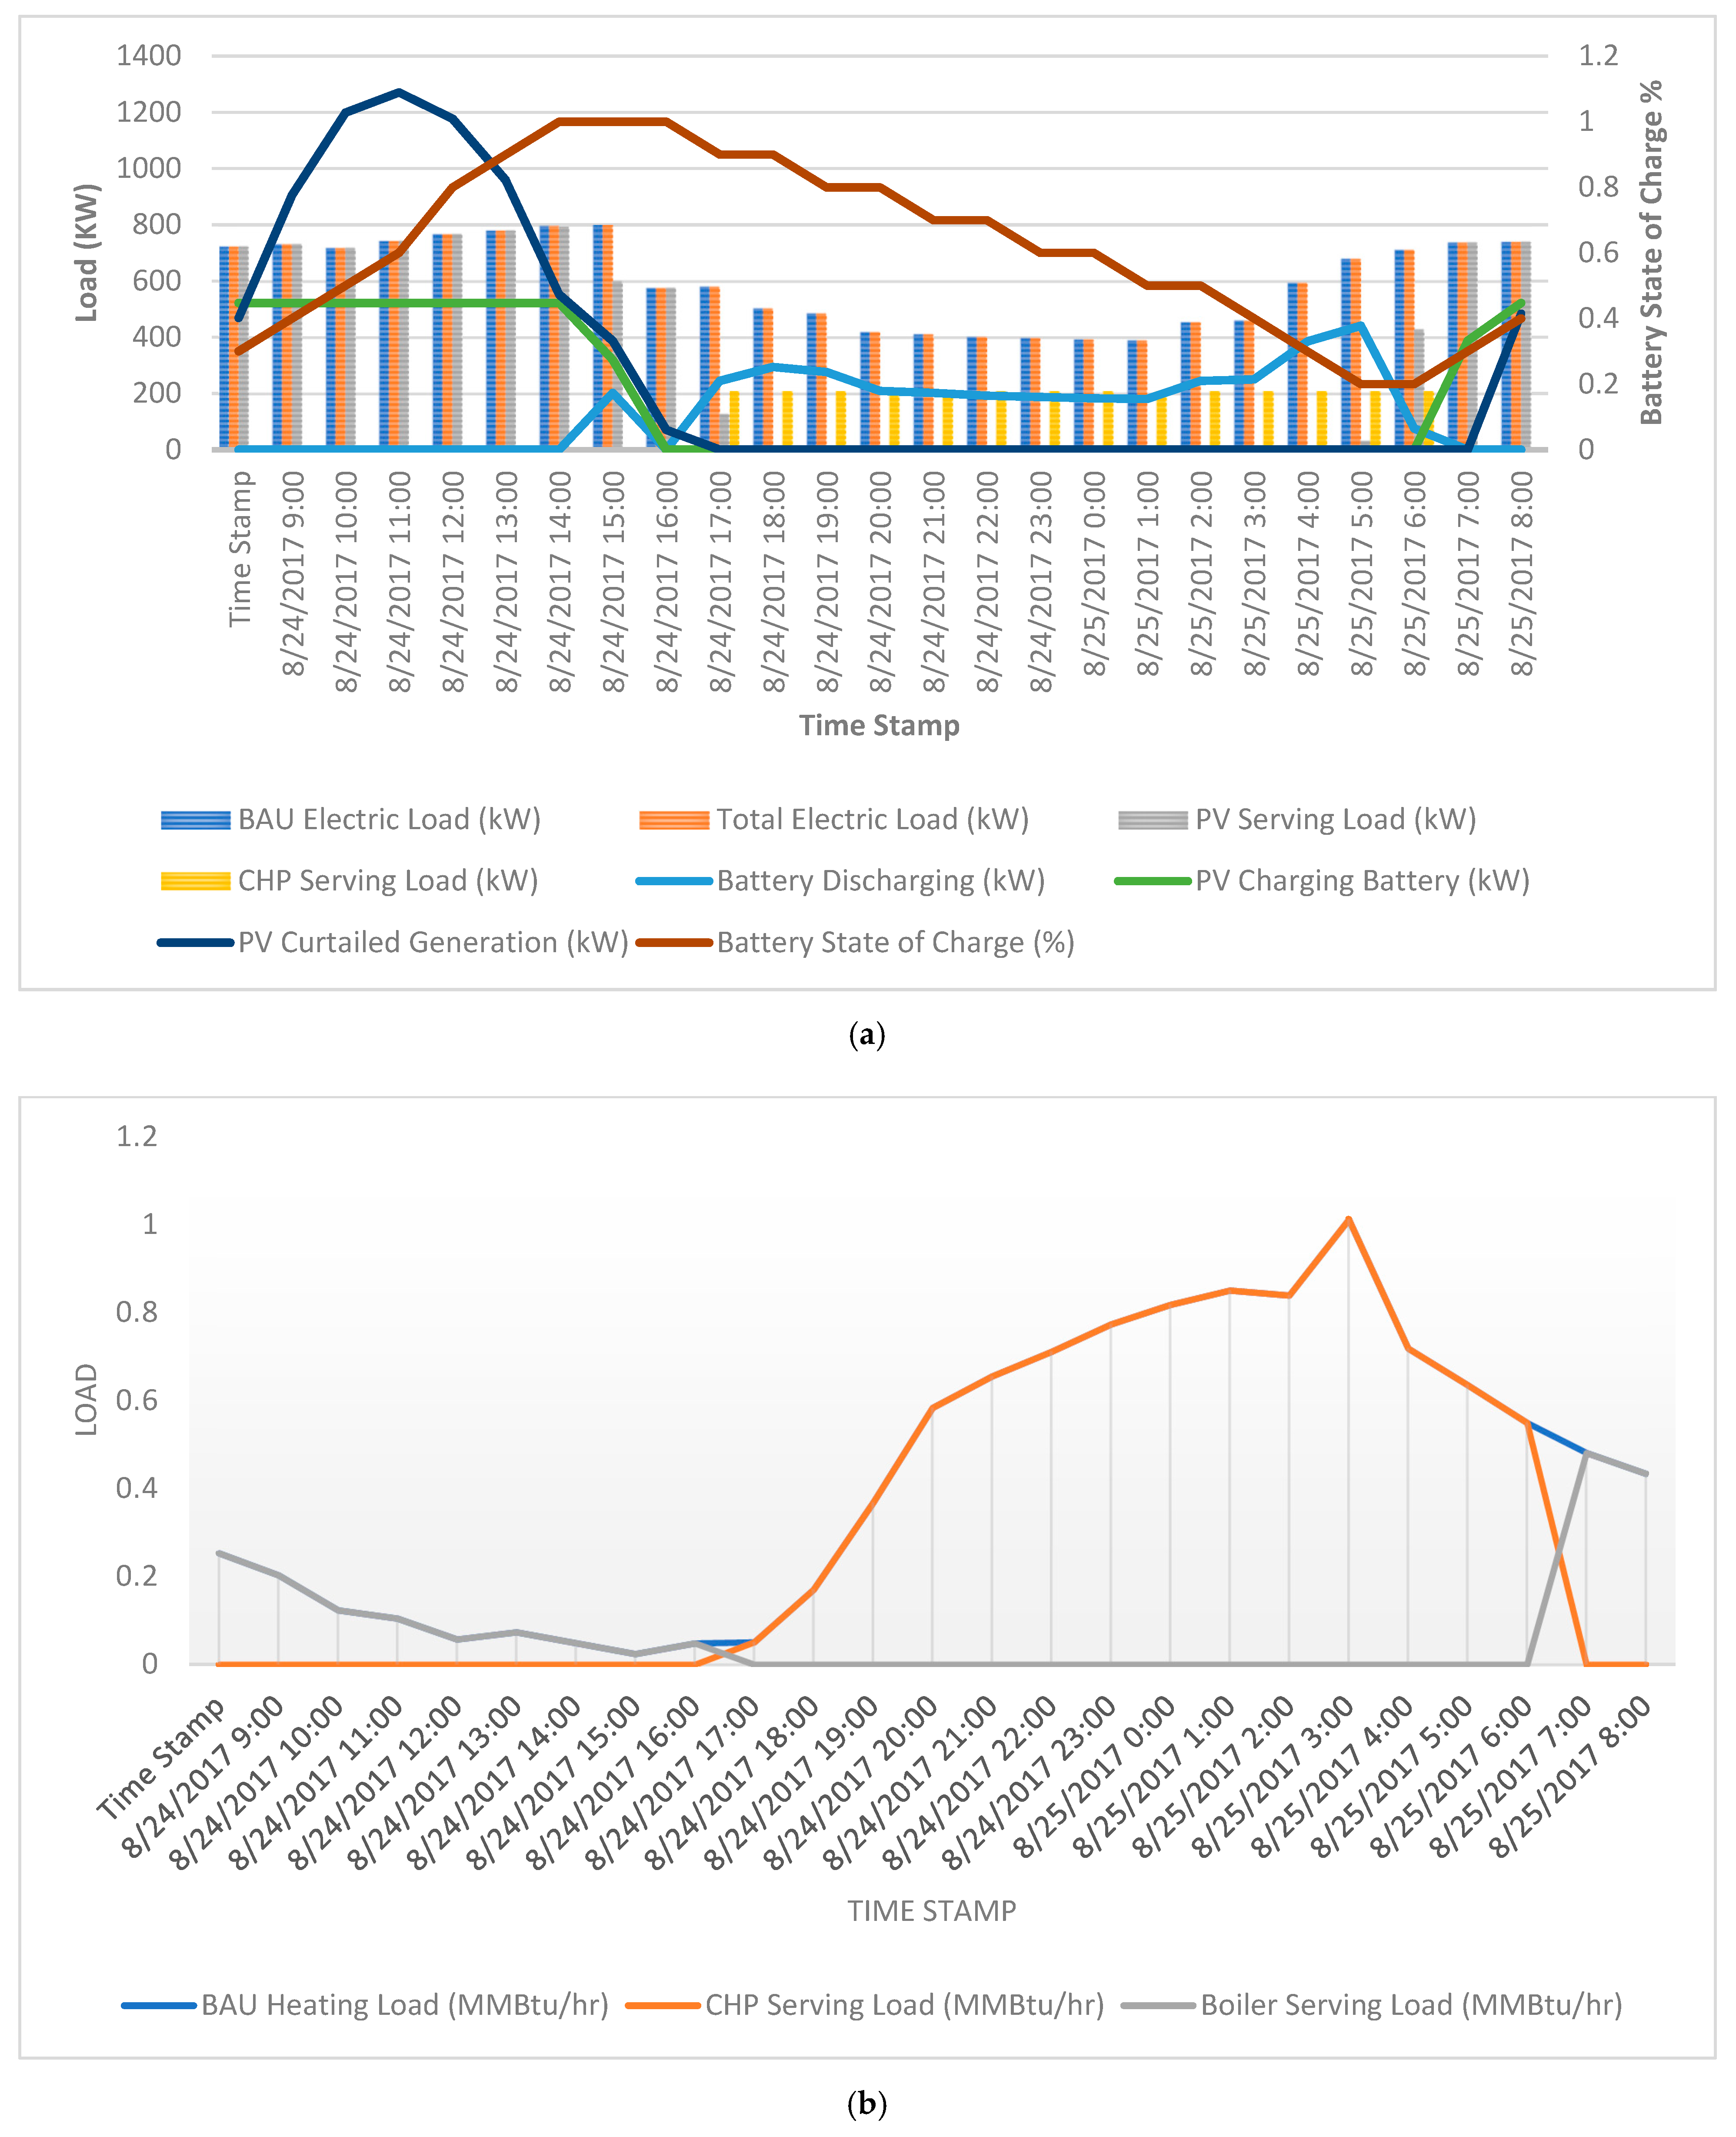
3. Results and Discussions:
4. Conclusions
Author Contributions
Funding
Institutional Review Board Statement
Informed Consent Statement
Data Availability Statement
Conflicts of Interest
Nomenclature
| Abbreviations | |
| DA | Days of autonomy. |
| DOD | Depth of charge of the battery. |
| STC | Standard test condition |
| Parameters | |
| Surface area of the PV module (m2). | |
| Battery capacity (kWh). | |
| Battery system size (kW). | |
| Maximum storage capacity of the battery (kWh). | |
| Minimum state of charge of battery (%). | |
| In a time, step h, power delivered to the battery (kW). | |
| In a time, step h, power dispatched from the battery (kW). | |
| In a time, step h, energy stored in the battery (kW). | |
| Demand cost. | |
| Energy costs. | |
| Cost of operation & maintenance. | |
| Capital cost of PV, battery. | |
| Capital cost for technology t ($/kW). | |
| Electricity cost in time step h ($/kW). | |
| Demand cost for month m. | |
| O&M cost per unit size of the system for technology t ($/kW). | |
| Rated capacity of PV array (kW). | |
| Demand cost for ratchet r. | |
| Capital cost of battery per kWh ($/kWh). | |
| Capital cost of storage inverter per kW ($/kW). | |
| Derating factor of solar PV array. | |
| Monthly peak demand for month m (kW). | |
| Peak demand in ratchet r (kW). | |
| Average energy demand (kWh/day). | |
| Hourly capacity factor for demand d for energy technology t in time step h at locations s (unitless). | |
| Degradation factor for technology t (unitless). | |
| Production factor for technology t, serving load l, in timestep h (unitless). | |
| Fixed fuel consumption. | |
| Varying fuel usage. | |
| Consumption rate of the fuel, i.e., natural gas. | |
| Solar irradiation on the PV panel’s surface (kW/m2). | |
| Solar irradiation under STC. | |
| Production size restriction for load l in time step h(kW). | |
| Capacity of net metering level v at location s. | |
| Electric power generation from the CHP unit. | |
| Pg | Grid power. |
| Load power demand. | |
| , and | Power supplied by the corresponding energy sources. |
| Rated production of technology t, serving load l. in timestep h (kW). | |
| Heat power generation from the CHP unit. | |
| R | Both the fuel burn rate and available usable heat for electric (e) and heat generation (h). |
| Temperature under STC. | |
| PV cell temperature in the current time step (°C). | |
| System size for energy technology. | |
| 1 if the technology is active, else 0. | |
| 1 if location s is operated at the Net metering level v; otherwise, 0. | |
| Temperature coefficient of power (%/degree C). | |
| Efficiency of converter and battery. | |
| Efficiency of the PV module under STC (%). | |
| Efficacy of the roundtrip inverter. | |
| Electric recovery efficiency of the CHP plant. | |
| Heat recovery efficiency of the CHP plant. | |
| Sets | |
| Set of energy technologies (solar PV = PV and G = grid). | |
| Set of all ratchets. | |
| Set of all months. | |
| Set of time steps | |
| Set of loads, for site load, for Battery load, for export. | |
| Set of net metering levels. | |
| u ∈ U | Set of fuel bin. |
| Set of all locations. | |
References
- Increase in Natural Disasters on a Global Scale by Ten Times. Available online: https://www.visionofhumanity.org/global-number-of-natural-disasters-increases-ten-times/ (accessed on 22 March 2022).
- Natural Disasters Skyrocket in Texas. Available online: https://spectrumlocalnews.com/tx/south-texas-el-paso/news/2022/04/20/natural-disasters-skyrocket-in-texas (accessed on 1 October 2022).
- Littlechild, S.; Kiesling, L. Hayek and the Texas blackout. Electr. J. 2021, 34, 106969. [Google Scholar] [CrossRef]
- Schaefer, J.L.; Siluk, J.C.M.; de Carvalho, P.S. An MCDM-based approach to evaluate the performance objectives for strategic management and development of Energy Cloud. J. Clean. Prod. 2021, 320, 128853. [Google Scholar] [CrossRef]
- Schaefer, J.; Siluk, J.; Carvalho, P.; Pinheiro, J.R.; Schneider, P. Management Challenges and Opportunities for Energy Cloud Development and Diffusion. Energies 2020, 13, 4048. [Google Scholar] [CrossRef]
- Kemabonta, T. Grid Resilience analysis and planning of electric power systems: The case of the 2021 Texas electricity crises caused by winter storm Uri (#TexasFreeze). Electr. J. 2021, 34, 107044. [Google Scholar] [CrossRef]
- Allahvirdizadeh, Y.; Moghaddam, M.P.; Shayanfar, H. A survey on cloud computing in energy management of the smart grids. Int. Trans. Electr. Energy Syst. 2019, 29, e12094. [Google Scholar] [CrossRef]
- Masrur, H.; Gamil, M.M.; Islam, R.; Muttaqi, K.M.; Lipu, M.S.H.; Senjyu, T. An Optimized and Outage-Resilient Energy Management Framework for Multicarrier Energy Microgrids Integrating Demand Response. IEEE Trans. Ind. Appl. 2022, 58, 4171–4180. [Google Scholar] [CrossRef]
- Ogunmodede, O.; Anderson, K.; Cutler, D.; Newman, A. Optimizing design and dispatch of a renewable energy system. Appl. Energy 2021, 287, 116527. [Google Scholar] [CrossRef]
- McLaren, J.; Laws, N.; Anderson, K.; DiOrio, N.; Miller, H. Solar-plus-storage economics: What works where, and why? Electr. J. 2019, 32, 28–46. [Google Scholar] [CrossRef]
- Marqusee, J.; Becker, W.; Ericson, S. Resilience and economics of microgrids with PV, battery storage, and networked diesel generators. Adv. Appl. Energy 2021, 3, 100049. [Google Scholar] [CrossRef]
- Hussain, A.; Bui, V.-H.; Kim, H.-M. Resilience-Oriented Optimal Operation of Networked Hybrid Microgrids. IEEE Trans. Smart Grid 2017, 10, 204–215. [Google Scholar] [CrossRef]
- Khodaei, A. Resiliency-Oriented Microgrid Optimal Scheduling. IEEE Trans. Smart Grid 2014, 5, 1584–1591. [Google Scholar] [CrossRef]
- Lagrange, A.; de Simón-Martín, M.; González-Martínez, A.; Bracco, S.; Rosales-Asensio, E. Sustainable microgrids with energy storage as a means to increase power resilience in critical facilities: An application to a hospital. Int. J. Electr. Power Energy Syst. 2020, 119, 105865. [Google Scholar] [CrossRef]
- Laws, N.D.; Anderson, K.; DiOrio, N.A.; Li, X.; McLaren, J. Impacts of valuing resilience on cost-optimal PV and storage systems for commercial buildings. Renew. Energy 2018, 127, 896–909. [Google Scholar] [CrossRef]
- Rosales-Asensio, E.; de Simón-Martín, M.; Borge-Diez, D.; Blanes-Peiró, J.J.; Colmenar-Santos, A. Microgrids with energy storage systems as a means to increase power resilience: An application to office buildings. Energy 2019, 172, 1005–1015. [Google Scholar] [CrossRef]
- Anderson, K.; Grymes, J.; Newman, A.; Warren, A. North Carolina Water Utility Builds Resilience with Distributed Energy Sources. Inf. J. Appl. Anal. 2022. [Google Scholar] [CrossRef]
- Anderson, K.; Farthing, A.; Elgqvist, E.; Warren, A. Looking beyond bill savings to equity in renewable energy microgrid deployment. Renew. Energy Focus 2022, 41, 15–32. [Google Scholar] [CrossRef]
- Hervás-Zaragoza, J.; Colmenar-Santos, A.; Rosales-Asensio, E.; Colmenar-Fernández, L. Microgrids as a mechanism for improving energy resilience during grid outages: A post COVID-19 case study for hospitals. Renew. Energy 2022, 199, 308–319. [Google Scholar] [CrossRef]
- Sepúlveda-Mora, S.B.; Hegedus, S. Resilience analysis of renewable microgrids for commercial buildings with different usage patterns and weather conditions. Renew. Energy 2022, 192, 731–744. [Google Scholar] [CrossRef]
- Masrur, H.; Islam, R.; Muttaqi, K.M.; Gamil, M.M.; Huang, Y.; Senjyu, T. Resilience-aware Optimal Design and Energy Management Scheme of Multi-energy Microgrids. In Proceedings of the 2021 IEEE Industry Applications Society Annual Meeting (IAS), Vancouver, BC, Canada, 10–14 October 2021; Institute of Electrical and Electronics Engineers Inc.: Piscataway, NJ, USA, 2022; pp. 1–5. [Google Scholar] [CrossRef]
- REopt Mathematical Model Documentation. Available online: https://github.com/NREL/REopt_API/wiki/REopt-Mathematical-Model-Documentation (accessed on 17 March 2022).
- Das, B.K.; Al-Abdeli, Y.M.; Kothapalli, G. Integrating renewables into stand-alone hybrid systems meeting electric, heating, and cooling loads: A case study. Renew. Energy 2021, 180, 1222–1236. [Google Scholar] [CrossRef]
- Hossain, A.; Pota, H.R.; Squartini, S.; Abdou, A.F. Modified PSO algorithm for real-time energy management in grid-connected microgrids. Renew. Energy 2019, 136, 746–757. [Google Scholar] [CrossRef]
- Mishra, S.; Anderson, K. Probabilistic Resilience of DER Systems—A Simulation Assisted Optimization Approach. In Proceedings of the 2021 IEEE Power & Energy Society Innovative Smart Grid Technologies Conference (ISGT), Washington, DC, USA, 16–18 February 2021; Institute of Electrical and Electronics Engineers Inc.: Piscataway, NJ, USA, 2021; pp. 1–5. [Google Scholar] [CrossRef]
- Arefin, A.A.; Masrur, H.; Othman, M.L.; Hizam, H.; Wahab, N.I.A.; Jalaluddin, N.A.; Islam, S.Z. Power Resilience Enhancement of a PV- Battery-Diesel Microgrid. In Proceedings of the 2020 International Conference on Smart Grids and Energy Systems (SGES), Perth, Australia, 23–26 November 2020; Institute of Electrical and Electronics Engineers Inc.: Piscataway, NJ, USA, 2021; pp. 860–863. [Google Scholar] [CrossRef]
- Masrur, H.; Sharifi, A.; Islam, R.; Hossain, A.; Senjyu, T. Optimal and economic operation of microgrids to leverage resilience benefits during grid outages. Int. J. Electr. Power Energy Syst. 2021, 132, 107137. [Google Scholar] [CrossRef]


| Parameters | Business as Usual (BaU) | Resilience | Financial |
|---|---|---|---|
| Average Annual PV Energy Production | - | 6,138,498 kWh | 4,288,000 kWh |
| Average Annual Energy Supplied from Grid | 8,981,110 kWh | 2,763,060 kWh | 4,096,295 kWh |
| CHP Electric Production | - | 1,344,622 kWh | 1,379,199 kWh |
| CHP Thermal Production | - | 5279 MMBtu | 5386 MMBtu |
| Total CO2 Emissions in Year 1 | 5919 tons | 2587 tons | 3409 tons |
| Lifecycle Costs of Climate Emissions | $549,080 | $987,294 | $1,000,613 |
| Lifecycle Costs of Health Emissions | $1,453,936 | $553,077 | $785,572 |
| Utility Energy Cost | $664,602 | $204,466 | $303,126 |
| Total Life Cycle Costs | $7,961,543 | $6,954,339 | $5,465,994 |
| Payback Period | N/A | 11.86 years | 3.69 years |
| Internal Rate of Return | N/A | 8.7% | 24.6% |
| Parameter | Business as Usual (BaU) | Resilience | Financial |
|---|---|---|---|
| System | None | 3933 kW PV 522 kW Battery with 4441 kWh capacity 208 kW CHP | 2747 kW PV 168 kW CHP |
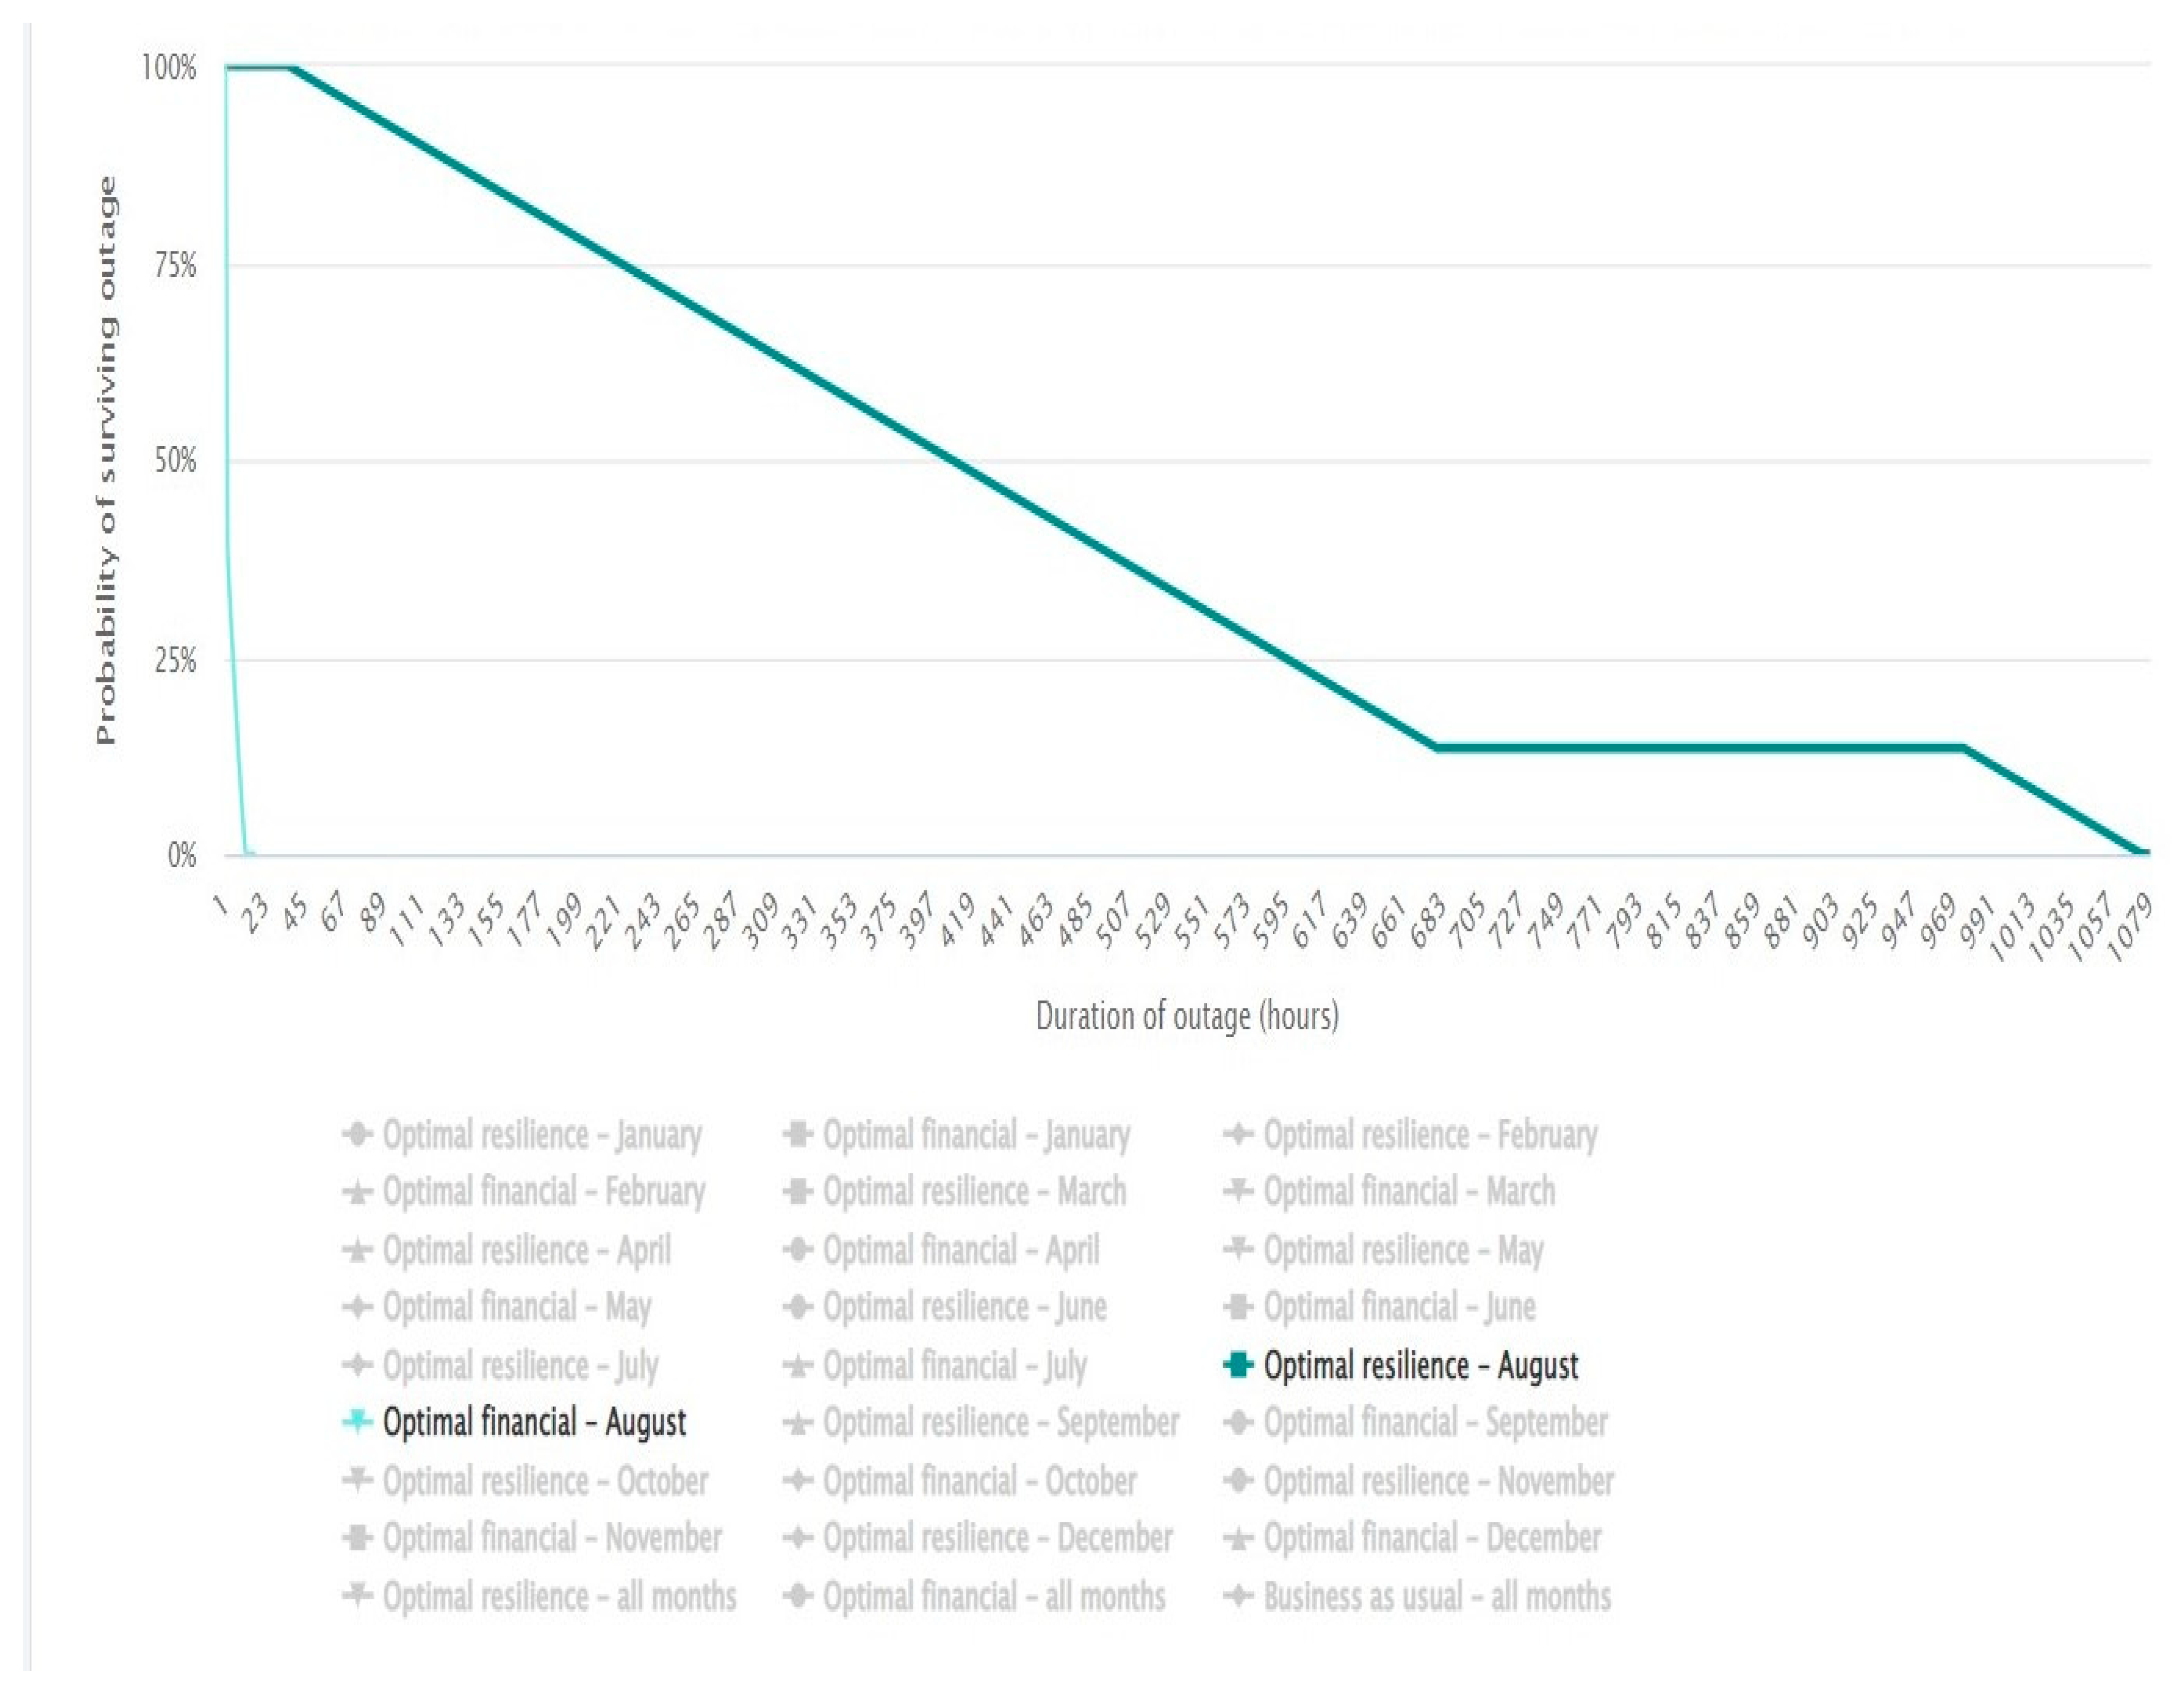
| Survive specific outage | No | Yes | No |
| Average | 0 | 7919 h | 2 |
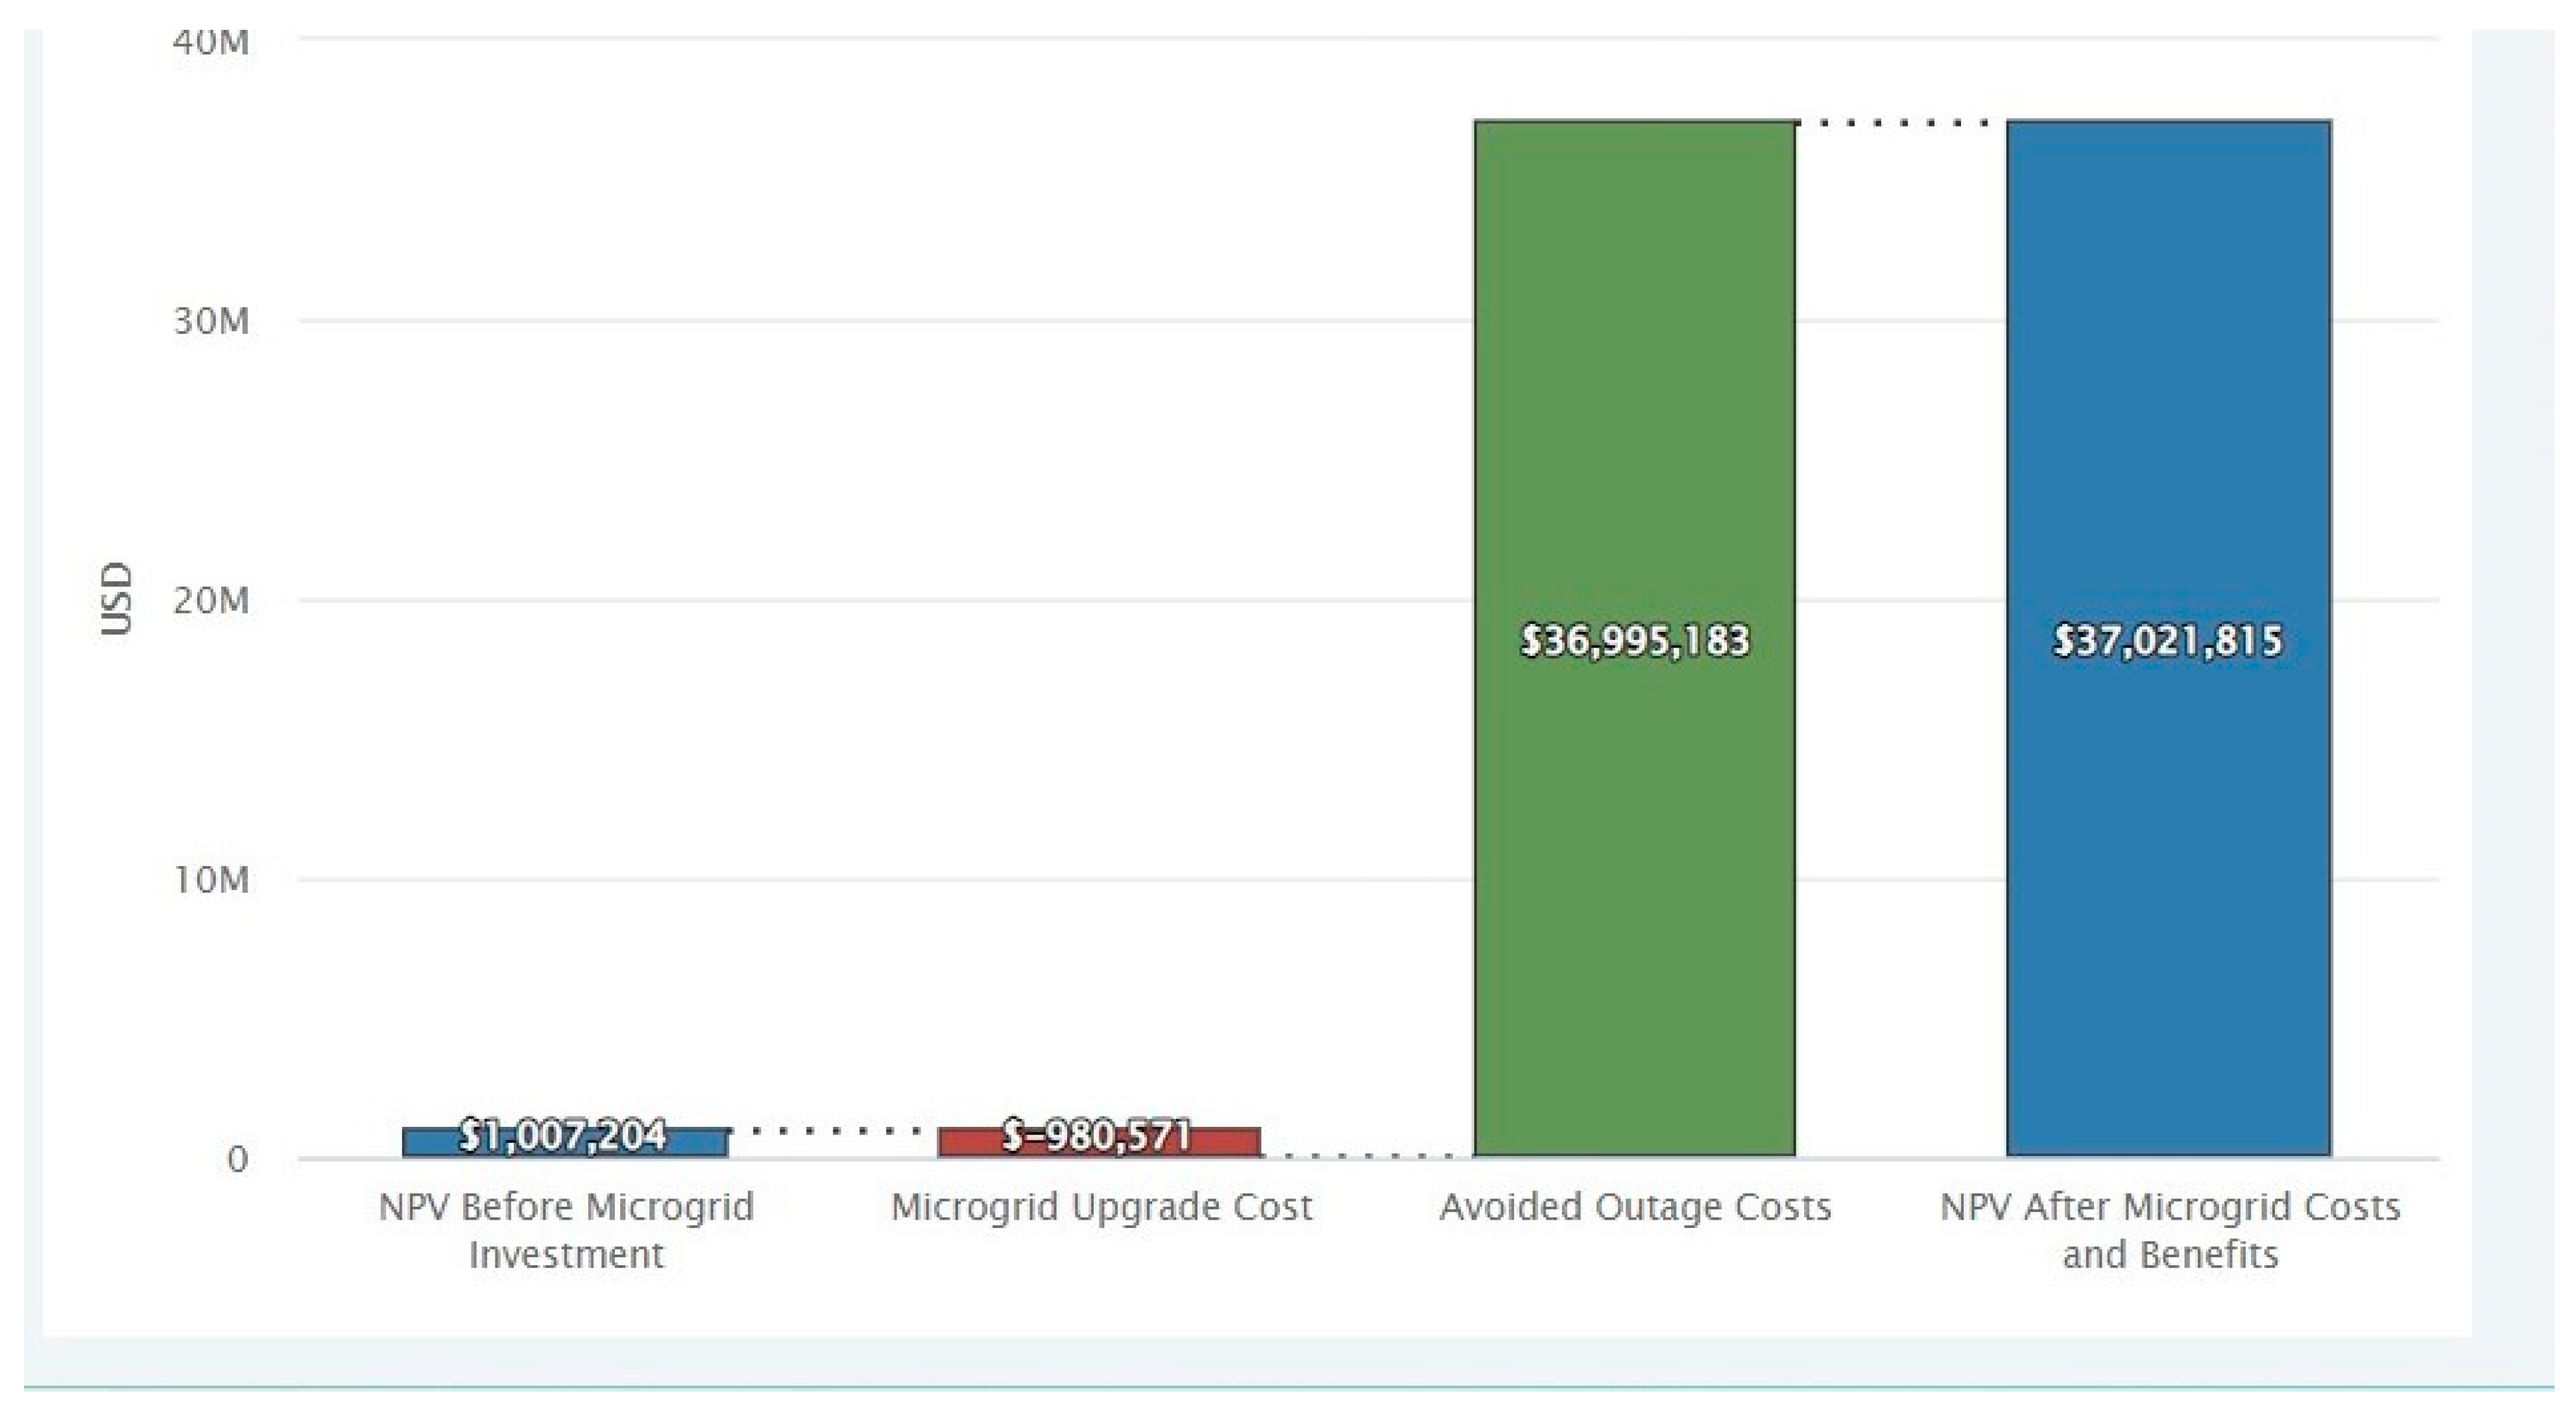
| NPV | 0 | $1,007,204 | $2,522,075 |
Publisher’s Note: MDPI stays neutral with regard to jurisdictional claims in published maps and institutional affiliations. |
© 2022 by the authors. Licensee MDPI, Basel, Switzerland. This article is an open access article distributed under the terms and conditions of the Creative Commons Attribution (CC BY) license (https://creativecommons.org/licenses/by/4.0/).
Share and Cite
Islam, K.S.; Hasan, S.; Chowdhury, T.; Chowdhury, H.; Sait, S.M. Outage Survivability Investigation of a PV/Battery/CHP System in a Hospital Building in Texas. Sustainability 2022, 14, 14965. https://doi.org/10.3390/su142214965
Islam KS, Hasan S, Chowdhury T, Chowdhury H, Sait SM. Outage Survivability Investigation of a PV/Battery/CHP System in a Hospital Building in Texas. Sustainability. 2022; 14(22):14965. https://doi.org/10.3390/su142214965
Chicago/Turabian StyleIslam, Kazi Sifatul, Samiul Hasan, Tamal Chowdhury, Hemal Chowdhury, and Sadiq M. Sait. 2022. "Outage Survivability Investigation of a PV/Battery/CHP System in a Hospital Building in Texas" Sustainability 14, no. 22: 14965. https://doi.org/10.3390/su142214965
APA StyleIslam, K. S., Hasan, S., Chowdhury, T., Chowdhury, H., & Sait, S. M. (2022). Outage Survivability Investigation of a PV/Battery/CHP System in a Hospital Building in Texas. Sustainability, 14(22), 14965. https://doi.org/10.3390/su142214965