
Unlocking New Value from Urban Biowaste: LCA of the VALUEWASTE Biobased Products


Abstract
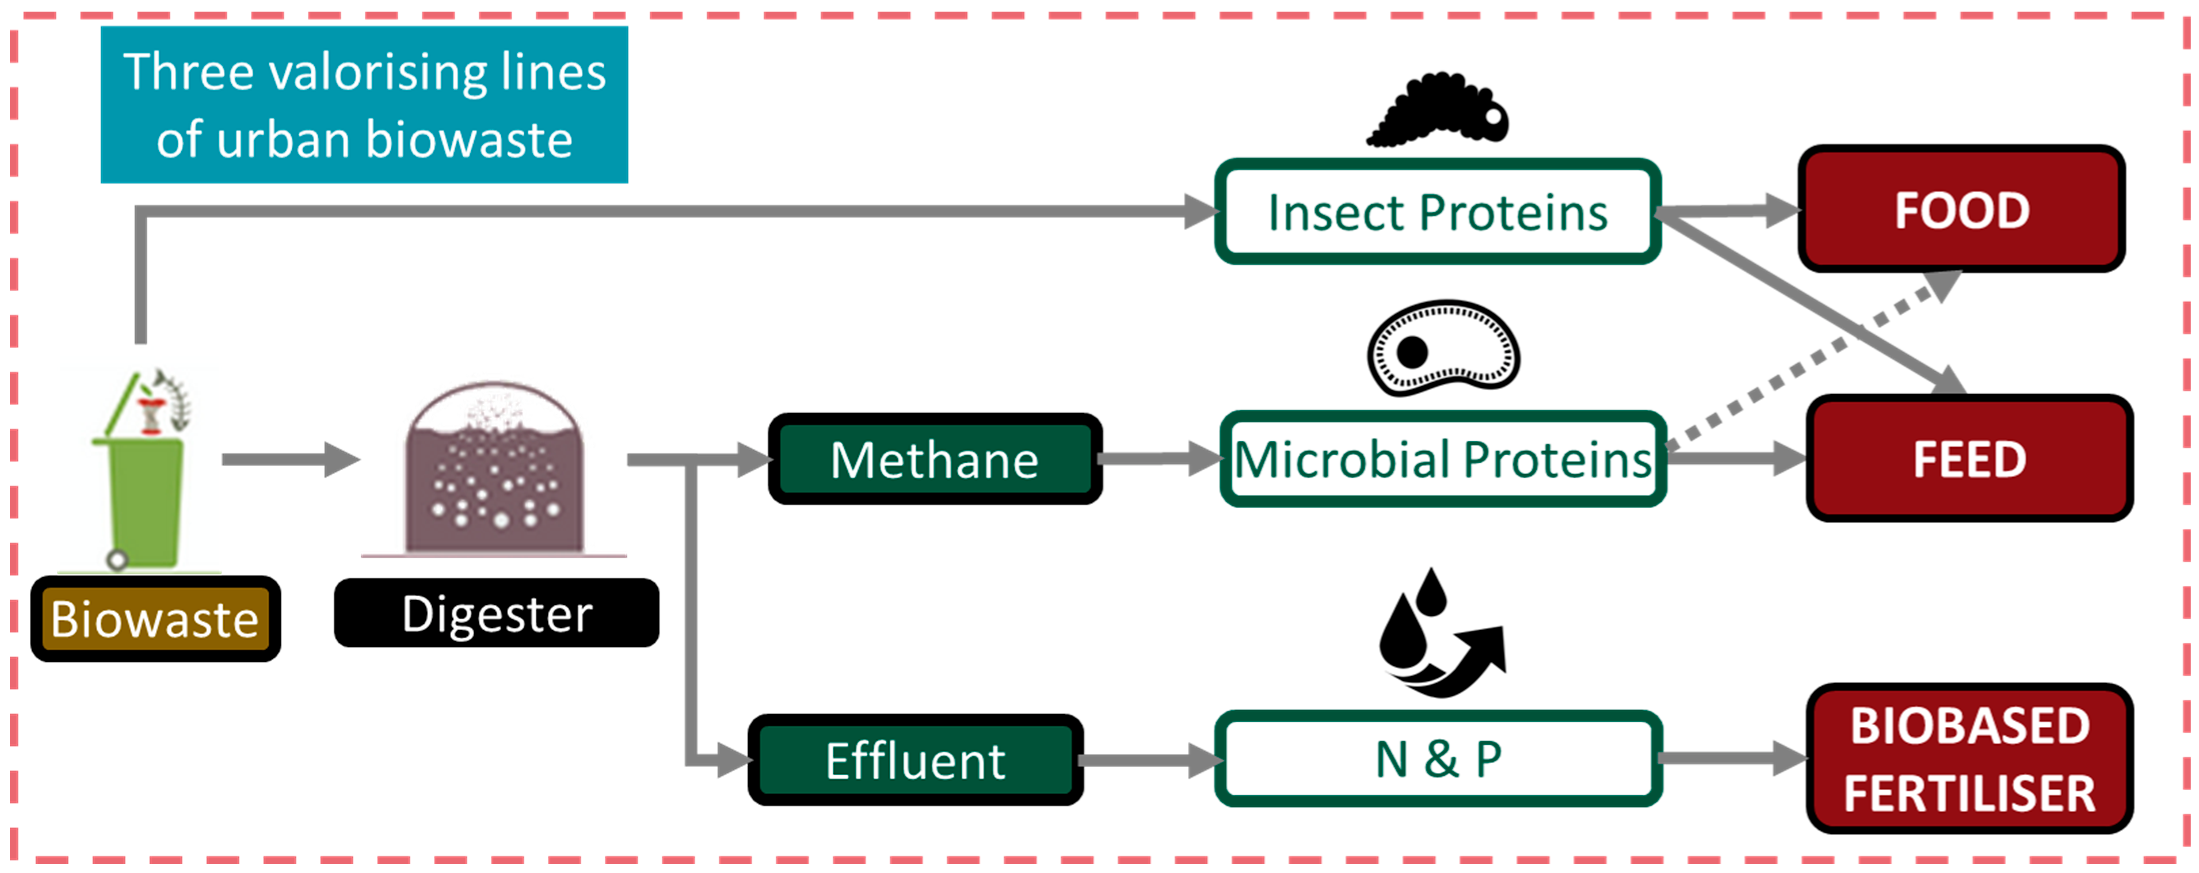
1. Introduction
2. Materials and Methods
2.1. Life Cycle Assessment (LCA)
2.1.1. Goal and Scope Definition
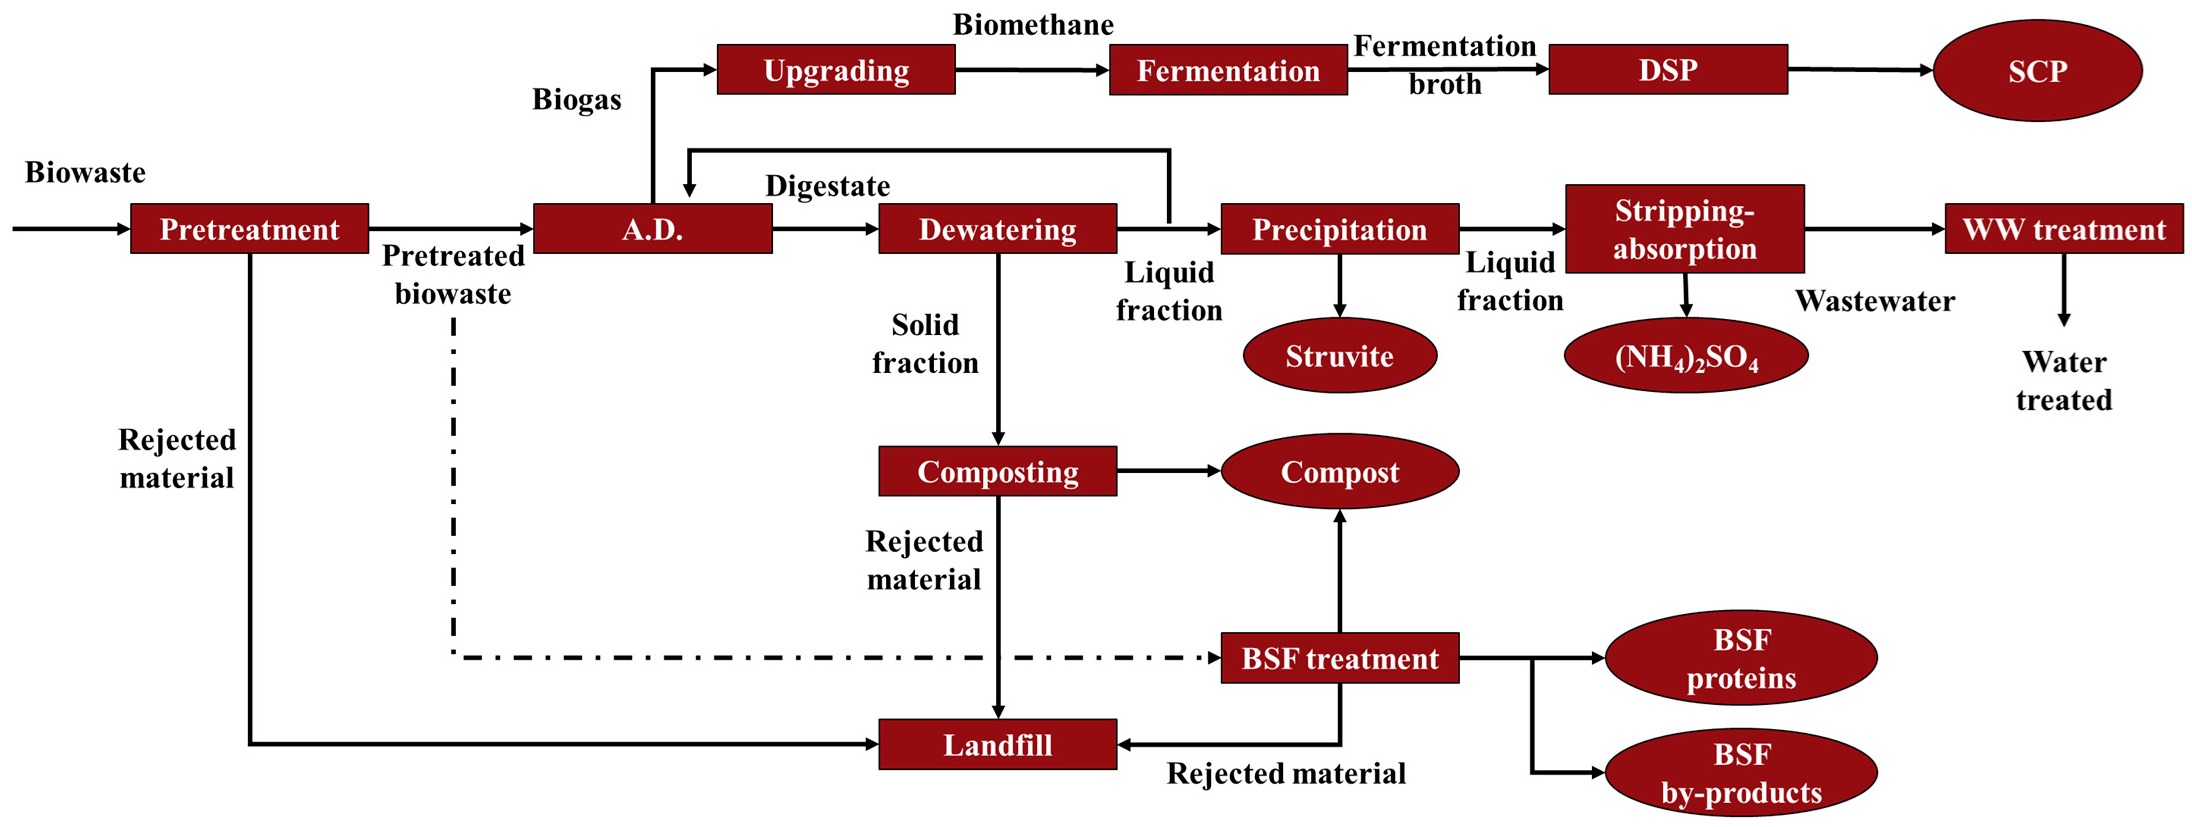
2.1.2. Life Cycle Inventory
2.1.3. Life Cycle Impact Assessment
3. Results and Discussion
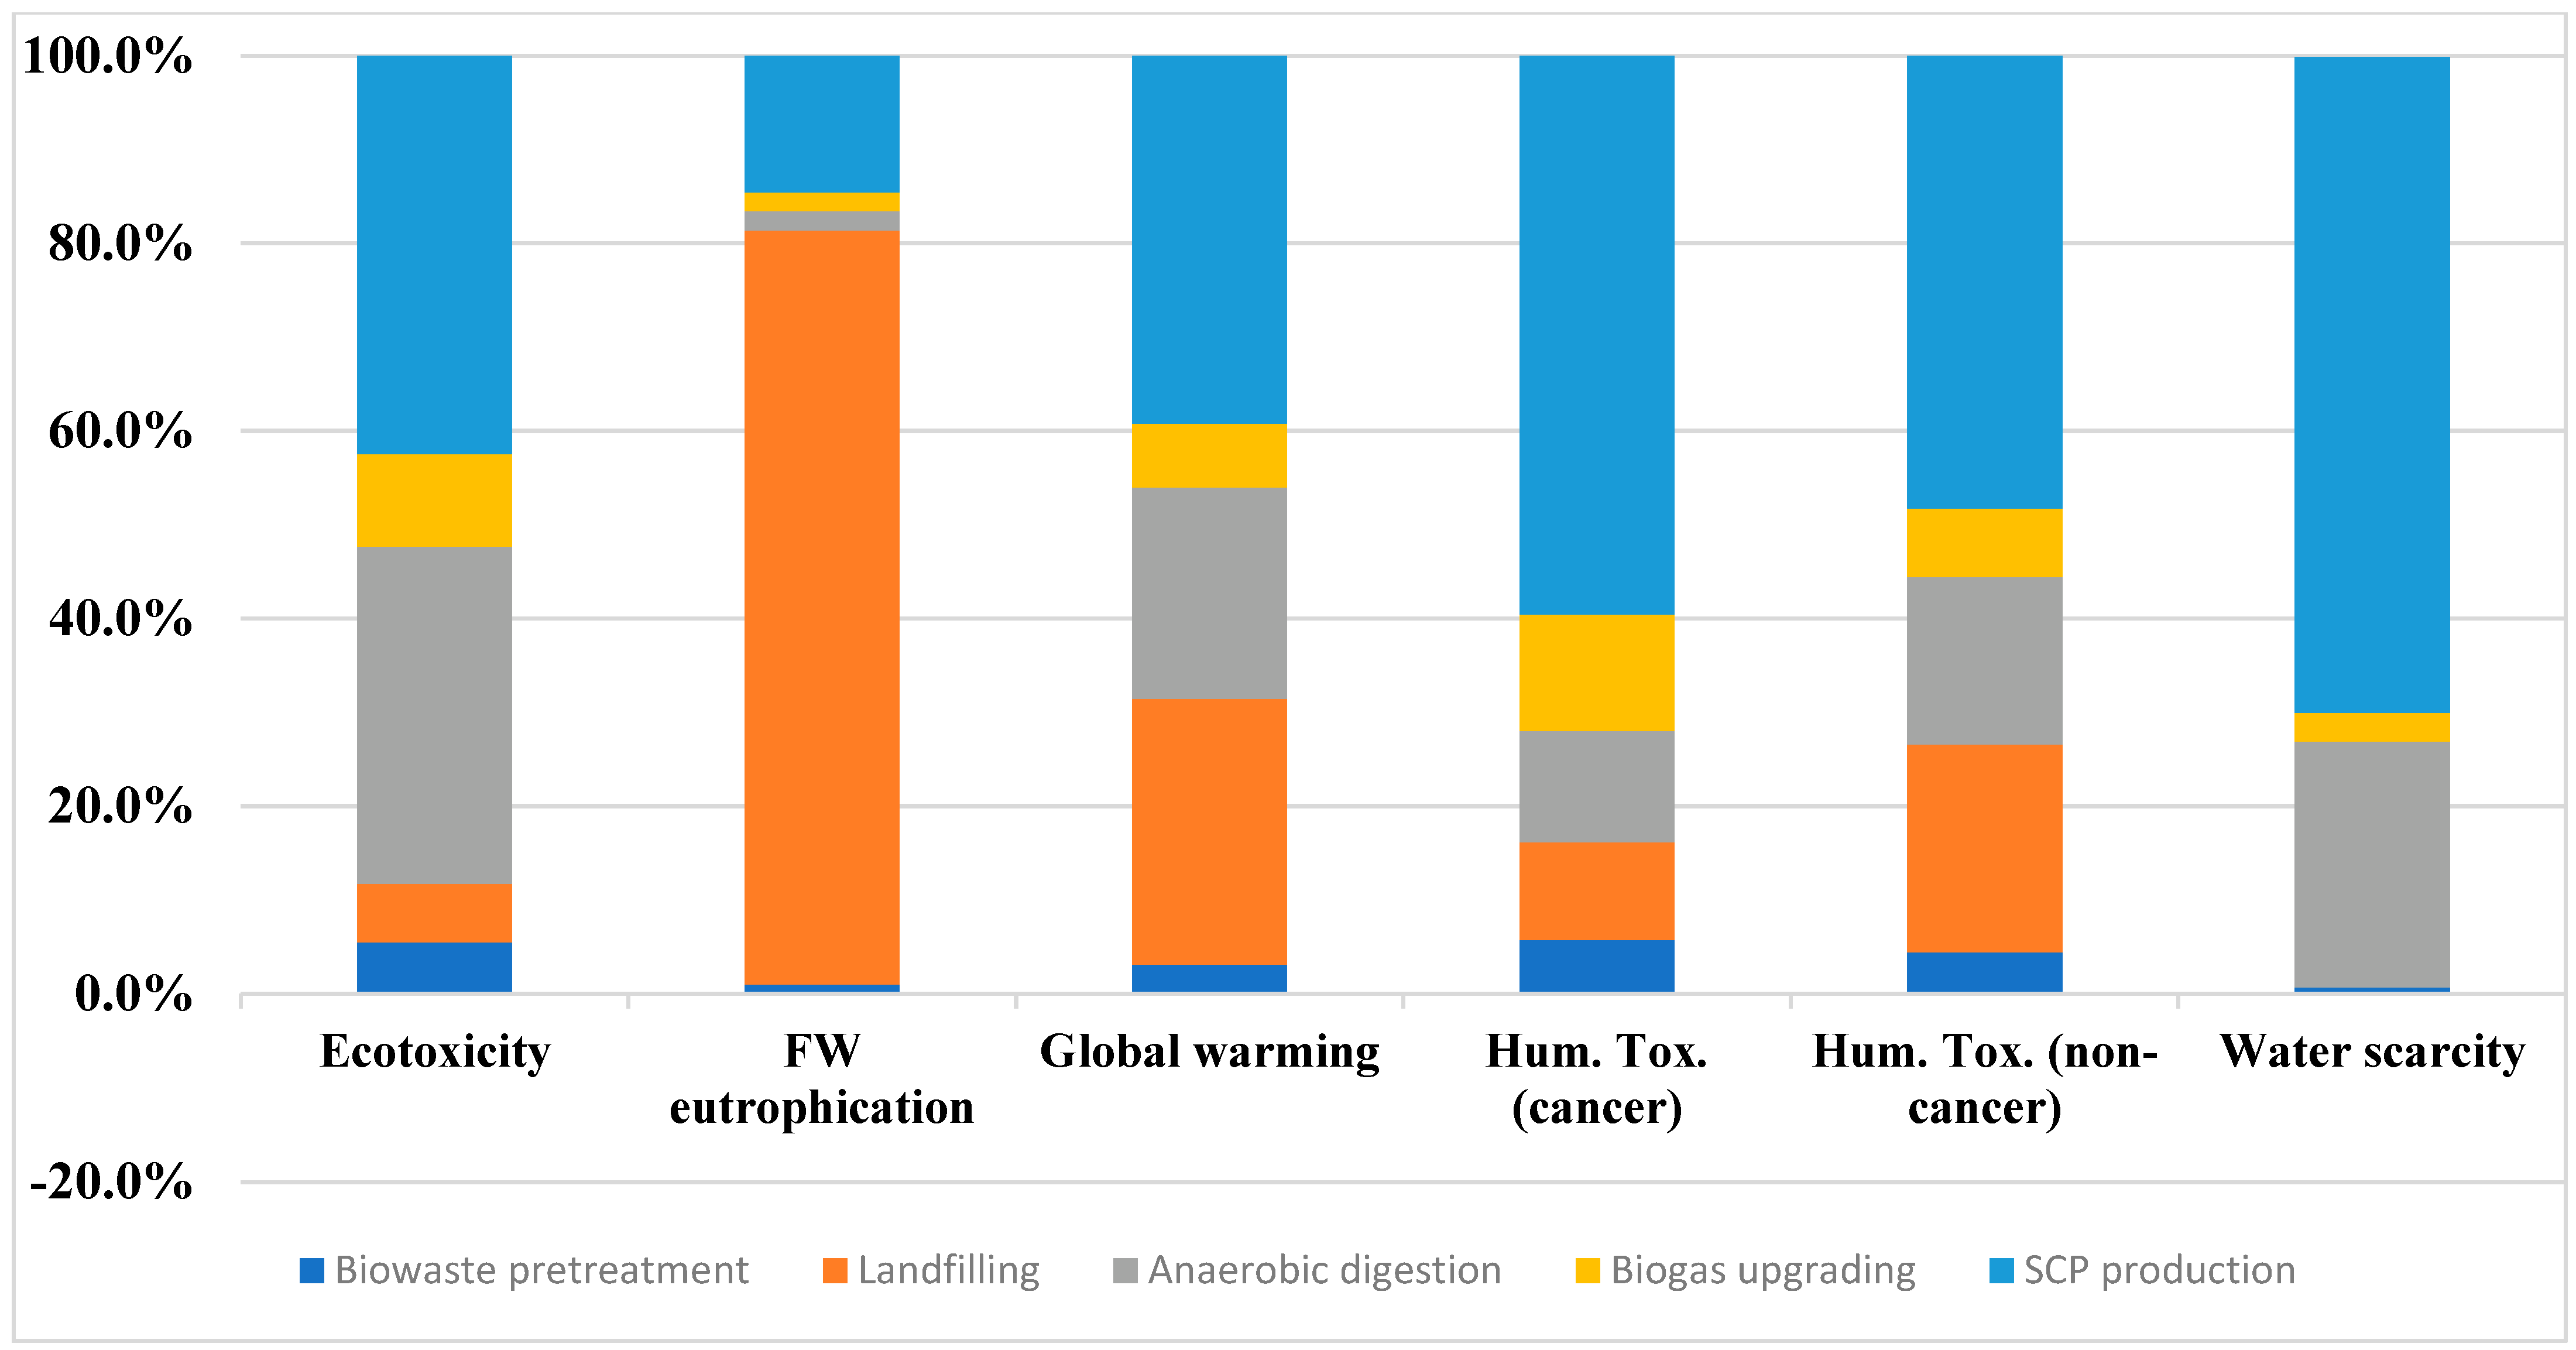
3.1. Production of Proteins from Single Cells
- For instance, the ecotoxicity was about 2.5-fold higher for the SCP production compared to the proteins coming from gluten feed and fish meal.
- Compared to gluten feed, the SCP production was about 3-fold lower in the human toxicity (non-cancer).
- Moreover, it was practically equal compared to soybean meal within the human toxicity (cancer) category.
- On the other hand, the production of SCP provided a between 3- and 6-times lower impact on water scarcity compared to gluten feed and soybean meal proteins; whereas, it was 4-times higher compared to sunflower meal.
- The impact of producing 1 kg of SCP on freshwater eutrophication was between 11- and 23-times lower compared to the proteins from the gluten feed, soybean meal, and sunflower meal.
- Finally, within the global warming impact category, it is necessary to point out that the largest environmental impact was provided by SCP manufacturing compared to the other protein sources (up to 11-fold higher).
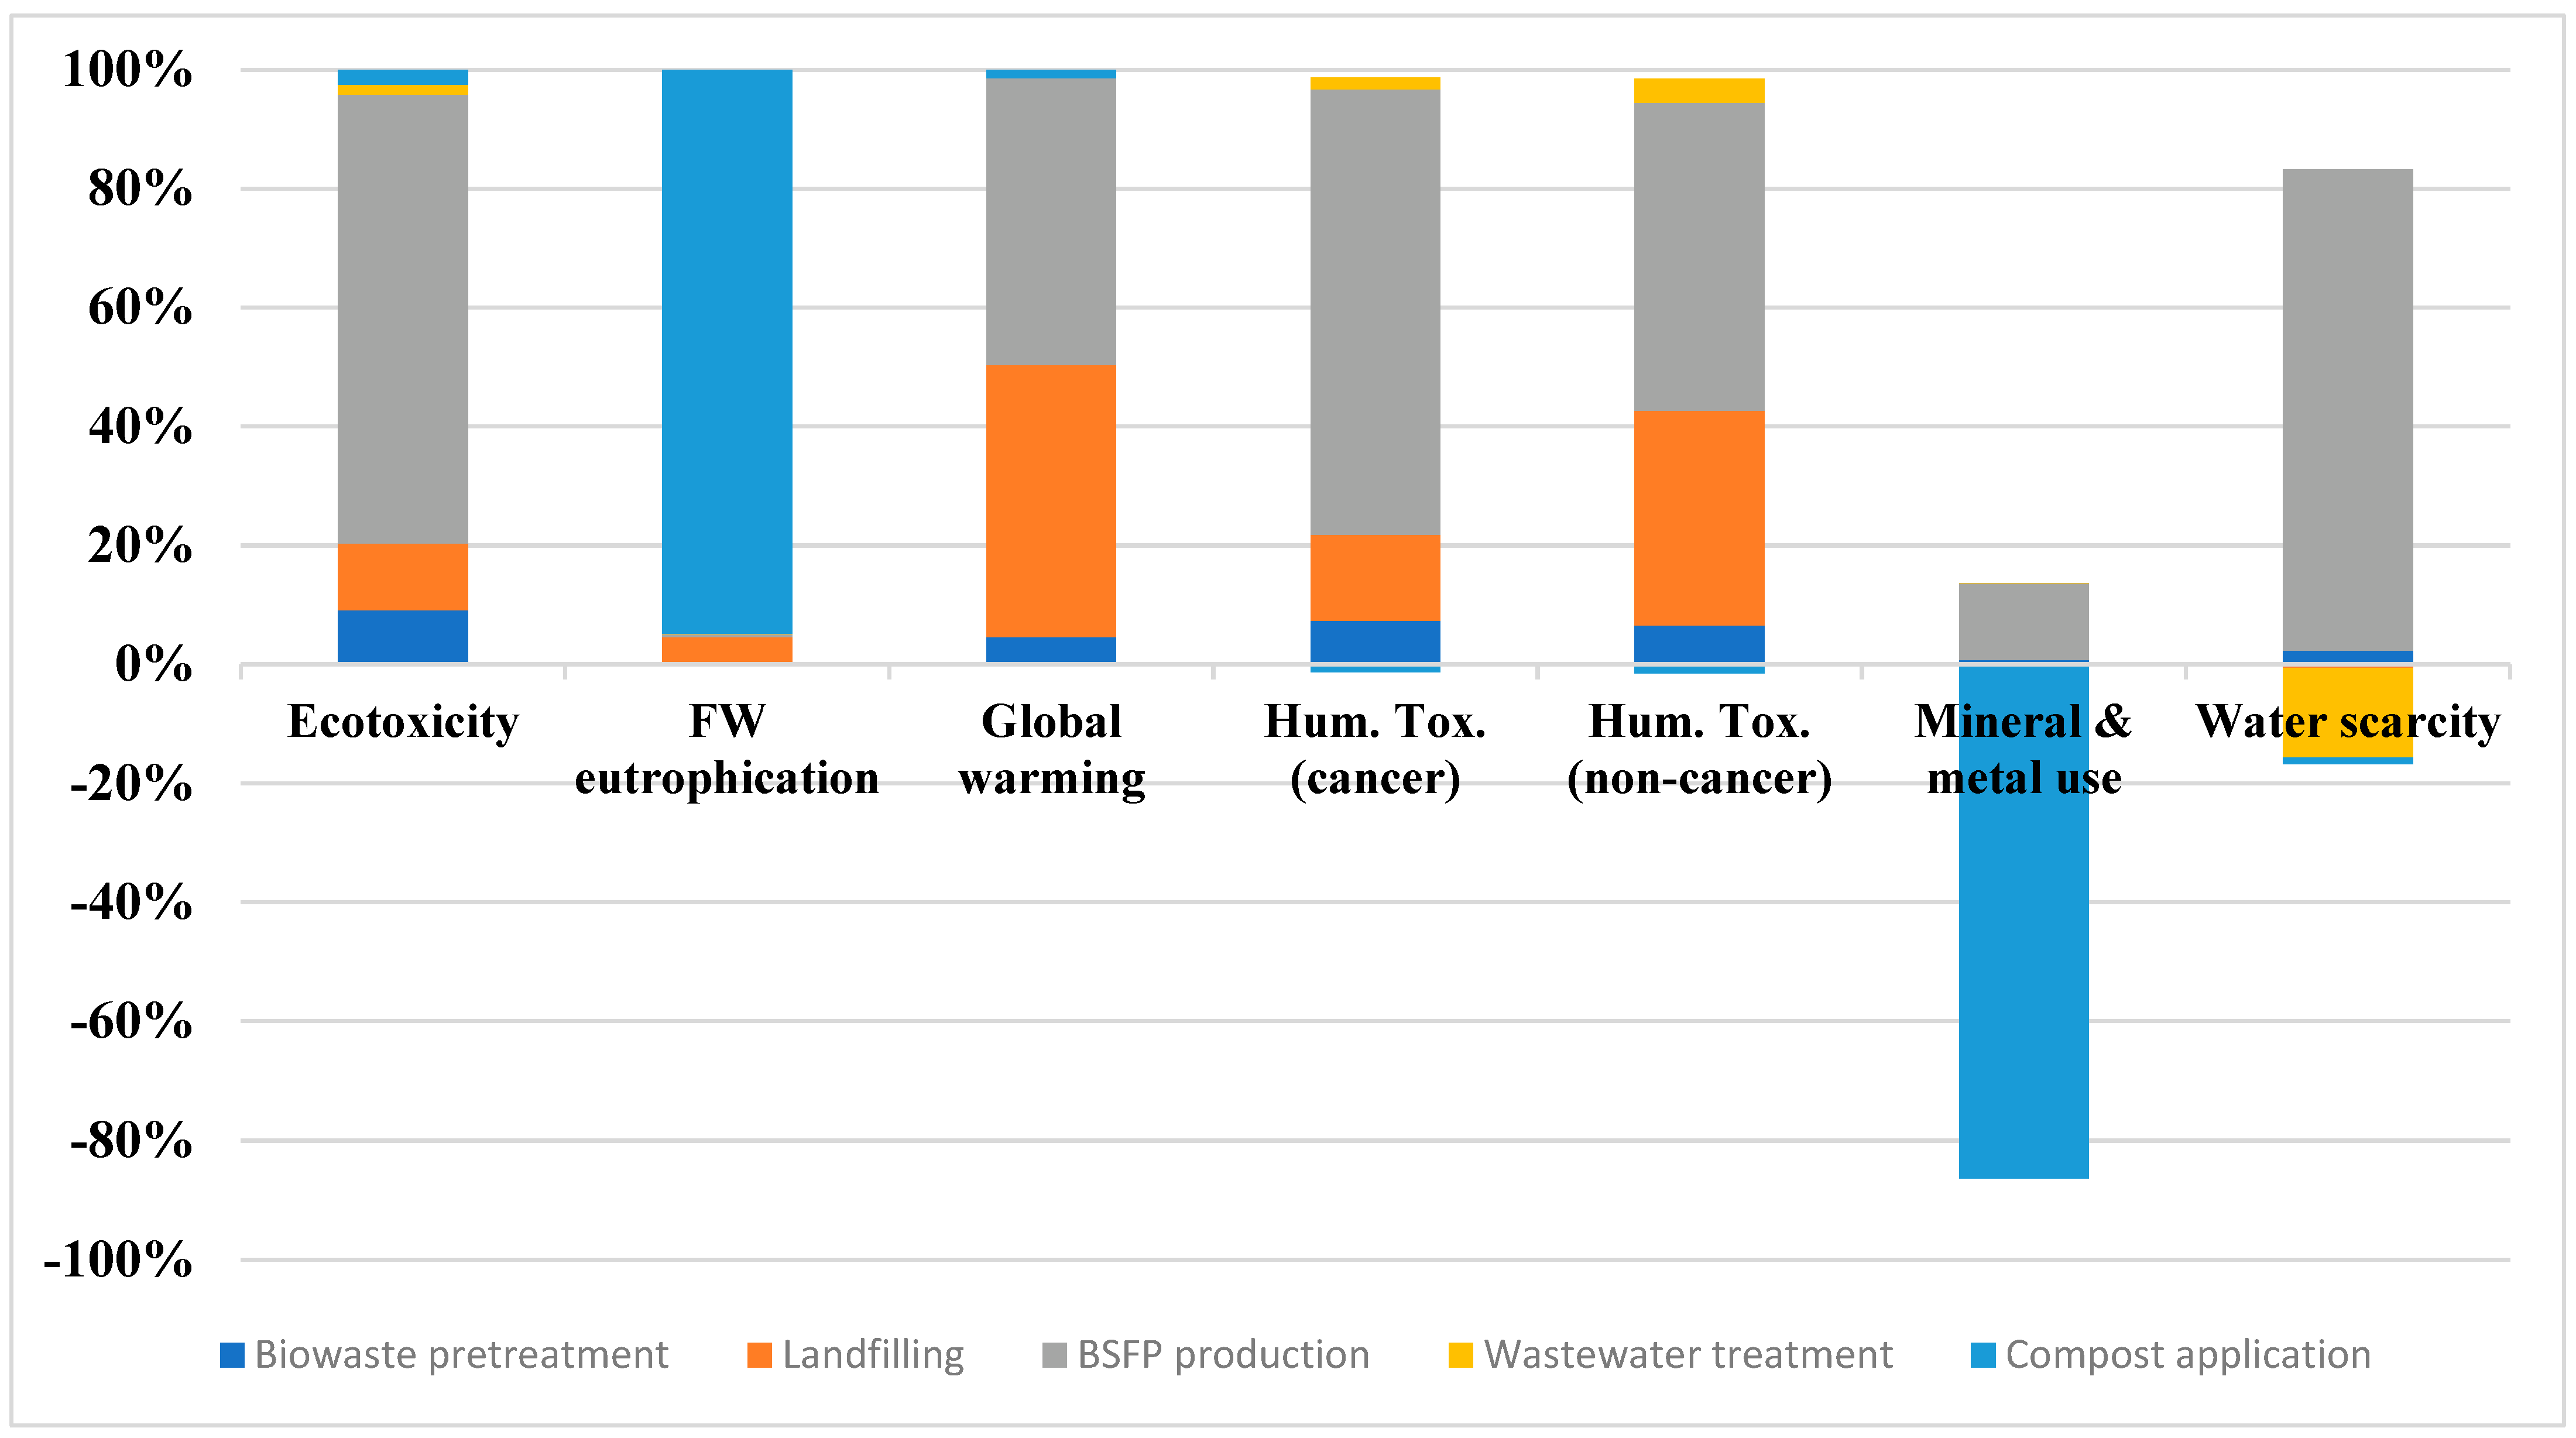
3.2. Production of Proteins from Black Solider Fly
- The impact on the freshwater ecotoxicity category was a bit higher for BSFP compared to gluten feed, fish meal, and gluten meal (lower than 2-fold). The difference was higher (about 7-fold) compared to soybean meal. However, it was much lower than the proteins coming from milk and whey concentrate (about 16- and 5-time higher than BSFP).
- Similarly to freshwater ecotoxicity, BSFP production provided a higher environmental impact for eutrophication and global warming compared to gluten feed and gluten meal (about 3-times for eutrophication and 3.5-times for global warming), but much lower compared to milk concentrate (9-fold, eutrophication; and 18-fold, global warming) and whey concentrate (3.4-times, eutrophication; and 5.3-times, global warming).
- In the case of human toxicity (cancer), the results of producing BSFP were close to those proteins obtained from fish meal, gluten feed, gluten meal, and sunflower meal (about 1.6-fold lower) and equal to soybean meal. Whereas, it was clearly a better option compared to whey and milk concentrate, highlighting the difference with the last one; 16-fold.
- These results were similar to those obtained for human toxicity (non-cancer); that is, BSFP provided a higher impact than fish meal (7-fold) and sunflower meal (3.7-fold), and equal to those proteins coming from soybean meal. On the contrary, BSFP provided a lower environmental impact than the rest of the protein sources: gluten feed (3.4-fold), gluten meal (3-fold), whey (4.7-fold), and milk concentrate (12.8-fold).
- In the case of water scarcity, the production of proteins from fish provided better results (61-fold) than the BSFP. On the other hand, the protein from BSF required between 8.3 and 122.5-times lower m3eq than the other protein sources.
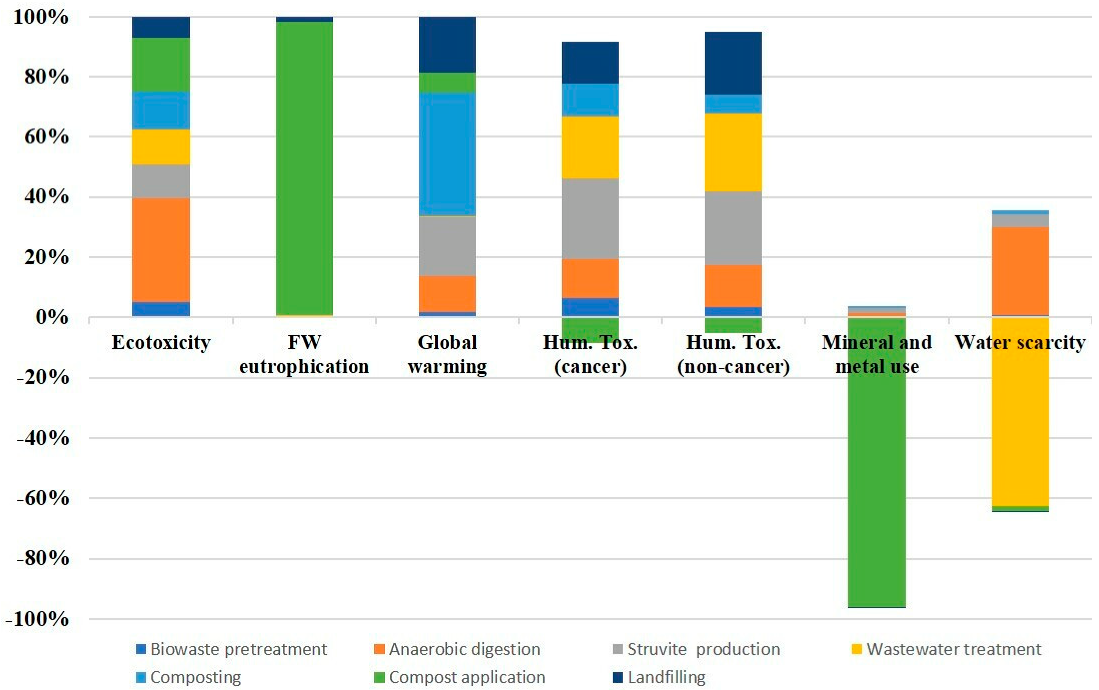
- The case of the minerals and metals use is especially remarkable since the BSFP was the only protein source that provided a positive environmental effect for this category due to the use of the generated compost as a fertilizer.
3.3. Production of Biofertilizers
3.3.1. Ammonium Sulphate ((NH4)2SO4) Obtained in the VALUEWASTE Project
3.3.2. Struvite Obtained in the VALUEWASTE Project
4. General Discussion
5. Conclusions
Author Contributions
Funding
Institutional Review Board Statement
Informed Consent Statement
Data Availability Statement
Acknowledgments
Conflicts of Interest
Glossary
| BSF: black soldier fly (Hermetia illucens) | LCV: lower calorific value |
| BSFP: black soldier fly proteins | MSW: municipal solid waste |
| CE: circular economy | OFMSW: organic fraction from municipal solid waste |
| FU: functional unit | PBW: pre-treated biowaste |
| FW eutrophication: freshwater eutrophication | ROOTS: circular policies for changing the biowaste system |
| HMG: homogenization process | SCP: single-cell proteins |
| HOB: hydrogen-oxidizing bacteria | UHT: ultra-high-temperature process |
| LCA: Life Cycle Assessment | WW: wastewater |
| LCI: Life Cycle Inventory |
References
- United Nations. Global Issues—Population. Available online: https://www.un.org/en/global-issues/population (accessed on 4 July 2022).
- United Nations. Feeding the World Sustainably. UN Chronicle. Available online: https://www.un.org/en/chronicle/article/feeding-world-sustainably (accessed on 7 September 2022).
- Colgrave, M.L.; Dominik, S.; Tobin, A.B.; Stockmann, R.; Simon, C.; Howitt, C.A.; Belobrajdic, D.P.; Paull, C.; Vanhercke, T. Perspectives on Future Protein Production. J. Agric. Food Chem. 2021, 69, 15076–15083. [Google Scholar] [CrossRef] [PubMed]
- Albanna, M. Anaerobic Digestion of the Organic Fraction of Municipal Solid Waste. In Management of Microbial Resources in the Environment; Malik, A., Alves, M., Grohmann, E., Eds.; Springer: Berlin/Heidelberg, Germany, 2014; pp. 1–530. [Google Scholar] [CrossRef]
- Bianco, I.; Panepinto, D.; Zanetti, M. Environmental Impacts of Electricity from Incineration and Gasification: How the LCA Approach Can Affect the Results. Sustainability 2022, 14, 92. [Google Scholar] [CrossRef]
- Dastjerdi, B.; Strezov, V.; Rajaeifar, M.A.; Kumar, R.; Behnia, M. A Systematic Review on Life Cycle Assessment of Different Waste to Energy Valorization Technologies. J. Clean. Prod. 2021, 290, 125747. [Google Scholar] [CrossRef]
- Mihai, F.C.; Minea, I. Sustainable Alternative Routes versus Linear Economy and Resources Degradation in Eastern Romania. Sustainability 2021, 13, 10574. [Google Scholar] [CrossRef]
- Global Footprint Network. Earth Overshoot Day. Available online: https://www.overshootday.org/ (accessed on 14 August 2022).
- Rashid, M.I.; Shahzad, K. Food Waste Recycling for Compost Production and Its Economic and Environmental Assessment as Circular Economy Indicators of Solid Waste Management. J. Clean. Prod. 2021, 317, 128467. [Google Scholar] [CrossRef]
- Avadí, A. Screening LCA of French Organic Amendments and Fertilisers. Int. J. Life Cycle Assess. 2020, 25, 698–718. [Google Scholar] [CrossRef]
- WaysTUP Consortium. Transforming Urban Waste into Valuable Products. Available online: https://waystup.eu/ (accessed on 15 September 2022).
- SCALIBUR Consortium. Leading a Revolution in Biowaste Recycling. Available online: https://scalibur.eu/ (accessed on 15 September 2022).
- VALUEWASTE Consortium. Unlocking New Value from Urban Biowaste. Available online: https://valuewaste.eu/ (accessed on 15 September 2022).
- Khoshnevisan, B.; Tabatabaei, M.; Tsapekos, P.; Rafiee, S.; Aghbashlo, M.; Lindeneg, S.; Angelidaki, I. Environmental Life Cycle Assessment of Different Biorefinery Platforms Valorizing Municipal Solid Waste to Bioenergy, Microbial Protein, Lactic and Succinic Acid. Renew. Sustain. Energy Rev. 2020, 117, 109493. [Google Scholar] [CrossRef]
- ISO 14040:2006; Environmental Management—Life Cycle Assessment—Principles and Framework. ISO Copyright Office: Geneva, Switzerland, 2006.
- ISO 14044:2006; Environmental Management—Life Cycle Assessment—Requirements and Guidelines. ISO Copyright Office: Geneva, Switzerland, 2006.
- European Union. Tool #64. Life Cycle Analysis. Available online: https://ec.europa.eu/info/sites/default/files/file_import/better-regulation-toolbox-64_en_0.pdf (accessed on 26 May 2022).
- Bava, L.; Jucker, C.; Gislon, G.; Lupi, D.; Savoldelli, S.; Zucali, M.; Colombini, S. Rearing of Hermetia Illucens on Different Organic By-Products: Influence on Growth, Waste Reduction and Enviromental Impact. Animals 2019, 9, 289. [Google Scholar] [CrossRef]
- Mertenat, A.; Diener, S.; Zurbrügg, C. Black Soldier Fly Biowaste Treatment—Assessment of Global Warming Potential. Waste Manag. 2019, 84, 173–181. [Google Scholar] [CrossRef]
- Maiolo, S.; Parisi, G.; Biondi, N.; Lunelli, F.; Tibaldi, E.; Pastres, R. Fishmeal Partial Substitution within Aquafeed Formulations: Life Cycle Assessment of Four Alternative Protein Sources. Int. J. Life Cycle Assess. 2020, 25, 1455–1471. [Google Scholar] [CrossRef]
- LaTurner, Z.W.; Bennett, G.N.; San, K.Y.; Stadler, L.B. Single Cell Protein Production from Food Waste Using Purple Non-Sulfur Bacteria Shows Economically Viable Protein Products Have Higher Environmental Impacts. J. Clean. Prod. 2020, 276, 123114. [Google Scholar] [CrossRef]
- Styles, D.; Adams, P.; Thelin, G.; Vaneeckhaute, C.; Chadwick, D.; Withers, P.J.A. Life Cycle Assessment of Biofertilizer Production and Use Compared with Conventional Liquid Digestate Management. Environ. Sci. Technol. 2018, 52, 7468–7476. [Google Scholar] [CrossRef]
- Thomsen, M.; Seghetta, M.; Mikkelsen, M.H.; Gyldenkærne, S.; Becker, T.; Caro, D.; Frederiksen, P. Comparative Life Cycle Assessment of Biowaste to Resource Management Systems—A Danish Case Study. J. Clean. Prod. 2016, 142, 4050–4058. [Google Scholar] [CrossRef]
- Tian, H.; Wang, X.; Lim, E.Y.; Lee, J.T.E.; Ee, A.W.L.; Zhang, J.; Tong, Y.W. Life Cycle Assessment of Food Waste to Energy and Resources: Centralized and Decentralized Anaerobic Digestion with Different Downstream Biogas Utilization. Renew. Sustain. Energy Rev. 2021, 150, 111489. [Google Scholar] [CrossRef]
- Sala, S.; Reale, F.; Cristóbal-García, J.; Marelli, L.; Rana, P. Life Cycle Assessment for the Impact Assessment of Policies; EUR 28380 EN; Publications Office of the European Union: Luxembourg, 2016. [Google Scholar] [CrossRef]
- Baker, C.G.J.; Mckenzie, K.A. Energy Consumption of Industrial Spray Dryers. Dry. Technol. Ann. Int. J. 2005, 23, 365–386. [Google Scholar] [CrossRef]
- Grau, A.; Farré, O. Situación y Potencial de Valorización Energética Directa de Residuos. Estudio Técnico PER 2011–2020; Instituto para la Diversificación y Ahorro de la Energía: Madrid, Spain, 2011. [Google Scholar]
- MAPAMA. Inventario Nacional de Gases de Efecto Invernadero (GEI) 1990–2018 (2020 Edition). Available online: https://www.miteco.gob.es/es/calidad-y-evaluacion-ambiental/temas/sistema-espanol-de-inventario-sei-/Inventario-GEI.aspx (accessed on 13 May 2022).
- Møller, J.; Boldrin, A.; Christensen, T.H. Anaerobic Digestion and Digestate Use: Accounting of Greenhouse Gases and Global Warming Contribution. Waste Manag. Res. 2009, 27, 813–824. [Google Scholar] [CrossRef]
- Morelli, B.; Cashman, S.; Arden, S. Life Cycle Assessment and Cost Analysis of Municipal Wastewater Treatment Expansion Options for Food Waste Anaerobic Co-Digestion; U.S. Environmental Protection Agency: Lexington, MA, USA, 2019. [Google Scholar]
- Remy, C.; Jekel, M. Sustainable Wastewater Management: Life Cycle Assessment of Conventional and Source-Separating Urban Sanitation Systems. Water Sci. Technol. 2008, 58, 1555–1562. [Google Scholar] [CrossRef]
- Romero Lestido, A.L. Estudio de La Viabilidad Técnico-Económica de La Tecnología de Membranas Para El Enriquecimiento de Biogás Procedente de La Digestión de Fangos de Depuración de Aguas Residuales. Master’s Thesis, Chemical Engineering, Politechnical University of Catalonia, Barcelona, Spain, 2018. [Google Scholar]
- Schmid, A.G. Diferenciación Espacial En La Metodología de Análisis Del Ciclo de Vida: Desarrollo de Factores Regionales Para Eutrofización Acuática y Terrestre. Ph.D. Thesis, Chemical Engineering, Santiago de Compostela University, Santiago de Compostela, Spain, 2008. [Google Scholar]
- Suh, Y.; Rousseaux, P. Article in Press. Resour. Conserv. Recycl. 2002, 35, 191–200. [Google Scholar] [CrossRef]
- Tomei, M.C.; Bertanza, G.; Canato, M.; Heimersson, S.; Laera, G.; Svanström, M. Techno-Economic and Environmental Assessment of Upgrading Alternatives for Sludge Stabilization in Municipal Wastewater Treatment Plants. J. Clean. Prod. 2016, 112, 3106–3115. [Google Scholar] [CrossRef]
- United Nations (UN). Methodological Tool: Project and Leakage Emissions from Composting; Version 02.0; United Nations. Framework Convention on Climate Change. Available online: https://cdm.unfccc.int/methodologies/PAmethodologies/tools/am-tool-13-v2.pdf (accessed on 20 August 2022).
- Friðriksson, G.B.; Johnsen, L.T.; Bjarnadóttir, H.J.; Sletnes, L.H. Guidelines for the Use of LCA in the Waste Management Sector. Nordtest Project Nr. 1537-01; Nordtest: Espoo, Finland, 2002. [Google Scholar]
- Van Zelm, R.; Seroa da Motta, R.D.P.; Lam, W.Y.; Menkveld, W.; Broeders, E. Life Cycle Assessment of Side Stream Removal and Recovery of Nitrogen from Wastewater Treatment Plants. J. Ind. Ecol. 2020, 24, 913–922. [Google Scholar] [CrossRef]
- Yoshida, H.; Christensen, T.H.; Scheutz, C. Life Cycle Assessment of Sewage Sludge Management: A Review. Waste Manag. Res. 2013, 31, 1083–1101. [Google Scholar] [CrossRef] [PubMed]
- Berglund, M.; Börjesson, P. Assessment of Energy Performance in the Life-Cycle of Biogas Production. Biomass Bioenergy 2006, 30, 254–266. [Google Scholar] [CrossRef]
- Cabrera Delgado, J. Evaluación de La Utilización de Biometano Obtenido Mediante Upgrading a Partir de Biogás Como Combustible Para Autobuses Urbanos. Master’s Thesis, Automotive Engineering, Valladolid University, Valladolid, Spain, 2018. [Google Scholar]
- Doka, G. Life Cycle Inventories of Waste Treatment Services. Ecoinvent Report No. 13; Swiss Centre for Life Cycle Inventories: Dübendorf, Switzerland, 2003; p. 111. [Google Scholar]
- European Environment Agency. EMEP/EEA Air Pollutant Emission Inventory Guidebook 2016: Technical Guidance to Prepare National Emission Inventories; EEA: Copenhagen, Denmark, 2016. [Google Scholar] [CrossRef]
- Fisher, K. Impact of Energy from Waste and Recycling Policy on UK Greenhouse Gas Emissions; Department for Environment, Food and Rural Affairs: London, UK, 2006.
- García Sánchez, F.J. Producción de Biometano a Partir de Biogás de Vertedero; Universidad de Sevilla: Seville, Spain, 2016. [Google Scholar]
- Heimersson, S.; Svanström, M.; Laera, G.; Peters, G. Life Cycle Inventory Practices for Major Nitrogen, Phosphorus and Carbon Flows in Wastewater and Sludge Management Systems. Int. J. Life Cycle Assess. 2016, 21, 1197–1212. [Google Scholar] [CrossRef]
- Zampori, L.; Pant, R. Suggestions for Updating the Product Environmental Footprint (PEF) Method; Publications Office of the European Union: Luxembourg, 2019. [Google Scholar] [CrossRef]
- Becker, M.-Y.; Kohlheb, N.; Hunger, S.; Eschrich, S.; Müller, R.; Aurich, A. Early-stage Sustainability Assessment of Biotechnological Processes: A Case Study of Citric Acid Production. Eng. Life Sci. 2020, 20, 90–103. [Google Scholar] [CrossRef] [PubMed]
- Kohlheb, N.; Wluka, M.; Bezama, A.; Thrän, D.; Aurich, A.; Müller, R.A. Environmental-Economic Assessment of the Pressure Swing Adsorption Biogas Upgrading Technology. BioEnergy Res. 2021, 14, 901–909. [Google Scholar] [CrossRef]
- Arashiro, L.T.; Montero, N.; Ferrer, I.; Acién, F.G.; Gómez, C.; Garfí, M. Life Cycle Assessment of High Rate Algal Ponds for Wastewater Treatment and Resource Recovery. Sci. Total Environ. 2018, 622–623, 1118–1130. [Google Scholar] [CrossRef]
- Smetana, S.; Schmitt, E.; Mathys, A. Sustainable Use of Hermetia Illucens Insect Biomass for Feed and Food: Attributional and Consequential Life Cycle Assessment. Resour. Conserv. Recycl. 2019, 144, 285–296. [Google Scholar] [CrossRef]
- Järviö, N.; Maljanen, N.L.; Kobayashi, Y.; Ryynänen, T.; Tuomisto, H.L. An Attributional Life Cycle Assessment of Microbial Protein Production: A Case Study on Using Hydrogen-Oxidizing Bacteria. Sci. Total Environ. 2021, 776, 145764. [Google Scholar] [CrossRef]
- Pikaar, I.; de Vrieze, J.; Rabaey, K.; Herrero, M.; Smith, P.; Verstraete, W. Carbon Emission Avoidance and Capture by Producing In-Reactor Microbial Biomass Based Food, Feed and Slow Release Fertilizer: Potentials and Limitations. Sci. Total Environ. 2018, 644, 1525–1530. [Google Scholar] [CrossRef]
- Puyol, D.; Batstone, D.J.; Hülsen, T.; Astals, S.; Peces, M.; Krömer, J.O. Resource Recovery from Wastewater by Biological Technologies: Opportunities, Challenges, and Prospects. Front. Microbiol. 2017, 7, 2106. [Google Scholar] [CrossRef]
- Matassa, S.; Batstone, D.J.; Hülsen, T.; Schnoor, J.; Verstraete, W. Can Direct Conversion of Used Nitrogen to New Feed and Protein Help Feed the World? Environ. Sci. Technol. 2015, 49, 5247–5254. [Google Scholar] [CrossRef]
- Pikaar, I.; Matassa, S.; Bodirsky, B.L.; Weindl, I.; Humpenöder, F.; Rabaey, K.; Boon, N.; Bruschi, M.; Yuan, Z.; Van Zanten, H.; et al. Decoupling Livestock from Land Use through Industrial Feed Production Pathways. Environ. Sci. Technol. 2018, 52, 7351–7359. [Google Scholar] [CrossRef]
- Smetana, S.; Palanisamy, M.; Mathys, A.; Heinz, V. Sustainability of Insect Use for Feed and Food: Life Cycle Assessment Perspective. J. Clean. Prod. 2016, 137, 741–751. [Google Scholar] [CrossRef]
- Salomone, R.; Saija, G.; Mondello, G.; Giannetto, A.; Fasulo, S.; Savastano, D. Environmental Impact of Food Waste Bioconversion by Insects: Application of Life Cycle Assessment to Process Using Hermetia illucens. J. Clean. Prod. 2017, 140, 890–905. [Google Scholar] [CrossRef]
- Thévenot, A.; Rivera, J.L.; Wilfart, A.; Maillard, F.; Hassouna, M.; Senga-Kiesse, T.; Le Féon, S.; Aubin, J. Mealworm Meal for Animal Feed: Environmental Assessment and Sensitivity Analysis to Guide Future Prospects. J. Clean. Prod. 2018, 170, 1260–1267. [Google Scholar] [CrossRef]
- Gold, M.; Cassar, C.M.; Zurbrügg, C.; Kreuzer, M.; Boulos, S.; Diener, S.; Mathys, A. Biowaste Treatment with Black Soldier Fly Larvae: Increasing Performance through the Formulation of Biowastes Based on Protein and Carbohydrates. Waste Manag. 2020, 102, 319–329. [Google Scholar] [CrossRef]
- Dortmans, B.; Diener, S.; Verstappen, B.; Zurbrügg, C. Black Soldier Fly Biowaste Processing; Eawag—Swiss Federal Institute of Aquatic Science and Technology: Dübendorf, Switzerland, 2017. [Google Scholar]
- Lijó, L.; González-García, S.; Bacenetti, J.; Fiala, M.; Feijoo, G.; Lema, J.M.; Moreira, M.T. Life Cycle Assessment of Electricity Production in Italy from Anaerobic Co-Digestion of Pig Slurry and Energy Crops. Renew. Energy 2014, 68, 625–635. [Google Scholar] [CrossRef]
- Lijó, L.; González-García, S.; Bacenetti, J.; Fiala, M.; Feijoo, G.; Moreira, M.T. Assuring the Sustainable Production of Biogas from Anaerobic Mono-Digestion. J. Clean. Prod. 2014, 72, 23–34. [Google Scholar] [CrossRef]
- Sayara, T.; Sánchez, A. Gaseous Emissions from the Composting Process: Controlling Parameters and Strategies of Mitigation. Processes 2021, 9, 1844. [Google Scholar] [CrossRef]
- Colón, J.; Cadena, E.; Pognani, M.; Barrena, R.; Sánchez, A.; Font, X.; Artola, A. Determination of the Energy and Environmental Burdens Associated with the Biological Treatment of Source-Separated Municipal Solid Wastes. Energy Environ. Sci. 2012, 5, 5731–5741. [Google Scholar] [CrossRef]
- USGS. Phosphate Rock. United States Geological Survey. Available online: https://pubs.usgs.gov/periodicals/mcs2021/mcs2021-phosphate.pdf (accessed on 14 July 2022).
- El Bamiki, R.; Raji, O.; Ouabid, M.; Elghali, A.; Yazami, O.K.; Bodinier, J.L. Phosphate Rocks: A Review of Sedimentary and Igneous Occurrences in Morocco. Minerals 2021, 11, 1137. [Google Scholar] [CrossRef]
- Statista. Phosphate Rock Reserves by Country 2021. Available online: https://www.statista.com/statistics/681747/phosphate-rock-reserves-by-country/ (accessed on 14 July 2022).
- Calisto Friant, M.; Vermeulen, W.J.V.; Salomone, R. Analysing European Union Circular Economy Policies: Words versus Actions. Sustain. Prod. Consum. 2021, 27, 337–353. [Google Scholar] [CrossRef]
- Future Market Insights. Milk Protein Market Size, Industry Share & Trends—2032. Available online: https://www.futuremarketinsights.com/reports/milk-protein-market (accessed on 24 August 2022).
- Fortune Business Insights. Whey Protein Market Size, Share & Growth Report [2022–2029]. Available online: https://www.fortunebusinessinsights.com/whey-protein-market-106555 (accessed on 24 August 2022).
- HOOP-SCALIBUR-VALUEWASTE-WAYSTUP Projects. CirculaR pOlicies for Changing the biOwasTe System (ROOTS): A Position Paper. European Circular Economy Stakeholder Platform. Available online: https://circulareconomy.europa.eu/platform/en/knowledge/circular-policies-changing-biowaste-system-roots-position-paper (accessed on 27 July 2022).


| Stage | Inputs | Outputs | ||||
|---|---|---|---|---|---|---|
| Biowaste pretreatment and | Biowaste | 71.4 kg | Leftover biogas (to upgrade) | 7.1 kg | ||
| anaerobic digestion | FeCl3 | 0.1 kg | Solid fraction of digestate | 47.5 kg | ||
| Polyelectrolyte | 0.04 kg | Liquid fraction of digestate | 39.2 kg | |||
| Tap water | 28.8 kg | Rejected materials to landfill | 6.4 kg | |||
| Diesel | 0.09 kg | Emissions to air | ||||
| Electricity | 12.0 MJ | CH4 | 0.083 kg | CO | 1.07 g | |
| CO2 | 0.296 kg | NOx | 1.96 g | |||
| N2O | 0.014 g | SO2 | 6.00 × 10⁻³ g | |||
| NH3 | 8.00 × 10⁻⁴ g | NMVOCs | 0.156 g | |||
| PM10 | 0.079 g | PM2.5 | 0.079 g | |||
| Biogas upgrading | Leftover biogas (to upgrade) | 7.1 kg | Biomethane | 2.51 kg | ||
| Activated carbon | 9.6 g | Thermal energy | 0.058 MJ | |||
| Electricity | 6.2 MJ | Electrical energy | 0.035 MJ | |||
| Emissions to air | ||||||
| CH4 | 2.00 × 10⁻⁴ g | CO | 2.00 × 10⁻³ g | |||
| CO2 | 0.023 g | NOx | 0.048 g | |||
| N2O | 3.00 × 10⁻⁴ g | SO2 | 0.189 g | |||
| As | 9.55 × 10⁻⁴ mg | NMVOCs | 2.30 × 10⁻⁴ g | |||
| PM10 | 5.76 × 10⁻³ g | PM2.5 | 2.75 × 10⁻³ g | |||
| Cd | 5.73 × 10⁻⁵ mg | Cr | 9.55 × 10⁻⁴ mg | |||
| Cu | 1.91 × 10⁻³ mg | Hg | 9.55 × 10⁻⁴ mg | |||
| Ni | 1.91 × 10⁻³ mg | Pb | 4.78 × 10⁻³ mg | |||
| Zn | 5.73 × 10⁻³ mg | DIOX | 2.30 × 10⁻⁵ mg | |||
| PAHs | 1.56 × 10⁻⁵ mg | PCBs | 7.59 × 10⁻¹⁰ mg | |||
| SCP production | Chemicals * | 62.38 kg | Uniprotein (8% H2O) | 1.55 kg | ||
| Protein from microorganism | 1.00 kg | |||||
| Wastewater to WWTP | 8.6 kg | |||||
| CH4 | 0.057 g | CO | 2.23 g | |||
| CO2 | 1.019 kg | NOx | 5.08 g | |||
| N2O | 6.00 × 10⁻³ g | NMVOCs | 0.15 g | |||
| PM10 | 0.051 g | PM2.5 | 0.051 g | |||
| Electrical energy | 19.5 MJ | |||||
| Stage | Inputs | Outputs | ||||
|---|---|---|---|---|---|---|
| Biowaste pretreatment | Biowaste | 72.3 kg | Rejected materials to landfill | 6.5 kg | ||
| Diesel | 0.09 kg | Biowaste (pretreated) | 65.8 kg | |||
| Electricity | 2.4 MJ | Emissions to air | ||||
| CH4 | 3.00 × 10⁻³ g | CO | 0.664 g | |||
| CO2 | 0.297 kg | NOx | 1.417 g | |||
| N2O | 0.013 g | SO2 | 2.00 × 10⁻³ g | |||
| NH3 | 1.00 × 10⁻³ g | NMVOCs | 0.129 g | |||
| PM10 | 0.073 g | PM2.5 | 0.073 g | |||
| BSF protein production | Biowaste (pretreated) | 65.8 kg | New fresh larvae | 10.1 kg | ||
| Tap water | 7.0 kg | Insect meal | 1.45 kg | |||
| Process water | 8.3 kg | Protein from insect meal | 1.00 kg | |||
| Feed (insect diet) | 3.3 kg | Fatty fraction | 1.27 kg | |||
| Natural gas | 0.14 kg | Compost (larval fattening) | 3.2 kg | |||
| Electricity | 53.3 MJ | Compost (incubation and colony) | 1.3 kg | |||
| Rejected materials to landfill | 0.6 kg | |||||
| Wastewater | 7.0 kg | |||||
| Emissions to air | ||||||
| CH4 | 0.033 g | CO | 0.255 g | |||
| CO2 | 0.363 kg | NOx | 0.582 g | |||
| N2O | 0.560 g | NMVOCs | 0.017 g | |||
| PM10 | 6.00 × 10⁻³ g | PM2.5 | 6.00 × 10⁻³ g | |||
| Emissions to air | ||||||
| Compost application | Compost (larval fattening) | 3.2 kg | CH4 | 5.00 × 10⁻⁵ g | CO | 9.78 × 10⁻³ g |
| Substituted N fertiliser (CAN27) | −0.20 kg | CO2 | 4.08 kg | NOx | 0.022 g | |
| Substituted P fertiliser (TS46P2O5) | −0.20 kg | N2O | 1.42 g | SO2 | 3.00 × 10⁻⁵ g | |
| Diesel | 1.3 × 10⁻³ kg | NH3 | 13.24 g | NMVOCs | 1.93 × 10⁻³ g | |
| PM10 | 8.90 × 10⁻⁴ g | PM2.5 | 8.90 × 10⁻⁴ g | |||
| Stage | Inputs | Outputs | ||||
|---|---|---|---|---|---|---|
| (NH4)2SO4 | ||||||
| Biowaste pretreatment and anaerobic digestion | Biowaste | 245 kg | Leftover biogas (to upgrade) | 24.3 kg | ||
| FeCl3 | 0.33 kg | Solid fraction of digestate | 163 kg | |||
| Polyelectrolyte | 0.15 kg | Liquid fraction of digestate | 134.5 kg | |||
| Tap water | 99 kg | Rejected materials to landfill | 22.1 kg | |||
| Diesel | 0.32 kg | Emissions to air | ||||
| Electricity | 41.0 MJ | CH4 | 0.285 g | CO | 3.66 g | |
| CO2 | 1.01 kg | NOx | 6.68 g | |||
| N2O | 0.048 g | NMVOCs | 0.531 g | |||
| PM10 | 0.269 g | PM2.5 | 0.269 g | |||
| SO2 | 0.020 g | NH3 | 0.026 g | |||
| Composting of solid fraction digestate | Solid fraction of digestate | 163 kg | Compost | 45.7 kg | ||
| Diesel | 0.26 kg | Rejected materials to landfill | 2.1 kg | |||
| Electricity | 5.87 MJ | Emissions to air | ||||
| CH4 | 326 g | CO | 1.84 g | |||
| CO2 | 0.83 kg | NOx | 3.93 g | |||
| N2O | 32.6 g | SO2 | 5.00 × 10⁻³ g | |||
| NH3 | 39.1 g | NMVOCs | 0.36 g | |||
| PM10 | 0.20 g | PM2.5 | 0.20 g | |||
| Emissions to air | ||||||
| Compost application | Compost | 45.7 kg | CH4 | 6.86 × 10⁻⁴ g | CO | 0.14 g |
| Substituted N fertiliser (CAN27) | −3.29 kg | CO2 | 0.057 kg | NOx | 0.306 g | |
| Substituted P fertiliser (TS46P2O5) | −0.88 kg | N2O | 23.90 g | SO2 | 3.67 × 10⁻⁴ g | |
| Diesel | 0.018 kg | NH3 | 223.0 g | NMVOCs | 0.027 g | |
| PM10 | 0.013 g | PM2.5 | 0.013 g | |||
| Emissions to freshwater | ||||||
| PO4 | 42.5 g | |||||
| Emissions to agricultural soil | ||||||
| PO4 | 3.65 g | |||||
| Ammonium sulphate production | Struvite process effluent | 129 kg | Fertilizer (95% H2O) | 1.11 kg | ||
| H2SO4 (96%) | 1.0 kg | Ammonium sulphate (pure) | 1.00 kg | |||
| Natural gas | 2.27 kg | Wastewater to WWTP | 128.9 kg | |||
| Electrical energy | 4.68 MJ | Emissions to air | ||||
| CH4 | 0.11 g | CO | 4.24 g | |||
| CO2 | 6.04 kg | NOx | 9.68 g | |||
| N2O | 0.0106 g | PM2.5 | 0.11 g | |||
| PM10 | 0.11 g | NMVOCs | 0.28g | |||
| Struvite | ||||||
| Biowaste pretreatment and anaerobic digestion | Biowaste | 17,654 kg | Leftover biogas (to upgrade) | 1741.0 kg | ||
| FeCl3 | 23.6 kg | Solid fraction of digestate | 11,672 kg | |||
| Polyelectrolyte | 10.60 kg | Liquid fraction of digestate | 9631 kg | |||
| Tap water | 7086 kg | Rejected materials to landfill | 1579 kg | |||
| Diesel | 22.8 kg | Emissions to air | ||||
| Electricity | 167 MJ | CH4 | 20.4 kg | CO | 262 kg | |
| CO2 | 72.2 kg | NOx | 479 g | |||
| N2O | 3.44 g | NMVOCs | 38.0 g | |||
| PM10 | 19.3 g | PM2.5 | 19.3 g | |||
| SO2 | 1.46 g | NH3 | 0.19 g | |||
| Composting of solid fraction of digestate | Solid fraction of digestate | 11,672 kg | Compost | 3274 kg | ||
| Diesel | 18.7 kg | Rejected materials to landfill | 149 kg | |||
| Electricity | 421 MJ | Emissions to air | ||||
| CH4 | 23.37 kg | CO | 132.2 g | |||
| CO2 | 59.10 kg | NOx | 281.90 g | |||
| N2O | 2.34 kg | SO2 | 0.37 g | |||
| NH3 | 2.80 kg | NMVOCs | 25.6 g | |||
| PM10 | 14.6 g | PM2.5 | 14.6 g | |||
| Compost application | Compost | 3274 kg | Emissions to air | |||
| Substituted N fertiliser (CAN27) | −236.10 kg | CH4 | 0.049 g | CO | 9.93 g | |
| Substituted P fertiliser (TS46P2O5) | −62.90 kg | CO2 | 4.14 kg | NOx | 21.9 g | |
| Diesel | 1.31 kg | N2O | 1.72 kg | SO2 | 0.026 g | |
| NH3 | 14.6 kg | NMVOCs | 1.960 g | |||
| PM10 | 0.904 g | PM2.5 | 0.904 g | |||
| Emissions to freshwater | ||||||
| PO4 | 3.04 kg | |||||
| Emissions to agricultural soil | ||||||
| PO4 | 0.262 kg | |||||
| MgCl2 production | Slaked lime | 4.22 kg | MgCl2 (100%) | 7.16 kg | ||
| HCl (32%) | 17.2 kg | |||||
| Thermal energy | 48.7 MJ | |||||
| Electrical energy | 4.1 MJ | |||||
| Struvite production | Liquid fraction of digestate | 9631 kg | Fertilizer (95% H2O) | 19.37 kg | ||
| MgCl2 (100%) | 7.2 kg | N in fertilizer | 1.00 kg | |||
| NaOH (100%) | 0.48 kg | Struvite process’ effluent | 9263 kg | |||
| Tap water | 57.8 kg | Emissions to air | ||||
| Natural gas | 39.3 kg | CH4 | 1.88 g | CO | 73.4 g | |
| Electrical energy | 132.10 MJ | CO2 | 104.49 kg | NOx | 167.5 g | |
| N2O | 0.188 g | NMVOCs | 4.89 g | |||
| PM10 | 1.68 g | PM2.5 | 1.68 g | |||
| Impact Category | Environmental Burden (%) of Every Stage | Environmental Burden (%) within the SCP Production Stage | ||
|---|---|---|---|---|
| Ecotoxicity | Anaerobic digestion | 36.0 | Ammonia (NH3) 1 | 0.7 |
| Biogas upgrading | 9.9 | Natural gas 1 | 0.8 | |
| Biowaste pretreatment | 5.5 | Oxygen 1 | 14.1 | |
| SCP production stage | 42.4 | Processes 2 | - | |
| Landfilling | 6.2 | WW 3 treatment | 5.3 | |
| Electricity | 72.7 | |||
| Rest 4 | 6.4 | |||
| Global warming | Anaerobic digestion | 22.5 | Ammonia (NH3) | 8.2 |
| Biogas upgrading | 6.8 | Natural gas | 4.3 | |
| Biowaste pretreatment | 3.1 | Oxygen | 9.9 | |
| SCP production stage | 39.3 | Processes | 24.5 | |
| Landfilling | 28.3 | WW treatment | 0.1 | |
| Electricity | 51.3 | |||
| Rest | 1.7 | |||
| Human toxicity | Anaerobic digestion | 11.9 | Ammonia (NH3) | 3.6 |
| (cancer) | Biogas upgrading | 12.4 | Natural gas | 7.8 |
| Biowaste pretreatment | 5.8 | Oxygen | 12.8 | |
| SCP production stage | 59.5 | Processes | - | |
| Landfilling | 10.4 | WW treatment | 5.9 | |
| Electricity | 66.1 | |||
| Rest | 3.8 | |||
| Human toxicity | Anaerobic digestion | 17.8 | Ammonia (NH3) | - |
| (non-cancer) | Biogas upgrading | 7.3 | Natural gas | 15.5 |
| Biowaste pretreatment | 4.4 | Oxygen | 9.0 | |
| SCP production stage | 48.3 | Processes | 6.5 | |
| Landfilling | 22.2 | WW treatment | 13.1 | |
| Electricity | 46.3 | |||
| Rest | 9.6 | |||
| Water scarcity | Anaerobic digestion | 26.2 | Ammonia (NH3) | - |
| Biogas upgrading | 3.1 | Natural gas | - | |
| Biowaste pretreatment | 0.7 | Oxygen | 2.3 | |
| SCP production stage | 69.8 | Processes | - | |
| Landfilling | 0.2 | WW treatment | 11.6 | |
| Electricity | 10.9 | |||
| Tap water | 74.1 | |||
| Rest | 1.1 | |||
| Impact Category | Environmental Burden (%) of Every Stage | Environmental Burden (%) within the BSFP Production Stage | ||
|---|---|---|---|---|
| Ecotoxicity | Pretreatment | 9.2 | Electricity | 99.4 |
| Landfilling | 11.2 | Tap water | 0.1 | |
| BSFP 1 production stage | 75.5 | Process water | 0.4 | |
| WW 2 treatment | 1.6 | Natural gas | 0.1 | |
| Compost application | 2.5 | Insect meal production | - | |
| Global warming | Pretreatment | 4.6 | Electricity | 90.7 |
| Landfilling | 45.7 | Tap water | - | |
| BSFP 1 production stage | 48.2 | Process water | 0.2 | |
| WW 2 treatment | 0.1 | Natural gas | 1.0 | |
| Compost application | 1.4 | Insect meal production | 8.1 | |
| Human toxicity (cancer) | Pretreatment | 7.3 | Electricity | 98.2 |
| Landfilling | 14.5 | Tap water | 0.1 | |
| BSFP 1 production stage | 74.9 | Process water | 0.2 | |
| WW 2 treatment | 2.0 | Natural gas | 1.5 | |
| Compost application | 1.3 | Insect meal production | - | |
| Human toxicity (non-cancer) | Pretreatment | 6.6 | Electricity | 94.6 |
| Landfilling | 36.1 | Tap water | 0.1 | |
| BSFP 1 production stage | 51.7 | Process water | 0.6 | |
| WW 2 treatment | 4.1 | Natural gas | 4.1 | |
| Compost application | 1.5 | Insect meal production | 0.6 | |
| Water scarcity | Pretreatment | - | Electricity | 58.8 |
| Landfilling | - | Tap water | 18.8 | |
| BSFP 1 production stage | 84.3 | Process water | 22.4 | |
| WW 2 treatment | 15.7 | Natural gas | - | |
| Compost application | - | Insect meal production | - | |
| Biofertilizer | Impact Category | Environmental Burden (%) of Every Stage | Environmental Burden (%) within the Biofertilizer Production Process | ||
|---|---|---|---|---|---|
| Ammonium sulphate | Global warming | (NH4)2SO4 production | 17.5 | Drying | 77.6 |
| Anaerobic digestion 1 | 12.4 | Electricity | 5.1 | ||
| Biowaste pretreatment | 1.7 | Natural gas | 13.7 | ||
| Compost application | 6.9 | Tap water and H2SO4 | 3.3 | ||
| Composting | 42.3 | Precipitation | 0.3 | ||
| Landfilling | 19.0 | ||||
| WW treatment 2 | 0.2 | ||||
| Human toxicity | (NH4)2SO4 production | 24.1 | Drying | - | |
| (cancer) | Anaerobic digestion | 13.7 | Electricity | 15.1 | |
| Biowaste pretreatment | 6.6 | Natural gas | 56.8 | ||
| Compost application | 8.6 | Tap water and H2SO4 | 28.1 | ||
| Composting | 11.4 | Precipitation | - | ||
| Landfilling | 14.4 | ||||
| WW treatment | 21.4 | ||||
| Human toxicity | (NH4)2SO4 production | 22.3 | Drying | 9.4 | |
| (non-cancer) | Anaerobic digestion | 14.4 | Electricity | 6.5 | |
| Biowaste pretreatment | 3.6 | Natural gas | 70.0 | ||
| Compost application | 5.2 | Tap water and H2SO4 | 13.7 | ||
| Composting | 5.9 | Precipitation | 0.3 | ||
| Landfilling | 21.7 | ||||
| WW treatment | 27.0 | ||||
| Struvite | Global warming | Anaerobic digestion | 12.1 | Drying | 68.1 |
| Biowaste pretreatment | 1.7 | Electricity | 9.6 | ||
| Compost application | 6.8 | Natural gas | 12.0 | ||
| Composting | 41.2 | Rest 3 | 10.4 | ||
| Landfilling | 18.5 | ||||
| Struvite production | 19.5 | ||||
| WW treatment | 0.2 | ||||
| Human toxicity | Anaerobic digestion | 13.1 | Drying | - | |
| (cancer) | Biowaste pretreatment | 6.3 | Electricity | 27.7 | |
| Compost application | 2.4 | Natural gas | 49.3 | ||
| Composting | 10.9 | Rest | 23.0 | ||
| Landfilling | 13.9 | ||||
| Struvite production | 26.8 | ||||
| WW treatment | 20.5 | ||||
| Human toxicity | Anaerobic digestion | 13.8 | Drying | 8.3 | |
| (non-cancer) | Biowaste pretreatment | 3.5 | Electricity | 12.2 | |
| Compost application | 5.0 | Natural gas | 62.0 | ||
| Composting | 6.2 | Rest | 17.4 | ||
| Landfilling | 20.9 | ||||
| Struvite production | 24.5 | ||||
| WW treatment | 26.1 | ||||
Publisher’s Note: MDPI stays neutral with regard to jurisdictional claims in published maps and institutional affiliations. |
© 2022 by the authors. Licensee MDPI, Basel, Switzerland. This article is an open access article distributed under the terms and conditions of the Creative Commons Attribution (CC BY) license (https://creativecommons.org/licenses/by/4.0/).
Share and Cite
Fernández-Gutiérrez, D.; Argüelles, A.; Castejón Martínez, G.; Soriano Disla, J.M.; Lara-Guillén, A.J. Unlocking New Value from Urban Biowaste: LCA of the VALUEWASTE Biobased Products. Sustainability 2022, 14, 14962. https://doi.org/10.3390/su142214962
Fernández-Gutiérrez D, Argüelles A, Castejón Martínez G, Soriano Disla JM, Lara-Guillén AJ. Unlocking New Value from Urban Biowaste: LCA of the VALUEWASTE Biobased Products. Sustainability. 2022; 14(22):14962. https://doi.org/10.3390/su142214962
Chicago/Turabian StyleFernández-Gutiérrez, David, Alejandra Argüelles, Gemma Castejón Martínez, José M. Soriano Disla, and Andrés J. Lara-Guillén. 2022. "Unlocking New Value from Urban Biowaste: LCA of the VALUEWASTE Biobased Products" Sustainability 14, no. 22: 14962. https://doi.org/10.3390/su142214962
APA StyleFernández-Gutiérrez, D., Argüelles, A., Castejón Martínez, G., Soriano Disla, J. M., & Lara-Guillén, A. J. (2022). Unlocking New Value from Urban Biowaste: LCA of the VALUEWASTE Biobased Products. Sustainability, 14(22), 14962. https://doi.org/10.3390/su142214962