

Spatial and Temporal Evolution of Vegetation Water Consumption in Arid and Semi-Arid Areas against the Background of Returning Farmland to Forestland


Abstract
1. Introduction
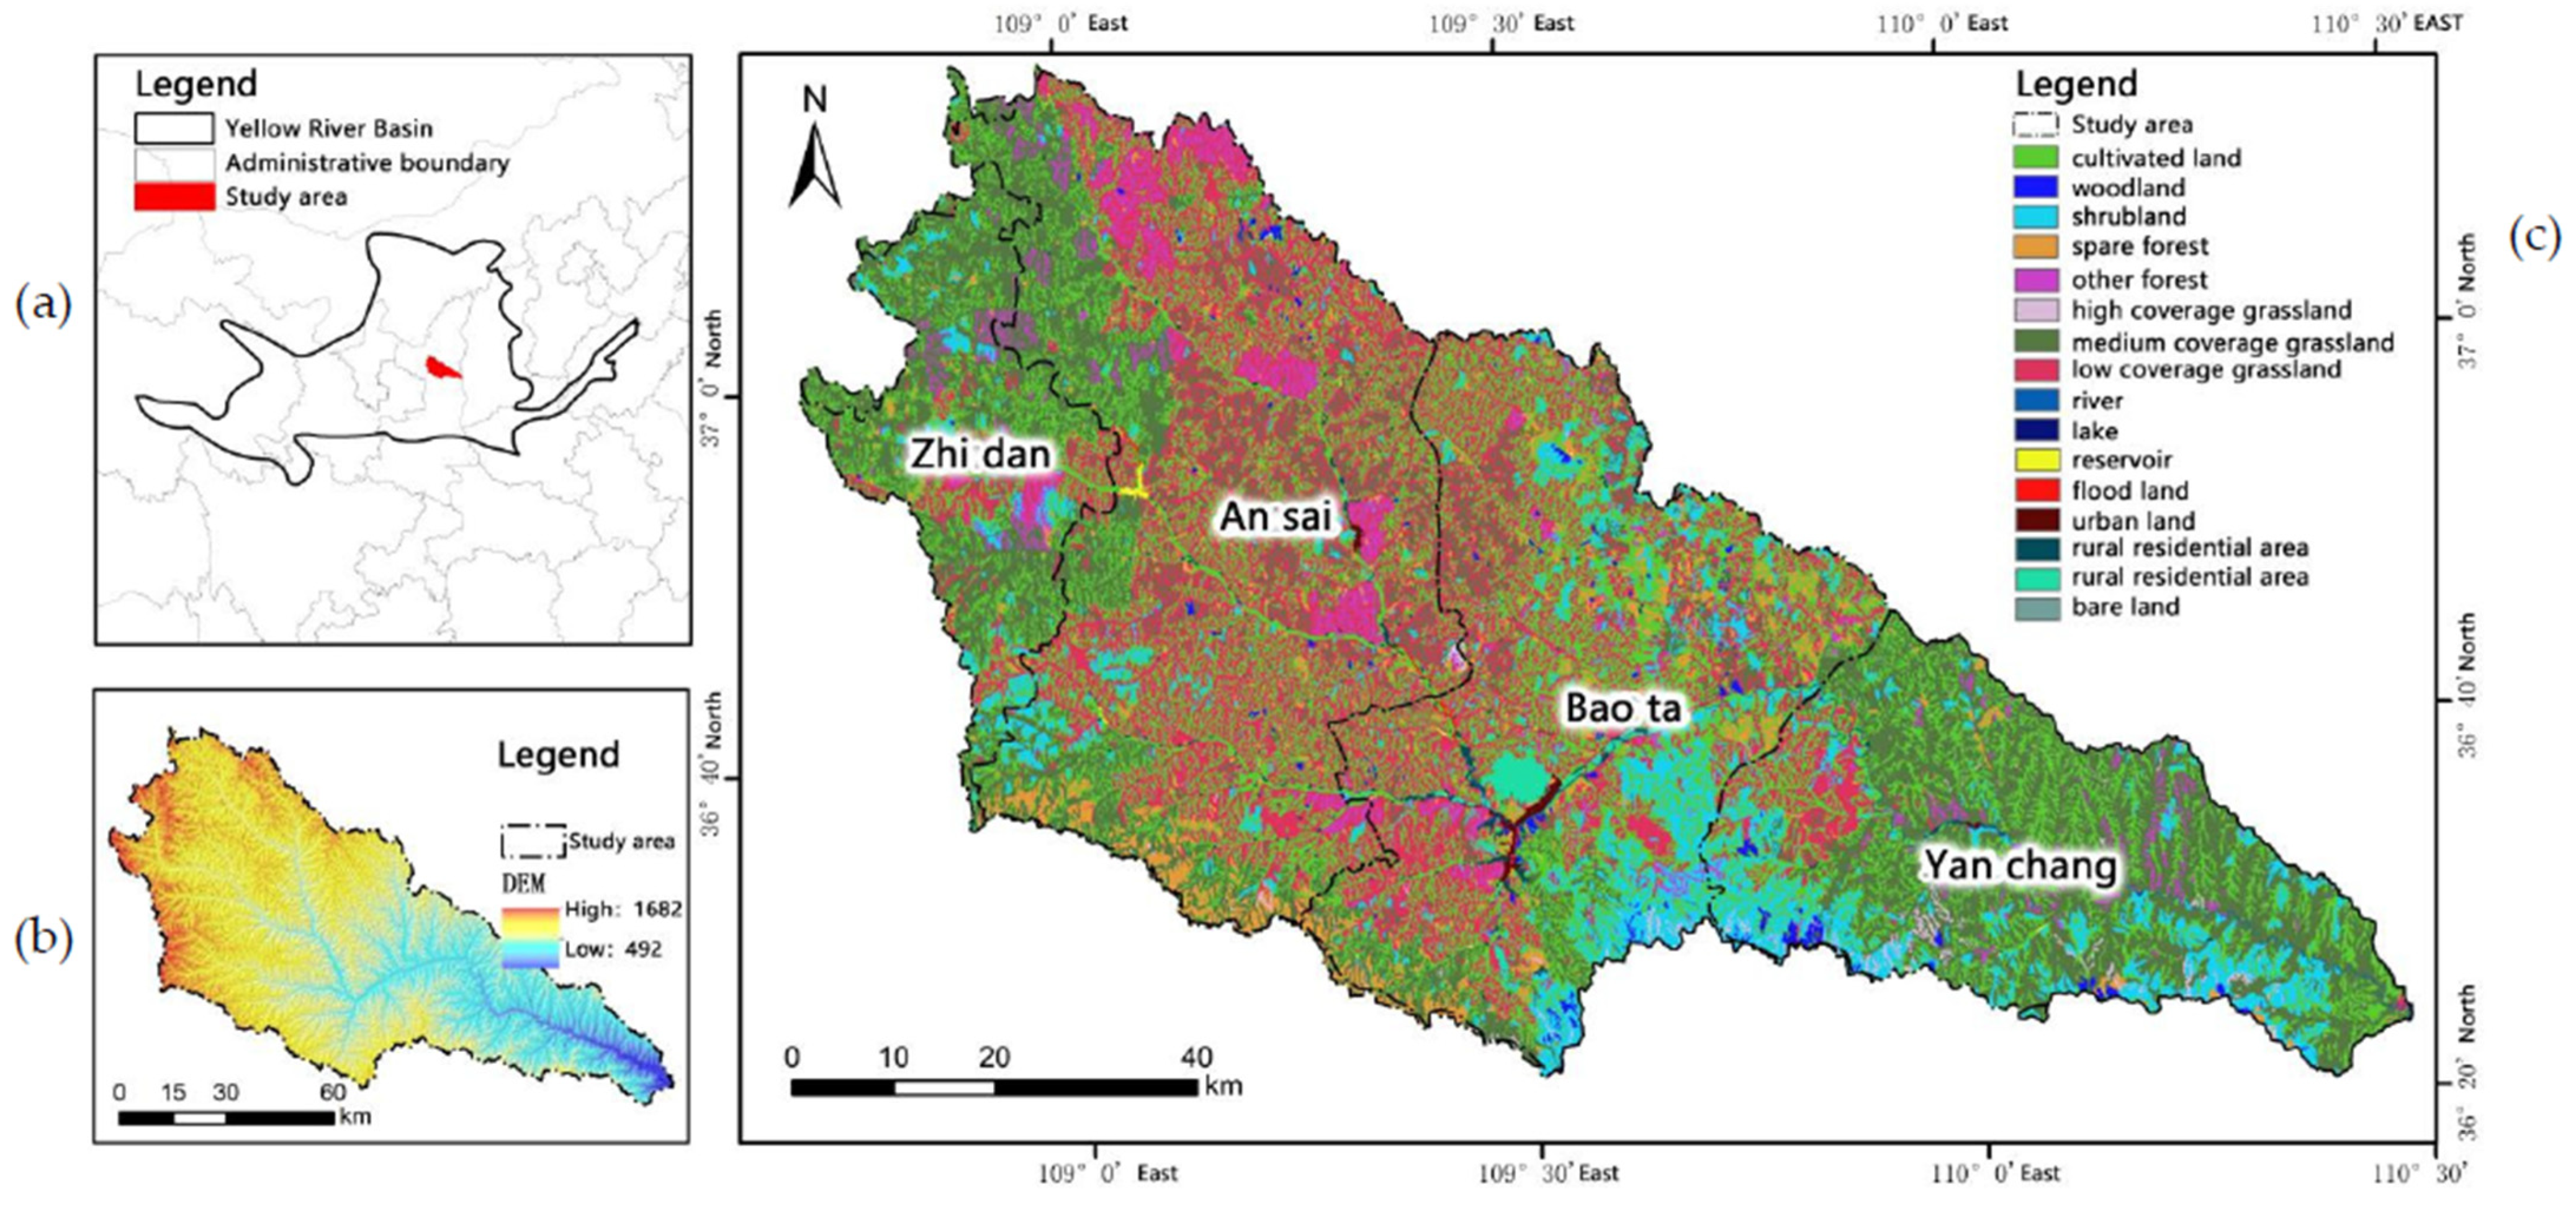
2. Study Area
3. Methodology and Data
3.1. Data Sources
3.2. Methodology
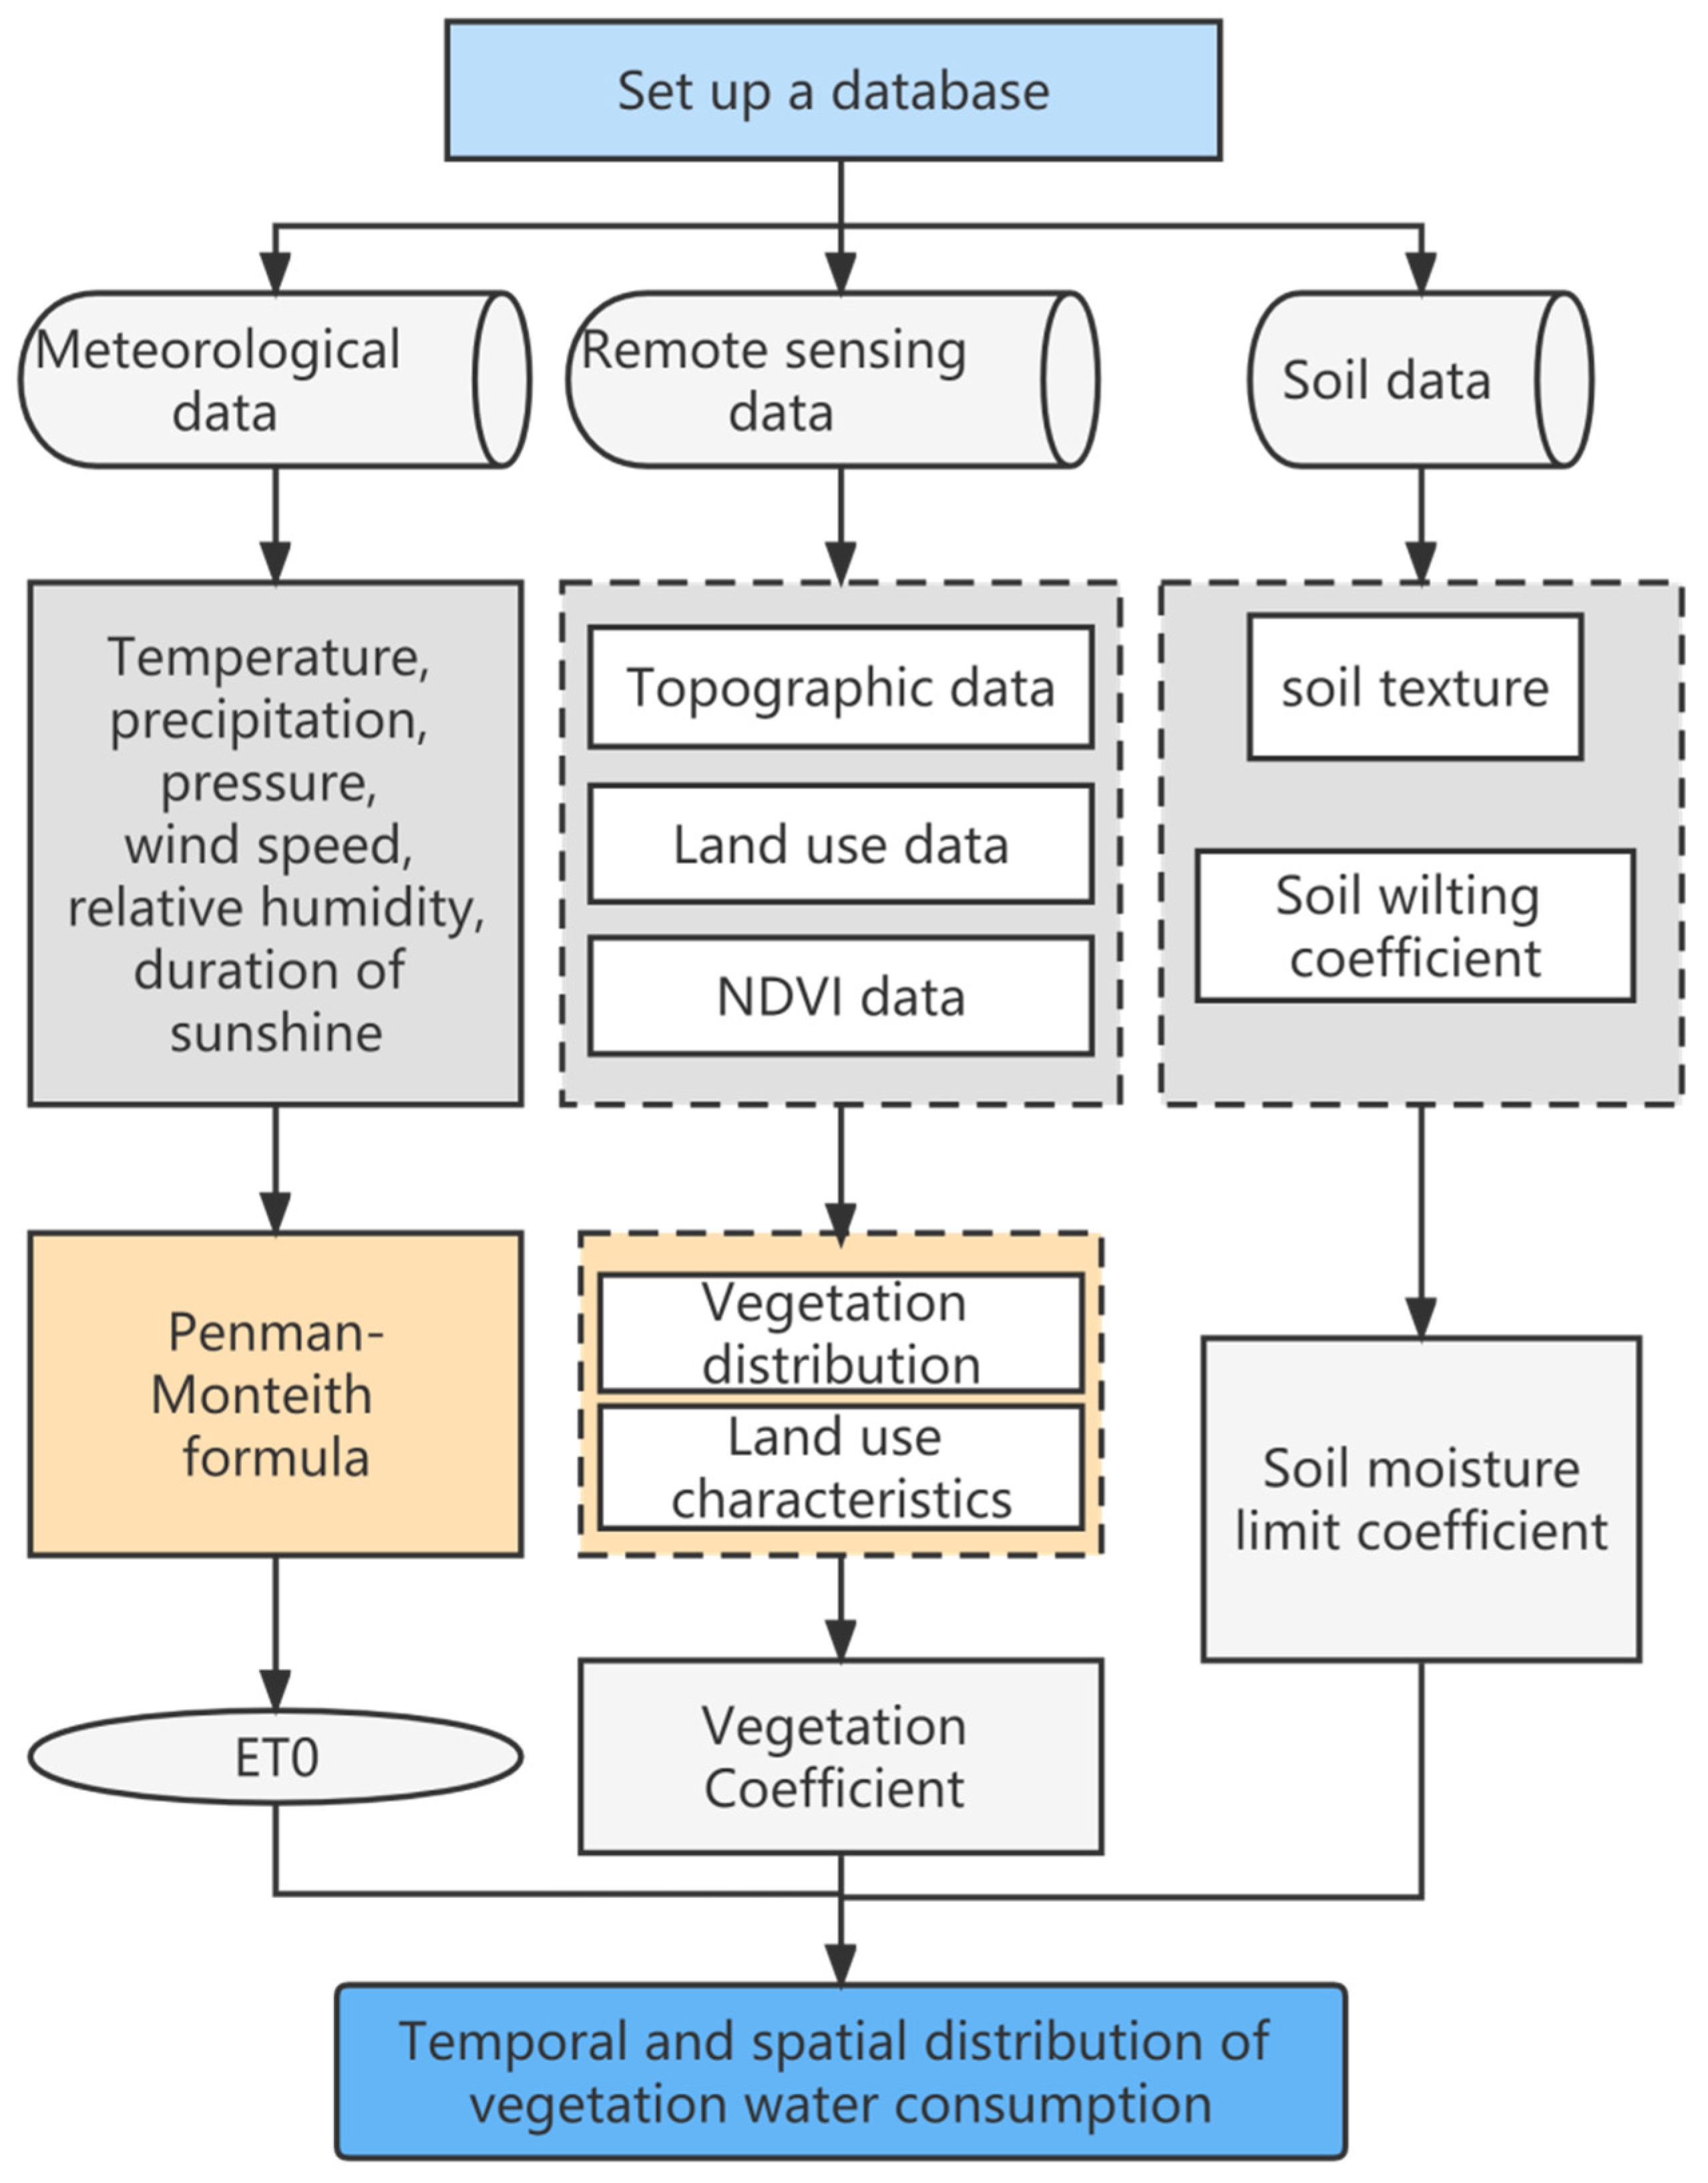
3.2.1. Calculation Method of Vegetation Water Consumption
3.2.2. Determination of Potential Evaporation ET0
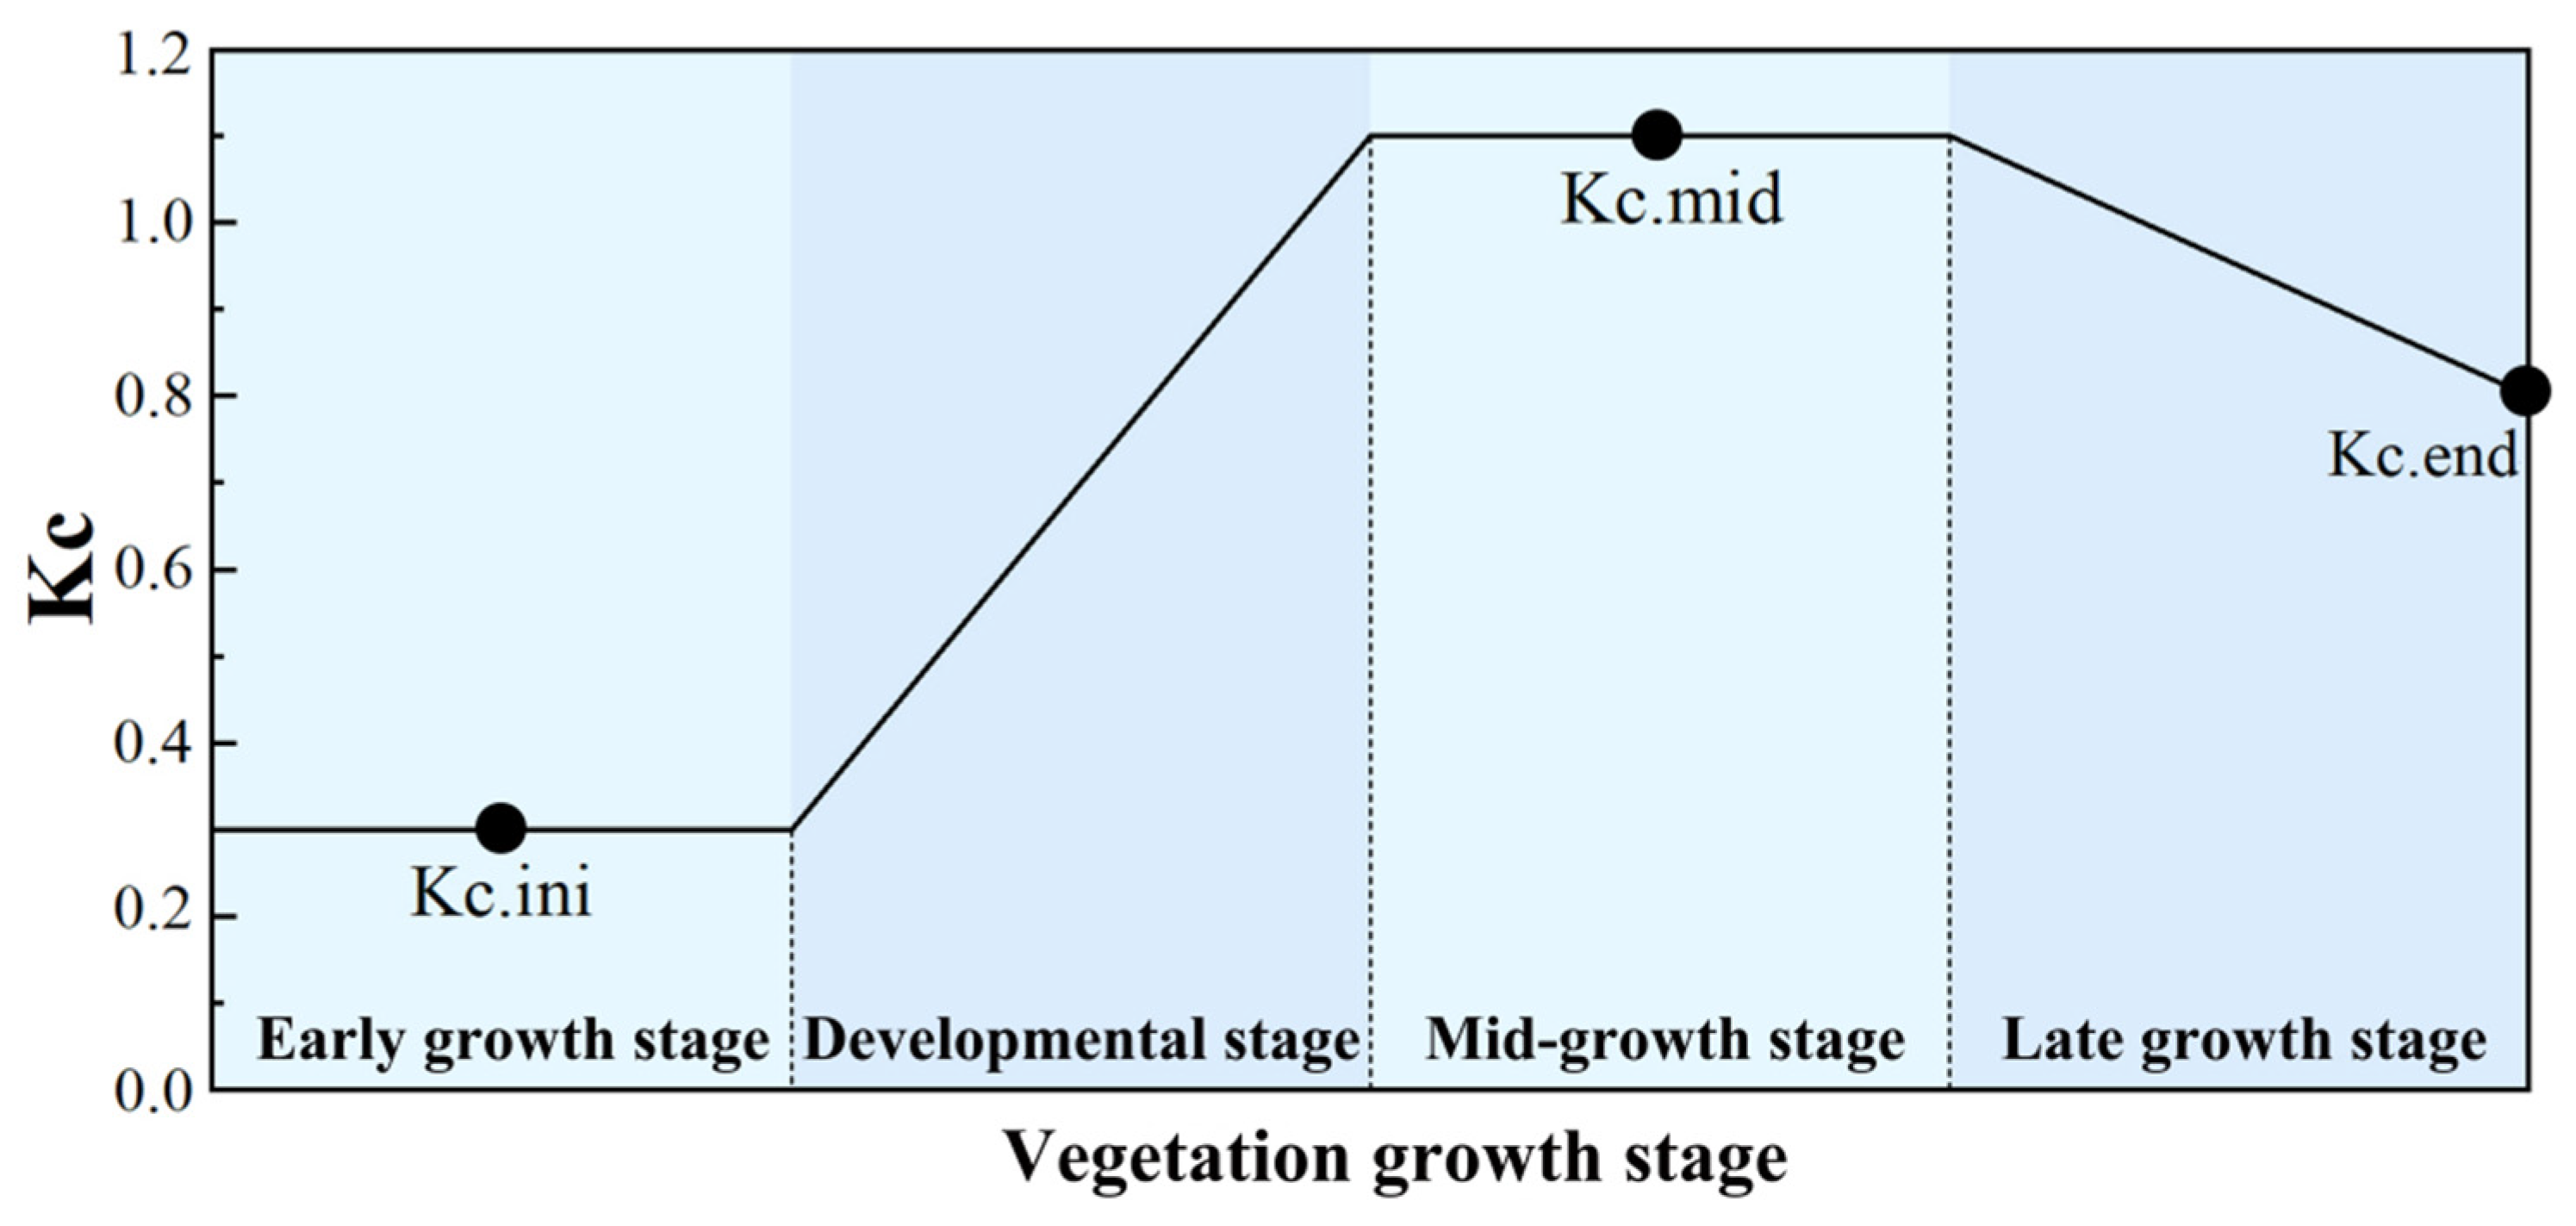
3.2.3. Determination of Crop Coefficient KC
3.2.4. Determination of Soil Water Limiting Conditions KS
3.2.5. Mann–Kendall Statistical Test
3.2.6. Land-Use Transfer Matrix
4. Results and Analysis
4.1. Potential Evapotranspiration ET0
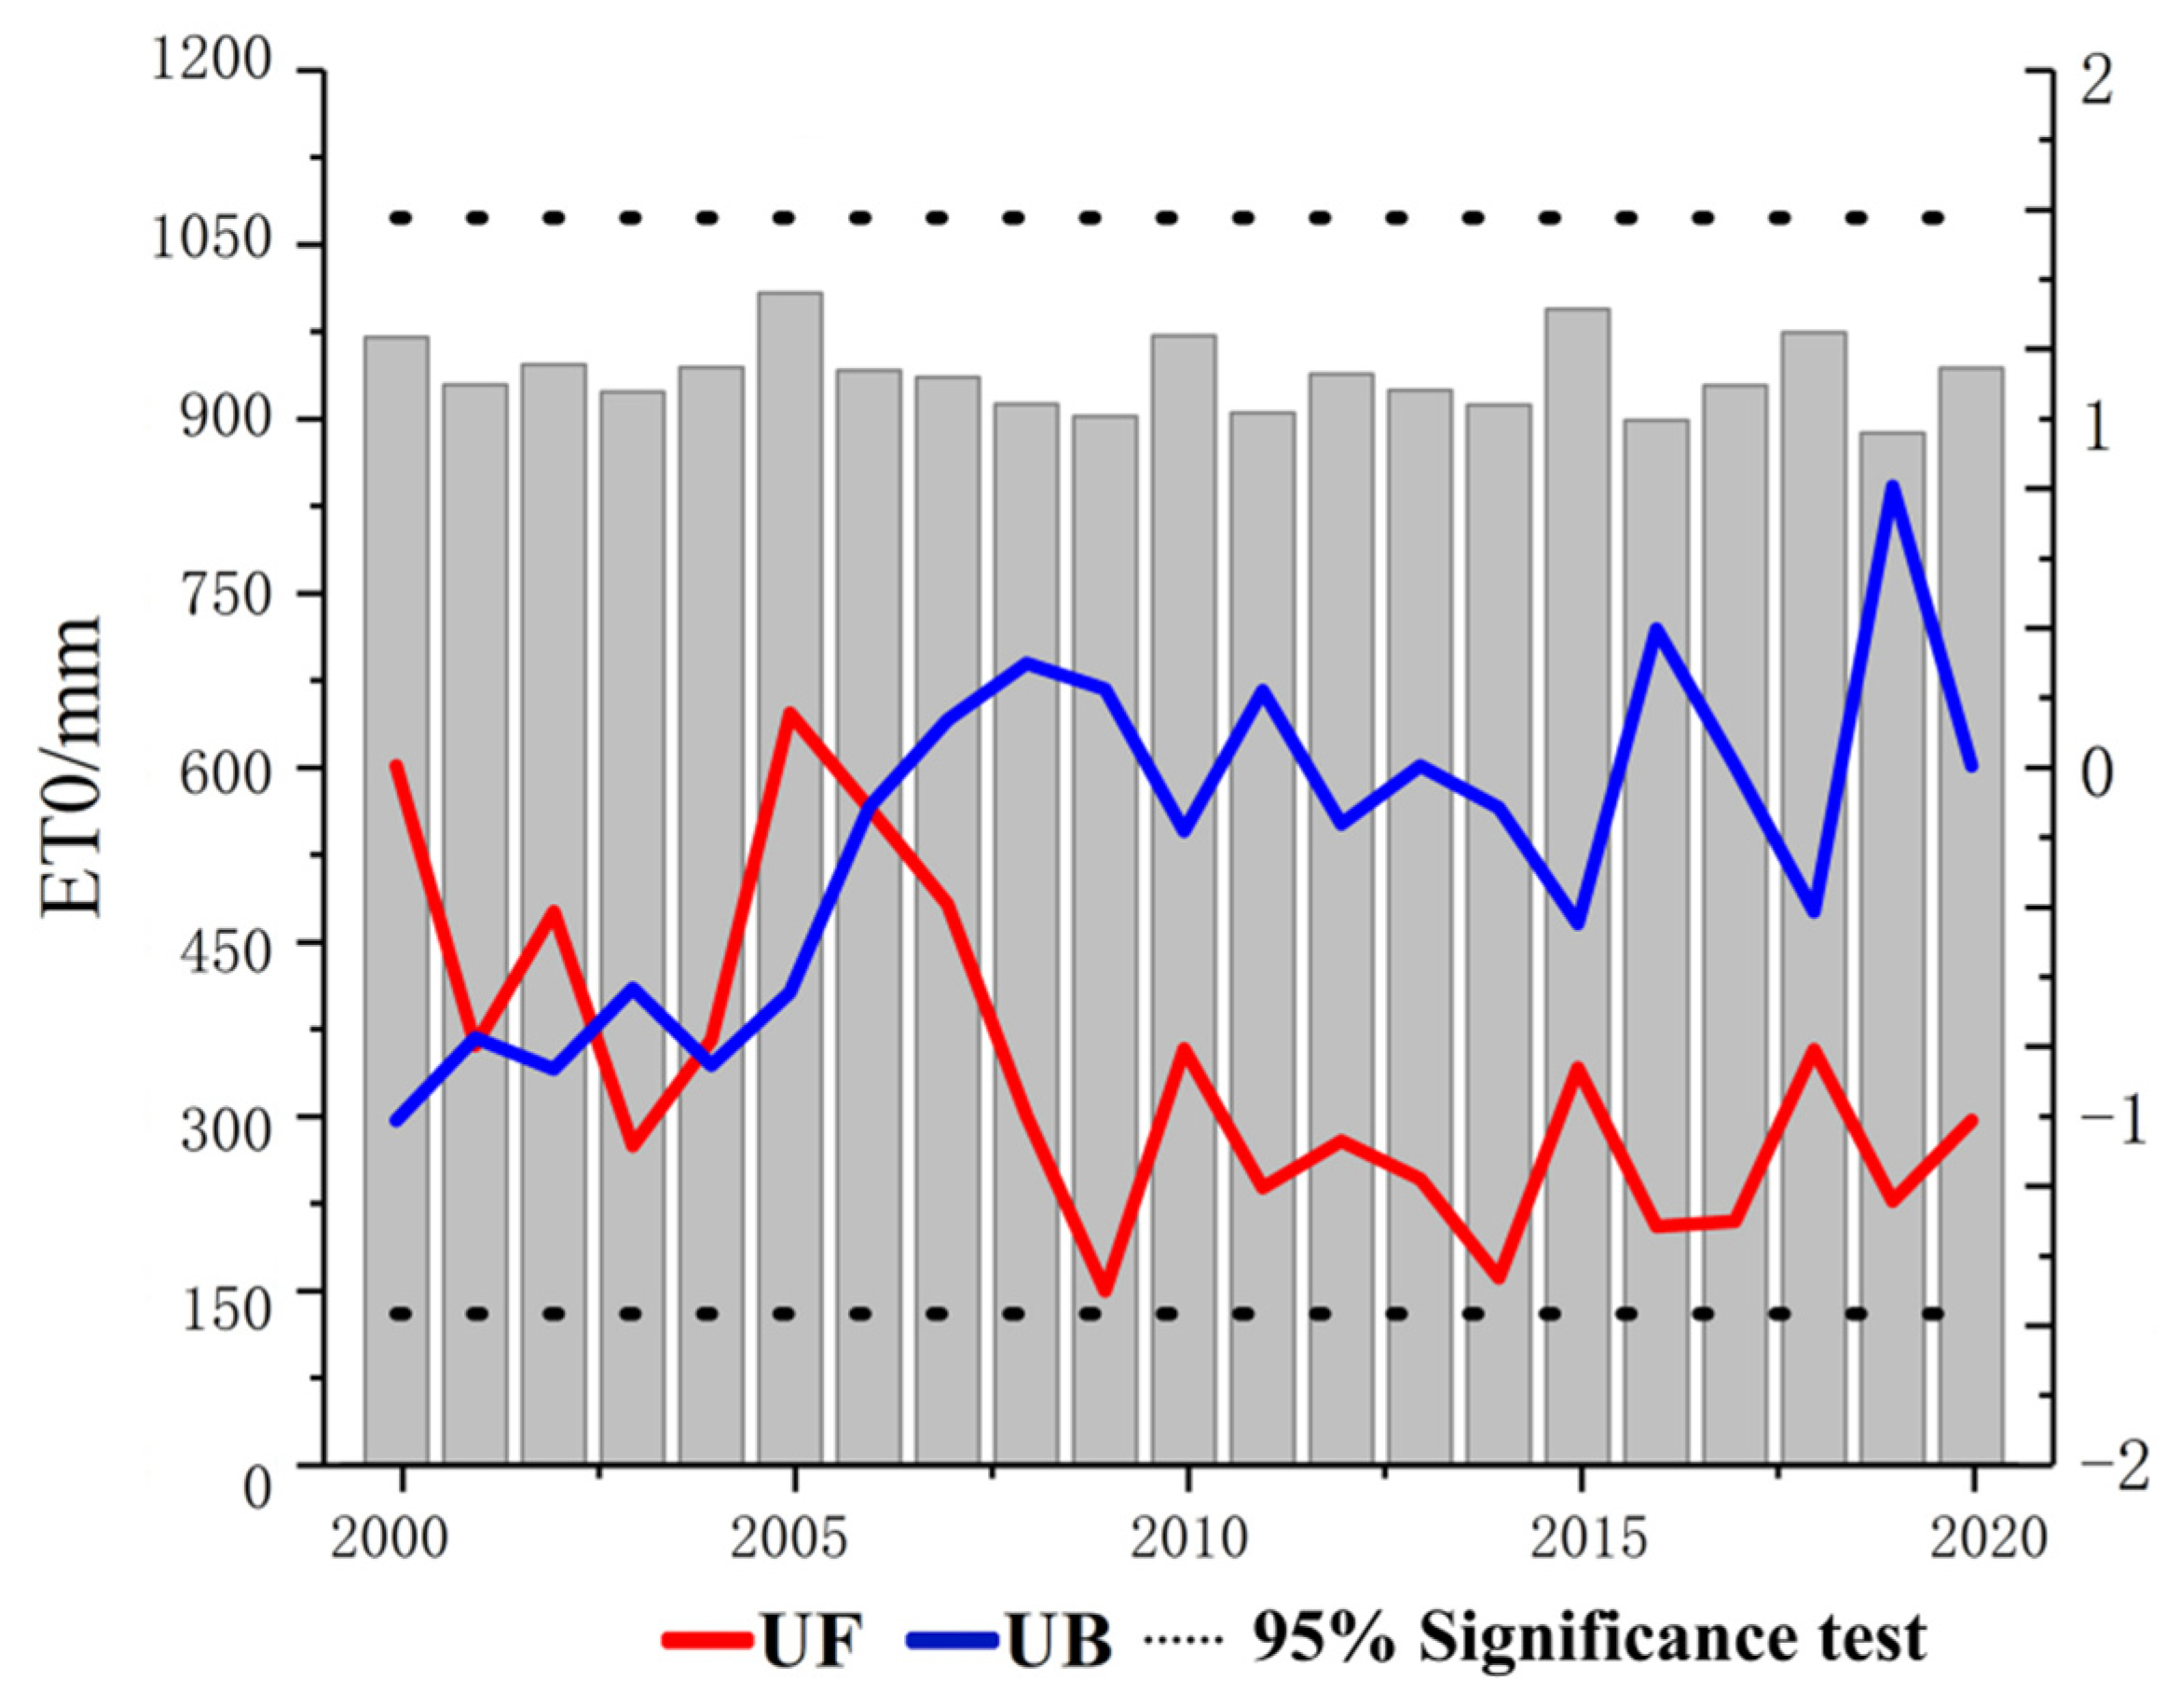
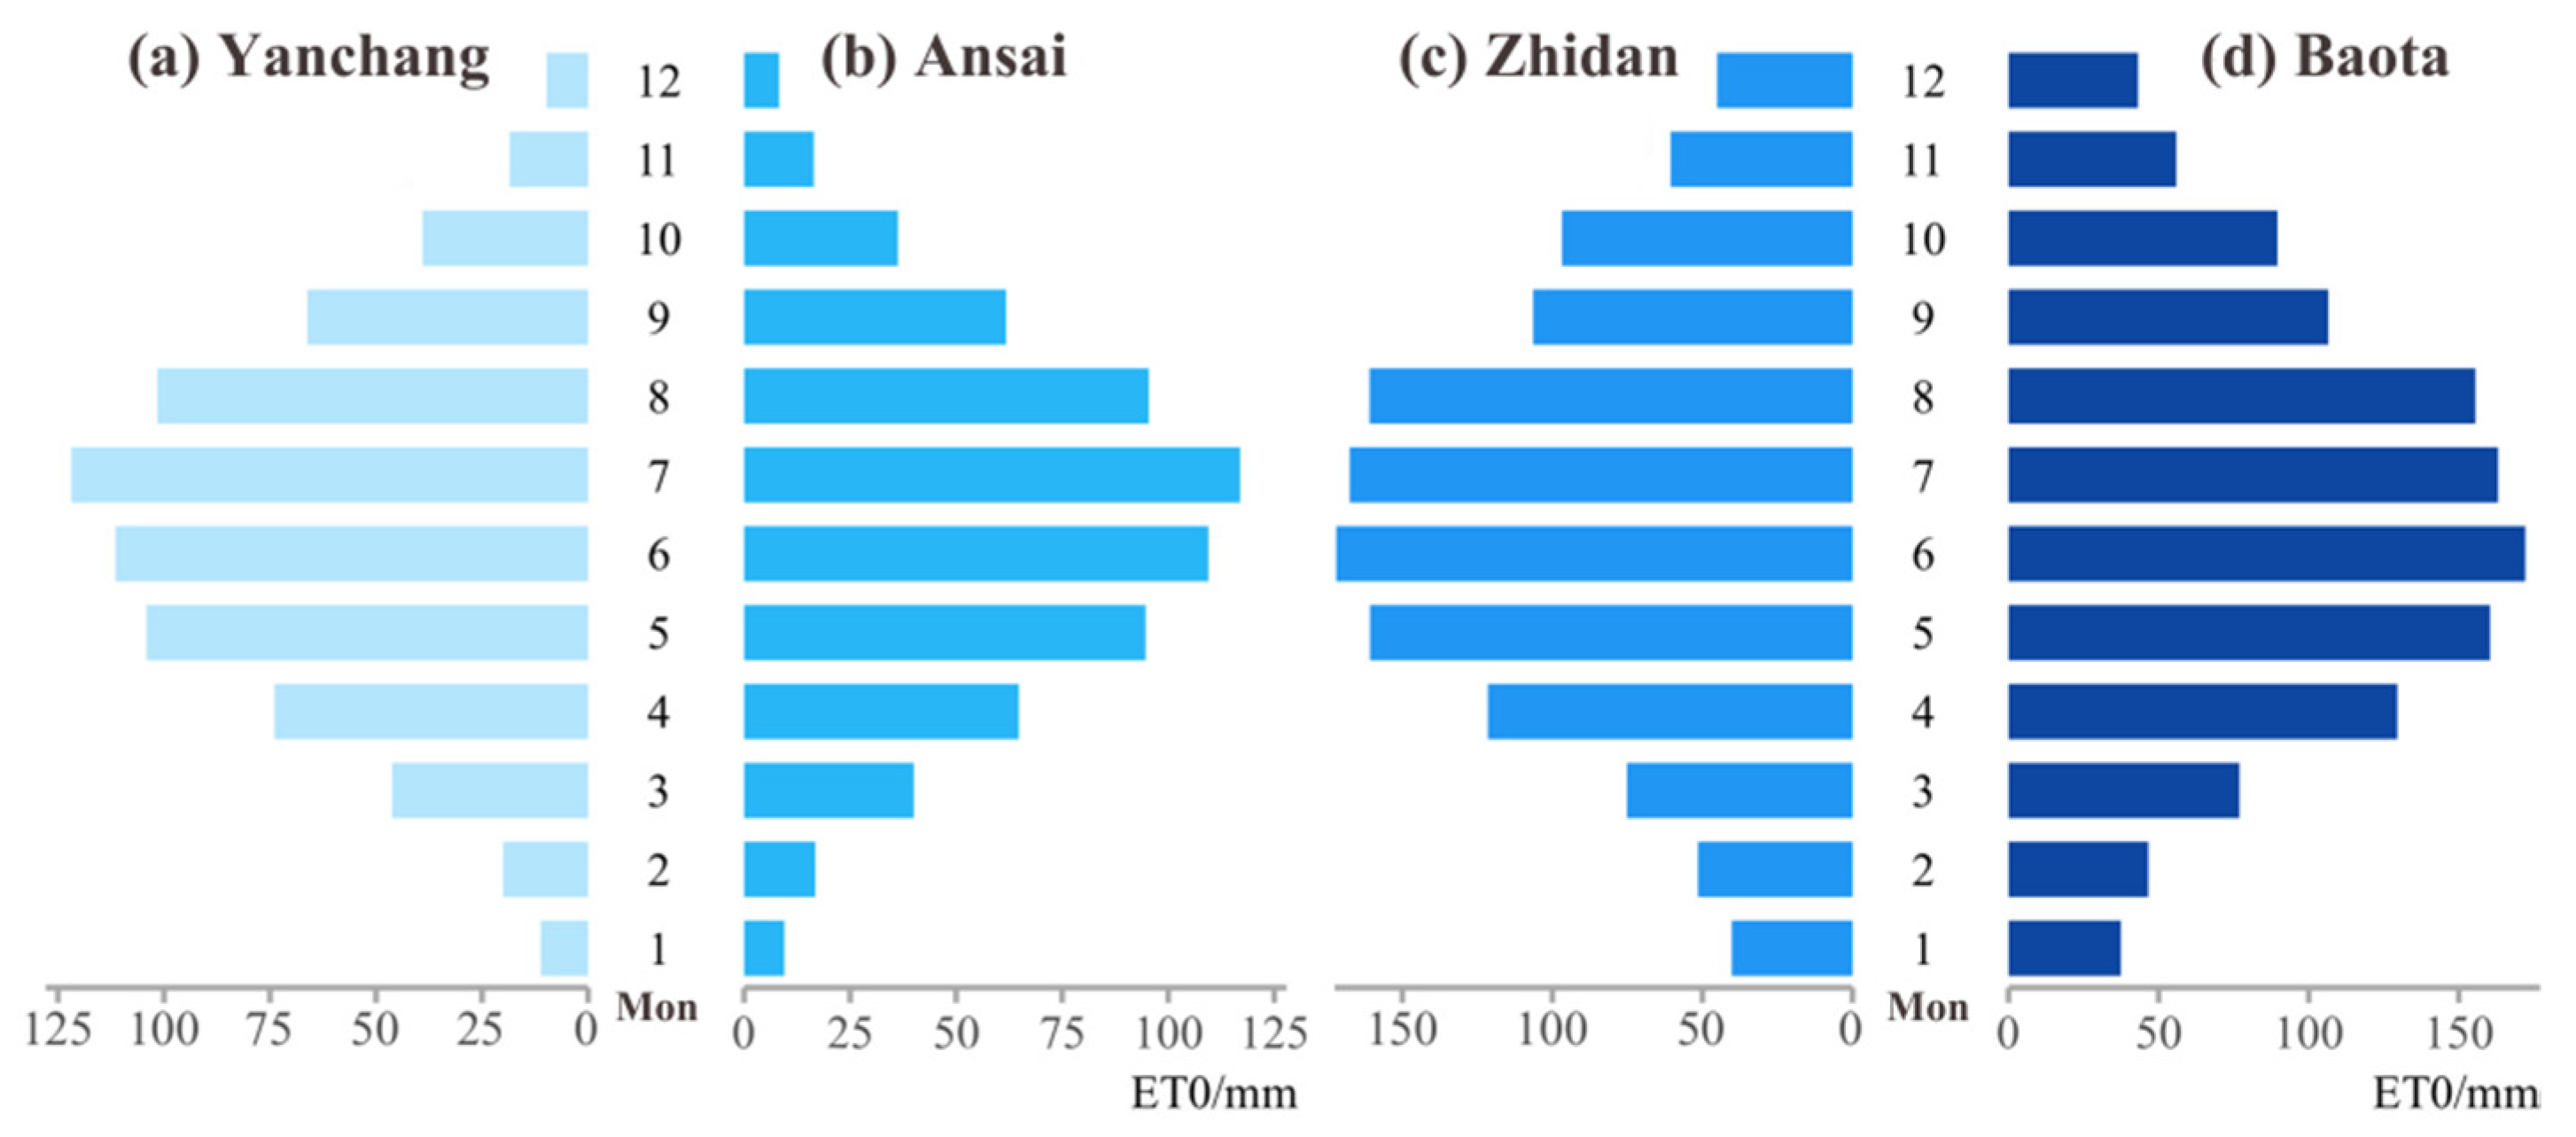
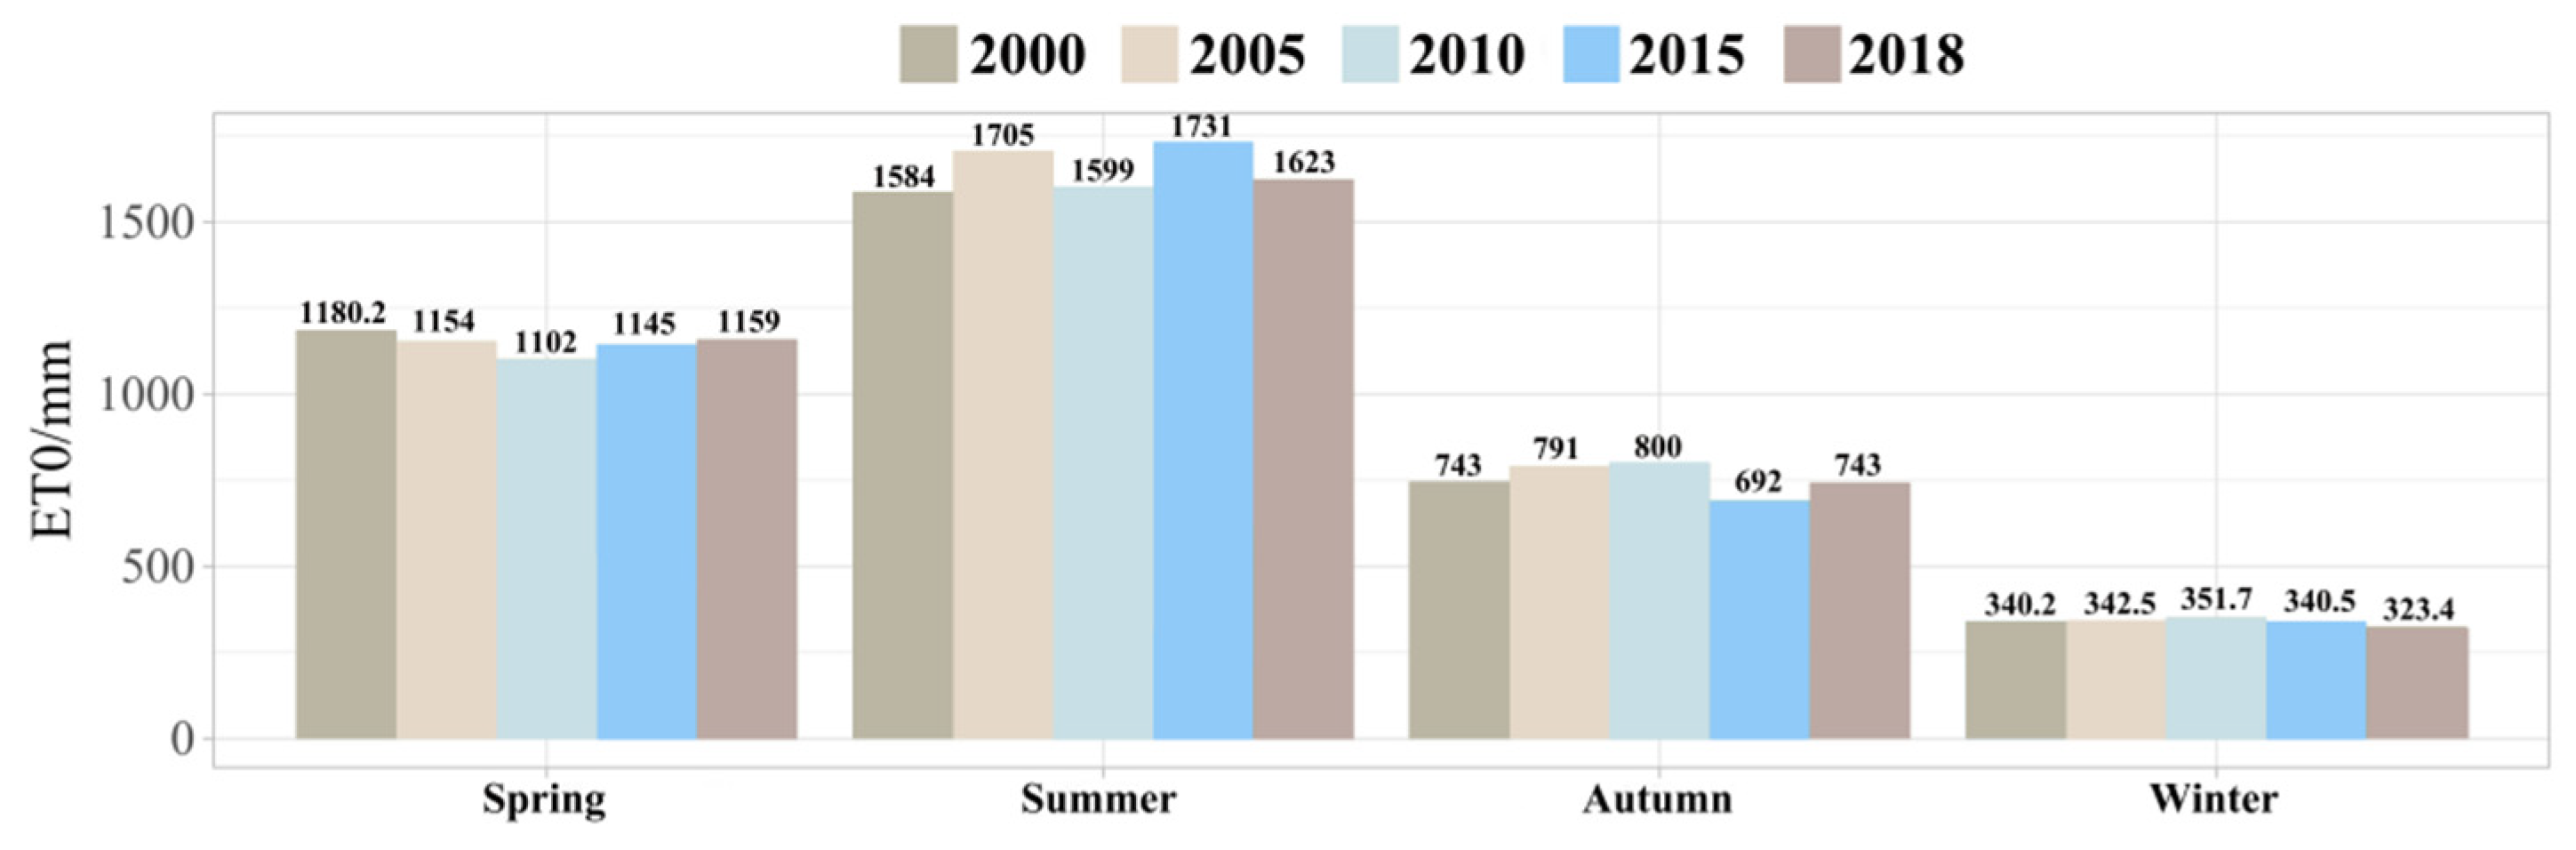
4.1.1. Temporal Characteristics of Potential Evapotranspiration in the Yanhe River Basin
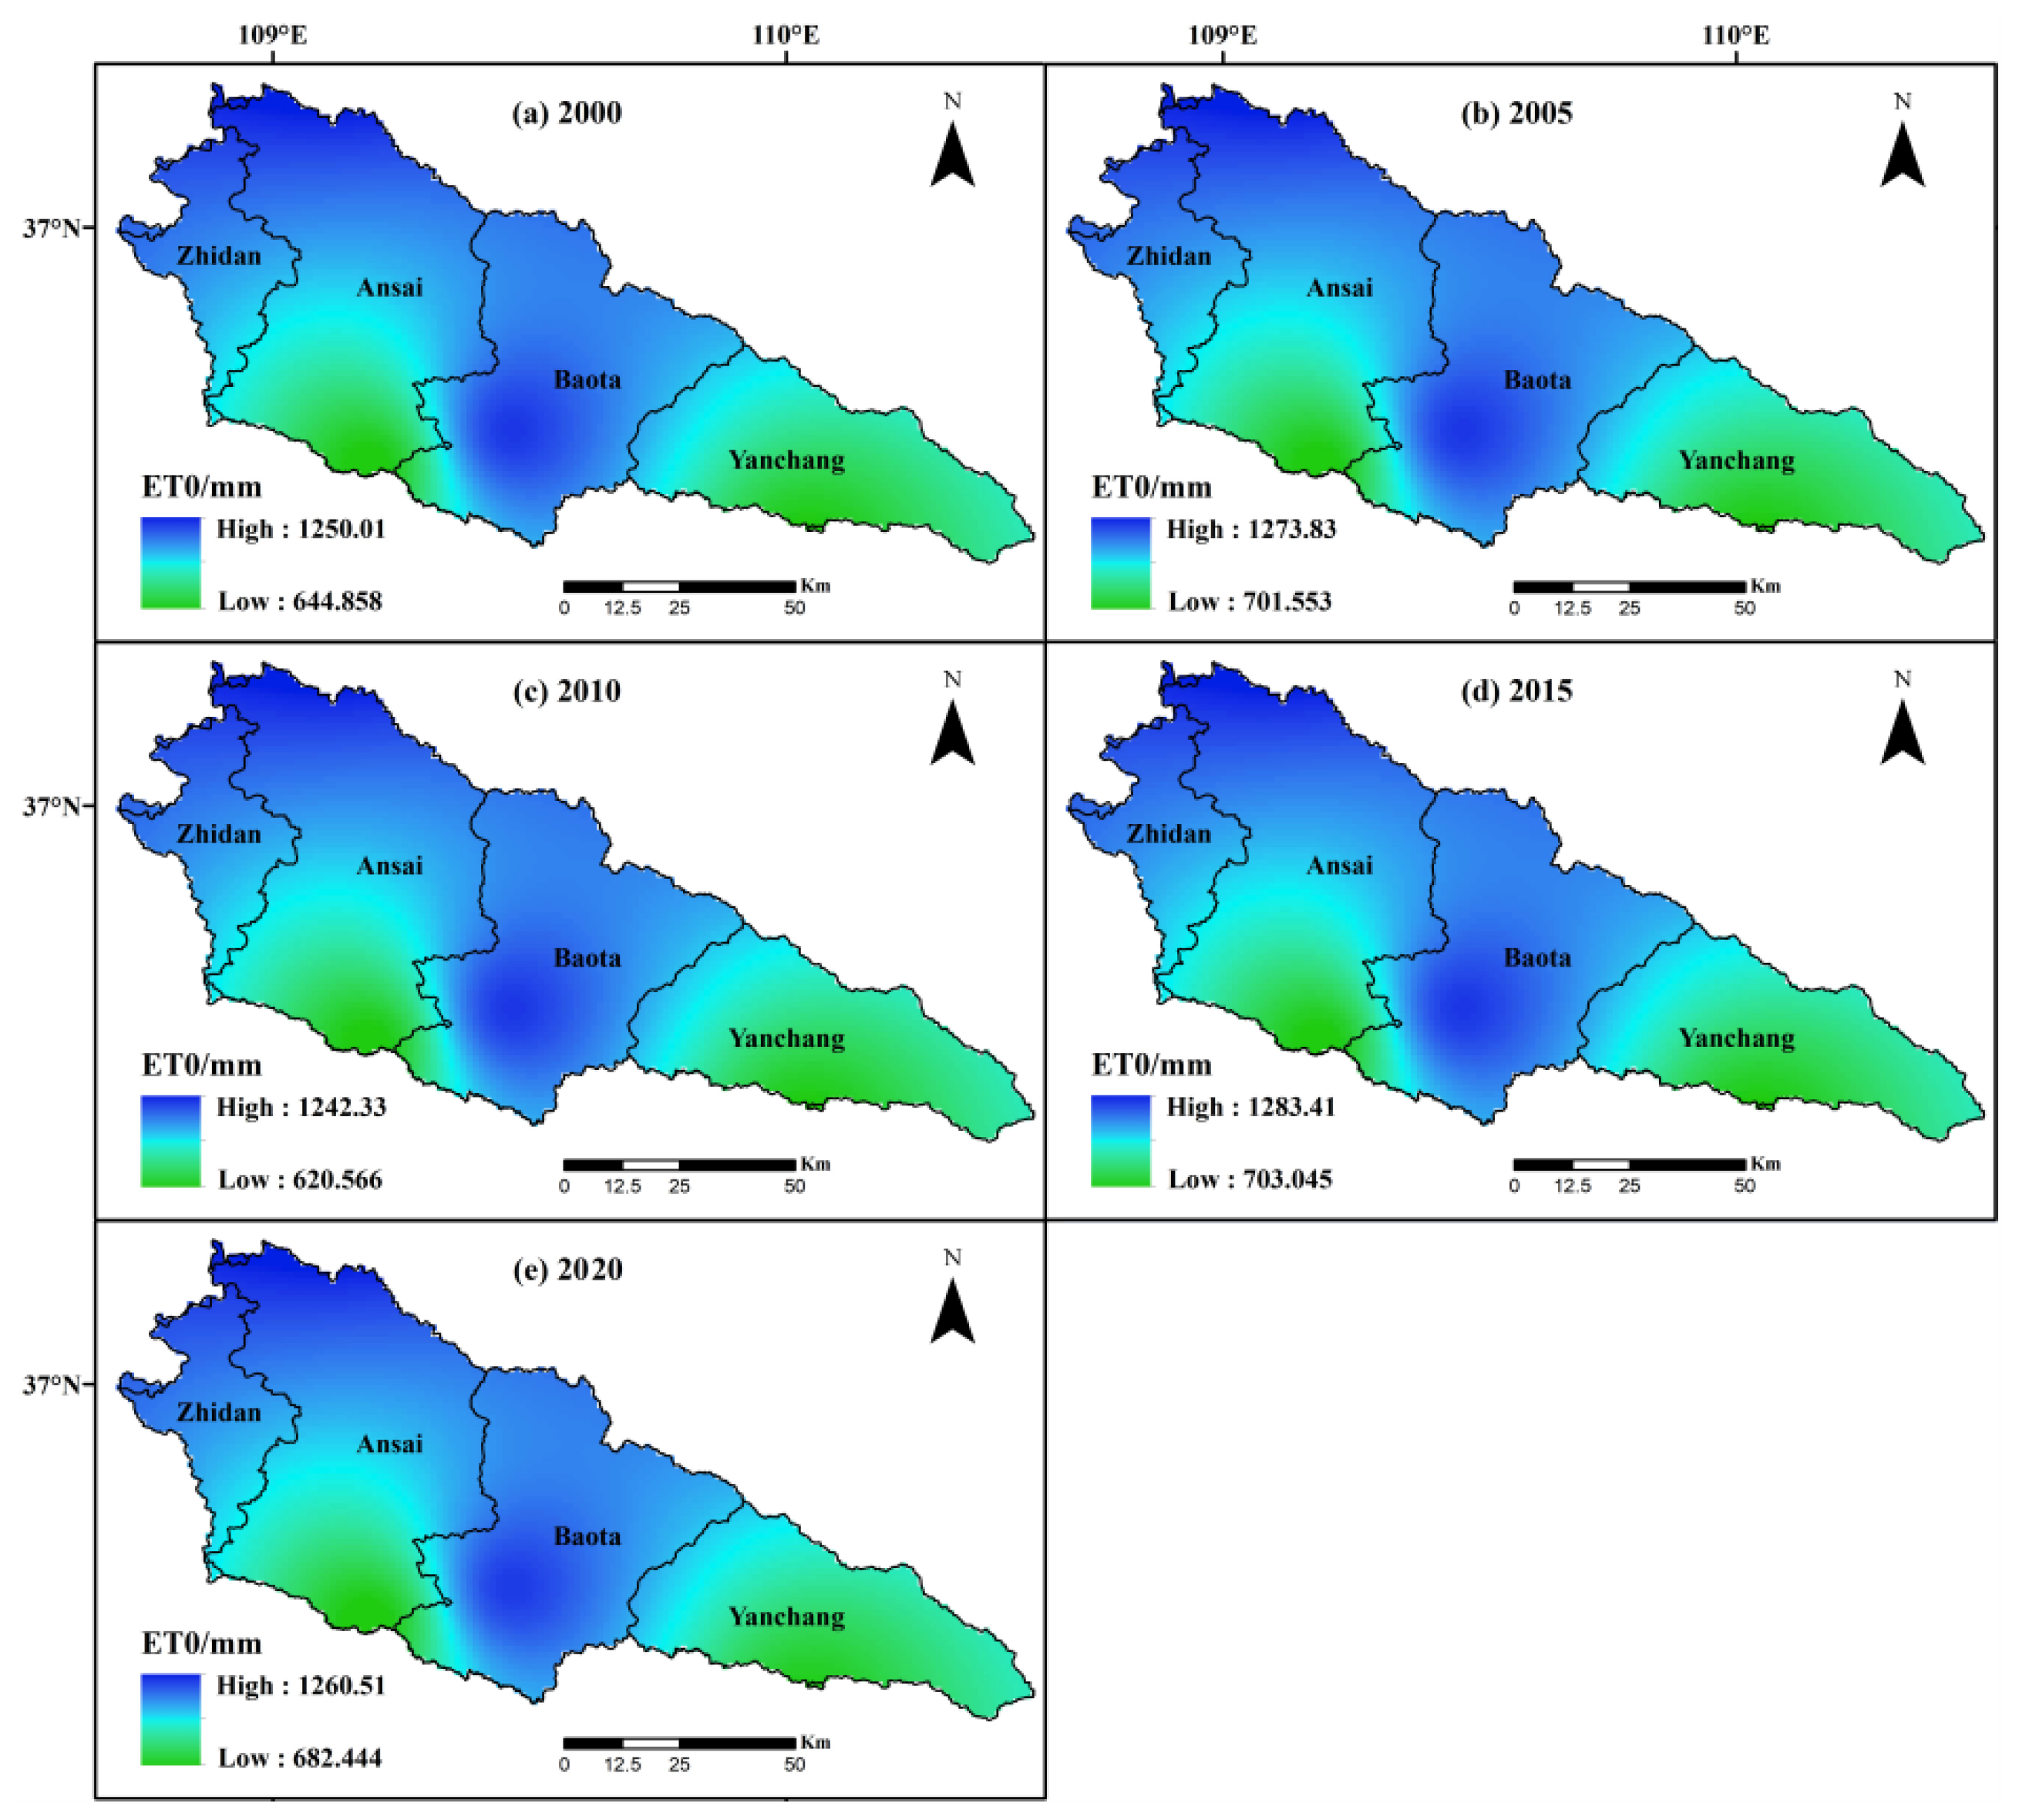
4.1.2. Spatial Characteristics of Potential Evapotranspiration
4.2. Analysis of Land-Use Change Results
4.2.1. Baota Distract
4.2.2. Ansai Distract
4.2.3. Yanchang Distract
4.3. Result of Analysis of Vegetation Water Consumption
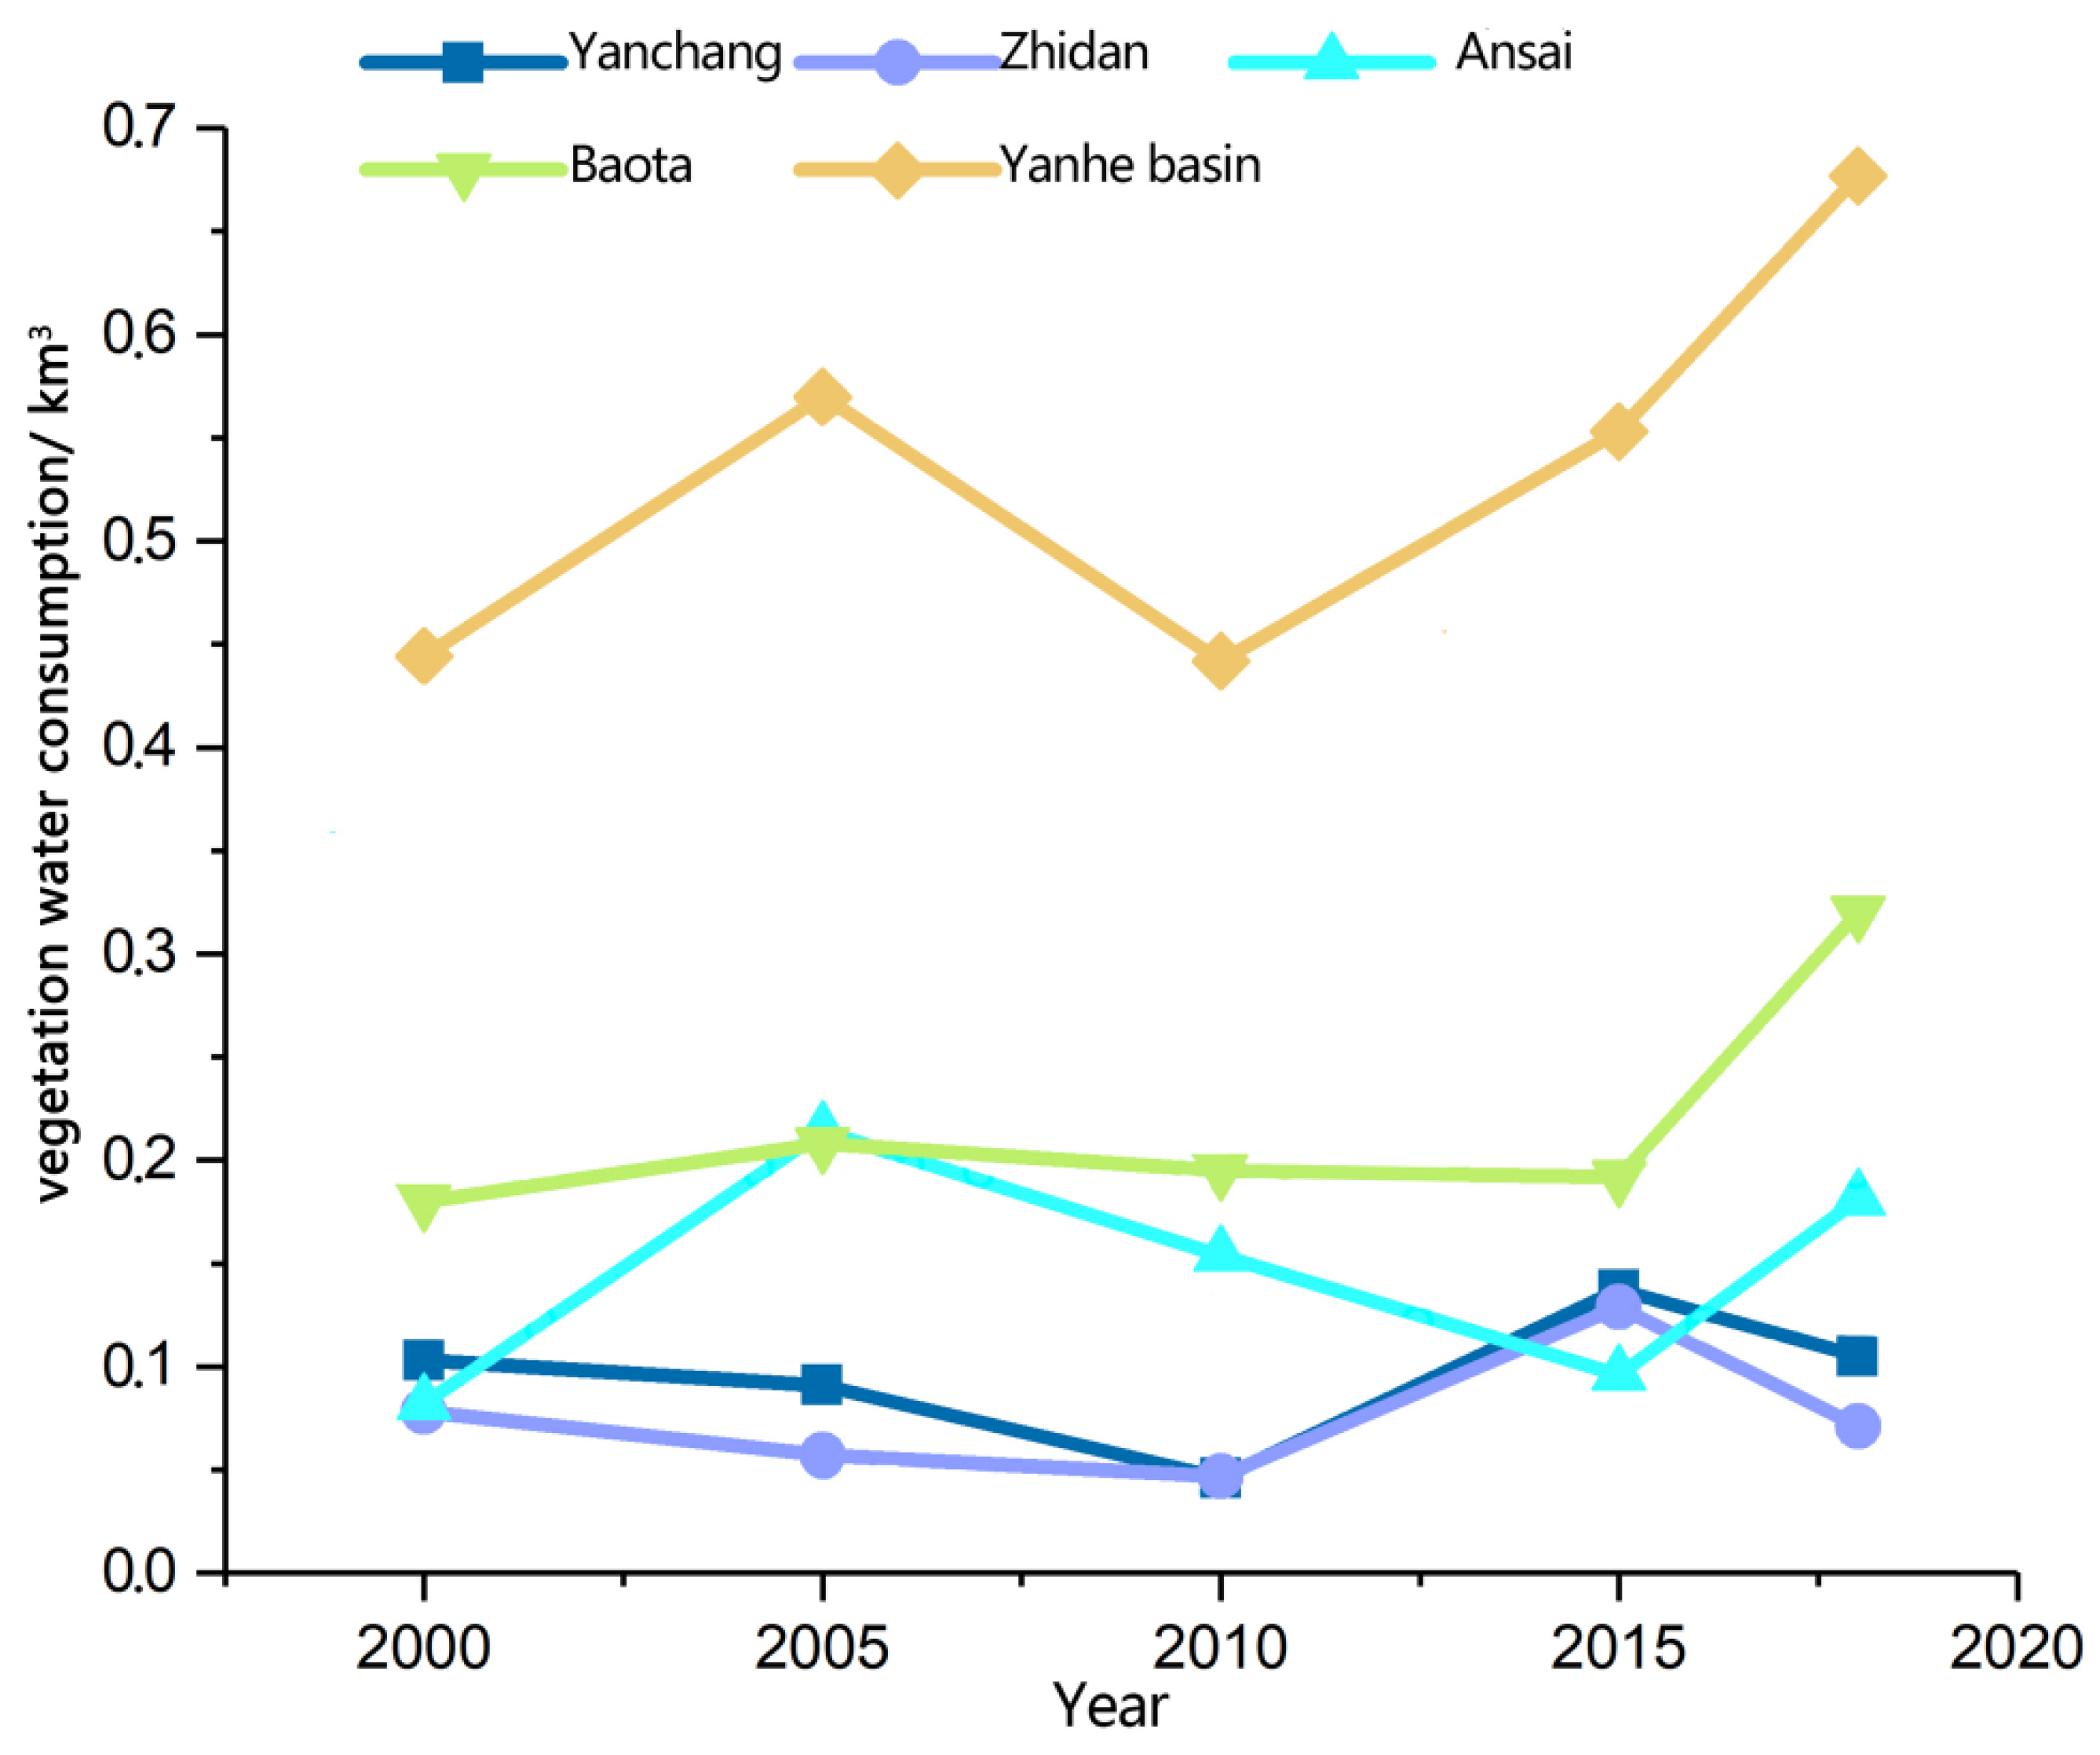
4.3.1. Spatial and Temporal Variation Analysis of Vegetation Water Consumption
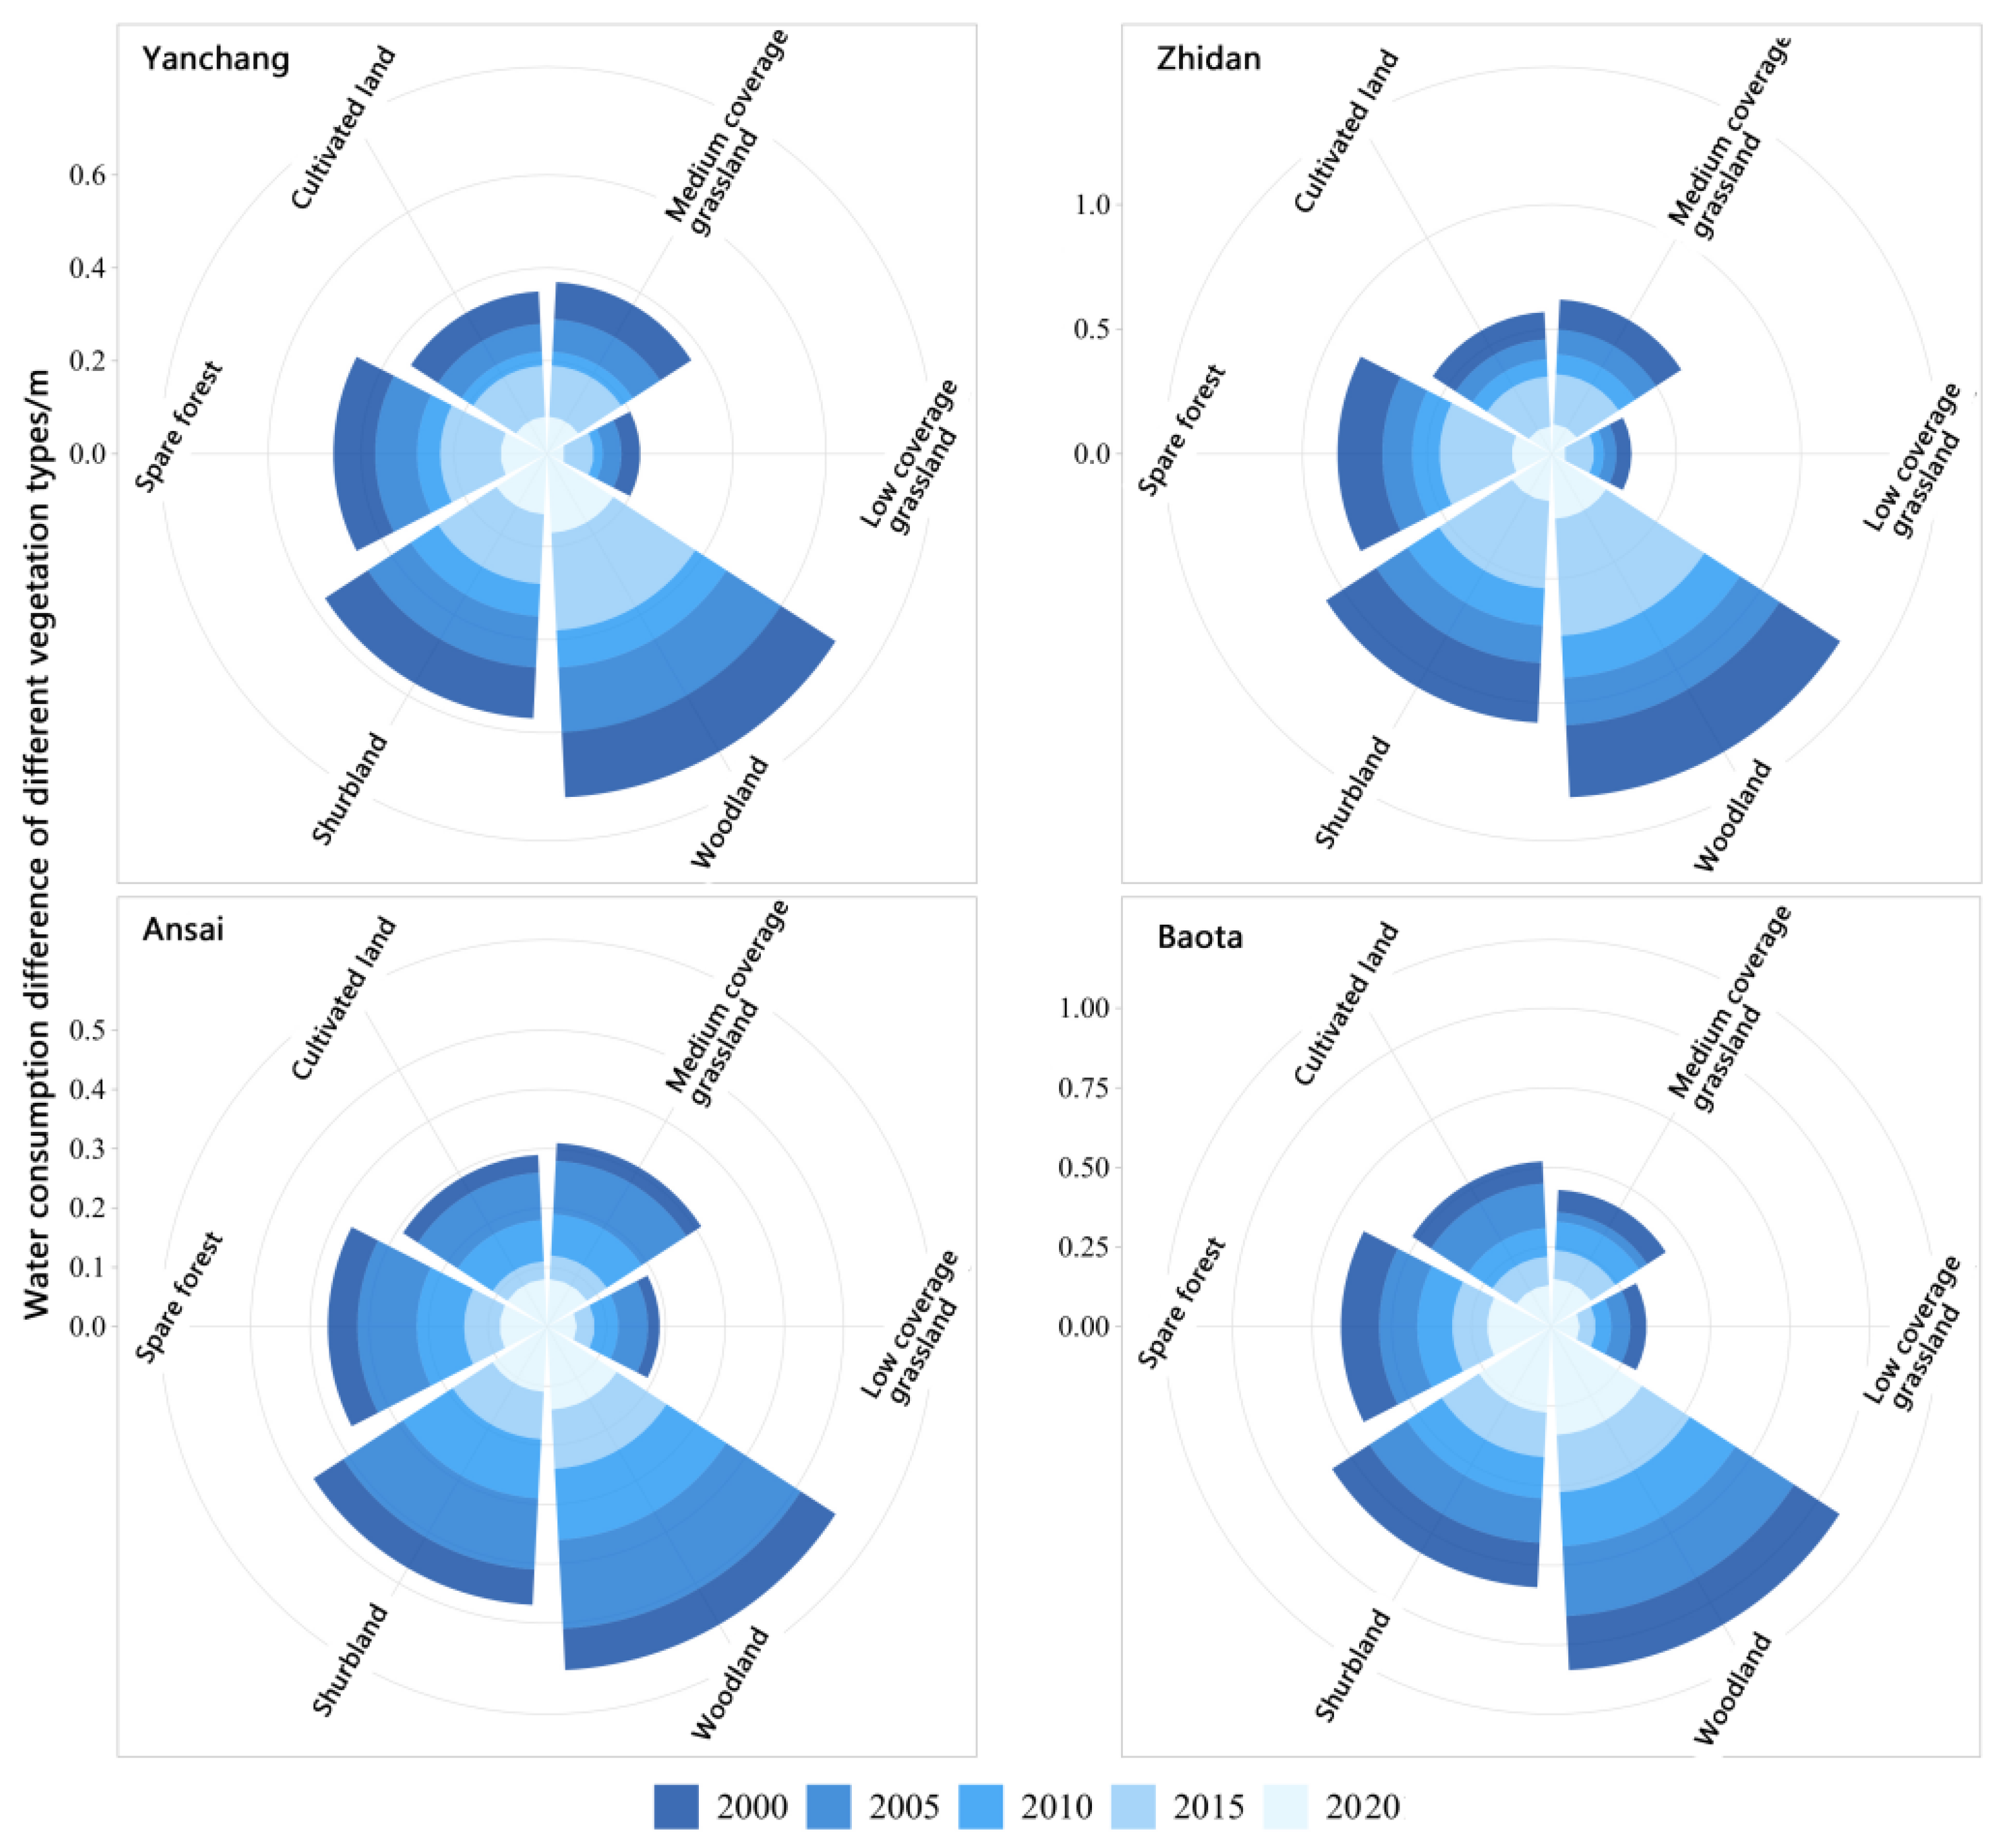
4.3.2. Analysis of Water Consumption Differences between Different Vegetation Types
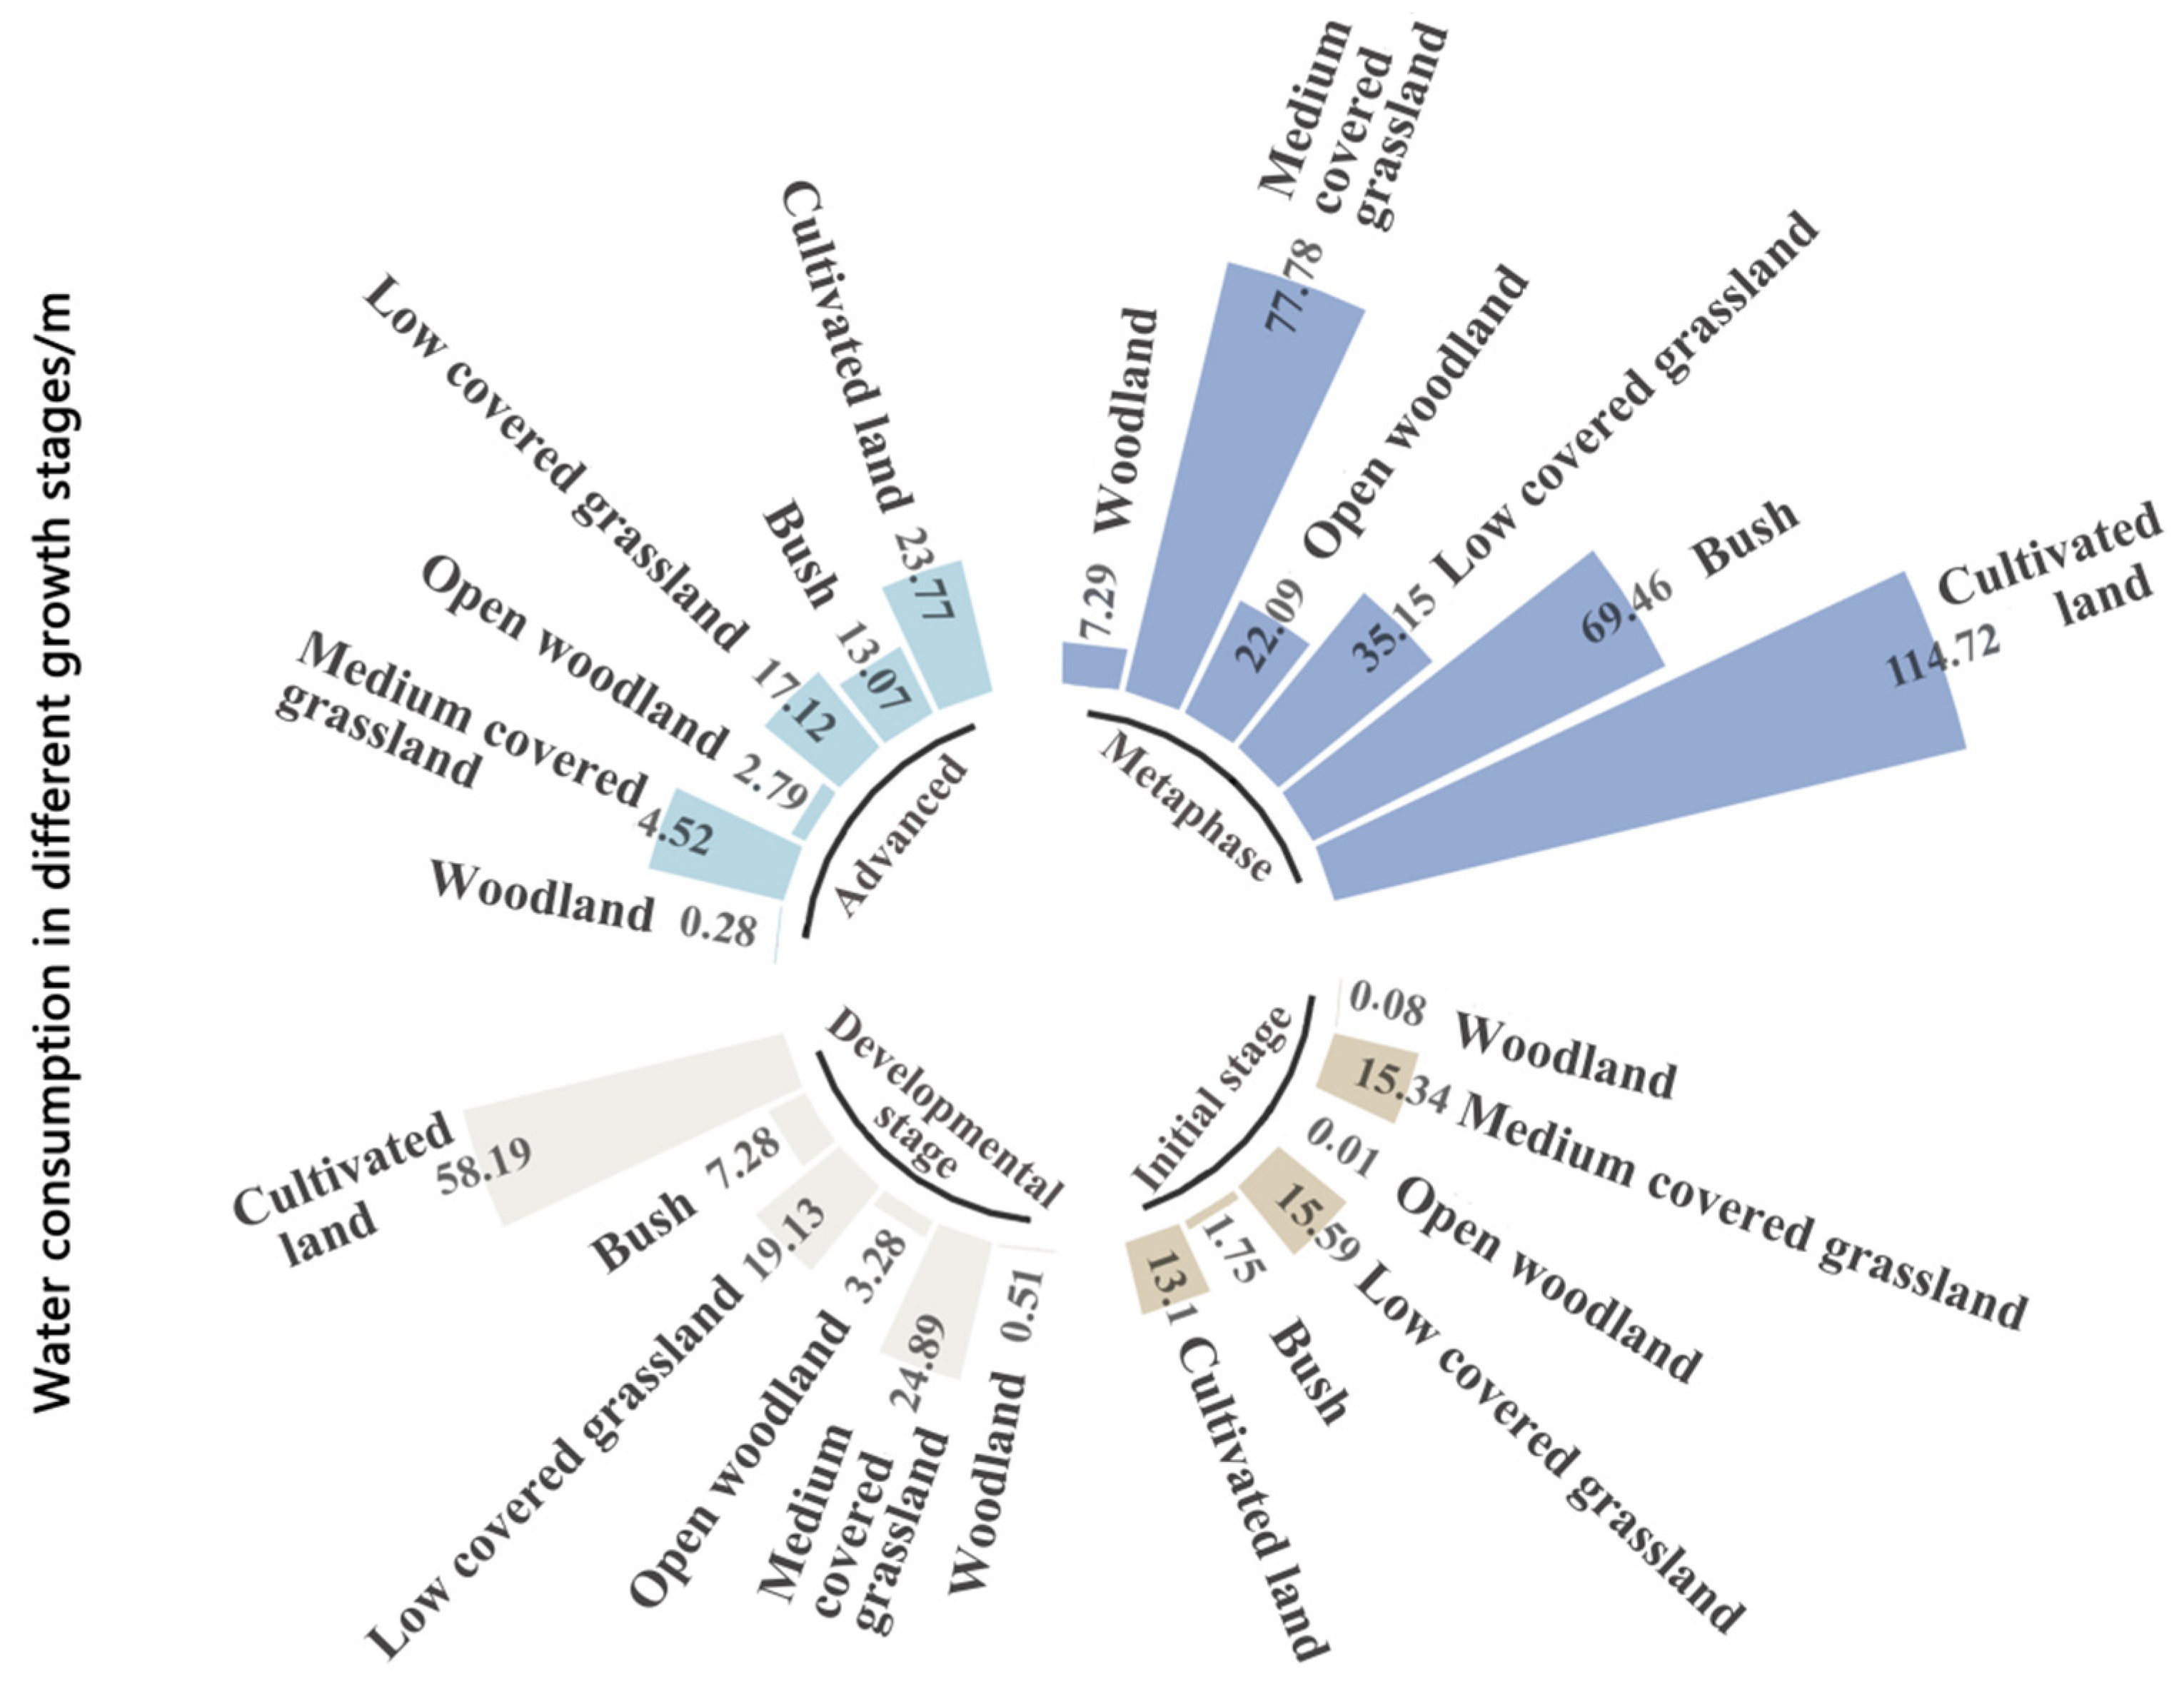
4.3.3. Analysis of Water Consumption in Different Growth Stages of Different Vegetation Years
5. Discussion
6. Conclusions
Author Contributions
Funding
Institutional Review Board Statement
Informed Consent Statement
Data Availability Statement
Acknowledgments
Conflicts of Interest
References
- Project Team of “Strategic Research on Sustainable Development of Water Resources in China in the 21st Century” of Chinese Academy of Engineering. Research Report on sustainable development of water resources in China. Chin. Eng. Sci. 2000, 2, 1–17. [Google Scholar]
- Wei, L.; Zheng, X.; Guo, J.; Zhou, Y.; Yue, D. Study on spatial and temporal distribution of vegetation water consumption in Shule River Basin Based on improved Penman formula. Res. Arid. Areas 2020, 37, 1416–1426. [Google Scholar]
- Jiang, Y. Review and Prospect of China’s urbanization in the century. Qiusuo 2001, 11, 27–30. [Google Scholar]
- Cao, Z. The disadvantages of the existing urbanization mode in the western region and the realistic choice preference. Contemp. Econ. Res. 2011, 13, 60–64. [Google Scholar]
- Yu, S.; Liu, Z.; Guo, J.; Wang, Y.; Yu, P.; Wang, L. Transpiration characteristics and influencing factors of Larch stands in Liupan Mountain. J. Nanjing For. Univ. Nat. Sci. Ed. 2021, 45, 131–140. [Google Scholar]
- Chen, H.; Zeng, X. Simulation study on the effect of vegetation interannual change on evapotranspiration. J. Ecol. 2013, 33, 4343–4353. [Google Scholar]
- Allen, R.G.; Pereira, L.S.; Smith, M. Dual crop coefficient method for estimating evaporation from soil and application extensions. J. Irrig. Drain. Eng. 2005, 131, 2–13. [Google Scholar] [CrossRef]
- Lu, C.; Zhao, T.; Shi, X.; Cao, S. Ecological restoration by afforestation may increase groundwater depth and create potentially large ecological and water opportunity costs in arid and semiarid China. J. Clean. Prod. 2020, 176, 1213–1222. [Google Scholar] [CrossRef]
- Vicente-Serrano, S.M.; Gouveia, C.; Camarero, J.J. Response of vegetation to drought time-scales across global land biomes. Proc. Natl. Acad. Sci. USA 2013, 110, 52. [Google Scholar] [CrossRef]
- Jiang, T.; Su, X.; Guo, S.; Wu, H. Spatial and temporal variation of vegetation water consumption in Northwest China and its response to meteorological drought. J. Water Conserv. 2021, 52, 229–240. [Google Scholar]
- Peng, F.; He, X.; Liu, B.; Zhang, S.; Zhang, Y. Study on calculation method of ecological water demand of desert vegetation in arid area. Water Sav. Irrig. 2017, 15, 90–93. [Google Scholar]
- He, Y.T.; Min, Q.W.; Li, W.H. Progress and perspectives on ecological water requirement of vegetation. Resour. Sci. 2005, 27, 8–12. [Google Scholar]
- Liu, X.; Xu, M.; Ling, H.; Fu, J.; Zhao, X. Estimation of ecological water demand in the lower reaches of Tarim River. Deserts China 2013, 33, 1198–1205. [Google Scholar]
- Zhang, K.; Han, Y.X.; Si, J.H.; Han, H. Ecological water demand and ecological reconstruction in Minqin Oasis. Chin. J. Ecol. 2006, 25, 813–817. [Google Scholar]
- Zhang, L. Ecological water requirement based on ecological protection and restoration targets in the lower reaches of the Heihe river, northern China. Front. For. China 2009, 4, 263–270. [Google Scholar] [CrossRef]
- Ye, H.; Chen, S.; Sheng, F. Study on the water demand dynamics of vegetation ecological suitability in Shule River irrigation area from 2000 to 2014. Glacier Frozen Soil 2016, 38, 231–240. [Google Scholar]
- Li, W.; Yin, H.; Wang, W.; Lu, Y.; Wang, Y. Analysis of the difference between saturated bare soil and water surface evaporation based on field observation and energy conservation principle. Hydro-Geol. Eng. Geol. 2021, 48, 38–44. [Google Scholar]
- Li, W.; Brunner, P.; Franssen, H.H.; Li, Z.; Wang, W. Potential evaporation dynamics over saturated bare soil and an open water surface. J. Hydrol. 2020, 590, 125140. [Google Scholar] [CrossRef]
- Chi, D.; Wang, H.; Li, X.; Liu, H.; Li, X. Estimation of the ecological water requirement for natural vegetation in the Ergune river basin in northeastern China from 2001 to 2014. Ecol. Indic. 2020, 92, 141–150. [Google Scholar] [CrossRef]
- Wang, G.; Wang, Q.; Shi, S. Study on ecological water demand of forest and grass vegetation in Yongding River Basin of Shanxi Province. J. Nat. Resour. 2013, 28, 95–105. [Google Scholar]
- Wang, L.; Zhang, J.; Liu, Z.; Han, J.; Mao, Z. Ecological water requirement of plant-soil systems along the Silk Road Economic Belt: A case study of the Guanzhong—Tianshui region, China. Geol. J. 2020, 53, 293–300. [Google Scholar] [CrossRef]
- Wang, G.X.; Cheng, G.D. Waterdemand of ecosystem and estimate method in arid inland riverbasin. J. Ofdesert Res. 2002, 22, 129–134. [Google Scholar]
- Feng, H.L.; Zheng, H.X.; Cao, Y. On theories and methodologies of ecological water demand estimation. J. Nan Jing Xiao Zhuang Coll. 2005, 21, 50–55. [Google Scholar]
- Cheng, S.Y.; Liu, B.Q. Current state and progress of research on ecological and environmental water requirements. Water Sci. Eng. Technol. 2005, 11, 39–41. [Google Scholar]
- Wang, F.; Wang, H.; Chen, M.J.; Yan, W.; Tang, K. A study of ecological water requirements in Northwest China Part II:Application of-remote sensing and GIS. J. Nat. Resour. 2002, 17, 129–137. [Google Scholar]
- Mu, Q.; Zhao, M.; Running, S.W. Improvements to a MODIS global terrestrial evapotranspiration algorithm. Remote Sens. Environ. 2011, 115, 1781–1800. [Google Scholar] [CrossRef]
- Kim, H.W.; Hwang, K.; Mu, Q.; Oh Lee, S.; Choi, M. Validation of MODIS 16 global terrestrial evapotranspiration products in various climates and land cover types in Asia. KSCE J. Civ. Eng. 2012, 16, 229–238. [Google Scholar] [CrossRef]
- Dzikiti, S.; Jovanovic, N.Z.; Bugan, R.D.; Ramoelo, A.; Majozi, N.P.; Nickless, A.; Cho, M.A.; le Maitre, D.C.; Ntshidi, Z.; Pienaar, H.H. Comparison of two remote sensing models for estimating evapotranspiration: Algorithm evaluation and application in seasonally arid ecosystems in South Africa. J. Arid. Land 2019, 11, 495–512. [Google Scholar] [CrossRef]
- Wu, G.; Liu, Y.; Zhao, X.; Ye, C. Temporal and spatial distribution characteristics of surface evapotranspiration in Poyang Lake Basin Based on MOD16 products. Geogr. Res. 2013, 32, 617–627. [Google Scholar]
- Yang, X. Influence of multi-scale landscape pattern on runoff and sediment transport process in the Loess Plateau. Yangling Shaanxi Northwest Univ. Agric. For. 2019, 34, 74–81. [Google Scholar]
- Jiao, J.; Wang, Z.; Wei, Y.; Su, Y.; Cao, B.; Li, Y. Field observation and analysis of erosion and sediment yield characteristics under Extreme Rainstorm in Yanhe River Basin. J. Agric. Eng. 2017, 33, 159–167. [Google Scholar]
- Wei, L. Research on ecological water demand of natural vegetation in Shule River Basin Based on spatial optimization of ecological carrying capacity. Lanzhou Univ. 2021, 42, 114–127. [Google Scholar]
- Allen, R.G.; Pereira, L.S.; Raes, D.; Smith, M. Crop evapotranspiration guidelines for computing crop requirements. FAO Irrig. Drain. Report modeling and application. J. Hydrol. 1998, 285, 19–40. [Google Scholar]
- Li, W.; Hendricks Franssen, H.-J.; Brunner, P.; Li, Z.; Wang, Z.; Wang, Y.; Wang, W. The role of soil texture on diurnal and seasonal cycles of potential evaporation over saturated bare soils—Lysimeter studies. J. Hydrol. 2022, 613, 128194. [Google Scholar] [CrossRef]
- Mann, H.B. Nonparametric tests against trend. Econometrica 1945, 13, 245–259. [Google Scholar] [CrossRef]
- Kendall, M.G. Rank Correlation Methods; Charles Griffin: London, UK, 1975. [Google Scholar]
- Zhu, H.; Li, X. Discussion on regional land use change index model. J. Geogr. 2003, 58, 643–650. [Google Scholar]
- Luo, Y.; Yin, D.; Mu, X.; Gao, P.; Zhao, G. Analysis on space-time characteristics and influencing factors of actual evapotranspiration in Yanhe River Basin. Sci. Soil Water Conserv. China 2021, 19, 51–59. [Google Scholar]
- Gao, G.; Shen, Q.; Zhang, Y.; Pan, N.; Ma, Y.; Jiang, X.; Fu, B. Determining spatio-temporal variations of ecological water consumption by natural oases for sustainable water resources allocation in a hyper-arid endorheic basin. J. Clean. Prod. 2018, 185, 1–13. [Google Scholar] [CrossRef]
- Kang, D.; Tian, M.; Gao, J.; Bai, S.; Li, S. Water consumption characteristics of forest and grass evapotranspiration under vegetation restoration in Chifeng City based on SEBAL model. Environ. Sci. Res. 2021, 34, 399–408. [Google Scholar]


Publisher’s Note: MDPI stays neutral with regard to jurisdictional claims in published maps and institutional affiliations. |
© 2022 by the authors. Licensee MDPI, Basel, Switzerland. This article is an open access article distributed under the terms and conditions of the Creative Commons Attribution (CC BY) license (https://creativecommons.org/licenses/by/4.0/).
Share and Cite
Guo, T.; Hou, Q.; Wu, Y.; Zhang, L. Spatial and Temporal Evolution of Vegetation Water Consumption in Arid and Semi-Arid Areas against the Background of Returning Farmland to Forestland. Sustainability 2022, 14, 14959. https://doi.org/10.3390/su142214959
Guo T, Hou Q, Wu Y, Zhang L. Spatial and Temporal Evolution of Vegetation Water Consumption in Arid and Semi-Arid Areas against the Background of Returning Farmland to Forestland. Sustainability. 2022; 14(22):14959. https://doi.org/10.3390/su142214959
Chicago/Turabian StyleGuo, Ting, Quanhua Hou, Yan Wu, and Lingda Zhang. 2022. "Spatial and Temporal Evolution of Vegetation Water Consumption in Arid and Semi-Arid Areas against the Background of Returning Farmland to Forestland" Sustainability 14, no. 22: 14959. https://doi.org/10.3390/su142214959
APA StyleGuo, T., Hou, Q., Wu, Y., & Zhang, L. (2022). Spatial and Temporal Evolution of Vegetation Water Consumption in Arid and Semi-Arid Areas against the Background of Returning Farmland to Forestland. Sustainability, 14(22), 14959. https://doi.org/10.3390/su142214959