Article

The Effects of Meridian Surface Shape on the Pressure Pulsation of a Multi-Stage Electric Submersible Pump

1
CNOOC EnerTech Drilling & Production Co. Ltd., Tianjin 300452, China
2
National Research Center of Pumps, Jiangsu University, Zhenjiang 212013, China
*
Author to whom correspondence should be addressed.
Sustainability 2022, 14(22), 14950; https://doi.org/10.3390/su142214950
Submission received: 23 September 2022 / Revised: 2 November 2022 / Accepted: 5 November 2022 / Published: 11 November 2022
(This article belongs to the Special Issue Ocean and Hydropower)

Abstract

:
The influence mechanism of the internal pressure fluctuation propagation law of multi-stage submersible electric pump (ESP) is still unclear, which has been a major problem restricting the stable exploitation of deep-sea oil and gas. In order to investigate the effect of different meridian profiles on the pressure pulsation characteristics of three-stage submersible electric pumps, the unsteady Reynolds-averaged Navier–Stokes (URANS) method is used to numerically investigate it. The results show that the lower the pressure pulsation amplitude in the pump caused by the meridional shape that is more in line with the flow law, has a positive effect on the operation stability. The change of the shape of the meridian greatly affects the pressure pulsation law in the secondary and final pumps. The rotor–stator interaction causes the pressure pulsation amplitude of the monitoring point in the middle of the pump chamber to reach a peak value. By using continuous wavelet transform analysis, it is found that the regularity of 1–2 times frequency conversion is complicated due to multiple pulsation sources and low frequency propagation coupling between stages. At 3–6 times frequency, it is basically close to the pulsation rule of the blade frequency. The above research provides a basis for improving the operation stability of the ESP.

1. Introduction

An electric submersible pump (ESP) is widely used in oil and gas production as an efficient artificial lift device [1]. However, the typical structure of cascaded supercharging also makes its running stability obviously insufficient. In the 1970s, the problem that the pressure pulsation in the pump affects the operation stability attracted the attention of scholars. At first, the research on the noise and cavitation of the pump began. At that time, the pressure pulsation was regarded as a random signal related to cavitation [2,3,4]. In the early 1980s, Japanese scholars pointed out that the disturbance between the centrifugal pump impeller and the volute separation tongue or the diffuser would lead to the generation of pressure pulsation [5,6,7]. Since then, in order to reduce vibration and noise and improve the stability of pump operation, scholars have conducted in-depth research on the pressure pulsation in the pump through theoretical analysis, numerical simulation and experimental measurement [8,9,10].
Dring et al. [11] pointed out that the rotor–stator interaction between the impeller and the diffuser can be divided into potential flow interference and wake interference. Potential flow interference is the potential flow effect of the inviscid fluid propagating upstream and downstream caused by the relative motion between the impeller and the diffuser and wake interference is a flow field fluctuation that only acts downstream due to the impeller blade wake impacting the inlet edge of the diffuser blades. Chalghoum et al. [12] found that the pressure near the volute tongue of a centrifugal pump is inversely proportional to the angle between the blade outlet and the volute tongue. Arndt et al. [13] found through the centrifugal pump pressure pulsation test that the increase in the number of diffuser blades would lead to a significant weakening of the impeller blade pressure pulsation. Brennen et al. [14] found that the maximum pressure pulsation intensity on the diffuser appeared near the suction leading edge of the blade, while the maximum pressure pulsation intensity on the impeller blade appeared at the trailing edge of the blade. Through experimental research, Khalifa et al. [15] found that reducing the flow rate of the double volute pump would significantly increase the pressure pulsation intensity in the pump. Solis et al. [16] carried out numerical calculation of pressure pulsation for centrifugal pumps with four different structures. Through comparative analysis, it was found that the amplitude of pressure pulsation at the passing frequency of the blade could be reduced by increasing the radial clearance.
Due to the obvious advantages of the CFD method in the study of ESPs, it has not only been used in the design process of ESPs but has also been widely used in the research on the stability of ESPs [17,18]. In the ESP, the hydraulically induced instability is the most complex component in the operation instability of the pump system [19,20]. Inside the ESP, due to the limited number of blades of the impeller, the internal flow field will be unevenly distributed, and then there will be strong dynamic and static coupling with the diffuser, which will induce the constant fluctuation of the pressure in the pump [21,22]. This phenomenon was first discovered by Dring and Joslyn et al. [11,23] in a pump visualization experiment, and was summarized as the phenomenon of rotor–stator interaction. Then, Iino et al. [24] successfully obtained the pressure variation law in an ordinary centrifugal pump through the instantaneous pressure measurement, and summarized the influence of the geometrical dimensions of the rotor components on it. In the follow-up research, Zhang et al. [25] analyzed the rotor–stator interaction and the pressure fluctuation phenomenon caused by numerical calculation method, and successfully established the relationship between the pressure fluctuation law and the number of dynamic and static rotor blades. On the basis of these studies, the researchers further analyzed the pressure pulsation in the pump and the instability effect caused by it through theoretical derivation, numerical calculation and experimental verification. Zhou et al. [26] found that the periodicity of pressure pulsation in the pump is related to the number of blades, but the intensity of pressure pulsation in each model is not related to the number of blades. Yang et al. [27] carried out multi-stage numerical calculation on the ESP based on the special structure of the ESP and found that there is a certain difference in the pressure pulsation in the ESP. The reasons were analyzed, and the inference that the operation instability in the ESP will have inter-stage influence is made. The structural design of the multi-stage ESP makes it easy to aggravate the unsteady state of the pump body when the liquid medium flows inside the lengthy flow channels, and the multi-stage series structure will inevitably superimpose the pressure fluctuation of the medium in the back-stage pump. Not only that, since the ESP is generally composed of impeller and diffuser, it is very easy to produce rotor–stator interaction between the two when the pump body is running, which induces adverse fluctuations in the liquid medium and causes vibration and noise in the pump.
In the past literature, only the static and dynamic interference mechanism in the pump is generally studied, and the influence of the superposition of inter-stage fluctuations caused by the special structure of the ESP is ignored. At the same time, the shape of the meridian surface of the impeller and diffuser is the key structure that affects the flow law in the pump. Based on ANSYS CFX 17.0 software, this paper conducts an unsteady study on the three-stage model of the multi-stage ESP. By setting the corresponding monitoring points at the same position in the calculation domain of the impeller, pump chamber and diffuser flow channel in the three-stage structure, the analysis summarizes the results. The pressure propagation law at the monitoring point, and the pressure pulsation coefficient is used to visualize the fluctuation difference analysis of the pressure pulsation at all stages. The reasons for the difference of the multi-level structure and the influence of different meridian plane shapes on the variation law of pressure pulsation were explored, in order to provide a reference for the stability optimization of the pump.

2. Physical Model

The research object is a medium specific speed ESP. The basic design parameters of the pump: speed n = 2850 r/min, flow rate Q = 80 m3/h, single-stage head H = 20 m, specific speed ns = 165.41, and the structural parameters: number of impeller blades Z = 6, the number of diffuser blades Z2 = 7, the impeller inlet diameter D1 = 80 mm, the impeller outlet diameter D2 = 148 mm, the impeller outlet width b2 = 22 mm, the impeller hub diameter dh = 30 mm, the impeller blade wrap angle ϕ = 105°.
Based on Taguchi design method, the meridional surfaces of impeller and diffuser are parametrically decomposed, and the hydraulic performance optimization under multiple working conditions is carried out by effect analysis method and signal-to-noise ratio analysis method. The factor levels and the performance indexes of the corresponding schemes are selected based on the statistical results. Based on the analysis of variance, the linear equations of each factor and the performance indexes, such as head and efficiency, are fitted. Finally, according to the optimized design objectives, the optimization scheme with better performance is determined. This is described in detail in a previous investigation by Bai [28] and Yang [29]. The optimized meridional surface shape facilitates the reduction of flow losses. After the optimization of the meridian, on the premise that the head meets the requirements, the overall efficiency at the rated operating point is increased by 6.8%. The schematic diagram of the meridian of the optimized impeller and diffuser is shown in Figure 1. The impeller meridional surface avoids sudden contraction and expansion, which reduces the hydraulic losses. For the convenience of recording, the different meridional before and after optimization are named as scheme 1 (black) and scheme 2 (red).

3. Numerical Simulation

3.1. Computational Domain

Most of the application scenarios of ESPs are in deep liquid media, and they are often multi-stage superimposed mechanisms. Simulation cannot be limited to single-stage considerations. The multi-stage structure causes the liquid inflow at the impeller inlet of the pump body from the second stage to be on the basis of pre-swirl. In order to ensure that the simulation and experimental flow are as accurate as possible, the three-stage structure is generally simulated to replace the numerical simulation of the pump body with three or more stages. Except for the first and last two stages, the flow states of the remaining stages are mostly similar to the second stage, and the hydraulic performance can be regarded as the equivalent superposition of the lift. After assembling the three-dimensional model, the water body is divided, and the three-dimensional expansion diagram of the water body of the whole flow channel is obtained as shown in Figure 2. The structure of the shroud and hub in the water body of the pump chamber, which has little effect on the performance, will be simplified, and the pump chamber and the diffuser will be combined to save the calculation time.

3.2. Meshing and Independence Verification

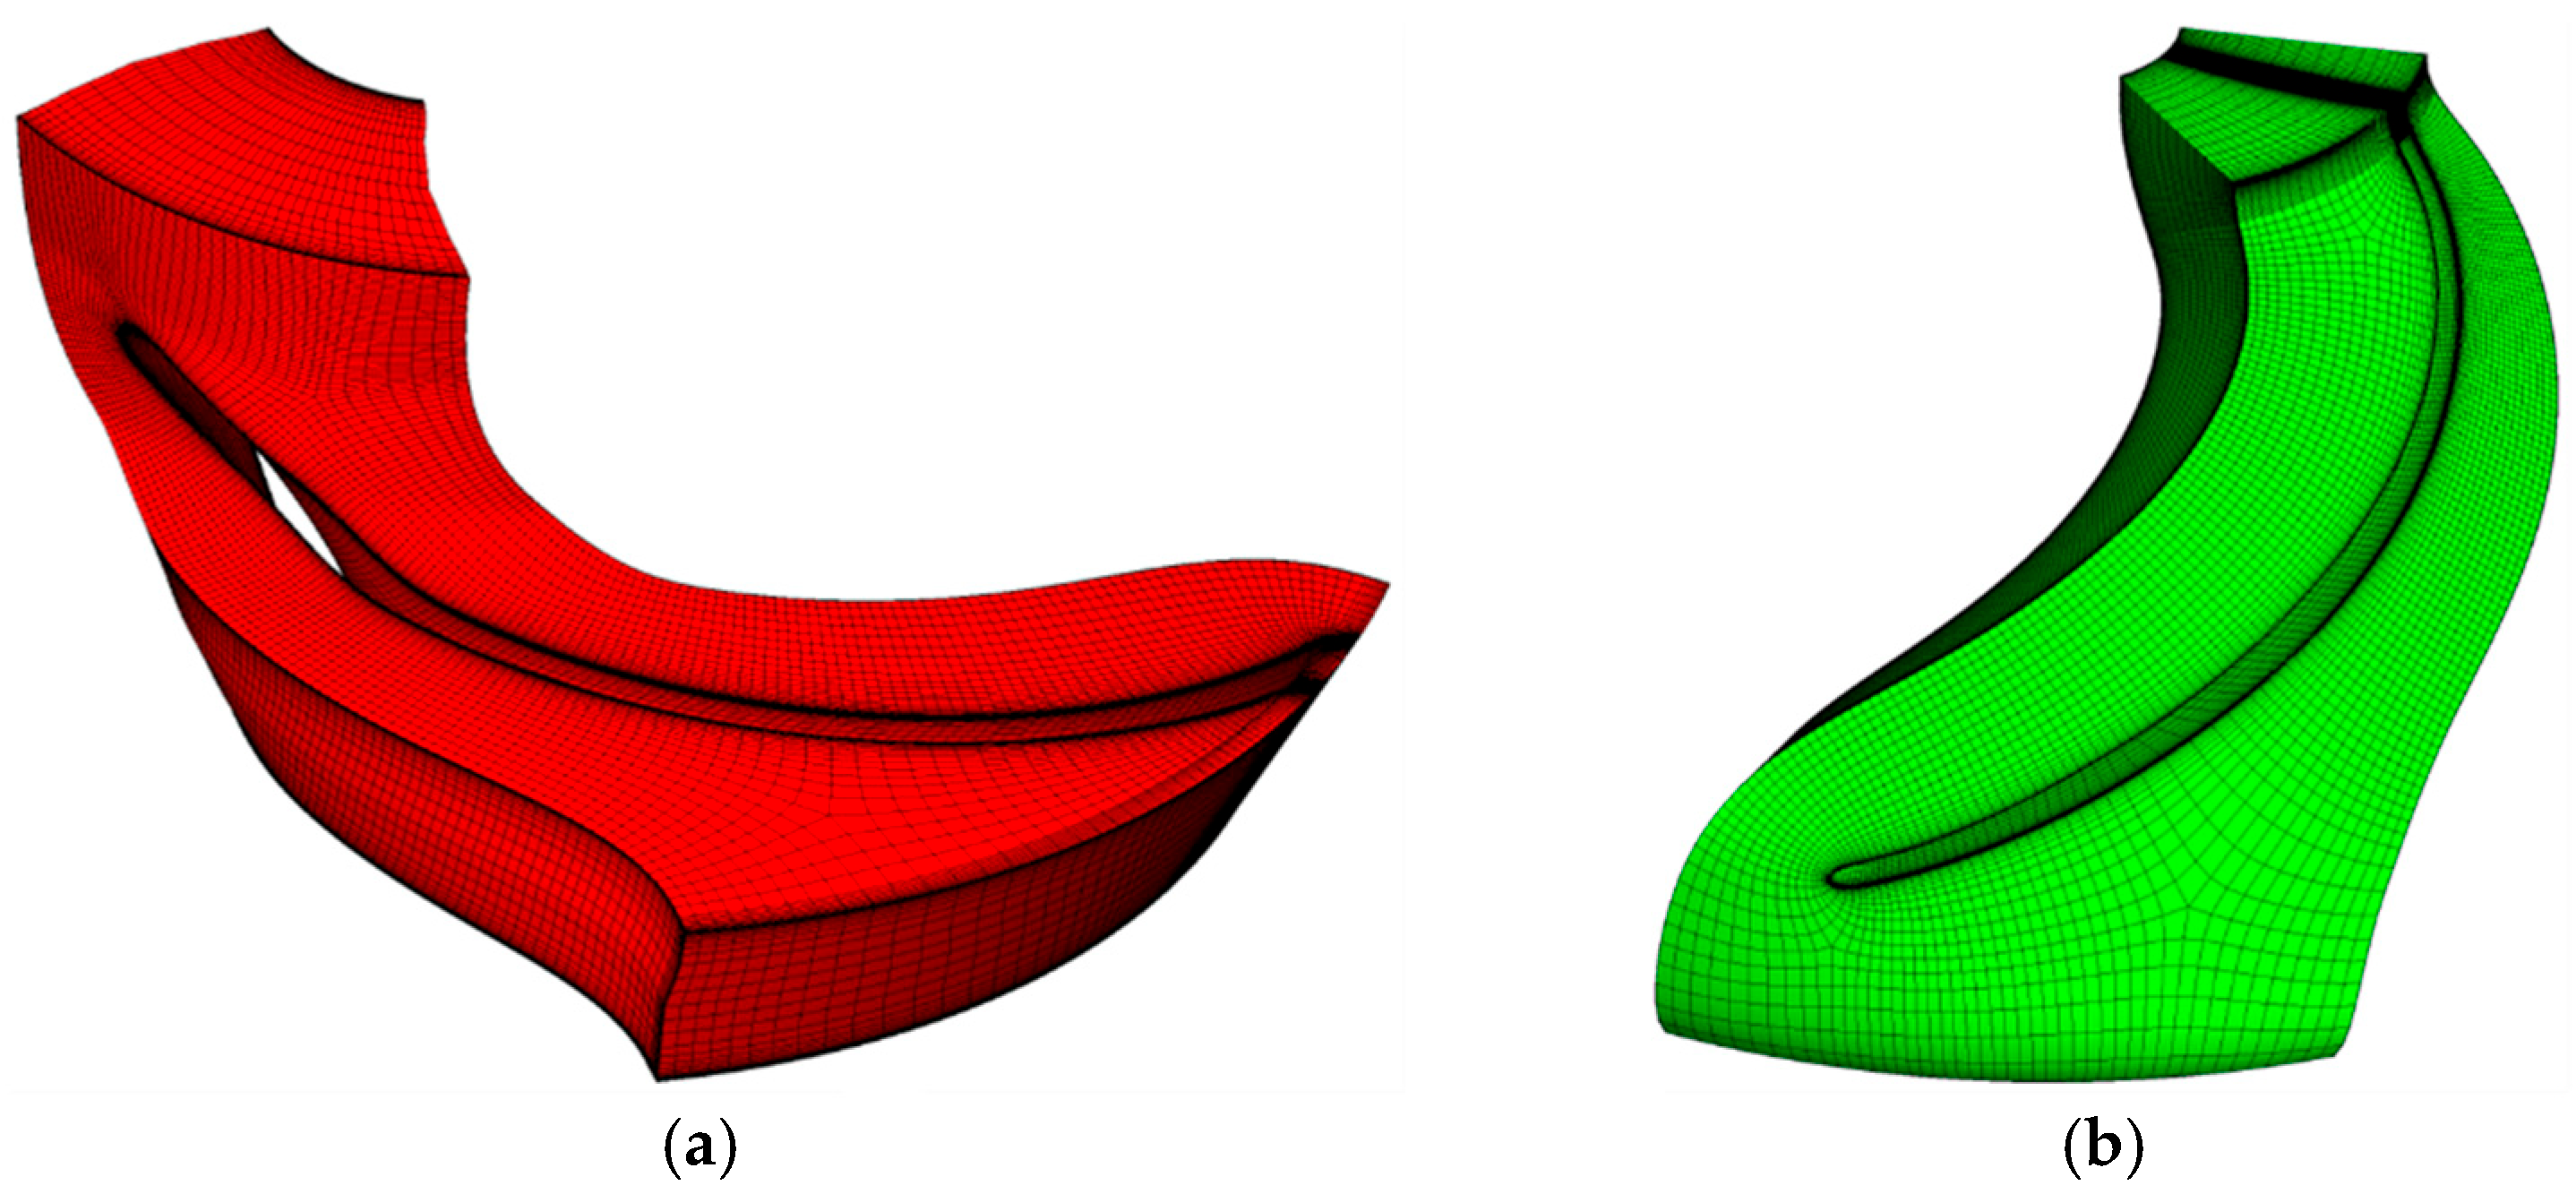
The AMSYS ICEM software is used to perform full hexahedral structured mesh division for the inlet and outlet pipe sections in the computational domain to ensure that the quality of the inlet and outlet pipes is greater than 0.6 to meet the calculation requirements [30,31]. The impeller and diffuser of the ESP are meshed in TurboGird, a special mesh generation software for turbomachinery, and the aspect ratio and orthogonality of the mesh are strictly limited. For the negative volume distribution that occurs, the topological structure is used to generate a mesh structure with a mass greater than 0.3, and y+ is controlled to be less than 100. Figure 3 shows the mesh of the single-channel impeller and diffuser. The full-channel mesh can be obtained by rotating the single-channel grid by its period multiple in ANSYS ICEM [32,33]. Before numerical calculation, it is generally necessary to discretize the computational domain and divide it into multiple small grid units. However, due to the consideration of computer performance and calculation cycle, an appropriate and accurate grid number setting can maximize the use of existing computer performance [34]. As shown in Table 1, when the grid size is less than 2 mm, the prediction error is more obvious. As the number of grids continues to increase, the prediction performance gradually becomes stable, and the solution error fluctuation is less than 1%, which can be ignored. Considering the computer computing performance and time cost [35], the mesh size of the final selected model is 2 mm. The grid-independent analysis of the whole flow field is basically consistent with the trend of single flow channel, and the size is 2 mm, and the number of grids is the period multiple of the single flow channel of the corresponding component.

3.3. Boundary Conditions

After meshing, each calculation subdomain is imported into ANSYS CFX software in turn to simulate the multi-stage ESP. The inlet boundary condition is set to pressure inlet and the outlet is set to mass outflow. The impeller is set to rotating domain and adopts rotating coordinate system (MRF), and the speed is set to 2850 r/min. The inlet and outlet sections and the diffuser are set as static domains, the wall surface adopts no-slip boundary condition, the wall surface roughness is set to 20 μm, and the standard wall surface function is used for the near wall surface. The iterative convergence accuracy is set to 1 × 10⁻⁴, and the discrete format adopts the first-order upwind style. During steady-state solution, the static interface adopts the default setting, and the dynamic interface is set to the frozen rotor type. In the unsteady solution, the steady calculation result is used as its initial value to improve the calculation efficiency, and the dynamic and static interface is changed to transient rotor stator. The transient numerical simulation impeller rotates 9 times, the total time is total time = 0.18947 s, the step size is 2° of impeller rotation as the unit time, Δt = 1.16959 × 10⁻⁴, and the initial time is set to 0 s. Solve a time step with a maximum number of inner loops of 10. A large number of literature studies have shown that the SST k-ω model has the characteristics of high accuracy and good flow separation and capture effect in the simulation of rotating machinery, so it is selected to simulate the internal flow characteristics of the ESP [36,37].

3.4. Monitoring Point

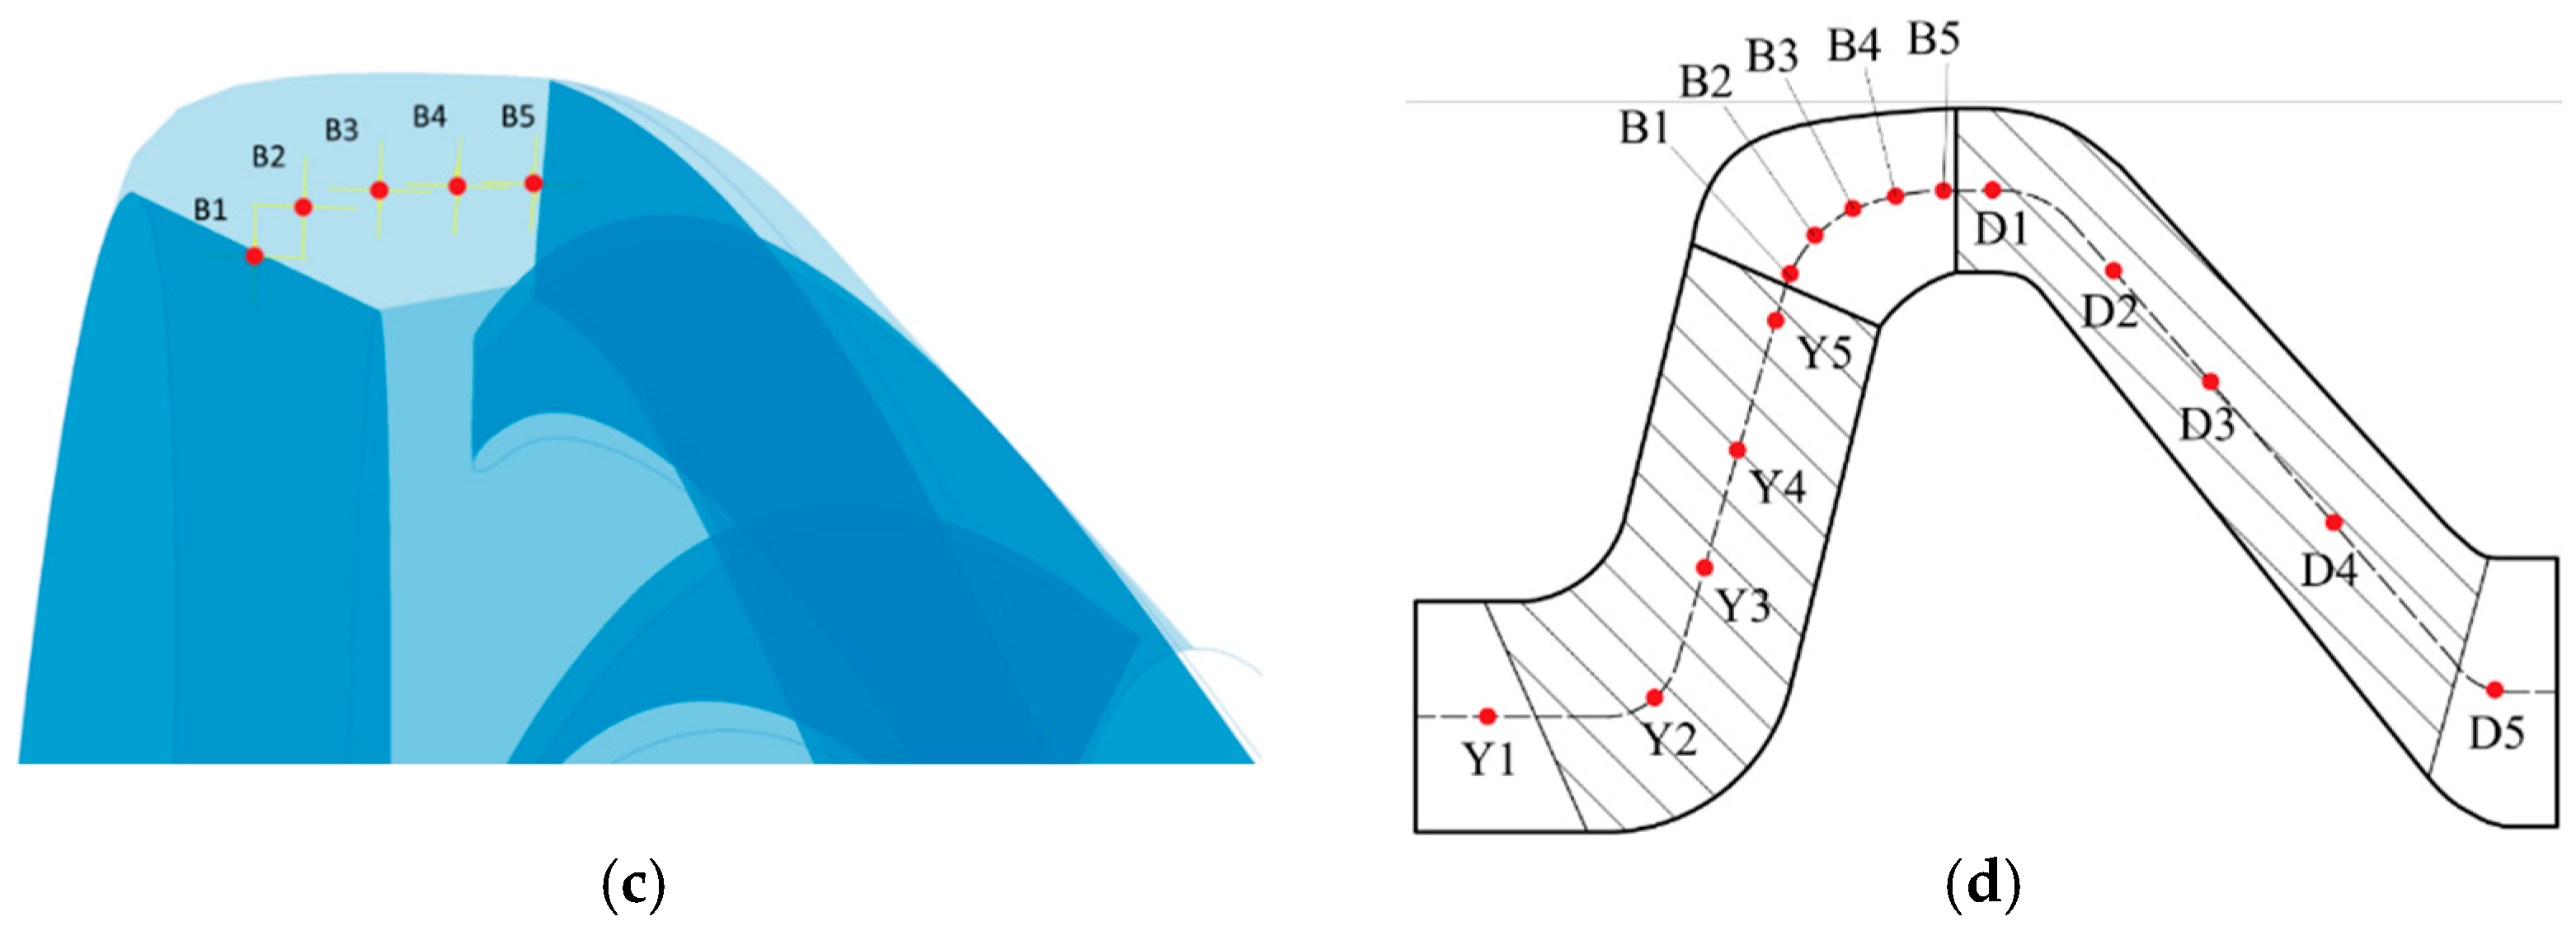
In order to summarize the variation law of pressure pulsation in the pump through computational simulation analysis, it is necessary to set up corresponding monitoring points in each computational domain. As shown in Figure 4a, it is the monitoring point in the impeller. In this chapter, five monitoring points Y1, Y2, Y3, Y4 and Y5 are set in the first-stage impeller, all of which are located on the middle section of the impeller flow channel. Among them, Y1 is located at the inlet of the impeller blade, Y5 is located at the outlet of the impeller blade, and the rest are equally distributed. As shown in Figure 4b, there are five monitoring points D1, D2, D3, D4, and D5 in the diffuser, of which D1 and D5 are located at the inlet and outlet respectively, and their distribution is consistent with the impeller. As shown in Figure 4c, the distribution of monitoring points in the pump chamber is also consistent. The position of the monitoring point in the secondary and final stage is the same as that of the first stage, and the labels increase in turn. The two-dimensional plane distribution map is shown in Figure 4d.
The pressure of each monitoring point in the multi-stage ESP increases with the number of stages, and its pressure magnitude also increases step by step. Therefore, in order to exclude the influence of the large magnitude change on the accuracy of the analysis, the monitored pressure is processed in a dimensionless way, and the pressure pulsation coefficient Cp is used to consider the fluctuation degree of the pressure pulsation in the pump [38], which is defined as follows:
C p = p p ¯ 1 2 ρ u 2 2
where p is the pressure value at the monitoring point in Pa; p ¯ is the mean value of the monitoring point pressure during one rotation in Pa; u 2 is the peripheral speed at the impeller outlet in m/s; ρ is the density of the liquid medium in kg/m3.
The time domain is to study the variation law of the pulsating signal at different times, and the frequency domain is to analyze the variation of the intensity distribution of the pulsating signal at different frequencies. The frequency domain analysis is the pulsation information obtained by transforming the time domain signal by the Fast Fourier Transform (FFT) method. Usually, the frequency domain analysis is based on the multiple change of the rotation frequency. The meaning of the rotation frequency f n is as follows:
f n = n 60
where n represents the rotational speed of the impeller in r/min; f n represents the rotational frequency of the impeller in Hz. The speed of this paper is 2850 r/min, so the frequency of this paper is 47.5 Hz.
f D = f n × Z D
where f D represents the blade passing frequency of the diffuser in Hz; Z D is the number of diffuser blades 7. Therefore, f D is 332.5 Hz.
f Y = f n × Z Y
where f Y represents the blade passing frequency of the impeller in Hz; Z Y is the number of impeller blades 6. Therefore, f Y is 285 Hz.

3.5. Simulation Accuracy Verification

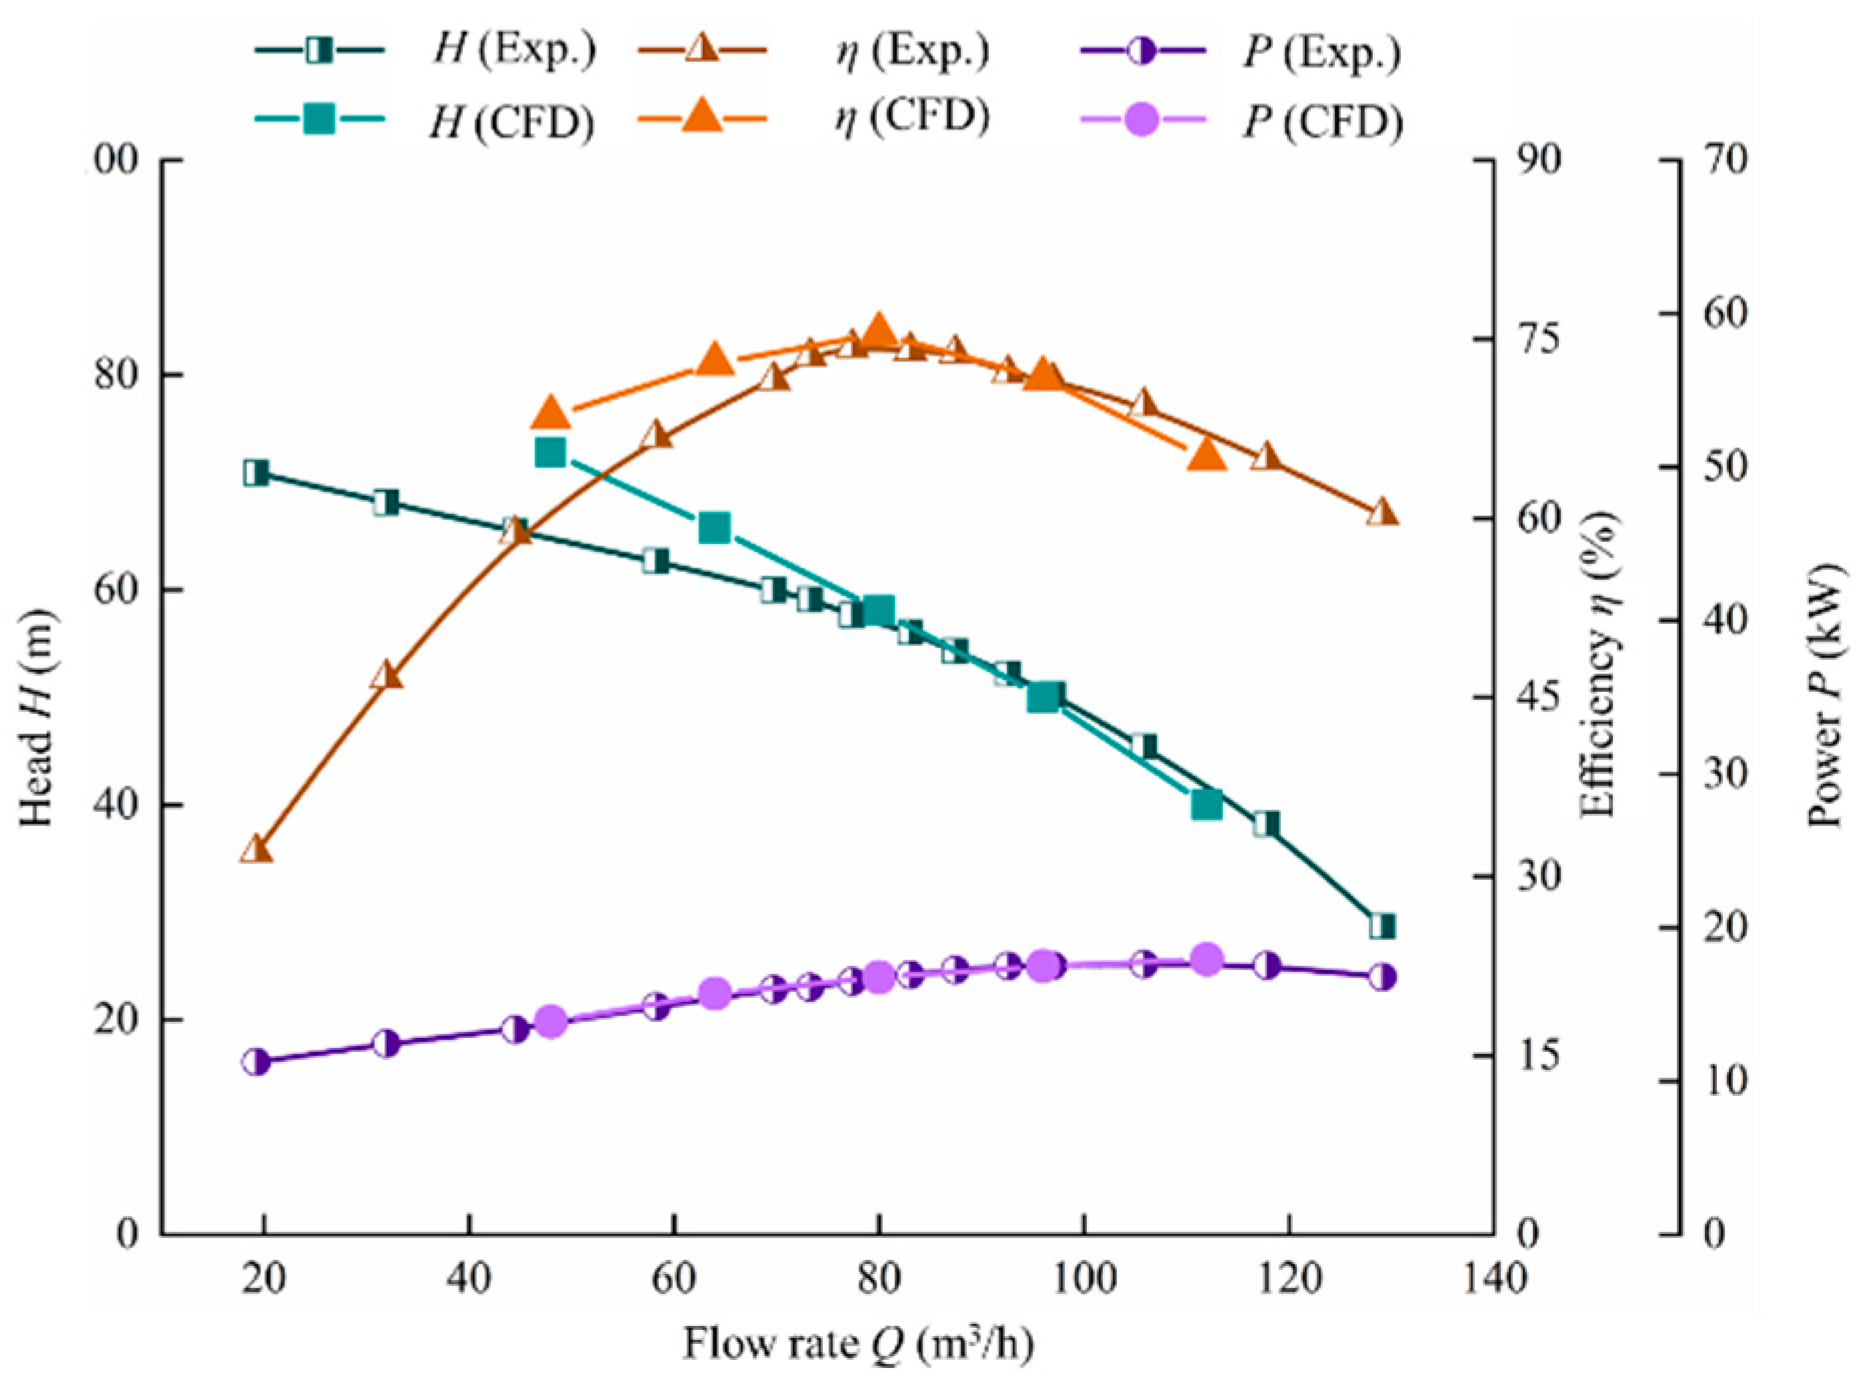
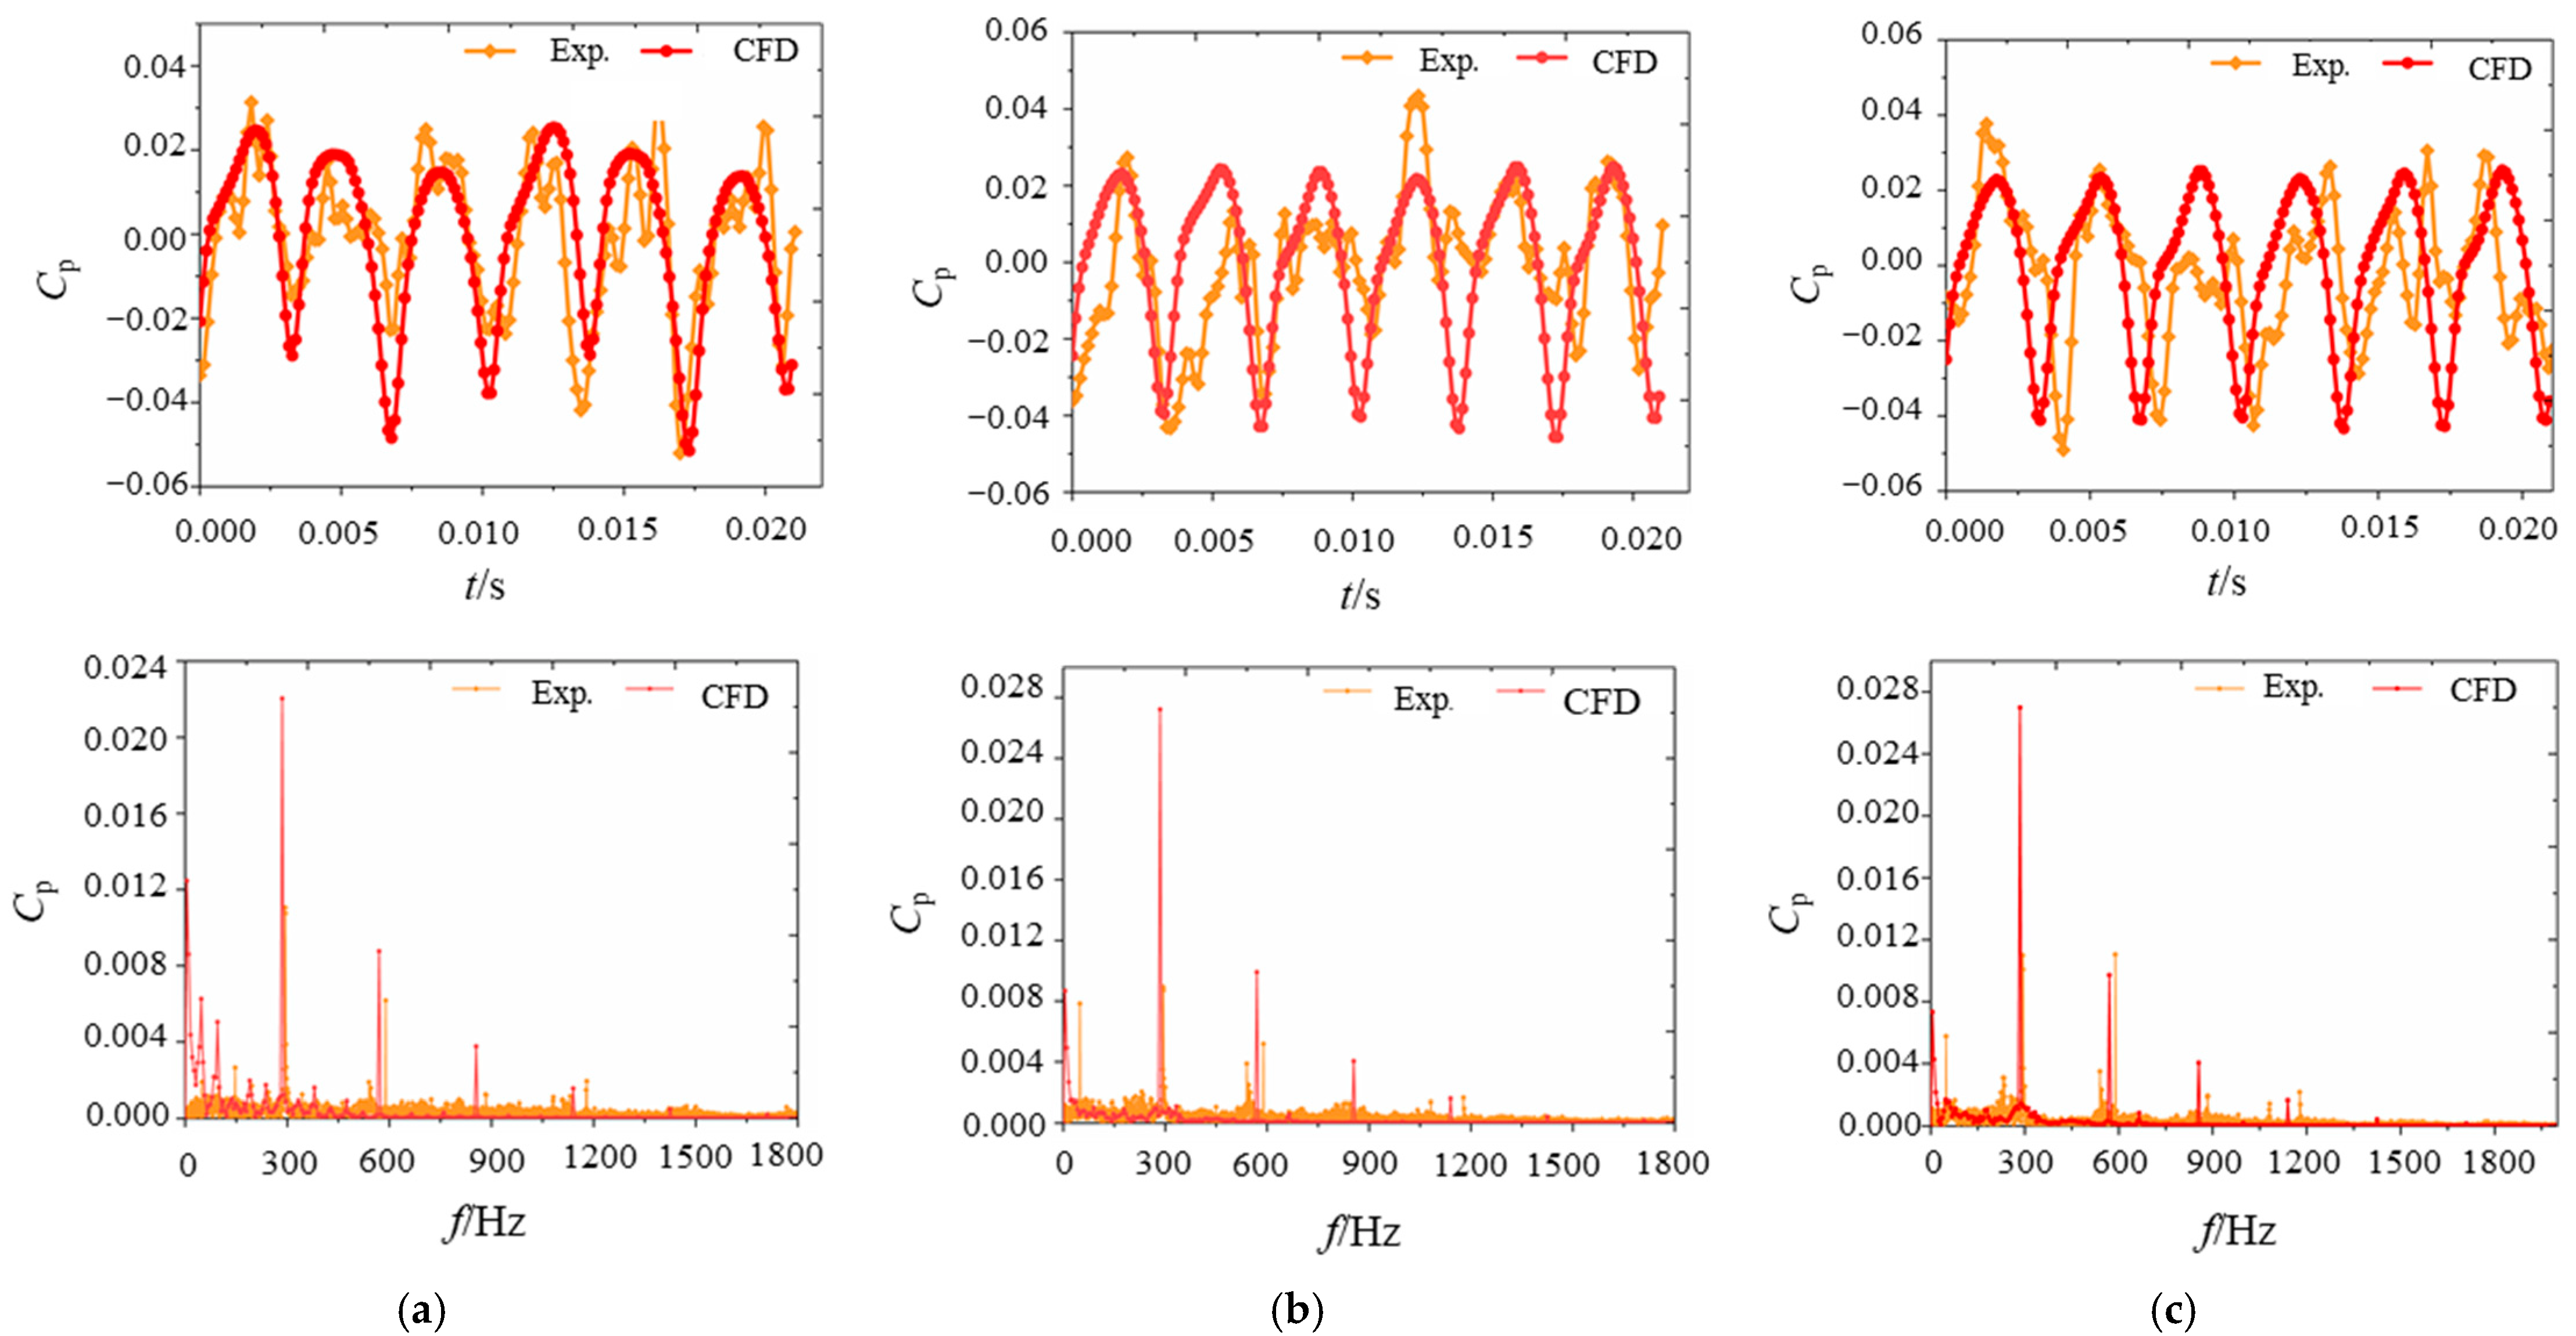
Yang et al. [27,39] compared the numerical simulation results of the external characteristics and interstage pressure pulsation characteristics of the three-stage ESP with the experimental results. The experimental loop and all instrumentation details are detailed in references. After analysis, because the simulation does not consider the friction loss of the front and rear cover plates of the impeller, the external characteristic results are slightly higher than the experimental data, as shown in Figure 5, but the error meets the requirements. The predicted value of pressure pulsation at the monitoring point in the middle of the pump chamber are consistent with the experimental trend, and both the main frequency signal and the fluctuation period can verify the accuracy of the numerical simulation, as shown in Figure 6.

4. Results and Discussion

4.1. Pressure Pulsation Inside the Impeller

Figure 7 is the distribution diagram of the internal pressure pulsation characteristics of the impeller under the rated flow condition. The flow of the liquid medium in the second stage of the multi-stage pump is relatively stable, so the analysis is mainly based on the pulsation characteristics in the secondary pump. Figure 7a depicts the comparison of the time domain characteristics of the secondary impeller in scheme 1 and scheme 2. From the fluctuation amplitude, it can be clearly found that the magnitude of the fluctuation of scheme 2 is greatly reduced, and the degree of pressure pulsation is significantly weakened. In terms of cycles, the curves of the two schemes have a 7-cycle law, which is consistent with the number of diffuser blades, because the liquid at the inlet of the secondary impeller flows out from the end of the first-stage diffuser. In scheme 1, the pulsation at the front of the impeller is weak, and the pulsation gradually increases with the flow direction to the peak in the middle of the impeller. In scheme 2, the pulsation is weaker and the peak occurs in the middle and tail of the impeller. The law of severe pulsation of the tail impeller should be mainly caused by the dynamic and static interference generated by the pulsation source in the pump chamber. Figure 7b is a comparison diagram of frequency domain characteristics. It can be seen that the frequency signal is larger at the low-frequency pulsation and 7 times the frequency, but the signal strength of scheme 2 is obviously weakened. Consistent with the above analysis, the main frequency of the impeller under the influence of dynamic and static interference occurs at the passing frequency of the diffuser, due to its close proximity to the upper diffuser. Second, the signal strength at multiple harmonics also decreases with increasing multiplier. The main reason for the large low-frequency pulsation intensity is the inter-stage coupling phenomenon caused by the superposition of inter-stage pulsation, which leads to the transmission of the first-stage low-frequency pulsation signal to the secondary. As shown in Figure 7c–e, since the inlet is a steady flow, the first-stage pulsation signal at the monitoring point Y1 at the impeller inlet is smaller than the other stages. In terms of the flow direction, scheme 1 shows the law that the pulsation intensity is large in the middle, and the pulsation is small at the beginning and the end. In the case of scheme 2, the intermediate monitoring point Y3 not only reduces the overall signal strength, but also makes its amplitude lower than that of the first-stage impeller in the unsteady state in the stable state of the second and last stages. From the perspective of inter-stage characteristics, the intensity of the pulsation in Scheme 1 increases sharply compared with the first stage, generally reaching its peak in the second stage, and slightly stable in the third stage. For scheme 2, the law at the inlet is similar to that of scheme 1, but the fluctuation range in the middle obviously has a flat trend, and the tail remains stable from the second stage impeller. In general, the stability between the two levels of the scheme is higher.

4.2. Pressure Pulsation Inside the Chamber

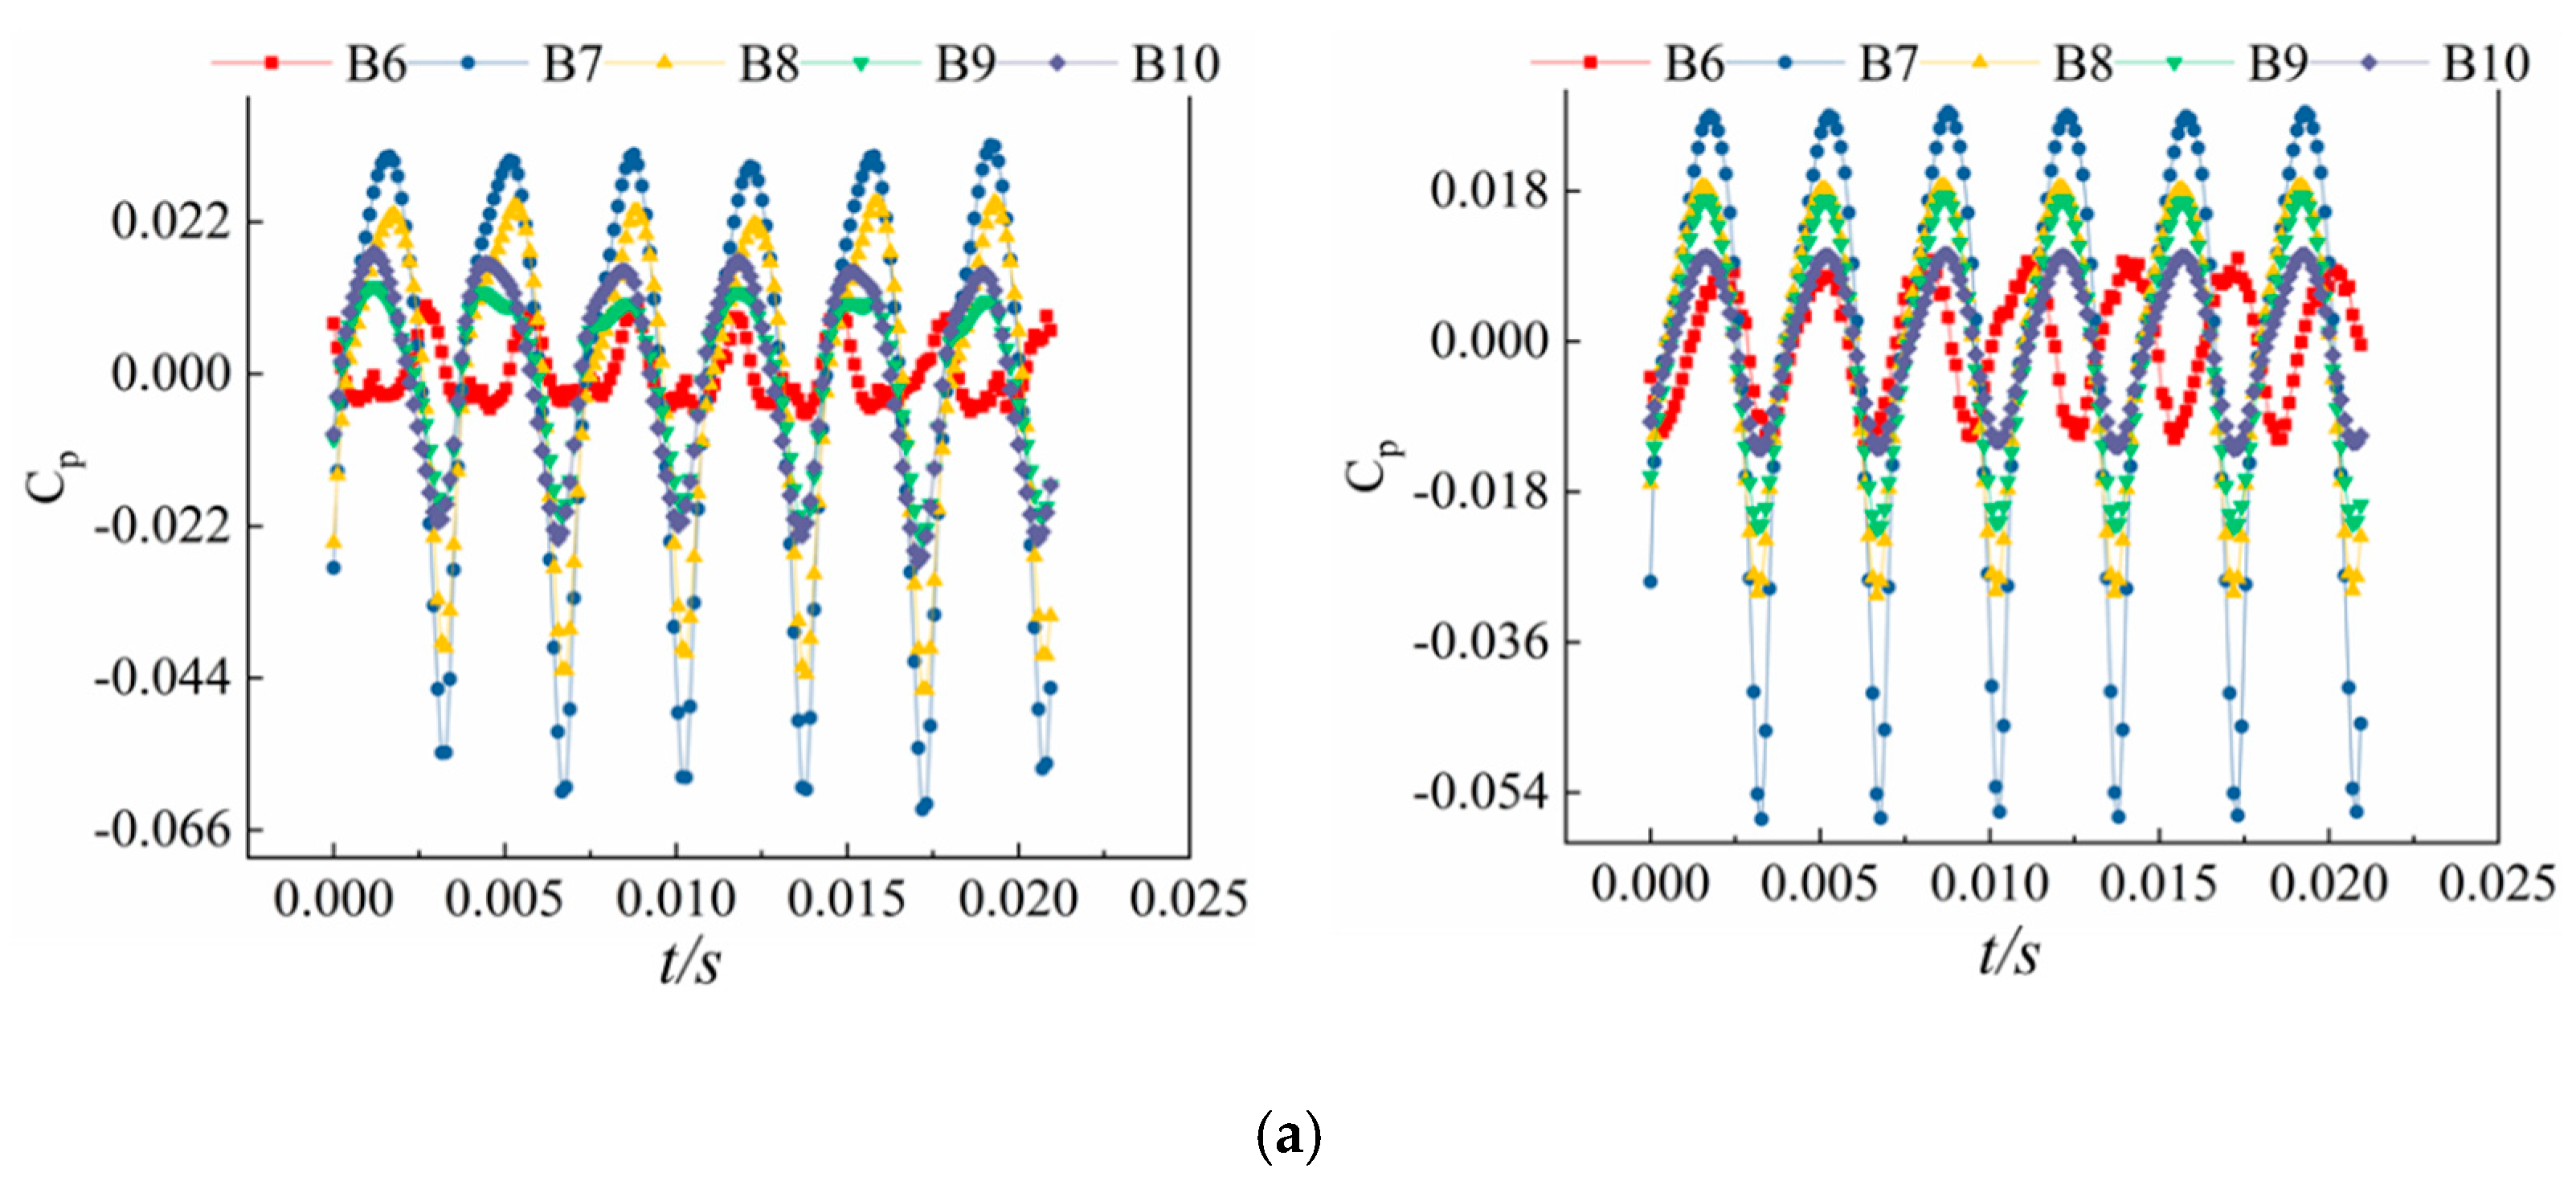
Figure 8 is a distribution diagram of the pressure pulsation characteristics inside the pump chamber under the rated flow condition. The pump chamber is the pressure source of dynamic and static interference in the ESP, and the pulsation in each flow channel is deeply affected by it. Among them, the time domain diagram of the secondary pump chamber in Figure 8a, from the perspective of periodicity, is mostly six cycles, which are the same as the number of impeller blades. At the same time, it can be clearly found that the signal amplitude of the minimum value is abnormally large relative to the maximum value of the pulsating signal. This is because in the process of conveying the medium, the pressure drops caused by the jet is stronger than the pressure drops caused by the wake. The extremes of this pulsation all peak in the middle region of the pump chamber. It is worth mentioning that the pump chamber inlet of scheme 1 is greatly affected by the impeller pulsation law, thus showing a situation of seven cycles, but the monitoring point after the flow direction is greatly affected by the pulsation source. In terms of phase, due to the design of the structure, the pulsation characteristics before optimization are more complicated, and the regularity of the phase after optimization is more obvious. Figure 8b is the frequency domain distribution diagram. As far as the low-frequency pulsation is concerned, although there is an inter-stage coupling phenomenon, due to the rated operating point and the secondary pump chamber, the pulsation intensity is much lower than the intensity of the arterial-venous interference pulsation source itself. Scheme 2 optimizes the meridional surface structure, which greatly weakens the low-frequency pulsation region and further reduces the pulsation intensity of the interstage coupling. Additionally, because the monitoring points are relatively close to the pulsation source, the pulsation intensity is similar at the main frequency and its multiplier, and there is no obvious improvement. Figure 8c–e describes the distribution of the inter-stage pulsation characteristics of the pump chamber. It can be seen that due to the steady state, the pulsation characteristics are relatively obvious, and the difference between the stages is low, which is especially reflected in the optimized part of the pump chamber. In scheme 1, the pulsation of each monitoring point in the first stage of the pump chamber fluctuated slightly, and the other parts of the second stage and the last stage showed good regularity. The pulsation intensity of the inlet monitoring point B1 and the central monitoring point B3 is not obvious. Only at the final monitoring point B5, which is close to the diffuser, the signal intensity has some weakening trend.

4.3. Pressure Pulsation Inside the Diffuser

Figure 9 is the distribution diagram of the pressure pulsation characteristic inside the diffuser under the rated flow condition. Figure 9a is a time domain diagram of the secondary diffuser. First, the pulsation presents six cycles, which is equal to the number of impeller blades. Secondly, the pulsation intensity at the monitoring point gradually decreases with the flow direction, and reaches the lowest at the outlet of the diffuser. On the whole, the pressure pulsation intensity of scheme 2 tends to attenuate compared with scheme 1, and the phase change occurs at the monitoring point D10 at the outlet of the diffuser in scheme 2. The reason is that the monitoring point is the farthest from the pulsation source of the current stage, and is affected by the pulsation source of the two stages before and after at the same time, so there is a certain coupling, which eventually leads to the change of the time domain phase. Figure 9b is a comparison diagram in the frequency domain. Through the scale comparison, it can be found that the pulsation signal at the diffuser frequency of scheme 2 is relatively low, and all except the low frequency part at 1–2 times the rotation frequency is significantly reduced. Figure 9c–e are the comparison diagrams between pulsation stages. At the monitoring point D1 at the inlet of the diffuser, the extreme point of the first stage of scheme 1 fluctuates up and down, while scheme 2 not only reduces the overall amplitude, but also makes the tertiary pulsation develop regularly. The law of the monitoring point D3 in the middle of the diffuser is roughly close to that of D1. The second and last stages show better stability due to the pulsation under the rated flow condition. The second harmonic part of scheme 2 is significantly improved, and the periodicity is relatively complete. The magnitude of the overall signal intensity at the monitoring point D5 at the outlet of the diffuser becomes smaller, and the phase periodicity in the first and second stages of scheme 2 is enhanced to a certain extent, and the final stage may be affected by more sources of pulsation.

4.4. Analysis of CWT

In the above, a qualitative analysis is carried out on the time-frequency characteristics in the ESP. By decomposing the equal-frequency pulsation signal of the blade frequency by FFT, the high-frequency variation law in the multi-stage ESP is analyzed. However, it cannot do anything about the low frequency signal part. Since the ESP is affected by many different pulsation sources, the changes of its coupled pulsation signal are extremely complex. In order to explore the variation law of low-frequency signal in the multi-stage ESP, CWT was used to analyze the middle point of the secondary impeller, diffuser and pump chamber of the multi-stage ESP. The essence of CWT is a filtering process of the original signal [40]. The detail signal at each scale is decomposed by energy through CWT, trying to discriminate and extract by the energy scale, and then analyze the low-frequency pulsation characteristics. The inner product of continuous wavelet transform is as follows:
W T f ( a , τ ) = f t , ψ a , x t = 1 a R f t ψ * t τ a d t
where the f(t) transform is the CWT, the conjugate of the dilated and translated wavelet ψ*((tτ)/a) is employed and a and τ are the scale (or dilation) and translation parameters, respectively.
Figure 10 is a CWT pulsation distribution diagram of different meridian under rated flow conditions. From a longitudinal perspective, since the flow state of the ESP is relatively stable at the rated flow operating point, the low-frequency components from the impeller to the diffuser are very similar. However, only the pulsation components in the pump chamber are slightly blurred, which may be due to the middle point of the dynamic and static interference, and the clarity of the pulsation components at the monitoring point in the middle of the diffuser is enhanced. In terms of the overall horizontal comparison, the overall magnitude of the scale is one order of magnitude lower than before optimization, which is reflected in both high and low frequencies. The period and pulsation trend at 3–6 times the rotation frequency of the impeller is roughly similar, but the amplitude and phase are shifted. Due to the influence of multiple pulsation sources at the pump chamber, the pulsation oscillation is larger than that of the impeller diffuser. It is worth mentioning that the pulsation amplitude at 1 time the rotation frequency fn of scheme 2 is almost 0, and the two meridian planes are affected. The difference in pressure pulsation is obvious. Moreover, the periodicity is more obvious at the 2 times the frequency of scheme 2, and the frequency of 3 times and above increases with the increase of the multiple, the lower the resolution, and the more obvious the phenomenon of pulsation superposition. The CWT pulsation in the diffuser has the same variation law as that of the pump chamber, especially at 1 times the rotational frequency, the magnitude is reduced by another level.

5. Conclusions

Transient numerical simulations of two multi-stage ESPs with different meridional shapes were carried out. At the same time, the instantaneous pressure changes at different positions in the impellers, pump chambers and diffuser at all stages were monitored. The main conclusions of this paper are as follows:
1.
The shape of the meridian of scheme 2 is more in line with the flow law, so the pulsation intensity in each component in the pump is smaller than that of scheme 1. Optimizing the shape of the meridian has a contribution to reducing the pulsation strength and increasing the operational stability, which improves the hydraulic performance. Transient pressure pulsation in the secondary and final stages of the pump is a key factor affecting the unsteady flow in the pump;
2.
The pulsation amplitude peaks at the middle monitoring point in the pump chamber, which is caused by the rotor–stator interaction between the impeller and the diffuser. Because of the pulse source and pulse propagation coupling, the pressure pulsation period at the monitoring points in the impeller and pump cavity is the same as the number of diffuser blades, and the pressure pulsation period at the monitoring points in the diffuser is the same as the number of impeller blades;
3.
The low-frequency pulsation signal after CWT is basically close to the pulsation law of the leaf frequency when the frequency is 3–6 times. At 1–2 times the rotation frequency, the regularity is relatively complicated due to various pulsation sources and low-frequency propagation coupling between stages.
Based on the above studies, we believe that by optimizing the shape of the impeller and diffuser meridian, it is possible to effectively reduce the pressure pulsation amplitude and improve the operational stability of multi-stage submersible electric pumps.

Author Contributions

Conceptualization, D.D. and Y.H.; methodology, Y.X.; software, Y.X.; validation, L.Y. and X.S.; investigation, Y.X.; resources, D.D. and L.Y.; writing—original draft preparation, Y.X.; writing—review and editing, Y.H.; visualization, D.D.; supervision, L.Y.; project administration, X.S.; funding acquisition, D.D. and X.S. All authors have read and agreed to the published version of the manuscript.

Funding

The work was sponsored by Scientific Research Projects of China National Offshore Oil Corporation (JTKY-SXSH-2020-HF-06).

Conflicts of Interest

The authors declare no conflict of interest.

References

  1. Zhu, J.; Zhu, H.; Zhang, J.; Zhang, H.Q. A numerical study on flow patterns inside an electrical submersible pump (ESP) and comparison with visualization experiments. J. Petrol. Sci. Eng. 2019, 173, 339–350. [Google Scholar] [CrossRef]
  2. Spence, R.; Amaral-Teixeira, J. A CFD parametric study of geometrical variations on the pressure pulsations and performance characteristics of a centrifugal pump. Comput. Fluids 2009, 38, 1243–1257. [Google Scholar] [CrossRef] [Green Version]
  3. Guan, D.; Cong, X.; Li, J.; Niu, Z. Experimental test and theoretical modeling on the working characteristics of spherical water pump. Flow Meas. Instrum. 2022, 85, 102162. [Google Scholar] [CrossRef]
  4. Zhou, L.; Hang, J.; Bai, L.; Krzemianowski, Z.; El-Emam, M.A.; Yasser, E.; Agarwal, R. Application of entropy production theory for energy losses and other investigation in pumps and turbines: A review. Appl. Energy 2022, 318, 119211. [Google Scholar] [CrossRef]
  5. Guelich, J.; Bolleter, U. Pressure pulsations in centrifugal pumps. ASME J. Vib. Acoust. 1992, 318, 272–279. [Google Scholar] [CrossRef]
  6. Li, D.; Qin, Y.; Wang, J.; Zhu, Y.; Wang, H.; Wei, X. Optimization of blade high-pressure edge to reduce pressure fluctuations in pump-turbine hump region. Renew. Energy 2022, 181, 24–38. [Google Scholar] [CrossRef]
  7. Shim, H.S.; Kim, K.Y. Effects of the number of blades on impeller-volute interaction and flow instability of a centrifugal pump. Proc Inst. Mech. Eng. A-J. Power Energy 2022, 09576509221094951. [Google Scholar] [CrossRef]
  8. Zheng, Y.; Chen, Y.; Mao, X.; Wang, H.; Shi, W.; Kan, K.; Zhang, Y. Pressure pulsation characteristics and its impact on flow-induced noise in mixed-flow pump. Trans. Chin. Soc. Agric. Eng. 2015, 31, 67–73. [Google Scholar]
  9. Shi, L.; Yuan, Y.; Jiao, H.; Tang, F.; Cheng, L.; Yang, F.; Zhu, J. Numerical investigation and experiment on pressure pulsation characteristics in a full tubular pump. Renew. Energy 2021, 163, 987–1000. [Google Scholar] [CrossRef]
  10. Guan, D.; Wu, J.H.; Jing, L.; Hilton, H.H.; Lu, K. Kinematic modeling, analysis and test on a quiet spherical pump. J. Sound Vib. 2016, 383, 146–155. [Google Scholar] [CrossRef]
  11. Dring, R.; Joslyn, H.; Hardin, L.; Wagner, J. Turbine rotor-stator interaction. ASME J. Eng. Power 1982, 104, 729–742. [Google Scholar] [CrossRef]
  12. Chalghoum, I.; Kanfoudi, H.; Elaoud, S.; Akrout, M.; Zgolli, R. Numerical Modeling of the Flow Inside a Centrifugal Pump: Influence of Impeller–Volute Interaction on Velocity and Pressure Fields. Arab. J. Sci. Eng. 2016, 41, 1–14. [Google Scholar] [CrossRef]
  13. Arndt, N.; Acosta, A.; Brennen, C.; Caughey, T. Experimental investigation of rotor-stator interaction in a centrifugal pump with several vaned diffusers. ASME J. Turbomach. 1990, 112, 98–108. [Google Scholar] [CrossRef]
  14. Brennen, C.; Franz, R.; Arndt, N. Rotor/Stator Unsteady Pressure Interaction. 1988. Available online: https://www.researchgate.net/publication/30759128_RotorStator_Unsteady_Pressure_Interaction (accessed on 22 September 2022).
  15. Khalifa, A.; Al-Qutub, A.; Ben-Mansour, R. Experiments on pressure fluctuations in a high pressure-double volute centrifugal pump under part load conditions. In Proceedings of the 4th International Conference on Thermal Energy: Theory and Applications, Abu-Dhabi, United Arab Emirates; 2009. Available online: https://www.researchgate.net/publication/281902977_Experiments_on_Pressure_Fluctuations_in_a_High_Pressure-Double_Volute_Centrifugal_Pump_under_Part_Load_Conditions (accessed on 22 September 2022).
  16. Solis, M.; Bakir, F.; Khelladi, S.; Noguera, R. Numerical study on pressure fluctuations reduction in centrifugal pumps: Influence of radial gap and splitter blades. Int. Sch. Res. Not. 2011, 2011, pp. 1–14. Available online: https://downloads.hindawi.com/archive/2011/479594.pdf (accessed on 22 September 2022).
  17. Rutter, R.; Sheth, K.; O’Bryan, R. Numerical flow simulation and validation of an electrical submersible pump//Fluids Engineering Division Summer Meeting. Am. Soc. Mech. Eng. Digit. Collect. 2013, 55546, V01AT03A005. [Google Scholar]
  18. Bai, L.; Zhou, L.; Han, C.; Zhu, Y.; Shi, W. Numerical study of pressure fluctuation and unsteady flow in a centrifugal pump. Processes 2019, 7, 354. [Google Scholar] [CrossRef] [Green Version]
  19. Muggli, F.A.; Holbein, P.; Dupont, P. CFD calculation of a mixed flow pump characteristic from shutoff to maximum flow. J. Fluids Eng. 2002, 12, 798–802. [Google Scholar] [CrossRef]
  20. Wang, H.; Hu, Q.; Yang, Y.; Wang, C. Performance Differences of Electrical Submersible Pump under Variable Speed Schemes. Int. J. Simul. Model. 2021, 20, 76–86. [Google Scholar] [CrossRef]
  21. Maitelli, C.W.S.P.; Bezerra, F.V.M.; Mata, W. Simulation of flow in a centrifugal pump of esp systems using computational fluid dynamics. Braz. J. Pet. Gas 2010, 4, 001–009. [Google Scholar]
  22. Hammer, S.; Phan, D.; Peter, J.; Werder, T.; Meyer, R.; Liebich, R.; Thamsen, P. Active Flow Control by Adaptive Blade Systems in Periodic Unsteady Flow Conditions. 2014. Available online: http://www.depositonce.tu-berlin.de/handle/11303/197 (accessed on 22 September 2022).
  23. Joslyn, D.; Dring, R. Three-Dimensional Flow in an Axial Turbine: Part 1—Aerodynamic Mechanisms. J. Turbomach. 1992, 114, 61–70. [Google Scholar] [CrossRef]
  24. Iino, T.; Kasai, K. An analysis of unsteady flow induced by interaction between a centrifugal impeller and a vaned diffuser (1st report, Measurement of pressure fluctuations in pump impellers). Trans. Jpn. Soc. Mech. Eng. Part B 1985, 51, 3748–3753. [Google Scholar] [CrossRef] [Green Version]
  25. Zhang, M.; Wang, H.; Tsukamoto, H. Unsteady Hydrodynamic Forces due to Rotor-Stator Interaction on a Diffuser Pump with Identical Number of Vanes on the Impeller and Diffuser. Trans. Jpn. Soc. Mech. Eng. Part B 2005, 127, 2020–2027. [Google Scholar] [CrossRef]
  26. Zhou, L.; Shi, W.; Lu, W. Performance analysis on deep-well centrifugal pump guide vanes based on numerical simulation. Trans. Chin. Soc. Agric. Eng. 2011, 27, 38–42. [Google Scholar]
  27. Yang, Y.; Zhou, L.; Shi, W.; He, Z.; Han, Y.; Xiao, Y. Interstage difference of pressure pulsation in a three-stage electrical submersible pump. J. Petrol. Sci. Eng. 2021, 196, 107653. [Google Scholar] [CrossRef]
  28. Bai, L.; Yang, Y.; Zhou, L.; Li, Y.; Xiao, Y.; Shi, W. Optimal design and performance improvement of an electric submersible pump impeller based on Taguchi approach. Energy 2022, 252, 124032. [Google Scholar] [CrossRef]
  29. Yang, Y.; Zhou, L.; Hang, J.; Du, D.; Shi, W.; He, Z. Energy characteristics and optimal design of diffuser meridian in an electrical submersible pump. Renew. Energy 2021, 167, 718–727. [Google Scholar] [CrossRef]
  30. Kan, K.; Zhang, Q.; Zheng, Y.; Xu, H.; Xu, Z.; Zhai, J.; Muhirwa, A. Investigation into Influence of Wall Roughness on the Hydraulic Characteristics of an Axial Flow Pump as Turbine. Sustainability 2022, 14, 8459. [Google Scholar] [CrossRef]
  31. Zuo, Z.; Tan, L.; Shi, W.; Chen, C.; Ye, J.; Francis, E.M. Transient Characteristic Analysis of Variable Frequency Speed Regulation of Axial Flow Pump. Sustainability 2022, 14, 11143. [Google Scholar] [CrossRef]
  32. Zhang, Y.; Zhang, Z.; Zheng, J.; Zhang, J.; Zheng, Y.; Zang, W.; Lin, X.; Fernandez-Rodriguez, E. Experimental investigation into effects of boundary proximity and blockage on horizontal-axis tidal turbine wake. Ocean. Eng. 2021, 225, 108829. [Google Scholar] [CrossRef]
  33. Zhang, Y.; Zang, W.; Zheng, J.; Cappietti, L.; Zhang, J.; Zheng, Y.; Fernandez-Rodriguez, E. The influence of waves propagating with the current on the wake of a tidal stream turbine. Appl. Energy 2021, 290, 116729. [Google Scholar] [CrossRef]
  34. Han, Y.; Zhou, L.; Bai, L.; Shi, W.; Agarwal, R. Comparison and validation of various turbulence models for U-bend flow with a magnetic resonance velocimetry experiment. Phys. Fluids 2021, 33, 125117. [Google Scholar] [CrossRef]
  35. El-Emam, M.A.; Zhou, L.; Yasser, E.; Bai, L.; Shi, W. Computational methods of erosion wear in centrifugal pump: A state-of-the-art review. Arch. Comput. Method. E. 2022, 29, 1–26. [Google Scholar] [CrossRef]
  36. Deyou, L.; Hongjie, W.; Gaoming, X.; Ruzhi, G.; Xianzhu, W.; Zhansheng, L. Unsteady simulation and analysis for hump characteristics of a pump turbine model. Renew. Energy 2015, 77, 32–42. [Google Scholar] [CrossRef]
  37. Gao, B.; Zhang, N.; Li, Z.; Ni, D.; Yang, M. Influence of the blade trailing edge profile on the performance and unsteady pressure pulsations in a low specific speed centrifugal pump. J. Fluids Eng. 2016, 138, 051106. [Google Scholar] [CrossRef]
  38. Zhao, X.; Xiao, Y.; Wang, Z.; Luo, Y.; Cao, L. Unsteady flow and pressure pulsation characteristics analysis of rotating stall in centrifugal pumps under off-design conditions. J. Fluids Eng. 2018, 140, 021105. [Google Scholar] [CrossRef]
  39. Yang, Y.; Zhou, L.; Han, Y.; Hang, J.; Lv, W.; Shi, W.; He, Z.; Pan, B. Pressure pulsation investigation in an electrical submersible pump based on Morlet continuous wavelet transform. Proc. Inst. Mech. Eng. Part C: J. Mech. Eng. Sci. 2021, 235, 6069–6079. [Google Scholar] [CrossRef]
  40. Zhu, J.; Zhu, H.; Zhang, J.; Zhang, H.Q. Intelligent fault diagnosis of hydraulic piston pump based on wavelet analysis and improved alexnet. Sensors 2021, 21, 549. [Google Scholar] [CrossRef] [PubMed]
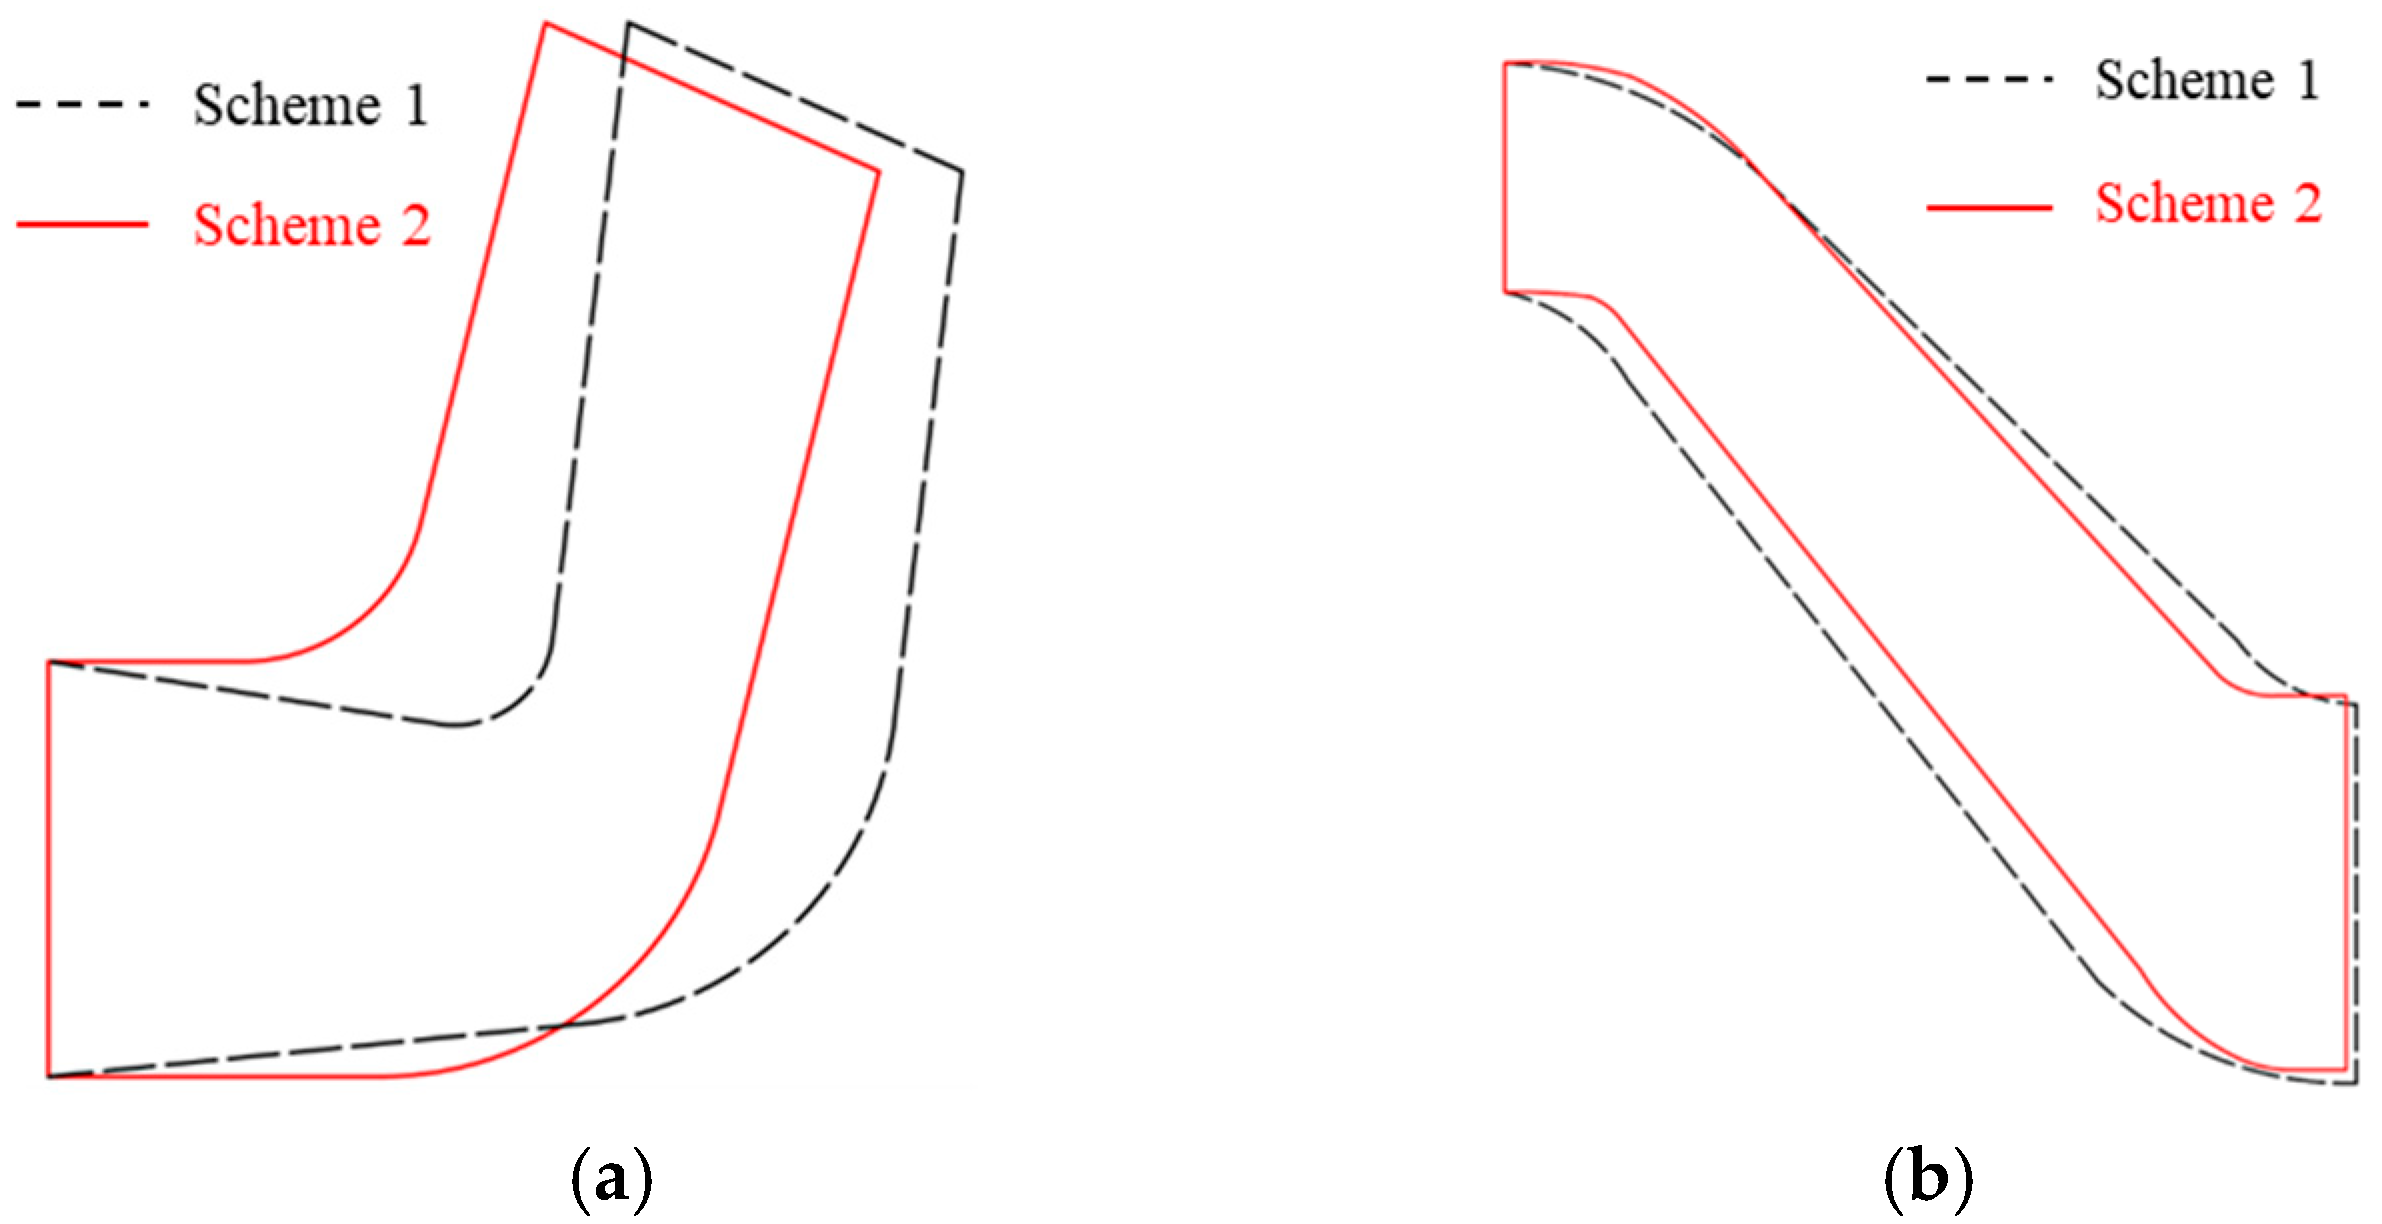
Figure 1. Comparison of different meridian profiles. (a) Impeller; (b) Diffuser.
Sustainability 14 14950 g001
Figure 2. 3D water body assembly development.
Sustainability 14 14950 g002
Figure 3. Single runner grid. (a) Impeller; (b) Diffuser.
Sustainability 14 14950 g003
Figure 4. Distribution map of pressure pulsation monitoring points. (a) Impeller; (b) Diffuser; (c) Pump chamber; (d) Plane distribution map of monitoring points.
Sustainability 14 14950 g004aSustainability 14 14950 g004b
Figure 5. Comparison between simulation results and experimental results of external characteristics.
Sustainability 14 14950 g005
Figure 6. Comparison of pressure fluctuation experiment and simulation results under rated flow (up: time domain, down: frequency domain). (a) 1st stage; (b) 2nd stage; (c) 3rd stage.
Sustainability 14 14950 g006
Figure 7. The influence of the shape of the meridian surface on the internal pressure pulsation characteristics of the impeller under rated operating conditions. (a) Time domain distribution of secondary impeller (left: scheme 1; right: scheme 2); (b) Frequency domain distribution of secondary impeller (left: scheme 1; right: scheme 2); (c) Inter-stage time domain distribution of impeller inlet monitoring points (left: scheme 1; right: scheme 2); (d) Inter-stage time domain distribution of monitoring points in the middle of the impeller (left: scheme 1; right: scheme 2); (e) Inter-stage time domain distribution of impeller outlet monitoring points (left: scheme 1; right: scheme 2).
Sustainability 14 14950 g007aSustainability 14 14950 g007b
Figure 8. Influence of the shape of the meridian plane on the pressure pulsation characteristics inside the pump chamber under rated operating conditions. (a) Time domain distribution of secondary pump chamber (left: scheme 1; right: scheme 2); (b) Frequency domain distribution of secondary pump chamber (left: scheme 1; right: scheme 2); (c) Inter-stage time domain distribution of monitoring points at the inlet of the pump chamber (left: scheme 1; right: scheme 2); (d) Inter-stage time domain distribution of monitoring points in the middle of the pump chamber (left: scheme 1; right: scheme 2); (e) Inter-stage time domain distribution of monitoring points at pump chamber outlet (left: scheme 1; right: scheme 2).
Sustainability 14 14950 g008aSustainability 14 14950 g008b
Figure 9. Influence of the shape of the meridian plane on the internal pressure pulsation characteristics of the diffuser under rated operating conditions. (a) Time domain distribution of secondary diffuser (left: scheme 1; right: scheme 2); (b) Secondary diffuser frequency domain distribution (left: scheme 1; right: scheme 2); (c) Inter-stage time domain distribution of diffuser inlet monitoring points (left: scheme 1; right: scheme 2); (d) Inter-stage time domain distribution of monitoring points in the middle of the diffuser (left: scheme 1; right: scheme 2); (e) Inter-stage time domain distribution of diffuser outlet monitoring points. (left: scheme 1; right: scheme 2).
Sustainability 14 14950 g009aSustainability 14 14950 g009b
Figure 10. Wavelet pulsation characteristics of different meridian under rated flow conditions (left: scheme 1; right: scheme 2). (a) Impeller wavelet pulsation distribution; (b) Pump chamber wavelet pulsation distribution; (c) Diffuser wavelet pulsation distribution.
Sustainability 14 14950 g010aSustainability 14 14950 g010b
Table 1. Grid dependency analysis.
Size/mm1.41.72.02.32.6
Impeller573,678454,745349,804279,843184,696
Diffuser590,164468,813354,508286,473189,041
Head/m58.1958.0558.1156.6555.08
Efficiency/%75.4975.5575.4574.1873.69
Publisher’s Note: MDPI stays neutral with regard to jurisdictional claims in published maps and institutional affiliations.