
Spatial-Temporal Changes and Influencing Factors of Ecological Protection Levels in the Middle and Lower Reaches of the Yellow River


Abstract
1. Introduction
2. Martials and Methods
2.1. Indicator System
2.2. Analytical Framework
2.2.1. Ecological Conservation Levels Model
2.2.2. GTWR Model
2.3. Data Sources
3. Results and Discussion
3.1. Ecological Protection Level
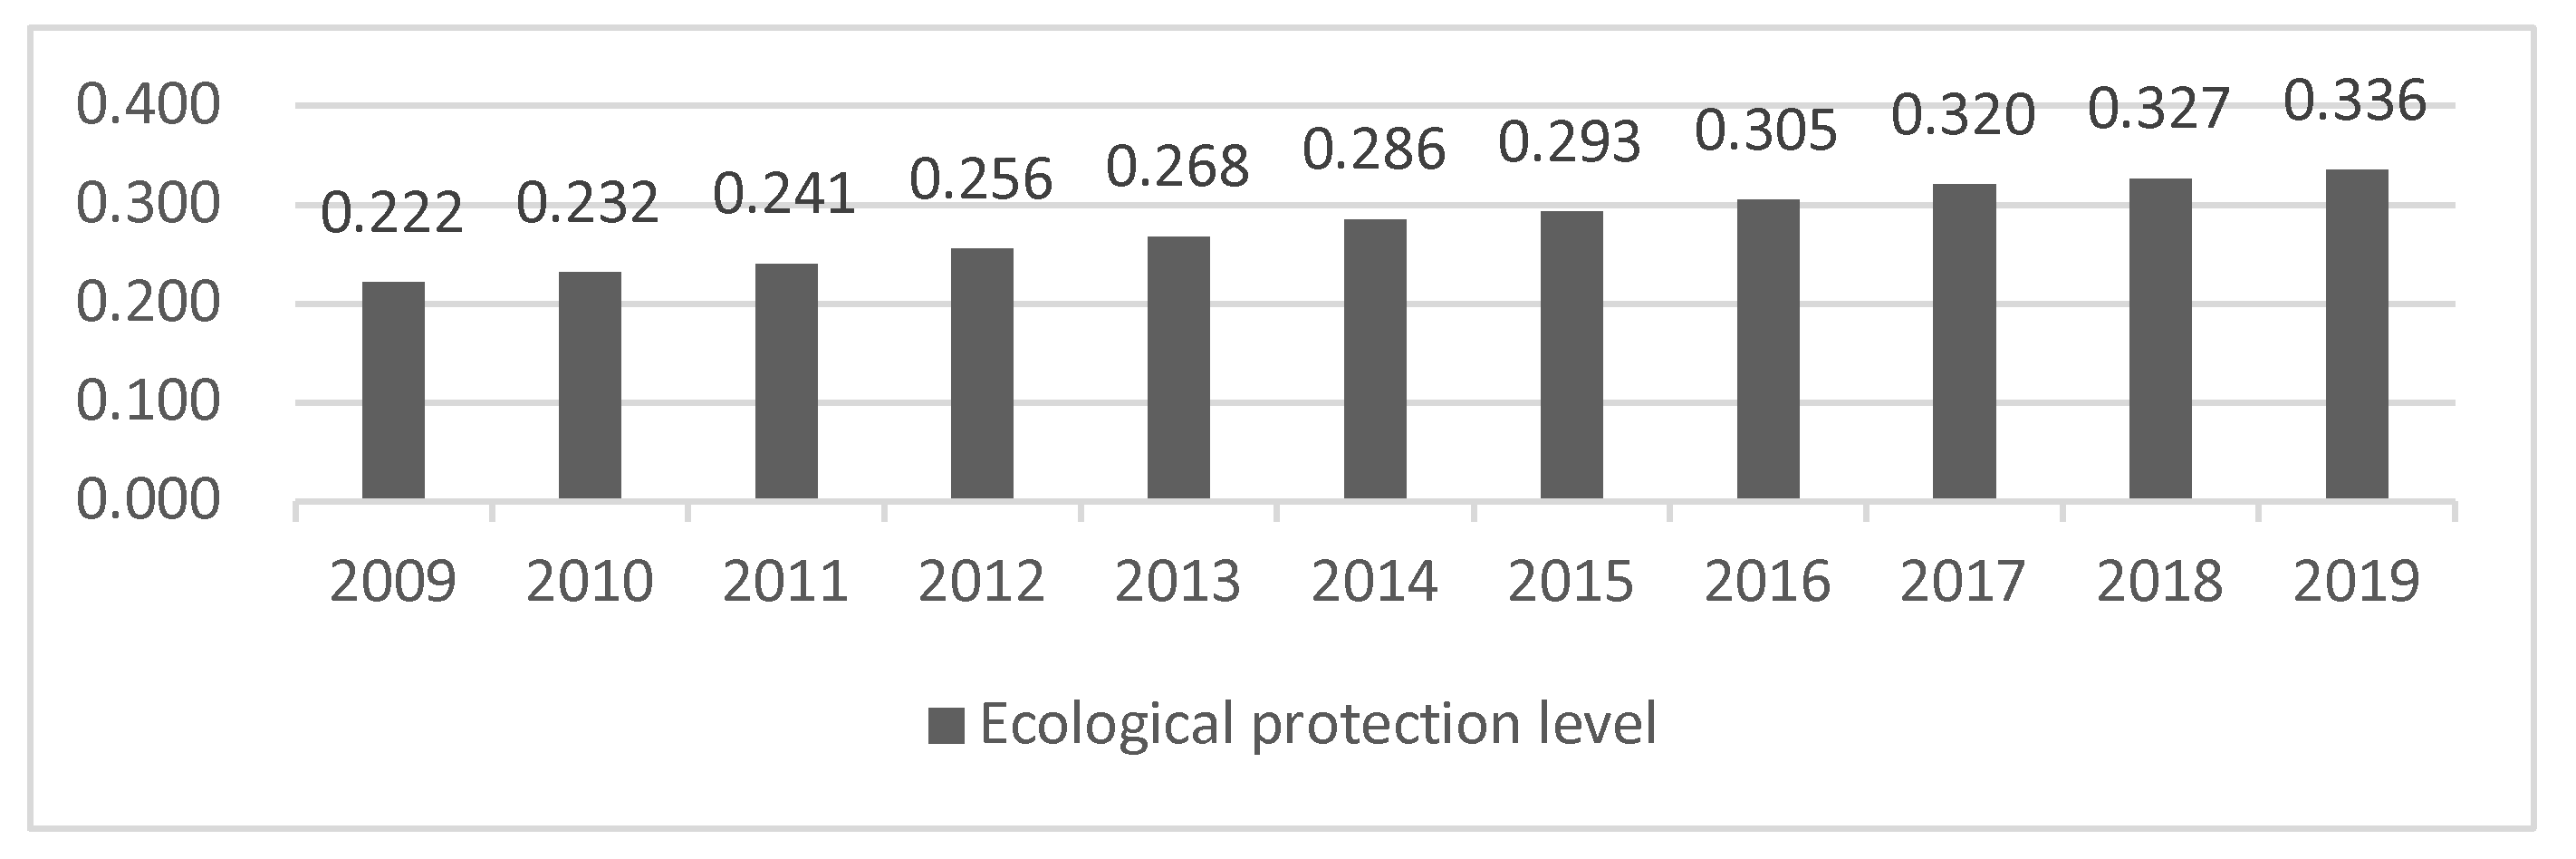
3.1.1. Chronological Changes
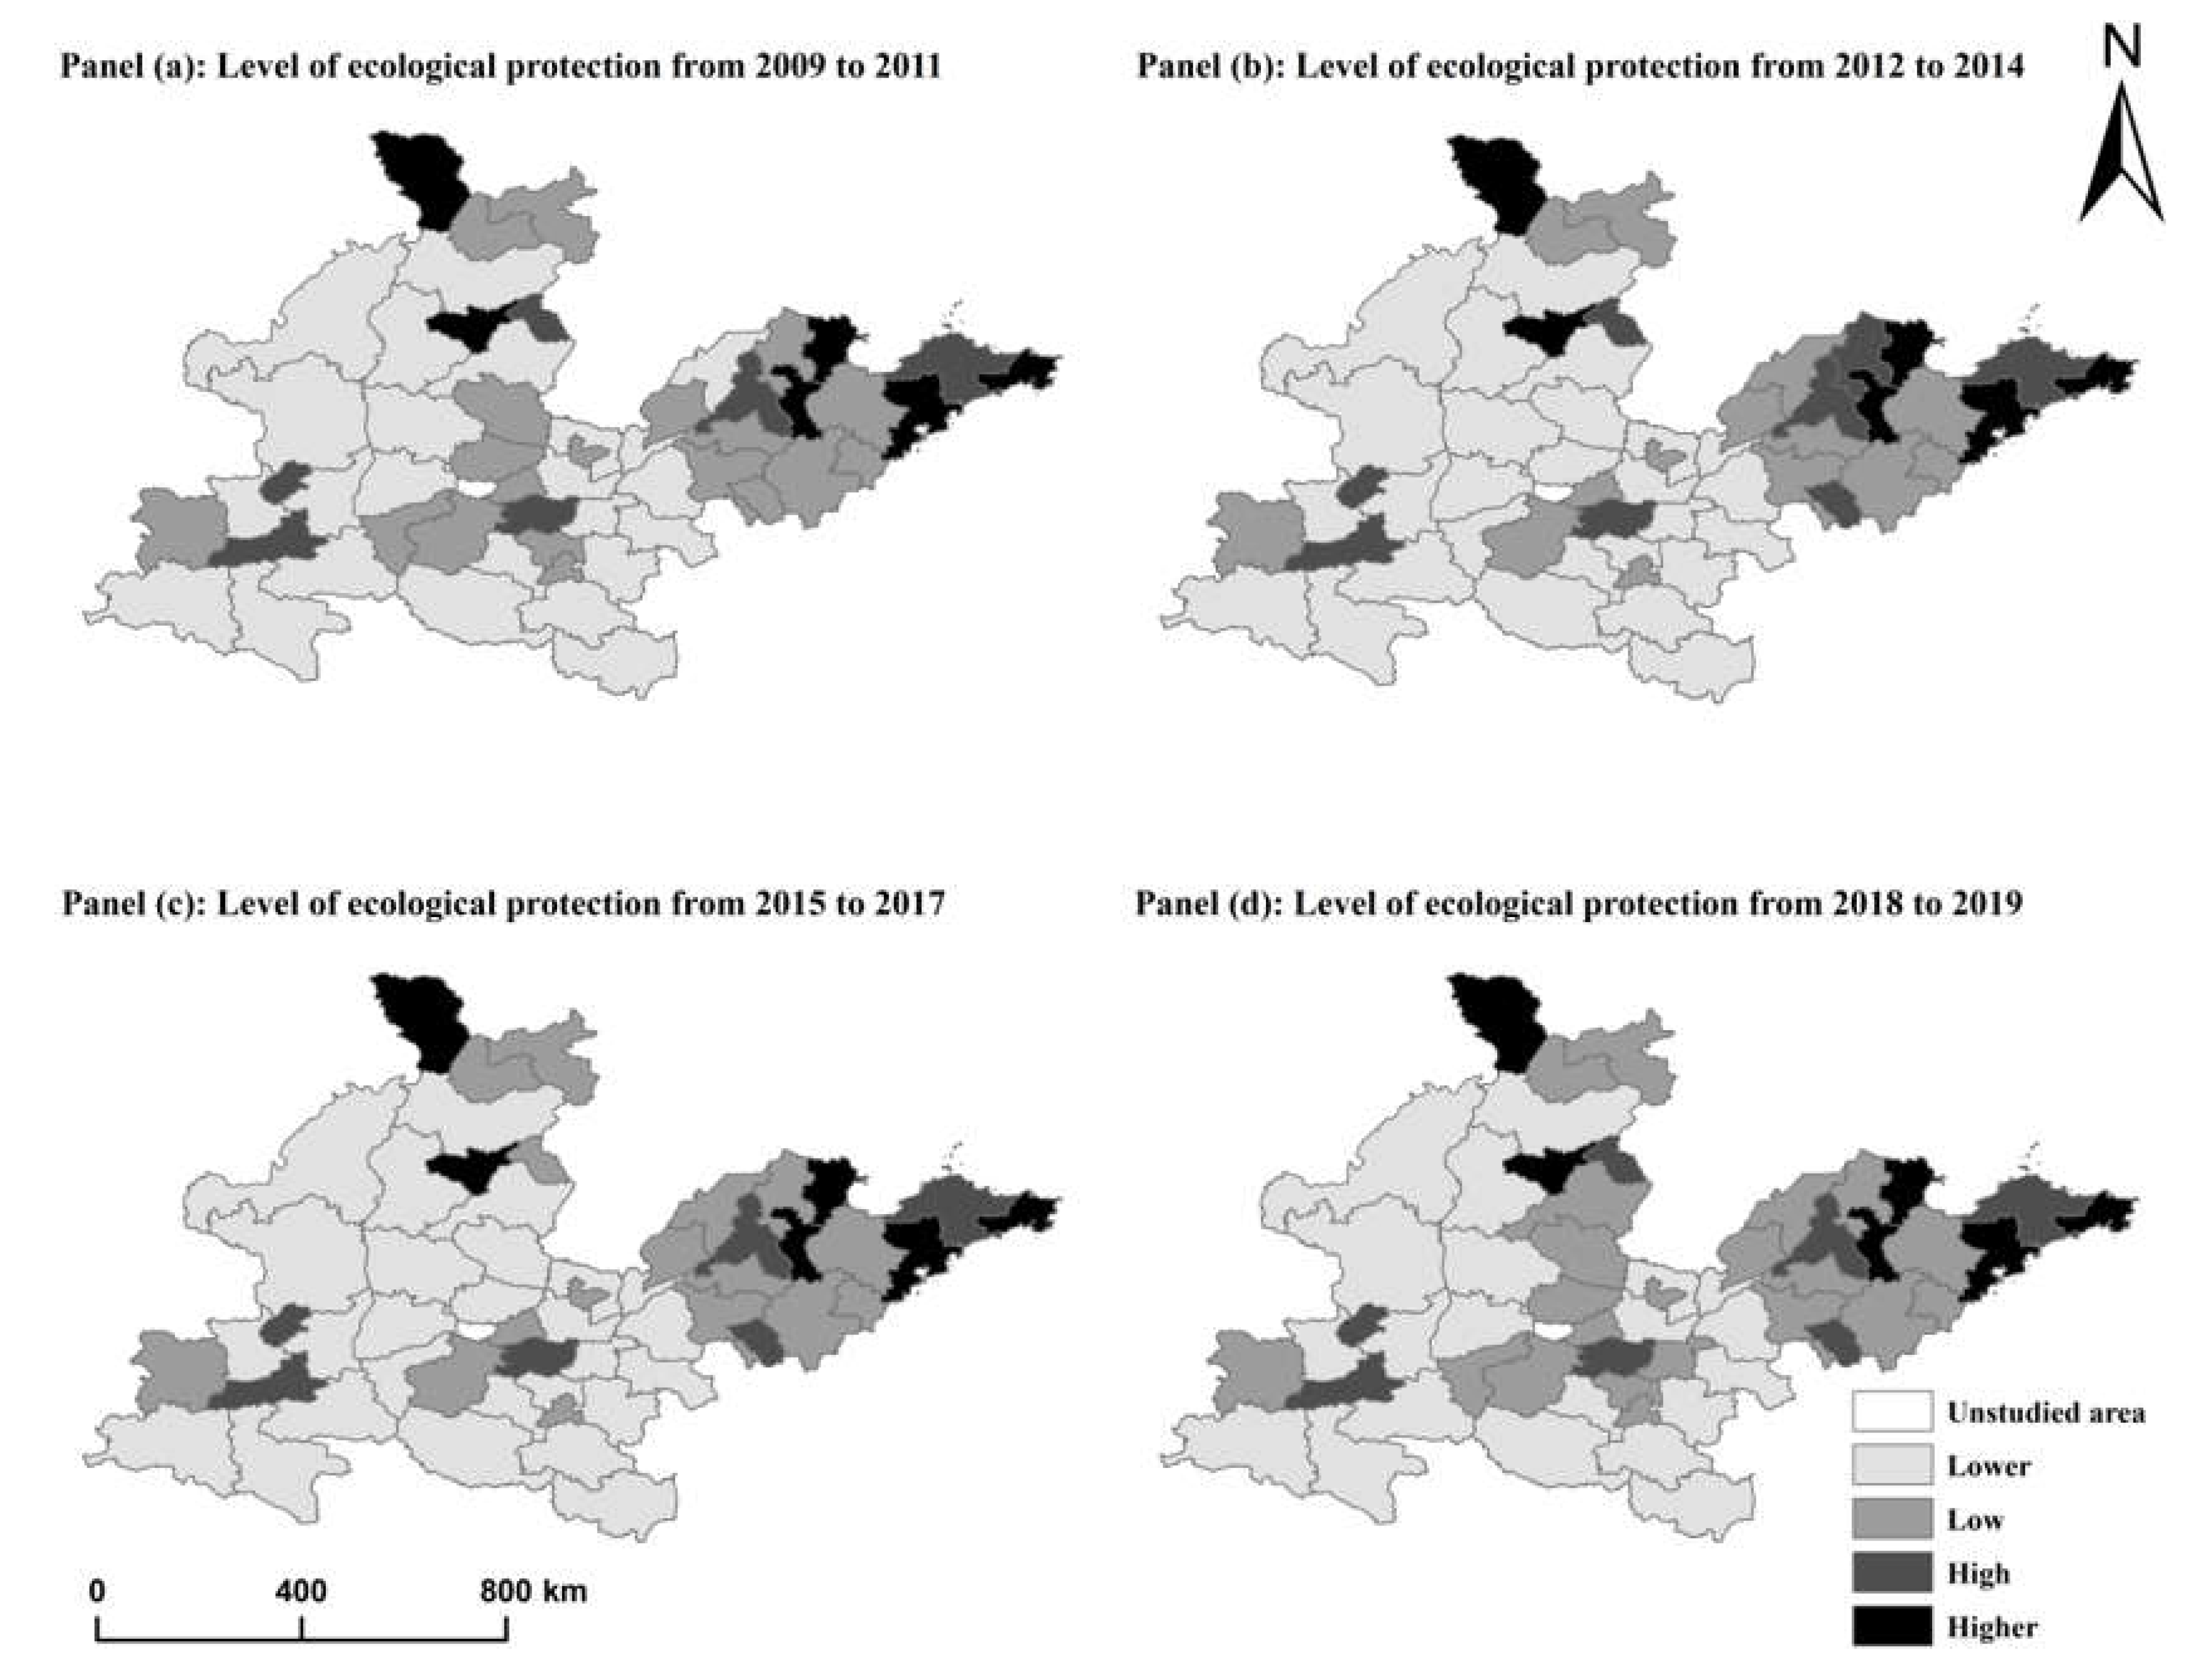
3.1.2. Spatial Distribution Characteristics
- (1)
- From coastal to inland areas, the ecological level tends to decrease from high to low. The most cities with high ecological protection level are mainly located in coastal areas, fewer in inland areas. Coastal cities with the region’s good economic advantages, such as Qingdao and Weihai, have launched green financial products and related platforms to support enterprises to engage in environmentally friendly production, prompting them to transform and upgrade, which has led to an improved level of ecological protection. At the same time, inland areas are relatively backward economically, green financial products have not yet been promoted and ecological policies are weakly regulated. Therefore, most high-level cities are distributed in downstream coastal areas, and there is a certain spatial coupling with regions with higher economic development.
- (2)
- The level of ecological protection varies greatly between provinces. Shandong and Henan are located in the North China plain, with flat terrain, fertile soil, many rivers and lakes [33], it is suitable for various organisms to survive. Therefore, they have a better ecological environment foundation. The industrial structure is transformed more quickly, with less heavy and chemical industries. A series of ecological compensation policies are issued to improve the ecological protection level, so they are in areas with a higher ecological protection level in the four periods and have more cities with a high ecological protection level. The Loess Plateau contains 40% of the Shaanxi Province’s total area and almost the entire Shanxi Province. It has a loose soil structure, which lacks vegetation protection, and is susceptible to serious soil erosion during the summer months when precipitation is concentrated, especially during heavy rainfall [34]. Shaanxi has a large amount of coal, oil and gas resources, and the heavy chemical industries are in dominant position. The large-scale exploitation of resources has led to a large reduction of surface vegetation, coal ash and other wastes have also caused damage to the surface environment and exacerbated soil erosion [35], resulting in serious damage to the ecological environment. Hence, the areas mainly have low ecological protection levels in four periods.
- (3)
- The number of cities with high ecological protection levels has increased slightly. The study areas have a more prominent conflict between protection and development, so to improve its ecological situation, a series of measures has been enacted by the state, from the National Comprehensive Water Resources Plan (2020–2030) approved in 2010, which included the Yellow River Basin Water Resources Utilisation Plan as an important part, to “Ecological Protection and High-quality Development of the Yellow River Basin” strategy proposed in 2019, the implementation of relevant policies has led to the improvement of the ecological situation, resulting the number of cities with high ecological protection levels rising from 21.8% in the first period to 23.64% in the fourth period.
3.2. Spatial Correlation Analysis of Ecological Protection Level
3.2.1. Global Spatial Autocorrelation Analysis
3.2.2. Local Spatial Autocorrelation Analysis
4. Factors Influencing the Level of Ecological Protection
4.1. Variable Selection
- (1)
- The intensity of fertilizer application. Agricultural surface pollution has become one of the most important sources of water pollution in China, so agricultural pollution can greatly influence ecological protection. To maintain crop yields, farmers use chemical fertilizers to increase soil fertility, but there are no precise standards for the amount of fertilizer applied, so farmers are prone to over-spreading fertilizers, resulting in chemicals substances that are not absorbed by plants entering the soil first and then rivers and groundwater with the seepage of water, causing eutrophication of river and the appearance of various algae, polluting water sources, and affecting the ecosystem.
- (2)
- Amount of agricultural film applied. Some crops need to be winterized and the use of agrarian film provides higher temperatures and humidity, so some winterized crops in the north require large amounts of film, but agricultural film cannot be reused and its chemical material produces harmful substances when burned, so it is thrown away in large quantities, leading to a lot of white pollution in the countryside, which is not easily decomposed and can be harmful to the ecological environment.
- (3)
- Green technology innovation level. Green technology innovation generally refers to new methods or technologies that can improve the environment [36,37], which have been studied and discussed by scholars in many aspects, and are believed to be able to mitigate environmental risks [38], improve resource use efficiency [39], reduce pollution rates [40], save energy [41,42], and bring ecological honor [43], so governments and relevant organizations have taken green technological innovation as an important driving force to achieve environmental protection [16].
- (4)
- Afforestation area per capita. Forestry ecological security is an important part of national ecological security. As a component of terrestrial systems, forests and crops can play a number of roles such as climate regulation and biodiversity enrichment [44], contributing to regional sustainable development and ecological civilization construction [45]. Planted forests can replenish the forestry area reduced by logging operations or related production, maintain or enhance the capacity of forest systems to function, and improve the ecological environment.
4.2. Data Verification
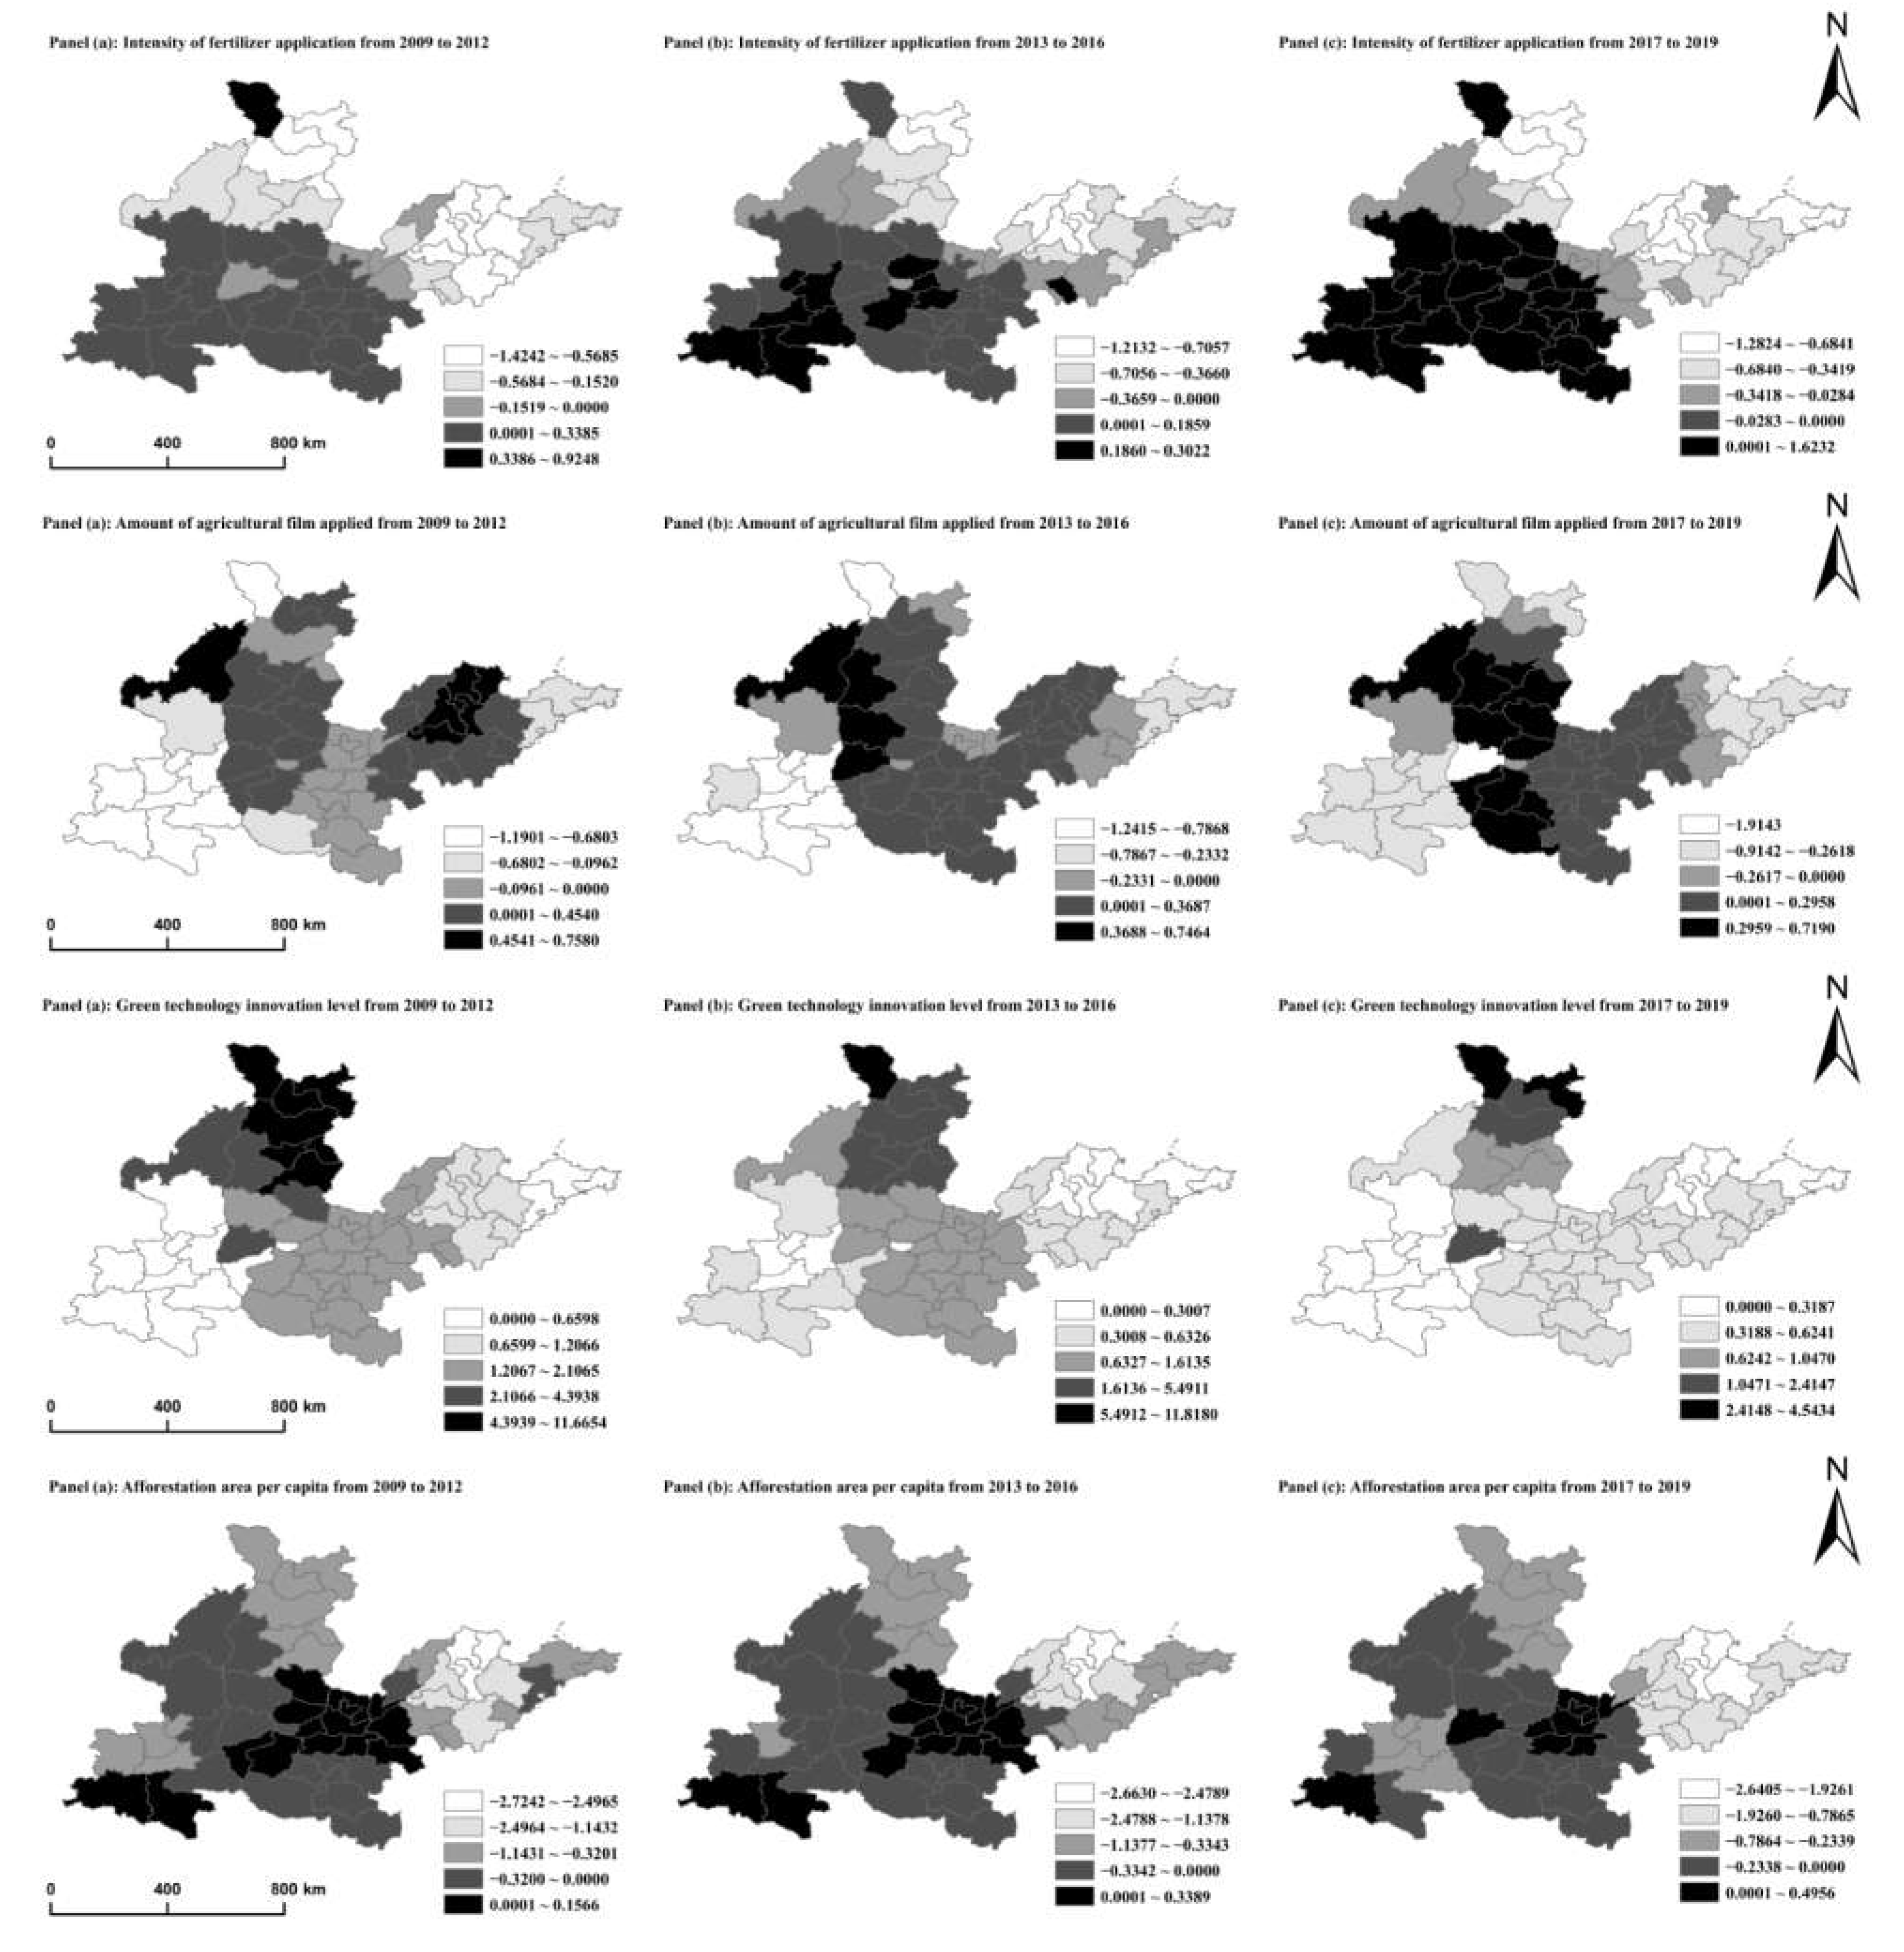
4.3. Evolution of the Spatial Distribution of Influencing Factors
- (1)
- The impact of fertilizer application intensity on the level of ecological protection is mostly negative, and the areas with a higher level of influence are more concentrated in distribution. The intensity of fertilizer application only had the most significant impact on the level of ecological protection in Hohhot in the first period, the number of cities in the highest-level increased greatly in the second and third periods. In Shandong, northern Shanxi and Yulin in Shaanxi Province, the intensity of fertilizer application showed a negative impact on the level of ecological protection, while in Henan, south-central Shaanxi, and southern Shanxi it showed a positive impact, probably because the reduction of fertilizer advocated by the government has played a role, the small amount of fertilizer applied is absorbed by plants, promoting plant growth and thus allowing the level of ecological protection to be improved, thus showing a positive impact.
- (2)
- The negative impact of agricultural film application on the level of ecological protection shows an upward trend, with a smaller number of areas with a positive impact. From the first and third periods, the areas where the impact of agricultural film application is negative are mainly located in southern Shaanxi, central Henan, and coastal Shandong. In the second period, Henan turns to be in a positive distribution, but the positive value is smaller. This indicates that a small amount of agricultural film can protect some non-cold-tolerant plants successfully through winter, which can help maintain the regional ecology. However, the high application amount of agricultural film in most areas damaged the local soil and water environment, so overall showed a negative impact.
- (3)
- The green technology innovation level positively impacts the ecological protection level, but the degree of effects shows a gradual downward trend. The number of cities in high-level influenced by the level of green technology innovation is decreasing. Most cities in Henan Province have reduced from a higher level of influence in the previous two periods to a low level of influence. The green technology innovation level has a high and stable impact on the ecological protection level in the cities of Shanxi Province, with a gradual decline from a higher level in Henan Province, and mainly at a lower level of impact in Shandong and Shaanxi. Innovation is the first driver of green development, and technological innovation plays an increasingly important role in improving environmental quality [46]. The green technologies are difficult to disseminate, complicated to use, and costly, resulting in a low conversion rate and a long period between their approval and practical application to ecological conservation, making the green technology innovation level in this period less effective in enhancing ecological conservation.
- (4)
- The impact of per capita afforestation on the ecological protection level is primarily negative, and shows the first decreasing and then increasing trend. This is mainly because artificial afforestation requires seedling breeding, which consumes many human and material resources, and the survival rate of transplanted seedlings is improved through fertilization and other technical means, raising local carbon emissions. Moreover, the effect of seedlings on improving the ecological level is limited, and the positive impact of afforestation on the environment needs to wait for the saplings to grow up, so there is a lag in the effect of artificial afforestation on improving ecological protection. The areas where the impact of afforestation per capita is positive are mainly distributed in the south of Shaanxi and Shanxi and the north of Henan, where the Yellow River and its branches especially flow through, and the soil erosion is more serious. To combat soil erosion, the governments of Shaanxi and other regions have attached great importance to tree planting activities, promoting a comprehensive national compulsory tree planting campaign through various forms such as pledging to plant and adopt trees, donating funds for afforestation, network planting, nurturing and management, etc. Moreover, the afforestation area is more extensive, with an increase of 66,700 square kilometers of forest area in Shaanxi alone, and the trees transplanted in earlier years have started to take effect, significantly improving the poor ecological state of the region.
4.4. Distribution of Urban Core Influences
- (1)
- Core influences in the same area are relatively stable. The cities with the application amount of agricultural film as a core influencing factor are fewer, which may be due to the use of agricultural film in more occasional areas and the duration of film use, so the impact on the level of ecological protection is small. However, the use of biodegradable film and the limitations of film recycling have led to the accumulation of film residues in the environment year after year, which affects water infiltration and reduces soil water content, leading to serious consequences such as the salinization of the soil. As a result, the impact of agricultural films on the level of ecological protection increases. The number of cities with a green technology innovation level as core impact factors is more. Still, it shows a decreasing trend, mainly due to the high costs and barriers to green technology innovation’s research and development, which makes enterprises lack the motivation to research and development, leading to a gradually decreasing impact of green technology innovation. Hence, the number of cities with it as a core influence factor decreases more. The number of cities with afforestation area per capita as a core influencing factor is small, but shows an increasing trend, probably because transplanted saplings need time to grow into woods before they can play a role in windbreak and sand-fixation, reduce the carbon dioxide content of the area, which in turn has an impact on the greenhouse effect, causing afforestation area per capita impact on ecological protection level is lagging.
- (2)
- The core influencing factors are different between regions. The core influencing factor for Shaanxi is mainly the amount of agricultural film applied, for Henan and Shanxi is the green technology innovation level, for Shandong is green technology innovation level and afforestation area per capita. In Shaanxi, the low importance attached to green technologies and less green technology applications make its positive impact on ecological protection limited, but the local area has a wide range of agricultural product bases with a large amount of agricultural film application, therefore, the amount of agricultural film applied becoming the core factor influencing the level of ecological protection. As more and more attention being paid to the Yellow River’s ecological environment, Shaanxi promotes sustainable agricultural development projects. It implements projects such as the comprehensive recycling of agricultural film, so the number of cities in Shaanxi with agricultural film application as a core factor for ecological protection level has been reduced in the third period. Henan, in order to strengthen energy conservation and emission reduction, has carried out green technology-related seminars and built a green technology innovation system. At the same time, Shanxi focused on green transformation, using green technology to promote low carbon emissions and develop clean energy, making the level of green technology innovation a core influencing factor for most cities in Henan and Shanxi provinces; Shandong attaches more importance to green technology and forest resources, and since 2004 Shandong has held several Since 2004, Shandong has held many green technology exhibitions and environmental technology forums to promote the exchange of green technology among municipalities, and has established a forest chief system and actively promoted the greening of the national territory, which has greatly improved the ecological level of each municipality. Shandong attaches more importance to green technology and forest resources, and since 2004 Shandong has held several green technology exhibitions and environmental technology forums to promote the exchange of green technology among cities, and has established a forest chief system and actively promoted the greening of the national territory, which has greatly improved the ecological level of each city. So, the improvement of ecological protection in Shandong cities is mainly dependent on the implementation of policies and is characterized by a two-wheeled core influence of the green technology innovation level and the afforestation area per capita.
5. Conclusions and Policy Implications
5.1. Conclusions
- (1)
- The ecological protection level shows a steady upward trend, but the spatial distribution varies greatly. The ecological level increased from 0.222 to 0.336 for 2009–2019, and the growth rate was 51.35%. The growth trend is divided into three stages: slow growth from 2009–2011, rapid growth from 2012–2017, and slower growth from 2018–2019. The level of ecological protection shows a decreasing distribution trend from the coast to the interior. Most cities with high-level ecological protection are located at Shandong and Henan provinces. While most cities from Shaanxi provinces have a low-level ecological protection.
- (2)
- The ecological protection level shows a significant positive spatial correlation and are mainly clustered in the same category. The index of Global Moran’s I are greater than 0.1, which all pass the significance test, the spatial positive correlation of ecological protection level was significant. The change of Global Moran’s I index is small, indicating that the ecological protection level clustering state is relatively stable between cities. The first and third quadrants of the Moran scatter plot have the majority of cities distributed, showing a clear clustering of same agglomeration. The third quadrant belongs to the “low-low” category and distributes the largest number of cities.
- (3)
- The factors affecting the ecological protection level differ in spatial and temporal distribution. The ecological protection level is strongly influenced by the green technology innovation level in three periods, mainly by a positive way, while the intensity of fertilizer application, amount of agricultural film applied, and afforestation area per capita mostly show a small and negative influence on the level of ecological protection. The core influencing factor for most cities in Shaanxi is the amount of agricultural film applied, for most cities in Henan and Shanxi provinces is mainly the green technology innovation level, the core influencing factors for most cities in Shandong is the afforestation area per capita and green technology innovation level.
5.2. Policy Implications
Author Contributions
Funding
Institutional Review Board Statement
Informed Consent Statement
Data Availability Statement
Acknowledgments
Conflicts of Interest
References
- Lu, C.; Ji, W.; Liu, Z.; Mao, J.; Li, J.; Xue, B. Spatial-temporal Pattern and Influencing Factors of the “Production-LivingEcological” Functional Space of the Yellow River Basin at County Level in Gansu, China. Sci. Geogr. Sin. 2022, 42, 579–588. [Google Scholar]
- Sun, Y.H. The Review, Reflection and Prospect of Environmental Legislation in China Over the Past 70 Years. Chin. J. Environ. Manag. 2019, 11, 5–10. [Google Scholar]
- Elahi, E.; Khalid, Z.; Tauni, M.Z.; Zhang, H.; Lirong, X. Extreme weather events risk to Crop -production and the adaptation of innovative management strategies to mitigate the risk: A retrospective survey of rural Punjab, Pakistan. Technovation 2021, 117, 102255. [Google Scholar] [CrossRef]
- Elahi, E.; Zhixin, Z.; Khalid, Z.; Xu, H. Application of an artificial neural network to optimise energy inputs: An energy-and cost-saving strategy for commercial poultry farms. Energy 2022, 244, 123169. [Google Scholar] [CrossRef]
- Li, H.J.; Du, S. Twelve More Prominences: The Essence of Xi Jinping Thought on Socialism with Chinese Characteristics for a New Era. Reform 2022, 5, 1–20. [Google Scholar]
- Liu, L.B.; Xiong, K.N.; Ren, X.D. Assessment of Ecological Environment Status in the Longxi-Hongkou National Nature Reserve Based on Remote Sensing Ecological Index. J. Ecol. Rural. Environ. 2020, 36, 202–210. [Google Scholar]
- Razzaq, A.; Qing, P.; Abid, M.; Anwar, M.; Javed, I. Can the informal groundwater markets improve water use efficiency and equity? Evidence from a semi-arid region of Pakistan. Sci. Total Environ. 2019, 666, 849–857. [Google Scholar] [CrossRef]
- Razzaq, A.; Tang, Y.; Qing, P. Towards Sustainable Diets: Understanding the Cognitive Mechanism of Consumer Acceptance of Biofortified Foods and the Role of Nutrition Information. Int. J. Environ. Res. Public Health 2021, 18, 1175. [Google Scholar] [CrossRef]
- Razzaq, A.; Xiao, M.; Zhou, Y.; Liu, H.; Abbas, A.; Liang, W.; Naseer, M. Impact of Participation in Groundwater Market on Farmland, Income, and Water Access: Evidence from Pakistan. Water 2022, 14, 1832. [Google Scholar] [CrossRef]
- Ru, S.F.; Ma, R.H. Evaluation, spatial analysis and prediction of ecological environment vulnerability of Yellow River Basin. J. Nat. Resour. 2022, 37, 1722–1734. [Google Scholar] [CrossRef]
- Pan, H.Y.; Li, J.A.; Zhang, Q. Study on Restoration of Ecological Environment Quality in Earthquake Area Based on RSEI: A Case Study of Wenchuan County. Resour. Environ. Yangtze Basin 2021, 30, 745–757. [Google Scholar]
- Shi, Y.L.; Yu, G.R.; Wang, H. Assessment of China’s ecological environment and strategic thinking. Resour. Sci. 2015, 37, 1305–1313. [Google Scholar]
- Razzaq, A.; Liu, H.; Zhou, Y.; Xiao, M.; Qing, P. The Competitiveness, Bargaining Power, and Contract Choice in Agricultural Water Markets in Pakistan: Implications for Price Discrimination and Environmental Sustainability. Front. Environ. Sci. 2022, 670. [Google Scholar] [CrossRef]
- Zhang, Q. Study on the Coordination between Eco-environmental Protection and High-quality Economic Development in the Northwest of the Middle and Upper Reaches of the Yellow River. Ningxia Soc. Sci. 2022, 3, 139–145. [Google Scholar]
- Gao, G.L.; Jia, R.X.; Wang, J.Y.; Dou, H.T. Significant Advances, Comprehensive Evaluation, Main Orientation of Ecological Protection and High-Quality Development in the Yellow River Basin. J. Lanzhou Univ. 2022, 50, 35–46. [Google Scholar]
- Sun, Y.; Fan, J.; Sun, Z.R.; Guo, R. Temporal and Spatial Pattern of Green Technology Innovation and Its Influencing Factors in the Yellow River Basin. Ecol. Econ. 2022, 38, 60–67. [Google Scholar]
- Fang, S.N. The Distinct Political Orientation of Xi Jinping’s Ecological Civilization Thought. Theor. Explor. 2020, 1, 79–85. [Google Scholar]
- Sun, J.W.; Cui, Y.Q.; Zhang, H. Spatio-temporal pattern and mechanism analysis of coupling between ecological protection and economic development of urban agglomerations in the Yellow River Basin. J. Nat. Resour. 2022, 37, 1673–1690. [Google Scholar] [CrossRef]
- Cheng, H.X.; Yu, Y.; Niu, H.; Wu, Y.P.; Cheng, Q.Q. Analysis on the Measurement and Coupling Coordination of Ecological Environment and Green Development in the Yellow River Basin. For. Econ. 2021, 43, 5–20+96. [Google Scholar] [CrossRef]
- Liu, B.B.; Zuo, Q.T.; Diao, Y.X. The value and pathways of green technology innovation for ecological conservation and high-quality development of the Yellow River Basin. Resour. Sci. 2021, 43, 423–432. [Google Scholar] [CrossRef]
- Zhao, J.J.; Liu, Y.; Zhu, Y.K.; Qin, S.L.; Wang, Y.H.; Miao, C.H. Spatiotemporal differentiation and influencing factors of the coupling and coordinated development of new urbanization and ecological environment in the Yellow River Basin. Resour. Sci. 2020, 42, 159–171. [Google Scholar] [CrossRef]
- Cui, P.P.; Zhao, Y.; Xia, S.Y.; Yan, J.Y. Level Measures and Temporal and Spatial Coupling Analysis of Ecological Environment and High Quality Development in the Yellow River Basin. Econ. Geogr. 2020, 40, 49–57+80. [Google Scholar]
- Sun, J.Q. Evaluation and Trend Prediction of Coupling Coordination between Ecological Protection and High-quality Development in the Yellow River Basin. Financ. Econ. 2021, 3, 106–118. [Google Scholar]
- Feng, X.H.; Zhong, Y.X.; Li, Z.R.; Fu, Y. Evolvement of spatial pattern of urban system in the Economic Belt of Yangtze River. Resour. Environ. Yangtze Basin 2017, 26, 1721–1733. [Google Scholar]
- Li, E.K.; Lu, Y.Q.; Chen, Y. Geographic pattern evolution of China’s merchandise export and its influencing factors: Based on the analysis of merchandise export distance and the GTWR model. Geogr. Res. 2019, 38, 2624–2638. [Google Scholar]
- Elahi, E.; Khalid, Z.; Weijun, C.; Zhang, H. The public policy of agricultural land allotment to agrarians and its impact on crop productivity in Punjab province of Pakistan. Land Use Policy 2020, 90, 104324. [Google Scholar] [CrossRef]
- Zhang, Z.X.; Li, Y.J.; Elahi, E.; Wang, Y.M. Comprehensive Evaluation of Agricultural Modernization Levels. Sustainability 2022, 14, 5069. [Google Scholar] [CrossRef]
- Ren, B.P.; Du, Y.X. Industrial Ecologicalization in the Context of High-Quality Development in the Yellow River Basin. Yellow River 2022, 44, 5–10. [Google Scholar]
- Elahi, E.; Weijun, C.; Jha, S.K.; Zhang, H. Estimation of realistic renewable and non-renewable energy use targets for livestock production systems utilising an artificial neural network method: A step towards livestock sustainability. Energy 2019, 183, 191–204. [Google Scholar] [CrossRef]
- Elahi, E.; Weijun, C.; Zhang, H.; Abid, M. Use of artificial neural networks to rescue agrochemical-based health hazards: A resource optimisation method for cleaner crop production. J. Clean. Prod. 2019, 238, 117900. [Google Scholar] [CrossRef]
- Elahi, E.; Weijun, C.; Zhang, H.; Nazeer, M. Agricultural intensification and damages to human health in relation to agrochemicals: Application of artificial intelligence. Land Use Policy 2019, 83, 461–474. [Google Scholar] [CrossRef]
- Zhang, J.M. Study on the Legal Mechanism for Water Preservation and Restoration in the Yellow River Basin. Frontiers 2022, 2, 106–108. [Google Scholar]
- Wang, T.; Wang, Z.X.; Mao, D.H. Spatial and temporal match pattern of virtual water versus virtual cultivated land of main grain crops in China. World Agric. 2019, 10, 71–79+110+130+131. [Google Scholar]
- Wang, Y.R.; Wang, Y.H.; Yang, J.L.; Zhao, T.Y.; Kou, L.; Zhang, D.H. Forest ecological security rating and its spatio-temporal evolution analysis in the Yellow River Basin. Acta Ecol. Sin. 2022, 42, 2112–2121. [Google Scholar]
- Ma, L.; Tian, H.Z.; Kang, L. Eco-environmental impact and spatial control of mineral resources exploitation in the Yellow River Basin. Resour. Sci. 2020, 42, 137–149. [Google Scholar] [CrossRef]
- Castellacci, F.; Lie, C.M. A taxonomy of green innovators: Empirical evidence from South Korea. J. Clean. Prod. 2016, 143, 1036–1047. [Google Scholar] [CrossRef]
- Takalo, S.K.; Tooranloo, H.S.; Parizi, Z.S. Green innovation: A systematic literature review. J. Clean. Prod. 2021, 279, 122474. [Google Scholar] [CrossRef]
- Elahi, E.; Khalid, Z.; Zhang, Z. Understanding farmers’ intention and willingness to install Renewable energy technology: A solution to reduce the environmental emissions of agriculture. Appl. Energy 2022, 309, 118459. [Google Scholar] [CrossRef]
- Wang, W.X.; Yu, B.; Yan, X.; Yao, X.L.; Liu, Y. Estimation of innovation’s green performance: A range-adjusted measure approach to assess the unified efficiency of China’s manufacturing industry. J. Clean. Prod. 2017, 149, 919–924. [Google Scholar] [CrossRef]
- Albort-Morant, G.; Leal-Rodríguez, A.L.; de Marchi, V. Absorptive capacity and relationship learning mechanisms as complementary drivers of green innovation performance. J. Knowl. Manag. 2018, 22, 432–452. [Google Scholar] [CrossRef]
- Elahi, E.; Khalid, Z. Estimating smart energy inputs packages using hybrid optimization technique to mitigate environmental emissions of commercial fish farms. Appl. Energy 2022, 326, 119602. [Google Scholar] [CrossRef]
- Chapple, K. Innovation in the Green Economy: An Extension of the Regional Innovation System Model? Econ. Dev. Q. 2011, 25, 5–25. [Google Scholar] [CrossRef]
- Maria, D.R. What Drives Green Product Development and How do Different Antecedents Affect Market Performance? A Survey of Italian Companies with Eco-Labels. Bus. Strategy Environ. 2017, 26, 1144–1161. [Google Scholar]
- Elahi, E.; Zhang, H.; Lirong, X.; Khalid, Z.; Xu, H. Understanding cognitive and socio-psychological factors determining farmers’ intentions to use improved grassland: Implications of land use policy for sustainable pasture production. Land Use Policy 2021, 102, 105250. [Google Scholar] [CrossRef]
- Chen, Y.D.; Xu, S.; An, X. Construction and Demonstration of Forestry Ecological Security Evaluation Index System. Stat. Decis. 2021, 37, 36–40. [Google Scholar]
- Liao, G.P.; Qin, J.M. Can Green Technology Innovation Effectively Improve Environmental Quality?Based on the Perspective of Fiscal Decentralization. J. Technol. Econ. 2022, 41, 17–29. [Google Scholar]


| First-Level Index | Second-Level Index | Unit | Attribute |
|---|---|---|---|
| state level | Greenery coverage in built-up areas | % | + |
| Green space per capita | m2/person | + | |
| pressure level | Industrial wastewater emissions per unit GDP | Tonnes/million RMB | - |
| Industrial SO2 emissions per unit GDP | Tonnes/million RMB | - | |
| response level | Ratio of sound disposal of domestic waste | % | + |
| Ratio of sewage sent to treatment plants | % | + |
| Years | 2009 | 2010 | 2011 | 2012 | 2013 | 2014 | 2015 | 2016 | 2017 | 2018 | 2019 |
|---|---|---|---|---|---|---|---|---|---|---|---|
| Global Moran’s I | 0.205 | 0.233 | 0.225 | 0.233 | 0.217 | 0.199 | 0.2 | 0.188 | 0.207 | 0.151 | 0.213 |
| z | 2.674 | 2.999 | 2.897 | 2.989 | 2.815 | 2.59 | 2.594 | 2.468 | 2.689 | 2.054 | 2.756 |
| p | 0.004 | 0.001 | 0.002 | 0.001 | 0.002 | 0.005 | 0.005 | 0.007 | 0.004 | 0.02 | 0.003 |
| Indicators | Specific Indicators | Explanation of Indicators |
|---|---|---|
| Intensity of fertilizer application | Fertilizer use/crop area sown | Agricultural pollution and ecological protection |
| Amount of agricultural film applied | Agricultural plastic film use/crop sown area | |
| Green technology innovation level | Number of green patent applications/grants | Green technology applied to ecological conservation |
| Afforestation area per capita | Area of planted forests/population | Artificially modified ecosystems |
| Bandwidth | Residual Squares | Sigma | AICc | R2 | R2 Adjusted | Spatio-Temporal Distance Ratio |
|---|---|---|---|---|---|---|
| 1.1435 | 1.1314 | 0.0429 | −2130.5430 | 0.8005 | 0.7992 | 0.9365 |
Publisher’s Note: MDPI stays neutral with regard to jurisdictional claims in published maps and institutional affiliations. |
© 2022 by the authors. Licensee MDPI, Basel, Switzerland. This article is an open access article distributed under the terms and conditions of the Creative Commons Attribution (CC BY) license (https://creativecommons.org/licenses/by/4.0/).
Share and Cite
Zhu, M.; Tang, H.; Elahi, E.; Khalid, Z.; Wang, K.; Nisar, N. Spatial-Temporal Changes and Influencing Factors of Ecological Protection Levels in the Middle and Lower Reaches of the Yellow River. Sustainability 2022, 14, 14888. https://doi.org/10.3390/su142214888
Zhu M, Tang H, Elahi E, Khalid Z, Wang K, Nisar N. Spatial-Temporal Changes and Influencing Factors of Ecological Protection Levels in the Middle and Lower Reaches of the Yellow River. Sustainability. 2022; 14(22):14888. https://doi.org/10.3390/su142214888
Chicago/Turabian StyleZhu, Min, Haiyun Tang, Ehsan Elahi, Zainab Khalid, Kaili Wang, and Nimra Nisar. 2022. "Spatial-Temporal Changes and Influencing Factors of Ecological Protection Levels in the Middle and Lower Reaches of the Yellow River" Sustainability 14, no. 22: 14888. https://doi.org/10.3390/su142214888
APA StyleZhu, M., Tang, H., Elahi, E., Khalid, Z., Wang, K., & Nisar, N. (2022). Spatial-Temporal Changes and Influencing Factors of Ecological Protection Levels in the Middle and Lower Reaches of the Yellow River. Sustainability, 14(22), 14888. https://doi.org/10.3390/su142214888