Article

Nutrition Transition and Chronic Diseases in India (1990–2019): An Ecological Study Based on Animal and Processed Food Caloric Intake and Adequacy according to Nutrient Needs

1
INRAE, Université Clermont Auvergne, UNH, Human Nutrition Unit, CRNH Auvergne, F-63000 Clermont-Ferrand, France
2
Department of Food Science and Technology, Pondicherry University, Chinna Kalapet, Kalapet, Pondicherry 605014, India
*
Author to whom correspondence should be addressed.
Sustainability 2022, 14(22), 14861; https://doi.org/10.3390/su142214861
Submission received: 22 October 2022 / Revised: 8 November 2022 / Accepted: 9 November 2022 / Published: 10 November 2022
(This article belongs to the Special Issue Diet and Nutrition in Food Sustainability)

Abstract

:
The Indian diet is becoming westernized with a potential threat to human health. This ecological study aimed at analyzing the nutritional transition in India during the 1990–2019 period within the framework of the newly developed 3V index, considering the degree of processing starting with industrially processed foods (IPFs, i.e., the Real/’Vrai’ metric 1), plant/animal calorie ratio (i.e., the Vegetal metric 2), and diversity of food intake (i.e., the Varied metric 3). Total and food group (n = 14) caloric intakes, percentages of animal and IPF calories, adequacy to the Indian Recommended Dietary Allowances, and prevalence of chronic diseases were retrieved from web databases (e.g., OECD.Stats, Our World in Data and FAO-STAT) and Indian food composition table. The total calorie intake increased by 31% over thirty years, being mainly linked to increased consumption of dairy products and IPF, but still remains below the average recommended intake in 2019. The IPF and animal calorie shares increased from 3.6 to 11.6% and 15.1 to 24.3%, respectively, while micronutrient intakes improved in 2019. In the same time, prevalence of overweight/obesity and type 2 diabetes, and cardiovascular disease mortality increased. In conclusion, the evolution of the Indian diet deviates from metrics 1 and 2 and improves in metric 3, which may not be a sufficient metric in terms of the alleviation of chronic diseases. Therefore, while improving food diversity and replacing refined with wholegrain cereals, Indians should also curb increasing their consumption of IPF and animal calories.

Graphical Abstract

1. Introduction

Diet-related chronic disease prevalence (e.g., obesity and type 2 diabetes) continues to rise worldwide [1], especially in emerging and developing countries, such as China [2] and India [3], where the nutrition transition is more rapid and impactful toward human health than in developed countries [4]. Furthermore, food system sustainability, social inequalities in healthy food access, the progressive disappearance of small-scale agriculture, loss of animal and plant biodiversity, increased animal suffering from intensive breeding, and environmental degradation all pose serious threats to global health [5,6,7,8]. Food systems are globally responsible for 34% of greenhouse gas emissions worldwide, with 24% from agriculture and land-use change activities and 10% from supply chain activities [9]. However, healthier and more sustainable food choices downstream might drive more sustainable food processing (i.e., reducing ultra-processing) [7], which would have the potential also to drive an increase in sustainable food production [10], potentially mitigating greenhouse gas emissions and pollution upstream. Beyond the usual nutritional recommendations referring to the balance between vegetal and animal calories and the consumption of a variety of foods from the groups in the food pyramid, current studies show that an imbalance also occurs depending on the degree of processing applied to the foods ingested [11].
Thus, the worldwide increase in animal-based foods [12,13] and ultra-processed foods (UPF) [7,14,15,16,17] consumption does not go in the direction of improved food system sustainability, and more broadly of global health. In addition, monotonous diets (e.g., diet high in UPF in Western countries or based on a few staple foods—cereals and/or legumes) diets in developing countries) may threaten animal and plant biodiversity worldwide, and food system sustainability in the end, notably because they are less resilient to external stress factors, such as extreme climatic change [18]. Therefore, these three dimensions, i.e., the vegetal/animal product ratio, the UPF percentage, and food variety in the diet, need to be considered together to achieve a healthy and sustainable dietary pattern. However, previous analyses of scenarios addressing dietary patterns and global health [19] generally considered either only one or two of these dimensions [6], and sometimes only food nutrient contents, e.g., proteins [20], but never all three dimensions at the same time. Thus, they appear insufficiently holistic and still too reductionist to reach a strong impact on global health.
For this purpose, we elaborated through an empirico-inductive approach [21] based on foresight scenarios for protecting global health at horizon 2050, and also based on validated dietary patterns for preventing chronic diseases [19], a holistic and simple index to characterize the relationship between diet and global health, i.e., the 3V index for Vrai (Real, not UPFs mimicking real foods), Végétal (Vegetal) and Varié (Varied, if possible organic, local and/or seasonal) foods [19]. Within the framework of an ideal 3V index, quantitatively, worldwide, a precautionary UPFs threshold would account for no more than approximately 15% of calories (1–2 servings/day, Real metric) and animal foods (from all sources) for an optimum of approximately 15% calories (2–3 servings/day, Vegetal metric), and weekly at least 35 different real foods (among the main food groups), as previously described [19]. Such thresholds allow for meeting and improving all nutritional needs [19]. All three metrics are linked to global health and are interconnected, so if one of the three dimensions is not fully addressed, the diet moves away from the target of sustainable global health. For example, replacing animal foods with ultra-processed plant-based meat substitutes [22] or consuming organic UPFs, such as industrially processed ready-to-eat meals or bakery products, among others [23], will not necessarily lead to substantial improvement in global health. The 3V index also implies that meeting or improving nutritional needs (Vegetal and Varied metrics) is not sufficient to prevent chronic diseases (such as obesity, type 2 diabetes, hypertension or hepatic steatosis) if the food matrix environment of the nutrients and calories (Real metric) is too highly degraded [24], notably by a high level of processing applied to vegetal foods (e.g., highly refined grains, sugar sweetened beverages, or industrial sweets and desserts) [25] or ultra-processing [11,26,27], as reported in the Chinese [28] and French [29] diet transitions, where nutritional adequacy is insufficient to prevent high level of chronic disease prevalence. Finally, the 3V index does not aggregate the three dimensions in only one score but are considered separately.
Therefore, the healthy and sustainable diet derived from the 3V index corresponds to a diet rich in minimally-processed and varied plant-based foods [19]. Thus, contrary to the EAT-Lancet dietary pattern that proposes quantities by food group to reach global sustainability [6], the holistic 3V index only defines three generic dimensions that govern the diet-global health relationship [19,29], and that can be adapted according to the specificities of each region or countries worldwide. Applied to the transition of dietary patterns in emerging countries, this index, easy to learn by consumers, and health and public policy professionals, makes it possible to better target the development of a healthy and sustainable diet. Therefore, the 3V index is not a diet but a holistic indicator that tells to look not only at the quantity of consumed calories and the adequacy of nutrient needed to prevent chronic diseases but also to look at the importance of calorie quality/source, expressed by the Real and, secondarily, Vegetal metrics.
In this way, the 3V index allows for the assessment of the health and sustainability potentials of a dietary pattern trajectory over time. In France, considered a developed country, the dietary pattern is far from optimum in regard to the 3V index, with UPF and animal foods accounting for 35 and 36% of the daily calorie consumption in adults, respectively, as well as the presence of some nutrient deficiencies in 2015 [29]. This can be attributed to the high level of UPFs available in French supermarkets/hypermarkets, with UPFs accounting for 69 percent of industrially processed foods (IPFs) [30], as well as the purchasing habits of regular hypermarket customers for whom shopping carts were evaluated, revealing that foods in the shopping cart contained 61 and 41% UPFs and animal calories, respectively [31]. In emerging countries, UPF sales are rapidly growing, reaching a calorie share of approximately 25% in the Brazilian diet in 2018 [32] and 19% in the Chinese diet in 2019 [28]. More precisely, in China, it was observed that the dietary pattern is moving substantially away from a beneficial 3V index, i.e., from the 15% optimal animal and UPF caloric intake [19]. Due to the very large Chinese population, this may have potential deleterious impacts on global health.
Another vast emerging country, with approximatively the same number of individuals as China (1.37 billion in 2019), is India. Still, contrary to China, it is characterized by a significant percentage of vegetarians (30–40% of the overall population [33]). Consequently, the trend of evolution of the quality of the Indian diet with regard to human and environmental health is of the utmost importance, because with China this makes up 36% of the world’s population. Thus, if the diet of more than a third of the world’s population shifts towards less healthy and unsustainable dietary patterns, this will have very negative consequences for global health. Measuring this trend, notably during the last thirty years, is therefore crucial. The 3V rule, very holistic and encompassing the three dimensions of global health, is very suitable for this type of ecological analysis. The One Health approach also includes human health and therefore the prevalence of chronic diseases in India. Notably, between the 1990s and 2010s, the prevalence of overweight and obesity has doubled in India, together with a constant and regular increase in the consumption of highly industrialized and junk foods [4].
Therefore, the main objective of this ecological study was to assess the evolution of the overall Indian dietary pattern from 1990 to 2019, the period encompassing the last nutrition transition, through the lens of the 3V index and to relate these observations to the prevalence trajectories of main chronic diseases.

2. Materials and Methods

The rational for the three metrics used in this study has been previously and comprehensively detailed with all affiliated references [19].
To measure the adequacy of the Indian dietary pattern to the 3V index during the 1990–2019 period, animal-based foods (Vegetal metric for the vegetal/animal calorie ratio) and UPF (Real metric) calorie percentages were mandatory. For the ‘Varied’ dimension, the evolution of the different consumed food groups’ shares and the adequacy to the nutrient needs (i.e., based on the Recommended Dietary Allowances, RDAs) [34] were considered as two indicators indirectly reflecting the food diversity of the Indian dietary pattern. Then, correlations between the ‘Real’ and ‘Vegetal’ metrics (calorie quality and source) and the prevalence or mortality rates of chronic diseases during the 1990–2019 period were calculated. For all these calculations, data were first extracted from web databases, and secondarily, when data were lacking, from some original articles.

2.1. Data Sources and Collection

To target the overall Indian population, the main sources of data for food group and animal-based food intakes (g/day and calorie/day) were extracted from OECD.Stats [35], Our World in Data [36], FAOSTAT [37], Helgilibrary.com and Commoditiescontrol.com web databases. Contrary to national surveys data which can be subjected to recall bias and may be concerned by a specific target group or population, data from these web platforms (i.e., not scholarly databases) allows analyses on overall consumption trends over time; and are therefore better adapted to ecological studies.
Then, from these platforms, thirteen food groups could have been selected: cereals, fruits, vegetables, legumes, pulses and tubers, meats (beef, sheep, and poultry), dairy products, eggs, fish and seafood, nuts and seeds, spices and condiments, sugars, and oils and fats. To avoid duplicates, total dairy product and plant oil consumptions, as retrieved from the OECD.Stats web databases, were corrected by those already included in the IPF group, i.e., dairy products and plant oil marketed in formal retail channels [38].
Food composition data were collected from the Indian Food Composition Tables [39], created with the most recent data supplied by the Department of Food Science and Technology from Pondicherry University (total: n = 8618 different foods, including IPFs). The data on prevalence percentages and/or mortality rates of chronic diseases, i.e., hypertensive heart diseases, ischemic heart disease, stroke, obesity, type 2 diabetes, liver diseases, cancers, upper digestive tract diseases, and hemoglobinopathies/hemolytic anemias were retrieved from “The Lancet GBD” [40], “Perspective Monde” [41], “Our World in Data” [36], and “IDF Diabetes Atlas” [42] databases.
When data were lacking from web databases, they were extracted from original articles or review papers about India and its nutrition transition through the ISI Web of Science database, with the topic fields and combined Boolean operators as follows:
[“Animal product* OR processed food*” OR “Chronic disease*”] AND [“Consumption* OR intake* OR sale*”] AND [“India*”], and the affiliated keywords or synonyms for each lexical field.
Then, the results obtained from both sources (web databases and original articles) were compared to already published results derived from Indian epidemiological or ecological studies based on different representative national surveys at different years (e.g., India study (PODIS) [43], India Human Development Survey [44] or Urban and Rural survey in 2016 and 2012 [45]).

2.2. Data Formatting according to the 3V Index

For the Real metric, due to the lack of data for UPF consumption in India, only data on IPFs were retrieved (considering that all IPFs are not UPFs). IPFs were defined “as substances extracted and purified from unprocessed or minimally processed foods (e.g., vegetable oils) and industrially produced ready-to-eat or ready-to-heat food products resulting from the processing of several food substances (e.g., snack bars). This is a deliberately broader definition than the ‘UPF’ category”, and concerned product vector categories for sugar, fat, and salt consumption for the years 1999, 2006, 2012, and 2017, i.e., oils and fat, fruit/vegetable juices, frozen processed foods, dried processed foods, dairy, confectionery, biscuits, chilled processed foods, carbonated soft drinks, baked goods and other processed foods [38]. Baker et al. sourced data for IPF from Euromonitor International Passport Global Market Information Database [38]. The ideal Real metric considers not to exceed 15% UPF calorie daily.
Meats, dairy products, eggs, fish, and seafood were all considered 100% animal-based foods for the Vegetal metric. Concerning mixed products found in IPFs, which are combinations of vegetal and animal ingredients, a median animal calorie percentage was assessed from the main recipes found in each IPF category, as previously detailed [28,29,31]. The ideal Vegetal metric considers not to exceed 15% animal calorie daily.
The Varied metric is indirectly expressed as (1) the change in the calorie shares accounted for by the primary food groups and (2) the evaluation of the supply of macro- and micronutrients and fiber, and the corresponding adequacy with regard to the Indian RDAs for adults—after averaging for males and females [34], based on food group quantities consumed and the median food group composition [39]. To say it differently, the Varied metric here is simply evaluated through an improvement in nutritional needs and a more equitable distribution of consumption of the main food groups.

2.3. Data Calculations and Statistical Analyses

The basis of the calculations was the average calorie intake (kcal/day/capita) during the 1990–2019 period calculated for the main food groups consumed. When it was necessary to convert grams to kcal, we used all ‘as eaten’ food products within each food group from the updated Indian database [39]. After checking the normality of the data distribution (Shapiro–Wilk’s test, non-significant) within a given food group, the nonparametric median calorie content for one gram of each food group was determined (Table 1).
Food groups were relatively homogeneous regarding food items that compose them, limiting the bias of calculations first based on the median calorie content of each food group (Table 1).
For the Real metric, we first considered the total amount of IPFs consumed in 1999, 2006, 2012 and 2017 (kg per capita) [38]. For the missing data during the 1990–2019 period, IPF data were extrapolated from these four years based on the best fitted equation for the years 1999, 2006, 2012 and 2017, i.e., “Consumption (g/day/capita) = 2 × 10−41e(0.0488×year)” (R2 = 1). For the Vegetal metric, data regarding the consumption of animal food groups were expressed in g/day or in kg/year/capita and were more rarely expressed in calories. Therefore, when necessary, data were converted into calories to determine the median percentages of calories consumed for each animal group (Table 1). For these first two metrics, the total calories from animal and IPF sources were reported concerning the total daily consumed calories, yielding daily animal and IPF calorie percentages (%).
For the Varied metric, we first calculated the percentage of calories accounted for by the selected thirteen main food groups and IPFs. Secondly, according to the Indian RDA [33] and the median amounts of macro- and micronutrients in each of these fourteen food groups (as evaluated from the Indian food database [39]), we also evaluated the RDA adequacy (%) during the 1990–2019 period for fiber, free sugars (maximum 10% of total calorie intake), each micronutrient (vitamins, minerals and trace elements: see the number of ‘as eaten’ foods considered within each food group in Table 1) and the evolution of the protein, carbohydrate, and lipid calorie percentages.
To measure the evolution of chronic disease prevalence through the lens of the 3V index during the 1990–2019 period, they were correlated with total calorie intake (i.e., calorie quantity), animal food, and IPF calorie shares (%) (i.e., calorie quality). The best-fitted models/equations were identified for each correlation (i.e., those with the highest coefficient of determination, R2).
Due to the non-significant result for Shapiro–Wilk’s test, showing a non-normal distribution of the data (SPAD 9.1 software©, Coheris, Suresnes, France), median values were always used in this study (e.g., median calorie and nutrient contents for food groups). All correlation analyses and searches for equations were realized with Excel software (Microsoft Office 2016©, Redmond, Wash., DC, USA).

3. Results

3.1. Sources of Calorie Intakes

Total calorie intake increased from 1726 to 2266 kcal/day/capita between 1990 and 2019, i.e., +24%, with a slight decrease between 2001 and 2005, from 1965 to 1948 kcal/day/capita (Table 2).
This increase was mainly due to the rise in IPFs, sugar, oils and fats, fish and seafood, and dairy products consumptions, while cereal consumption decreased from 1122 to 1071 kcal/day/capita (i.e., −4.5%) (Figure 1). Consumption of plant-based foods slightly increased for nuts and seeds, legumes, pulses and tubers, fruits and vegetables, while spice and condiment consumption slightly decreased.
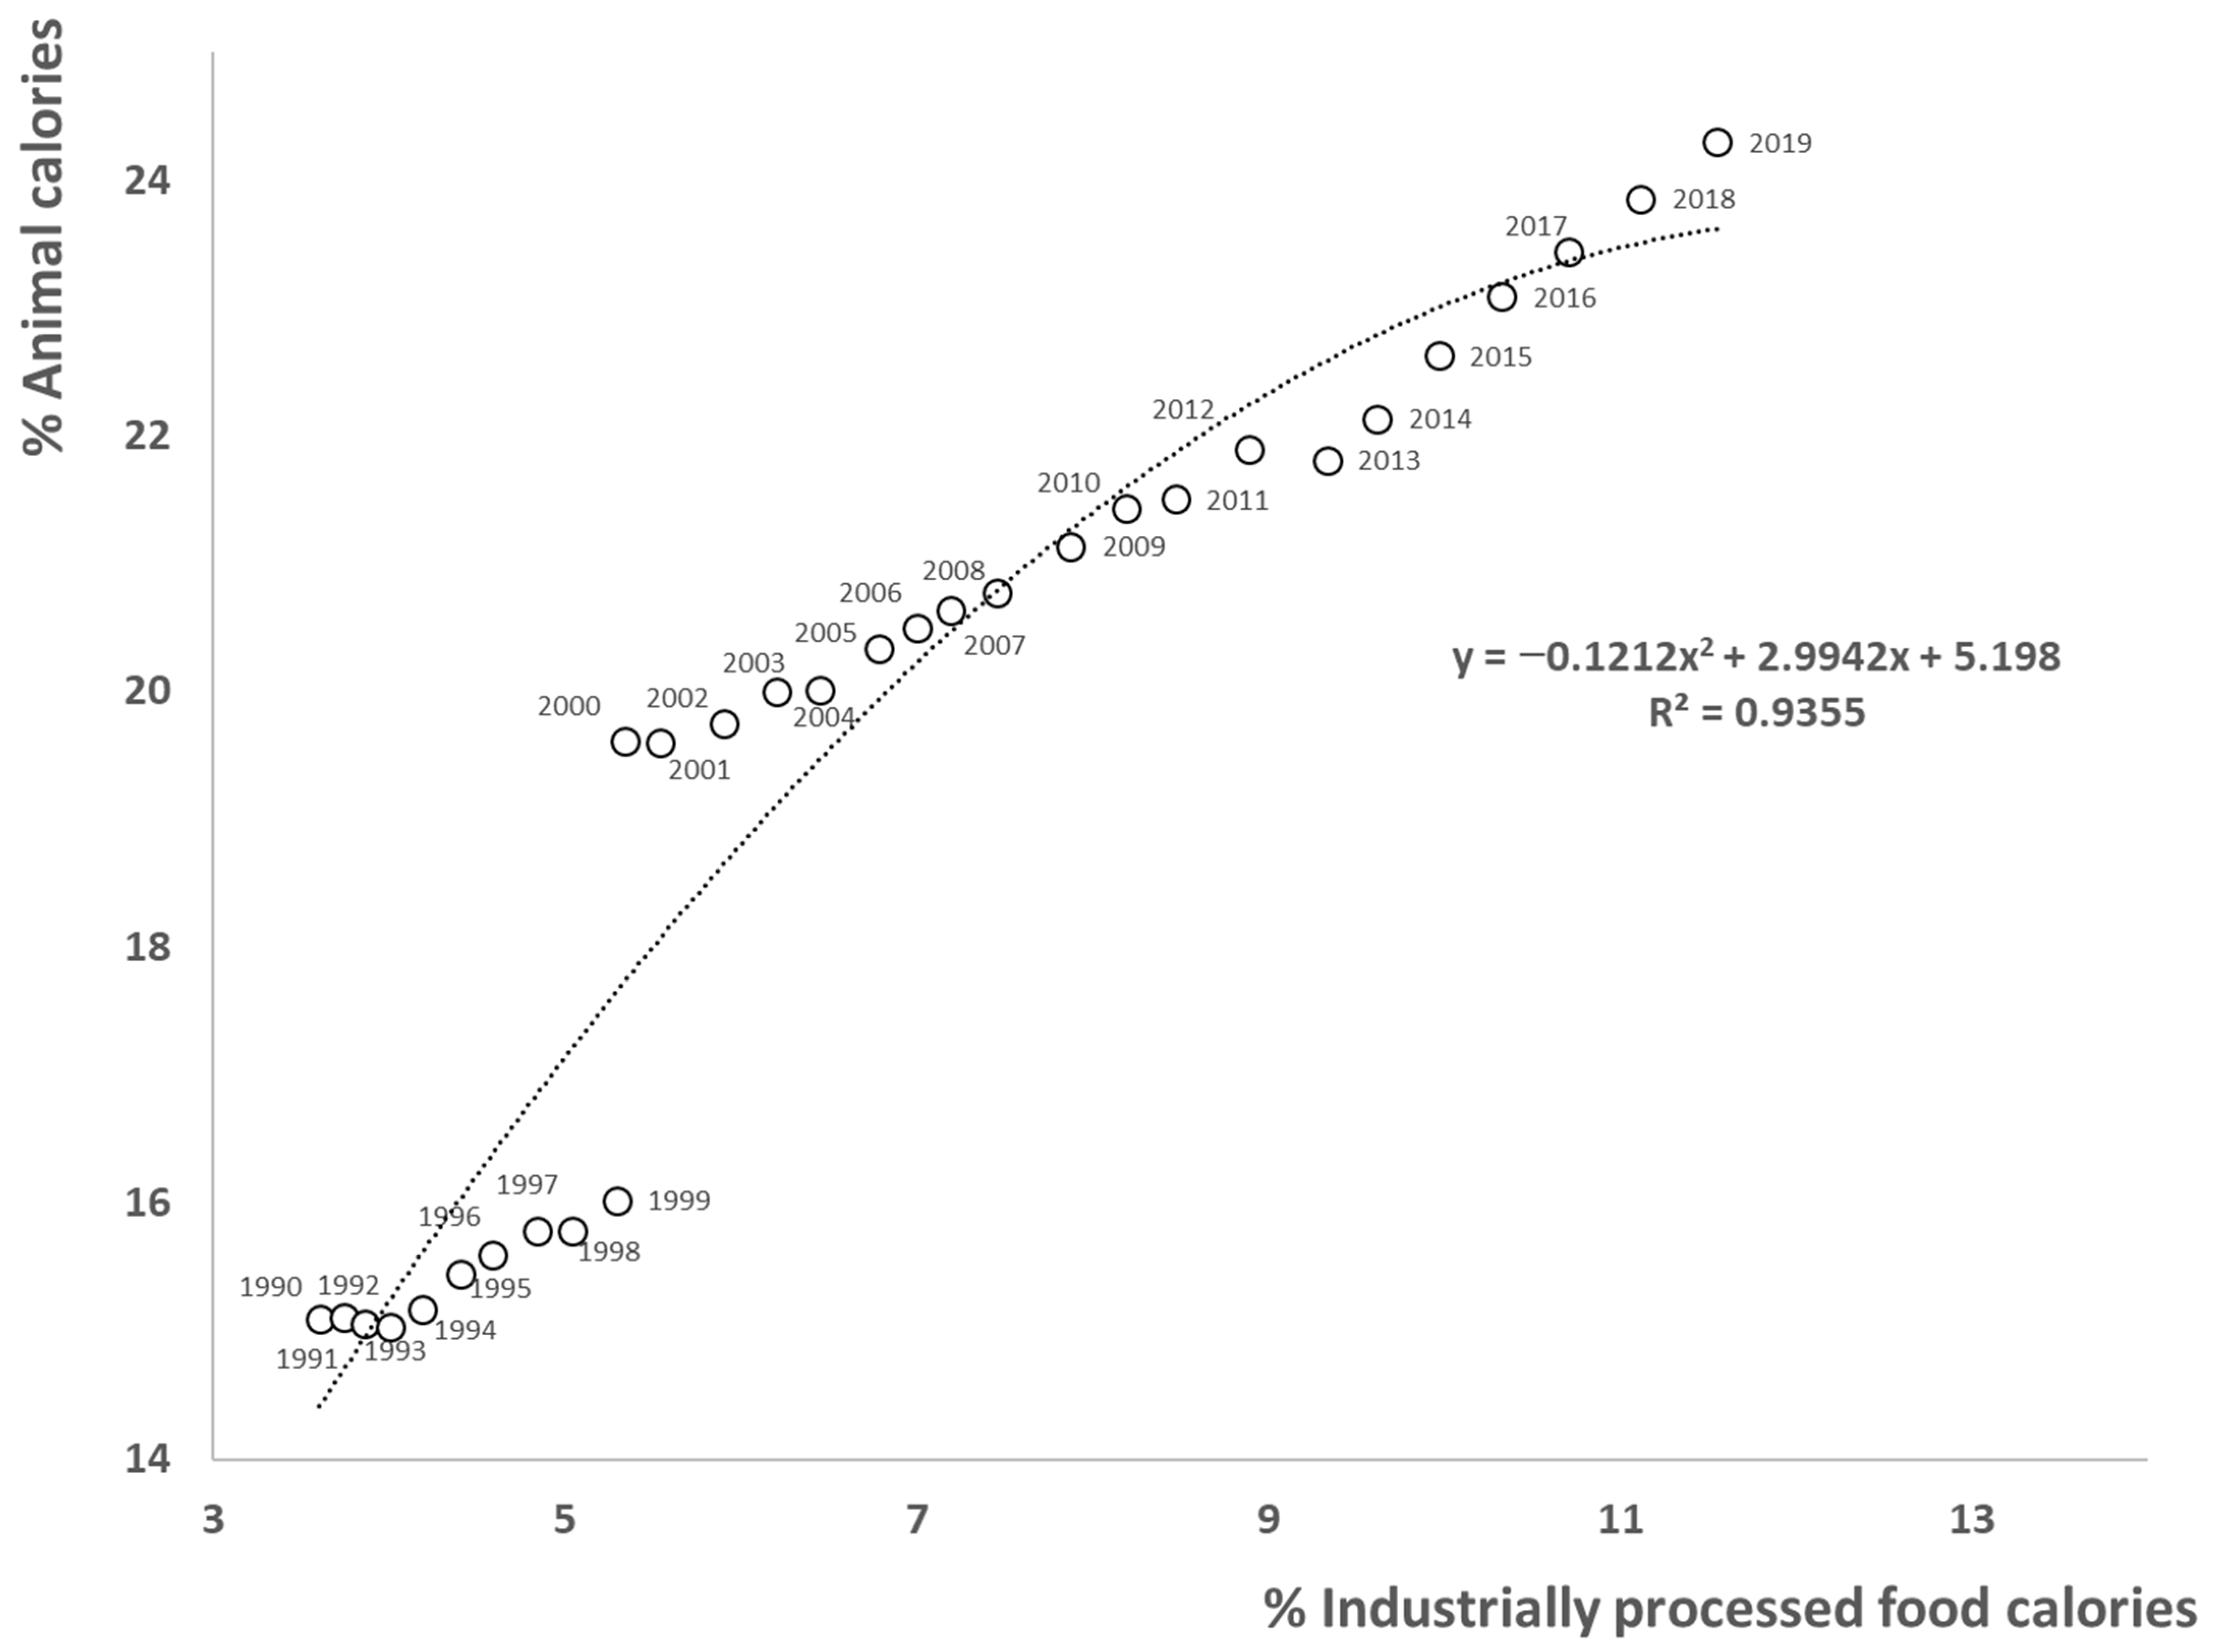
During this same period, animal and IPF intake regularly increased from 15.1 to 24.3% (exceeding the 15% animal calorie threshold of the Vegetal metric) and from 3.6 to 11.6% (remaining under the 15% UPF calorie threshold of the Real metric) of calories consumed, respectively (Table 2), and these two data were highly correlated with each other according to a polynomial curve (R2 = 0.94; Figure 2). The most significant variation was the decrease in the calories consumed from cereals (−18%) (Table 2).
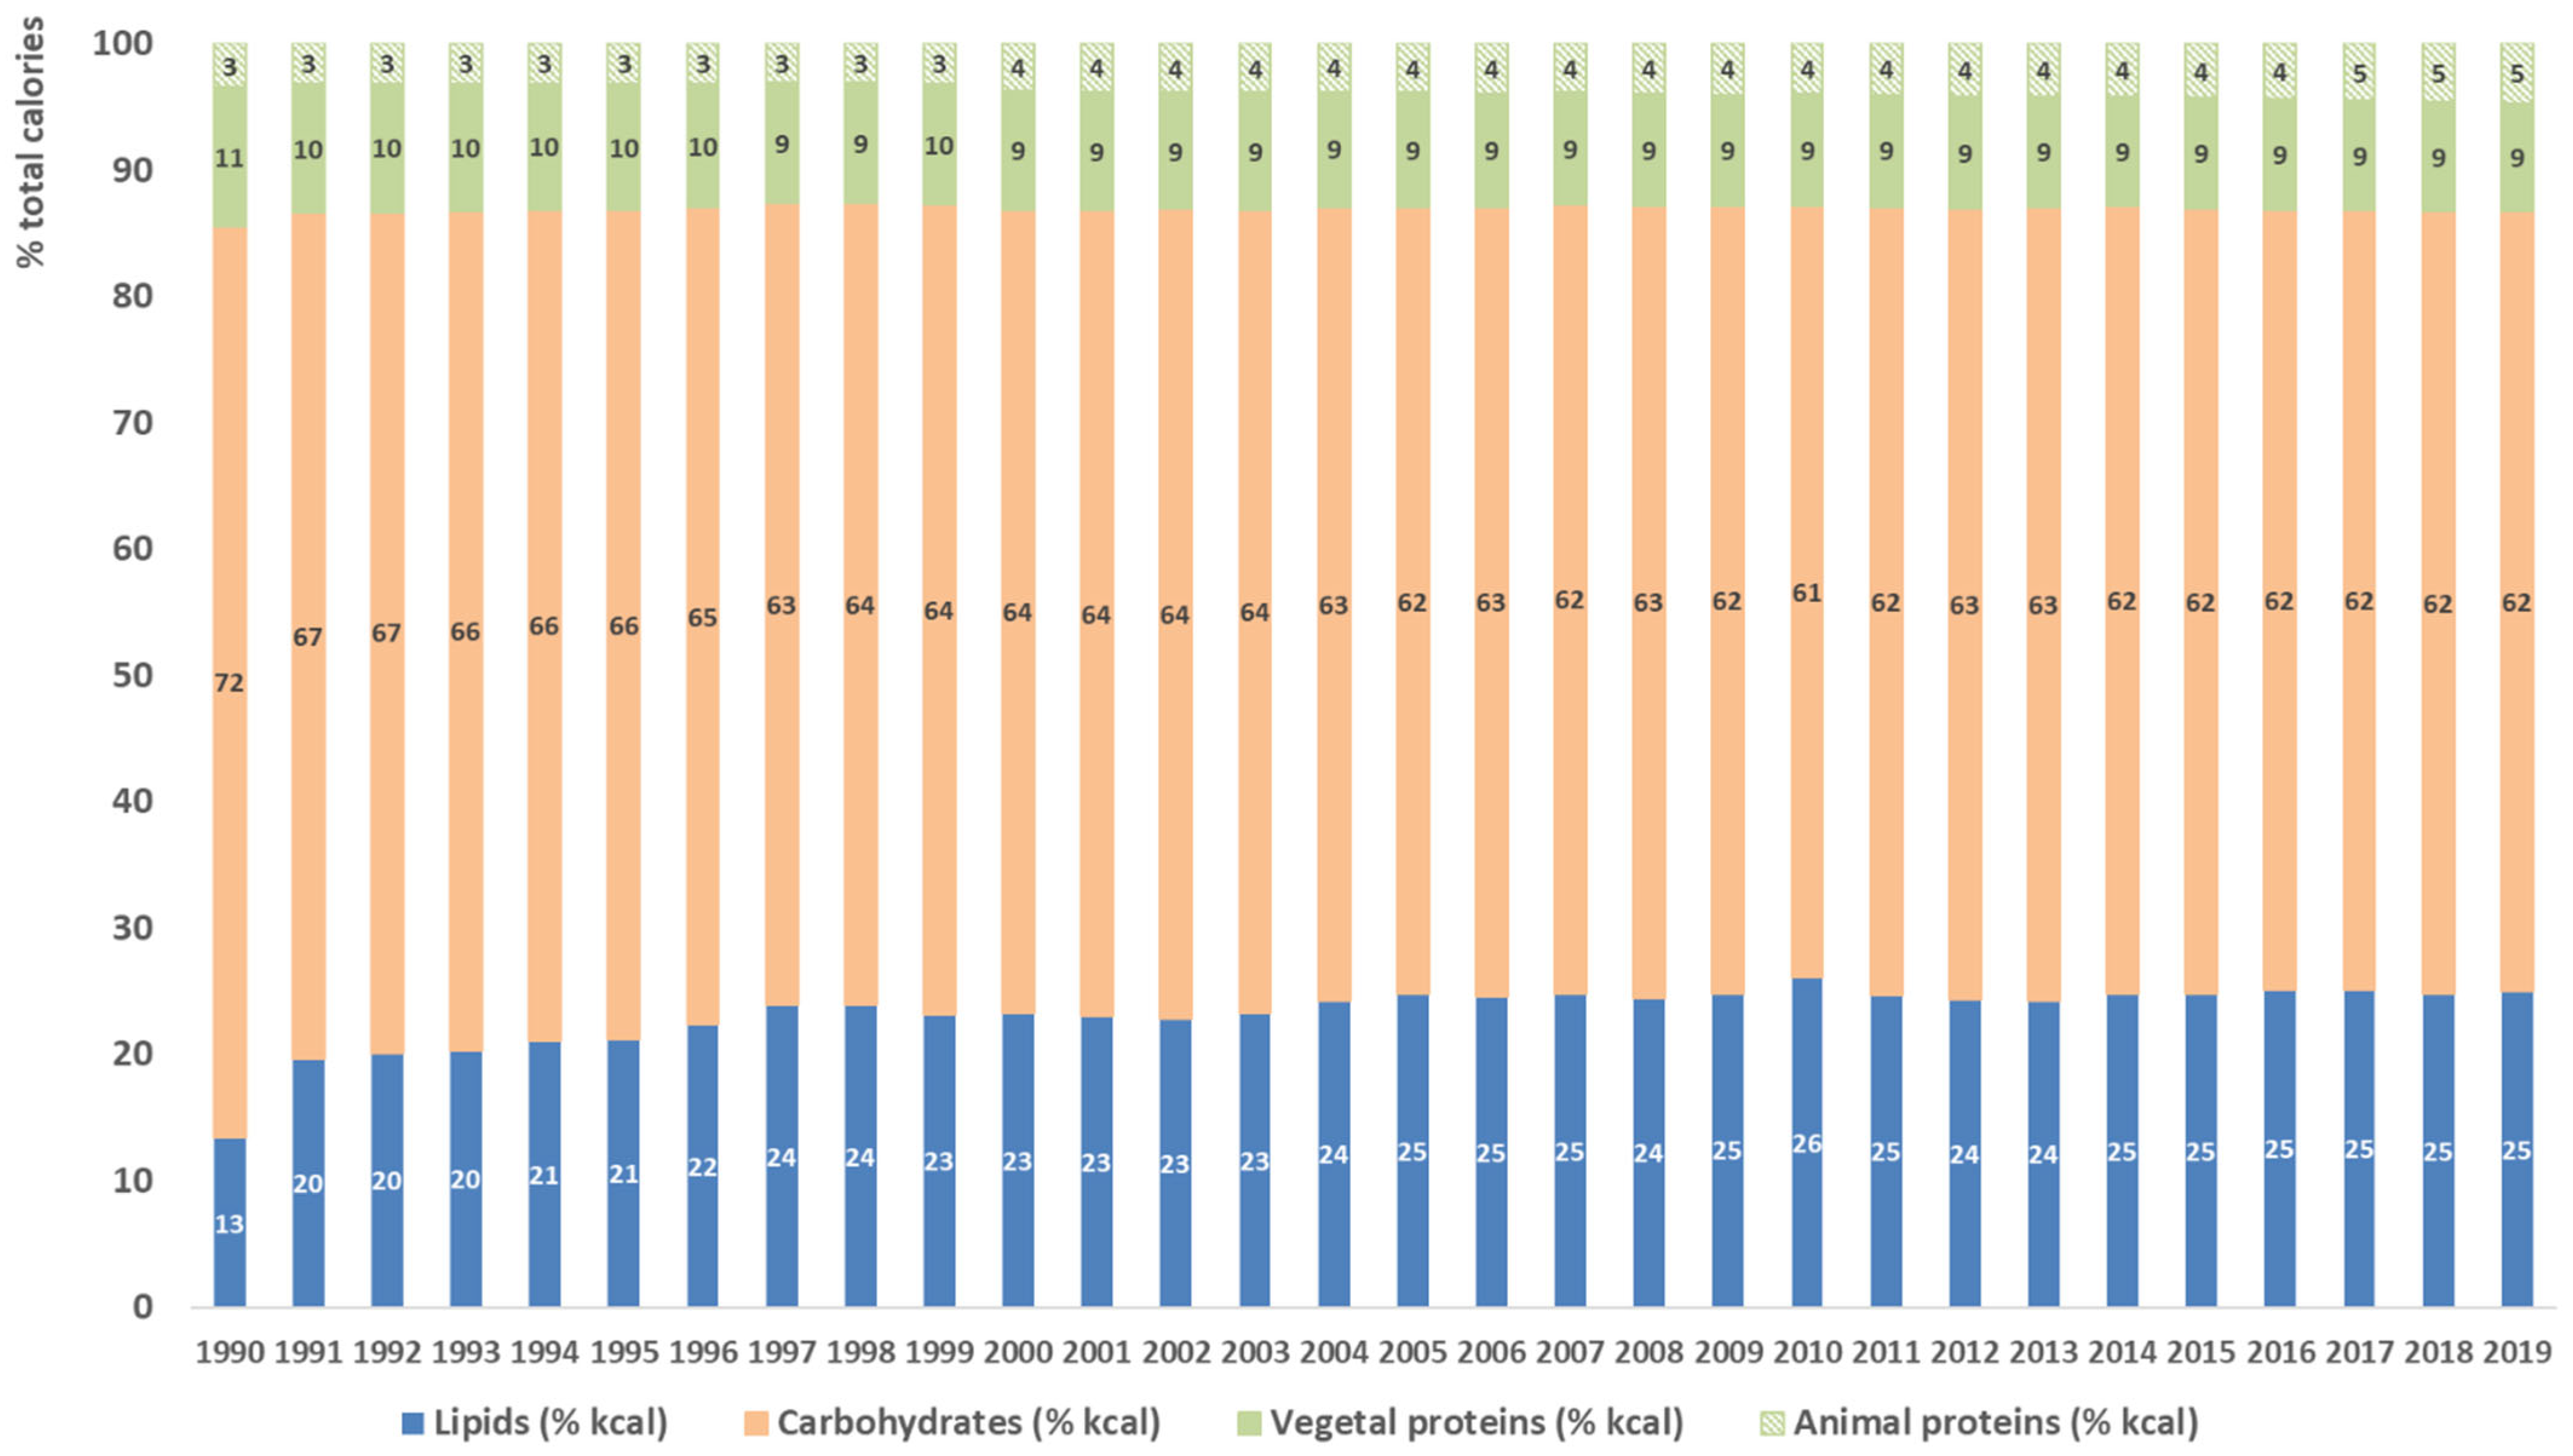
These changes in calorie shares by food groups expressed in the evolution of macronutrient calorie shares from 1990–2019 are as follows: calories from lipids almost doubled from 13 to 25%, while calories from carbohydrates decreased from 72 to 62%, and protein calories slightly decreased from 14.4 to 13.3% but remained stable between 1991 and 2019 at approximately 13% (Figure 3). Regarding calories from protein, vegetal protein calories decreased by 2.4%, while animal protein calories increased by 1.3% (Figure 3).

3.2. The Varied Metric: Adequacy according to the RDA

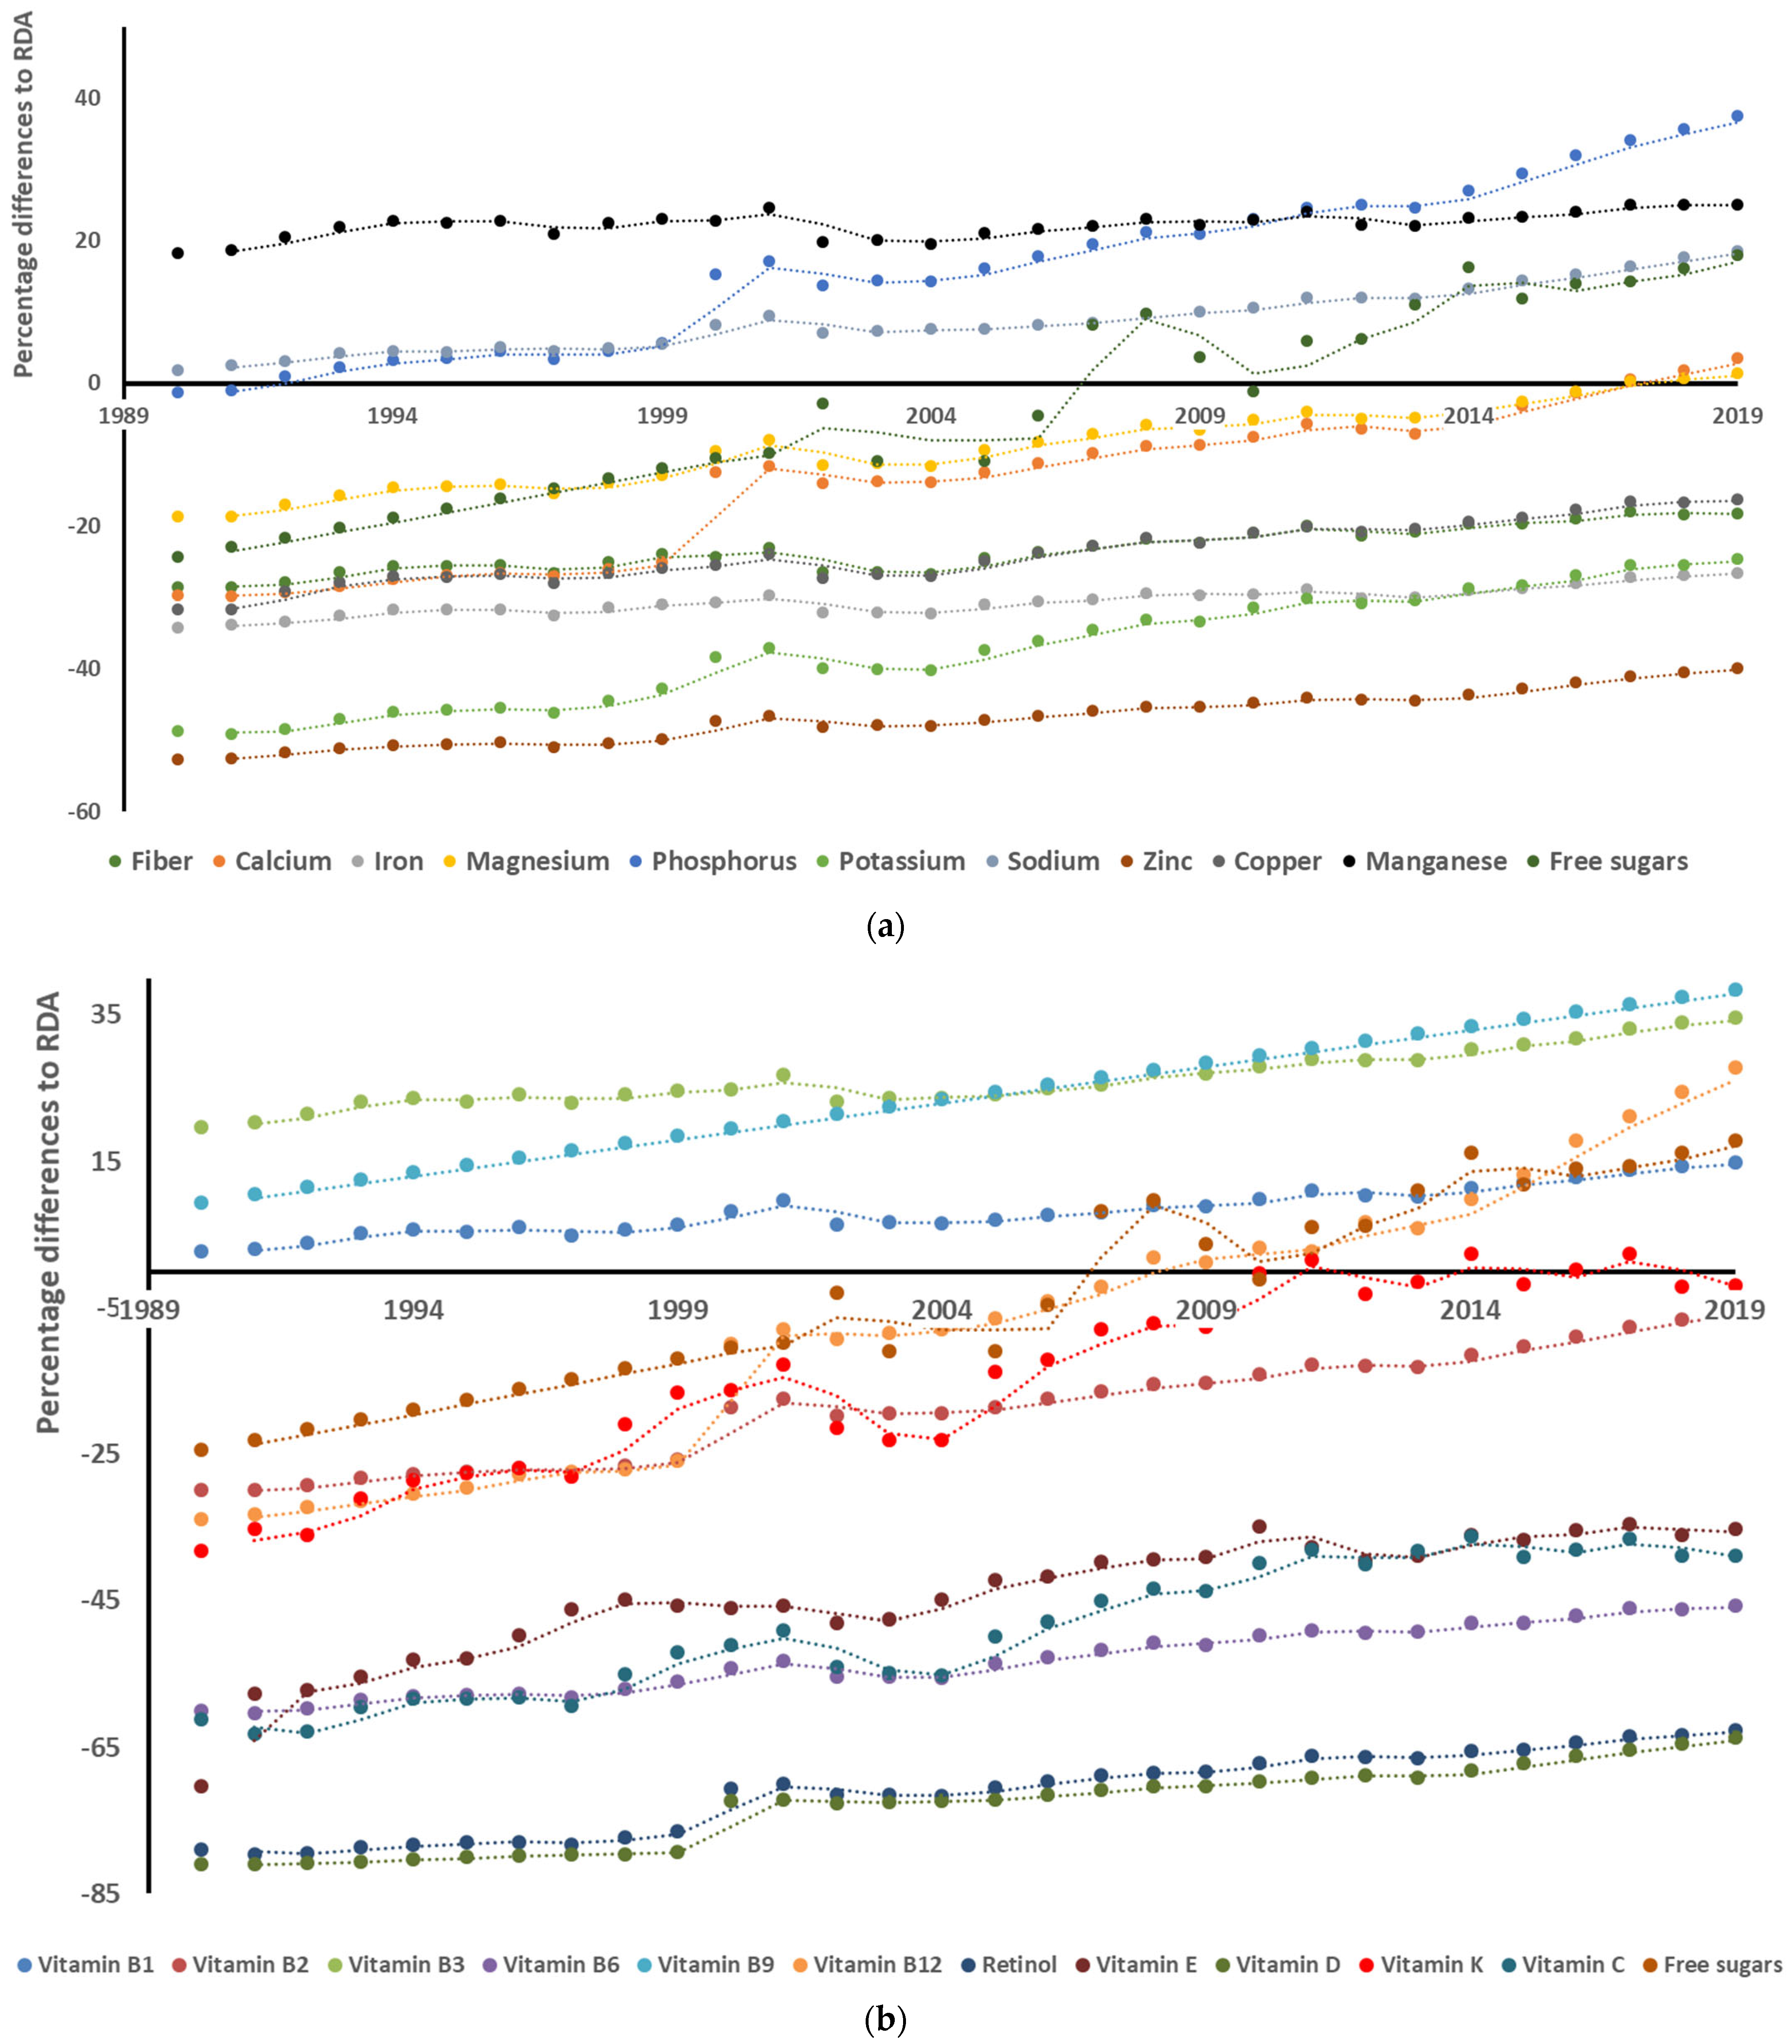
In 1990, there were significant deficiencies in fiber, calcium, iron, magnesium, potassium, zinc and copper, as indicated by negative percentage differences to the RDA. Still, adequate intake according to the RDA improved for fiber and all minerals and trace elements between 1990 and 2019 (Figure 4a). However, in 2019, fiber, iron, magnesium, potassium, zinc, and copper were still below the RDA. In 2007, free sugar consumption exceeded 10% of the total calorie intake and reached +18% in 2019 (Figure 4a).
Concerning the twelve vitamins, important deficiencies were observed in 1990 for all vitamins (from −30% to −81% RDA, as indicated by negative percentage differences to the RDA) except for vitamin B1 (thiamine), vitamin B3 (niacin), and vitamin B9 (folates) (Figure 4b). From 1990 to 2019, adequacy according to the RDA improved for all vitamins, but the consumption of vitamin B6 (pyridoxine, −46% RDA), vitamin A (retinol, −63% RDA)), vitamin E (−35% RDA), vitamin D (−64% RDA) and vitamin C (−39% RDA) remained insufficient in 2019 (Figure 4b).
Therefore, despite an improvement in the adequacy to RDA (Figure 4) and also in the diversity of the different consumed food groups (Table 2), the Varied metric remains insufficiently addressed.

3.3. Chronic Disease Prevalence and Mortality Rates versus Real and Vegetal Metrics

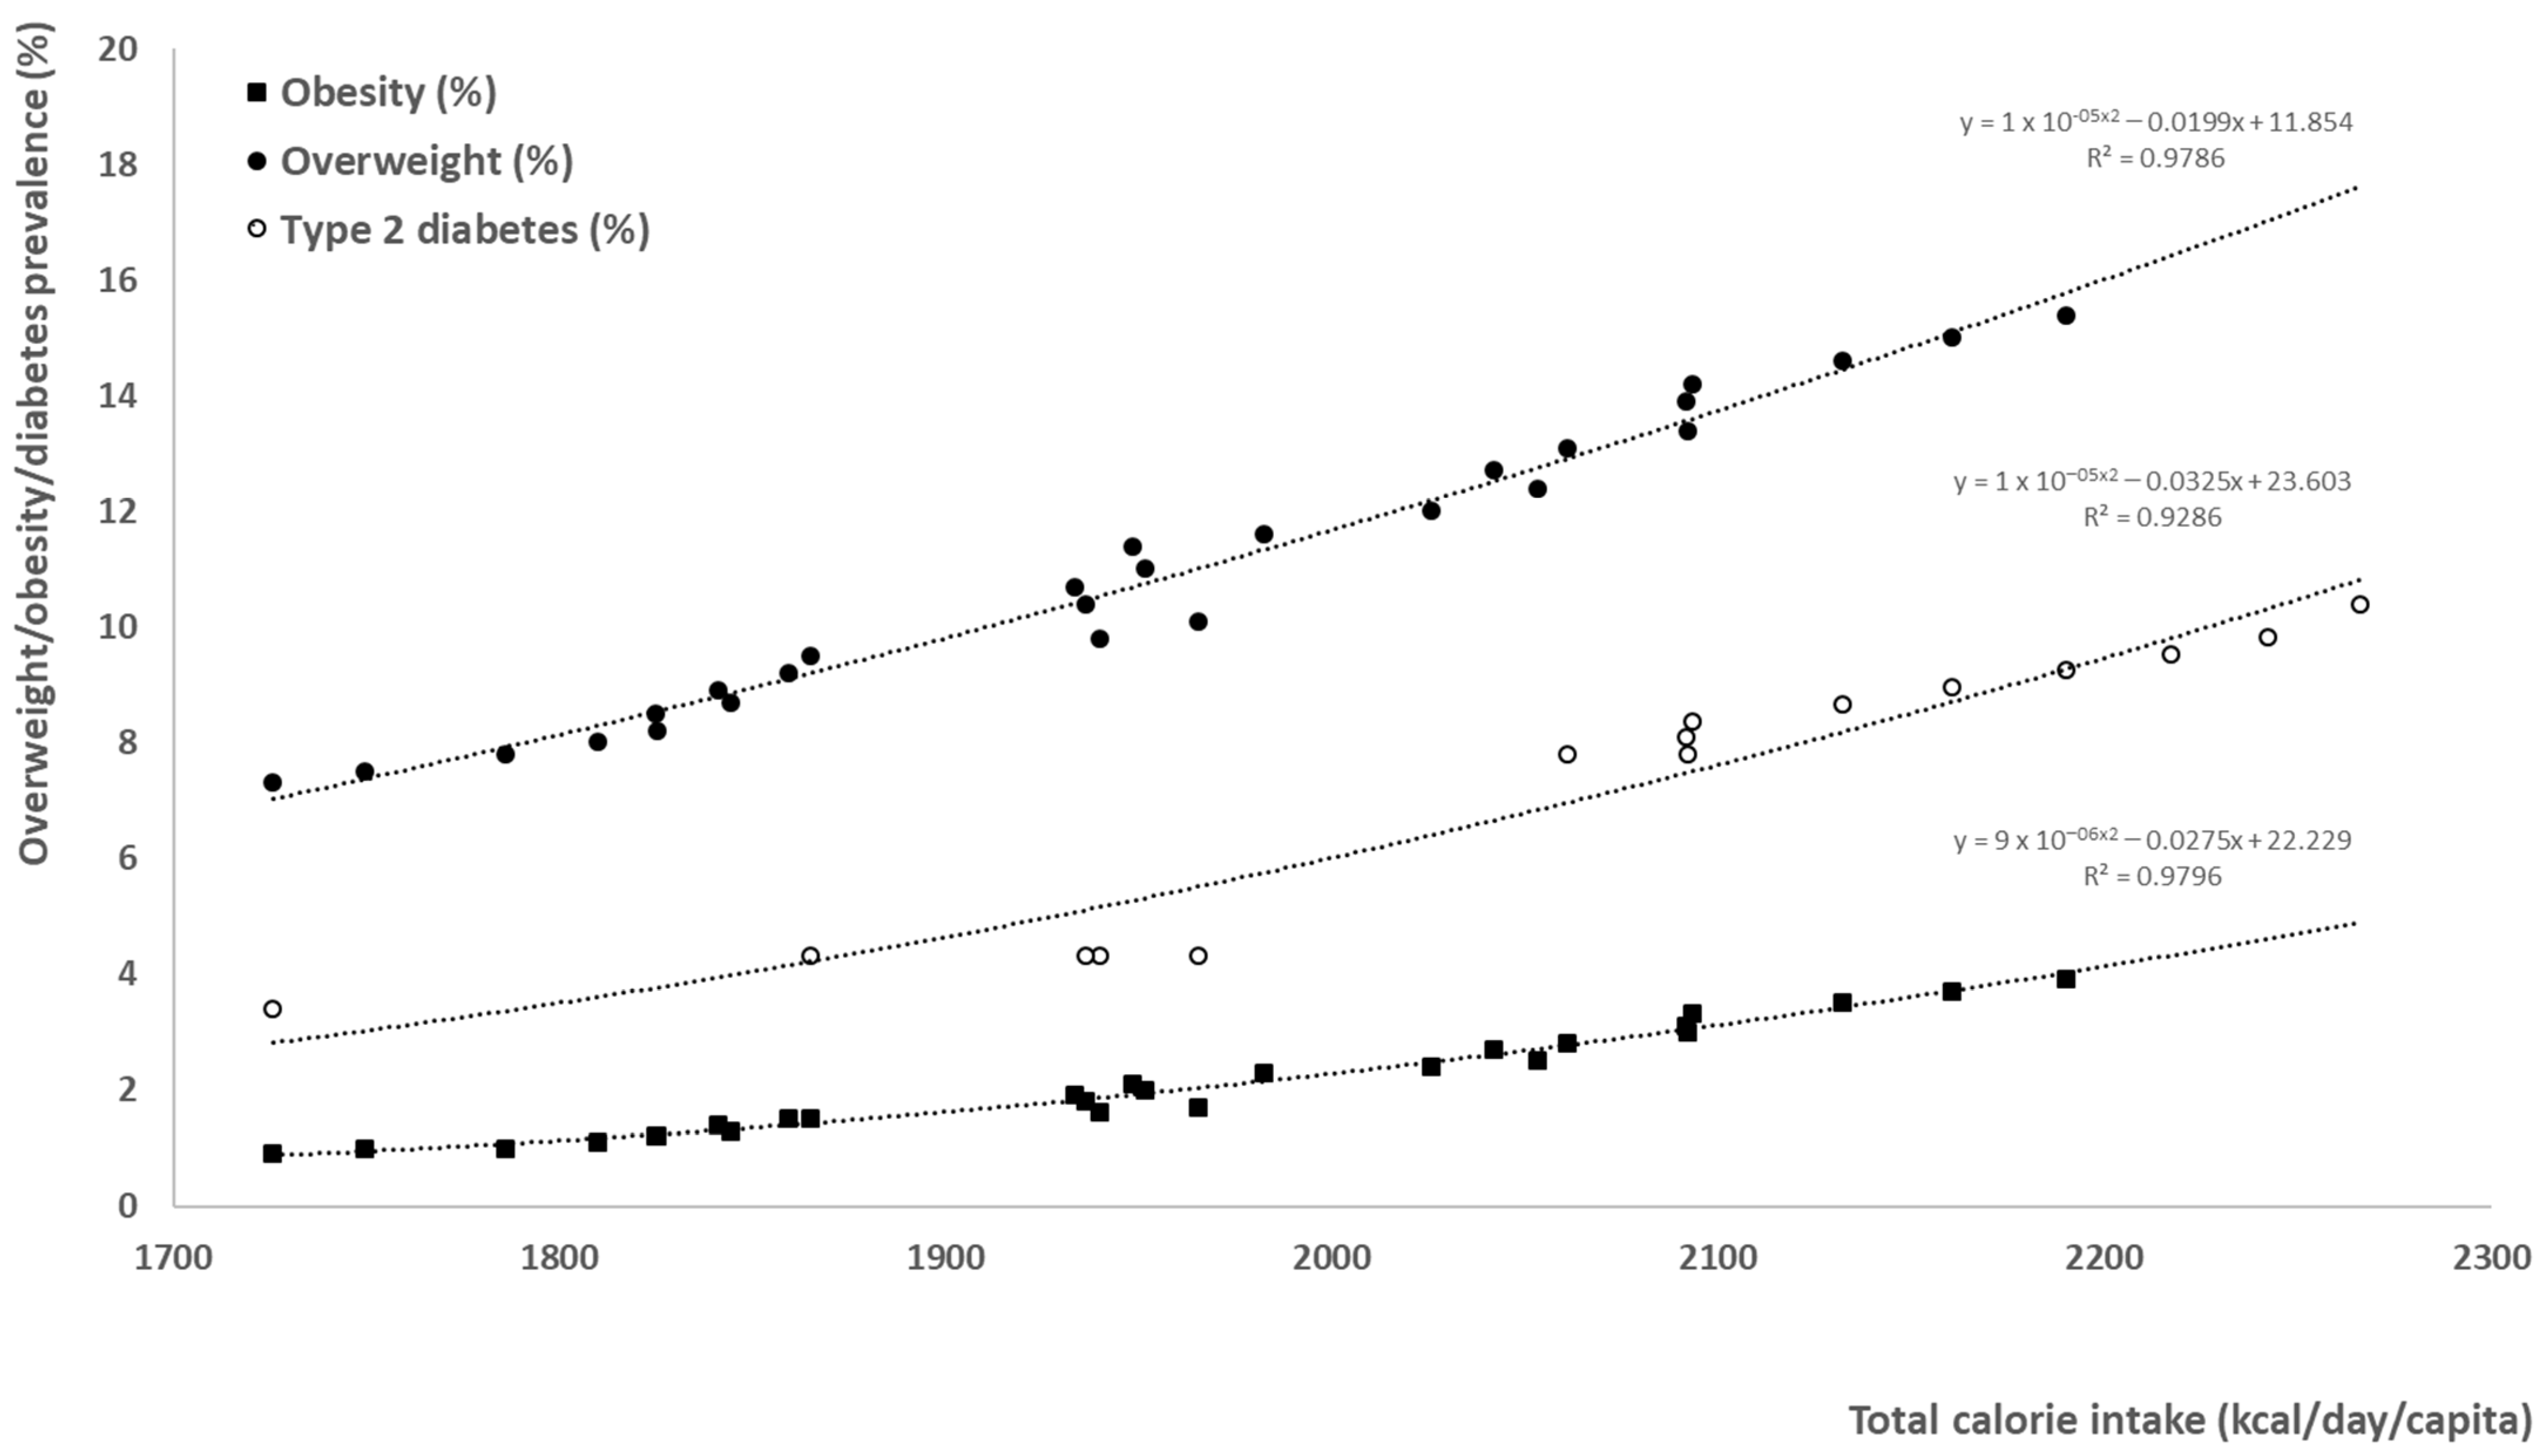
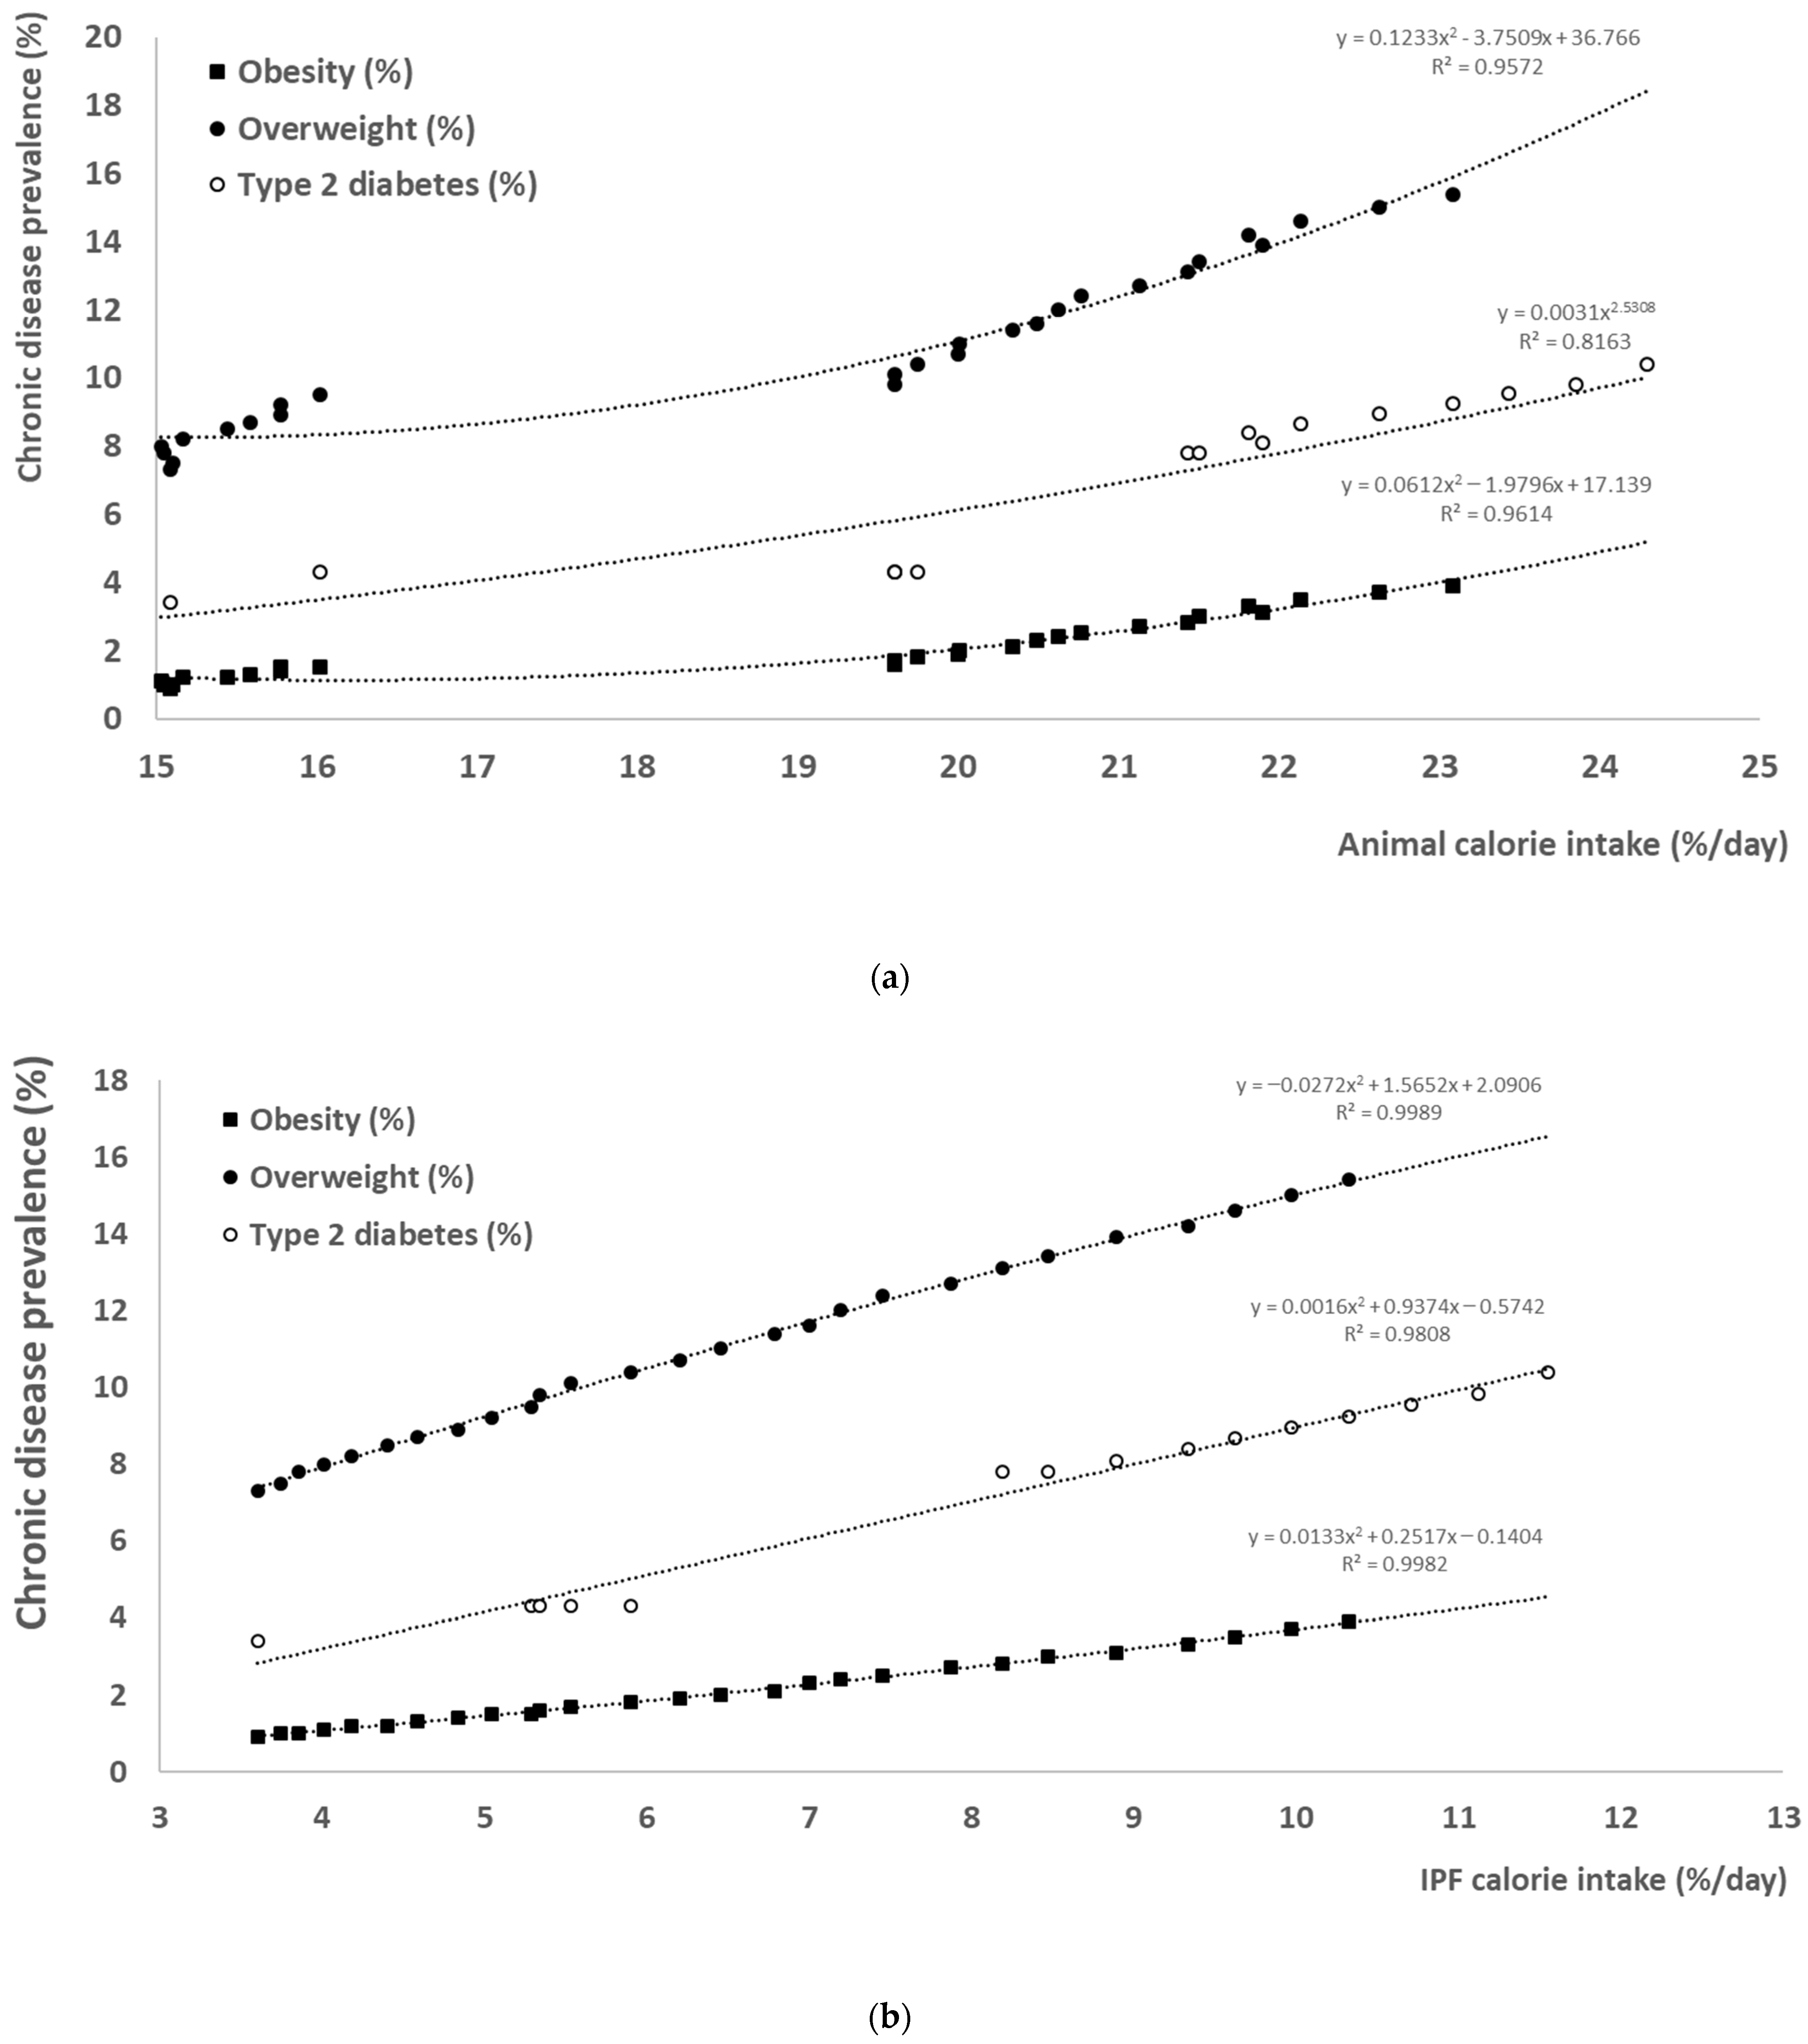
During the 1990–2019 period, overweight, obesity, and type 2 diabetes prevalence increased from 7.3 to 15.4%, from 0.9 to 3.9%, and from 3.4 to 12.7%, respectively (Figure 5).
Except for type 2 diabetes prevalence, which was positively correlated with animal food calorie intake according to a power curve (R2 = 0.82, Figure 6a), these increases were all significantly and positively correlated with total (Figure 5), animal food (Figure 6a), and IPF (Figure 6b) calorie intake according to polynomial curves (R2 > 0.92).
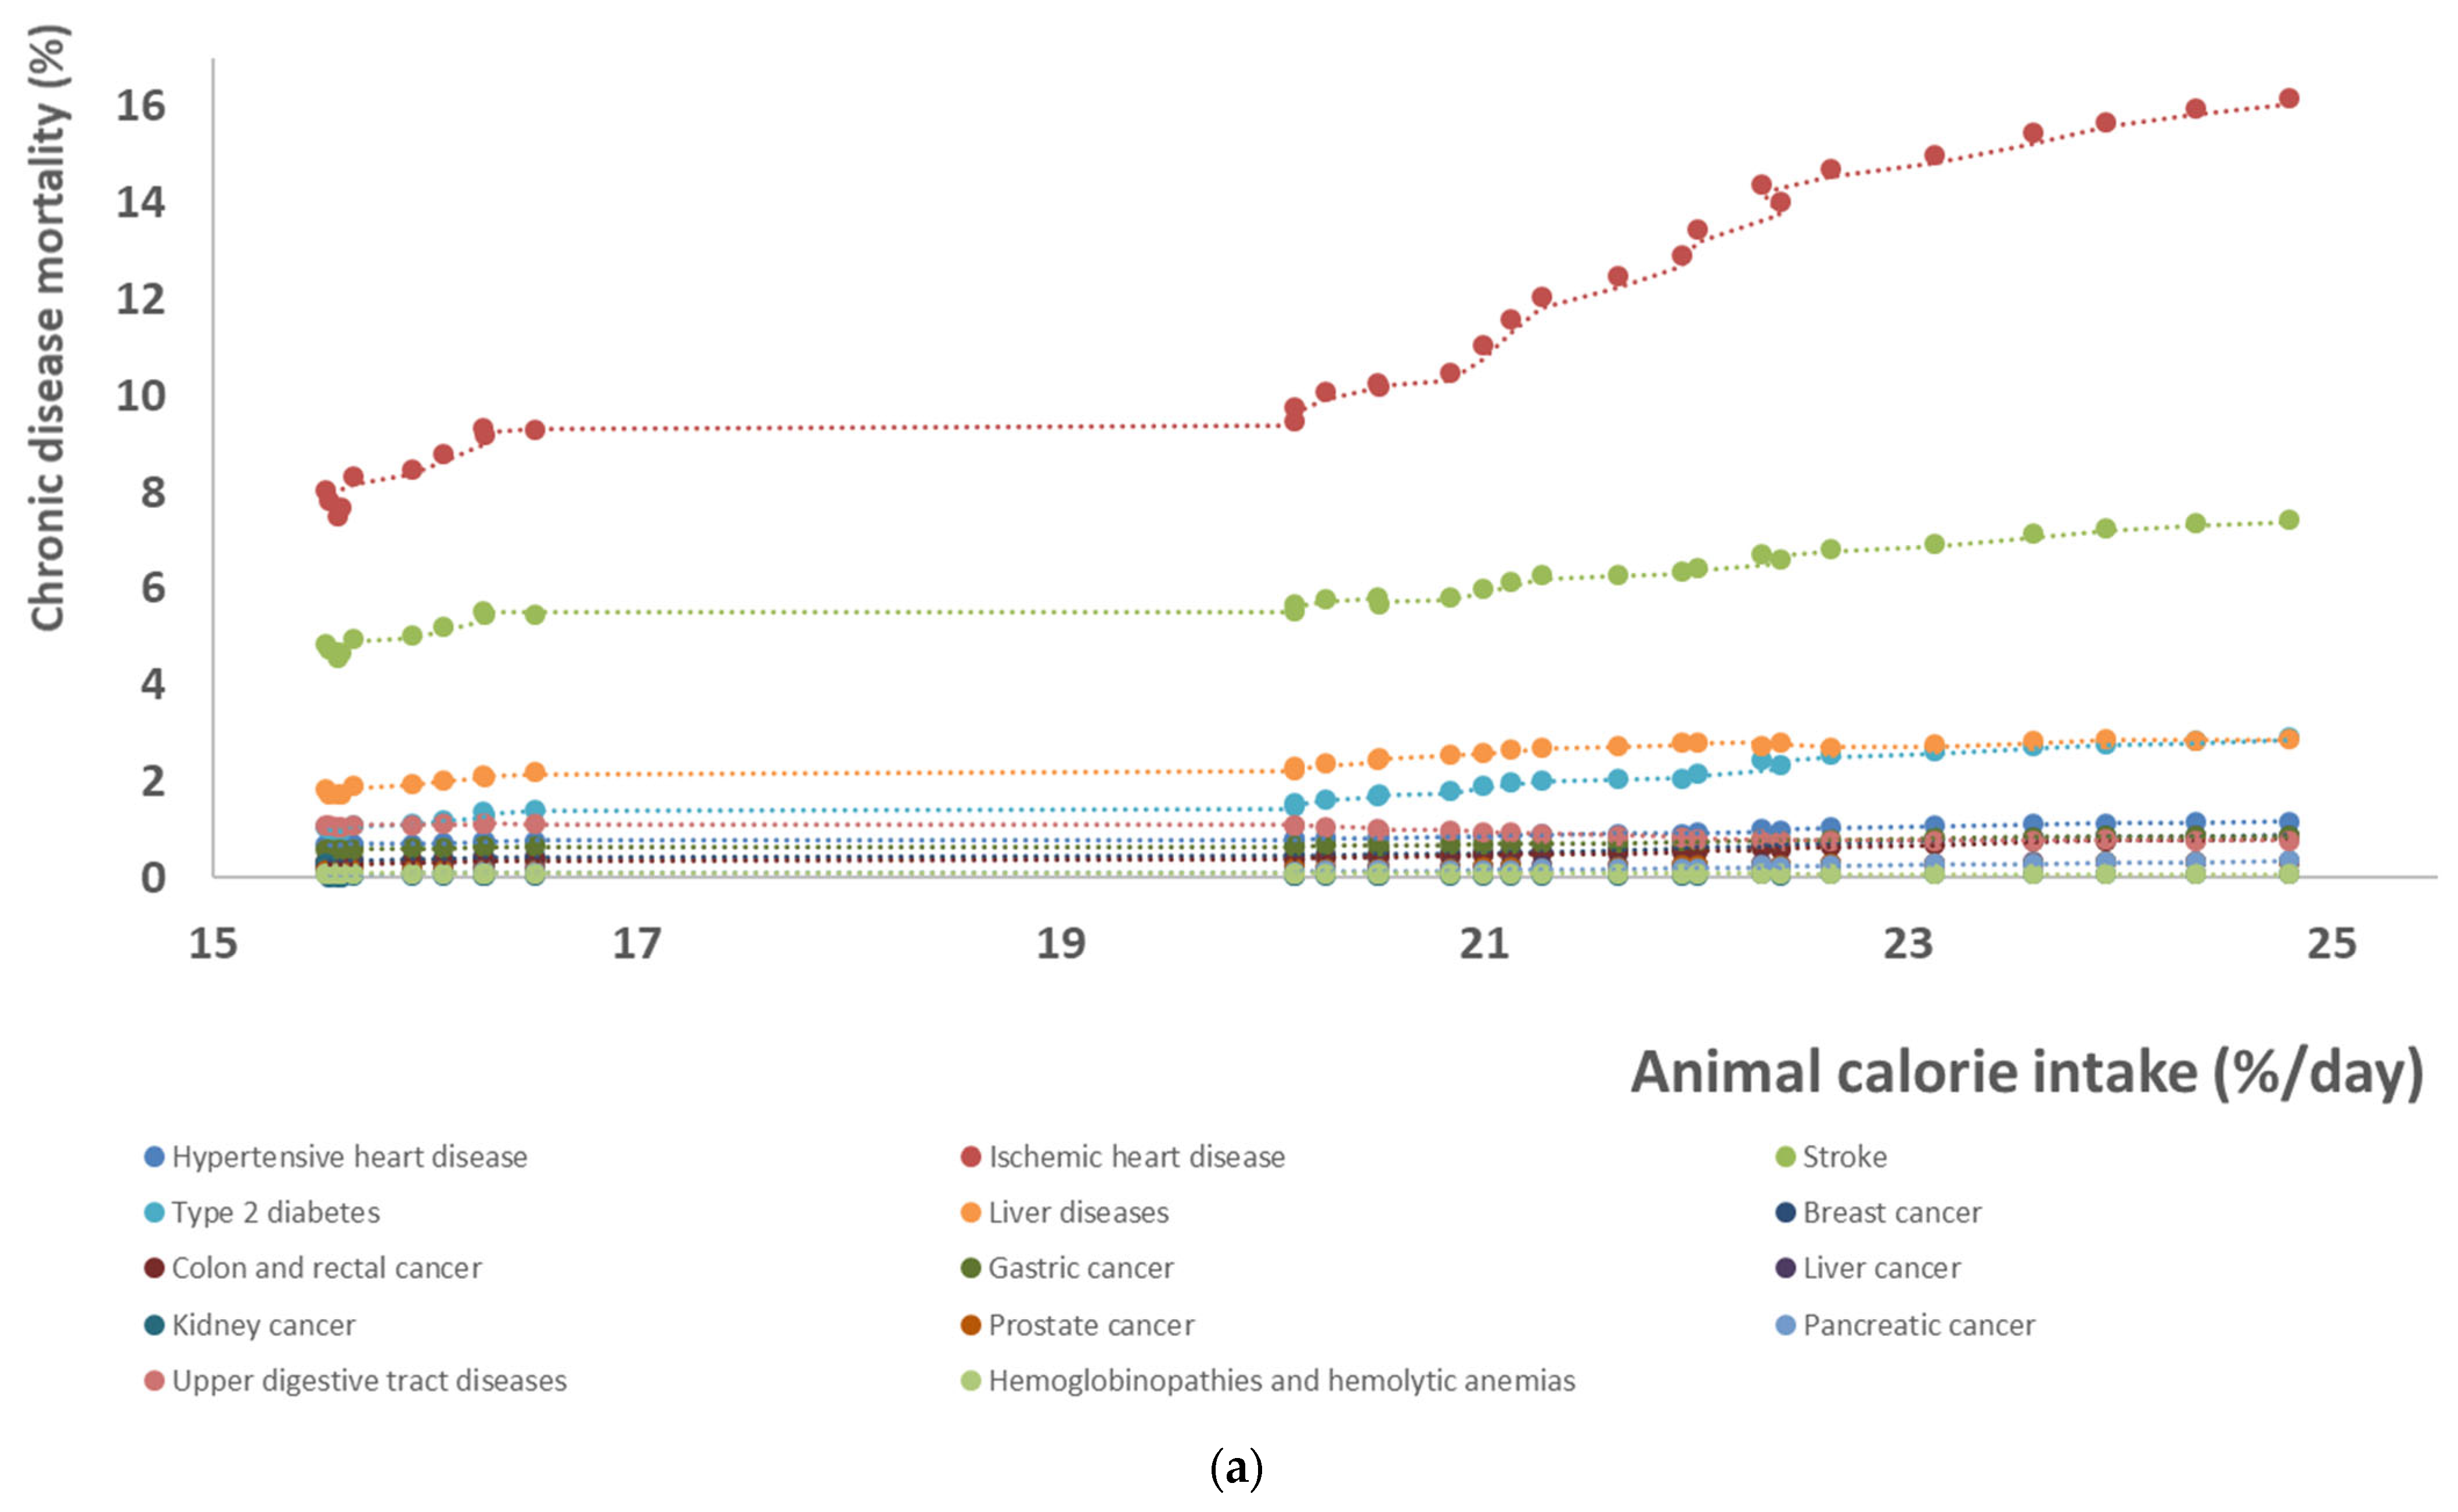
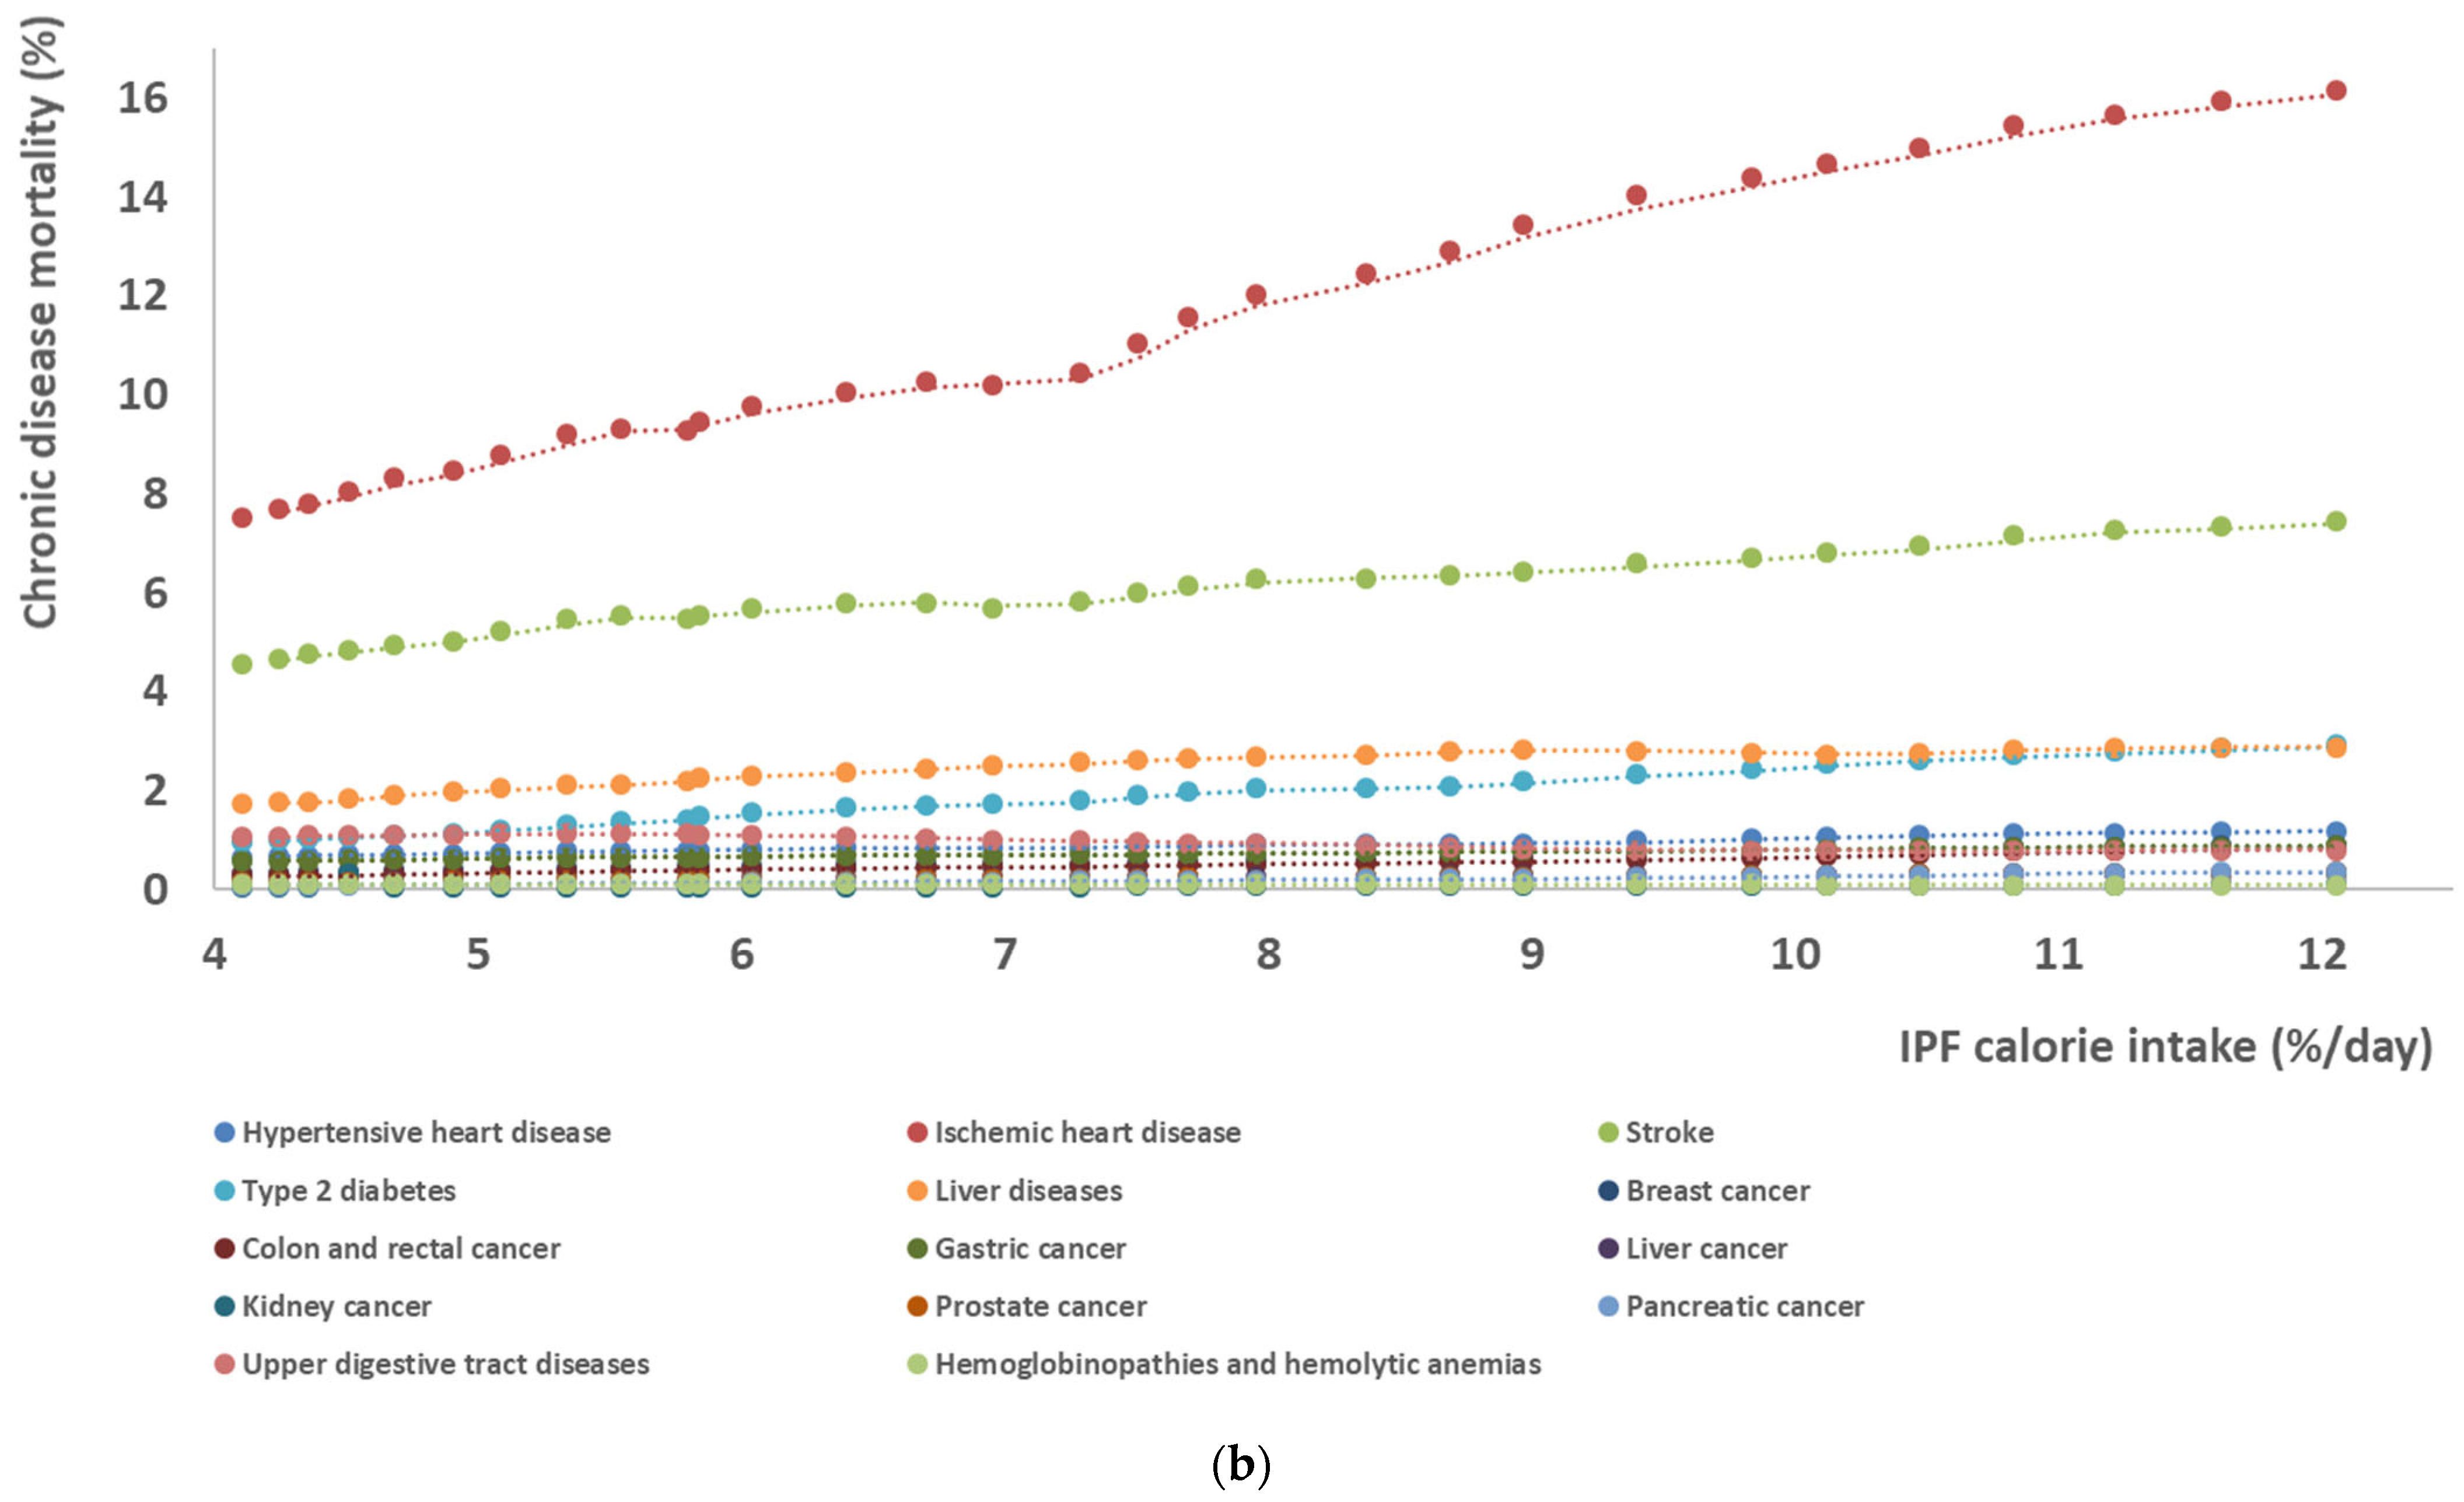
Except for mortalities due to upper digestive tract diseases, haemoglobinopathy and hemolytic anemia, all other mortality rates increased during the 1990–2019 period (Figure 7a,b). Mortality rates of ischemic heart disease, type 2 diabetes and total cancers more than doubled during this period, and mortality rates for hypertensive heart disease, stroke and liver diseases increased approximately 1.6–1.8 fold (Figure 7a,b). Overall, cardiovascular disease mortality increased from 12.7 to 24.8%. More specifically, type 2 diabetes, liver diseases, obesity, stroke and ischemic heart disease mortality increased with increases in animal food (Figure 7a) and IPF (Figure 7b) calorie intake.

4. Discussion

4.1. Data from Web Databases versus Published Data

The bases of calculations for the Real and Vegetal metrics are the total, food group, animal, and IPF calorie intake. Therefore, first, it is essential to compare and discuss our data about calorie intake with those already published by sources other than web databases, e.g., Indian national food surveys:
Despite some differences in absolute consumed calorie values (kcal/day/capita), the relative increase in total calorie intake, with a slight decrease between 2001 and 2005, is quite overall in agreement with previous data. Notably, declining calorie consumption was noted in India between 1983 and 2005, whereas real expenditures and incomes increased [46,47,48,49,50,51]. This has been called the “calorie consumption puzzle” [47,48,50]. For Duh and Spears, “Several explanations have been offered for this puzzling phenomenon, including movements in relative prices, impoverishment of a large section of rural India, diversification of food consumption, decline in calorie needs and a squeeze of the food budget.” [48]. Eli and Li proposed another explanation that may be complementary to the previous: “When caloric needs vary substantially, lower caloric intake can actually correspond to an increase in welfare as it frees up resources for higher food quality and non-food expenditures” [50]. A slight decrease in calorie intake of approximately 1.5% was also observed based on National Sample Survey Office data between 1993–1994 and 2011–2012 (from 2109 to 2076 kcal/day) [52], of −4.5% between 1993–1994 and 2011–2012, i.e., from approximately 2200 to 2100 kcal/day [53], and to similar extent by others [54,55], while we observed a slight decrease of approximately −0.9% only between 2001 and 2005, with an average intake of 2092 kcal/day in 2011–2012. However, for Smith, “the measured calorie decline is incomplete collection of data on food consumed away from peoples’ homes, which is widespread and rapidly increasing”, suggesting a possible increase calorie intake due to more IPFs purchased outside home [56] that accounted for India’s “missing” calories [57].
In the Indian national food survey based on the 2016 Urban Survey and the 2012 Rural survey, an average of 2000 kcal/day was reported considering both rural and urban areas, with a protein/lipid/carbohydrate caloric ratio of approximately 13/20/67 [45]. In our study, we found an increase from 2092 to 2190 kcal/day from 2012 to 2016, and an average ratio of 13/25/62, i.e., with a 5% increase in calorie intake from lipids, which is similar to the National Sample Survey Office data showing approximately 11/21/69 in 2011–2012 and a 5% increase in calorie intake from lipids from 1993–1994 [52,58]. In our study, protein consumption remained stable and that of lipids regularly increased to the detriment of carbohydrates, as previously observed [51], mainly due to increased consumption of dairy, oils, fats, and IPFs. Regarding protein types, animal protein intake increased from 13.8 to 22.0 g/day in our study (i.e., +37.3%), whereas a 29.2% increase was reported in another study, i.e., from 8.6 to 12.1 g/day [59]. The discrepancy is mainly due to the higher dairy intake in our study [35].
Concerning calorie consumption by food group, our results in 2011–2012 are overall in good agreement with those reported by the National Sample Survey Organization (NSSO) of India in 2011–2012 [60], with 51.6 and 52.5% of calories obtained from cereals, 8.7 and 10.5% of calories obtained from IPFs, 0.8 and 1.0% of calories obtained from nuts and seeds, 3.1 and 4.0% of calories obtained from vegetables, and ≤ 1% of calories obtained from fish/seafood, eggs and meats. The decreases in cereal calorie intake (−13%) and the increase in fruit (+105%), vegetable (+47%) and milk (+91%) calorie intakes from 1990–2016 in our study were also previously observed (i.e., −9%, +112%, +86% and +70%, respectively), with no significant evolution in meat calorie intake in either analysis [49]. Finally, the increase in sugar consumption from 146 to 213 kcal/day between 1990 and 2018 agrees with that previously reported between 1990 and 2018 of 180 to 230 kcal/day, which also included other sweeteners [49].
More generally, our results support the previous conclusions that the overall Indian diet has shifted away from high consumption of cereals to a higher consumption of dairy, IPFs and added sugars, but “progress on micronutrient-rich food groups such as fruits, vegetables, meat, and egg has been worryingly slow” [61]. The projected Indian diet in 2025–2026 might follow these tendencies with higher intakes of fruits, vegetables, dairy products, and sugar and stable intakes of cereals, pulses and meats [62].
Therefore, our results obtained from web databases are in rather good agreement with previously published data from Indian national surveys, supporting our calculations for evaluating the IPF and animal calorie shares (%).

4.2. Caloric Intake, Overweight/Obesity and Type 2 Diabetes Prevalence

Daily total caloric intake in India has increased by approximately 31% in thirty years but remained below the recommended intake of 2420 kcal/day for moderate activity in 2019 [34]. However, overweight/obesity and type 2 diabetes prevalence and cardiovascular disease mortality continue to increase, especially the prevalence of diabetes, which reached 10% in 2019. Obesity prevalence remains relatively low (3.9% in 2016) compared with other emerging countries, such as Brazil (20.1% in 2016) [63] and China (6.2% in 2016) [28]. Therefore, explanations for this increased prevalence must include factors other than solely increased total calorie intake. We therefore propose to find these explanations in the level of adequacy—or not—to the 3V index.

4.3. Adequacy according to the 3Vs Index

4.3.1. Metric 1: Minimum of 85% of Calories from Real Foods

The IPF calorie share increased from 3.6% in 1990 to 11.6% in 2019. Limited data are available for India concerning UPF consumption. The only human study was carried out in 1,030 adolescents in Delhi and reported a mean energy intake from UPFs of 16.2% [64]. Other data were based on sales in 2013 and 2019 and amount to approximately 6.7 kg/capita [65] and 11.7 kg/capita [14], respectively, i.e., approximately 51 and 89 kcal/day, corresponding to only 2.4 and 3.9% of total calories in 2013 and 2019, respectively. However, the UPF compounding annual growth rate is among the highest worldwide and is estimated to be near 10% between 2009 and 2019 [14]. In addition, it has been recently shown that urban households spend more on IPFs and consume more food away from home than rural households [66]. Therefore, the growing rate of urbanization in India might lead to still higher intakes of IPFs—and consequently UPFs—in the near future, with approximately 34% of Indian people living in urban areas in 2019 [49,67].
However, IPF intake appears too low to have contributed, even if partly, to the regular increases in overweight, obesity, and type 2 diabetes prevalence. Instead, this may be partly explained by the high level of cereal consumption, generally refined cereals such as white rice and breads, together with a regular increase in added sugar intake. Indeed, in India, rice may constitute up to 76% of all consumed cereals [68]. For better shelf life, unrefined cereals were progressively replaced by highly refined cereals, notably beginning in the 1980s [69]. A significant increase of 17% in type 2 diabetes prevalence was previously reported during the period 1984–2003 among US adults consuming refined rice (i.e., ≥5 servings/week versus <1 serving/month) [68]. Conversely, with the consumption of brown rice, the risk was significantly decreased by 11% (i.e., ≥2 servings/week versus <1 serving/month) [70]. In 2012, a similar conclusion was reached with a 55% higher risk of developing type 2 diabetes in the highest category of white rice intake than in the lowest category in Asian populations [71]. Consequently, it has been suggested to replace “refined grains, such as polished white rice, with brown/minimally polished rice as measures to reduce the risk of type 2 diabetes/CVD epidemic in India” [72].
Beyond the increase in IPF consumption and the high level of white rice and sugar intake, the parallel increase in physical inactivity in the Indian population, as a result of rapid urbanization and globalization, may also partly contribute to the increased prevalence of overweight and type 2 diabetes [58]; in 2016, on average 16 and 46% of Indians had a low-intensity physical activity and were not working, respectively [73].

4.3.2. Metric 2: 85% of Calories from Plants

The animal calorie share increased from 15.1 to 24.3% between 1990 and 2019 but to a lesser extent than in China, i.e., from 9.5 to 30.0% [28]. This increase in India is mainly due to greater consumption of dairy products (+5% calorie share) and animal-based IPFs (+3.6%) but not meats. The increase from 235 to 368 animal kcal/day between 1990 and 2010 (+57%) was different from that previously reported, i.e., from approximately 150 to 220 between 1990 and 2010 (+47%) [49]. The difference between the two sources was mainly due to the data supplied by OECD.Stats used in this study [35], which reported a higher consumption of milk and added the consumption of fresh dairy products (mainly yogurts and other fermented milks) that was not mentioned in national Indian surveys. Notably, Indians regularly consume several traditional dairy-based recipes, e.g., ghee (clarified butter), raitas (yogurt salads with vegetables or fruits), desserts (e.g., milk rice with spices), pastries (khoya, a paste of condensed milk), tchaï (tea with milk), milk coffee with spices, lassi (a traditional yogurt drink), buttermilk and rose milk [74].
As for IPFs, increases in animal calories are also significantly associated with increases in overweight, obesity and type 2 diabetes prevalence. However, because the increase in animal calories was primarily attributed to dairy products rather than red and processed meat, this association should not be interpreted as implying that dairy is to blame. Dairy products are generally not linked to obesity [75], type 2 diabetes [76], or cardiovascular diseases [77], with yoghurt and other fermented milks even being shown to be potentially protective [78]. These concomitant changes are therefore probably only fortuitous.

4.3.3. Metric 3: Variety of Real Foods

While adequacy according to the RDA improved between 1990 and 2019, numerous micronutrient deficiencies were observed in 2019, primarily for vitamin B6, retinol, vitamin E, vitamin C, iron, copper and zinc. For vitamin D, the apparent deficiency is observed worldwide because sun exposure through solar ultraviolet radiation is not considered, only food intakes [79,80]. Additionally, deficiencies in iron (anemia), retinol, vitamin C and zinc have often been reported in India, together with niche deficiencies in specific populations, such as copper in pregnant women and adult tribal populations [34,81,82]. Vitamin B6 deficiency is also more localized [83]. However, previously reported deficiencies in vitamin B12 and folate [83] were not observed in our study. Concerning vitamin E, the Expert Group of Indian Council of Medical Research concluded in 2020 that “no relevant studies in apparently healthy individuals could be identified by systematic search of studies on vitamin E and K intake in Indians using PubMed search engine” [34].

4.4. Limitations of the Study

The first limitation of our study is its ecological design using data from web databases. These platforms sometimes provide total and food group calorie intakes somewhat different from those reported by national Indian surveys. The main observed differences were that data from web databases indicate higher dairy consumption and lower cereal consumption. This suggests that data from web databases do not reflect exactly the same level of consumption by food group as Indian surveys or other epidemiological studies carried out in the field, sometimes in specific populations, and based on food frequency questionnaires. At this point, one cannot conclude which data are the most robust and should be preferred. However, the relative results and tendencies of the evolution of food group calorie shares are quite similar between both data sources.
Another limitation is that because of the ecological nature of this study, there may be differences in dietary patterns between Indian regions [73,84] or even ethnic groups based on religious beliefs and/or traditional culinary habits; obviously, data from web databases do not allow for exploration of these differences. However, the variability between North, Central, Northeast, South, West and East India is not so large concerning food group contribution to calorie intake, especially in rural regions (with more variability in urban regions) [73].

5. Conclusions

This study is the first to relate the consumption of IPF and animal calories to the evolution of chronic disease prevalence and mortality during the 1990–2019 period in India and suggesting that calorie quality appears to matter more than calorie quantity or nutrient intakes to explain these current evolutions. As regards to the 3V rule, it also shows that the overall Indian dietary pattern is slowly, progressively and potentially moving away from healthiness and sustainability.
Indeed, the improvement in RDA adequacy do not appear to prevent increases in the prevalence of overweight/obesity and type 2 diabetes or increased mortality from cardiovascular diseases, showing that this nutritional metric is insufficient to prevent chronic diseases, as observed in China [28]. The types of evolution observed in the present study and related to animal and IPF calories, strongly suggest that intakes of these foods will likely continue to increase and that the Indian population will progressively move away from the Real and Vegetal metrics, while improving the Varied metric. As a result, obesity [85], type 2 diabetes [86], and hepatic steatosis (commonly known as “soda” or “junk food” disease) [87] are expected to continue to rise, and the Indian dietary pattern will shift away from healthiness and sustainability. To approach the 3V index, the Indian dietary pattern observed in 2019 should therefore improve in regard to the Varied rule while stopping the increase in animal-based food and IPF calorie intakes, especially UPF intake (notably, in Asia, the UPF sale growth rate is among the highest worldwide, i.e., >100% [64]), replacing refined cereals with wholegrain [88] and limiting sugar consumption. The overall Indian dietary pattern is therefore undoubtedly at a crossroads.
As perspectives, the 3V index appears as a holistic and straightforward indicator to evaluate the evolution of the whole quality of a defined dietary pattern, whatever the country considered. Concerning India, it indicates that only improving the adequacy to the nutrient needs (RDA) is insufficient to stay healthy and to prevent chronic diseases. Consequently, the 3V index also appears as a relevant conceptual framework to develop protective diets according to regional or country agronomic characteristics.

Author Contributions

Conceptualization, A.F. and E.R.; methodology, A.F. and K.A.; software, A.F.; validation, A.F., K.A., H.S. and E.R.; formal analysis, A.F.; investigation, A.F. and K.A.; resources, A.F.; data curation, A.F. and K.A.; writing—original draft preparation, A.F.; writing—review and editing, A.F., K.A., H.S. and E.R.; supervision, A.F. and E.R.; project administration, A.F. and E.R.; funding acquisition, A.F. and E.R. All authors have read and agreed to the published version of the manuscript.

Funding

This research was funded by the INRAE/Cirad’s GloFoodS (“Transitions for World Food Security”) metaprogram.

Institutional Review Board Statement

Not applicable.

Informed Consent Statement

Not applicable.

Data Availability Statement

All crude data that support the findings of this study are available from the cited web databases (i.e., OECD.Stats (https://stats.oecd.org/ (accessed on 12 July 2021)), Our World in Data (https://ourworldindata.org/ (accessed on 12 July 2021)), FAOSTAT (https://www.fao.org/faostat/fr/ (accessed on 12 July 2021)), Helgi Library (https://www.helgilibrary.com/ (accessed on 12 July 2021)) and Commodities Control (http://www.commoditiescontrol.com/ (accessed on 12 July 2021))) and the Indian Food Composition Table (see the Methods section). The intermediary calculated data are available from the corresponding author in an Excel file, [A.F.], upon reasonable request.

Acknowledgments

Prathap K. Shetty from Pondicherry University (Department of Food Science and Technology, India) is greatly acknowledged for supplying the most recent Indian food composition data and sharing with us reports related to Indian nutrition transition and specific Indian recommended dietary intakes. The INRAE/Cirad’s GloFoodS (“Transitions for World Food Security”) metaprogram is also acknowledged for funding the study.

Conflicts of Interest

The authors declare no conflict of interest.

References

  1. Afshin, A.; Sur, P.J.; Fay, K.A.; Cornaby, L.; Ferrara, G.; Salama, J.S.; Mullany, E.C.; Abate, K.H.; Abbafati, C.; Abebe, Z.; et al. Health effects of dietary risks in 195 countries, 1990–2017: A systematic analysis for the Global Burden of Disease Study 2017. Lancet 2019, 393, 1958–1972. [Google Scholar] [CrossRef] [Green Version]
  2. Popkin, B.M.; Corvalan, C.; Grummer-Strawn, L.M. Dynamics of the double burden of malnutrition and the changing nutrition reality. Lancet 2020, 395, 65–74. [Google Scholar] [CrossRef]
  3. Patel, V.; Chatterji, S.; Chisholm, D.; Ebrahim, S.; Gopalakrishna, G.; Mathers, C.; Mohan, V.; Prabhakaran, D.; Ravindran, R.D.; Reddy, K.S. Chronic diseases and injuries in India. Lancet 2011, 377, 413–428. [Google Scholar] [CrossRef]
  4. Popkin, B.M.; Ng, S.W. The nutrition transition to a stage of high obesity and noncommunicable disease prevalence dominated by ultra-processed foods is not inevitable. Obes. Rev. 2021, 395, 65–74. [Google Scholar] [CrossRef] [PubMed]
  5. Johnston, J.L.; Fanzo, J.; Cogill, B. Understanding Sustainable Diets: A Descriptive Analysis of the Determinants and Processes That Influence Diets and Their Impact on Health, Food Security, and Environmental Sustainability. Adv. Nutr. Int. Rev. J. 2014, 5, 418–429. [Google Scholar] [CrossRef] [Green Version]
  6. Willett, W.; Rockström, J.; Loken, B.; Springmann, M.; Lang, T.; Vermeulen, S.; Garnett, T.; Tilman, D.; DeClerck, F.; Wood, A.; et al. Murray, Food in the Anthropocene: The EAT–Lancet Commission on healthy diets from sustainable food systems. Lancet 2019, 393, 447–492. [Google Scholar] [CrossRef]
  7. Fardet, A.; Rock, E. Ultra-Processed Foods and Food System Sustainability: What are the Links? Sustainability 2020, 12, 6280. [Google Scholar] [CrossRef]
  8. HLPE/FAO. Rapport du Groupe d’experts de haut niveau sur la sécurité alimentaire et la nutrition du Comité de la sécurité alimentaire mondiale. In Sécurité Alimentaire et Nutrition: Enoncé d’une Vision Globale à L’horizon 2030; HLPE/FAO: Rome, Italy, 2021. [Google Scholar]
  9. Crippa, M.; Solazzo, E.; Guizzardi, D.; Monforti-Ferrario, F.; Tubiello, F.N.; Leip, A. Food systems are responsible for a third of global anthropogenic GHG emissions. Nat. Food 2021, 2, 198–209. [Google Scholar] [CrossRef]
  10. Knorr, D.; Augustin, M.A.; Tiwari, B. Advancing the Role of Food Processing for Improved Integration in Sustainable Food Chains. Front. Nutr. 2020, 7, 34. [Google Scholar] [CrossRef] [Green Version]
  11. Lane, M.M.; Davis, J.A.; Beattie, S.; Gómez-Donoso, C.; Loughman, A.; O’Neil, A.; Jacka, F.; Berk, M.; Page, R.; Marx, W.; et al. Ultraprocessed Food and Chronic Noncommunicable Diseases: A Systematic Review and Meta-Analysis of 43 Observational Studies. Obes. Rev. 2021, 22, e13146. [Google Scholar] [CrossRef]
  12. Tilman, D.; Clark, M. Global diets link environmental sustainability and human health. Nature 2014, 515, 518–522. [Google Scholar] [CrossRef] [PubMed]
  13. FAO. The State of Food Security and Nutrition in the World 2020; FAO: Rome, Italy, 2020. [Google Scholar]
  14. Baker, P.; Machado, P.; Santos, T.; Sievert, K.; Backholer, K.; Hadjikakou, M.; Russell, C.; Huse, O.; Bell, C.; Scrinis, G.; et al. Ultra-processed foods and the nutrition transition: Global, regional and national trends, food systems transformations and political economy drivers. Obes. Rev. 2020, 21, e13126. [Google Scholar] [CrossRef] [PubMed]
  15. Monteiro, C.A.; Lawrence, M.; Millett, C.; Nestle, M.; Popkin, B.M.; Scrinis, G.; Swinburn, B. The need to reshape global food processing: A call to the United Nations Food Systems Summit. BMJ Glob. Health 2021, 6, e006885. [Google Scholar] [CrossRef] [PubMed]
  16. da Silva, J.T.; Garzillo, J.M.F.; Rauber, F.; Kluczkovski, A.; Rivera, X.S.; da Cruz, G.L.; Frankowska, A.; Martins, C.A.; Louzada, M.L.D.C.; Monteiro, C.A.; et al. Greenhouse gas emissions, water footprint, and ecological footprint of food purchases according to their degree of processing in Brazilian metropolitan areas: A time-series study from 1987 to 2018. Lancet Planet. Health 2021, 5, e775–e785. [Google Scholar] [CrossRef]
  17. Garzillo, J.M.F.; Poli, V.F.S.; Leite, F.H.M.; Steele, E.M.; Machado, P.P.; Louzada, M.L.D.C.; Levy, R.B.; Monteiro, C.A. Ultra-processed food intake and diet carbon and water footprints: A national study in Brazil. Rev. Saude Publica 2022, 56, 6. [Google Scholar] [CrossRef]
  18. FAO. The State of the World’s Biodiversity for Food and Agriculture; FAO: Rome, Italy, 2019. [Google Scholar]
  19. Fardet, A.; Rock, E. How to protect both health and food system sustainability? A holistic ‘global health’-based approach via the 3V rule proposal. Public Health Nutr. 2020, 23, 3028–3044. [Google Scholar] [CrossRef]
  20. de Gavelle, E.; Leroy, P.; Perrimon, M.; Huneau, J.-F.; Sirot, V.; Orset, C.; Fouillet, H.; Soler, L.-G.; Mariotti, F. Modeled gradual changes in protein intake to increase nutrient adequacy lead to greater sustainability when systematically targeting an increase in the share of plant protein. Clim. Chang. 2019, 161, 129–149. [Google Scholar] [CrossRef]
  21. Fardet, A.; Lebredonchel, L.; Rock, E. Empirico-inductive and/or hypothetico-deductive methods in food science and nutrition research: Which one to favor for a better global health? Crit. Rev. Food Sci. Nutr. 2021, 1–14. [Google Scholar] [CrossRef]
  22. Gehring, J.; Touvier, M.; Baudry, J.; Julia, C.; Buscail, C.; Srour, B.; Hercberg, S.; Péneau, S.; Kesse-Guyot, E.; Allès, B. Consumption of Ultra-Processed Foods by Pesco-Vegetarians, Vegetarians, and Vegans: Associations with Duration and Age at Diet Initiation. J. Nutr. 2020, 151, 120–131. [Google Scholar] [CrossRef]
  23. Davidou, S.; Frank, K.; Christodoulou, A.; Fardet, A. Organic food retailing: To what extent are foods processed and do they contain markers of ultra-processing? Int. J. Food Sci. Nutr. 2021, 73, 172–183. [Google Scholar] [CrossRef]
  24. Fardet, A.; Rock, E. Chronic diseases are first associated with the degradation and artificialization of food matrices rather than with food composition: Calorie quality matters more than calorie quantity. Eur. J. Nutr. 2022, 61, 2239–2253. [Google Scholar] [CrossRef] [PubMed]
  25. Satija, A.; Bhupathiraju, S.N.; Spiegelman, D.; Chiuve, S.E.; Manson, J.E.; Willett, W.; Rexrode, K.M.; Rimm, E.B.; Hu, F.B. Healthful and Unhealthful Plant-Based Diets and the Risk of Coronary Heart Disease in U.S. Adults. J. Am. Coll. Cardiol. 2017, 70, 411–422. [Google Scholar] [CrossRef] [PubMed]
  26. Hall, K.D.; Ayuketah, A.; Brychta, R.; Cai, H.; Cassimatis, T.; Chen, K.Y.; Chung, S.T.; Costa, E.; Courville, A.; Darcey, V.; et al. Ultra-Processed Diets Cause Excess Calorie Intake and Weight Gain: An Inpatient Randomized Controlled Trial of Ad Libitum Food Intake. Cell Metab. 2019, 30, 67–77.e3. [Google Scholar] [CrossRef] [PubMed] [Green Version]
  27. Pagliai, G.; Dinu, M.; Madarena, M.P.; Bonaccio, M.; Iacoviello, L.; Sofi, F. Consumption of ultra-processed foods and health status: A systematic review and meta-analysis. Br. J. Nutr. 2020, 125, 308–318. [Google Scholar] [CrossRef]
  28. Fardet, A.; Aubrun, K.; Rock, E. Nutrition transition and chronic diseases in China (1990–2019): Industrially processed and animal calories rather than nutrients and total calories as potential determinants of the health impact. Public Health Nutr. 2021, 24, 5561–5575. [Google Scholar] [CrossRef]
  29. Fardet, A.; Thivel, D.; Gerbaud, L.; Rock, E. A Sustainable and Global Health Perspective of the Dietary Pattern of French Population during the 1998–2015 Period from INCA Surveys. Sustainability 2021, 13, 7433. [Google Scholar] [CrossRef]
  30. Davidou, S.; Christodoulou, A.; Frank, K.; Fardet, A. A study of ultra-processing marker profiles in 22,028 packaged ultra-processed foods using the Siga classification. J. Food Compos. Anal. 2021, 99, 103848. [Google Scholar] [CrossRef]
  31. Fardet, A.; Desquilbet, M.; Rock, E. The compliance of French purchasing behaviors with a healthy and sustainable diet: A 1-yr follow-up of regular customers in hypermarkets. Renew. Agric. Food Syst. 2021, 37, 49–59. [Google Scholar] [CrossRef]
  32. Simões, B.D.S.; Barreto, S.M.; Molina, M.D.C.B.; Luft, V.C.; Duncan, B.B.; Schmidt, M.I.; Bensenõr, I.J.M.; Cardoso, L.D.O.; Levy, R.B.; Giatti, L. Consumption of ultra-processed foods and socioeconomic position: A cross-sectional analysis of the Brazilian Longitudinal Study of Adult Health (ELSA-Brasil). Cad. Saude Publica 2018, 34, e00019717. [Google Scholar] [CrossRef] [Green Version]
  33. Agrawal, S.; Millett, C.J.; Dhillon, P.K.; Subramanian, S.V.; Ebrahim, S. Type of vegetarian diet, obesity and diabetes in adult Indian population. Nutr. J. 2014, 13, 89. [Google Scholar] [CrossRef]
  34. ICMR-NIN Expert Group. Nutrient Requirements for Indians, Recommended Dietary Allowances (RDA) and Estimated Average Requirements (EAR); ICMR-National Institute of Nutrition: Hyderabad, India, 2020. [Google Scholar]
  35. OECD; FAO. OECD. Stat. 2019. Available online: http://stats.oecd.org/ (accessed on 12 July 2021).
  36. Roser, M.; Ritchie, H. Our World in Data—Food Supply. 2013. Available online: https://ourworldindata.org/ (accessed on 28 July 2021).
  37. FAO. FAOSTAT. 2020. Retrieved July, 2021. Available online: http://www.fao.org/faostat/fr/#home (accessed on 12 July 2021).
  38. Baker, P.; Friel, S. Processed foods and the nutrition transition: Evidence from Asia. Obes. Rev. 2014, 15, 564–577. [Google Scholar] [CrossRef] [PubMed] [Green Version]
  39. National Institute of Nutrition. Indian Food Composition Tables; National Institute of Nutrition: Hyderabad, India, 2017. [Google Scholar]
  40. The Lancet GBD. Global Burden of Disease. 2022. Available online: https://www.thelancet.com/gbd (accessed on 12 July 2021).
  41. Cole de Politique Appliquée, Faculté des Lettres et Sciences Humaines, Université de Sherbrooke. Perspective Monde. 2022. Available online: https://perspective.usherbrooke.ca/ (accessed on 12 July 2021).
  42. International Diabetes Federation. IDF Diabetes Atlas, 10th ed.; International Diabetes Federation: Brussels, Belgium, 2021. [Google Scholar]
  43. Sadikot, S.; Nigam, A.; Das, S.; Bajaj, S.; Zargar, A.; Prasannakumar, K.; Sosale, A.; Munichoodappa, C.; Seshiah, V.; Singh, S.; et al. The burden of diabetes and impaired glucose tolerance in India using the WHO 1999 criteria: Prevalence of diabetes in India study (PODIS). Diabetes Res. Clin. Pract. 2004, 66, 301–307. [Google Scholar] [CrossRef] [PubMed]
  44. Singh, P.K.; Singh, L.; Dubey, R.; Singh, S.; Mehrotra, R. Socioeconomic determinants of chronic health diseases among older Indian adults: A nationally representative cross-sectional multilevel study. BMJ Open 2019, 9, e028426. [Google Scholar] [CrossRef] [PubMed] [Green Version]
  45. Hemalatha, D.R.; Laxmaiah, D.A.; Sriswan, D.M.R.; Boiroju, D.N.K.; Radhakrishna, D.K.V. What India Eats; ICMR-National Institute of Nutrition: Hyderabad, India, 2016. [Google Scholar]
  46. Deaton, A.; Drèze, J. Food and Nutrition in India: Facts and Interpretations. Econ. Pol. Week. 2009, 44, 42–65. [Google Scholar]
  47. Basu, D.; Basole, A. The Calorie Consumption Puzzle in India: An Empirical Investigation; Economics Department Working Paper Series; University of Massachusetts-Amherst: Amherst, MA, USA, 2012; 36p. [Google Scholar]
  48. Duh, J.; Spears, D. Health and Hunger: Disease, Energy Needs, and The Indian Calorie Consumption Puzzle. Econ. J. 2017, 127, 2378–2409. [Google Scholar] [CrossRef] [Green Version]
  49. Yadav, K. The Dietary Trend in the World Particularly in China and India; Sanrachna; SGT University Center for Research Innovation: Haryana, India, 2020. [Google Scholar]
  50. Shari, E.; Nicholas, L. Can Caloric Needs Explain Three Food Consumption Puzzles? Evidence from India; University of Toronto: Toronto, ON, Canada, 2012. [Google Scholar]
  51. Sharma, S.; Sharma, P. Agricultural Production, Marketing and Food Security in India: A Peep into Progress. Productivity 2017, 58, 155–165. [Google Scholar]
  52. Siddiqui, Z.; Donato, R.; Jumrani, J. Looking Past the Indian Calorie Debate: What is Happening to Nutrition Transition in India. J. Dev. Stud. 2017, 55, 2440–2459. [Google Scholar] [CrossRef]
  53. Meenakshi, J.V. Trends and patterns in the triple burden of malnutrition in India. Agric. Econ. 2016, 47, 115–134. [Google Scholar] [CrossRef] [Green Version]
  54. Kolady, D.E.; Srivastava, S.K.; Just, D.; Singh, J. Food away from home and the reversal of the calorie intake decline in India. Food Secur. 2020, 13, 369–384. [Google Scholar] [CrossRef]
  55. Srivastava, S.; Chand, R. Tracking transition in calorie-intake among Indian households: Insights and policy implications. Agric. Econ. Res. Rev. 2017, 30, 23–35. [Google Scholar] [CrossRef]
  56. Smith, L.C. The great Indian calorie debate: Explaining rising undernourishment during India’s rapid economic growth. IDS Working Papers 2013, 2013, 1–35. [Google Scholar] [CrossRef]
  57. Nicholas, L.; Shari, E. Search of India’s Missing Calories: Energy Requirements and Calorie Consumption; U.C. Berkeley: Berkeley, CA, USA, 2010. [Google Scholar]
  58. Misra, A.; Singhal, N.; Sivakumar, B.; Bhagat, N.; Jaiswal, A.; Khurana, L. Nutrition transition in India: Secular trends in dietary intake and their relationship to diet-related non-communicable diseases. J. Diabetes 2011, 3, 278–292. [Google Scholar] [CrossRef] [PubMed]
  59. Zulauf, C. China, India, the Food Transition, and Future Demand Growth. In Farmdoc Daily; Department of Agricultural and Consumer Economics, University of Illinois at Urbana-Champaign: Champaign, IL, USA, 2015. [Google Scholar]
  60. Sharma, M.; Kishore, A.; Roy, D.; Joshi, K. A comparison of the Indian diet with the EAT-Lancet reference diet. BMC Public Health 2020, 20, 812. [Google Scholar] [CrossRef]
  61. Tak, M.; Shankar, B.; Kadiyala, S. Dietary Transition in India: Temporal and Regional Trends, 1993 to 2012. Food Nutr. Bull. 2019, 40, 254–270. [Google Scholar] [CrossRef] [PubMed]
  62. Alae-Carew, C.; Bird, F.A.; Choudhury, S.; Harris, F.; Aleksandrowicz, L.; Milner, J.; Joy, E.J.; Agrawal, S.; Dangour, A.D.; Green, R. Future diets in India: A systematic review of food consumption projection studies. Glob. Food Secur. 2019, 23, 182–190. [Google Scholar] [CrossRef] [PubMed]
  63. WHO. Diabetes Country Profiles; WHO: Rome, Italy, 2016. [Google Scholar]
  64. Jain, A.; Mathur, P. Intake of Ultra-processed Foods Among Adolescents From Low- and Middle-Income Families in Delhi. Indian Pediatr. 2020, 57, 712–714. [Google Scholar] [CrossRef]
  65. Pan American Health Organization. Ultra-Processed Food and Drink Products in Latin America: Trends, Impact on Obesity, Policy Implications; Pan American Health Organization: Washington, DC, USA, 2015. [Google Scholar]
  66. D’Amour, C.B.; Pandey, B.; Reba, M.; Ahmad, S.; Creutzig, F.; Seto, K. Urbanization, processed foods, and eating out in India. Glob. Food Secur. 2020, 25, 100361. [Google Scholar] [CrossRef]
  67. Law, C.; Green, R.; Kadiyala, S.; Shankar, B.; Knai, C.; Brown, K.; Dangour, A.D.; Cornelsen, L. Purchase trends of processed foods and beverages in urban India. Glob. Food Secur. 2019, 23, 191–204. [Google Scholar] [CrossRef]
  68. Radhika, G.; van Dam, R.M.; Sudha, V.; Ganesan, A.; Mohan, V. Refined grain consumption and the metabolic syndrome in urban Asian Indians (Chennai Urban Rural Epidemiology Study 57). Metabolism 2009, 58, 675–681. [Google Scholar] [CrossRef]
  69. Juliano, B.O. Rice in Human Nutrition; The International Rice Research Institute: Los Baños, Philippines, 1993. [Google Scholar]
  70. Sun, Q.; Spiegelman, D.; van Dam, R.M.; Holmes, M.D.; Malik, V.S.; Willett, W.C.; Hu, F.B. White Rice, Brown Rice, and Risk of Type 2 Diabetes in US Men and Women. Arch. Intern. Med. 2010, 170, 961–969. [Google Scholar] [CrossRef]
  71. Hu, E.A.; Pan, A.; Malik, V.; Sun, Q. White rice consumption and risk of type 2 diabetes: Meta-analysis and systematic review. BMJ 2012, 344, e1454. [Google Scholar] [CrossRef] [PubMed] [Green Version]
  72. Mohan, V.; Radhika, G.; Vijayalakshmi, P.; Sudha, V. Can the diabetes/cardiovascular disease epidemic in India be explained, at least in part, by excess refined grain (rice) intake? Indian J. Med. Res. 2010, 131, 369–372. [Google Scholar] [PubMed]
  73. Yadav, K. The Dietary Pattern, Nutritional Status, and Dual Burden of Malnutrition. Sanrachna; SGT University Center for Research Innovation: Haryana, India, 2020. [Google Scholar]
  74. Panjagari, N.R.; Singh, R.R.B.; Singh, A.K. Indian Traditional Fermented Dairy Products. In Traditional Foods: General and Consumer Aspects; Kristbergsson, K., Oliveira, J., Eds.; Springer: Berlin/Heidelberg, Germany, 2016; pp. 101–114. [Google Scholar]
  75. Mozaffarian, D. Dairy Foods, Obesity, and Metabolic Health: The Role of the Food Matrix Compared with Single Nutrients. Adv. Nutr. Int. Rev. J. 2019, 10, 917S–923S. [Google Scholar] [CrossRef]
  76. Guo, J.; Givens, D.I.; Astrup, A.; Bakker, S.J.L.; Goossens, G.H.; Kratz, M.; Marette, A.; Pijl, H.; Soedamah-Muthu, S.S. The Impact of Dairy Products in the Development of Type 2 Diabetes: Where Does the Evidence Stand in 2019? Adv. Nutr. Int. Rev. J. 2019, 10, 1066–1075. [Google Scholar] [CrossRef] [PubMed] [Green Version]
  77. Guo, J.; Astrup, A.; Lovegrove, J.A.; Gijsbers, L.; Givens, D.I.; Soedamah-Muthu, S.S. Milk and Dairy Consumption and Risk of Cardiovascular Diseases and All-Cause Mortality: Dose–Response Meta-Analysis of Prospective Cohort Studies. Eur. J. Epidemiol. 2017, 32, 269–287. [Google Scholar] [CrossRef] [Green Version]
  78. Salas-Salvadó, J.; Guasch-Ferré, M.; Díaz-López, A.; Babio, N. Yogurt and Diabetes: Overview of Recent Observational Studies. J. Nutr. 2017, 147, 1452S–1461S. [Google Scholar] [CrossRef] [Green Version]
  79. Bogh, M.K.; Schmedes, A.V.; Philipsen, P.A.; Thieden, E.; Wulf, H.C. Vitamin D production depends on ultraviolet-B dose but not on dose rate: A randomized controlled trial. Exp. Dermatol. 2010, 20, 14–18. [Google Scholar] [CrossRef]
  80. Rhodes, L.E.; Webb, A.R.; Fraser, H.; Kift, R.; Durkin, M.T.; Allan, D.; O’Brien, S.J.; Vail, A.; Berry, J.L. Recommended Summer Sunlight Exposure Levels Can Produce Sufficient (≥20ngml−1) but Not the Proposed Optimal (≥32ngml−1) 25(OH)D Levels at UK Latitudes. J. Investig. Dermatol. 2010, 130, 1411–1418. [Google Scholar] [CrossRef]
  81. Toteja, G.; Gonmei, Z. Micronutrient status of Indian population. Indian J. Med. Res. 2018, 148, 511–521. [Google Scholar] [CrossRef]
  82. Kapil, U.; Toteja, G.S.; Rao, S.; Pandey, R.M. Zinc deficiency amongst adolescents in Delhi. Indian Pediatr. 2011, 48, 981–982. [Google Scholar]
  83. Ritchie, H.; Reay, D.S.; Higgins, P. Quantifying, Projecting, and Addressing India’s Hidden Hunger. Front. Sustain. Food Syst. 2018, 2, 11. [Google Scholar] [CrossRef] [Green Version]
  84. Green, R.; Milner, J.; Joy, E.J.M.; Agrawal, S.; Dangour, A.D. Dietary patterns in India: A systematic review. Br. J. Nutr. 2016, 116, 142–148. [Google Scholar] [CrossRef] [PubMed] [Green Version]
  85. Luhar, S.; Timæus, I.M.; Jones, R.; Cunningham, S.; Patel, S.A.; Kinra, S.; Clarke, L.; Houben, R. Forecasting the prevalence of overweight and obesity in India to 2040. PLoS ONE 2020, 15, e0229438. [Google Scholar] [CrossRef] [PubMed]
  86. Liu, J.; Ren, Z.-H.; Qiang, H.; Wu, J.; Shen, M.; Zhang, L.; Lyu, J. Trends in the incidence of diabetes mellitus: Results from the Global Burden of Disease Study 2017 and implications for diabetes mellitus prevention. BMC Public Health 2020, 20, 1415. [Google Scholar] [CrossRef]
  87. Barik, A.; Shah, R.V.; Spahillari, A.; Murthy, V.L.; Ambale-Venkatesh, B.; Rai, R.K.; Das, K.; Santra, A.; Hembram, J.R.; Bhattacharya, D.; et al. Hepatic steatosis is associated with cardiometabolic risk in a rural Indian population: A prospective cohort study. Int. J. Cardiol. 2016, 225, 161–166. [Google Scholar] [CrossRef]
  88. Ghosh, S.M.; Qadeer, I. Interpretations and Implications of Increasing Obesity in India-Data on Women from National Health Surveys. Econ. Pol. Week. 2020, 55, 37–45. [Google Scholar]
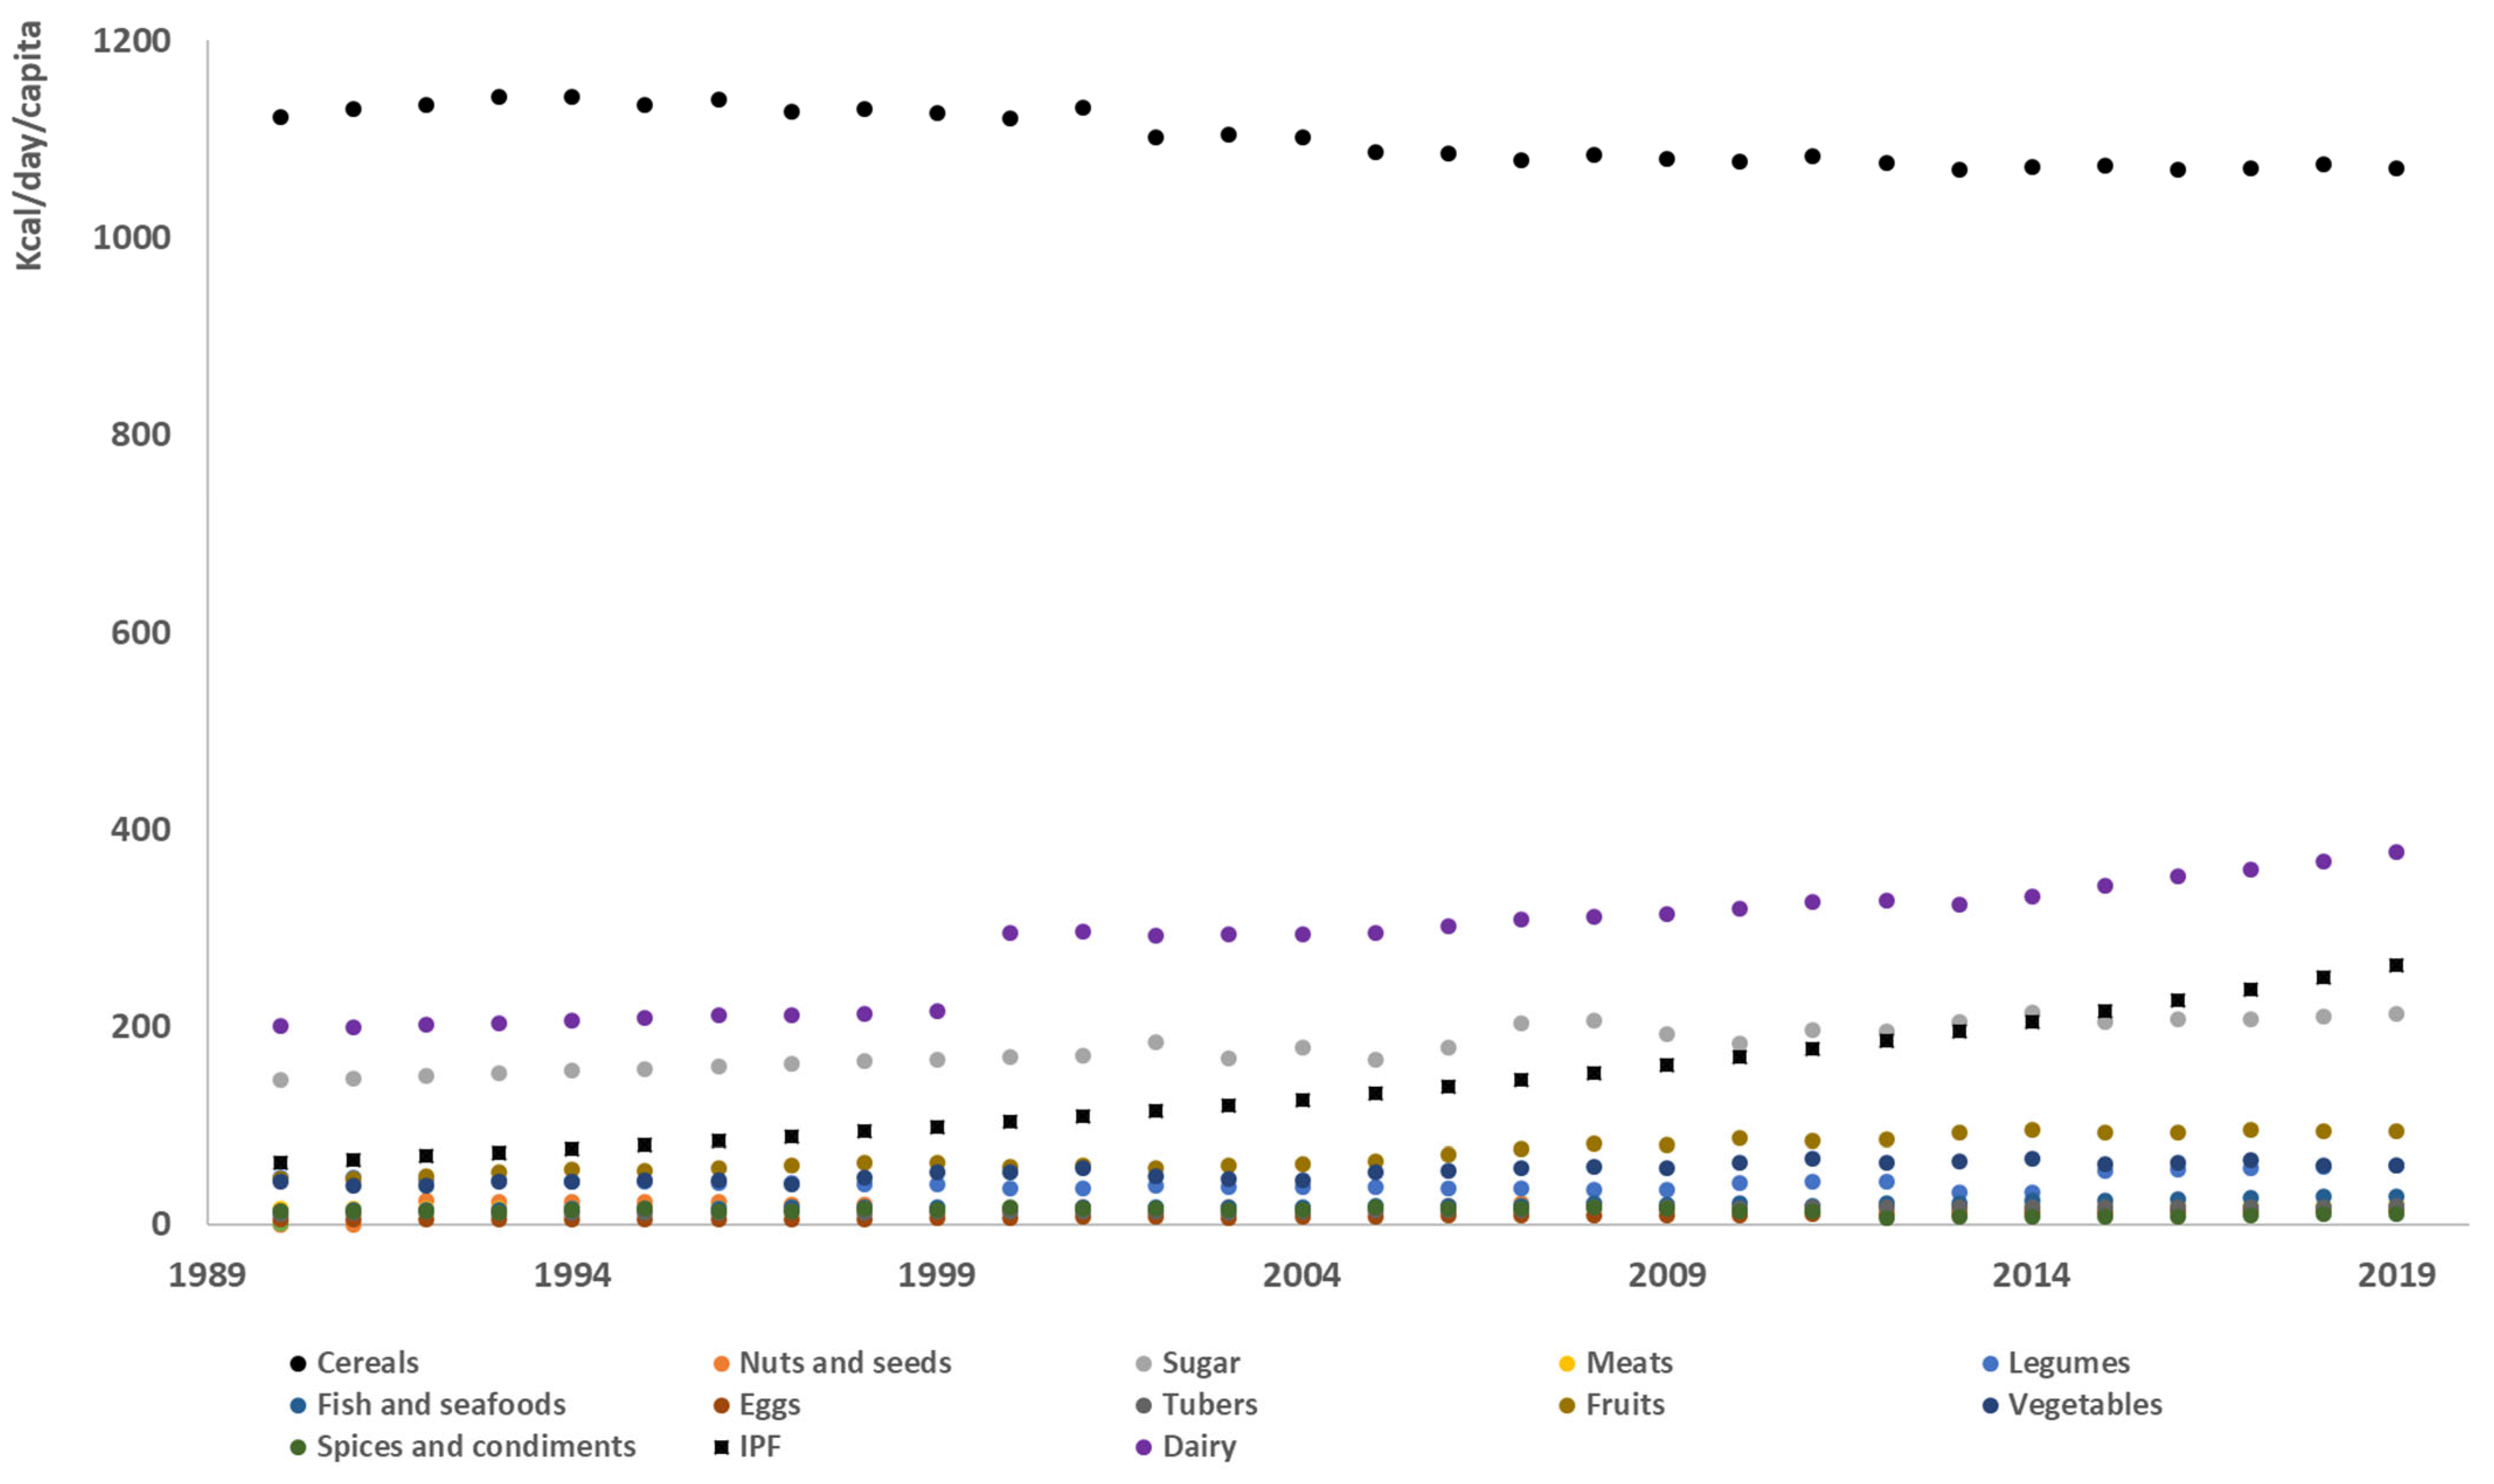
Figure 1. Changes in calorie intake by food group during the 1990–2019 period.
Sustainability 14 14861 g001
Figure 2. Correlations between percentages of calories from animal food and industrially processed food during the 1990–2019 period. Fitted curve was chosen based on the highest R2.
Sustainability 14 14861 g002
Figure 3. Percentages of macronutrient calorie shares during the 1990–2019 period.
Sustainability 14 14861 g003
Figure 4. The adequacy of the diet with regard to the RDA for adults (%) for (a) fiber, minerals and trace elements and (b) vitamins during the 1990–2019 period. A negative percentage difference to the RDA indicates a deficiency.
Sustainability 14 14861 g004
Figure 5. Associations between total calorie intake (kcal/day/capita) and the prevalence of overweight, obesity and type 2 diabetes during the 1990–2019 period. Fitted curves were chosen based on the highest R2 (overweight percentage includes obesity). All symbols for obesity, overweight and type 2 diabetes prevalence correspond to the years from 1990 (left hand side) to 2019 (right hand side of the figure).
Sustainability 14 14861 g005
Figure 6. During the 1990–2016 period, percentages of (a) industrially processed food calorie shares and (b) animal calorie shares and the prevalence of overweight, obesity and type 2 diabetes (%). Fitted curves were chosen based on the highest R2. All symbols for obesity, overweight and type 2 diabetes prevalence correspond to the years from 1990 (left hand side) to 2019 (right hand side of the figure).
Sustainability 14 14861 g006
Figure 7. During the 1990–2019 period, chronic disease mortality (% all deaths) correlated with percentages of (a) animal calorie consumption and (b) industrially processed calorie consumption. All symbols for chronic disease mortality correspond to the years from 1990 (left hand side) to 2019 (right hand side of the figure).
Sustainability 14 14861 g007aSustainability 14 14861 g007b
Table 1. Median calorie content of main food groups.
Food GroupsCalorie/g 1
Eggs (n = 5) 21.54
Meats (n = 1071)2.05
Fishes and seafood (n = 188)1.36
Dairy (n = 136)0.81
Fruits (n = 359)0.60
Vegetables (n = 360)0.30
Cereals (n = 53)2.65
Tubers (n = 121)0.93
Legumes (n = 237)1.14
Nuts and seeds (n = 132)5.74
Oils and fats (n = 105)8.84
Spices and condiments (n = 64)2.84
Table sugar (n = 1)3.98
IPF (n = 5184)2.77
1 Median calorie contents within each food group were based on all ready-to-eat foods as retrieved from the Indian database in 2021 [39]. 2 Number of ready-to-eat foods considered for the calculation of the median calorie content. It corresponds to the number of available foods (not including IPF) from the Indian database in 2021. Abbreviation: IPF, Industrially Processed Foods, as defined by Baker et al. [38].
Table 2. Evolution of the total calories and calorie percentages by food group and calorie type during the 1990–2019 period.
Years199019911992199319941995199619971998199920002001200220032004
Total calories (kcal/day/capita)172617491786181018251825184418411859186519401965193619331952
% total calories
Cereals65.064.663.563.162.662.261.861.360.860.457.757.656.957.156.5
Nuts and seeds0.00.01.41.31.31.21.31.11.10.80.70.90.70.90.8
Sugar8.48.58.48.48.58.68.78.88.99.08.78.79.58.79.1
Meats0.90.90.90.90.90.90.90.80.80.80.80.80.80.80.8
Legumes2.72.72.52.42.42.42.32.32.22.21.91.82.02.01.9
Fish and seafood0.80.80.80.80.90.90.90.90.90.90.80.90.90.90.9
Eggs0.30.30.30.30.30.30.30.30.30.30.40.40.40.40.4
Dairy11.611.411.311.211.311.511.511.511.411.615.215.115.115.215.0
Pulses and tubers0.70.70.70.70.70.60.60.80.60.70.70.70.70.60.7
Fruits2.62.62.73.03.12.93.13.23.43.43.03.02.93.13.2
Vegetables2.52.32.22.42.42.52.42.22.62.82.72.92.52.42.3
Spices and condiments0.80.80.70.70.80.90.80.80.80.80.90.80.80.80.8
Oils and fats0.00.70.70.70.80.80.91.11.11.11.00.90.90.91.1
IPF3.63.73.94.04.24.44.64.85.05.35.35.55.96.26.5
Animal15.115.115.015.015.215.415.615.815.816.019.619.619.720.020.0
Years200520062007200820092010201120122013201420152016201720182019
Total calories (kcal/day/capita)194819822026205320422061209220922093213221612190221722422266
% total calories
Cereals55.854.853.252.852.952.251.851.451.050.349.748.848.347.947.2
Nuts and seeds0.91.01.01.00.80.80.70.90.80.70.60.70.70.70.7
Sugar8.59.010.010.09.48.99.49.49.810.09.59.59.49.49.4
Meats0.80.80.90.90.90.90.80.80.80.80.80.80.80.90.9
Legumes1.91.91.81.71.72.12.12.11.61.52.52.62.62.62.6
Fish and seafood1.01.00.91.11.01.00.91.01.11.11.11.21.21.21.3
Eggs0.40.40.40.40.50.50.50.50.50.60.60.60.60.60.7
Dairy15.215.215.315.215.415.515.615.715.415.615.916.116.216.416.6
Pulses and tubers0.80.70.70.80.80.80.80.80.80.80.80.80.80.80.8
Fruits3.33.63.74.04.04.24.04.14.44.54.34.34.34.24.2
Vegetables2.72.72.82.82.83.13.23.03.13.12.92.92.92.72.6
Spices and condiments0.90.80.80.80.80.60.60.30.30.40.30.40.40.40.5
Oils and fats1.11.11.11.11.11.31.11.01.01.11.11.11.11.01.0
IPF6.87.07.27.57.98.28.58.99.39.610.010.310.711.111.6
Animal20.320.520.620.821.121.421.521.921.822.122.623.123.423.924.3
Note: For each column (year) the total of food groups is 100% (animal calories not included); Animal calories included all animal sources, i.e., “Meats”, “Fish and seafood”, “Eggs”, “Dairy”, and a part of “Oils and fats” and “IPF” (see Methods for mixed products in IPF).
Publisher’s Note: MDPI stays neutral with regard to jurisdictional claims in published maps and institutional affiliations.