Article

Assessing Wind Farm Site Suitability in Bangladesh: A GIS-AHP Approach

Institute of Water and Environment, Dhaka University of Engineering & Technology, Gazipur 1707, Bangladesh
*
Author to whom correspondence should be addressed.
Sustainability 2022, 14(22), 14819; https://doi.org/10.3390/su142214819
Submission received: 1 August 2022 / Revised: 23 October 2022 / Accepted: 7 November 2022 / Published: 10 November 2022

Abstract

:
Wind energy is one of the most attractive renewable energy sources because of its low operating, maintenance, and production costs as well as its low environmental impact. The goal of this study is to discover the best locations in Bangladesh for wind farms to be built and operated efficiently. This study applied the Geographic Information System (GIS) and Analytical Hierarchy (AHP) methodologies to examine the eight important parameters upon which the suitability of locations is highly dependent. This analysis finds that Bangladesh has large regions appropriate for wind farm installation, with 3718.76 km2 and 16,631.14 km2 classified as being of “very high” and “high” suitability, respectively. It was also observed that wind speed, land slope, and elevation each had a height-weighted criterion of 32%, 27%, and 12%, respectively, when picking suitable locations. However, the overall viability of this study in identifying suitable sites has been evaluated based on ROC and AUC techniques and found satisfactory as per AUC value. The knowledge gained from this study will help the sustainable and renewable energy development authority (SREDA) of Bangladesh to expedite the renewable energy investment process and will ensure greater certainty in resource development. The findings of this research can be considered as baseline information for the wind energy sector.

1. Introduction

Energy is one of the most important factors driving the expansion of the global economy and industrial sector [1,2]. For a developing country like Bangladesh, to ensure the energy reserve and its sustainable supply is the most crucial factor in the time of globalization. The increasing demand for electricity in Bangladesh is not being met by the available energy sources. Every day, the availability of fossil fuels decreases. Bangladesh’s industrialization is approaching its most critical point ever in terms of energy issues due to a lack of energy. This issue can be mitigated in part by shifting the energy paradigm and embracing renewable energy options, wind energy being the most prominent. Wind energy is capable of producing mechanical energy or electricity without polluting the environment [3].
Nevertheless, natural gas and coal are the primary power generation sources in Bangladesh’s power sector, which makes the country heavily dependent on fossil fuels. On the other hand, natural gas generates 62.9% of Bangladesh’s electrical power, with the rest coming from other sources like diesel (10%), coal (5%), heavy oil (3%) and renewables (3.3%) [4]. Additionally, fossil fuel consumption directly contributes to an increase in greenhouse gas (GHG) levels in the atmosphere. These three (CO2, SO2, and NOx) GHGs have been identified as a growing problem for the global community because of their long-term environmental and ecological impacts and, more crucially, their impact on climate change. Industrialization and widespread reliance on fossil fuels are driving an exponential rise in CO2 emissions [5]. Solar, biomass, wind, and hydropower are just a few of the climate-change mitigation options currently being considered for potential use in developing countries [5]. Bangladesh faces a number of energy development challenges, including the high cost of electricity subsidies and the negative impact of climate change on the country’s dwindling hydroelectric generation resources. Bangladesh’s development goal is to ensure that all citizens have access to modern, affordable electricity. The government of Bangladesh is working to develop a clean and reliable electrical energy supply because of Bangladesh’s high wind and solar potential. Wind energy is one of the newest and fastest-growing renewable energy sources because it is clean, renewable, and has a minimal impact on humans and the environment. Wind turbines (WTs) are also easy to set up and operate, with low costs of upkeep and repair [5].
The implementation of wind energy projects necessitates careful consideration of a wide range of variables. Preliminary economic, environmental, and land use requirements must be taken into account when selecting an investment site for a wind power plant (WPP). Additional considerations, such as the impact of WTs on wildlife, shadow flashing, visual impacts, and electromagnetic interference must be taken into account when deciding where to build a wind farm [6]. As a result, the windiest places aren’t always the best; rather, a variety of economic, physical, and ecological factors must be considered in order to select the ideal locations [7]. Wind farm locations are determined utilizing multi-criteria decision-making (MCDM) techniques. Rating method, weighted sum method (WSM), ranking method, Weighted Linear Combination (WLC), analytical hierarchy process (AHP), Boolean overlay operation, analytic network process (ANP), trade-off analysis method, concordance analysis, Order Weighted Average (OWA), and Elimination Et Choice Translating Reality (ELECT) are MCDM techniques that can be combined with the Geographic Information Systems (GIS) environment [8]. The WSM is commonly utilized to find solutions to decision-making issues that only involve a single dimension; however, its application in scenarios involving multiple dimensions is notoriously difficult [9]. In addition to this, the ELECTRE method is ideal for use in settings where there are a variety of factors to consider and a considerable number of alternatives to choose from. Despite this, it is not a foolproof method for picking the best available alternative [10]. On the other hand, the AHP is regarded as the most popular MCDM technique in the literature for analyzing renewable energy sites because it is simple, straightforward, and can examine the consistency of the decision. It has the advantage of simplifying decision-making challenges that require a high level of consistency and flexibility. The framework can also combine quantitative and qualitative criteria. AHP is a mathematical method that assigns a relative weight to each criterion based on the decision-makers’ expert opinions when comparing paired criteria [11,12].
Utilizing various multi-criteria GIS modeling approaches was the primary objective of this research project, which was designed to identify potential sites for the construction of wind farms. In spite of the fact that a few studies have been carried out on wind energy prospects, not a single study has been carried out in the past on the process of site selection in Bangladesh. To the best of our knowledge, this is the first in-depth study that has been conducted in Bangladesh with the purpose of simultaneously utilizing AHP and GIS to identify potential locations for siting wind farms. In light of this, in the current investigation, we are taking into account the points of view of both regional experts and an extensive literature review in order to provide an in-depth basis for AHP calculations. It is anticipated that this study will provide valuable insights for national-scale applications of wind energy due to the fact that its spatial scope for the siting of wind farms encompasses the entirety of the country.

2. Materials and Methods

This research intends to develop a method that can categorize the land that is available for the construction of wind farm projects into different levels, based on the degree to which it is suitable for such endeavors. In order to accomplish this objective, several steps have been determined, as shown in Figure 1. The first step in the research process is to choose the case study, then to conduct a literature review to investigate the scope of the need for projects of this kind and determine whether or not the proposed location is suitable for such projects. Next, based on the specifics of the case study and the technical challenges involved, decide which aspects of the land’s suitability for wind farms are the most important. As a consequence of this analysis, particular weights are assigned to each factor in order to develop an index that can determine the suitability of land. The AHP was utilized in order to arrive at these final weights. The final suitability map is then produced with the help of GIS, a map which is used for spatial analysis and the integration of multiple factors into the proposed index in order to locate areas that are not suitable.
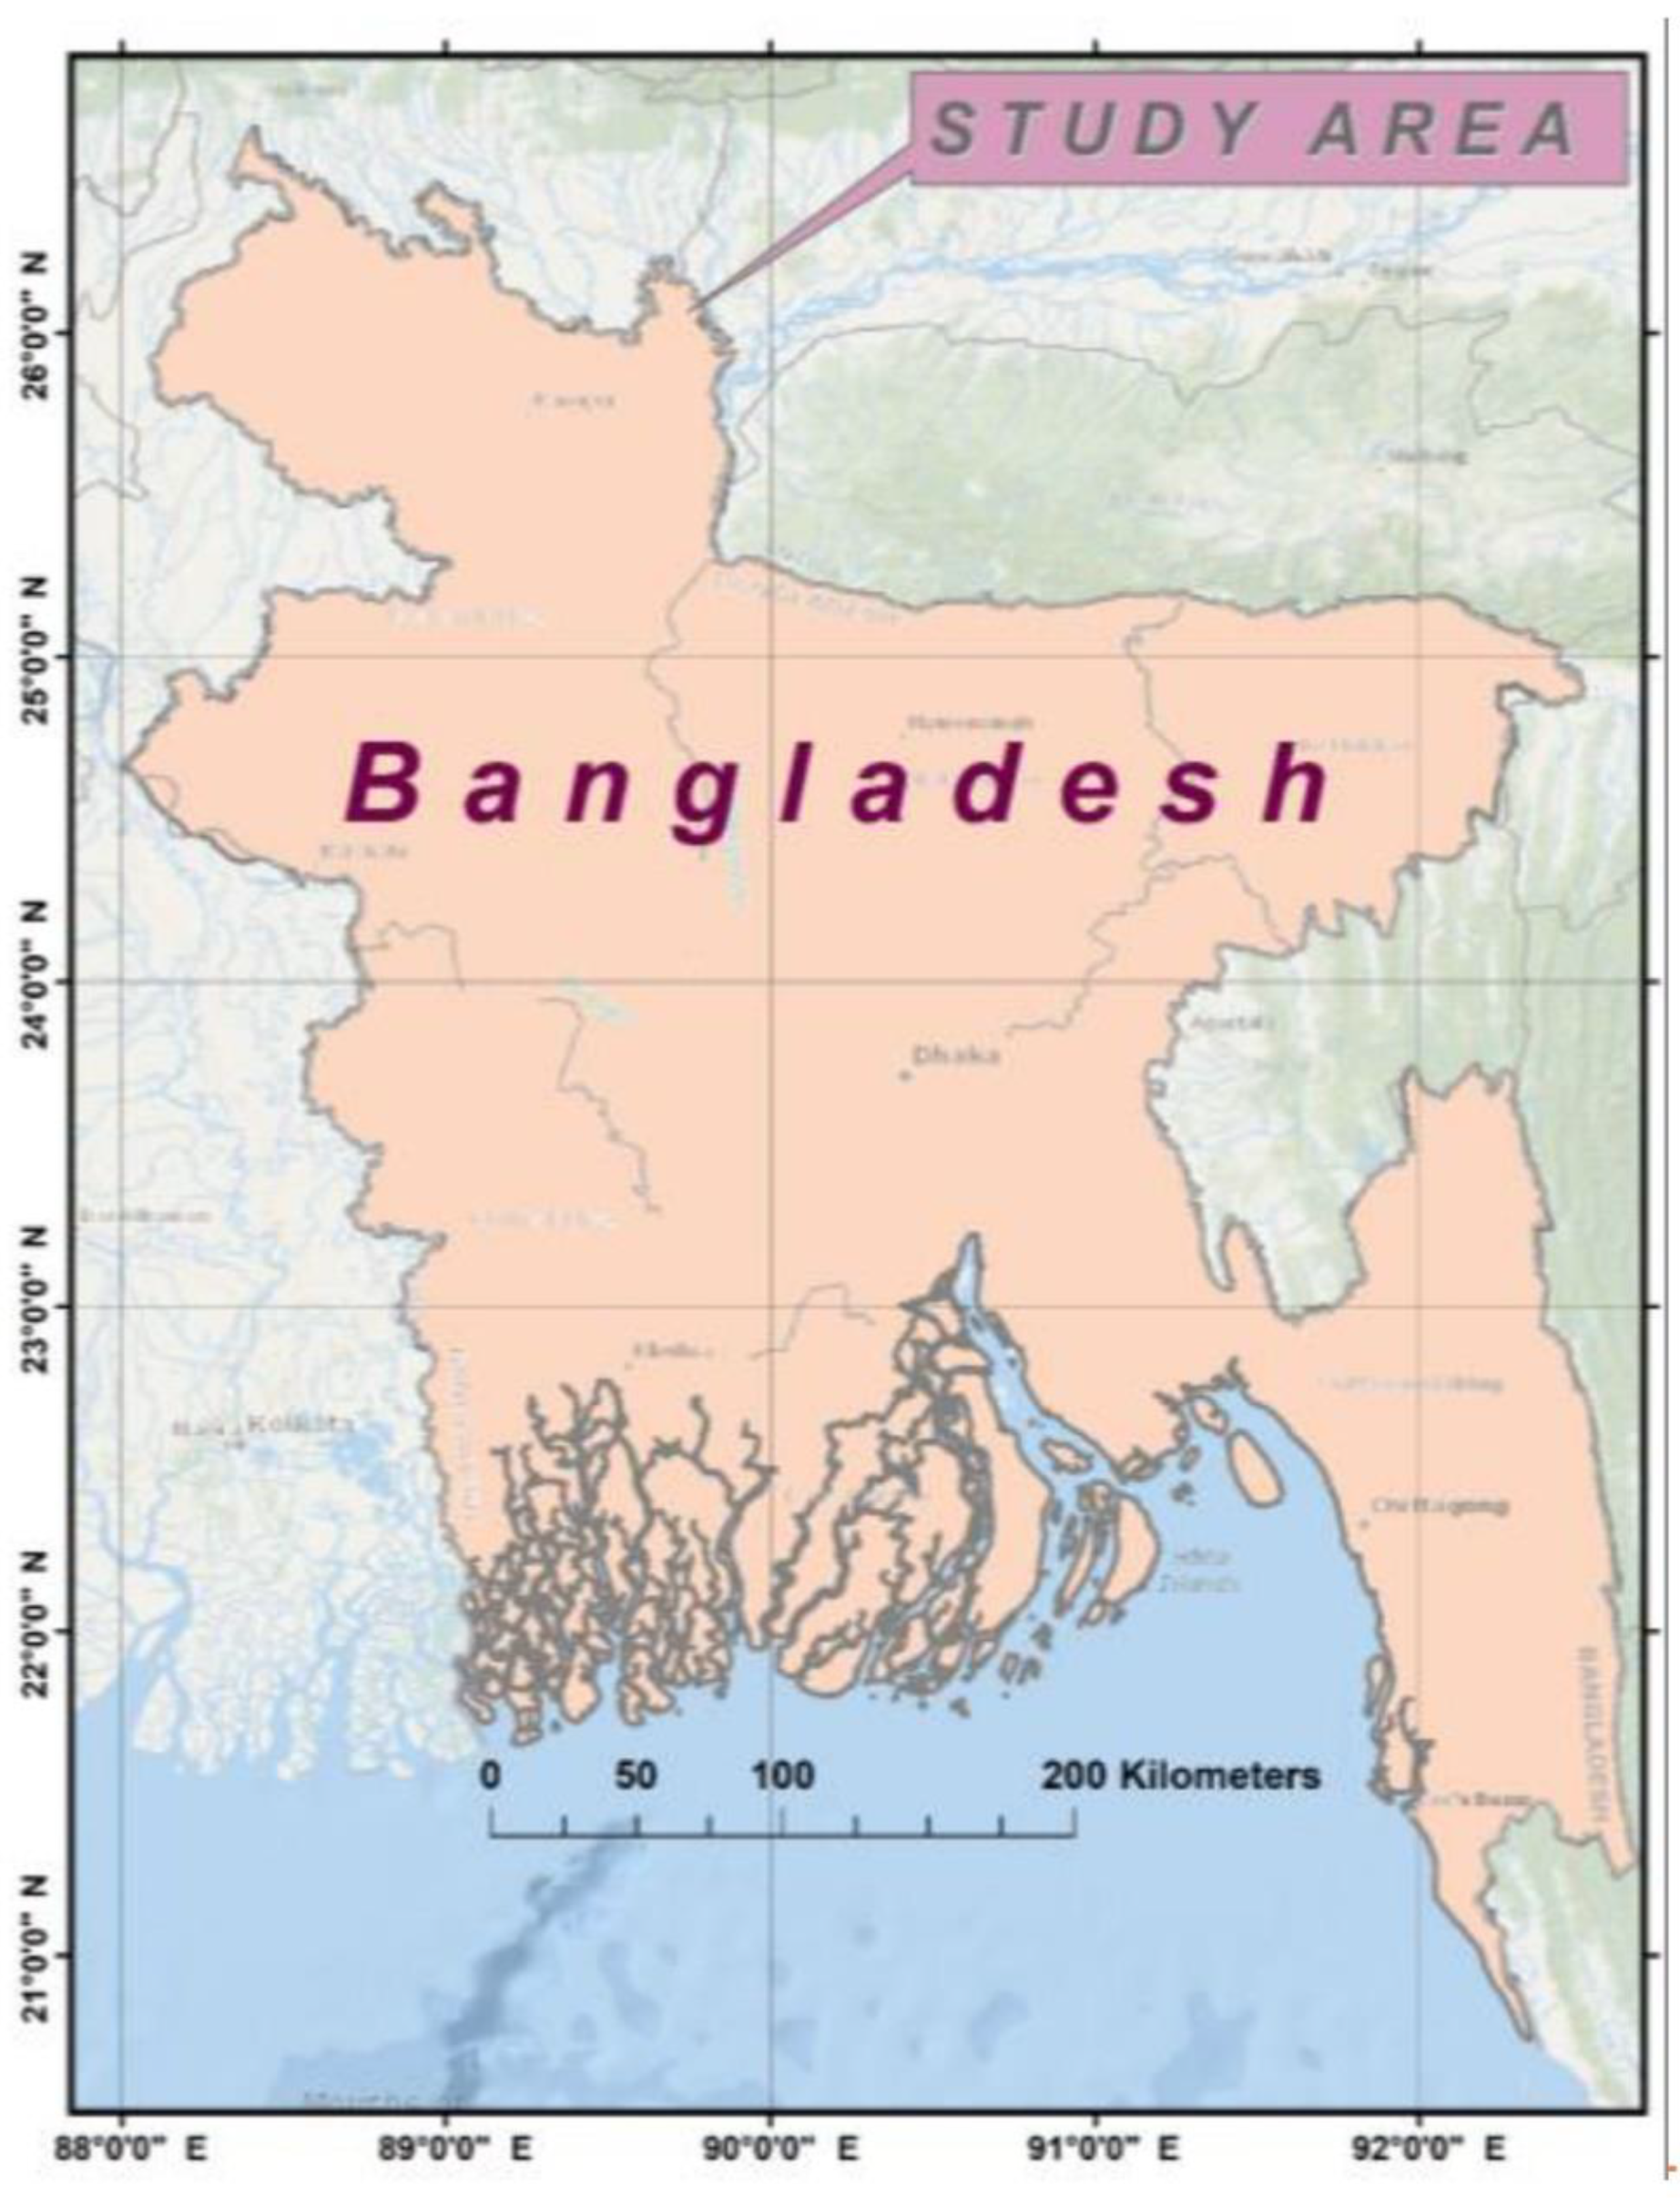
2.1. Study Area

The geographical extent of the study region, Bangladesh, can be found in South Asia between the coordinates 20°34′ N and 88°01′ E and 26°38′ N and 92°41′ E. Bangladesh is encircled on three sides by the country of India (i.e., west, north, and northeast). It shares a border with Myanmar on the southeast, while the southern side encompasses the Bay of Bengal and has a coastline that is more dispersed (Figure 2).

2.2. Land Suitability Evaluation Factors

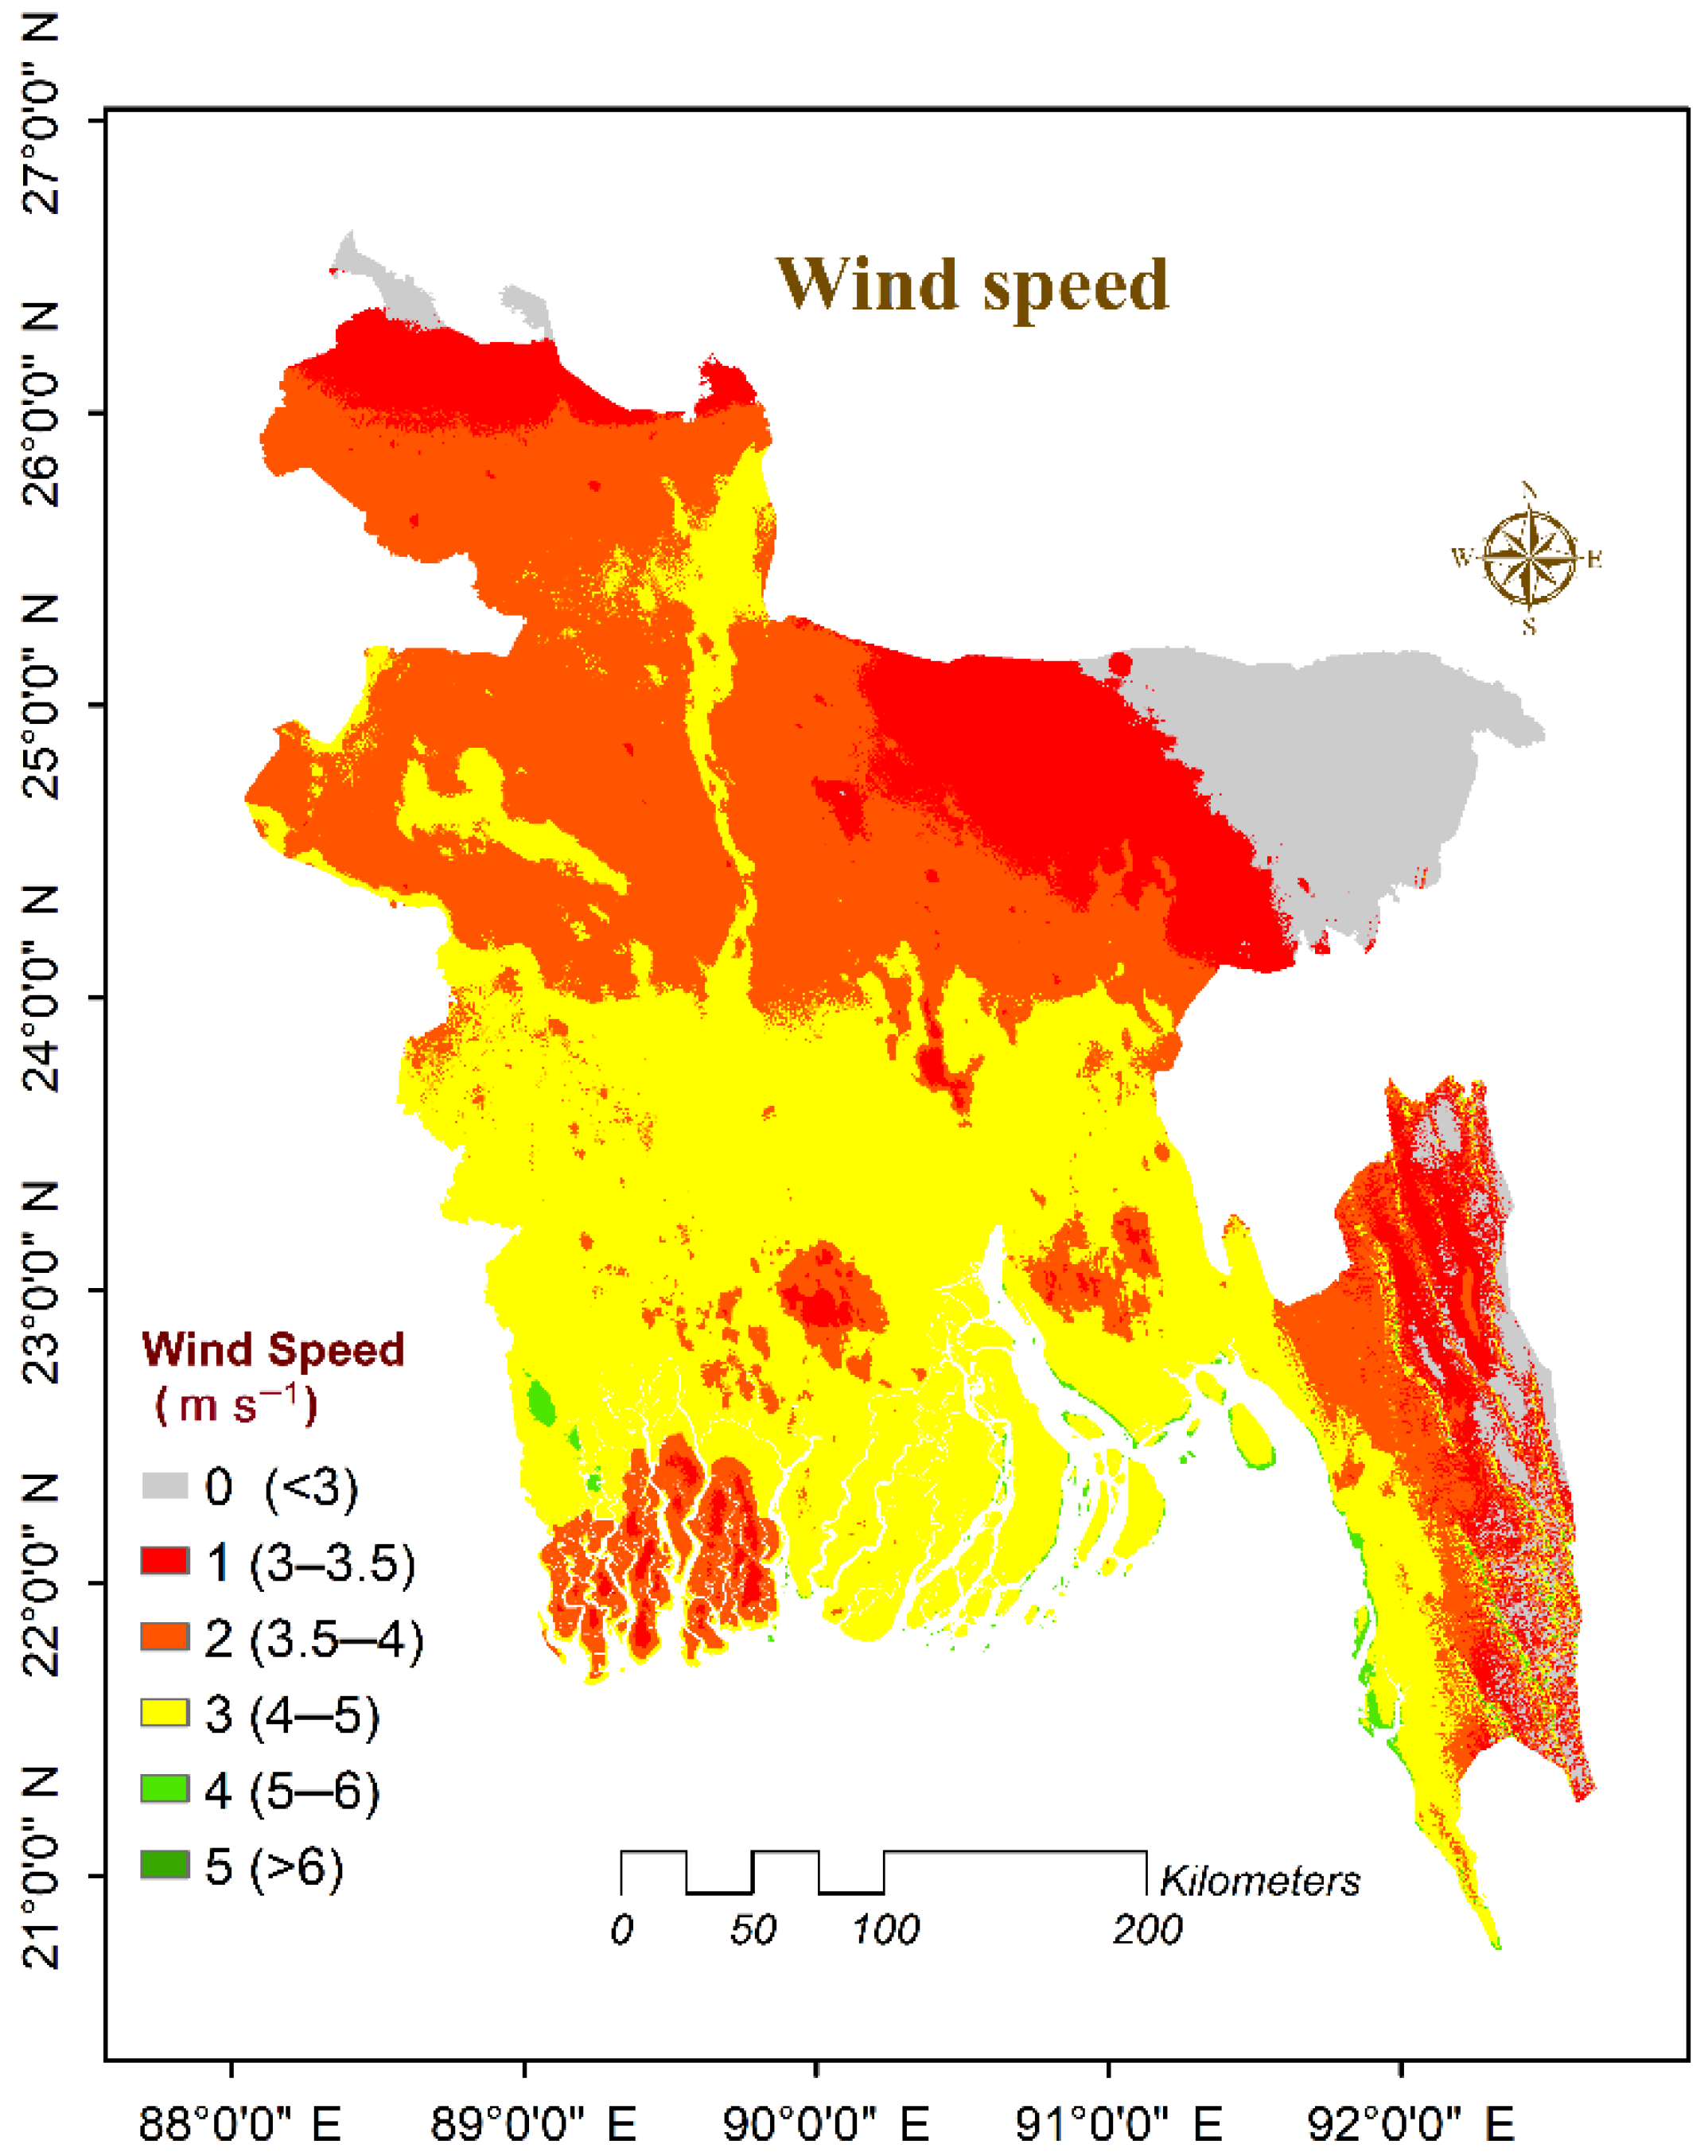
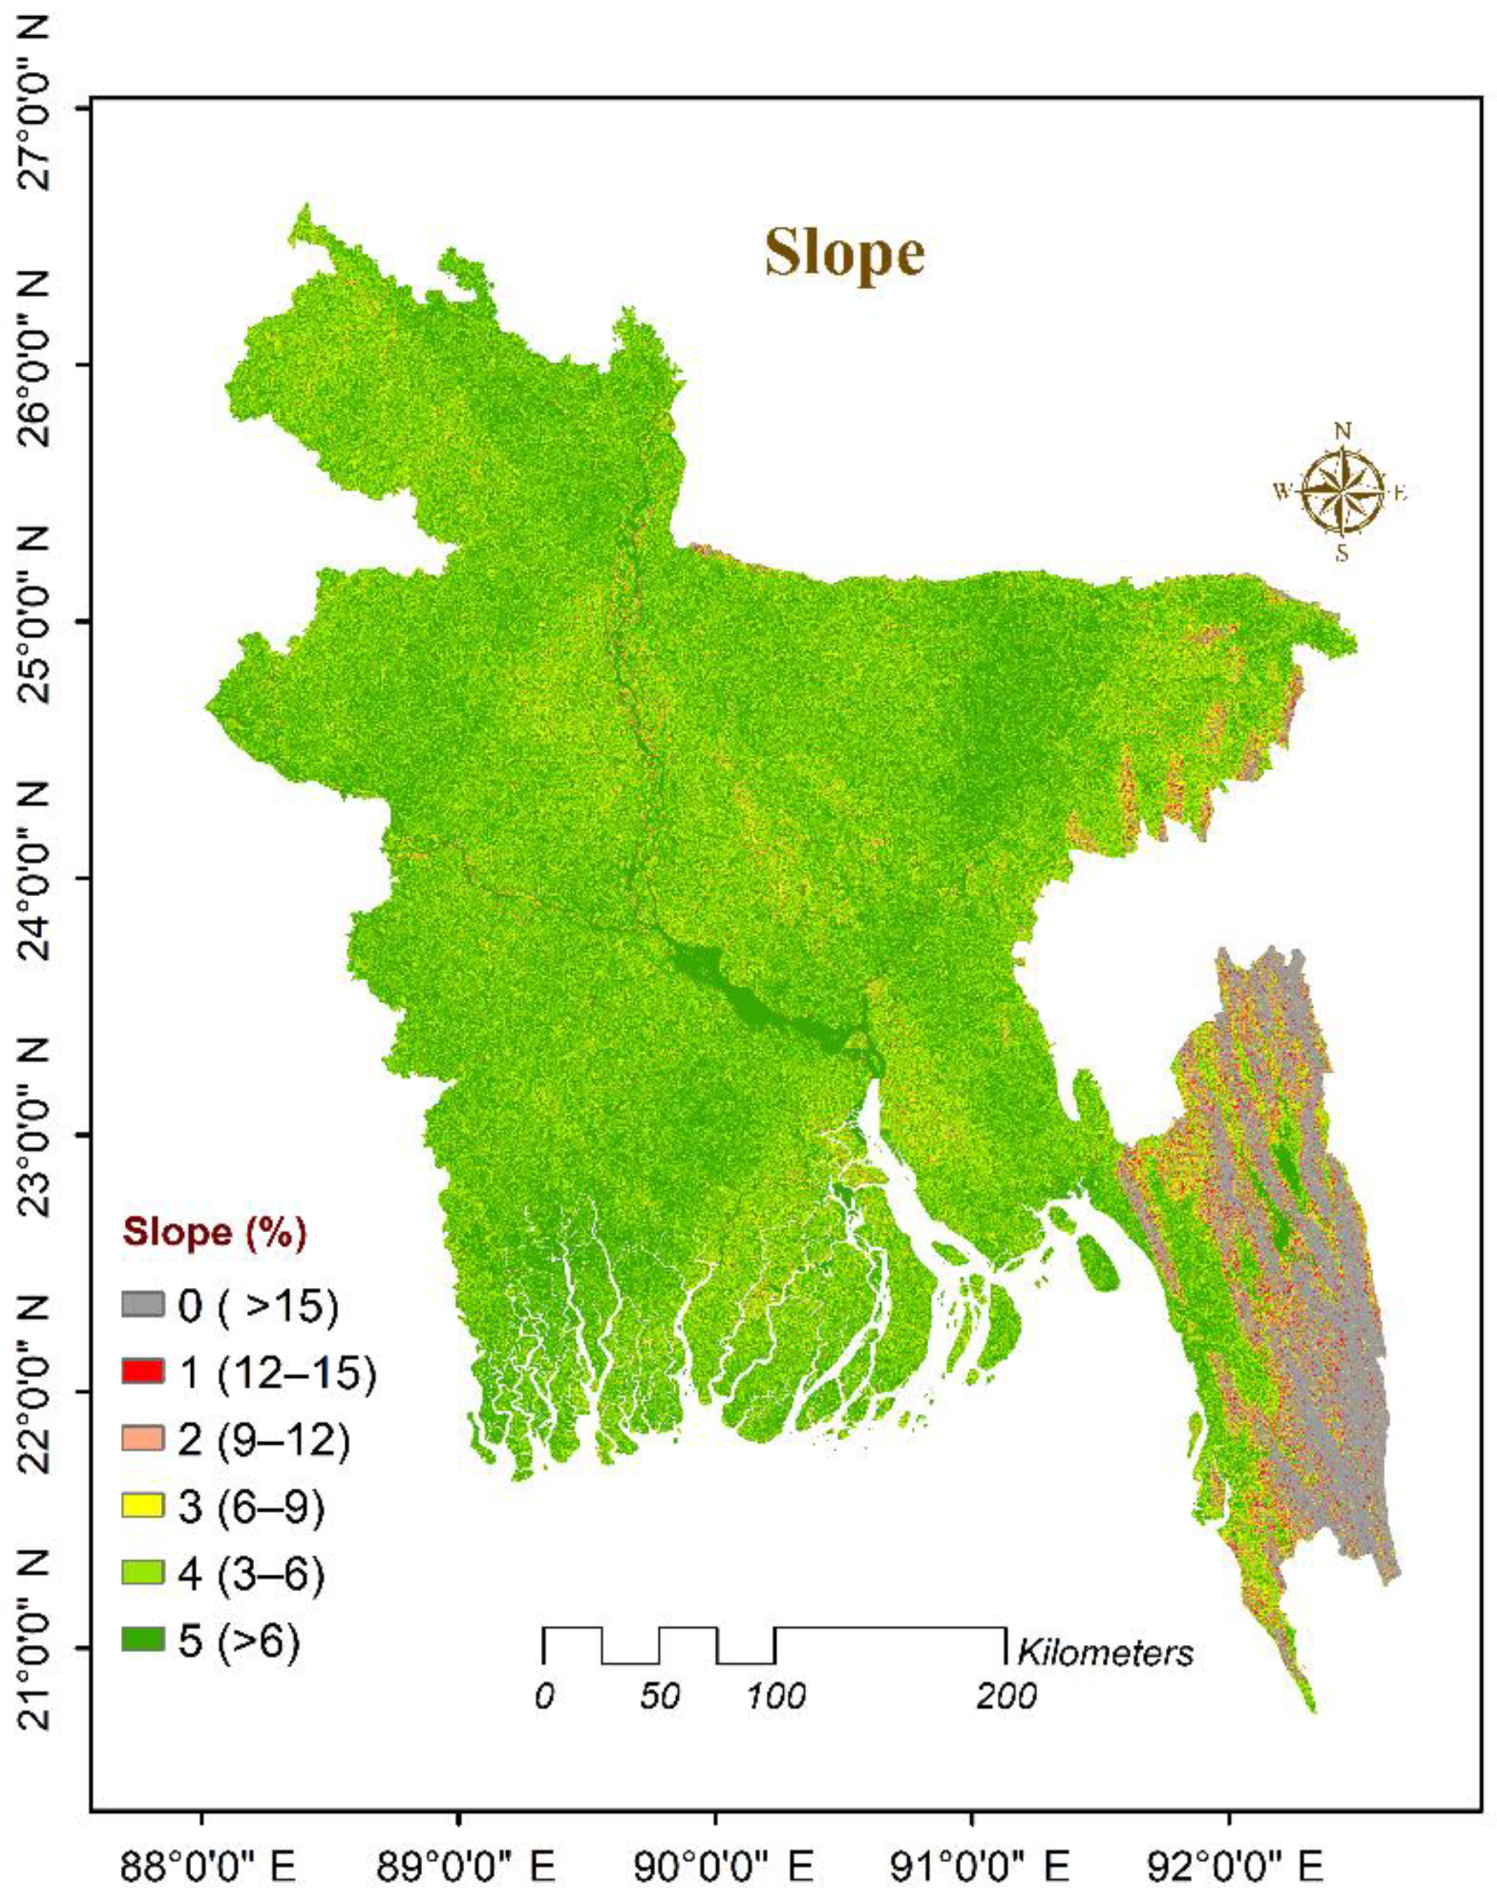
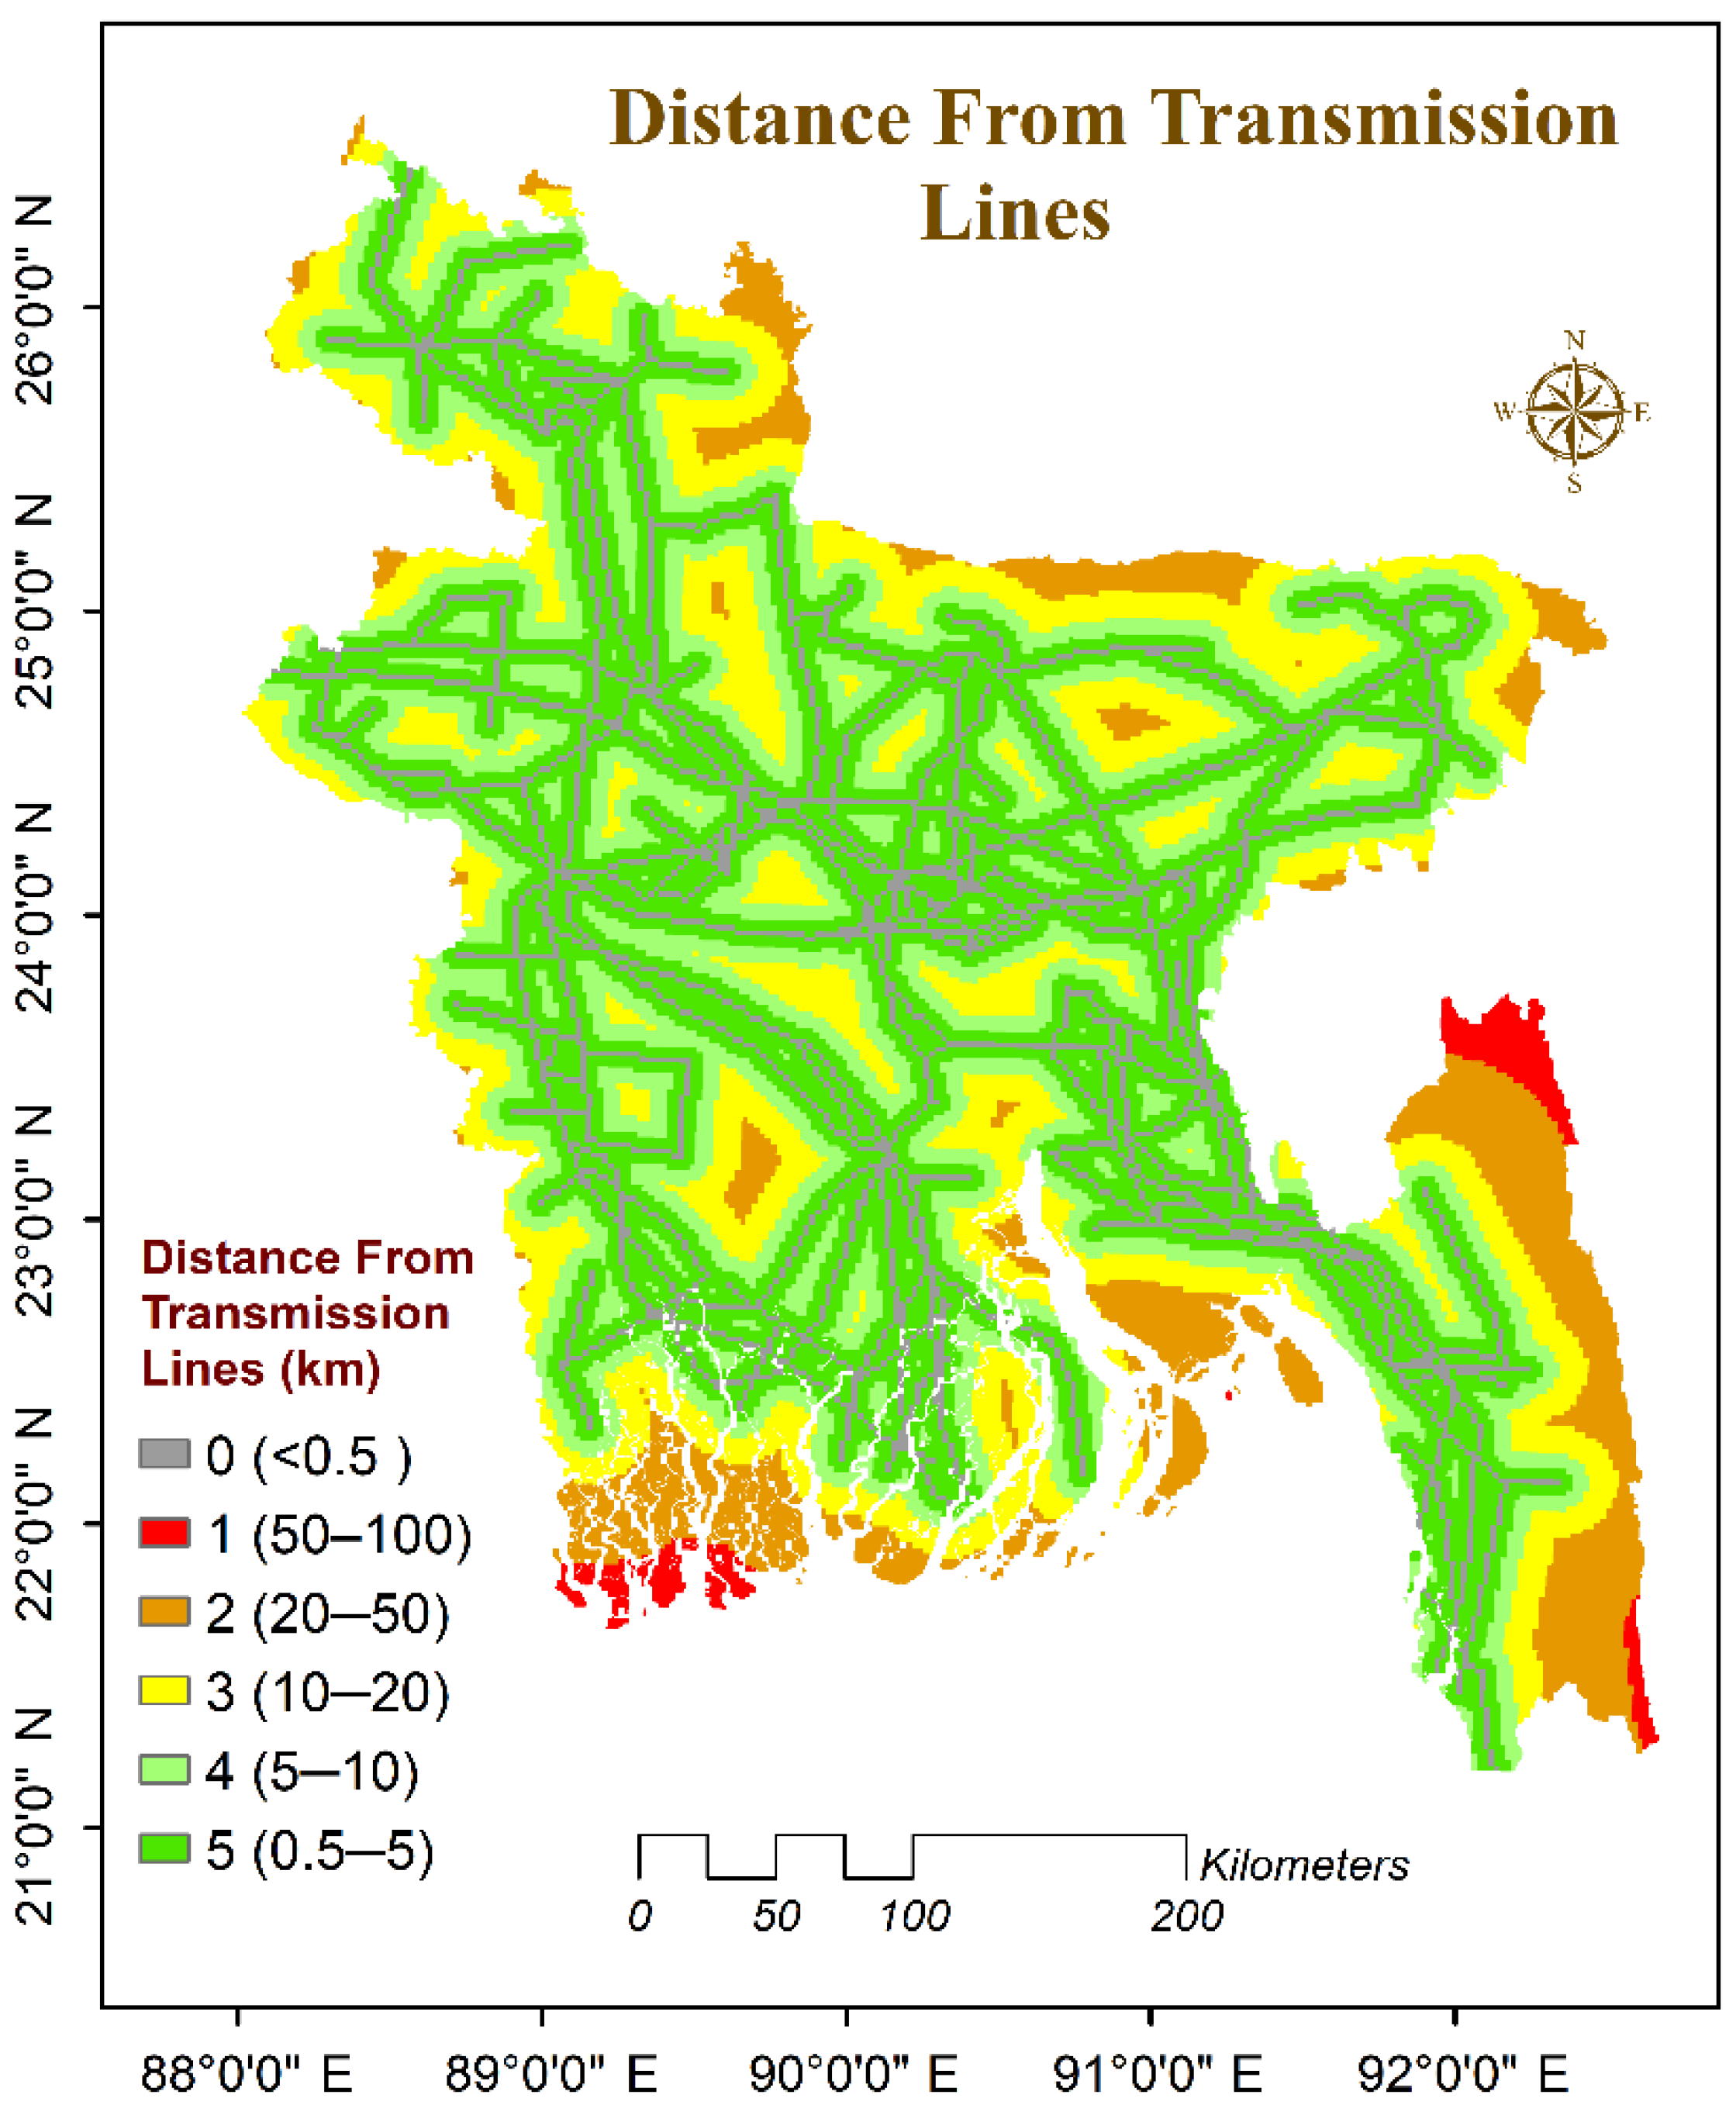
Wind speed, slope, city proximity, elevation, distance between power grid and transmission system, distance from airports, distance from major highways and railways and lightning strike flash rates are eight assessment factors that were established and used as input to ArcMap 10.8 to conduct a geographic study and choose Bangladesh’s optimal wind farm sites.

2.2.1. Wind Speed

Wind firms place the greatest emphasis on wind velocity. Wind turbines generate more electricity when the wind speed exceeds a certain threshold. In previous research studies, a variety of wind speed threshold values were identified. This study concludes that the location of a wind farm is inappropriate if the average wind speed is less than 3 ms−1. However, due to the potential for damage, WT equipment is prohibited in regions where the average wind speed exceeds 20 m s−1 [13].

2.2.2. Slope

In order to locate wind farms in the best possible location, slope is an important technical parameter. Maintenance and equipment installation costs rise because of the difficulty in accessing these locations due to steep slopes. Flat and low-slope areas are commonly recommended for wind farm development in order to avoid the difficulties of wind farm construction. Conversely, areas with a slope greater than 15% are omitted from the final suitability map [14]. However, in this study, the slope factor was calculated using data from a digital elevation model (DEM).

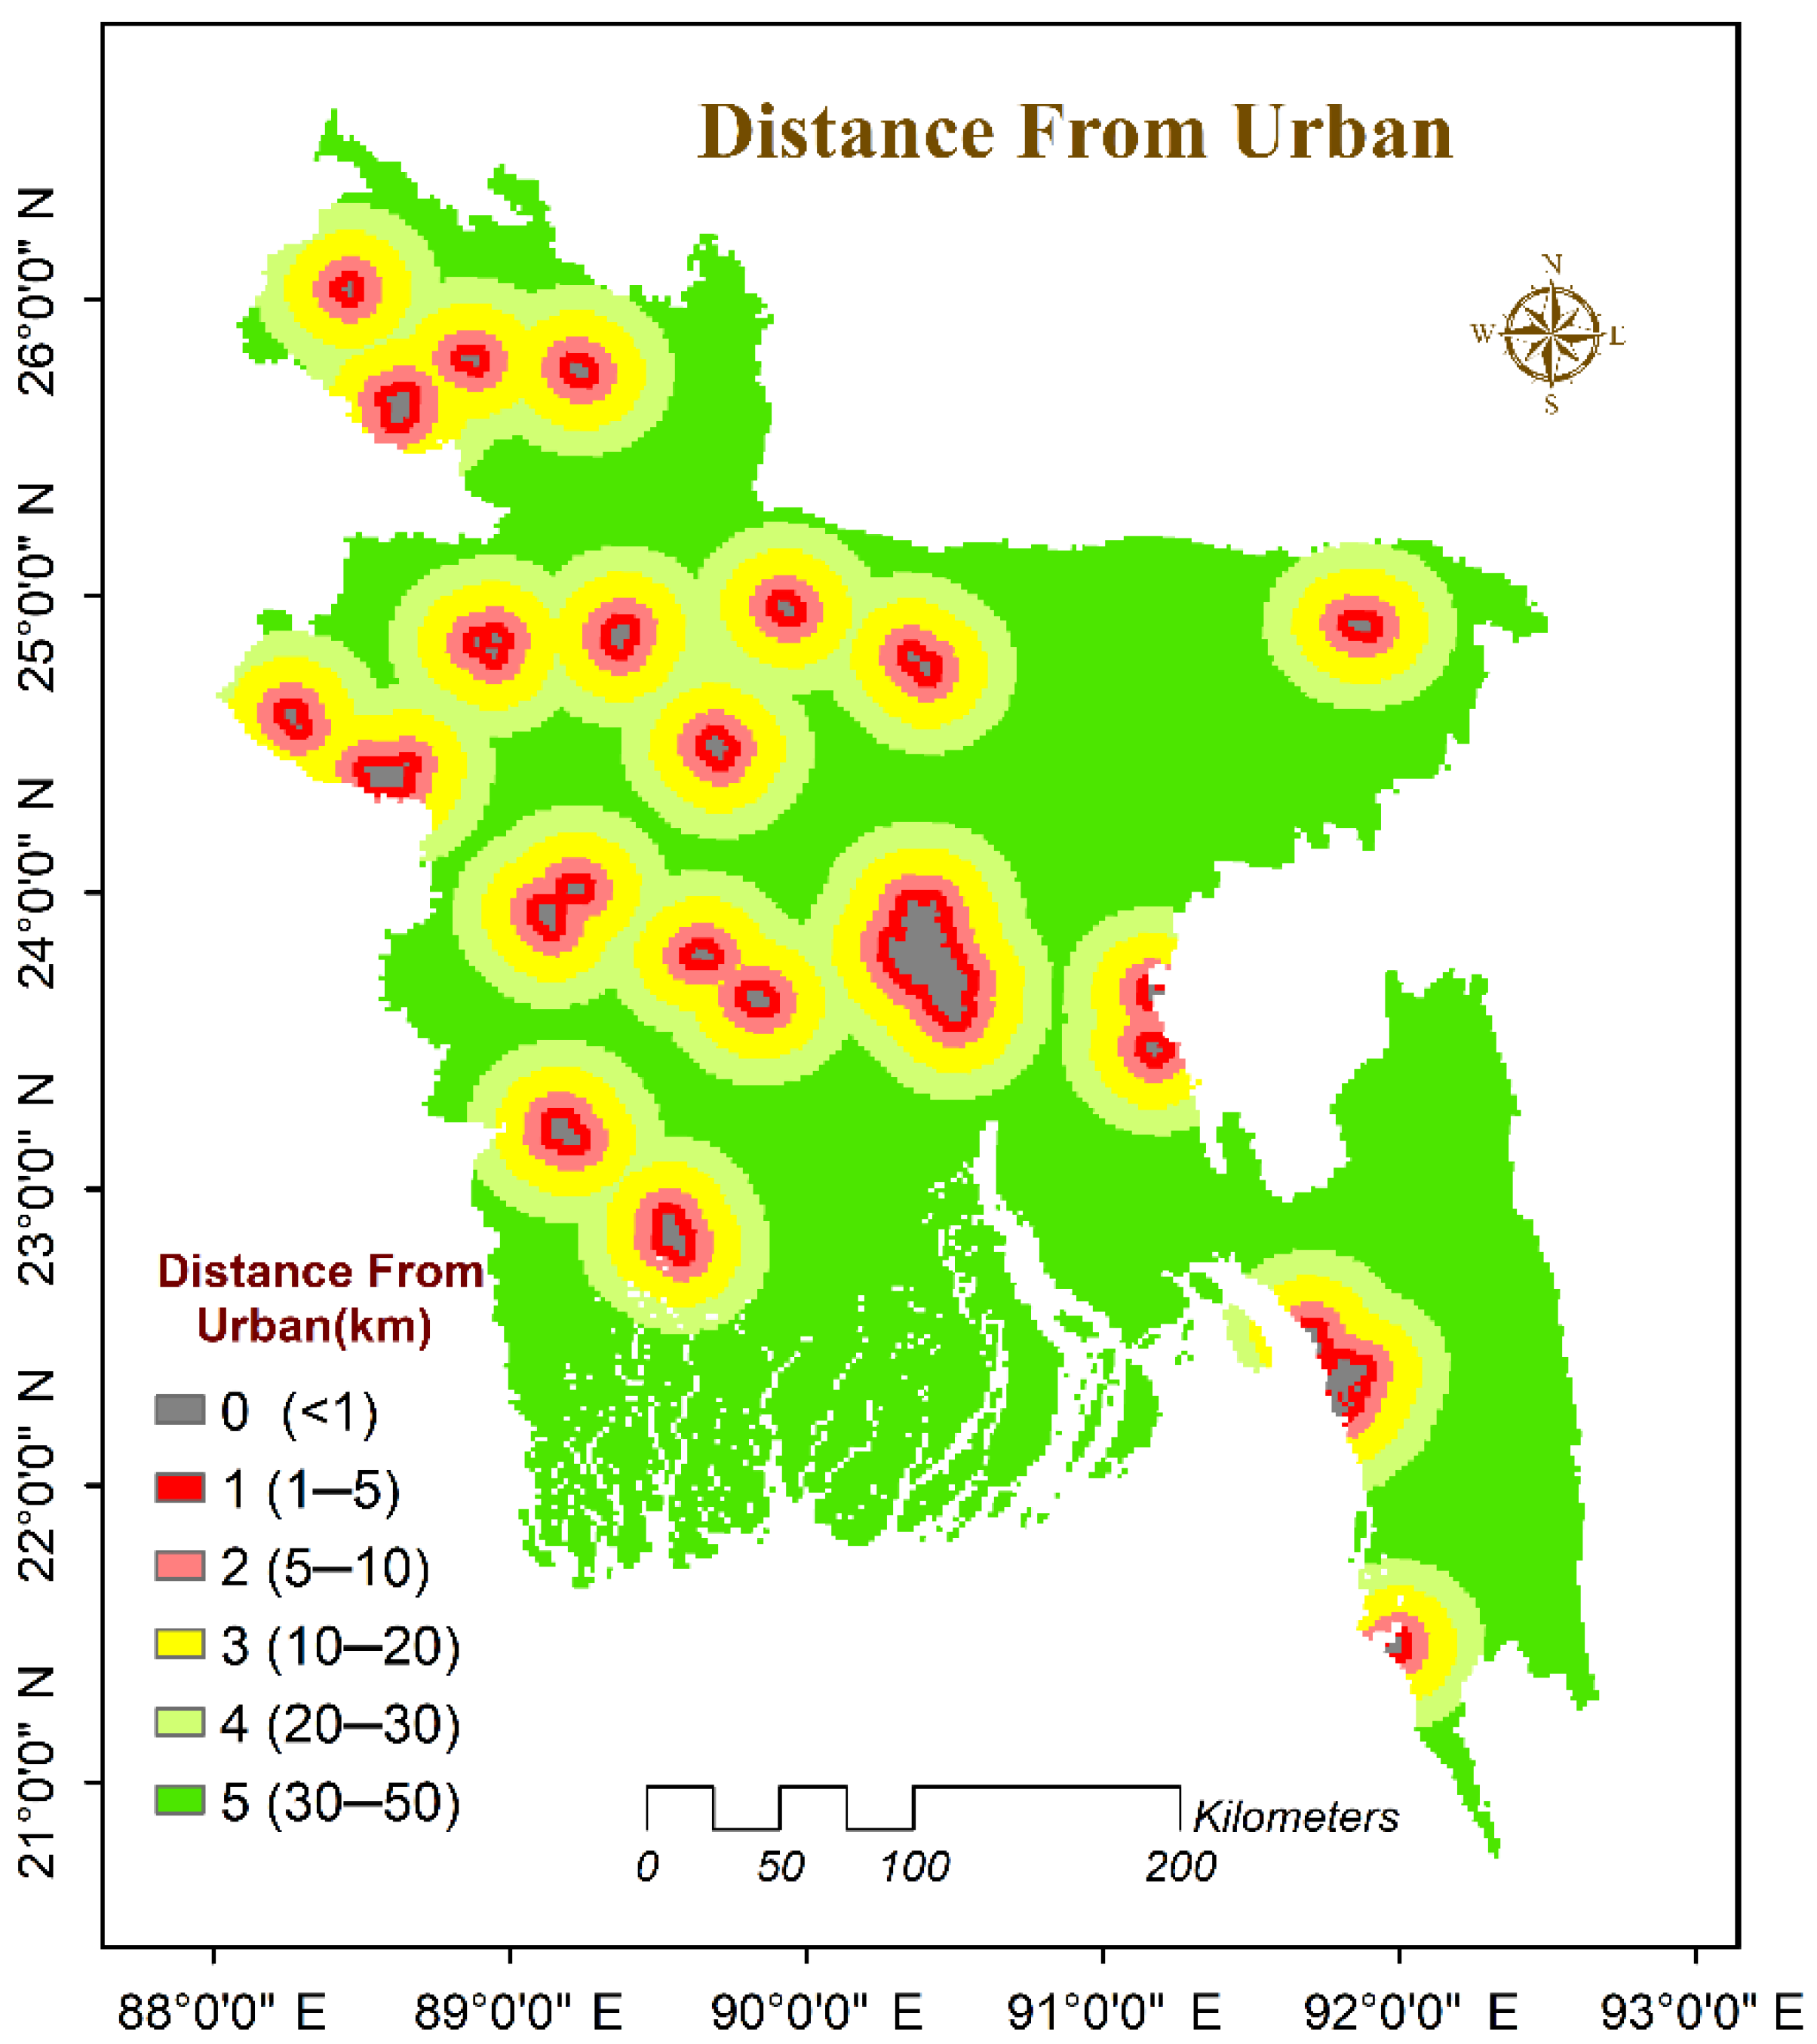
2.2.3. Distance from Urban Areas

Wind farms are a source of mechanical and aerodynamic noise, visual disturbances, and shadow flashes, among other issues. A minimum safe distance must be maintained from urban and residential areas to the wind farm site in order to evict the residents of the wind farm’s neighboring regions. For the wind farm project to be economically viable, a balance must be maintained between maintaining a safe distance from communities and rising transmission power losses and costs. Consequently, the distance between urban and residential areas must be calculated with care, taking into account all lateral factors. In this case, locations 1 km from residential areas are deemed suitable for wind farm development [15]. To develop a suitable data format for further use, this study used vector data from urban regions using the “Euclidean Distance” program.
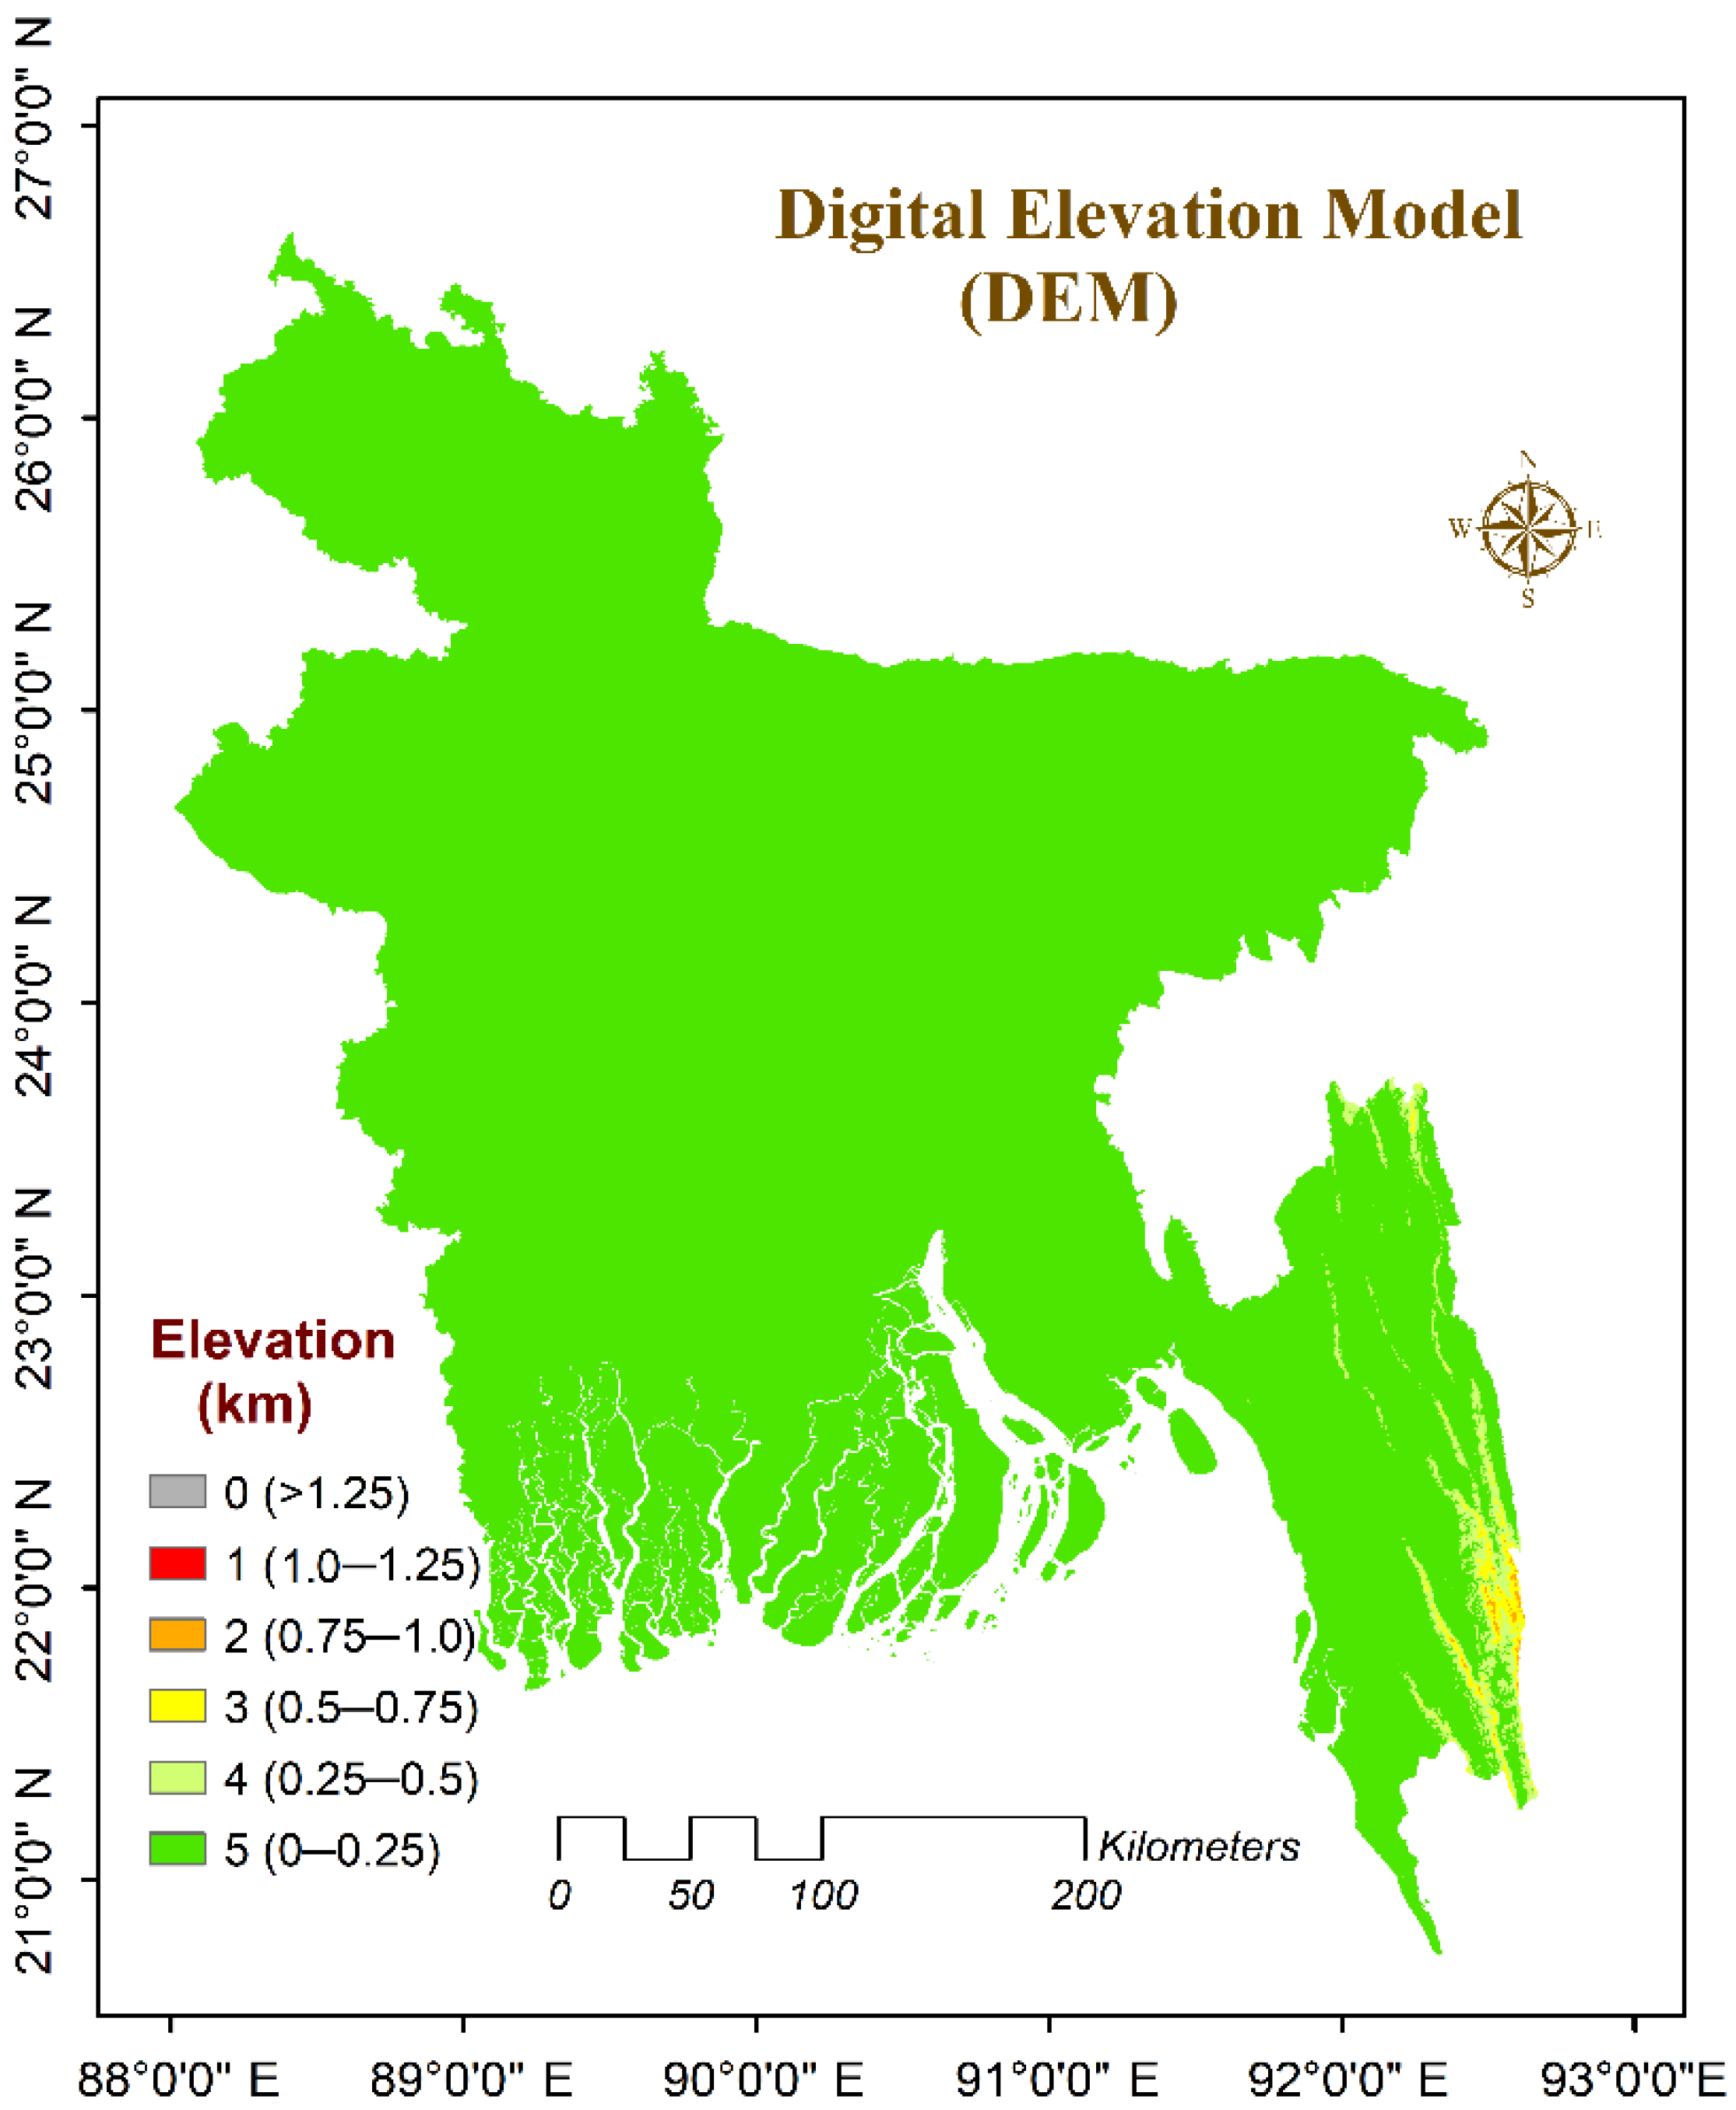
2.2.4. Elevation

Wind direction and speed are greatly influenced by the site’s elevation. Typically, wind turbines are located on higher ground in order to catch winds at speeds that are more powerful [16]. Construction costs go up, and maintenance becomes more difficult, because of this. As a result, careful consideration should be given to the location of wind farms. There are 1250 m and less than 0 m of difference between Bangladesh’s DEM’s highest and lowest points, respectively.

2.2.5. Distance from Transmission Lines and Power Grid

For the most part, the wind farm’s primary goal is to produce electricity and then feed it into the local grid via transmission lines. Therefore, the distance between potential wind farm locations and existing transmission lines and the power system is a critical consideration when selecting a wind farm site. To minimize the negative effects of power transmission on public health, a bare minimum distance should be determined [14]. According to this study, the minimum distance between power transmission lines and the power grid is 0.5 km [17].

2.2.6. Distance from Airports

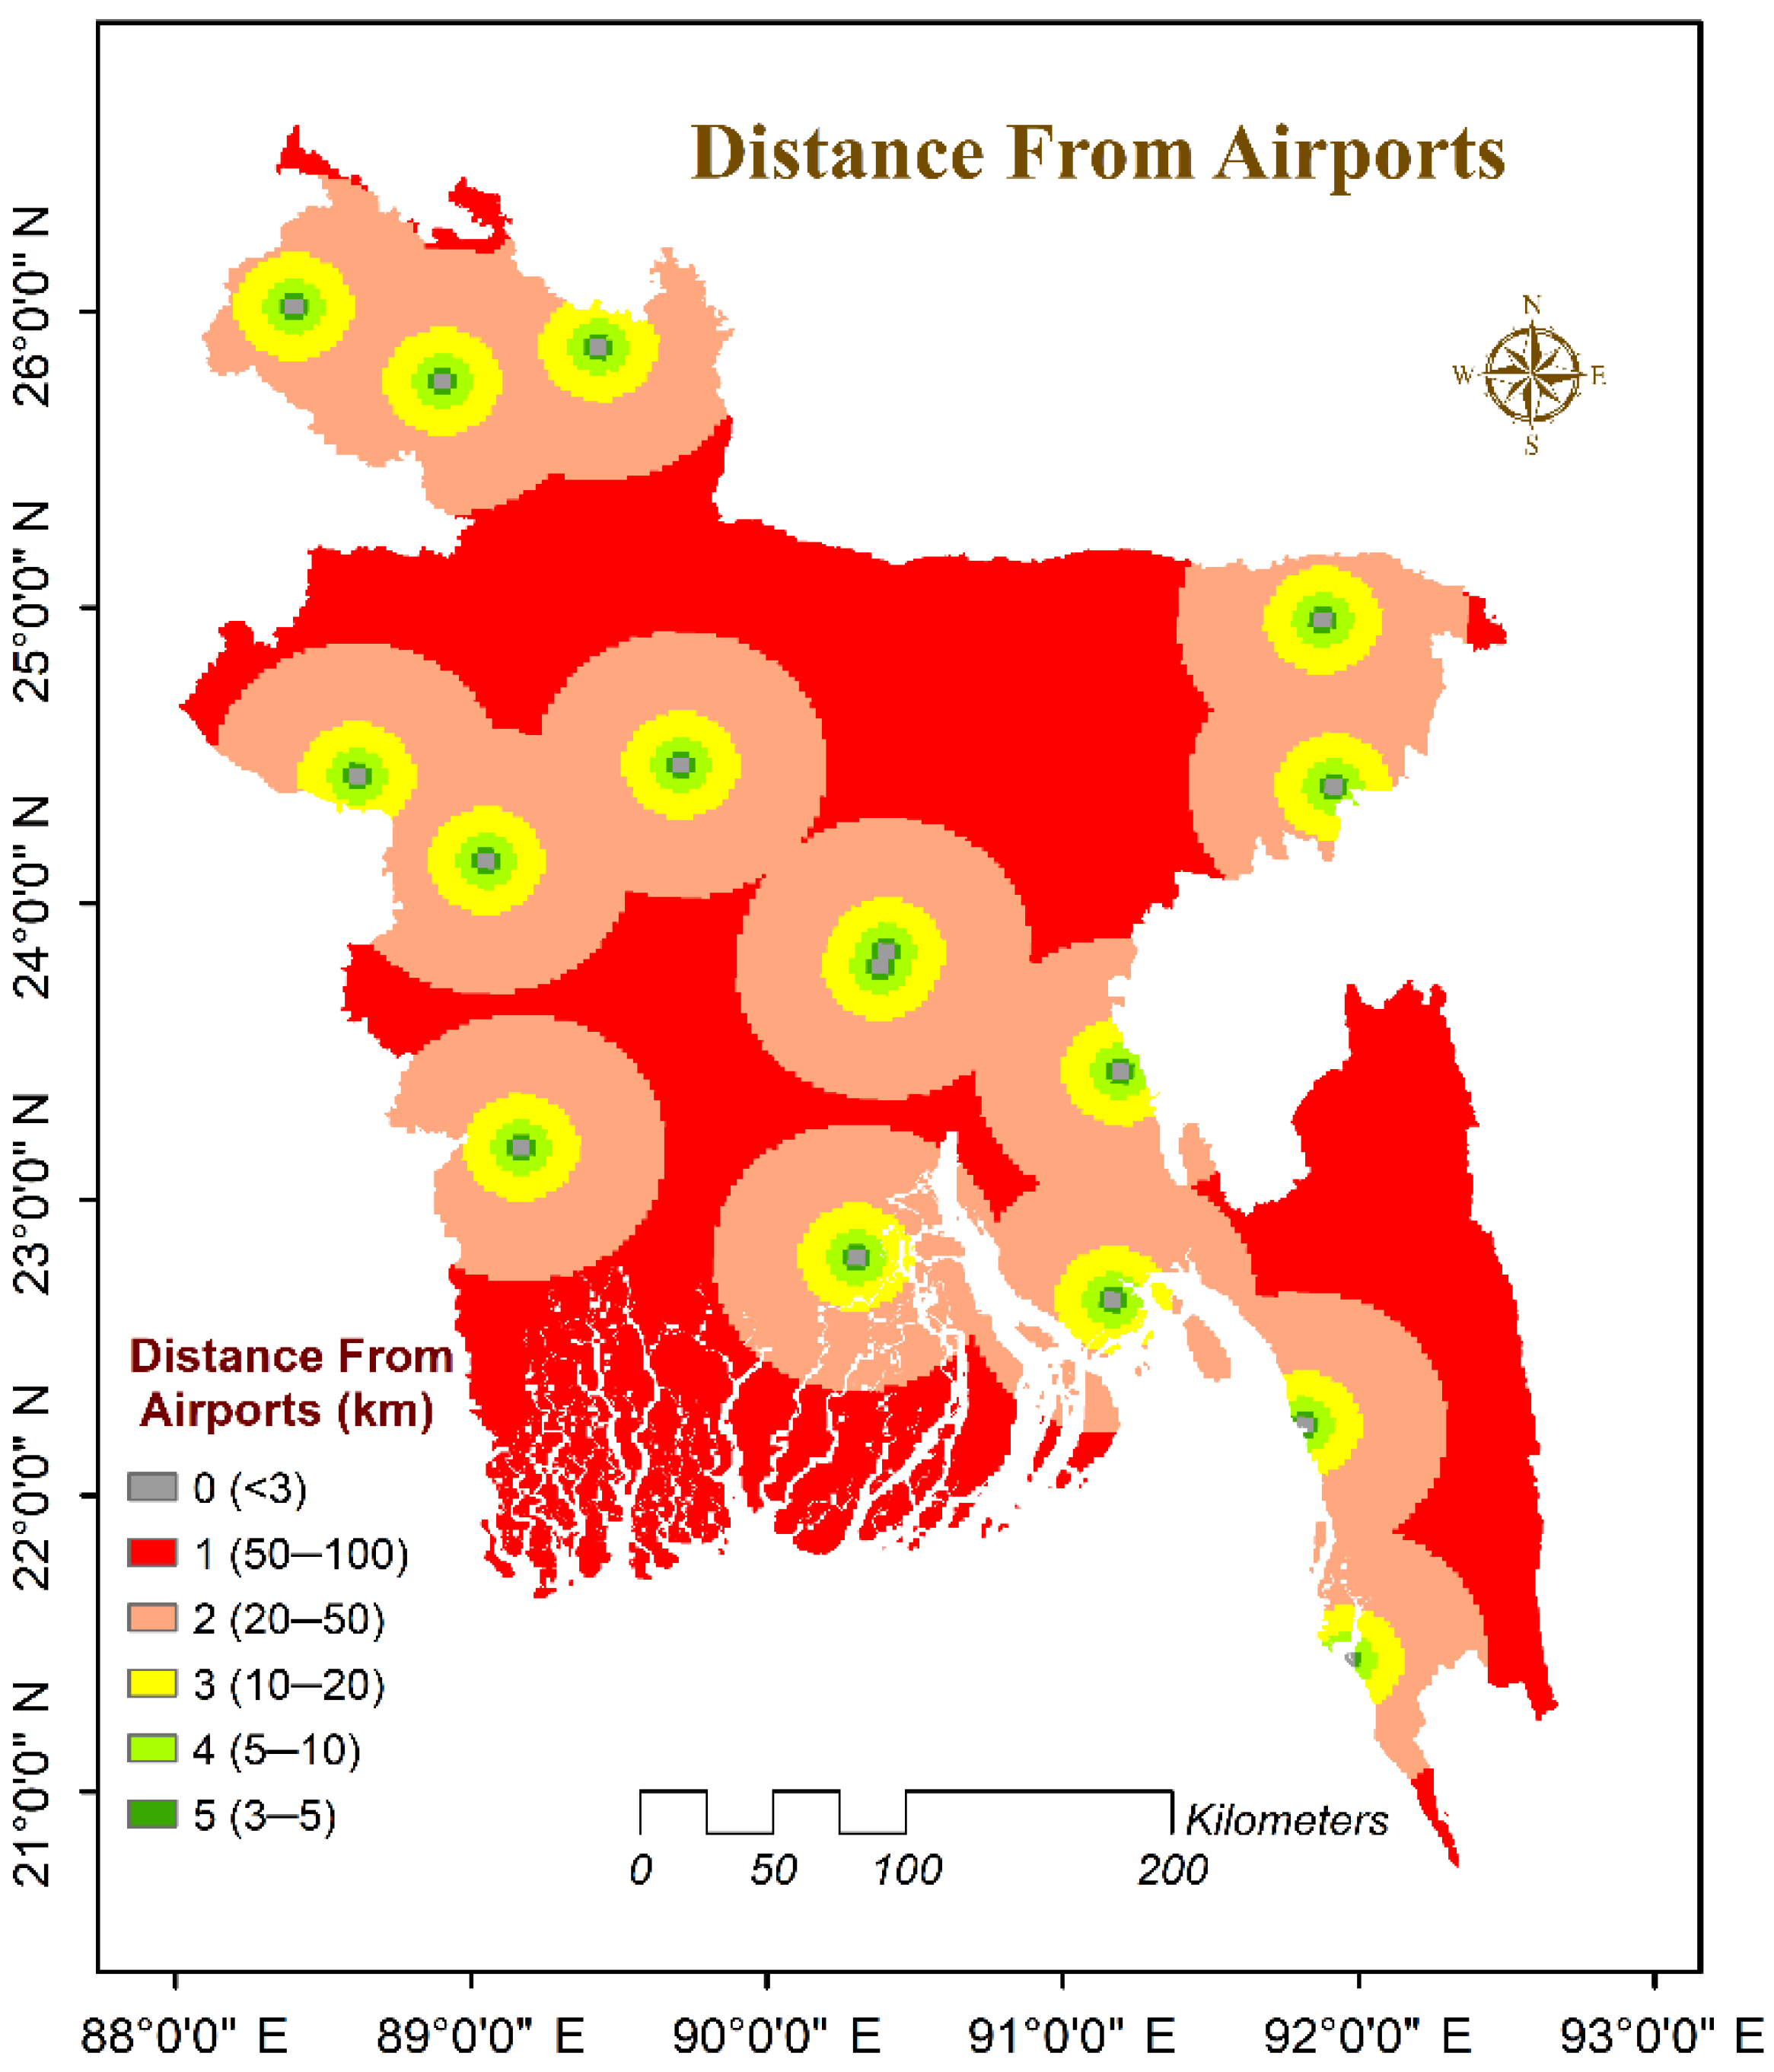
A proper distance from airports should be taken into consideration when installing wind turbines in order to avoid collisions. Airport communication and navigation systems can be disrupted by wind turbines. This study recommends a maximum distance of 3 km from major airports [18].

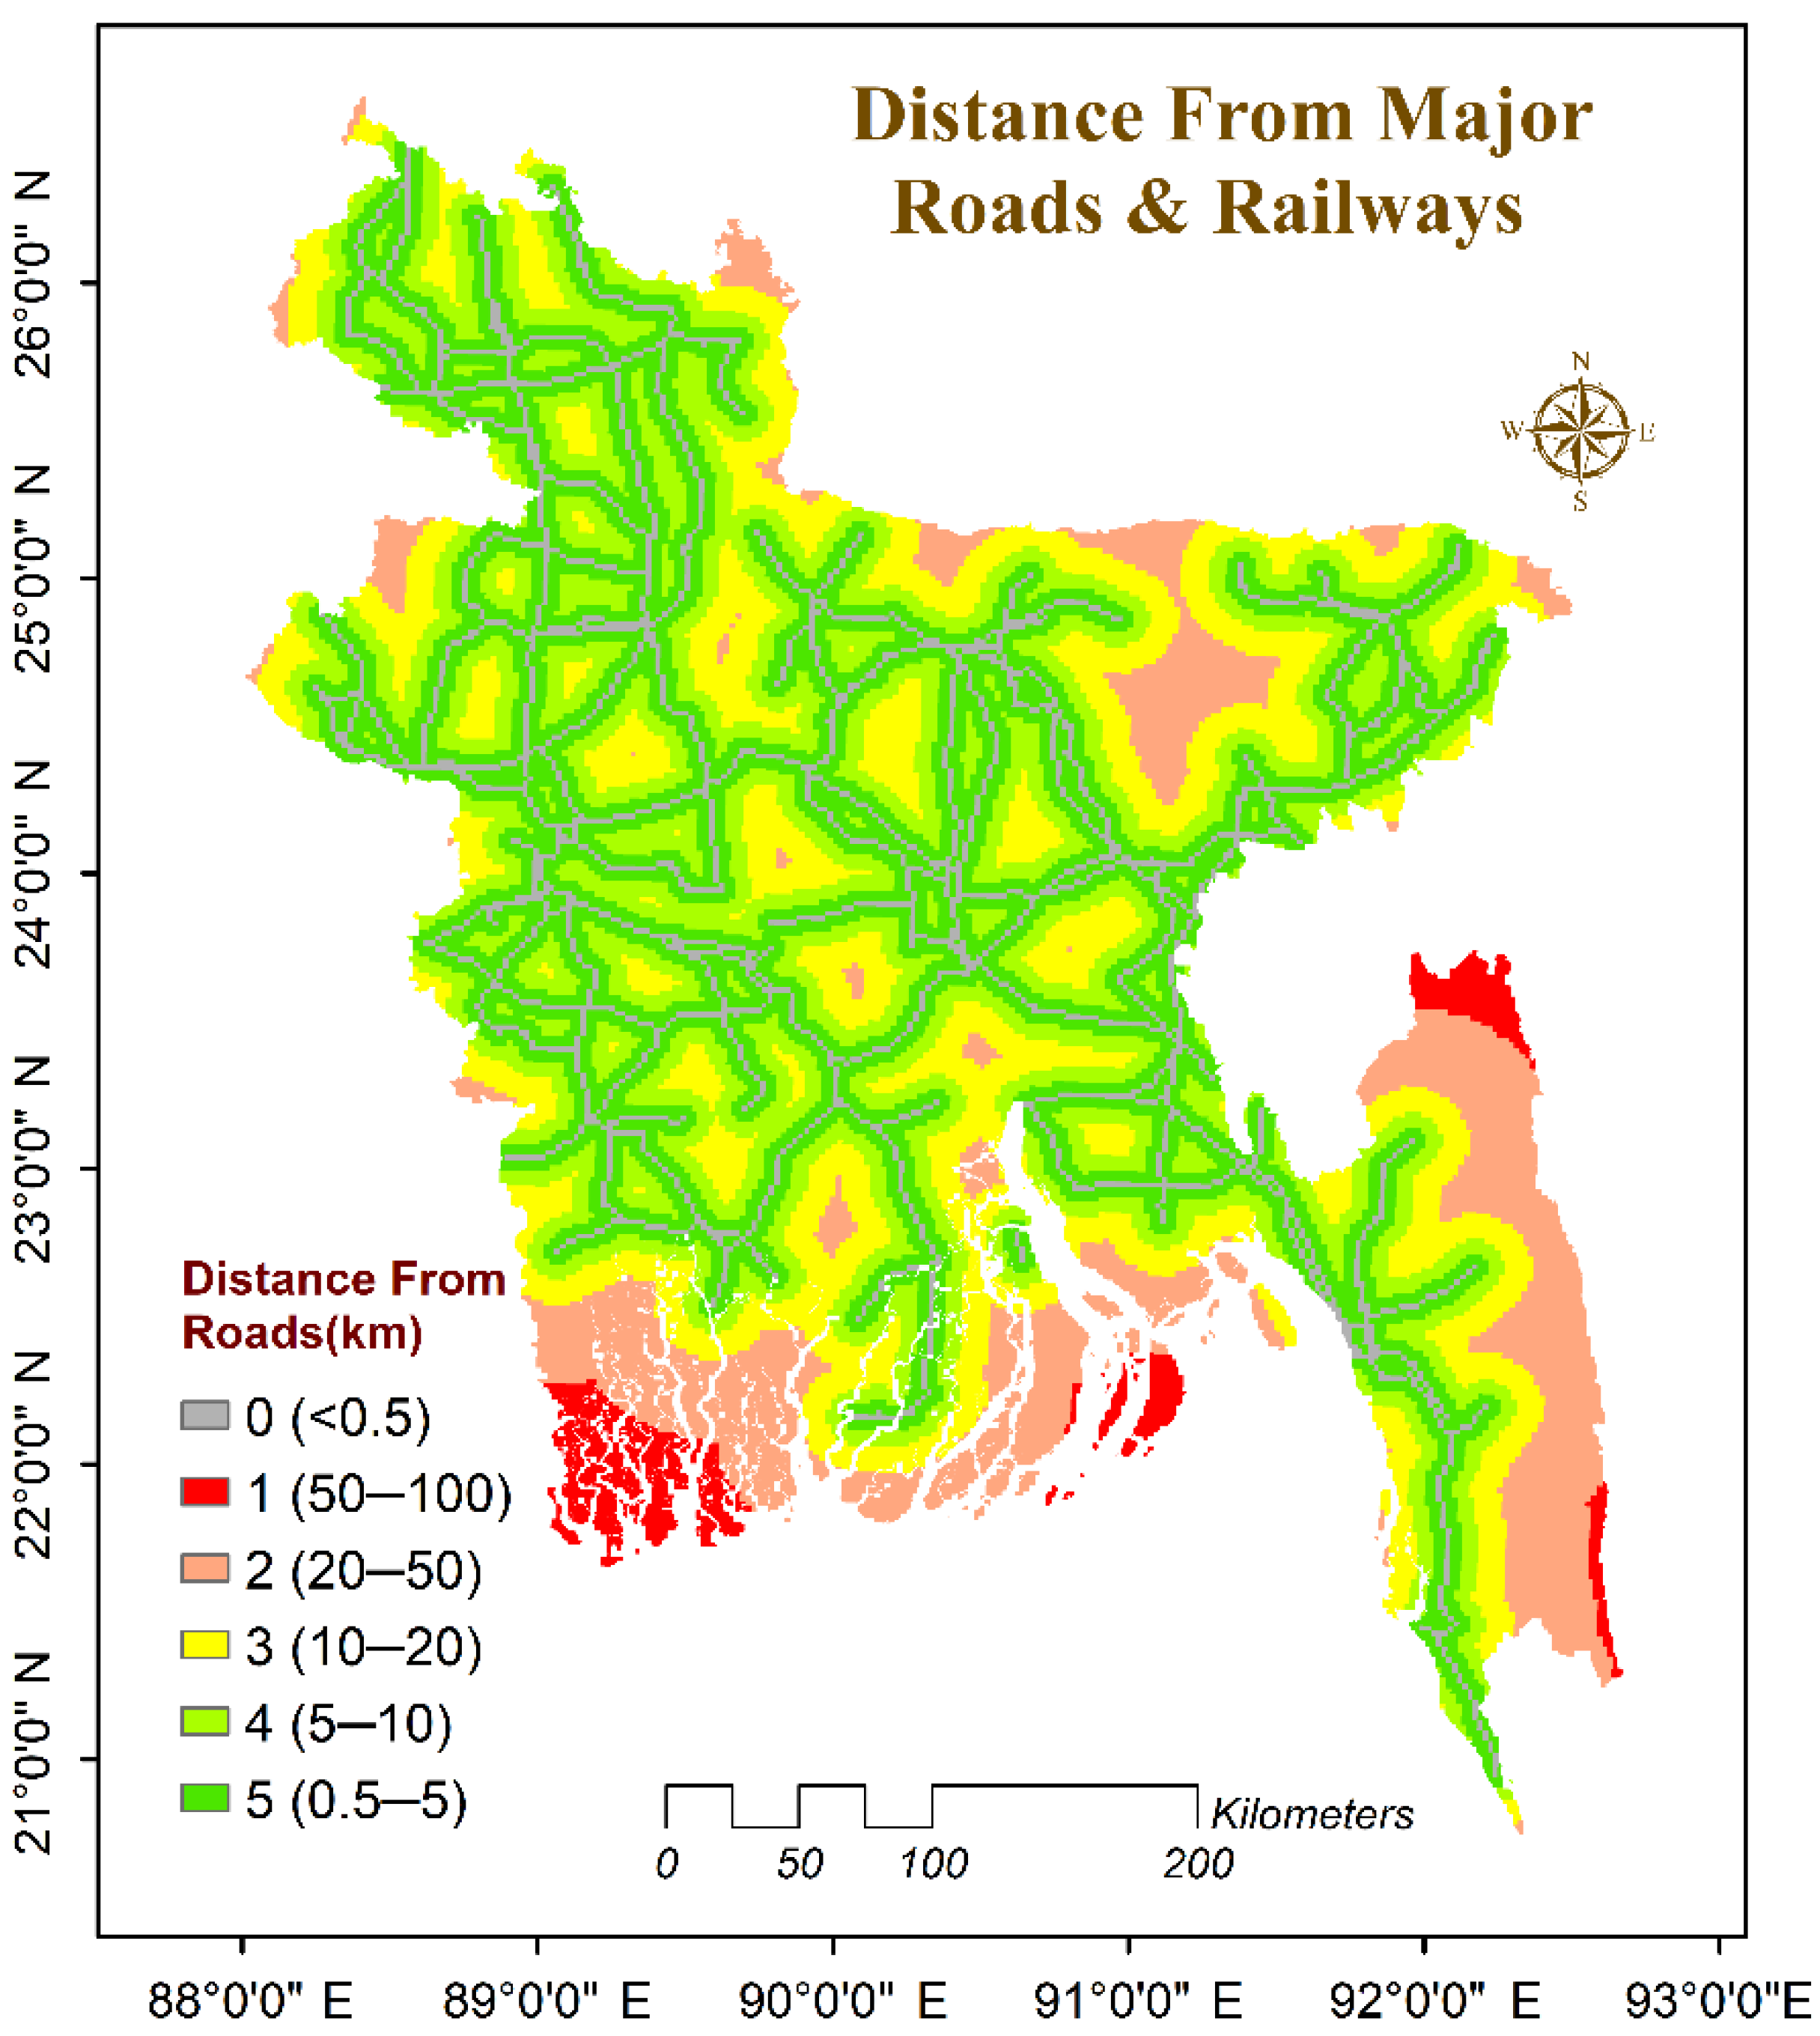
2.2.7. Distance from Major Roads and Railways

Ideally, wind farms should be located as close to major highways and railways as possible, in order to reduce transportation costs and make access easier for various employees, and second, to minimize multiple discomforts, such as the detrimental impact on road mobility due to loud noises and changes in the visual scene due to the rotation of the wind turbines caused by wind turbine operation, which affects road mobility [19]. Therefore, the minimum distance between this project and major roads and trains is 0.5 km [20].

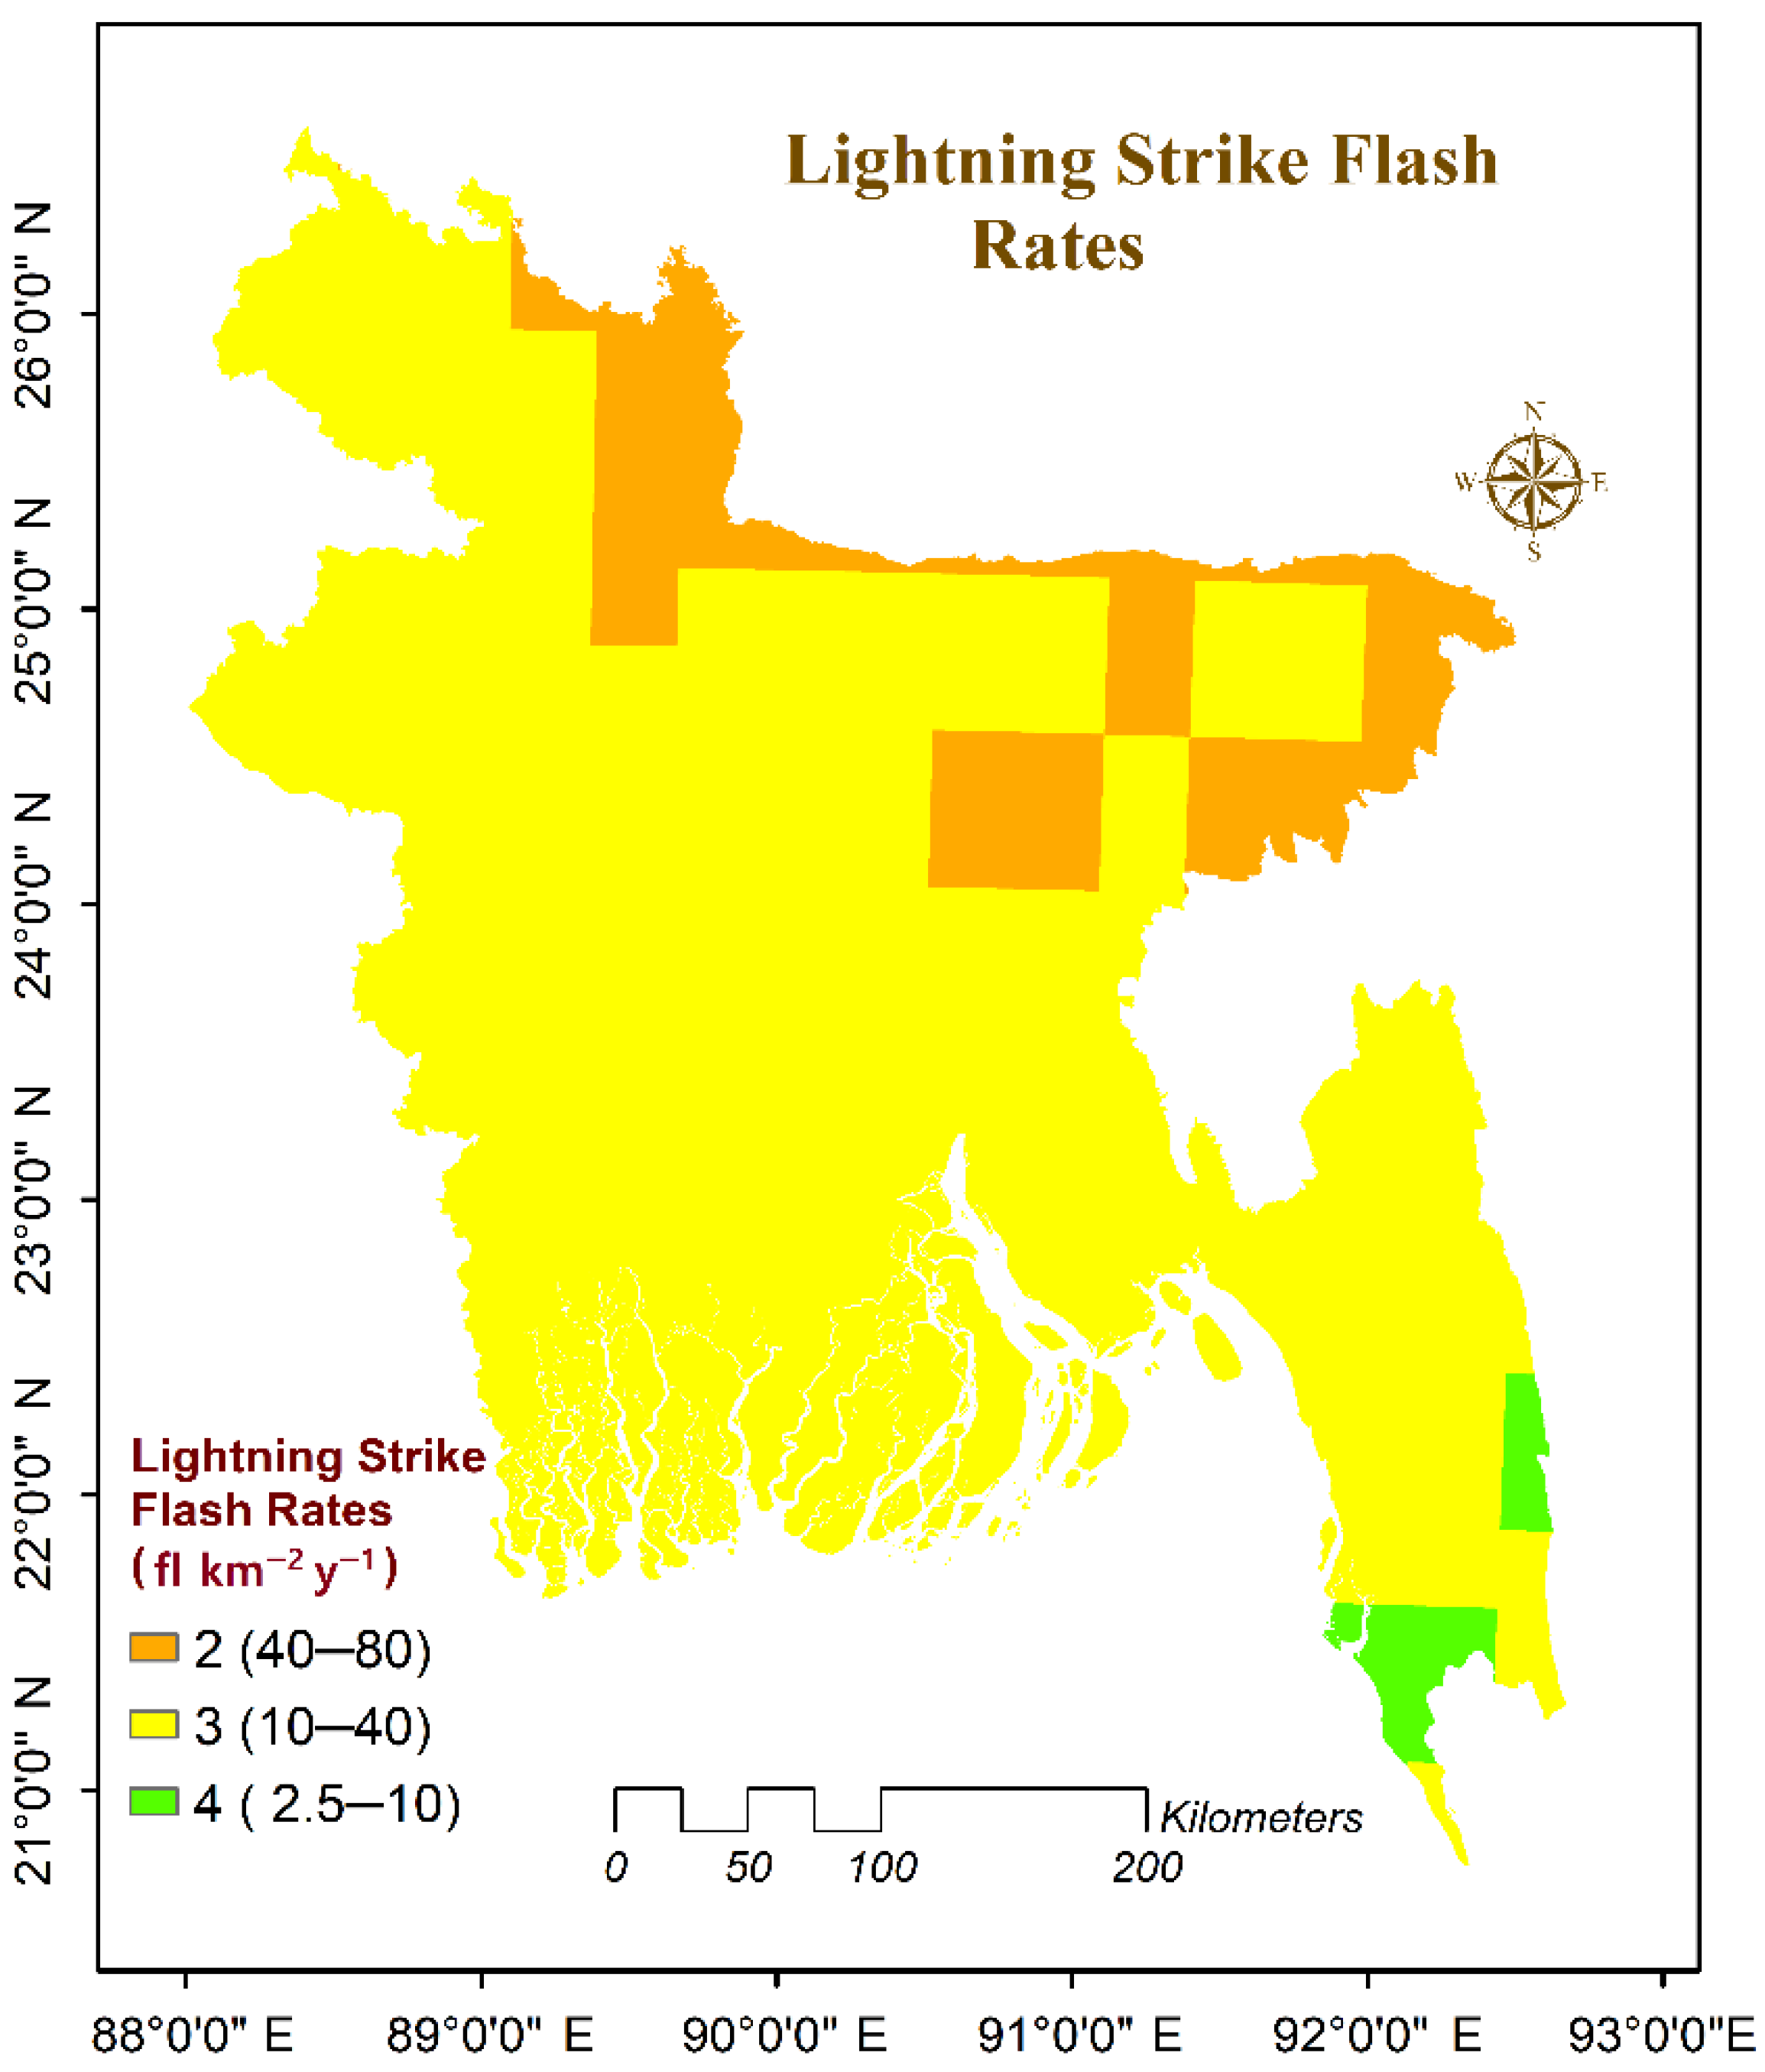
2.2.8. Lightning Strike Flash Rate

The lightning strike flash rate is considered a key factor in determining the best locations for wind farms’ sophisticated parts in terms of safety. Lightning strikes can cause problems for wind turbines, electrical equipment, and even for people who live near the struck body. Lightning strikes wind turbines because they are often located in high places and open areas, where the wind speeds are higher and the output power is greater. There is a large potential difference across the wind turbine sections when lightning strikes the blades of the turbines [21]. The body of the wind turbine as well as the electronic and control equipment could be severely damaged by this enormous potential. According to statistical data, lightning strikes involving wind turbines have been observed in certain countries, particularly during the winter months, resulting in wind turbine failures and long-term maintenance shutdowns. Therefore, to protect wind farms from unanticipated lightning-caused damage, it is necessary to avoid areas with a higher flash rate [22]. This study limits the annual strike rates to between 2.5 and 80 fl km−2 y−1, with no locations allowed to reach this level [23].

2.3. Multi-Criteria Decision-Making Using Analytical Hierarchy Process (AHP) Method

The Analytic Hierarchy Process (AHP) has garnered a significant amount of attention due to the fact that it is credited with having rigorous mathematical characteristics, and it has been utilized in a wide variety of fields [1]. Because of its capacity to solve problems involving the use of multiple criteria in decision-making, the AHP has been utilized by researchers from a wide range of fields in a number of different contexts. In order to get closer to optimal solutions, the AHP allows the users to set the specific weight of the influencing parameters in a multi-criteria decision-making problem. This allows the users to move closer to optimal solutions. The AHP method resolves any issue by employing a hierarchical model that is composed of goals, criteria, sub-criteria, and alternative solutions [24]. After the formation of the problem has been determined, the hierarchy can then be calculated. On the basis of the preference scale, a pairwise comparison matrix is constructed so that the criteria from one hierarchy level can be contrasted with the criteria from the next hierarchy level (Table 1) [25]. For a given number of entries, such as n-number, the pairwise comparison matrix will have n (n − 1)/2 comparisons.
In the AHP methodology, the weights of the criteria are applied to the problem-solving process depending on the pairwise comparison. In order to obtain the weights, the pairwise comparison matrix is first subjected to normalization. In order to perform this normalization, a “normalized pairwise comparison matrix” must first be constructed. This matrix is created by dividing the elements of each column of the matrix by the total of all of the columns. It is necessary to divide the total value of the row elements of the resulting matrix by the total number of row elements. As a result, a priority or weight vector is produced. The weights range from 0 to 1, with a sum of 1 for the matrix in full. When conducting pairwise comparisons of criteria using the AHP method, there is the potential for a certain amount of inconsistency to take place. As a consequence of this, it is necessary to assess the consistency of the logic behind pairwise comparisons. Saaty (1980) developed a consistency ratio in order to quantify the degree to which evaluations based on pairwise comparisons are consistent with one another [25]. Calculations are done to determine the consistency ratio for the pairwise comparison matrix. When the number of contradictions among the pairwise comparisons falls below a predetermined threshold, which is referred to as the consistency ratio, the matrix is said to be consistent. (CR = 0.1) [26]. Otherwise, the DMs’ ratings will need to be re-evaluated. Equation (1) can be used to calculate CR, where CI is the consistency index, m is the primary eigenvalue of the comparison matrix, and RI is the random index, which is dependent on the matrix size (n),which can be found in [24].
C R = C I R I , C I = λ m n n 1
Saaty proposes a “0.10” upper limit for this ratio. When the consistency ratio for the judgments is less than 0.10, it is presumed that the judgments are sufficiently consistent and the evaluation can continue. If the consistency ratio is more than 0.10, the judgments are considered inconsistent. In this instance, the quality of the decisions has to be enhanced. The consistency rate can be decreased by scrutinizing the judgments [26].
The suitability indices for wind farm installation sites were derived based on eight thematic layers integrated into the GIS platform to measure the site suitability indices. This was done by employing the weighted overlay method as pursued by Equation (2).
S I = w = 1 m 1 n W j × X i
Here, SI is the suitability index for wind farms’ sites, as well as Xi and Wj are the normalized weights of the ith feature and the jth class of the thematic layer, m represents the total number of themes, and n is the total number of classes in a theme.

2.4. GIS Processing

The present work is the first combined AHP-GIS spatial suitability analysis study for wind farm allocation in Bangladesh. As shown in Table 2, the suitability map was created with ArcGIS Desktop 10.8 and the geo-information data was obtained from publicly available online resources. This study employs eleven constraints, representing eight evaluation characteristics, to determine where wind farms are unsuitable and where they are optimal. According to Table 3 and Table 4, both groups of the geospatial analysis model’s parameters were determined using expert opinions, research region characteristics, and systematic review.

2.5. Preparing the Restraint Map and the Appropriate Area

According to the suggested method, the restriction maps define those places where it would be hard to build a wind farm. These maps were first made using ArcGIS software and the threshold and buffer values listed in Table 3. Several spatial analytic methods, such as classifying for wind speed, slope, height, urban area, highways, airports, TLs, and lightning strike, were used to make individual maps of restrictions. Then, using technologies called “overlays”, different restriction maps were put together to make the restricted Map.

2.6. Preparing the Standardized Suitability Maps

GIS software was used to create a categorized map for each criterion in the suitability map. The maps that emerge show the evaluated criteria as well as their rankings. As shown in Table 4, each map was gathered, processed in a raster format with a cell size of 30 m × 30 m, and then categorized. A classified map has been generated for every criterion. Using the required ranges from Table 4, the wind speed map was generated in ArcMap by reclassifying the existing wind speed map. The criteria for slope and elevation were also based on the digital elevation model (DEM). The slope map is created with the “Slope” tool in ArcGIS. The map is then reclassified using the classification tool. The elevation map has also been classified based on the ranking of the elevation criteria. In addition, for the total flash density Map, the ArcMap10.8′s reclassification tool was used to generate a distribution map of lightning strike levels in Bangladesh. The map is resampled to a resolution of 30 m, and the reclassification procedure is executed according to the ranges selected in 
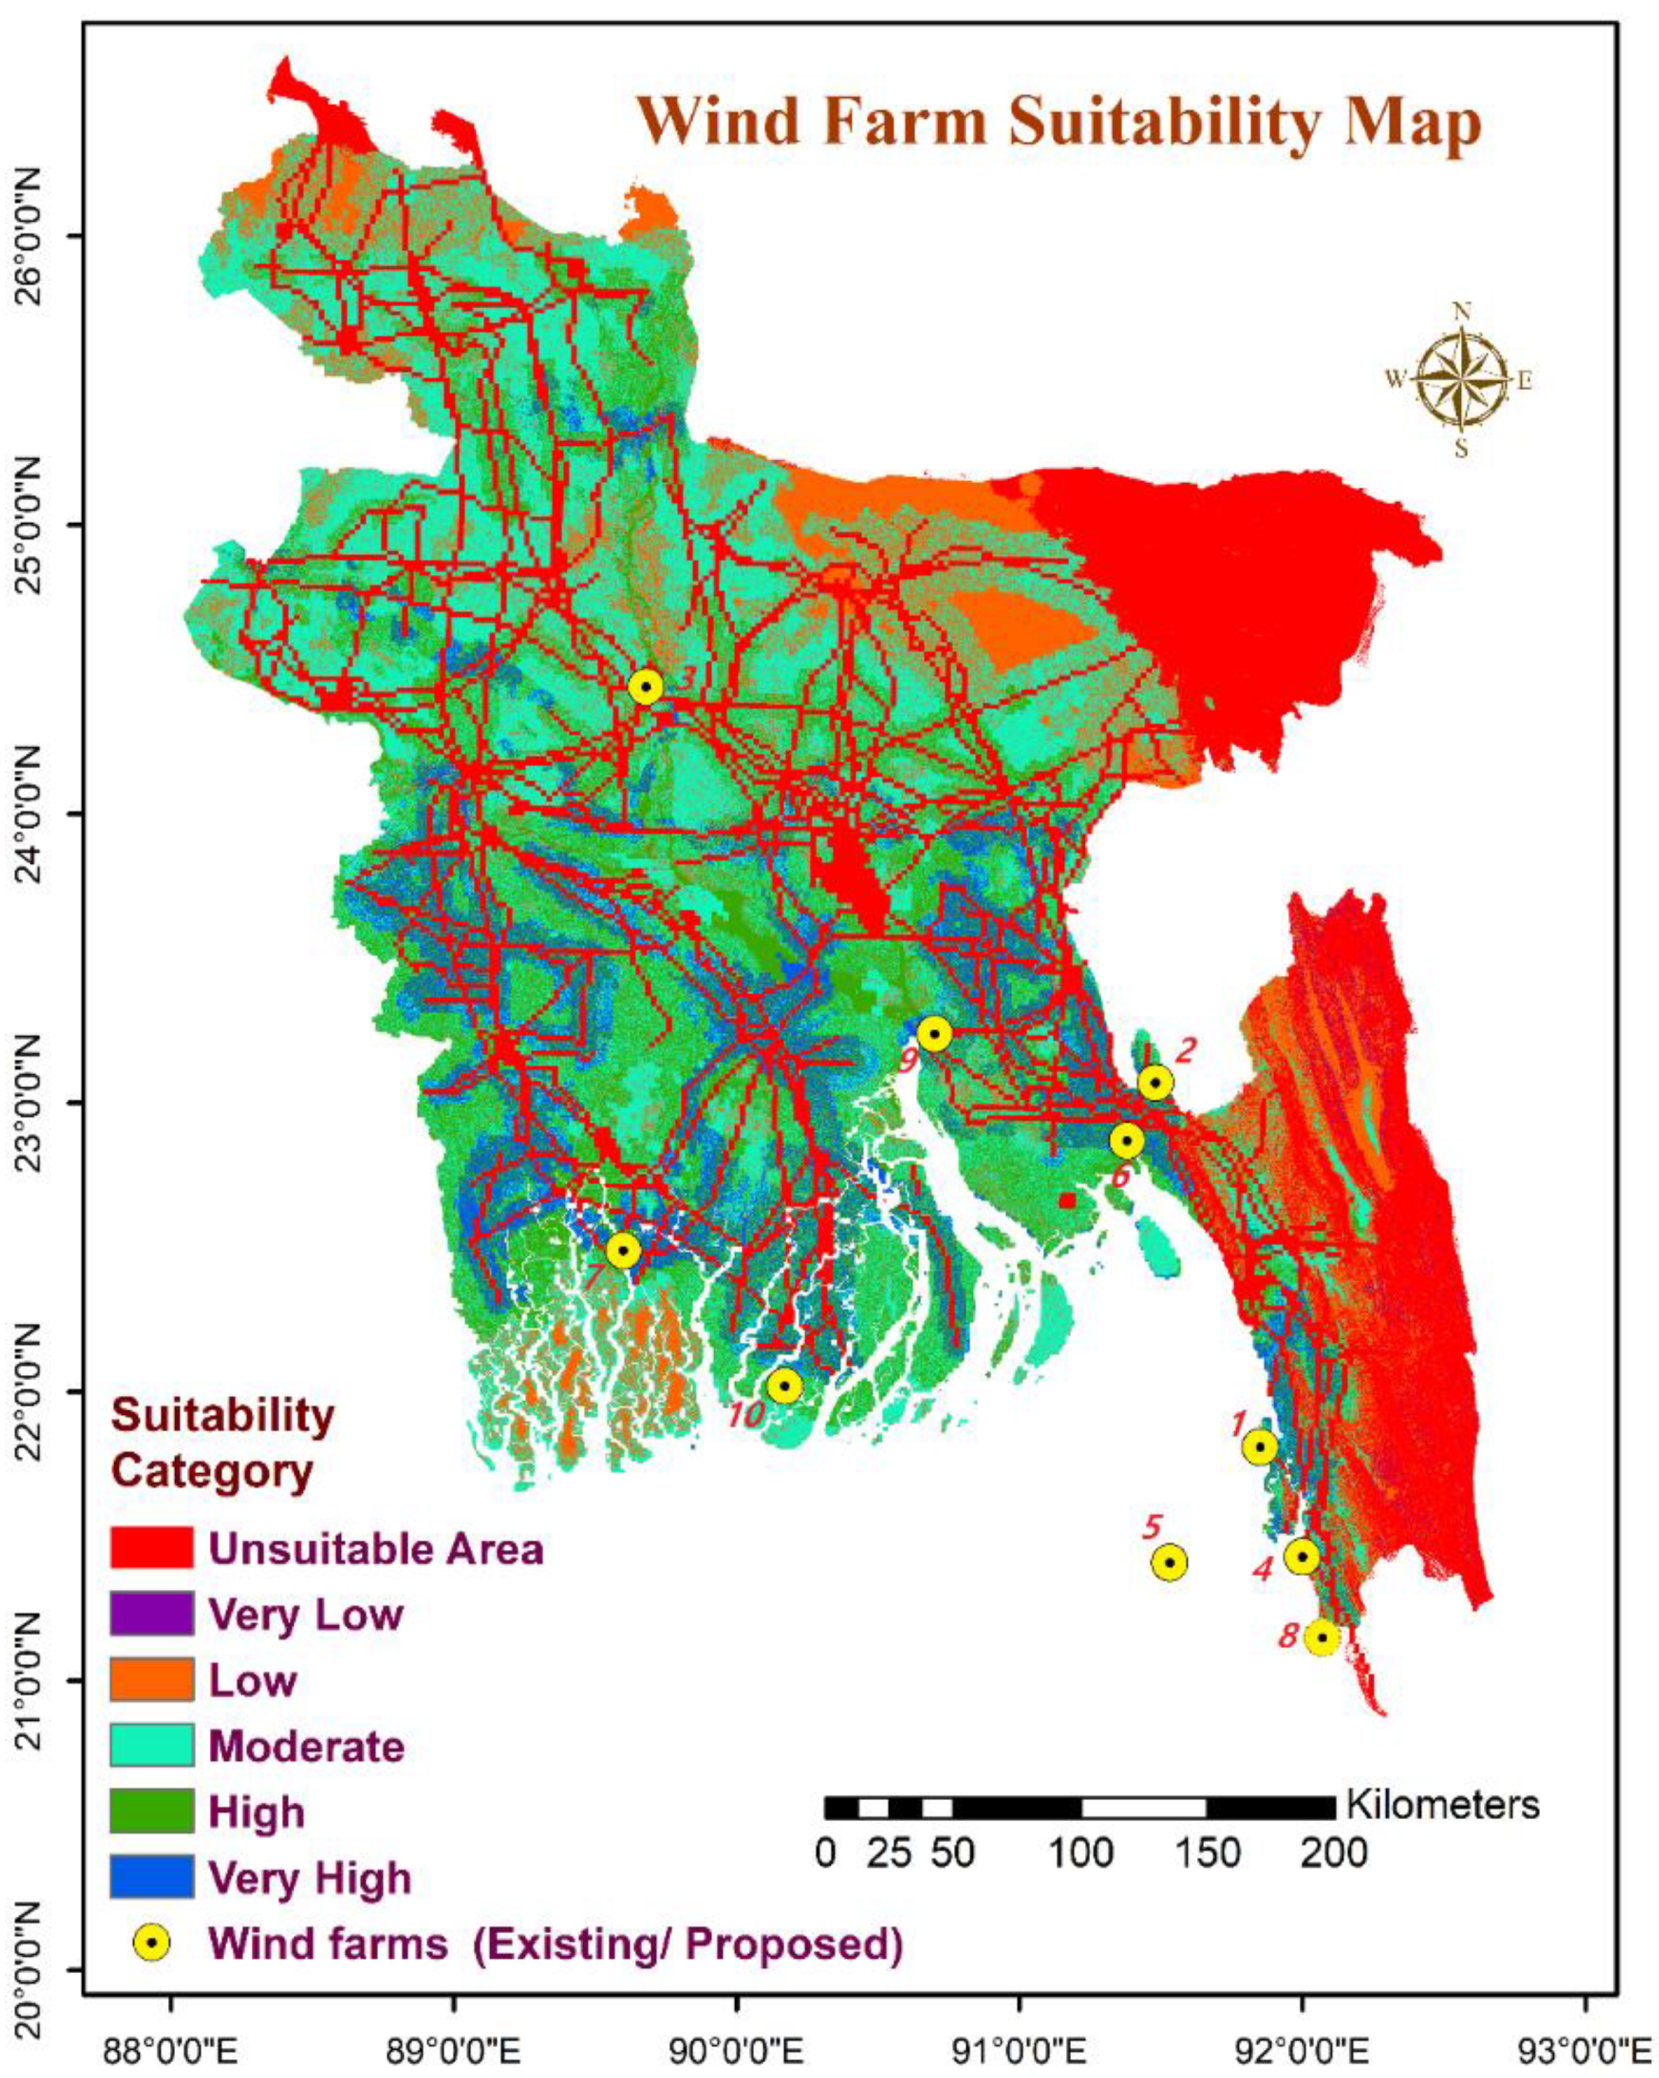
Table 4. In addition, a vector map of the city was used to create a classified distance map from urban areas, and the “Euclidean distance” tool was used to calculate the various distances. Using the digitized maps, the Euclidean distance tool was used to calculate the distance from the road network and from the power transmission lines. Then, using the spatial analyst tool Map Algebra, reclassification suitability maps of evaluation factors were generated. The last step involved conducting weighted overlay analysis. Using the “Weighted Overlay” technique, each suitability evaluation map was assigned a specific weight based on AHP results, and multiple reclassified geographic raster data layers were blended to produce the final suitability score for the study. There are five categories of suitability: very high, high, moderate, low, and very low.

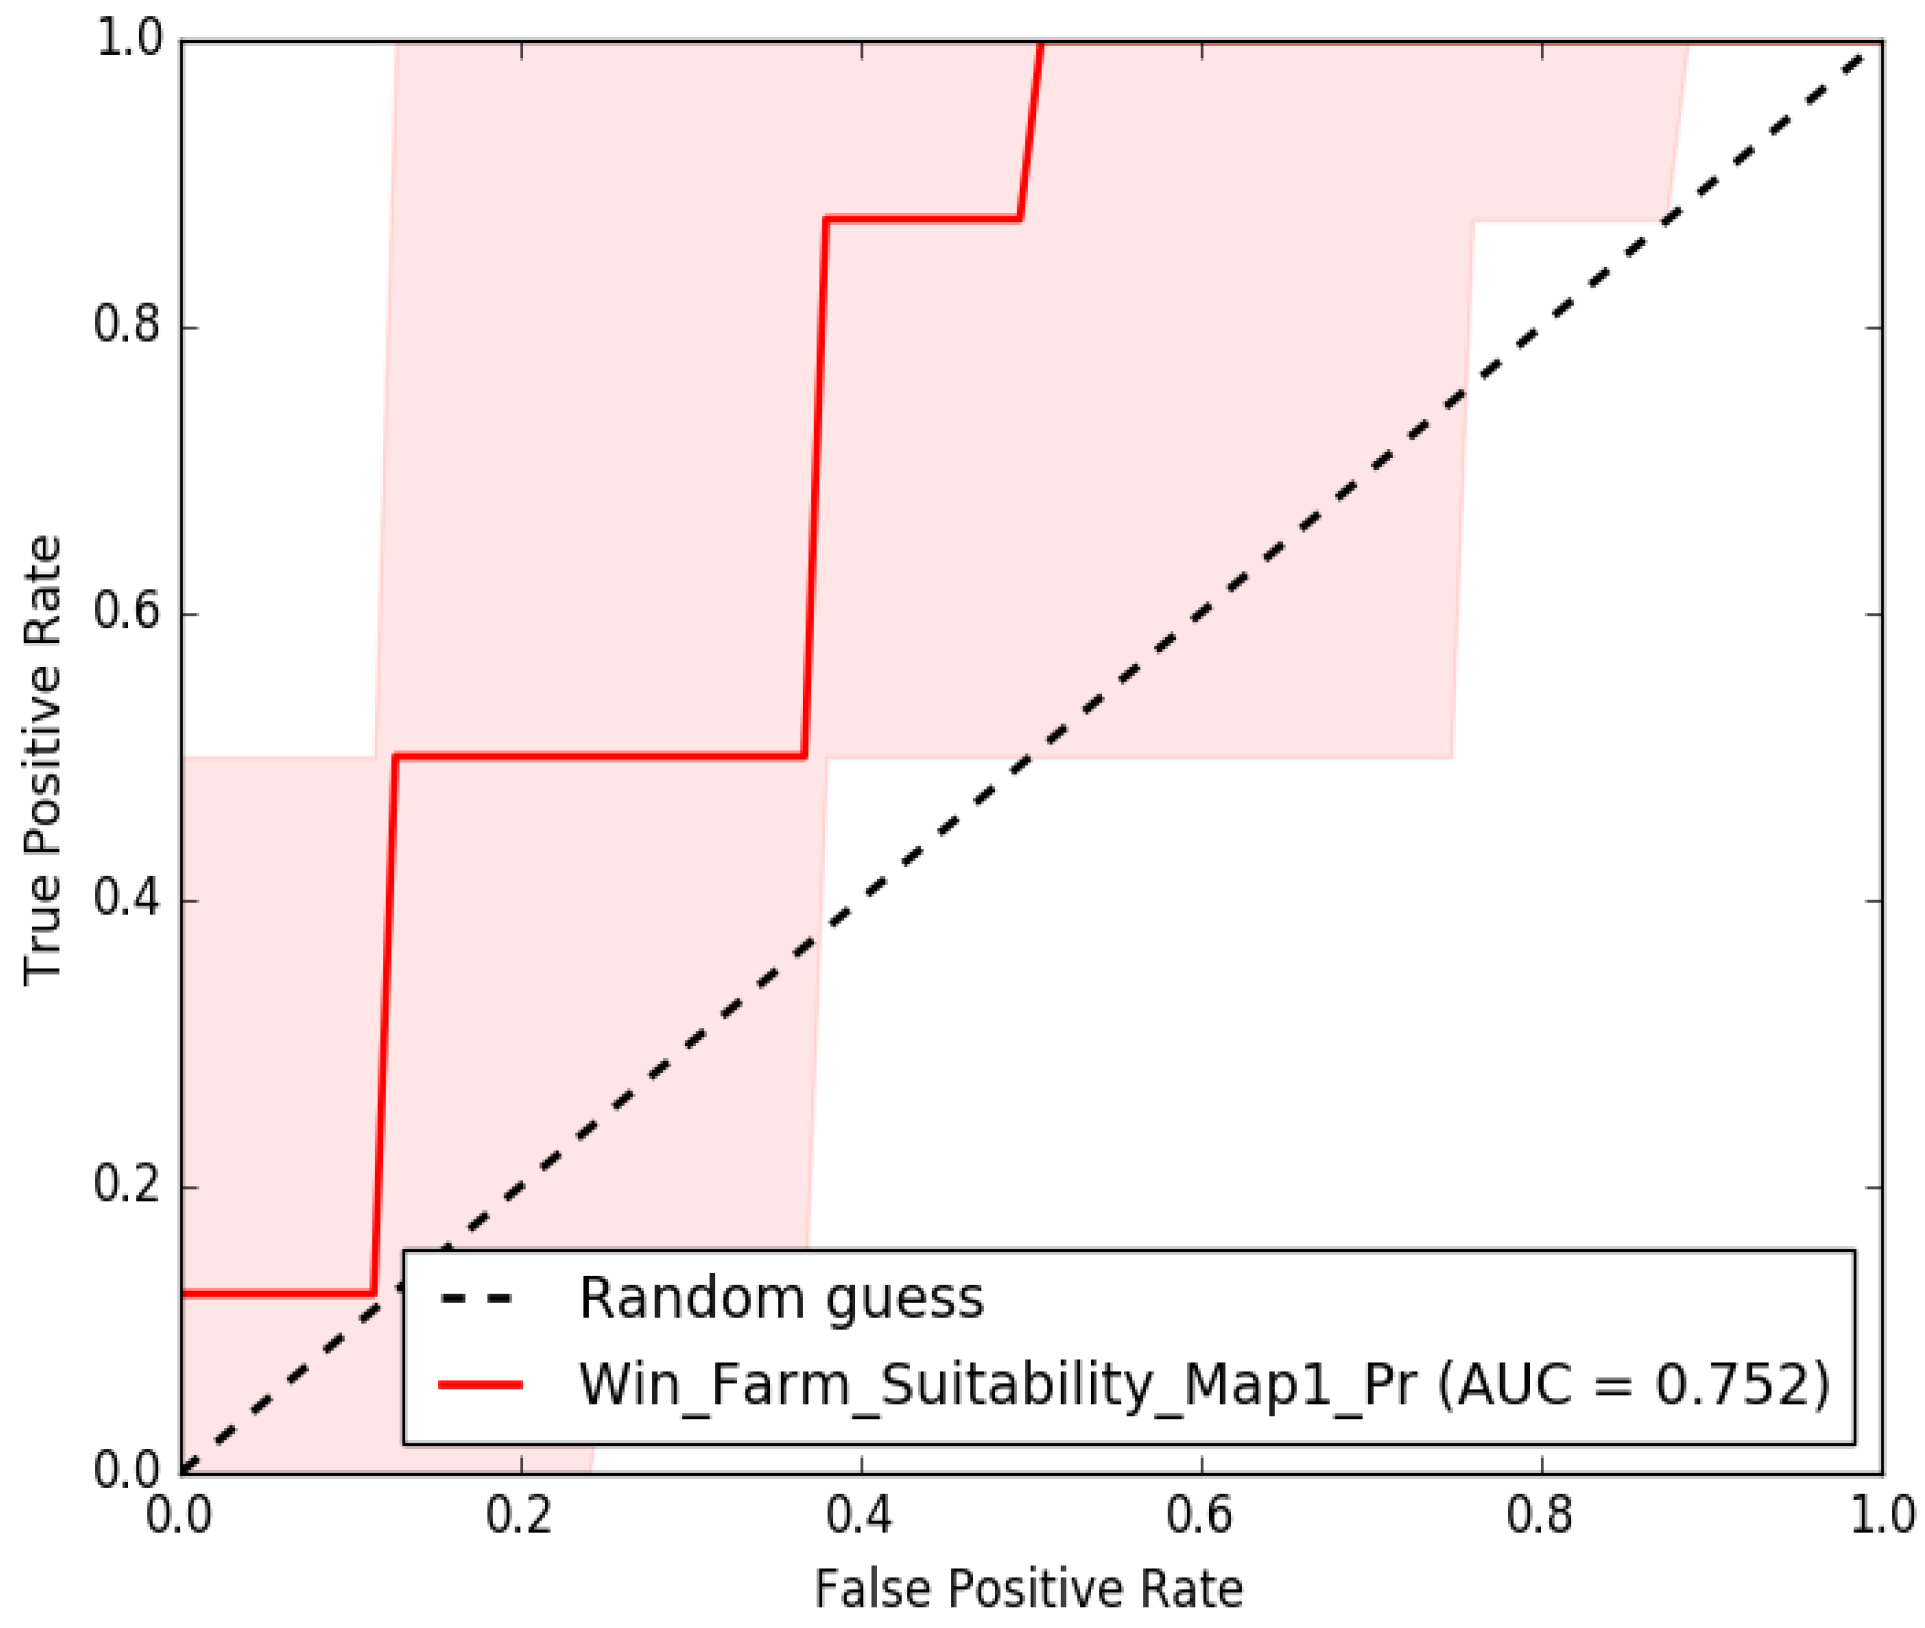
2.7. Model Validation Process

The sustainable and renewable energy development authority (SREDA), which falls under the ministry of power, energy, and mineral resources, has taken the initiative to install wind farms in several suitable locations throughout Bangladesh in order to harvest wind energy for the purposes of ensuring energy security and reducing carbon emissions. To this end, SREDA is installing a total of ten wind energy projects across the nation, of which two have been completed and are operational and eight are currently under construction. Bangladesh’s wind farm locations were compared to the findings of this study, i.e., the wind farm site suitability map, in order to verify the model’s ability to identify the best locations for wind farms. We have taken into account the project’s location in terms of “observed data.” Wind farm location models were compared to actual field data to see how well they performed in identifying suitable locations. There are two methods used to measure model performance in terms of numeric value: receiver operating characteristic curve (ROC) and area under the curve (AUC). To evaluate the performance of classification models, the ROC and AUC are commonly used. An actual wind farm project’s location and a suitability map layer were used in this method to classify wind farm locations. When evaluating the model’s performance, the AUC value (see Table 5) is typically used.

3. Results and Discussion

The outcomes of an AHP-GIS-based spatial analysis of wind energy system sites in Bangladesh are presented and extensively discussed. This includes the numerical values for the optimal evaluation weighting as well as the final map of site suitability.

3.1. AHP Results

In this study, the AHP-based MCDM process was used to determine the optimal weights of the eight criteria that influence factors (C1: wind speed; C2: slope; C3: elevation; C4: distance from TLs and PPs; C5: proximity to cities; C6: distance from roads and railways; C7: proximity to airports; C8: lightning strike flash rate). It was determined that the criteria factor C1 had the highest priority weight (32%) when it came to selecting the most suitable areas in the research area for the construction of wind farms. The remaining criteria factors are C2 through C8, and the priority weight of each of these criteria is decreasing (Table 6). According to the findings of this study, the consistency ratio was determined to be CR = 0.075, which is lower than 0.10.

3.2. Land Suitability Mapping Results

3.2.1. Wind Speed

Wind speed has great influences in selecting the plausible wind farm location as it determines whether a farm will be sustainable in the operation phase. Stronger winds allow the blades to rotate more quickly, thus they produce more electricity. However, the wind speed evaluation criteria were utilized here to determine the level of suitability of Bangladeshi land for the installation of wind farms. According to the boundary values listed in Table 4, land categories were presented in six degrees (very high, high, moderate, low, very low, and inappropriate) based on statistical data and the value’s frequency. Approximately 64.42% of the land area is suitable for wind farm development, as illustrated by the wind speed map in Figure 3. 0.01% of the land area experiences extremely high wind speeds, 0.59% experiences high wind speeds, and 40.85% experiences moderate wind speeds (4–5 m s−1).

3.2.2. Slope

Amongst the geographical features the most crucial is the land slope that evaluates the feasibility of the wind farms’ site from the point of construction costs. The installation of the wind farm on the steep slopes results in a higher construction cost. In addition, the land slope is taken into consideration to be significant due to the fact that it has the potential to hasten the wind speed due to the Venturi effect. Figure 4 is a slope map that demonstrates how nearly all of the land in Bangladesh, which accounts for 46.44 percent of the country’s total land area, is extremely well suited for the establishment of wind farms.

3.2.3. Distance from Transmission Lines (TL)

Another crucial element that must be taken into account is the distance between the possible wind farm site and the transmission lines because it directly affects both the construction and operation of a plant. All current and planned transmission lines have been considered in this analysis to determine the most appropriate course of action in this regard. According to the map of the distance from the TLs in Figure 5, the majority of the land area, which accounts for 58.31%, is situated in close proximity to the TLs that make up the national grid. In addition, the distance from urban areas is depicted on the map in Figure 6, which reveals that 2.84% of the land area is located between 1 and 5 km away from large cities or urban areas, while 5.88% of the land area is located between 5 and 10 km away, indicating that these are the ideal locations for wind farms.

3.2.4. Distance from Urban Areas

Depending on how far away the wind farms are, noises of different decibel levels are produced, some of which city inhabitants find objectionable. High levels of noise are produced when the wind turbine is whirling. Because of these factors, living conditions can improve with distance from the turbines. A major portion of the territory is, however, situated more than 20 km from a major city. An excellent prospect for the development of wind energy exists in this area. This region presents an excellent opportunity for wind energy development.
Figure 6. Map of the suitability categories based on distance from major cities.
Sustainability 14 14819 g006

3.2.5. Distance from Airports

The aviation infrastructure has a significant impact on both wind farm construction and operation. The aircraft’s operations during takeoff and landing have a negative impact on the wind farms. From a variety of perspectives, researchers examine the distance from airports. Some argue that wind farms can be built and maintained more easily and cost-effectively if they are located far from airports. Some researchers, on the other hand, believe that wind farms will impede air traffic control and air cargo security by creating permanent barriers in navigation, communication, and transmission systems. However, the map of the distance from the airport has been presented in Figure 7.

3.2.6. Distance from Roads and Railways

The distance of the wind farm from the major roads and railways has a significant impact on the building and operation of wind farms. If the wind turbines are positioned too near busy highways and railway tracks, an unanticipated accident may occur. However, if they are placed a great distance away, the initial investment would be higher. Here, the map of connectivity to roads and railroads is shown in Figure 8. This map reveals that 29.42% of the land area is located 0.5–5 km away from roads and trains, making it a potential location for wind farms. In addition, approximately 25.40% of the land area is situated 5–20 km away from roads and trains, making it suitable for investments in wind energy. In contrast, 24.15% of the land area is regarded as less favorable or unsuitable for the establishment of wind farms.

3.2.7. Elevation

Land elevation, also known as land form, is the vertical height of a point measured above mean sea level. This is an additional important factor that has a significant influence on the placement of wind farms. The higher the elevation, the more costs will be added in the construction stages of wind farms. In the higher elevated areas, extra care should be taken to develop the wind firm site. Figure 9 shows that more than 99% of the land is good for building wind farms because the elevation is less than 0.5 km. It has been determined that the hilly portion of the land, which has an elevation of more than one kilometer, is not an area that would be appropriate for wind farm locations.

3.2.8. Lightning Strike Flash Rates

A lightning strike is considered the most destructive factor that can drastically alter the operational system into a dead lock of the wind farm. Since the wind turbines are categorized as tall installations, they are greatly susceptible to experiencing immediate damage if they are struck by lightning. Figure 10 shows that the northern part of the country, which accounts for 1.92 percent of the total land area, has the most lightning strikes each year. The middle section of the country, which accounts for 84.81%of the total land area, has fewer lightning strikes. Because of this, the middle section and the area in the southeast are thought to be somewhat good places to build wind farms.

3.3. Wind Farm Suitability Categories

As depicted in Figure 11, the output is a wind farm location suitability map. Table 7 also contains the numerical results for each appropriateness class, as well as the percentages of the total area for each class. According to the results, 7.97% (10,629.23 km2) of the investigated land has a very high suitability, 16.15% (21,516.68 km2) has a high suitability, 31.40% (41,835.56 km2) has a moderate suitability, 13.57% (18,081.50 km2) has a low suitability, 0.22% (294.67 km2) has a very low suitability, and 23.74 percent (35,033.12 km2) is unsuitable. The high and suitable locations, which account for 24.12% of land, would be considered candidate zones for wind energy projects, necessitating investment development and policies in these regions. According to the suitability map, the land’s most favorable regions are located in the western and central southern regions. In addition, coastal regions are believed to be ideal for the construction of wind farms. These regions are particularly suitable because they share a number of characteristics that make wind farms possible, such as ideal land slope and elevation, high wind activity, proximity to grid TLs and northern airports, isolation from urban and rural areas, and low lightning strike exposure.

3.4. Validation and Comparison

The SREDA is currently engaged in ten wind farm projects in Bangladesh, the locations of which are depicted in Table 8. However, in order to assess the viability of the current study, the locations of these projects have been superimposed on the suitability map, which is the result of this study. It was discovered that two projects whose construction is already complete and in operation are located in very high and high suitability areas, while two projects that are still under construction are located in moderate and high suitability areas. One of the remaining six projects for which feasibility studies have been completed and for which construction will soon commence is located in a very high suitability area, while another is located in a high suitability area, and the remaining four projects are located in areas with moderate suitability. In addition to this qualitative performance evaluation technique, the ROC and AUC tools were employed to quantify the statistical validity of this study. As the AUC value is determined to be 0.75 in Figure 12, it is determined that the performance of this study in selecting suitable sites for wind farms is satisfactory (Table 5).

4. Conclusions

This study introduced a GIS and AHP-based platform for identifying suitable sites for wind farms in Bangladesh. Before proceeding with the installation of the energy-generation systems, it is strongly advised to select the best possible location for wind farms, despite the complexity involved in locating a suitable location. The MCDM method efficiently resolves complex decision-making issues by utilizing the GIS platform. In this study, decision-supporting parameters were evaluated using prior research results and expert opinion. AHP was used to determine the weight and significance of the selected criteria for the decision to provide support. The final wind farm suitability map was generated by superimposing all the AHP-determined weight-based raster criteria layers.
According to this research, Bangladesh has a great opportunity to utilize wind energy from its vast area. Rather than being concentrated in a single area, the “very high” suitable areas are found to be scattered across the country. That opens the door for every region to move toward green energy by putting up utility-scale wind farms. Investment in roads and transmission lines will be significantly reduced because of wind farm suitability locations’ dispersed nature. Consequently, initial costs will be lower. As a result of this research, a viable path to removing Bangladesh’s complex renewable energy decision-making process has been discovered. This work will serve as a solid foundation for renewable energy exploration, although in this research, optimal site selection for wind farm installation, several important criteria related to the geological features of the study area upon which site selection substantially depends have not been taken into account. These features are, for example, the bearing capacity of rock and soil layers (soft soil layers, liquefaction layers), geological structure (distribution of surrounding faults or fractures), geo-hazards (landslides, debris flows, rock falls, collapses, soil caves, and karst caves), and groundwater corrosiveness. They are all crucial indicators and certainly define the degree of complexity in site development and construction of the proposed wind farms, as well as post-construction survival certainty and safety. Hence, this study recommends further study, taking into account the detailed geological characteristics. Finally, to aid Bangladesh’s efforts to reduce carbon emissions, the findings of the current state of the art may persuade stakeholders to invest in the energy sector with greater certainty.

Author Contributions

Conceptualization, M.R.I. (Md Rabiul Islam); methodology, M.R.I. (Md Rakibul Islam); software, M.R.I. (Md Rakibul Islam); validation, M.R.I. (Md Rabiul Islam) and M.R.I. (Md Rakibul Islam); formal analysis, M.R.I. (Md Rabiul Islam) investigation, M.R.I. (Md Rabiul Islam); resources, H.M.I.; data curation, M.R.I. (Md Rakibul Islam); writing—original draft preparation, M.R.I. (Md Rabiul Islam); writing—review and editing, H.M.I.; visualization, M.R.I. (Md Rakibul Islam); supervision, M.R.I. (Md Rabiul Islam); project administration, H.M.I.; funding acquisition, M.R.I. (Md Rabiul Islam). All authors have read and agreed to the published version of the manuscript.

Funding

This study was entirely supported by the Institute of Water and Environment at the Dhaka University of Engineering & Technology, Gazipur. However, no notable, direct financial assistance was given to this study by any organization.

Institutional Review Board Statement

Not applicable.

Informed Consent Statement

Not applicable.

Data Availability Statement

Not applicable.

Acknowledgments

The authors are grateful to the individuals and organizations that provided data and/or technical assistance in order to complete the research.

Conflicts of Interest

The authors declare no conflict of interest.

References

  1. Noorollahi, Y.; Yousefi, H.; Mohammadi, M. Multi-criteria decision support system for wind farm site selection using GIS. Sustain. Energy Technol. Assess. 2016, 13, 38–50. [Google Scholar] [CrossRef]
  2. Jangid, J.; Bera, A.K.; Joseph, M.; Singh, V.; Singh, T.; Pradhan, B.; Das, S. Potential zones identification for harvesting wind energy resources in desert region of India–a multi criteria evaluation approach using remote sensing and GIS. Renew. Sustain. Energy Rev. 2016, 65, 1–10. [Google Scholar] [CrossRef]
  3. Saifullah, A.; Karim, M.A.; Karim, M.R. Wind energy potential in Bangladesh. Am. J. Eng. Res. (AJER) 2016, 5, 85–94. [Google Scholar]
  4. Taheruzzaman, M.; Janik, P. Electric energy access in Bangladesh. Trans. Environ. Electr. Eng. 2016, 1, 6–17. [Google Scholar] [CrossRef] [Green Version]
  5. Islam, M.T.; Shahir, S.; Uddin, T.I.; Saifullah, A. Current energy scenario and future prospect of renewable energy in Bangladesh. Renew. Sustain. Energy Rev. 2014, 39, 1074–1088. [Google Scholar] [CrossRef]
  6. Zalhaf, A.S.; Elboshy, B.; Kotb, K.M.; Han, Y.; Almaliki, A.H.; Aly, R.M.; Elkadeem, M. A high-resolution wind farms suitability mapping using GIS and fuzzy AHP approach: A national-level case study in Sudan. Sustainability 2021, 14, 358. [Google Scholar] [CrossRef]
  7. Jamshed, A.; Saleem, A.; Javed, S.; Riffat, M. Site Suitability Analysis for Developing Wind Farms in Pakistan: A GIS-Based Multi-Criteria Modeling Approach. Sci. Technol. Dev. 2018, 37, 195–201. [Google Scholar]
  8. Elkadeem, M.; Younes, A.; Sharshir, S.W.; Campana, P.E.; Wang, S. Sustainable siting and design optimization of hybrid renewable energy system: A geospatial multi-criteria analysis. Appl. Energy 2021, 295, 117071. [Google Scholar] [CrossRef]
  9. Pohekar, S.D.; Ramachandran, M. Application of multi-criteria decision making to sustainable energy planning—A review. Renew. Sustain. Energy Rev. 2004, 8, 365–381. [Google Scholar] [CrossRef]
  10. Velasquez, M.; Hester, P.T. An analysis of multi-criteria decision making methods. Int. J. Oper. Res. 2013, 10, 56–66. [Google Scholar]
  11. Saaty, T.L. What is the analytic hierarchy process? In Mathematical Models for Decision Support; Springer: Berlin/Heidelberg, Germany, 1988; pp. 109–121. [Google Scholar]
  12. Elkadeem, M.; Kotb, K.M.; Ullah, Z.; Atiya, E.G.; Dán, A.; Wang, S. A two-stage multi-attribute analysis method for city-integrated hybrid mini-grid design. Sustain. Cities Soc. 2021, 65, 102603. [Google Scholar] [CrossRef]
  13. Pamučar, D.; Gigović, L.; Bajić, Z.; Janošević, M. Location selection for wind farms using GIS multi-criteria hybrid model: An approach based on fuzzy and rough numbers. Sustainability 2017, 9, 1315. [Google Scholar] [CrossRef] [Green Version]
  14. Xu, Y.; Li, Y.; Zheng, L.; Cui, L.; Li, S.; Li, W.; Cai, Y. Site selection of wind farms using GIS and multi-criteria decision making method in Wafangdian, China. Energy 2020, 207, 118222. [Google Scholar] [CrossRef]
  15. Tercan, E. Land suitability assessment for wind farms through best-worst method and GIS in Balıkesir province of Turkey. Sustain. Energy Technol. Assess. 2021, 47, 101491. [Google Scholar] [CrossRef]
  16. Zalhaf, A.S.; Abdel-Salam, M.; Mansour, D.E.A.; Ookawara, S.; Ahmed, M. Assessment of wind turbine transient overvoltages when struck by lightning: Experimental and analytical study. IET Renew. Power Gener. 2019, 13, 1360–1368. [Google Scholar] [CrossRef]
  17. Kotb, K.M.; Elkadeem, M.; Khalil, A.; Imam, S.M.; Hamada, M.A.; Sharshir, S.W.; Dán, A. A fuzzy decision-making model for optimal design of solar, wind, diesel-based RO desalination integrating flow-battery and pumped-hydro storage: Case study in Baltim, Egypt. Energy Convers. Manag. 2021, 235, 113962. [Google Scholar] [CrossRef]
  18. Gigović, L.; Pamučar, D.; Božanić, D.; Ljubojević, S. Application of the GIS-DANP-MABAC multi-criteria model for selecting the location of wind farms: A case study of Vojvodina, Serbia. Renew. Energy 2017, 103, 501–521. [Google Scholar] [CrossRef]
  19. Höfer, T.; Sunak, Y.; Siddique, H.; Madlener, R. Wind farm siting using a spatial Analytic Hierarchy Process approach: A case study of the Städteregion Aachen. Appl. Energy 2016, 163, 222–243. [Google Scholar] [CrossRef]
  20. Ullah, Z.; Elkadeem, M.; Kotb, K.M.; Taha, I.B.; Wang, S. Multi-criteria decision-making model for optimal planning of on/off grid hybrid solar, wind, hydro, biomass clean electricity supply. Renew. Energy 2021, 179, 885–910. [Google Scholar] [CrossRef]
  21. Zalhaf, A.S.; Mansour, D.-E.A.; Han, Y.; Yang, P.; Darwish, M.M. Numerical and experimental analysis of the transient behavior of wind turbines when two blades are simultaneously struck by lightning. IEEE Trans. Instrum. Meas. 2021, 71, 1–12. [Google Scholar] [CrossRef]
  22. Zalhaf, A.; Abdel-Salam, M.; Mansour, D.-E.A.; Ahmed, M.; Ookawara, S. An Experimental Study of Lightning Overvoltages on a Small-scale Wind Turbine Model. Energy Procedia 2019, 156, 442–446. [Google Scholar] [CrossRef]
  23. Said, R.; Murphy, M. GLD360 upgrade: Performance analysis and applications. In Proceedings of the 24th International Lightning Detection Conference and 6th International Lightning Meteorology Conference, San Diego, CA, USA, 18–21 April 2016. [Google Scholar]
  24. Saaty, T.L. An exposition of the AHP in reply to the paper “remarks on the analytic hierarchy process”. Manag. Sci. 1990, 36, 259–268. [Google Scholar] [CrossRef]
  25. Thomas, P.G.; Doherty, P.C. The Analytic Hierarchy Process: Planning, Priority Setting, Resource Allocation; McGraw-Hill: Basel, Switzerland, 1980. [Google Scholar]
  26. Khalek, H.A.A.; Aziz, R.F.; Abdeen, A.H. Identify and prioritize the major influencing causes of automated concrete mixing system for mega construction projects using analytic hierarchy process. Alex. Eng. J. 2018, 57, 3451–3461. [Google Scholar] [CrossRef]
  27. Konstantinos, I.; Georgios, T.; Garyfalos, A. A Decision Support System methodology for selecting wind farm installation locations using AHP and TOPSIS: Case study in Eastern Macedonia and Thrace region, Greece. Energy Policy 2019, 132, 232–246. [Google Scholar] [CrossRef]
  28. Giamalaki, M.; Tsoutsos, T. Sustainable siting of solar power installations in Mediterranean using a GIS/AHP approach. Renew. Energy 2019, 141, 64–75. [Google Scholar] [CrossRef]
  29. Ayodele, T.R.; Ogunjuyigbe, A.; Odigie, O.; Munda, J.L. A multi-criteria GIS based model for wind farm site selection using interval type-2 fuzzy analytic hierarchy process: The case study of Nigeria. Appl. Energy 2018, 228, 1853–1869. [Google Scholar] [CrossRef]
  30. Ali, S.; Taweekun, J.; Techato, K.; Waewsak, J.; Gyawali, S. GIS based site suitability assessment for wind and solar farms in Songkhla, Thailand. Renew. Energy 2019, 132, 1360–1372. [Google Scholar] [CrossRef]
  31. Rashid, T.; Agrafiotis, I.; Nurse, J.R. A new take on detecting insider threats: Exploring the use of hidden markov models. In Proceedings of the 8th ACM CCS International Workshop on Managing Insider Security Threats, Vienna, Austria, 28 October 2016; pp. 47–56. [Google Scholar]
Figure 1. Flow diagram of the methodology (Source: modified from [6]).
Sustainability 14 14819 g001
Figure 2. Study area map of Bangladesh (Source: author).
Sustainability 14 14819 g002
Figure 3. Map of the suitability categories based on wind speed.
Sustainability 14 14819 g003
Figure 4. Map of the suitability categories based on land slopes.
Sustainability 14 14819 g004
Figure 5. Map of the suitability categories based on distance from transmission lines.
Sustainability 14 14819 g005
Figure 7. Map of the suitability categories based on distance from the airports.
Sustainability 14 14819 g007
Figure 8. Map of the suitability categories based on distance from the roads.
Sustainability 14 14819 g008
Figure 9. Map of the suitability categories based on the elevation.
Sustainability 14 14819 g009
Figure 10. Map of the suitability categories based on lightning strikes.
Sustainability 14 14819 g010
Figure 11. Suitability map of wind farms’ locations.
Sustainability 14 14819 g011
Figure 12. The ROC curve of the suitability map.
Sustainability 14 14819 g012
Table 1. The fundamental scale for pairwise comparison [25].
SNIntensity of ImportanceDefinitionExplanation
11Equal importanceTwo activities contribute equally to the objective
23Weak importance of one over anotherExperience and judgment slightly favor one activity over another
35Essential or strong importanceExperience and judgment strongly favor one activity over another
47Demonstrated importanceAn activity is strongly favored and its dominance demonstrated in practice
59Absolute importanceThe evidence favoring one activity over another is of the highest possible order of affirmation
62,4,6,8Intermediate values between the two adjacent judgmentsWhen compromise is needed
7ReciprocalsIf activity i has one of the above numbers assigned to it when compared with activity j, then j has the reciprocal value when compared with i
Table 2. Data sources.
SNDataTypeResolutionSource
1Mean wind speedRaster data9 kmhttps://globalwindatlas.info/ (accessed on 10 March 2022)
2Digital elevation modelRaster data30 mhttps://earthexplorer.usgs.gov/ (accessed on 10 March 2022)
3Power Transmission Lines mapJPG (Digitized)-https://www.researchgate.net/publication/322465405_Site_Screening_Report_for_1320MW_Coal_Based_Power_Plant_In_Gaibandha_Dinajpur/ (accessed on 10 March 2022)
4Urban areaVector data-https://www.naturalearthdata.com/downloads/10m-cultural-vectors/10m-urban-area/ (accessed on 10 March 2022)
5Road mapJPG (Digitized)-https://en.banglapedia.org/index.php/Road Transport/ (accessed on 10 March 2022)
6Airport’s location mapVector data-https://data.humdata.org/dataset/global-airports/ (accessed on 10 March 2022)
7LIS/OTD total flash density mapRaster data55 mhttps://ghrc.nsstc.nasa.gov/pub/lis/climatology/LIS-OTD/HRFC/ (accessed on 10 March 2022)
Table 3. Exclusion zones are identified using the threshold/buffer values of constraining variables.
No.Constraint FactorValueRef.Area Ratio in Bangladesh
1Wind speed<3 m/s[27]9.24
2Slope>15%[14]6.31
3Elevation>1.25 km[28]0
4TLs and PG<0.5 km[29]10.59
5Urban/Major cities<1 km[30]1.14
6Airports<3 km[18]0.38
7Major roads and railways<0.5 km[1]7.92
8Lightning strike>80 fl km−2 y−1[23]0
Table 4. Suitability classes and weights for each evaluation criteria.
SNEvaluation FactorSuitability ClassScoreRangeArea Ratio in Bangladesh, %
1Wind Speed (m/s)Very low13–3.514.19
Low23.5–435.12
Moderate34–540.85
High45–60.59
Very high5>60.01
2Slope (%)Very low112–151.53
Low29–122.79
Moderate36–99.50
High43–633.43
Very high50–346.44
3Distance from transmission lines and power grid (km)Very low150–1001.41
Low220–5010.67
Moderate310–2019.02
High45–1023.54
Very high50.5–534.77
4Distance from Urban/Major cities (km)Very low11–52.84
Low25–105.88
Moderate310–2015.49
High420–3018.73
Very high530–5055.92
5Distance from airports (km)Very low150–10043.93
Low220–5043.96
Moderate310–208.66
High45–102.60
Very high53–50.48
6Elevation (km)Very low11–1.250
Low20.75–10.05
Moderate30.5–0.750.33
High40.25–0.51.19
Very high50–0.2598.43
7Distance from major roads and railways (km)Very low150–1002.61
Low220–5013.62
Moderate310–2021.03
High45–1025.40
Very high50.5–529.42
8Lightning Strike flash rate (fl km−2 y−1)Very low180–1000
Low240–8013.27
Moderate310–4084.81
High42.5–101.92
Very high50.625–2.50
Table 5. Accuracy of AUC values [31].
Accuracy LevelExcellentGoodSatisfactoryPoorFailing
AUC value0.90 to 1.000.80 to 0.900.70 to 0.800.60 to 0.700.50 to 0.60
Table 6. Pairwise comparison for assessment criteria.
SNCriteriaC1C2C3C4C5C6C7C8Weightage Average
1C1123475790.32
2C21/213567770.27
3C31/31/31133550.12
4C41/41/51123570.11
5C51/71/61/31/213570.08
6C61/51/71/31/31/31130.04
7C71/71/71/51/51/51140.04
8C81/91/71/51/71/71/31/410.02
Table 7. Areas of each suitability class and their percentages to the total land area of Bangladesh.
SNClassMap ColorArea (km2)Percentage (%)
1UnsuitableRed40,863.0030.67
2Very lowPurple294.670.22
3LowOrange18,081.5013.57
4ModerateCyan41,835.5631.40
5HighGreen21,516.6816.15
6Very highBlue10,629.237.97
Table 8. The details of ten wind farm projects in Bangladesh.
SNLocationLatLongLocated in Suitability Map Project Progress
1Kutubdia Upazila, Cox’s Bazar21.8191.85Very HighC
2Sonagazi, Feni23.0791.48HighC
3Sirajganj Sadar Upazila, Sirajgonj24.4489.68ModerateUC
4Chakaria Upazila, Cox’s Bazar21.4392.00ModerateUC
5Maheshkhali Upazila, Cox’s Bazar21.4191.53Very HighUP
6Sonagazi, Feni22.8791.38ModerateUP
7Mongla Upazila, Bagerhat22.4989.60HighUP
8Cox’s Bazar Sadar Upazila, Cox’s Bazar21.1592.07ModerateUP
9Chandpur Sadar, Chandpur23.2490.70ModerateUP
10Kalapara Upazila, Patuakhali22.0290.17HighUP
C—Completed; UC—Under construction; UP—Under planning; Source: SREDA (https://ndre.sreda.gov.bd (accessed on 15 March 2022).
Publisher’s Note: MDPI stays neutral with regard to jurisdictional claims in published maps and institutional affiliations.

