1. Introduction
New and old driving force conversion, also called replacing old-growth drivers with new ones, mainly refers to fostering new driving forces actively, transforming traditional driving forces quickly, and constructing twin engines of economic development [
1,
2]. As China’s economic development entered the “New Normal”, the government has formulated and issued a series of reform measures to replace old driving forces with new ones, and therefore creating a new round of economic development in recent years [
3]. The new driving force, mainly includes new products, new forms of business, new models, and the upgrading of traditional industries, and is regarded as the principal strategy to realize economic development from high speed to high quality currently in China [
4]. At present, we are in the critical period of driving force conversion from factor-driven to innovation-driven. The new and old driving force conversion is not only at the heart of high-speed and sustainable economic growth, but also at the core of China’s long-term goal of “double carbon” realization [
5]. At the same time, “the new and old driving force conversion construction plan in Shandong province” has been approved by the State Council of the P. R. C. Furthermore, in 2021, “the start-up area of the new and old driving force conversion construction plan” was issued to further promote the construction of a comprehensive experimental region for the new and old driving force conversion in Shandong province, thereby achieving high-quality economic development in the studied area [
6].
Shandong province, located in the east of China, is a relatively well-developed region with abundant resources and integrated industrial structures. On the one hand, it is regarded as the best experimental field of the new and old driving force conversion; on the other hand, it carries more historical responsibility for ecological conservation and high-quality development than ever in the Yellow River Basin. In this way, studying and exploring differences in regional economic characteristics and development trends, measuring the proportion of high energy consuming industries, and evaluating the pollutant emissions transformation, shall help policymakers revise and publish more effective relevant laws and regulations [
7,
8]. In particular, a comprehensive new and old driving force conversion evaluation using numerical quantification can accurately measure the dynamic evolution from temporal and spatial views. Until now, the new and old driving force conversion has attracted significant attention of many scholars and experts with practical applications. However, only a few previous studies have involved problems, such as how to measure the development progress in terms of a comprehensive index, and how to explore the characteristics and path of the new and old driving force conversion [
9]. Unfortunately, most of them focus on the theoretical strategies of industrial restructuring at a macro level and lack the conversion development correlation and comparison with quantitative analysis. In addition, innovation capability, development factor, and industrial structure are different due to unbalanced development in China, which results in significant differences among regions in temporal-spatial evolution of the new and old driving force conversion. Therefore, scientific measurement of the driving force conversion development and its temporal-spatial evolution is conducive to accurately realizing high-quality development policy in all regions in China [
10]. To summarize, previous research has only focused on the strategies of the new and old driving force conversion, and no one has studied the measurement of the old and new driving force conversion among regions in Shandong. The main aims of this paper are as follows:
- (1)
We propose a framework of temporal-spatial evolution of the regional new and old economic driving force conversion in a Chinese province, including the new and old economic driving force conversion speed, direction, development, and spatial correlation measurement. Meanwhile, a novel evaluation index system with eight first-level and twenty-two second-level indicators is given to evaluate the level of new and old driving force conversion and its spatial pattern. Compared with the existing research, the proposed framework provides a thorough evaluation approach with value-added information for decision-makers.
- (2)
From the view of regional evolution, this study presents the methods of measuring conversion speed and direction of the new and old driving force, including the Moore index and the advanced industrial structure coefficient. In particular, the traditional entropy approach is improved by adding a time-dependent variable, making the analysis results more reasonable. Furthermore, the global and local spatial correlation measurement of the new and old driving force conversion is calculated using Moran’s I and Geoda.
- (3)
We thoroughly investigated and studied the temporal-spatial evolution of the regional new and old driving force conversion in Shandong province, China. The results show that the economic driving forces conversion capacity is increasing year by year in the cities and some undeveloped cities have seen faster growth. Jinan and eastern coastal areas have a strong economic driving force conversion capacity, while the western inland areas have a weak conversion ability.
- (4)
According to the analysis results and the local conditions in Shandong province, more targeted strategies and suggestions have been put forward for the high-quality development and ecological governance in the near future, including optimizing industrial structure to promote the development of three primary industries; promoting innovation and policy guidance; strengthening the construction of economic circle and “strong economy provincial capital”; and opening collaboratively and developing commonly.
The remainder of the paper is arranged as follows.
Section 2 reviews the relevant literature on research issues and proposes a research framework. Then, we present the approaches to measuring conversion speed, direction, and temporal-spatial evolution of the new and old driving force with an improved entropy method in
Section 3. After that, the data and analysis of the new and old driving force conversion development in the studied province are given in
Section 4 and
Section 5, respectively. Finally,
Section 6 presents the conclusions, limitations, and future research prospects.
2. Literature Review
In this section, we review the relevant literature on research issues and present a research framework, including the concept of new and old driving force conversion, and its measurement approaches.
2.1. New and Old Driving Force Conversion and Its Strategy
New and old driving force conversion was first put forward at the Fourth Session of the Twelfth National People’s Congress in China [
10]. Correspondingly, its similar study abroad is named “industrial transformation and upgrading”. Since then, studies related to the new and old driving force conversion has gradually attracted the attention of researchers, and relevant theoretical literature has begun to appear constantly [
11,
12,
13].
Figure 1 describes the basic framework of new and old driving force conversion in China, and believes that the new and old driving force conversion can be achieved by a shift from government-led to government-guided, from economic fields to social fields, from critical demonstration to all-round promotion, from factor-driven to innovation-driven, and from progressive innovation to subversive innovation [
14,
15].
With the persistence of the impact of COVID-19 on the industrial system, there is an urgent need for the continuous conversion of the new and old driving force that can support the growth of “new normal” economy in China. Compared with the domestic research in China, foreign industrial transformation and upgrading started earlier. Furthermore, they developed more quickly from the old driving forces to new energy transition, and from traditional industries to emerging industries [
15,
16]. Currently, in China, the theory and strategy of the new and old driving force conversion are on behalf of the main results of the research. Yang H. X. and Jiao Y. analyzed the connotation and mode of the new and old driving force conversion and the dynamic evolution from the perspective of technology efficiency and technological progress [
10]. Zheng, J. H. et al. believed that “the new driving force” corresponds to “the old driving force”, and the new driving force should be supported by knowledge technology, data information, and other new production factors [
17]. Accompanied by theoretical analysis, many researchers presented strategies from different views by combining them with economic structure transformation in China. Cui, J. H. and Li, W. L. suggested that the economic growth quality includes the upgrading of economic structure, efficiency improvement, and supply-side reform [
18]. Xu J. W. investigated and analyzed the questions of new and old driving force conversion in central China [
19]. After further analyzing the similarities and differences between the conversion of Shandong and that of the whole country, Xu, Z. et al. pointed out that emphasis on new and old driving force conversion should be placed on demand, supply, government support, and so on [
20]. Ning, C. S. suggested that technological breakthroughs and mechanism reform should be the core of new and old driving force conversion [
21]. At the same time, the competitiveness of enterprises at home and abroad is crucial to promoting the conversion of the old and new driving force. Overall, theoretical studies are relatively mature because of an early start, including the connotation, motivation, mechanism, and corresponding strategies of new and old driving force conversion.
2.2. Measurement of New and Old Driving Force Conversion Development
Evaluation index system is an effective way of measuring development progress, and some researchers have proposed sets of evaluation indicators from different views in the field of the new and old driving force conversion. For example, a nine-dimensional framework of an indicator system was established with the principle of practicability, including the emergence of new technologies, new models, new forms of business and new industries, and the conversion of traditional driving force [
22]. An index system is constructed to measure the replacement index of the old economic drivers in Shanxi tourism [
23], and the characteristics and rules of the index were analyzed. Based on the correlation between the conversion of the new and old driving force and the upgrading of industrial structure, the leading coefficient and transformation speed of new and old driving force conversion were introduced in the manufacturing industry [
24]. Based on the relevant data from the year 2000 to 2019, Zhang, T. G. and Chu, G. M. used the DEA-BCC model to evaluate the efficiency of industrial structure optimization, supported by financial development in Qingdao [
25]. From the view of the steel industry, Liu, H. D. et al. measured the conversion progress of the new and old driving force in the steel industry with micro industrial data by constructing a three-dimensional index system, including technical efficiency, total factor productivity, and driving force index [
26]. Li, C. Y. et al. decomposed economic driving force into three components: innovation, factors, and institutions, based on total factor productivity, then constructed a comprehensive index for the new and old driving force index using the entropy weight-TOPSIS method [
27]. Fang, D. C. and Pei, M. D. gave a seven-dimensional evaluation system to calculate the characteristics of driving force conversion between provinces using the entropy method [
28].
In addition, there are some researchers focused on measuring the new and old driving force conversion development in Shandong Comprehensive Experimental Zone to comprehensively evaluate sustainable development in Shandong province, China. Shen, L. and Chen, Y. Y. established an evaluation index system that can measure its expenditure performance to promote old drivers’ replacement with new ones [
29]. Using the entropy weight grey correlation TOPSIS method, Li, N. et al. studied the conversion level of the old and new economic driving force in different cities of the studied province, then classified the conversion capacity of driving forces based on clustering analysis and analyzed the evolution law of time and space [
30]. Huang, S. A. put forward the path to promote the steady and healthy development of the economy through the analysis of industrial transformation and upgrading of the old and new driving force in Shandong, China [
31].
2.3. Review
From the existing studies above, related research findings on the new and old driving force conversion provide a rich theoretical and practical basis for this study. With current research, we readily accept the following facts: (1) innovation, factor optimization, and system can promote the efficient conversion of the new and old driving force; (2) the evaluation indicators selection should consider the aspects of timeliness, measurability, integrity, and non-repetition, and must be combined with the actual situation; (3) the strategies for optimization and upgrading of industrial structure, and the conversion of old and new driving force, must be carried out simultaneously.
Nevertheless, there are still some limitations as follows. (1) The conversion speed and direction of new and old driving force have not been done very thoroughly in current research, which is essential to provide value-added information for decision-makers. (2) Some evaluation indicators for measuring the new and old driving force conversion process do not apply to regions in Shandong province directly. Particularly, existing evaluation indicators relevant to carbon emissions and high energy consumption are still insufficient. In contrast, resource consumption is not only an important indicator to measure the model of economic transformation, but also crucial to the green economy in China. (3) The temporal-spatial evolution of the regional new and old driving force conversion has not yet been thoroughly investigated and studied in Shandong province. Additionally, the traditional entropy method needs to be improved to make the analysis results more reasonable. (4) The corresponding strategies and suggestions have not been put forward for the high-quality development and ecological governance of Shandong provinces in the near future.
Based on the analysis, this paper aims to propose methods for measuring the conversion speed and direction of the new and old driving force and establish a scientific and reasonable evaluation index system for the conversion of the new and old driving force. Then, we calculate the conversion development of new and old driving force in Shandong province, and compare the characteristics and regional differences of the conversion of driving force among various regions. After that, we will give some suggestions and countermeasures based on the analysis of the new and old driving force conversion development in Shandong province, China.
3. Methodologies
In this section, we first present the ways to measure the conversion speed and direction of the new and old driving force, including the Moore index and the advanced industrial structure coefficient. Furthermore, the conversion development progress is measured using an improved entropy method, and spatial correlation is analyzed with the global and local Moran’s I, respectively.
3.1. Conversion Speed Measurement of the New and Old Driving Force
The value of Moore structure change is used to measure the conversion speed of the new and old driving force in this study, which is based on space vector theory. In detail, it constructs a three-dimensional vector with proportions of three primary industries at each period, then takes the angle between two vectors as an indicator of the degree of the industrial structure change. According to its definition [
32], the value of Moore structure change can be calculated using Equation (1):
where
is the value of Moore structure changing, and
wit and
wit+1 are the proportions of the
ith industry in period
t and
t + 1, respectively.
Furthermore,
β is introduced to describe the angle among three industries with different periods and can be calculated as in Equation (2):
In detail, the value of β ranges between 0 and π/2, and a higher value of β indicates a higher changing speed of industrial structure, while a smaller value shows a slow changing speed.
In addition, we represent industrial structure changing within a certain period using the average absolute value of the difference between industrial structure values, described as Equation (3):
where
k is the industrial structure changing value, and
qi0 and
qi1 are proportions in GDP or employment rate of the
ith industry on base period and reporting period, respectively.
3.2. Conversion Direction Measurement of the New and Old Driving Force
The advanced industrial structure coefficient is used to measure the exceeding development degree compared to the growth of the entire economic system [
33]. In this study, it is used to detect the conversion direction of the new and old driving force, and the calculation can be described in Equation (4):
where
Ei is the advanced industrial structure coefficient of the
ith industry;
ai is the ratio between reporting period and base period of the
ith industry; and
Ri is the average growth rate of the economic system over the same period, and can be calculated with Equation (5):
where
n is years studied.
In general, if the value of Ei is smaller than 1, it shows that the share of the ith industry decreases in the whole economic system, meaning relatively slow development. In comparison, if the value of Ei is greater than 1, it shows that the share of the ith industry increases, meaning relatively fast development with an ascending trend.
3.3. Conversion Development Measurement of the New and Old Driving Force
In this study, we first propose an evaluation index, including eight first-level indicators and twenty-two second-level indicators, to measure the conversion development of the new and old driving force. Then, we design a comprehensive evaluation model with development index using an improved entropy method.
3.3.1. Evaluation Indicators for Conversion Development of the New and Old Driving Force
The main goal of the new and old driving force conversion is to constitute the new driving forces that can support the growth of the new normal economy in China, including the new economy formed by new products, new forms of business, new models, and the upgrading of traditional industries together. To measure the conversion development of the new and old driving force, we establish an indicator system from two dimensions: fostering new growth drivers and conversing traditional growth drivers. The final evaluation index on conversion development measurement of the new and old driving force is described in
Table 1.
Innovation-driven development is crucial to cultivate new growth drivers for development, and there are four categories of indicators, namely new technology, new models, new business forms, and new industries. The new technology refers to those that can actually promote and replace traditional applications, rather than simple technologies in the laboratory. The new model combines the traditional industrial elements with high efficiency by taking market demand as the center. Specifically, it includes integrating the Internet with industrial innovation, integrating hardware into services, and providing one-stop consumption, entertainment, and leisure services. The new business form refers to the new links, chains, and activities derived from the existing industries and fields by meeting diversified and personalized product or service demands. It includes business activities based on the Internet; innovation of business process, service mode, or product form; and more flexible and fast personalized services. The new industry refers to those that can stimulate significant changes in the industrial system, using new scientific and technological achievements and new technologies to attain a particular scale of new economic activities. It involves the new industry directly generated by the industrialization of new technology applications, by the traditional industry adopting modern information technology (IT), and by the promotion and application of scientific and technological achievements. According to literature related to new driving force cultivation, this study selects ten second-level indicators, including the proportion of R&D personnel, invention patent number per ten thousand personnel, total factor productivity, investment in informatization, and so on.
In terms of traditional driving force conversion, this study employs policy support, element optimization, energy utilization, and waste reduction as first-level indicators. On the one hand, policy support is used as the external motivation of the new and old driving force conversion; thus, “C51: Improvement rate of the business environment” and “C52: the product-market openness” are employed as second-level indicators. On the other hand, the upgrading of production factors based on labor, technology, and land is the intrinsic motivation of the new and old driving force conversion, and enterprises can optimize and reconstruct by introducing personnel, technology, and management. Therefore, “C61: Expenditure of R&D” is selected to measure the investment of old driving force transformation; “C62: Land use efficiency” and “C63: The overall labor productivity” are employed to measure the output of old driving force conversion.
In addition, traditional driving force upgrading not only depends on the efficiency of economic operation, but also reduces energy consumption or improves energy utilization. In this way, “C71: Utilization rate of industrial solid waste”, “C73: Energy consumption per 1000$ GDP”, “C81: General industry solid waste per 1000$ GDP”, and so on, are employed as second-level indicators, showing the progress of old driving force replacement.
3.3.2. Comprehensive Evaluation Model for New and Old Driving Force Conversion Development
There are many methods for multiple-index comprehensive evaluation, and they can be grouped into the following two broad categories: the traditional subjective weighting method and the objective weighting method. Unfortunately, the subjective weighting method usually relies on subjective judgment with a lack of objectivity. In contrast, the objective weighting method determines the weight according to the information carried by the indicator itself, and the evaluation result is relatively accurate and objective. In this study, the entropy method is employed to weigh the indicators in order to objectively evaluate the new and old driving force conversion development. To compare the conversion development between different years, we improve the traditional entropy approach by adding a time-dependent variable, making the analysis results more reasonable.
The improved entropy method can be described as follows:
- (1)
Indicators selection. Suppose there are data involving
r years,
n cities,
m variables; then, x
θij is the value of the
jth indicator of the
θth year in the
rth city. Related data have been collected according to indicators in
Table 1.
- (2)
Data standardization. The values of evaluation indicators for the new and old driving force conversion are described using different units and orders, and data de-dimension and standardization processing for raw data is necessary. To illustrate the conversion degree, this study employs a utility function to convert the values to the range [60, 100], as can be seen in Equation (6).
For positive indicators, the calculation should use Equation (6) as follows:
For negative indicators, the calculation should use Equation (7) as follows:
where
is the converted value of
xθij, ranging between 60 and 100;
x is the observed value; and
xmax and
xmin are the maximum and the minimum values for the
jth indicator in all candidate solutions, respectively.
- (3)
Weight setting. The weight of the jth indicator of the ith city in the θth year can be calculated as follows in Equation (8):
- (4)
Entropy calculation. The jth indicator’s entropy can be calculated using Equation (9):
- (5)
Information utility value. The jth indicator’s information utility value can be calculated using Equation (10), where Sj is the jth indicator’s entropy:
- (6)
Weight of the jth indicator. The weight of the jth indicator can be calculated as Equation (11), where Ej is the information utility:
- (7)
The comprehensive grade of new and old driving force conversion of the ith city in θ year can be calculated as Equation (12):
In this study, the development index of new and old driving force conversion is calculated based on the linear weighting method, as can be seen in Equation (13):
where
is the
ith city’s standardized value of the
jth indicator in the
θth year;
Wj is the weight of the
jth indicator; and
m is the number of the second-level indicator.
3.4. Spatial Correlation Measurement of New and Old Driving Force Conversion
W. R. Tobler’s First Law (TFL) of geography indicates that “Everything is related to everything else, but near things are more related than distant thing” [
34]. In this way, the regions’ conversion development of new and old driving force in Shandong province may have an association relation, called spatial correlation. Furthermore, in this study, it is tested using global Moran’s I and local Moran’s I [
35]. The validity of Moran’s I depends on the appropriate spatial weight matrix, and the first problem to be solved is spatial weight matrix construction.
3.4.1. Spatial Weight Matrix
According to TFL, a city’s conversion development of new and old driving force is related to its adjacent areas. The spatial weight matrix is established by researchers’ subjective decisions from characteristics such as geographical relation, economic relation, etc. In this study, the significant level of global Moran’s I and distribution characteristics of the new and old driving force conversion are used to see whether the spatial weight matrix reaches the required standard.
Table 2 presents the definitions of the spatial weight matrix, including spatial adjacency matrix, geographical distance matrix, economic distance matrix, and economic and geographical distance matrix.
3.4.2. Global Spatial Correlation Analysis
Currently, there are many global spatial autocorrelation analysis methods, including Moran’s I [
36], Geary’s C [
37], Getis-Ord G [
38], and so on [
39]. Simulation experiments suggest that the inverse relationship between Moran’s I and Geary’s C is basically linear in nature, that is, Geary’s C deals with paired comparisons and Moran’s I with covariations. In addition, Getis-Ord G cannot be used to distinguish negative spatial autocorrelation. Furthermore, Moran’s I has been subsequently used in almost all studies employing spatial autocorrelation. It is analogous to the conventional correlation coefficient because its numerator is a product moment term. In this way, we employ global Moran’s I to measure the relation between adjacent spatial distributed objects and their attributes. Its value can be calculated as Equation (14):
where
n is the number of cities;
wij is the weight in the spatial weights matrix;
Yi and
Yj are the development levels of new and old driving force conversion in city
i and city
j, respectively; and
is the average development level of all cities.
As can be seen, I ranges from −1 to 1. The correlation between cities is positive if the value of I is greater than 0, with values closer to 1 showing a stronger correlation in space. On the other hand, the development level between cities has a negative correlation if the value of I is below 0 and closer to −1, indicating that the development level distributes with a high deviation in space. If the value of I is equal to 0, the development level of new and old driving force conversion is randomly distributed.
In addition, we use the
Z-test in Equation (15) to test whether Moran’s I is significant:
where
E(
I) = −1/(
n − 1), and
VAR(
I) =
E(
I2) −
E(
I)
2.
3.4.3. Local Spatial Correlation Analysis
Global Moran’s I typically describes the spatial correlation and aggregation as a whole, simply showing the conversion correlation of the new and old driving force. The local Moran’s I made up for this limitation by measuring the local correlation of new and old driving force conversion with local spatial correlation. Local Moran’s I, also called Anselin Local Moran’s I, is used to test the correlation between local spaces, as can be seen in Equation (16):
Local Moran’s I shows the development level between the city i and its surrounding cities. In detail, if the value of Ii is more than zero, it indicates that the conversion development level of the ith city appears with high-high aggregation or low-low aggregation. In contrast, if the value of Ii is below zero, it indicates that the conversion development level of the ith city appears with high-low aggregation or low-high aggregation
In practice, most researchers have preferred to use the Moran scatter plot as a display of local correlation because of the complex calculation of Local Moran’s I [
40]. The horizontal coordinate-axis
z in the Moran scatter plot is the space unit value after standardization; the vertical coordinate-axis
Wz describes the average value of the adjacent space unit. There are four quadrants in the Moran scatter plot, representing four types of spatial distribution, respectively. The element of new and old driving force conversion development in the first quadrant and the third quadrant shows little difference, appearing as agglomeration effects, and the element in the second quadrant and the fourth quadrant shows a significant difference, appearing as spatial disparity effects.
4. Data
In order to analyze the regional temporal-spatial evolution of new and old driving force conversion in Shandong province, we investigate and compare the conversion development by dividing these sixteen cities into three groups according to each city’s GDP and population, as can be seen in
Table 3.
In this study, all the data are from “China Stock Market & Accounting Research Database (CSMAR)” (accessed by:
https://www.gtarsc.com/, accessed on 26 August 2022) [
41], “Shandong province statistical yearbook” (accessed by:
http://tjj.shandong.gov.cn/, accessed on 26 August 2022) from the year 2015 to 2020 published by Shandong Provincial Bureau of Statistics [
42], and “China City Statistical Yearbook” (accessed by:
http://www.tjcn.org, accessed on 26 August 2022) year 2015 to 2020 [
43]. In order to eliminate the influence of price, some data are processed using CPI (consumer price index) reduction with the base year. Additionally, there are values of some indicators missing, and they are filled with the average value or processed with the exponential smoothing method. For those variables that cannot be obtained directly, we replace them with values of similar indicators or calculation results. For example, the indicator “C21: Investment in informatization” is obtained by summarizing the expenditure of hardware and software each year, and “C22: Internet access rate” is calculated by dividing the total number of Internet accessing users by the total users’ amount. Furthermore, “C51: Improvement rate of business environment” is obtained by dividing the number of employees in private enterprises by the total employees. The indicator “C52: Market openness” is equal to the value of the gross value of imports and exports divided by GDP; “C62: The land use efficiency” is each city’s GDP divided by its land area; and “C63: The overall labor productivity” is equal to each city’s GDP divided by its annual average number of employees.
5. Evolution Analysis and Suggestion of the New and Old Driving Force Conversion Development in Shandong Province
In this section, we will present the temporal-spatial evolution analysis of the new and old driving force conversion development in Shandong province, China, using the data and methods proposed in the previous sections, including conversion speed, direction, and temporal and spatial correlation measurements of the new and old driving force conversion. Then, we will provide some suggestions and countermeasures for further conversion of the new and old driving force according to their local conditions in the studied province.
5.1. Conversion Speed Analysis of the New and Old Driving Force in Shandong Province
According to Equations (1)–(3), the values of Moore structure change
M+, angle
β, and industrial structure change can be obtained. They are presented in
Table 4.
From the perspective of horizontal comparison, the values of β and k show an increasing trend from phase I to phase II, except for Jinan and Dongying, indicating that the speed of industrial structure upgrading for most cities has been constantly enhanced in these years. Additionally, it shows that the speed of new and old driving force conversion in the studied province has been accelerated in these years.
From the vertical point of view, there is great difference among these cities in terms of the value of k. In the first phase, the industrial structure upgrading speeds of Linyi, Jining, and Binzhou are in the leading positions. The speed of each city’s industrial structure upgrading has changed dramatically from the year 2015 to 2020, and the values of k have generally increased in all cities. Furthermore, Liaocheng has the most significant change; however, the conversion speed of Jinan is still reasonably low by comparison.
From the agglomeration effect aspect, the average angle β of II-large cities is the highest among the three types, indicating the rapid conversion speed of new and old driving force from 2015 to 2017. The speeds of medium-sized cities gradually accelerate in the second phase. However, there is no clear trend in the values of k from beginning to end. Additionally, the average value of β in I-large cities is lower than that in the II-large cities and medium-sized cities. It is possible that they may have encountered development bottlenecks during this period. Furthermore, technological innovation, human capital, opening up, and urbanization should be improved in Jinan and Qingdao if they want to achieve rapid conversion development speed of the new and old driving force in the future.
5.2. Conversion Direction Analysis of the New and Old Driving Force in Shandong Province
According to Equations (4) and (5), each city’s advanced industrial structure coefficient can be calculated, thereby determining the conversion direction of the new and old driving force in Shandong province. These are presented in
Table 5.
From
Table 5, it is evident that the tertiary industry is always the main force of economic development in the two phases. The secondary and tertiary industries have gained rapid growth since 2018, indicating that each city has struggled to explore the balance between new driving force mining and old driving force upgrading based on the existing industry. Additionally, each city’s advanced industrial structure coefficient of the tertiary industry is greater than 1 in the first phase, showing that the tertiary industry is developing ahead of time, while the advanced coefficient of the secondary industry is below 1, relatively behind the development. Furthermore, the secondary and tertiary industry in most cities are in an “advanced” development in phase II. For example, new material and aerospace industries have gained rapid development while cultivating traditional industries in Dongying, Shandong province.
In addition, most I-large and II-large cities gradually focus on the tertiary industry in the first phase, indicating that the economic restructuring has achieved initial results. Similarly, the secondary industry in most cities has developed rapidly since 2018, with the replacement of the old driving force by reducing energy consumption and heavy pollution industries.
5.3. Conversion Development Analysis of New and Old Driving Force in Shandong Province
In this sub-section, we will analyze the conversion development of the new and old driving force in Shandong province, China.
5.3.1. Conversion Development Evaluation
According to Equation (12), the annual development index of new and old driving force conversion in the studied province, can be obtained, as seen in
Table 6. In the same way,
Table 7 presents each city’s development index in the studied province in 2020.
- (1)
From the year 2015 to 2020, the conversion progress of new and old driving force developments have been in the accelerating phase in terms of new technology, new models, and new business, showing the powerful capacity for the old driving force replacement with new ones. At the same time, the development index of new technology rose rapidly from the year 2015 to 2017, but slightly decreased from the year 2018 to 2021. The reason can be attributed to the focus shift of urban development. From the perspective of cities, there are significant differences in the development index, showing that cities with low technology need to be improved in cultivating the new driving force.
- (2)
Element optimization index has few changes from the year 2015 to 2020, where Jinan and Qingdao are still in the leading position, indicating that those cities with low element upgrading need to strengthen innovation in the future.
- (3)
The energy utilization development index is stable from the year 2015 to 2020, with a little declining trend year by year. Along with the economic development, much attention should be paid to environmental protection and recycling of energy around the cities in the studied province.
- (4)
The conversion development index of the new and old driving force increased year by year because of the multi-parts attendance and cooperation. Similarly, the governments have taken effective measures and policies to support the critical technical renovation programs of the state in Jinan and Qingdao, thereby resulting in the development of high quality in Shandong province.
Overall, although the conversion development of new and old driving force among cities in the studied province has been enhanced these years, there are still significant differences among cities, and I-large cities need to further play a leadership role in many respects in the future.
5.3.2. Temporal Analysis of New and Old Driving Force Conversion in Shandong Province
Based on the proposed evaluation index, the conversion development index of new and old driving force can be obtained using the Entropy method, thereby measuring each city’s temporal sequence from the year 2015 to 2020, as can be seen in
Table 8.
From an urban integral and harmonious development point of view, the new and old driving force conversion is on its way up over time in Shandong province. In detail, the conversion development from the year 2015 to 2017 increased rapidly, except in Binzhou; while some cities’ developments slightly decreased from the year 2017 to 2018, the progress is still the dominant force. As a result, the average development index of new and old driving force conversion began to increase rapidly between 2019 and 2020. The results can be attributed to a range of factors. On the one hand, the new driving force has been fully stimulated, and the old driving force was replaced by the pressure from the Chinese government; on the other hand, advantages and achievements of the new and old driving force conversion are gradually emerging.
Figure 2 presents the average conversion development index from 2015 to 2020 in Shandong province from the perspective of different city types. As can be seen, the conversion development of I-large cities is much greater than the average value of the studied province. In comparison, the values of medium-sized cities are similar to the average and increasing slowly in recent years.
5.4. Spatial Correlation Analysis of New and Old Driving Force Conversion in Shandong Province
In this sub-section, we will analyze the spatial correlation of new and old driving force conversion in Shandong province, including spatial distribution and global and local spatial autocorrelation analysis.
5.4.1. Spatial Distribution of New and Old Driving Force Conversion in Shandong Province
According to each city’s development index of new and old driving force conversion in Shandong province, the visualization is presented from 2015 to 2020 using GeoDa [
44,
45,
46] with five customized breakpoints, as can be seen in
Figure 3.
From
Figure 3, it is evident that there are agglomeration effects from the geospatial view in term of new and old driving force conversion in Shandong province according to the geographical distribution of the development index. Specifically, the conversion development index is centered approximately on Jinan in the middle, and on Qingdao in the east, then scatters to surrounding directions, promoting the conversion development of other areas. Meanwhile, the development index is a significantly ladder-like distribution for the whole province. That is to say, the conversion development in the east is higher than that in the west; the conversion development in the coastal areas is better than that in the inland regions. The development index gradually reaches high levels from east to west and from coast to inland in the studied province. In this way, the development index of the new and old driving force conversion may be affected by geographical space to a certain extent.
Furthermore, the cities with high per capita GDP also have powerful conversion capability in terms of new and old driving force conversion, as can be seen in
Figure 3. In detail, the cities in the middle and east of the studied province also have a high conversion development index. This can be attributed to a strong economic foundation and complete industrial system in developed areas; similarly, new and old driving force conversion enhances the development with new technology and high quality, thereby promoting economic development. Furthermore, we are convinced that urban economic growth promotes the conversion of the new and old driving force; in other words, the conversion is affected by certain economic factors.
5.4.2. Global Spatial Autocorrelation Analysis in Shandong Province
In this study, the economic geographical distance weight matrix-based Moran’s I is used to analyze and test the spatial autocorrelation of new and old driving force conversion, according to the conversion development distribution characteristics in geospatial and economic space [
47].
The economic geographical distance weight matrix describes the difference between two cities in terms of economic and geographical distance, and smaller values indicate more significant weight, indicating the significant relationship in the new and old driving force conversion. In this study, the difference between the two cities’ per capita GDP is used as the variable of economic difference, and the economic weight matrix is regarded as a dynamic matrix changing over time.
We calculated sixteen cities’ conversion grades of new and old driving force from 2015 to 2020 using Geoda, as can be seen in
Table 9.
As can be seen from
Table 9, the global Moran’s I values of the sixteen cities in Shandong are all more than zero, showing a significant spatial correlation among them. Additionally, it proves the existence of the economic spatial agglomeration in terms of new and old driving force conversion among these cities. That is to say, cities with similar economic development have little difference in the conversion development index of the new and old driving force, and it is not randomly distributed in economic space. On the whole, agglomeration effects of new and old driving force conversion in these cities have little change from the year 2015 to 2018. However, the spatial correlation among these cities has sharply decreased since 2019, which can be attributed to the strategy of “strong economy provincial capital”, and the balanced (or harmonious) development of the economy in the studied province. In particular, the positive spatial correlation slightly increased because of the comprehensive experimental zone construction of new and old driving in 2019.
5.4.3. Local Spatial Autocorrelation Analysis in Shandong Province
The scatter plot of Moran’s I provides graphic descriptions of spatial agglomeration states among regions. In this study, we present cities’ conversion development of new and old driving force using Moran’s I scatter plot from 2015–2020 in the studied province, as can be seen in
Figure 4.
From
Figure 4, we can conclude that the conversion development of new and old driving force had a higher correlation each year. Specifically, most cities are in the first and third quadrants in the Moran’s I scatter plot, except for 2019, showing that their spatial relationships are positive with high agglomeration effects of low-low or high-high types. In 2019, there is a high regional difference; for example, Zibo, Dezhou, and Weifang are out of the first and third quadrants. At the same time, we can see that the points in the first quadrant are dispersed, indicating that there are differences between the conversion development in these cities.
Table 10 presents the conversion evolution of cities in Shandong through the integration of Moran’s I scatter plot from the year 2015 to 2020.
As can be seen from
Table 10, there are five cities, including Jinan, Qingdao, Yantai, Weihai, and Dongying, always in the first quadrant, indicating their high conversion development of the new and old driving force. In addition, they almost have the same economic difference as adjacent cities, showing high-high spatial aggregation effect. These cities should play an extremely positive role and promote the development of surrounding cities. On the other hand, there are eight points always located in the third quadrant, indicating their low conversion development of new and old driving force. Furthermore, they showed the effect of low-low aggregation overall with little difference in economic development. Based on the analysis of related indicators in these cities, high-energy consumption, imperfections related to business, and so on, are primarily universal issues, which prevent the further conversion of the new and old driving force in these cities. Some high-energy consumption industries are moved to other cities by Jinan when they replace the old driving force with new ones.
In addition, most of the cities in the third quadrant are located in the west or the south of Shandong province. They are located in the inland of the studied province with a weak economic foundation, lacking foreign trade advantages. It is worth noting that the total GDP of Weifang, Jining, and Linyi are at the forefront of overall cities. Still, the per capita GDP level is low, indicating that the economic development of these cities is highly dependent on the population dividend. As the capital of the studied province, Jinan always carries out sustained development with the new driving force. At the same time, Qingdao has a particular advantage in foreign investments and foreign trade developments with powerful new and old driving force conversion capacity. Around these two cities, aggregate areas have been formed, called the port city group on the eastern coast and the central city group on the central part, respectively.
5.5. Suggestions and Countermeasures of New and Old Driving Force Conversion in Shandong Province
According to the analysis results, we will provide some suggestions and countermeasures for the future conversion development of the new and old driving force in Shandong province, China.
- (1)
Optimizing industrial structure to promote the development of three primary industries. Shandong is primarily oriented toward the secondary industry and the tertiary industry currently; however, traditional secondary industry involves high-energy consumption and high pollution, hampering the ecological system protection and the realization of a resource-efficient society. In this way, upgrading of the secondary industry is urgently needed in some cities. It is worth noting that the rapid development of the tertiary industry is dependent on that of the primary and secondary industries. In this way, each city in the studied province should follow the laws of industrial development and the demands of market mechanism operation and promote high quality industrial development by “act according to circumstances” and “sustainability”.
- (2)
Promoting innovation and policy guidance. With the strategy of “developing the country through science and education” in China, most provinces have engaged in “the war for talent”. Talents with specialized knowledge play an essential role in the conversion of Shandong’s new and old driving force. The Shandong provincial government should put forward the development strategy for innovation and entrepreneurship education, making sustained efforts to train creative talents and create a market-oriented, law-based, and internationalized business environment.
- (3)
Strengthening the construction of economic circle and “strong economy provincial capital”. Jinan and Qingdao have gathered a lot of resources and services, bringing the rapid development of economy, culture, and industry. They should play to the role of positive spatial spillover effect, therefore leading the new and old driving force development of surrounding cities. For all that, the government should increase investments in science and technology, and fully highlight the role of the energy efficiency of spatial spillover effects. Industrial cooperation is also essential in promoting high-quality development.
- (4)
Opening collaboratively and developing commonly. The cities in Shandong province should strengthen the industrial cooperation with those in other provinces, therefore breaking through the bottleneck of development and promoting high-quality development of the Yellow River Basin. At the same time, the protection and construction of the eco-environment should be regarded as important.
6. Discussion
We explored the temporal-spatial evolution of the regional new and old driving force conversion in Shandong province in China as an example in this study. Still, there are questions that need to be explained, including the methodologies and results comparisons.
- (1)
Methodologies for temporal-spatial evolution of regional new and old driving force conversion.
As mentioned in the literature review, few researchers have presented a framework of temporal-spatial evolution of the regional new and old economic driving force conversion from a regional perspective, which comprehensively and systematically reflects the progress of new and old driving force conversion. The exceptions are studies by Zhu, M. F. and Yang C. H. [
23], and by Fang, D. C. and Pei, M. D [
28]. They have provided an index system to measure the new and old driving force conversion and analyze the characteristics and rules. However, those methodologies are used for one specific industry, such as the tourism industry and steel industry. Additionally, they cannot apply to the evaluation of regional conversion of new and old driving force in a province. Furthermore, conversion measurement is unlike traditional mathematical statistics, which can calculate the sum of each variable, and it is affected by local economic and geographical conditions. Aiming to solve this problem, we measured the new and old economic driving force conversion speed and direction using the Moore index and the advanced industrial structure coefficient, respectively.
Evaluation index systems have always been one of the most common methods for the measurement of development in many fields. Economic structure optimization and innovation driving force are widely accepted indicators in the measurement of new and old driving force conversion. Nevertheless, most of the current studies missed the capacity and condition of waste disposal, which plays a prominent part in measuring the conversion progress. In this study, a novel evaluation index system with eight first-level and twenty-two second-level indicators is proposed to evaluate the level of new and old driving force conversion and its spatial pattern. In particular, element optimization, energy utilization, and waste reduction are included to reflect conversion ability and progress. To evaluate the conversion progress truly and objectively, an improved entropy approach is proposed by adding a time-dependent variable, making the analysis results more reasonable. Furthermore, global and local spatial correlation measurements of new and old driving force conversion are calculated using Moran’s I and Geoda. As a result, regional temporal-spatial evolution of the new and old driving conversion is accurately presented in Shandong province in China.
- (2)
Comparisons of results of regional new and old driving force conversion
Generally speaking, the measurement results differ from province to province, due to their local conditions. In this study, we present the temporal-spatial evolution analysis in Shandong province, China. The results are in line with Xu, Z. et al. [
20] who show that the conversion development progress is increasing year by year in most cities, and there is an imbalance between the different areas. Additionally, it is obvious that the conversion speed in eastern cities is better than those in middle and western cities, and there is a spatial agglomeration effect. Many researchers provided appropriate schemes and paths for economic driving forces conversion according to their local conditions. However, these strategies are not applicable to the studied province. According to the economic foundation and great potential, we provide suggestions and countermeasures of new and old driving force conversion in Shandong province. Still, the detailed development approach in each city requires a specific analysis of specific issues.
7. Conclusions and Future Works
Environmental protection and resource efficiency improvement cannot be done without the recognition, support, and participation by the government, the enterprises, and the public. Studying and exploring the conversion development of new and old driving force in Shandong province, on the one hand, can provide scientific evaluation references in constituting economic policy; on the other hand, it can provide a decision-making basis for promoting the cities’ industry restructuring in the future. In this study, we first present the evaluation methods measuring the new and old driving force conversion, including the Moore index, the advanced industrial structure coefficient, and so on. Then, the new and old driving force conversion development evaluation systems are proposed, and temporal-spatial evolution in Shandong is analyzed from the year 2015 to 2020, including its conversion speed, direction, and spatial correlation. The main conclusions are as follows:
- (1)
The conversion speed of new and old driving force in Shandong province increased gradually year by year. Compared with the primary and secondary industry, the tertiary industry grew rapidly from the year 2016 to 2018. From 2019, three industries have evolved in the direction of rationalization.
- (2)
The average conversion capacity of the new and old driving force in Shandong province has gotten more powerful in recent years. The regional disparity between I-large cities and others is significant, with high conversion power. Conversion developments in II-large cities and medium-sized cities are relatively slow, indicating unbalanced development in the studied province.
- (3)
Horizontal spatial correlation of new and old driving force conversion development is significant, and there is a prominent phenomenon of a cluster of economic geographical space. In addition, horizontal agglomeration showed a gradual downtrend, including positive spatial agglomeration effects, negative spatial agglomeration effects, and spatial differentiation from the Moran’s I plot.
Nonetheless, there are still some questions unsolved in this paper. For example, the conversion evolution of new and old driving force is relatively static, without dynamic changes from a long-term perspective. Similarly, this study focuses on the city level in Shandong province and is unable to obtain information on the conversion of the new and old driving force at a more micro level. In addition, some indicators have not been included in the conversion evaluation, owing to the microscopic data that is not available, which is the focus of works in the future.
Author Contributions
Conceptualization, X.W.; Data curation, S.W.; Methodology, X.W.; Writing—original draft, S.W.; Writing—review & editing, X.W. All authors have read and agreed to the published version of the manuscript.
Funding
This research was supported by the Natural Science Foundation of Shandong Province of China under Grant (ZR2020MG031); the Ministry of Education, Humanities and Social Sciences project of China (22A10456023).
Acknowledgments
We gratefully acknowledge the detailed and helpful comments of the anonymous reviewers, who have enabled us to improve this paper considerably.
Conflicts of Interest
The authors declare no conflict of interest.
References
- Pan, Y.; Dong, F. Dynamic evolution and driving factors of new energy development: Fresh evidence from China. Technol. Forecast. Soc. Chang. 2022, 176, 121475. [Google Scholar] [CrossRef]
- Simionescu, M.; Niculescu, M.D.V.; Sciubba, E. The relationship between economic growth and pollution in some new European union member states: A dynamic panel ARDL approach. Energies 2021, 14, 2363. [Google Scholar] [CrossRef]
- Zhou, W.Z.; Li, Q.H.; Cui, X.Q. Conversion efficiency of new and old driving energy and its impact factors in China’s construction industry based on Malmquist index method. J. Environ. Prot. Ecol. 2022, 23, 1309–1320. [Google Scholar]
- Vinh, N.D.; Khanh, N.D.; Nguyen, C.V. Real-time driving cycle measurements of fuel consumption and pollutant emissions of a bi-fuel LPG-gasoline motorcycle. Energy Convers. Manag. X 2021, 12, 100135. [Google Scholar]
- Cheng, M.; Yang, S.; Wen, Z. The effect of technological factors on industrial energy intensity in China: New evidence from the technological diversification. Sustain. Prod. Consum. 2021, 28, 775–785. [Google Scholar] [CrossRef]
- The Central People’s Government of the People’s Republic of China. Available online: http://www.gov.cn/zhengce/content/2021-04/30/content_5604138.htm (accessed on 16 August 2022).
- Somayeh, A.; Hajilooei, M.M. How does the decomposition approach explain changes in Iran’s energy consumption? What are the driving factors? Clean. Respon. Consum. 2022, 4, 100054. [Google Scholar]
- Surendra, K.M.; Samhita, P.; Bulusu, V.S.; Tata, N.R. Concept of thermodynamic studies in electrochemical storage and conversion systems. Encycl. Energy Storage 2022, 1, 264–274. [Google Scholar]
- Huang, J.; Wang, H.Q.; Wu, J.L.; Yang, Z.J.; Hu, X.B.; Bao, M.M. Exploring the key driving forces of the sustainable intergenerational evolution of the industrial alliance innovation ecosystem: Evidence from a case study of China’s TDIA. Sustainability 2020, 12, 1320. [Google Scholar] [CrossRef]
- Yang, H.X.; Jiao, Y. New and old driving energy conversion: Theoretical exploration and practical research. Res. Econ. Manag. 2018, 7, 16–28. [Google Scholar]
- Wei, H.; Yao, H. Environmental regulation, roundabout production, and industrial structure transformation and upgrading: Evidence from China. Sustainability 2022, 14, 3820. [Google Scholar] [CrossRef]
- Fatemeh, T.; Rashidi, A. Selection of project managers in construction firms using analytic hierarchy process (AHP) and fuzzy TOPSIS: A case study. J. Constr. Dev. Ctries. 2011, 16, 69–89. [Google Scholar]
- Wu, X.G.; Meng, Y.B. Evaluation and selection of cement suppliers under the background of new and old driving energy conversion in China. Sustainability 2022, 14, 11472. [Google Scholar] [CrossRef]
- Esmaili-Dooki, A.; Bolhasani, P.; Fallah, M. An integrated fuzzy AHP and fuzzy TOPSIS approach for ranking and selecting the chief inspectors of bank: A case study. J. Appl. Res. Ind. Eng. 2017, 1, 8–23. [Google Scholar]
- Aravossis, K.G.; Kapsalis, V.C.; Kyriakopoulos, G.L.; Xouleis, T.G. Development of a holistic assessment framework for industrial organizations. Sustainability 2019, 11, 3946. [Google Scholar] [CrossRef]
- Solangi, Y.A.; Tan, Q.; Mirjat, N.H.; Ali, S. Evaluating the strategies for sustainable energy planning in Pakistan: An integrated SWOT-AHP and Fuzzy-TOPSIS approach. J. Clean. Prod. 2019, 236, 117655.1–117655.14. [Google Scholar] [CrossRef]
- Zheng, J.H.; Song, J.; Zhang, Y.; Jiang, Q.K. The evaluation of conversion of new and old driving force of China’s economic growth. China Ind. Econ. 2018, 6, 24–42. [Google Scholar]
- Cui, J.H.; Li, W.L. Measurement of economic growth quality and characteristics of temporal and spatial evolution: Taking nine cities in Dawan district, Guangdong, Hongkong and Macao as an example. J. Ind. Technol. Econ. 2021, 12, 139–147. [Google Scholar]
- Xu, J.W. Research on industrial transformation and upgrading, and conversion of new and old driving force in central China. Macroecon. Manag. 2018, 3, 67–72. [Google Scholar]
- Xu, Z.; Fan, Y.; Pan, J.; Yao, S.; Zhang, W. Research on innovation ability of new and old driving energy conversion core cities in Shandong province. Mod. Ind. Econ. Inform. 2019, 10, 15–18. [Google Scholar]
- Ning, C.S. Evolution of industrial revolution and conversion of new and old driving force: Analysis based on historical and logical perspective. Macroecon. Manag. 2019, 11, 67–76. [Google Scholar]
- Zhang, L.X.; Wang, F.; Wang, Y.P. Breakthrough point and path of new and old driving energy conversion in Shandong: An empirical analysis based on municipal-level panel data from 2002 to 2016. Rev. Econ. Manag. 2018, 5, 27–41. [Google Scholar]
- Zhu, M.F.; Yang, C.H. Study on measurement of replacement of old economic drivers in Shanxi tourism and its influence. Sci. Technol. Ind. 2021, 21, 23–28. [Google Scholar]
- Bian, W.J.; Li, J.; Luo, G.L. Research on measurement method and application of new and old kinetic energy conversion in manufacturing industry. J. Univ. Jinan (Soc. Sci. Ed.) 2021, 31, 113–125. [Google Scholar]
- Zhang, T.G.; Chu, G.M. Analysis and measurement of the optimization of industrial structure promoted by financial development under the background of the transformation from old to new driving forces-taking the city of Qingdao for example. J. Qingdao Univ. Sci. Technol. (Soc. Sci.) 2021, 37, 31–38. [Google Scholar]
- Liu, H.D.; Zhang, J.J.; Zhang, Q. Quantitative measurement and progress evaluation of transformation of new and old kinetic energy in China’s iron and steel industry. Stat. Decis. 2020, 15, 110–113. [Google Scholar]
- Li, C.Y.; Zhou, R.Y.; Yu, M.J. Historical evolution and regional characteristics of the conversion of new and old driving force in China. J. Quant. Tech. Econ. 2021, 2, 3–23. [Google Scholar]
- Fang, D.C.; Pei, M.D. Study on the measurement of new and old driving force conversion and its influencing factors. Contemp. Econ. Manag. 2021, 43, 26–32. [Google Scholar]
- Shen, L.; Chen, Y.Y. Research on the performance evaluation index system of the financial expenditure of new and old growth drivers. Financ. Sci. 2021, 64, 59–68. [Google Scholar]
- Li, N.; Guo, X.Y.; Hao, Y.X.; Chen, M.Z.; Chen, M. Study on comprehensive evaluation and spatial-temporal evolution of regional new and old economic driving force conversion taking Shandong province as example. J. Math. Pract. Theory 2022, 52, 1–9. [Google Scholar]
- Huang, S.A. Conversion of new and old driving energy and Shandong’s economic development. Shandong Soc. Sci. 2017, 9, 101–108. [Google Scholar]
- Rupp, K.; Selberherr, S. The economic limit to Moore’s law. IEEE Trans. Semicond. Manuf. 2011, 24, 1–4. [Google Scholar] [CrossRef]
- Kang, L.; Liu, Y. Characteristics of industrial structure evolution and isomorphism in Central Asia. J. Geogr. Sci. 2021, 30, 1781–1801. [Google Scholar] [CrossRef]
- Harvey, J. Miller. Tobler’s first law and spatial analysis. Ann. Assoc. Am. Geogr. 2004, 94, 269–277. [Google Scholar]
- Jong, P.D.; Sprenger, C.; Veen, F.V. On extreme values of Moran’s I and Geary’s C (spatial autocorrelation). Geogr. Anal. 1984, 16, 17–24. [Google Scholar] [CrossRef]
- Waldhör, T. The spatial autocorrelation coefficient Moran’s I under heteroscedasticity. Stat. Med. 2010, 15, 887–892. [Google Scholar] [CrossRef]
- Yamada, H. Geary’s c and spectral graph theory. Mathematics 2021, 9, 2465. [Google Scholar] [CrossRef]
- Arthur, G.; Ord, J.K. The analysis of spatial association by use of distance statistics. Geogr. Anal. 1992, 24, 189–206. [Google Scholar]
- Maritz, A.; Perenyi, A.; de Waal, G.; Buck, C. Entrepreneurship as the unsung hero during the current COVID-19 economic crisis: Australian perspectives. Sustainability 2020, 12, 4612. [Google Scholar] [CrossRef]
- Kurniawati, M. The role of ICT infrastructure, innovation and globalization on economic growth in OECD countries, 1996–2017. J. Sci. Technol. Policy Manag. 2020, 11, 193–215. [Google Scholar] [CrossRef]
- China Stock Market & Accounting Research Database. Available online: https://www.gtarsc.com/ (accessed on 26 August 2022).
- Shandong Provincial Bureau of Statistics. Available online: http://tjj.shandong.gov.cn/ (accessed on 26 August 2022).
- Chinese Statistical Information. Available online: http://www.tjcn.org/ (accessed on 26 August 2022).
- Anselin, L.; Syabri, I.; Kho, Y. GeoDa: An introduction to spatial data analysis. Geogr. Anal. 2005, 38, 5–22. [Google Scholar] [CrossRef]
- Li, J.; Stephenson, B.; Motahari-Nezhad, H.R.; Singhal, S. GEODAC: A data assurance policy specification and enforcement framework for outsourced services. IEEE Trans. Serv. Comput. 2011, 4, 340–354. [Google Scholar] [CrossRef]
- Anselin, L. Local indicators of spatial association-LISA. Geogr. Anal. 1995, 27, 93–115. [Google Scholar] [CrossRef]
- Jie, W.; Zhu, Q.Y.; Yin, P.Z.; Song, M.L. Measuring energy and environmental performance for regions in China by using DEA-based Malmquist indices. Oper. Res. 2017, 17, 715–735. [Google Scholar]
Figure 1.
The basic framework of the new and old driving force conversion in China.
Figure 1.
The basic framework of the new and old driving force conversion in China.
Figure 2.
Average conversion development index from 2015 to 2020 in Shandong province.
Figure 2.
Average conversion development index from 2015 to 2020 in Shandong province.
Figure 3.
Temporal-spatial evolution of regional new and old driving force conversion in Shandong province. (a) 2015, (b) 2016, (c) 2017, (d) 2018, (e) 2019, (f) 2020.
Figure 3.
Temporal-spatial evolution of regional new and old driving force conversion in Shandong province. (a) 2015, (b) 2016, (c) 2017, (d) 2018, (e) 2019, (f) 2020.
Figure 4.
Moran’s I scatter plot of regional new and old driving force conversion in Shandong province. (a) 2015, (b) 2016, (c) 2017, (d) 2018, (e) 2019, (f) 2020.
Figure 4.
Moran’s I scatter plot of regional new and old driving force conversion in Shandong province. (a) 2015, (b) 2016, (c) 2017, (d) 2018, (e) 2019, (f) 2020.
Table 1.
Evaluation index on conversion development measurement of the new and old driving force.
Table 1.
Evaluation index on conversion development measurement of the new and old driving force.
| First-Level Index | Second-Level Index | Type | Weight |
|---|
| B1: New Technology | C11: Proportion of R&D personnel | Positive | 0.0644 |
| C12: Invention Patent number per ten thousand personnel | Positive | 0.0878 |
| C13: Total factor productivity | Positive | 0.0763 |
| B2: New Model | C21: Investment in informatization | Positive | 0.0248 |
| C22: Internet access rate | Positive | 0.0364 |
| B3: New Business Form | C31: Proportion of employment in software and information technology services | Positive | 0.0946 |
| C32: The express delivery per capita | Positive | 0.0571 |
| C33: Proportion of e-commerce sales in GDP | Positive | 0.0562 |
| B4: New Industry | C41: Total assets of mainframe computers and other electronic equipment | Positive | 0.0135 |
| C42: Proportion of high-tech industries in industries | Positive | 0.0364 |
| B5: Policy Support | C51: Improvement rate of the business environment | Positive | 0.0477 |
| C52: The product-market openness | Positive | 0.0564 |
| B6: Element Optimization | C61: Expenditure of R&D | Positive | 0.1008 |
| C62: Land use efficiency | Positive | 0.0337 |
| C63: The overall labor productivity | Positive | 0.0983 |
| B7: Energy Utilization | C71: Utilization rate of industrial solid waste | Positive | 0.0133 |
| C72: Greenland coverage rate of each district | Positive | 0.0247 |
| C73: Energy consumption per 1000$ GDP | Negative | 0.0395 |
| C74: Proportion of high energy consuming | Negative | 0.0246 |
| B8: Waste reduction | C81: General industry solid waste per 1000$ GDP | Negative | 0.0416 |
| C82: Quantity of industrial wastewaters per 1000$ GDP | Negative | 0.0358 |
| C83: Quantity of SO2 per 1000$ GDP | Negative | 0.0124 |
Table 2.
Spatial Weight Matrix.
Table 2.
Spatial Weight Matrix.
| Weight Matrix | Definition |
|---|
| W1: Spatial adjacency matrix | |
| W2: Geographical distance matrix | dij is the distance bewteen city i and city j. |
| W3: Economic distance matrix | |
| W4: Economic and geographical distance matrix | , and describe thegeographical distance and economic distance between city i and city j, respectively. |
Table 3.
Cities classification in Shandong province.
Table 3.
Cities classification in Shandong province.
| Group | Population (Million) | GDP (Billion) | Cities |
|---|
| I-large cities | >8 | >1000 | Jinan, Qingdao |
| II-large cities | ≥5 | ≥400 | Linyin, Yantai, Zibo, Jining, Weifang |
| Medium-sized cities | <5 | <400 | Zaozhuang, Weihai, Binzhou, Dezhou, Liaocheng, Heze, Dongying, Rizhao, Taian |
Table 4.
The conversion speed of new and old driving force in Shandong province.
Table 4.
The conversion speed of new and old driving force in Shandong province.
| Type | Cities | Phase I: 2015–2017 | Phase II: 2018–2020 |
|---|
| M+ | β (°) | k | M+ | β (°) | k |
|---|
| I-large cities | Jinan | 0.9983 | 3.3414 | 2.1625 | 0.9985 | 1.6206 | 1.2584 |
| Qingdao | 0.9980 | 3.6243 | 2.2593 | 0.9913 | 6.3317 | 3.6521 |
| II-large cities | Linyi | 0.9962 | 4.9965 | 2.2854 | 0.9915 | 7.4758 | 3.6524 |
| Yantai | 0.9968 | 4.5849 | 2.2641 | 0.9732 | 13.2947 | 5.5822 |
| Zibo | 0.9973 | 4.2113 | 2.2584 | 0.9948 | 5.8456 | 1.3541 |
| Jining | 0.9971 | 4.3646 | 2.5982 | 0.9987 | 2.9218 | 3.4157 |
| Weifang | 0.9973 | 4.2113 | 2.4257 | 0.9934 | 6.5864 | 3.6985 |
| Medium-sized cities | Zaozhuang | 0.9973 | 4.2113 | 2.1620 | 0.9865 | 9.4253 | 5.6857 |
| Dongying | 0.9961 | 5.0619 | 2.8921 | 0.9985 | 3.1386 | 3.284 |
| Taian | 0.9978 | 3.8013 | 2.0001 | 0.9919 | 7.2975 | 4.4385 |
| Weihai | 0.9972 | 4.2886 | 2.1959 | 0.9875 | 9.0687 | 3.0364 |
| Rizhao | 0.9974 | 4.1326 | 2.0963 | 0.9684 | 14.4421 | 3.5554 |
| Dezhou | 0.9968 | 4.5849 | 1.8104 | 0.9931 | 6.7346 | 3.8773 |
| Liaocheng | 0.9969 | 4.5126 | 1.9254 | 0.9657 | 15.0499 | 9.0667 |
| Binzhou | 0.9961 | 5.0619 | 2.6254 | 0.9837 | 10.3591 | 3.3524 |
| Heze | 0.9972 | 4.2886 | 2.0641 | 0.9685 | 14.4192 | 6.6857 |
Table 5.
The advanced industrial structure coefficient of the new and old driving force conversion in Shandong province.
Table 5.
The advanced industrial structure coefficient of the new and old driving force conversion in Shandong province.
| Type | Cities | Phase I: 2015–2017 | Phase II: 2018–2020 |
|---|
| The Primary Industry | The Secondary Industry | The Tertiary Industry | The Primary Industry | The Secondary Industry | The Tertiary Industry |
|---|
| I-large cities | Jinan | 0.49 | −0.87 | 2.43 | 0.36 | 0.65 | 1.42 |
| Qingdao | −0.49 | −0.51 | 2.68 | 2.39 | −5.51 | 5.65 |
| II-large cities | Linyi | −0.13 | −0.57 | 3.34 | 5.70 | −5.48 | 6.09 |
| Yantai | −0.21 | −0.29 | 2.53 | 7.17 | −10.46 | 13.88 |
| Zibo | 0.08 | −1.12 | 3.57 | −3.09 | 1.51 | 0.69 |
| Jining | 0.65 | −0.86 | 3.87 | −5.15 | 6.48 | −3.51 |
| Weifang | −0.26 | −0.43 | 2.58 | −7.51 | 12.07 | −9.39 |
| Medium-sized cities | Zaozhuang | 1.59 | −1.12 | 4.36 | −2.82 | 2.57 | −0.24 |
| Dongying | 0.15 | −0.39 | 2.53 | −3.28 | 2.57 | 0.06 |
| Taian | 1.56 | −2.37 | 4.93 | −2.52 | 6.49 | −3.72 |
| Weihai | 0.29 | −0.22 | 2.98 | −1.33 | 10.07 | −9.36 |
| Rizhao | 0.70 | −0.24 | 2.67 | −3.04 | 3.90 | −1.51 |
| Dezhou | −0.38 | 0.07 | 3.12 | −0.02 | −1.87 | 5.34 |
| Liaocheng | 7.65 | −10.35 | 23.16 | −2.88 | 1.92 | −0.21 |
| Binzhou | 0.63 | −0.58 | 3.59 | −9.42 | 11.58 | −9.37 |
| Heze | 0.31 | −0.92 | 3.56 | −2.63 | 2.93 | 0.42 |
Table 6.
The annual development index of the new and old driving force conversion in Shandong province.
Table 6.
The annual development index of the new and old driving force conversion in Shandong province.
| Indicator | 2015 | 2016 | 2017 | 2018 | 2019 | 2020 |
|---|
| B1: New Technology | 13.37 | 14.39 | 14.37 | 13.96 | 14.31 | 14.72 |
| B2: New Model | 9.85 | 10.57 | 10.56 | 11.57 | 11.57 | 12.80 |
| B3: New Business Form | 8.92 | 9.38 | 10.33 | 10.46 | 10.63 | 11.35 |
| B4: New Industry | 4.62 | 5.50 | 5.49 | 5.71 | 5.83 | 6.82 |
| B5: Policy Support | 5.39 | 5.17 | 5.72 | 5.39 | 5.69 | 6.57 |
| B6: Element Optimization | 13.27 | 15.31 | 14.80 | 15.43 | 15.92 | 15.83 |
| B7: Energy Utilization | 10.86 | 9.48 | 9.37 | 9.82 | 10.57 | 10.96 |
| B8: Waste reduction | 5.42 | 6.25 | 5.98 | 7.36 | 9.35 | 8.41 |
Table 7.
The new and old driving force conversion development index of in 2020 in Shandong province.
Table 7.
The new and old driving force conversion development index of in 2020 in Shandong province.
| Type | City | B1 | B2 | B3 | B4 | B5 | B6 | B7 | B8 |
|---|
| I-large cities | Jinan | 14.57 | 15.61 | 13.45 | 6.54 | 6.78 | 15.67 | 11.24 | 9.53 |
| Qingdao | 16.08 | 14.50 | 11.66 | 6.34 | 6.91 | 16.53 | 11.27 | 9.07 |
| II-large cities | Linyi | 11.96 | 11.63 | 10.36 | 5.34 | 5.63 | 14.10 | 10.35 | 8.64 |
| Yantai | 13.40 | 12.29 | 11.05 | 6.27 | 5.37 | 13.96 | 9.50 | 7.92 |
| Zibo | 14.85 | 13.64 | 10.87 | 5.80 | 5.81 | 14.51 | 10.36 | 8.24 |
| Jining | 12.61 | 11.30 | 9.63 | 5.67 | 5.19 | 15.08 | 10.62 | 8.63 |
| Weifang | 11.89 | 12.65 | 10.74 | 6.36 | 6.67 | 14.36 | 9.71 | 7.66 |
| Medium-sized cities | Zaozhuang | 11.53 | 11.55 | 8.58 | 5.45 | 5.28 | 14.01 | 11.63 | 6.35 |
| Dongying | 13.54 | 12.87 | 7.47 | 6.31 | 5.37 | 13.69 | 11.58 | 6.24 |
| Taian | 12.15 | 12.41 | 8.93 | 5.82 | 6.36 | 12.41 | 9.91 | 5.47 |
| Weihai | 11.63 | 11.63 | 9.36 | 5.76 | 5.10 | 13.80 | 10.57 | 6.01 |
| Rizhao | 12.38 | 11.52 | 9.87 | 5.56 | 5.13 | 13.66 | 9.34 | 5.19 |
| Dezhou | 12.61 | 11.27 | 8.98 | 5.81 | 5.40 | 13.73 | 10.49 | 5.31 |
| Liaocheng | 13.65 | 12.14 | 9.67 | 5.63 | 6.58 | 14.15 | 10.42 | 5.41 |
| Binzhou | 12.81 | 11.35 | 9.36 | 5.43 | 5.33 | 13.64 | 11.34 | 5.38 |
| Heze | 12.96 | 11.51 | 9.66 | 5.65 | 5.09 | 13.75 | 11.82 | 6.38 |
Table 8.
The new and old driving force conversion development index between 2015 and 2020 in Shandong province.
Table 8.
The new and old driving force conversion development index between 2015 and 2020 in Shandong province.
| Type | City | 2015 | 2016 | 2017 | 2018 | 2019 | 2020 |
|---|
| I-large cities | Jinan | 75.68 | 80.24 | 81.67 | 83.62 | 85.30 | 93.39 |
| Qingdao | 75.37 | 78.63 | 82.15 | 84.31 | 85.64 | 92.36 |
| II-large cities | Linyi | 64.36 | 65.82 | 67.52 | 68.66 | 72.38 | 78.01 |
| Yantai | 71.60 | 72.36 | 73.77 | 73.63 | 75.69 | 76.76 |
| Zibo | 70.39 | 71.52 | 74.62 | 75.38 | 78.87 | 84.08 |
| Jining | 65.34 | 66.39 | 68.33 | 69.66 | 73.61 | 78.73 |
| Weifang | 68.22 | 69.34 | 70.34 | 73.17 | 75.74 | 80.04 |
| Medium-sized cities | Zaozhuang | 66.37 | 67.52 | 70.91 | 71.73 | 73.81 | 74.38 |
| Dongying | 71.29 | 72.84 | 75.63 | 74.82 | 75.34 | 77.07 |
| Taian | 66.38 | 66.51 | 68.64 | 71.26 | 72.92 | 73.46 |
| Weihai | 65.32 | 66.91 | 68.42 | 68.53 | 70.54 | 73.86 |
| Rizhao | 65.26 | 66.84 | 68.83 | 68.63 | 70.15 | 72.65 |
| Dezhou | 63.61 | 64.51 | 66.88 | 69.62 | 70.55 | 73.60 |
| Liaocheng | 65.27 | 67.18 | 68.33 | 71.10 | 72.52 | 73.65 |
| Binzhou | 67.88 | 68.66 | 70.34 | 71.28 | 73.81 | 74.64 |
| Heze | 65.60 | 66.57 | 68.93 | 70.27 | 73.18 | 76.82 |
| Average | | 68.49 | 70.05 | 72.20 | 73.60 | 75.44 | 78.78 |
Table 9.
Values of global Moran’s I in Shandong province from 2015–2020.
Table 9.
Values of global Moran’s I in Shandong province from 2015–2020.
| Item | 2015 | 2016 | 2017 | 2018 | 2019 | 2020 |
|---|
| Moran’s I | 0.645 | 0.531 | 0.581 | 0.494 | 0.477 | 0.508 |
| z | 5.314 | 5.234 | 4.437 | 3.932 | 3.741 | 2.536 |
| p-value | 0.001 | 0.003 | 0.012 | 0.011 | 0.026 | 0.021 |
Table 10.
Cities’ conversion evolution of the new and old driving force conversion in Shandong.
Table 10.
Cities’ conversion evolution of the new and old driving force conversion in Shandong.
| Type | City | 2015 | 2016 | 2017 | 2018 | 2019 | 2020 |
|---|
| I-large cities | Jinan | H-H | H-H | H-H | H-H | H-H | H-H |
| Qingdao | H-H | H-H | H-H | H-H | H-H | H-H |
| II-large cities | Linyi | L-L | L-L | L-L | L-L | L-L | L-L |
| Yantai | H-H | H-H | H-H | H-H | H-H | H-H |
| Zibo | H-H | H-H | H-H | H-H | H-H | H-L |
| Jining | L-L | L-L | L-L | L-L | L-L | L-L |
| Weifang | L-L | L-L | L-L | L-L | L-L | L-L |
| Medium-sized cities | Zaozhuang | L-L | L-L | L-L | L-L | L-L | L-L |
| Dongying | H-H | H-H | H-H | H-H | H-H | H-H |
| Taian | L-L | L-L | L-L | L-L | L-L | L-L |
| Weihai | L-L | L-L | L-L | L-L | L-L | L-H |
| Rizhao | L-L | L-L | L-L | L-L | L-L | L-L |
| Dezhou | L-L | L-L | L-L | L-L | L-L | L-L |
| Liaocheng | H-H | H-H | H-H | H-H | H-H | H-H |
| Binzhou | L-L | L-L | L-L | L-L | L-L | L-L |
| Heze | L-L | L-L | L-L | L-L | L-L | L-L |
| Publisher’s Note: MDPI stays neutral with regard to jurisdictional claims in published maps and institutional affiliations. |
© 2022 by the authors. Licensee MDPI, Basel, Switzerland. This article is an open access article distributed under the terms and conditions of the Creative Commons Attribution (CC BY) license (https://creativecommons.org/licenses/by/4.0/).


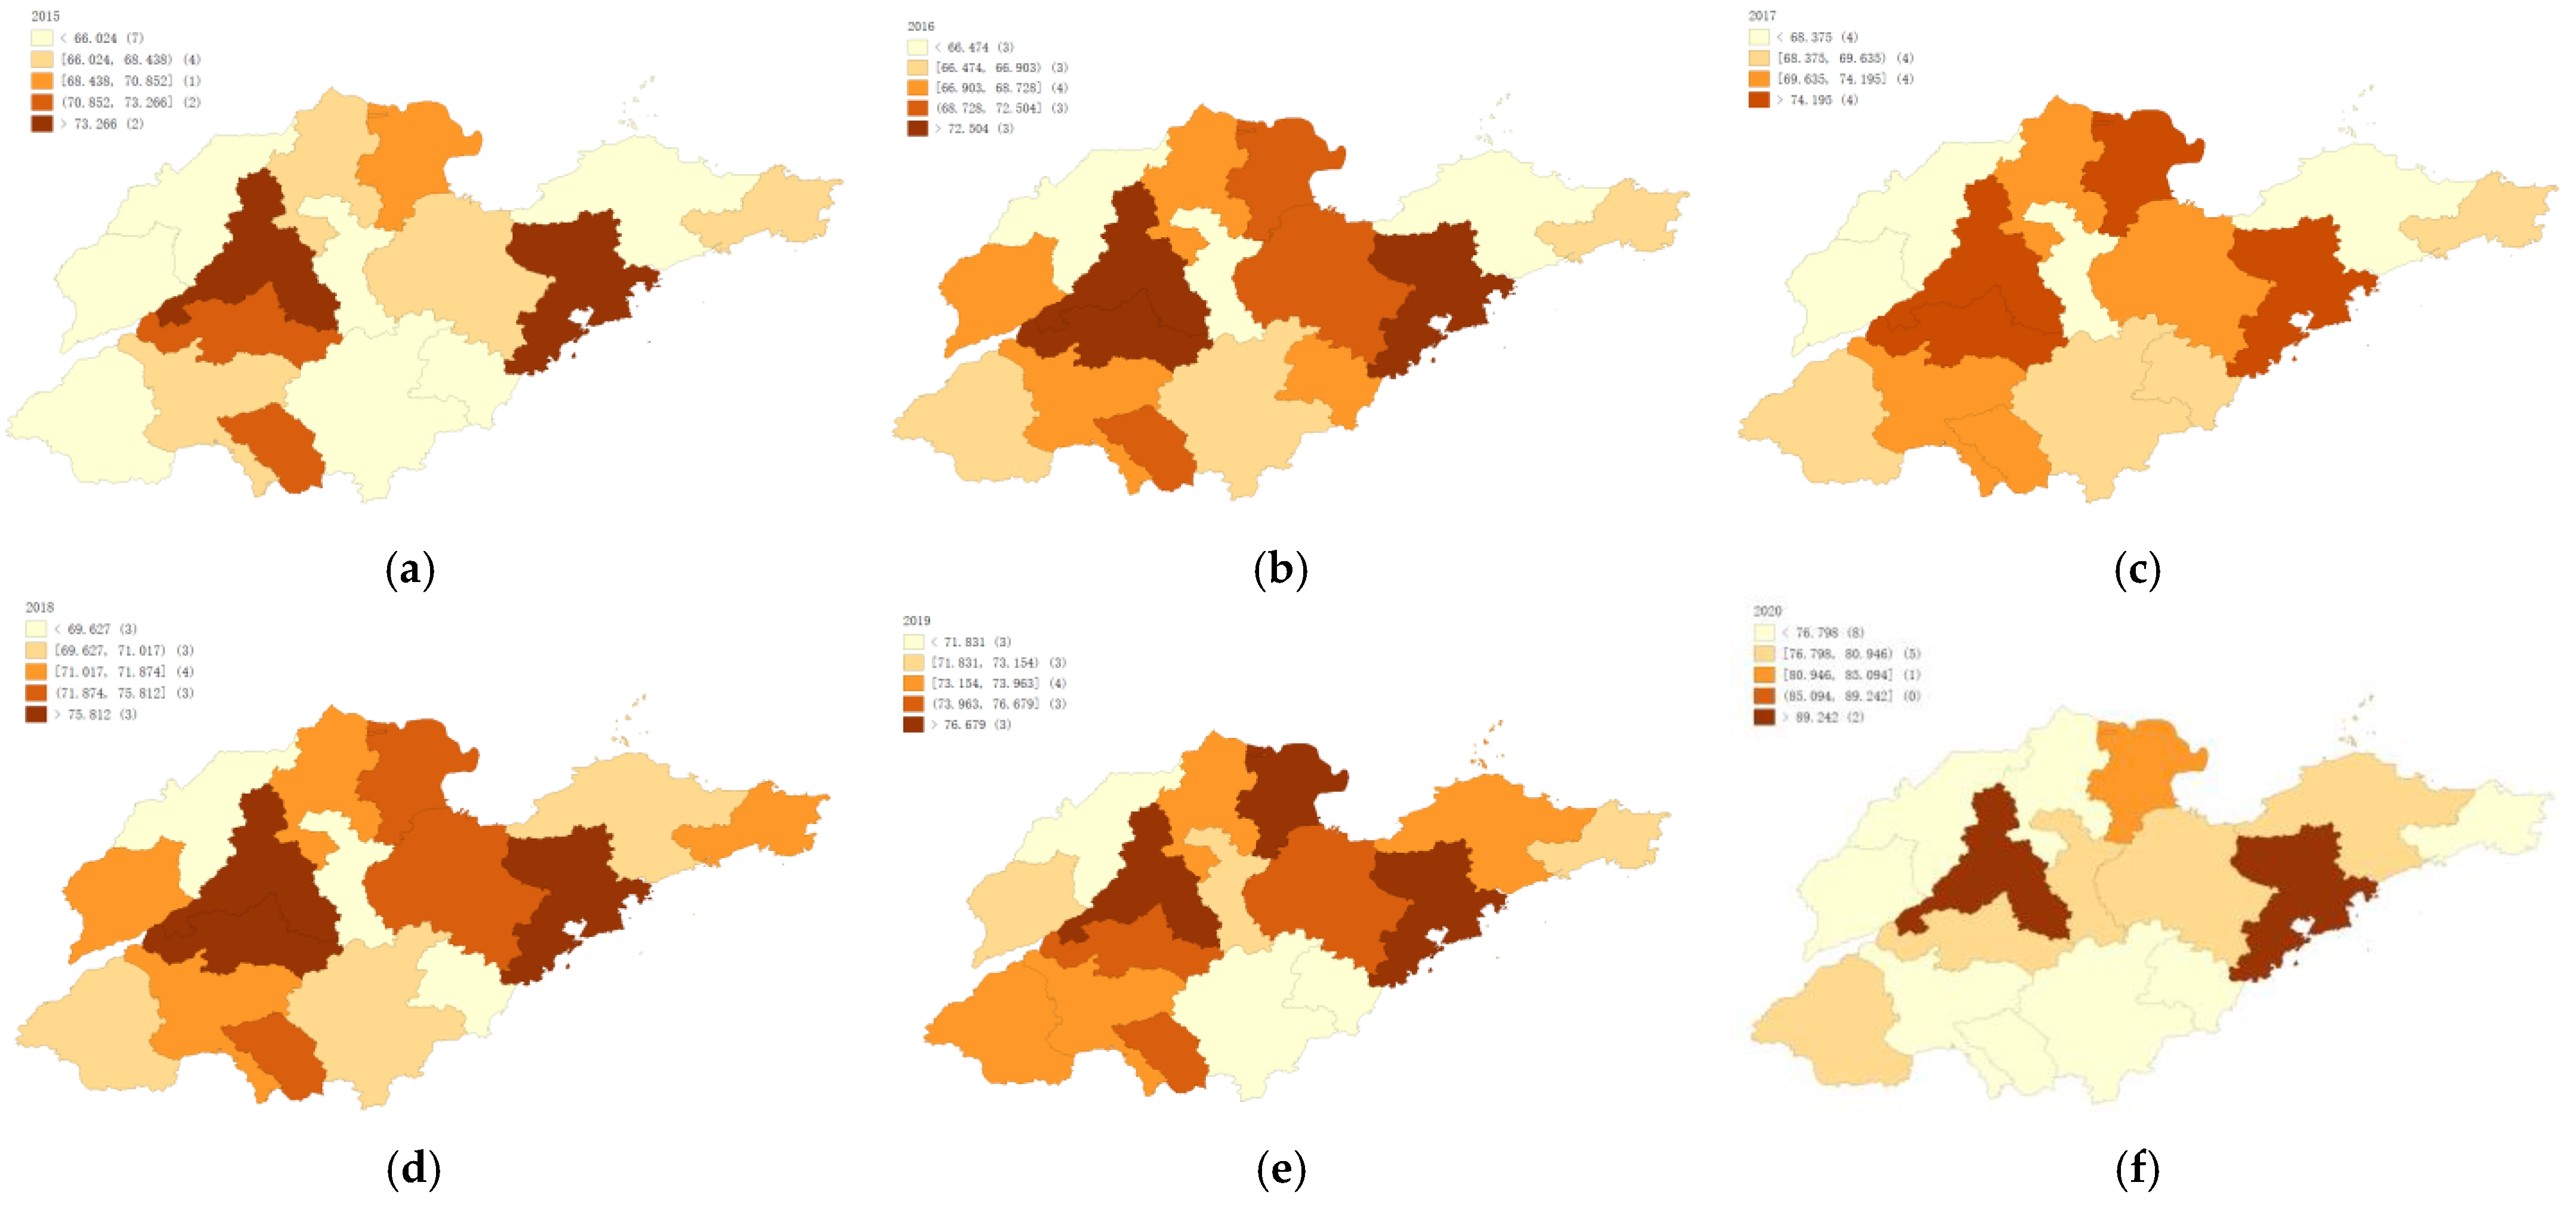
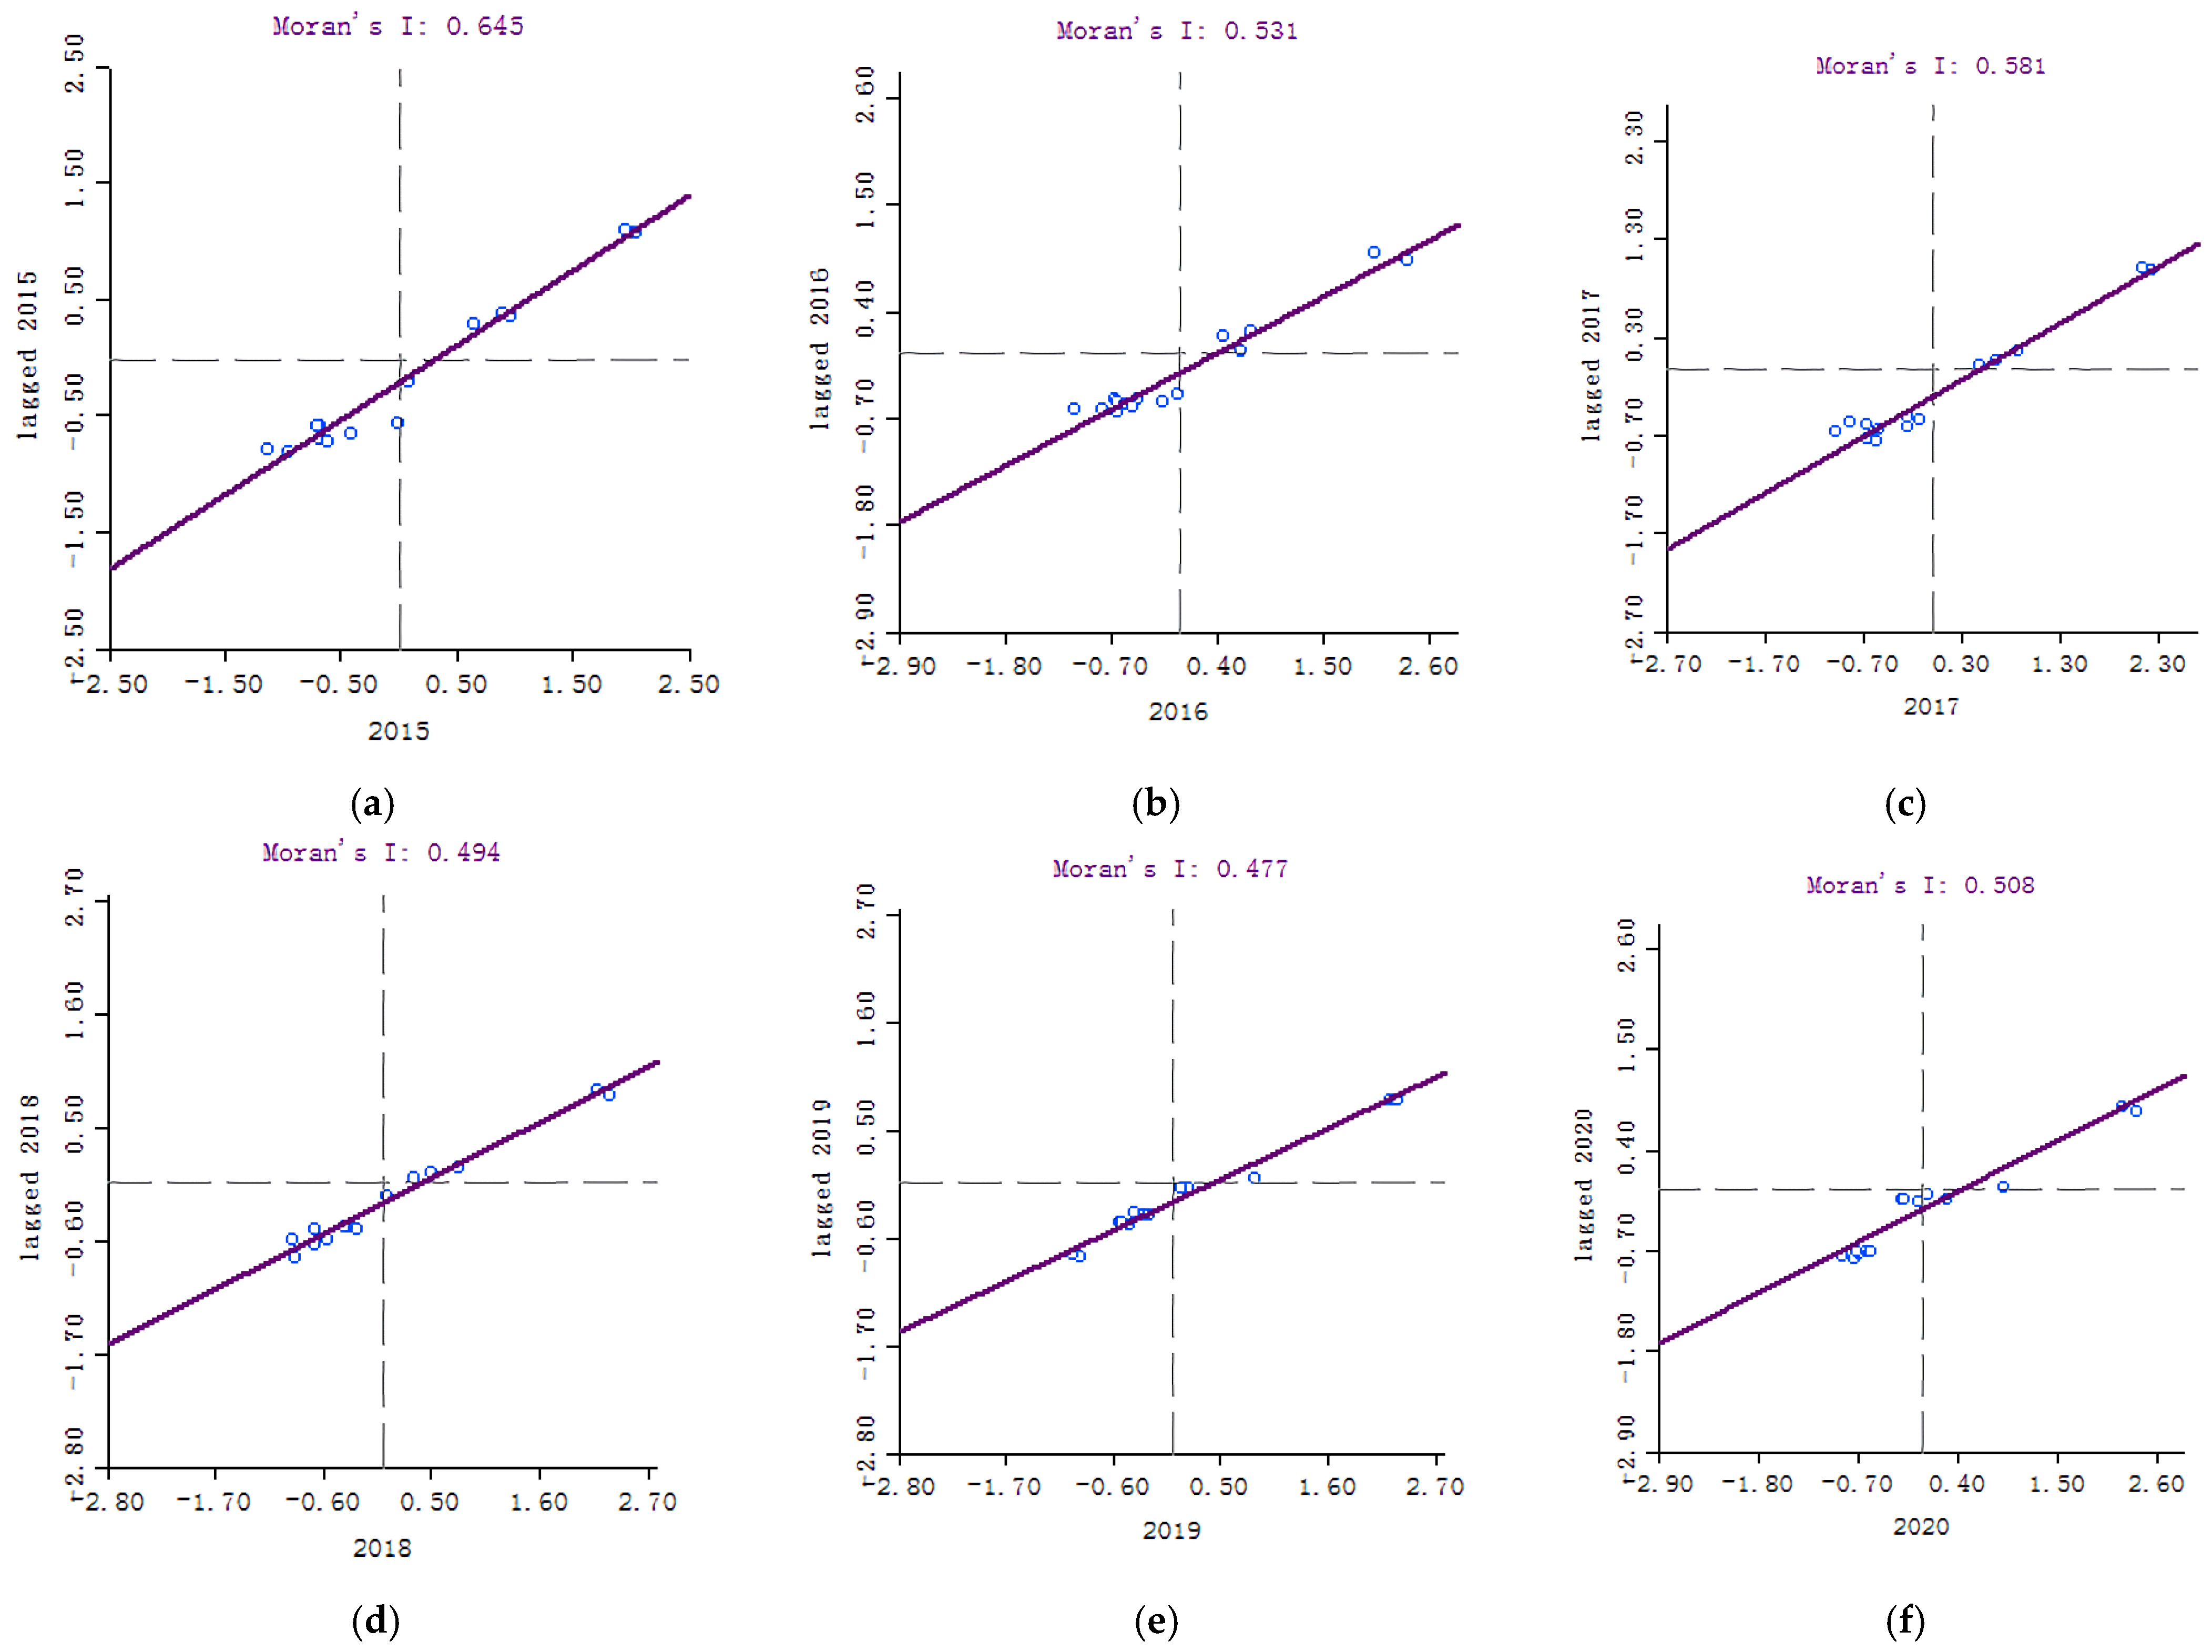