Article

Students’ Academic Performance and Engagement Prediction in a Virtual Learning Environment Using Random Forest with Data Balancing

1
College of Computing and Informatics, Saudi Electronic University, Riyadh 11673, Saudi Arabia
2
Department of IT & Computer Science, Pak-Austria Fachhochshule Institute of Applied Sciences & Technology, Haripur 22650, Pakistan
*
Authors to whom correspondence should be addressed.
Sustainability 2022, 14(22), 14795; https://doi.org/10.3390/su142214795
Submission received: 25 September 2022 / Revised: 30 October 2022 / Accepted: 1 November 2022 / Published: 9 November 2022
(This article belongs to the Special Issue Sustainable E-learning and Education with Intelligence)

Abstract

:
Virtual learning environment (VLE) is vital in the current age and is being extensively used around the world for knowledge sharing. VLE is helping the distance-learning process, however, it is a challenge to keep students engaged all the time as compared to face-to-face lectures. Students do not participate actively in academic activities, which affects their learning curves. This study proposes the solution of analyzing students’ engagement and predicting their academic performance using a random forest classifier in conjunction with the SMOTE data-balancing technique. The Open University Learning Analytics Dataset (OULAD) was used in the study to simulate the teaching–learning environment. Data from six different time periods was noted to create students’ profiles comprised of assessments scores and engagements. This helped to identify early weak points and preempted the students performance for improvement through profiling. The proposed methodology demonstrated 5% enhanced performance with SMOTE data balancing as opposed to without using it. Similarly, the AUC under the ROC curve is 0.96, which shows the significance of the proposed model.

1. Introduction

E-Learning systems confront a plethora of challenges but the most considerable of them is the lack of students’ interest in a variety of activities. In this scenario, if students’ engagements and academic performance are predicted, it will help to achieve the basic purpose of distance learning. In a virtual learning environment (VLE), a ginormous amount of data is produced by the participation of students every day. This trove of data can be utilized for student profiling as well as generating trends and hidden patterns. The focus of this study is to predict the academic performance and engagement of students in VLEs through student profiling using artificial-intelligence and machine-learning techniques. The freely available Open University Learning Analytics Dataset (OULAD) is used for this purpose. In the initial stages, students’ course information is taken from VLEs, which is preprocessed and cleansed. Our built models are trained on the extracted information and tested on new data that will end up in model evaluation. The model evaluation and building is conducted iteratively until the best performance is revealed.
Information-communications-technology (ICT)-based tools have made VLEs more reliable and, therefore, more universities are now offering online education. Particularly, due to COVID-19, higher education institutions in the Kingdom of Saudi Arabia and around the world have shifted their course offerings to e-learning.
In order to guide analytics in the e-learning paradigm, it is important to have techniques that can provide true analysis of the generated data from students’ interactions with the system. Students’ interactions can be revealed and associated with their performance on a particular course. The primary objective of the proposed model is to predict students’ academic performance and their engagement in various activities through students’ profiling in VLE using random forest and data balancing.
In an e-learning environment, students usually do not take an interest in assessment and learning activities. The proposed model will be used to increase the participation level of students by letting them know about their projected performance in advance. Particularly, it will help students improve their academic performance through active participation in academic activities. Development of such models will certainly be useful in identifying social, environment and behavioral factors affecting students’ overall performance in e-learning environments.
The primary contributions of this article include the following:
1.
We construct students’ profiles by combining their assessment scores and engagement with a VLE.
2.
We utilize random forest in conjunction with a data-balancing technique to predict the students’ academic performance from their profiles.
3.
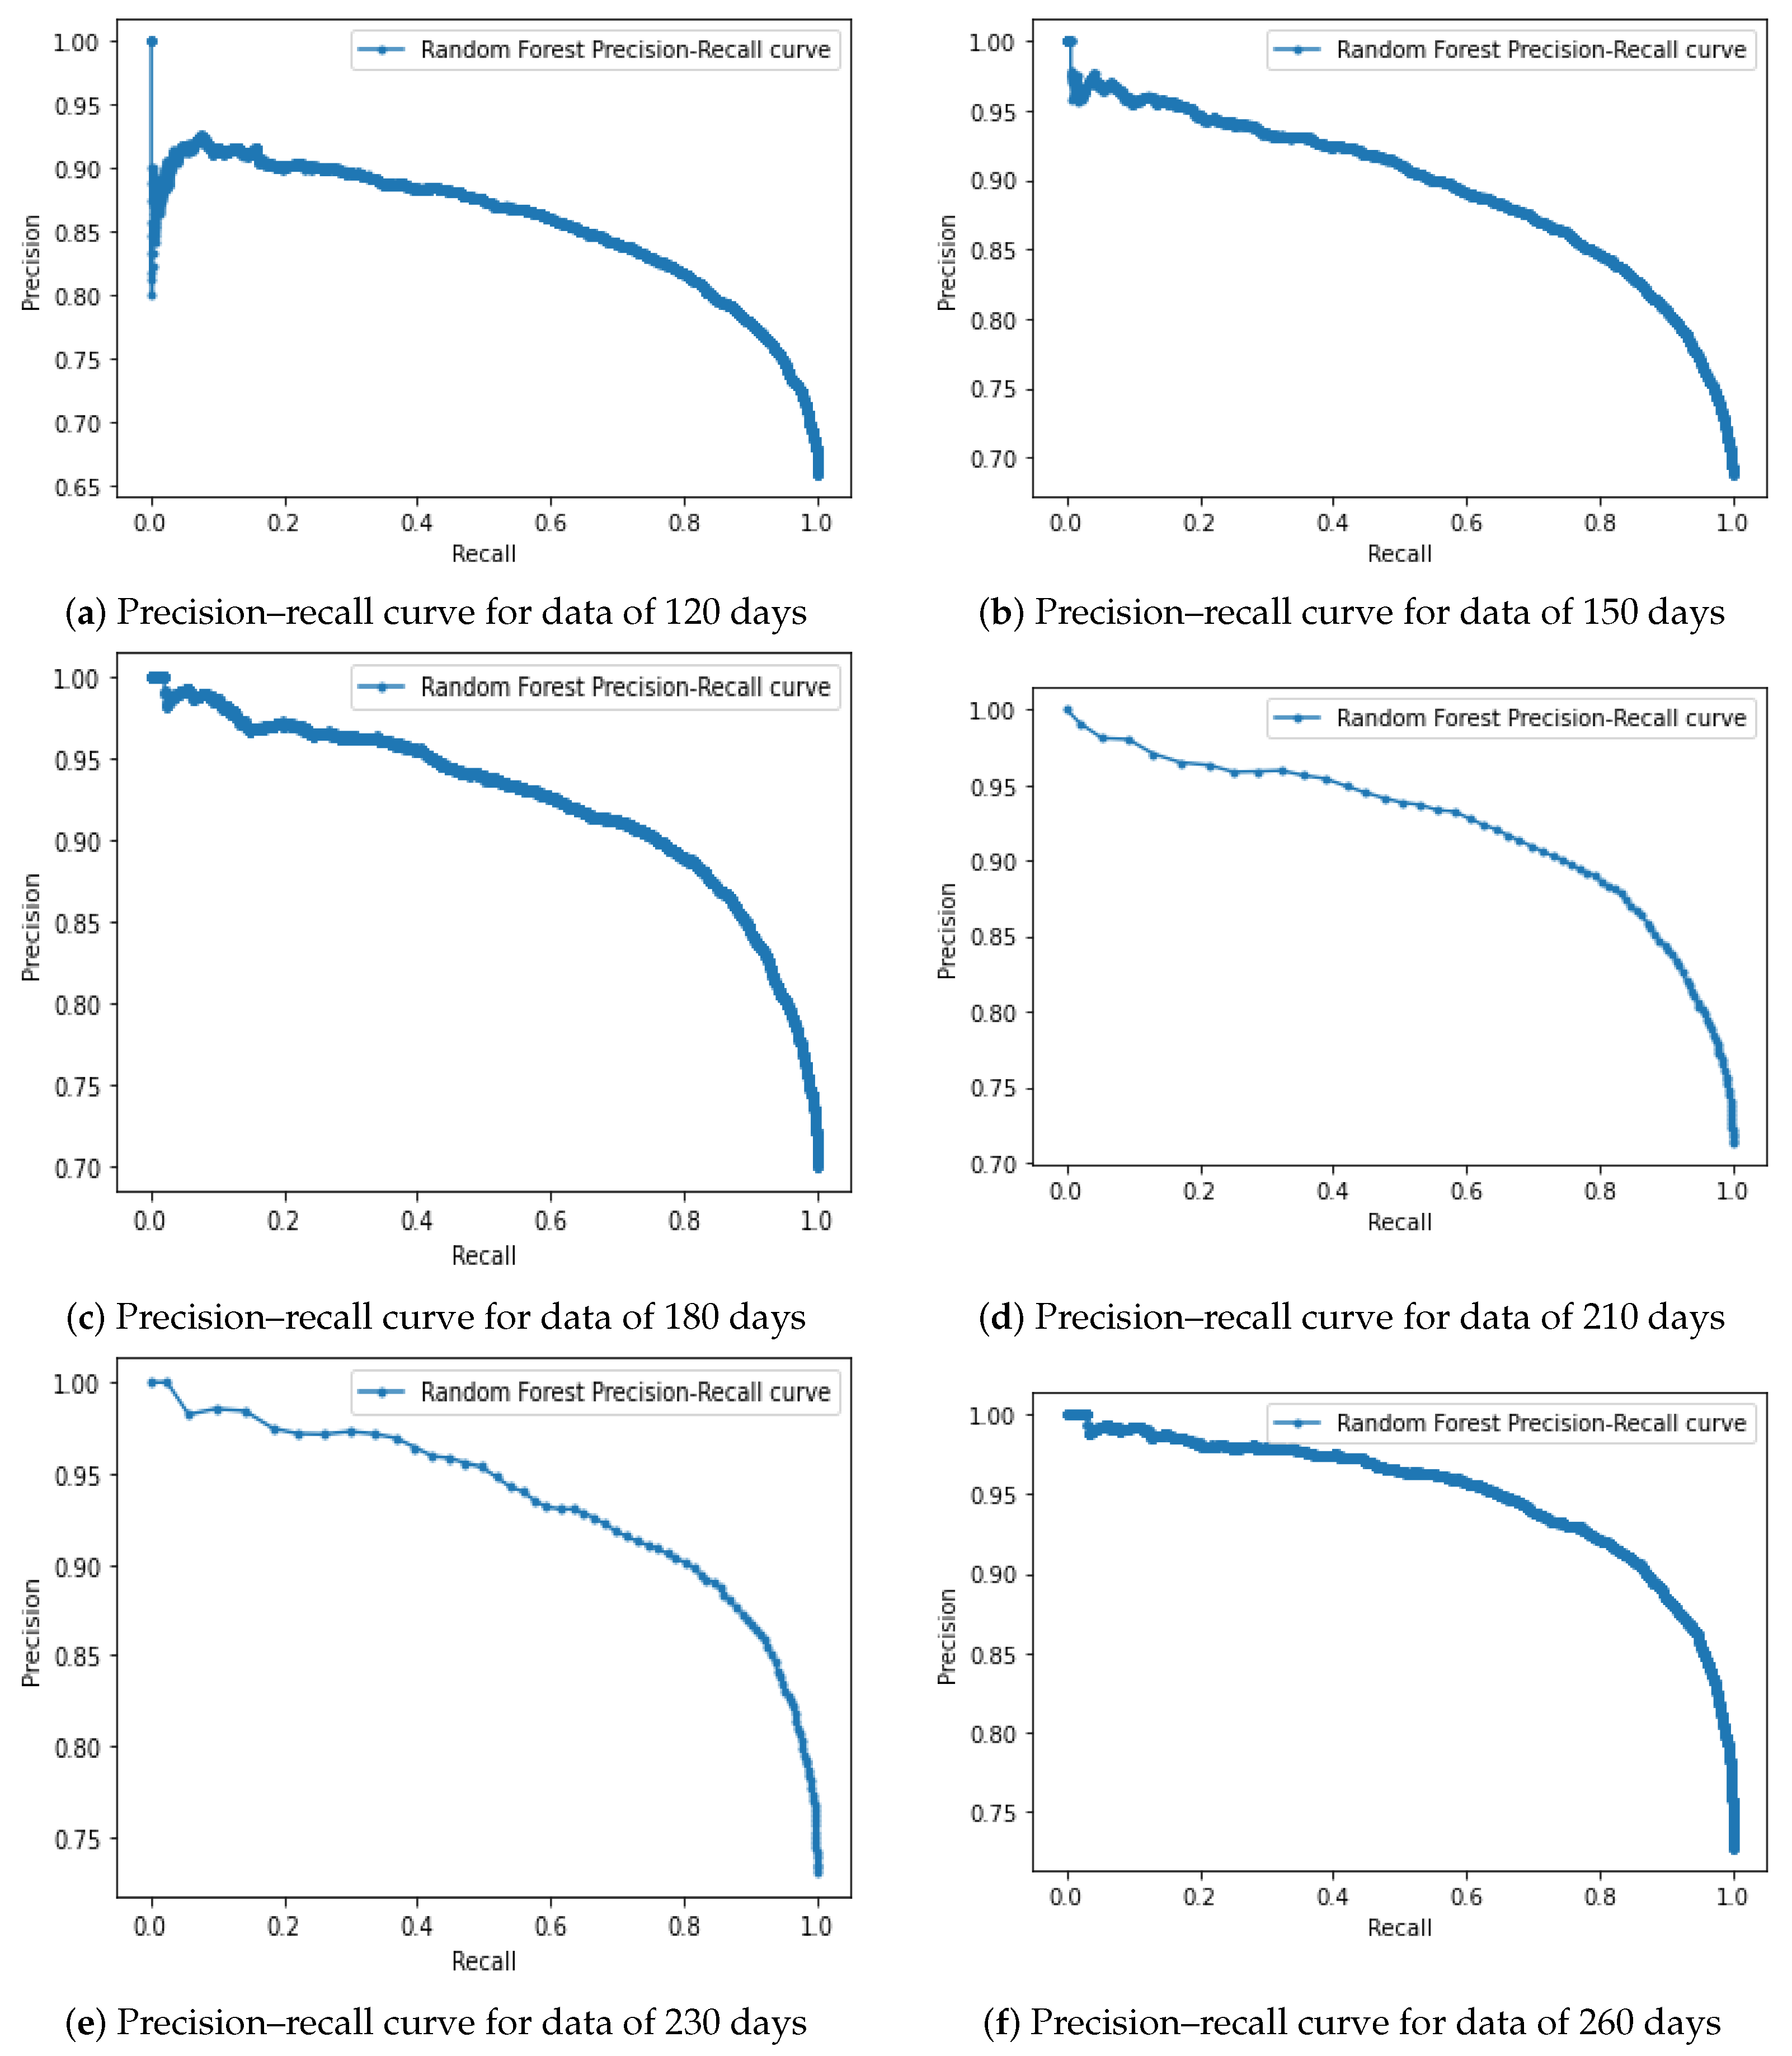
We investigate the performance of our proposed model by exploiting data from six different intervals, including the data for first 120 days, 150 days, 180 days, 210 days, 230 days, and 260 days.

2. Related Work

Traditional education and computer-based education are the two educational environments in practice today across academia, where the latter is well-known as e-learning [1]. Educational institutions around the world are now rapidly moving towards e-learning, with novel learning strategies that can help improve learning methodologies [2]. Innovation in information and communication technology tools have played a critical role in the growth of web-based teaching and learning processes [3], particularly in the post-COVID-19 scenario. E-learning systems have not only become an integral part of teaching over the web but also play a fundamental role in aiding face-to-face student–teacher sessions [4]. Transition from traditional learning environments to e-learning environments has created many challenges, particularly the lack of interest of the students, which affects their academic performance. Therefore, it is of the utmost importance to develop techniques which can identify reasons and forecast students’ projected performance. To achieve this, a number of studies [5,6,7,8,9,10] have been conducted in the recent past to explore the e-learning domain.
Ghassen Ben Brahim [11] extracted an 86-dimensional feature space where only informative features were exploited by various machine-learning algorithms to categorize a student as an academically low performer or high performer. The author evaluated the performance of the proposed methodology under three different experimental scenarios and obtained a 97.4% accuracy using a random-forest classifier.
Nikola et al. [12] employed various machine-learning algorithms to analyze the performance of their proposed approach. The authors addressed the problem of exam prediction both as classification and regression tasks. In the case of classification, the students were identified either as “pass” or “fail” where, as in case of regression, the actual score of the student exam was predicted. Similarly, Sekeroglu et al. [13] analyzed the Student Performance Dataset and Students Academic Performance Dataset using a number of machine-learning algorithms where the former dataset was used for prediction and the latter for classification. Burgos [14] took students’ online activities into account to predict their performance while using an e-learning system. The author categorized students based on their learning styles using the data obtained from their log-in history and learning management system from the Sakai platform [15]. Prior to classification, preprocessing, feature selection and parameter optimization was performed. This type of categorization will help to predict students’ performance in a particular course. Another study [16] showed that machine-learning techniques can effectively use historical grades of a student to predict their final grades. A dashboard was designed to forecast students’ performance in real time which may help prevent students from making premature decisions about dropping out. In another study [17], machine-learning techniques were used to predict students’ engagement from their behavioral features and analyze its effect on assessment grades. Instructors can easily identify low-engagement students with the help of a dashboard that displays students’ activities in the learning environment. An adaptive gamified learning system [18] was developed which utilizes educational data mining with gamification and adaptation techniques to increase the engagement of students in the learning environment and, consequently, their performance. The effectiveness of gamification against adaptive gamification was analyzed in the e-learning environment. Sana et al. [19] utilized three classifiers to develop a framework for the prediction of students’ performance. The authors preprocessed the data collected from a Kalboard 360 online-learning management system by removing less important and redundant features. Next, they performed feature selection and analysis to identify the most discriminative features. Finally, classification algorithms were used to predict the students’ performance. They reported the performance using accuracy, precision, recall and F-measure. Abubakar and Ahmad [20] used a random forest algorithm to predict student performance based on their interaction with an e-learning system and assessment marks. They also identified significant attributes, among others that were observed, to be more useful in performance prediction. The literature revealed that machine-learning algorithms can play a very crucial role in enhancing students’ interest in e-learning environments. Forecasting the results of students will encourage them to complete their courses. This is due to the fact that students usually drop a course based on their false assumption of failing the course. In this work, we will analyze the performance of a random-forest algorithm in combination with SMOTE data balancing for its effectiveness in predicting students’ projected performance.
The rest of the article is structured as follows. Section 3 describes the dataset, data-collection process, data cleansing, model-building process, and evaluation measures. Section 4 explains the experimental setup. Section 5 highlights the obtained results. Section 7 concludes the article.

3. Materials and Methods
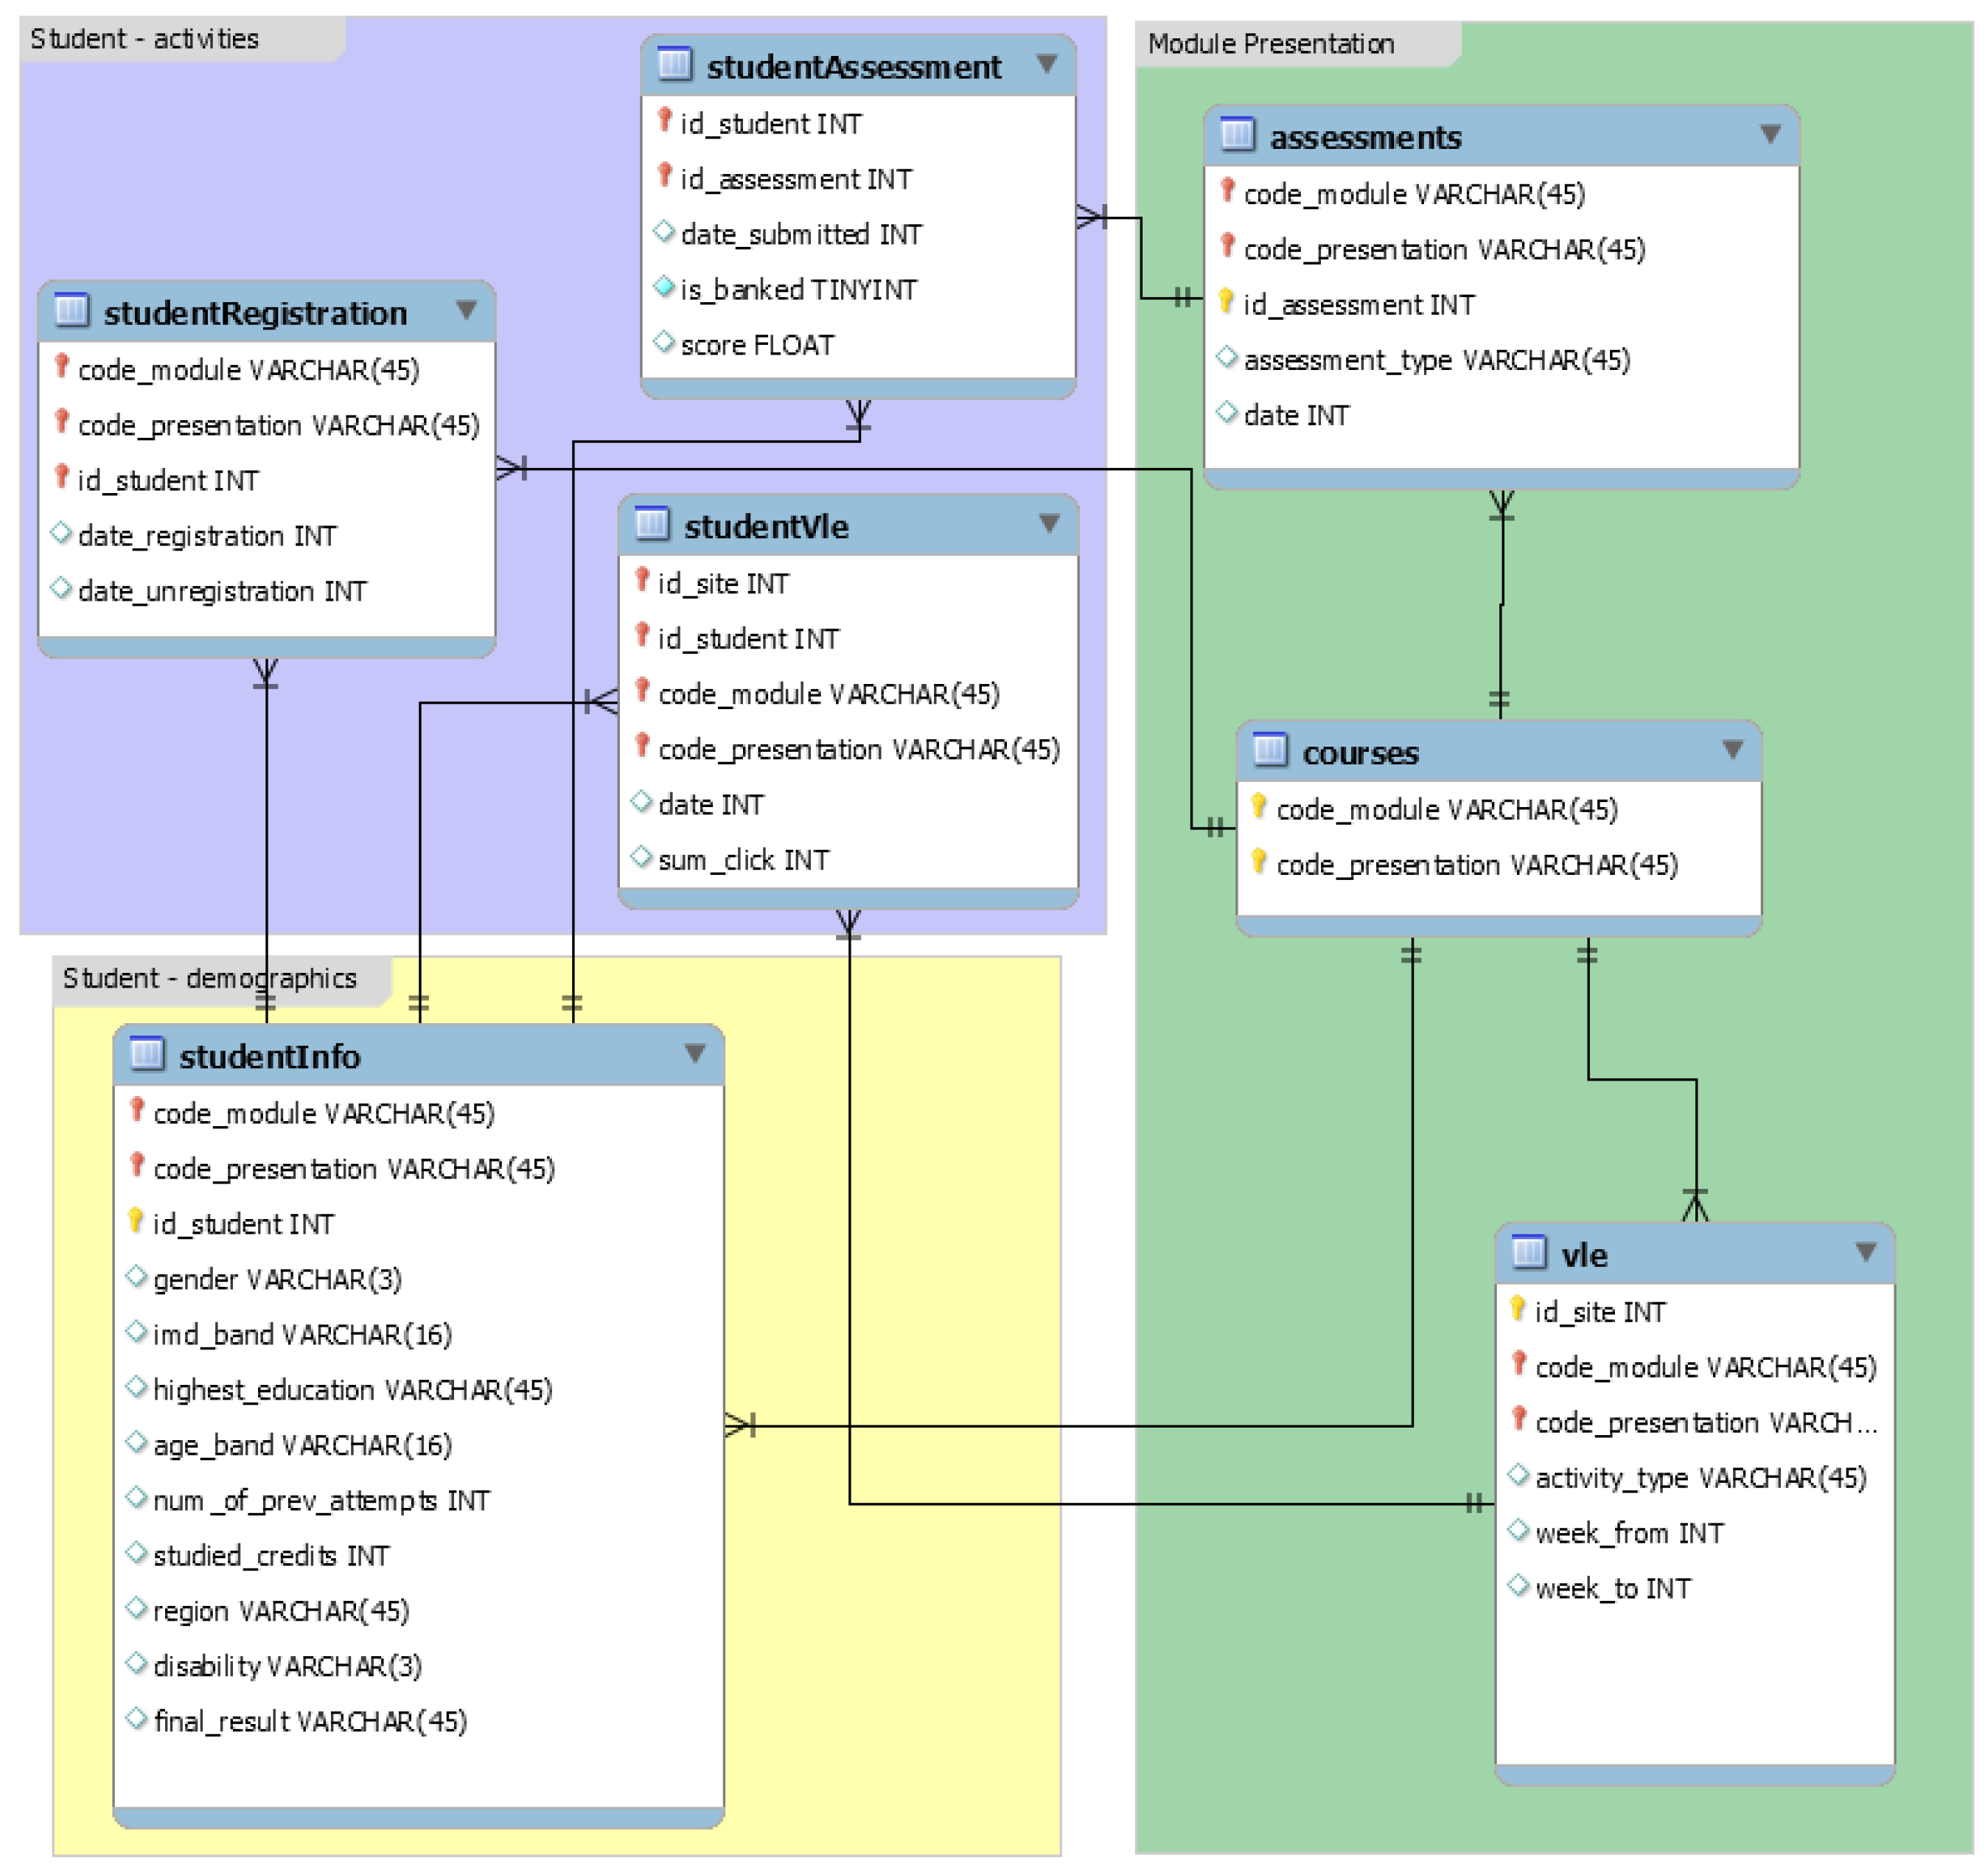
3.1. Dataset

Open University Learning Analytics Dataset (OULAD) [21] contains data about courses, students, and the interactions of those students with the VLE. As mentioned in the original documentation of this data, there are total of 7 recorded modules denoted as AAA, BBB, CCC, DDD, EEE, FFF, and GGG. The courses were offered in February and October, respectively, denoted as B and J, where the February semesters are usually 20 days shorter than the October semesters. The data for courses CCC, EEE, and GGG are not available for the years 2013 and 2014.
The dataset was developed from data of 22 modules taught at the Open University which contains not only the demographic data of 32,593 students but also the aggregated data of their assessment results and clickstreams in the form of their interactions with the university VLE. The clickstream data is logged as daily summaries which consist of 10,655,280 entries. Figure 1 illustrates the database schema of the utilized dataset i.e., OULAD which shows student demographics, student activities, and module presentation with detailed data attributes and data types. The dataset is student-centric rather than course-centric. The “courses” relation contains data about course name (code_module), the year and semester in which it is offered (code_presentation), and the length of the module presentation in number of days (length). The ”assessments” relation has information about assessments conducted in a given module presentation. In each course module, there are assessments and a final exam. Total weight of the exams and other assessments is 100 each. However, in some courses, only exams are weighted such as course GGG. Similarly, all computer-marked assessments (CMAs) are on the same date in course GGG. Another interesting fact about course GGG is that the first assessment is after 60 days, whereas in all other courses it is during the first 30 days. The “VLE” relation contains information about all the resources accessible to the students in the VLE which are usually pdf files and html pages. Studets’ interactions with these online resources are recorded as resource identification number (id_site), code_module, code_presentation, activity_type, the week from which the material is scheduled to be used (week_from), and week until which the resource is scheduled to be used (week_to). The demographics of students are provided in the “studentInfo” relation. The “studentRegistration” table contains information about the registration time of a course presentation. The date of unregistration is also found here. The “studentAssessment” relation has the results of the students’ submitted assessments. The value of score field in this relation ranges from 0–100, where the passing score is 40 or above.
Figure 2 highlights the gender-wise distribution of students.

3.2. Data Collection
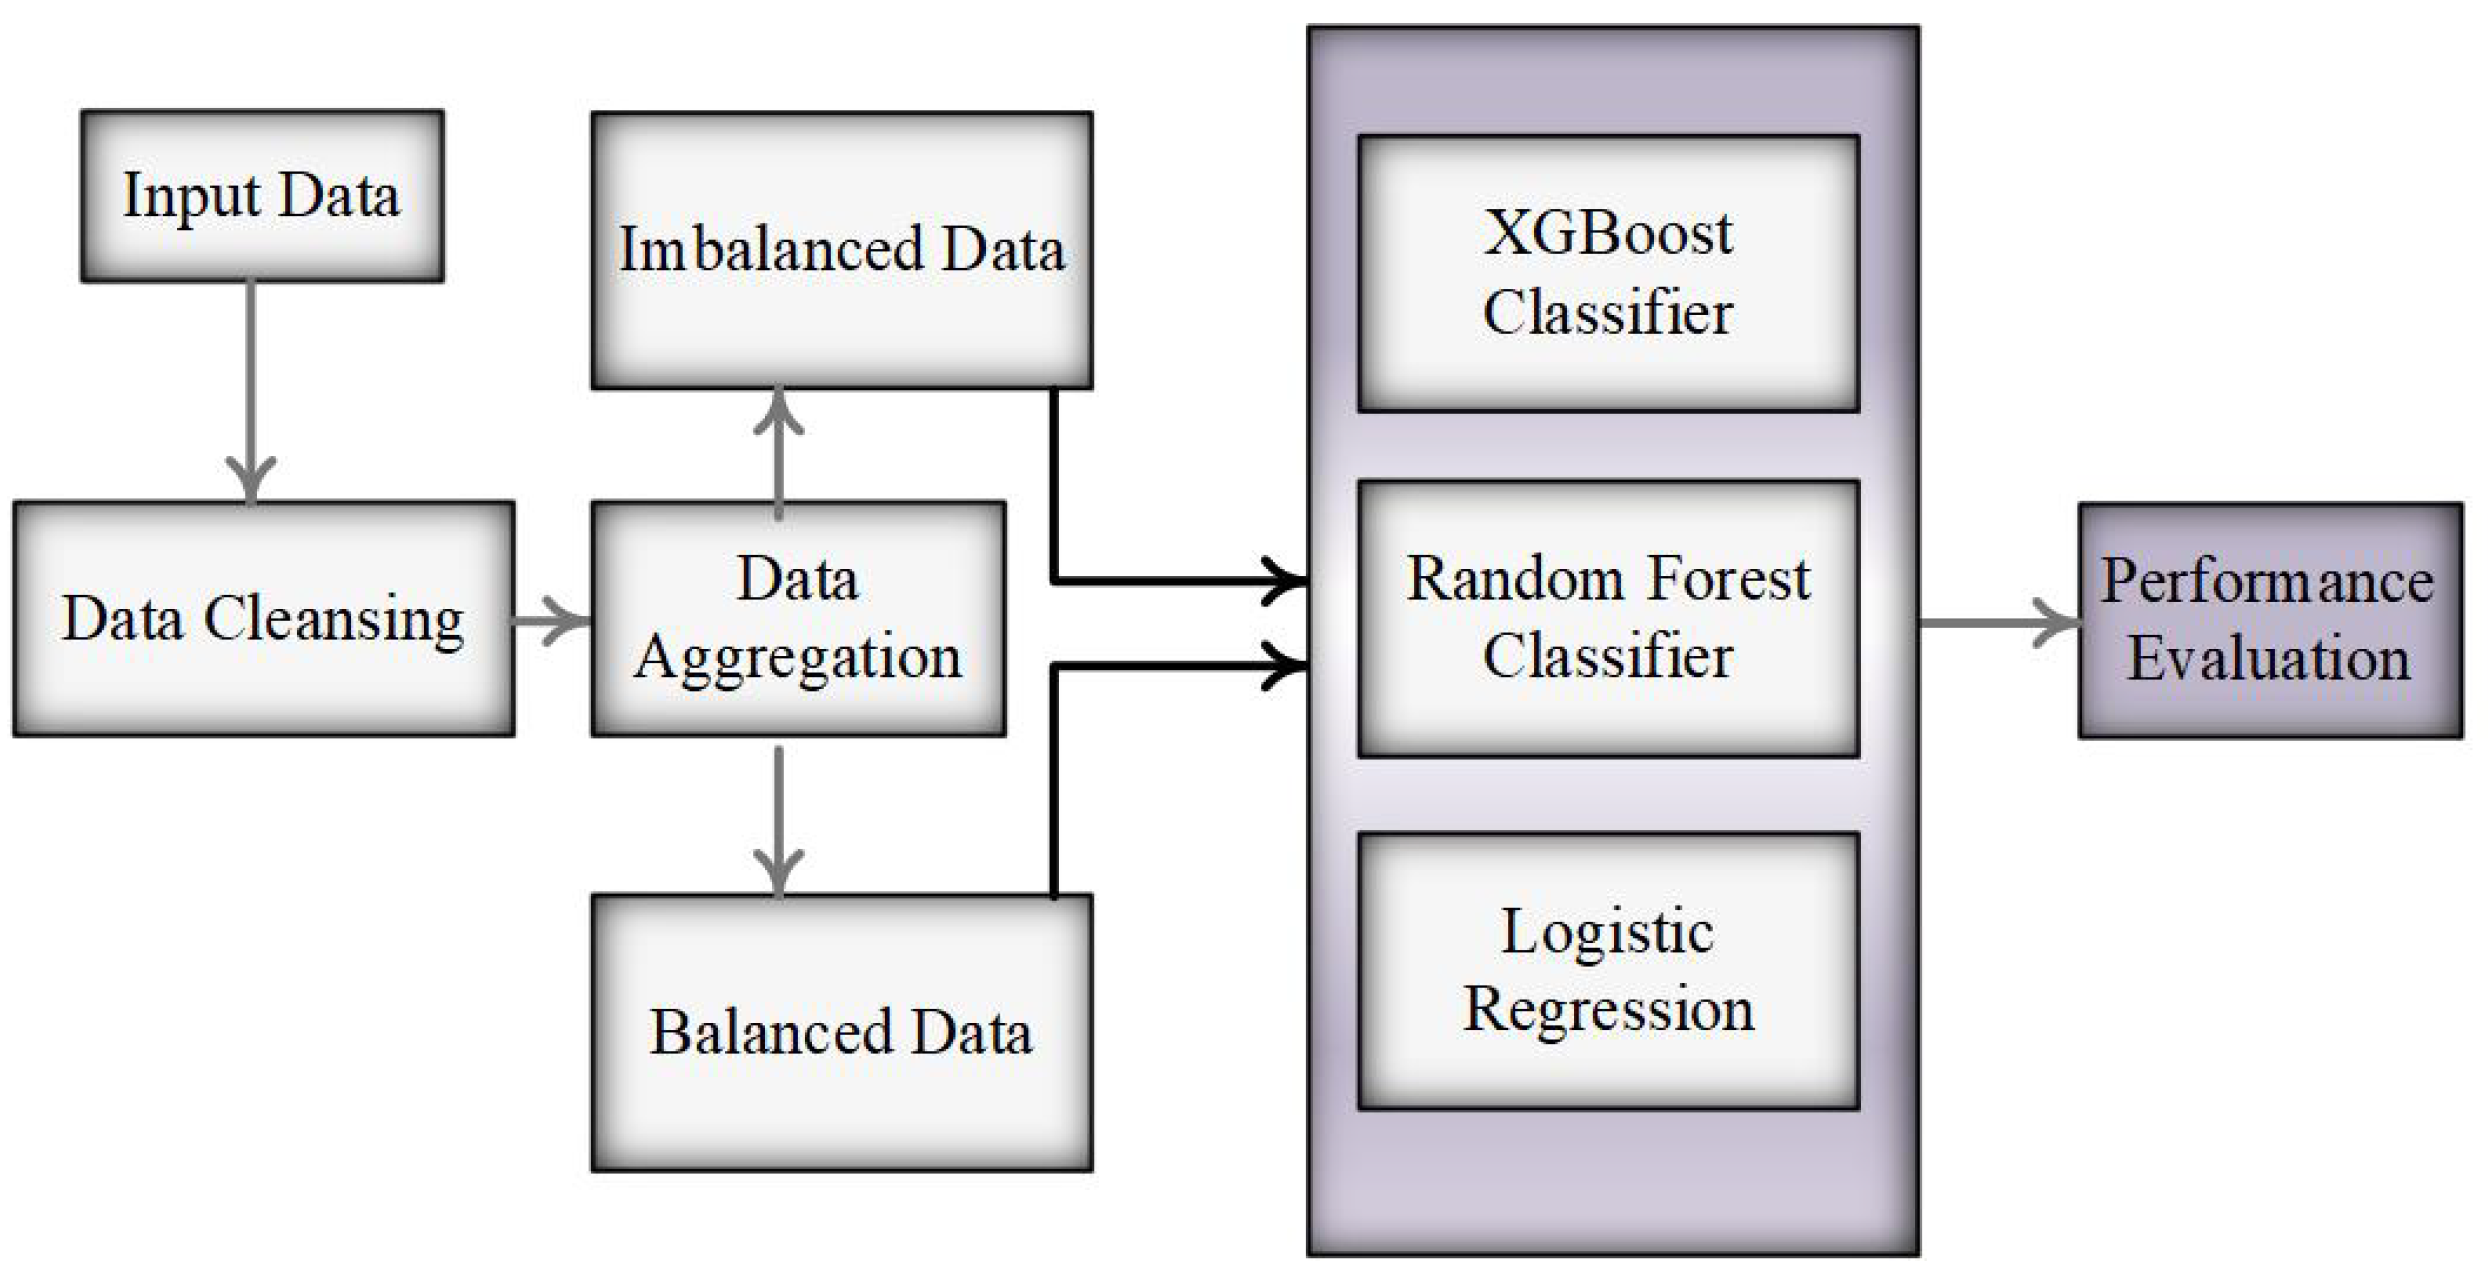
The OULAD dataset, as mentioned in Section 3.1, was utilized in this research, and represents the data of more than 200,000 enrolled students in European Open University [17]. The dataset consists of sciences, technology, engineering, and mathematics (broadly representing STEM). Module-wise student categories can be seen in Table 1.
Its VLE is composed of the course material, course lectures and assessments. Students can interact with each other, work on assignments, watch lecture videos and use materials on VLE while the recorded videos of students interaction can be found in the log files [17]. The information of these students were tabulated as 7 modules such as student registration, subjects, students VLE, students VLE, VLE itself, and assessments [22].
The students activities are recorded in the log-file with timing based on their clicks to indicate how much time was spent on a specific activity. Students’ discussion is included as forum variable which indicates a space where students can upload their queries and obtain replies [17]. The very first screen of each subject is represented by variable HomePage. The details about Open University and acronyms of higher education are kept in glossary. Relation between the dataset tables is as shown in Figure 1.

3.3. Methodology

The mechanics of our proposed research model to achieve the aim can be seen in Figure 3. The objective of the proposed methodology is to assess the students’ academic performance and predict engagement with the VLE which will ultimately help in predicting the final results of the students. The students’ academic performance can be computed from the scores whereas the engagement with the VLE can be measured from the number of clicks on the course-specific online resources.
In order to anlyse the students’ performance and engagement with the VLE, we utilized average score of a student’s assessment within the first number of days from the start of the semester and average number of clicks by a student while accessing each resource category within the first number of days from the start of the semester. In order to form the final feature vector, the two features were combined with other profile information. In this process, the students who withdrew from a course within the first number of days from the start of the semester were grouped with the Fail students. During this process, the students were categorized as Fail and Pass. Note that “distinction” as a result was also replaced by Pass. The withdrawn cases were also grouped with the Fail since the students withdrew from those courses due to their poor performance.

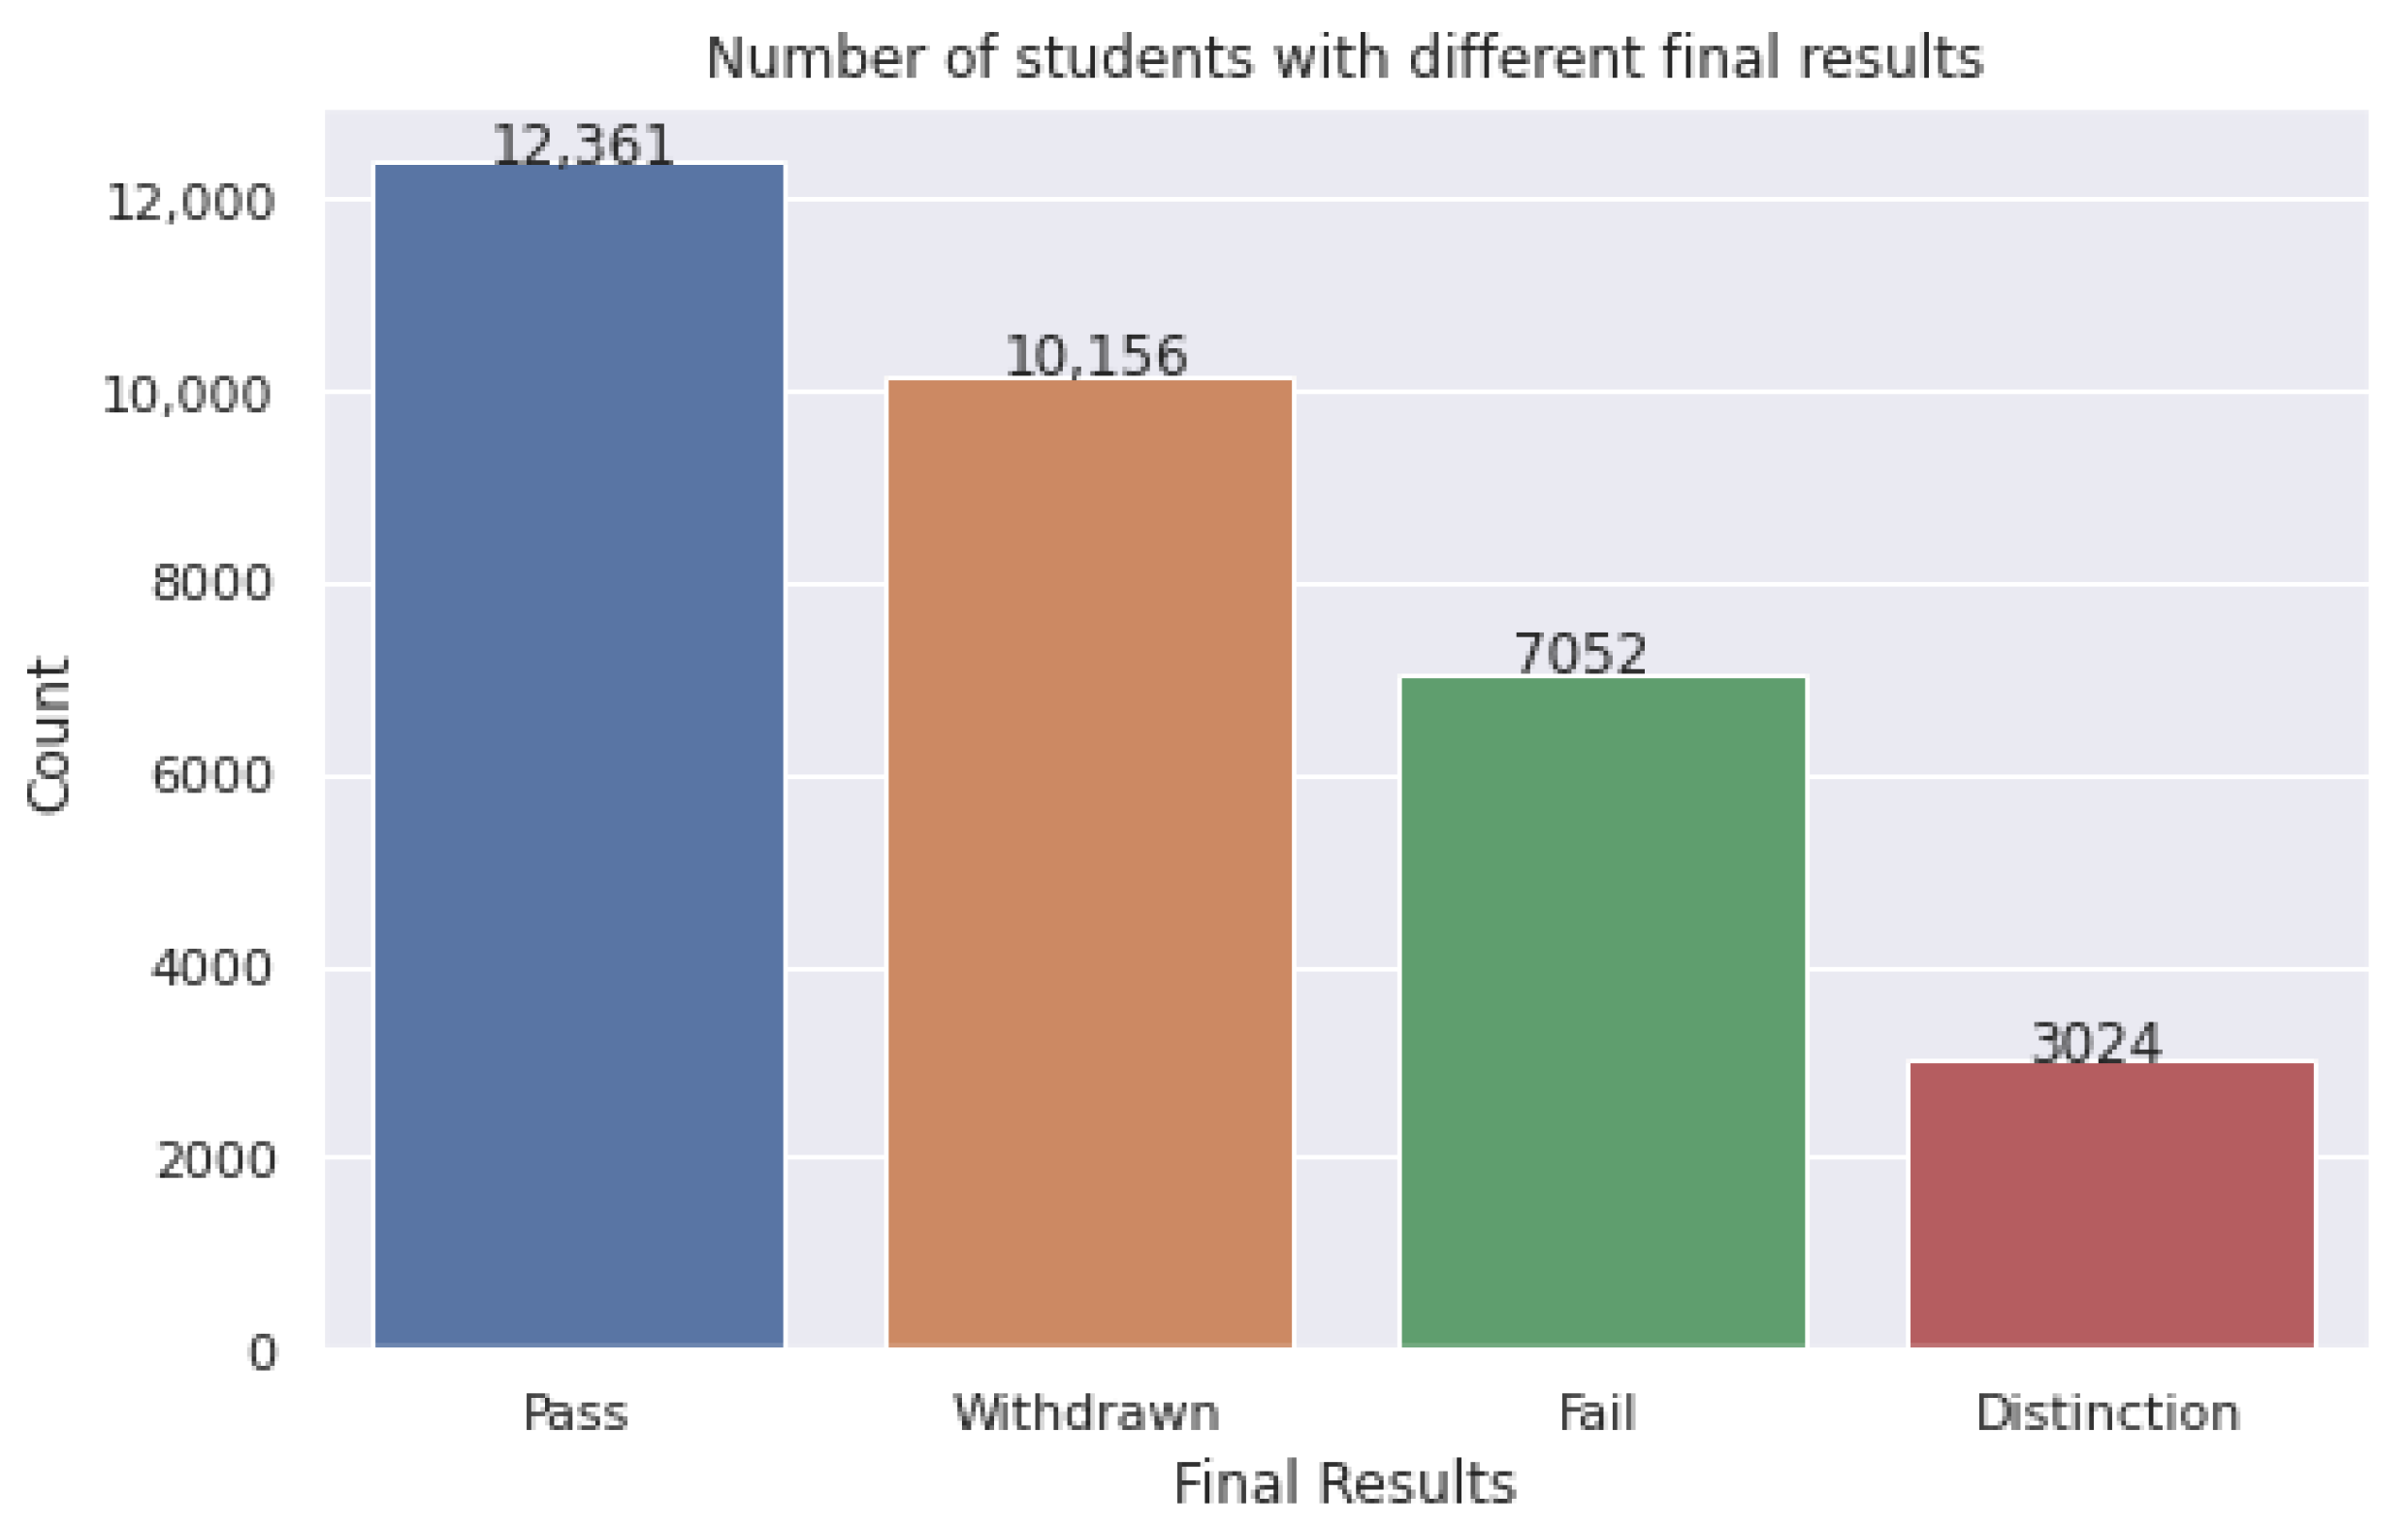
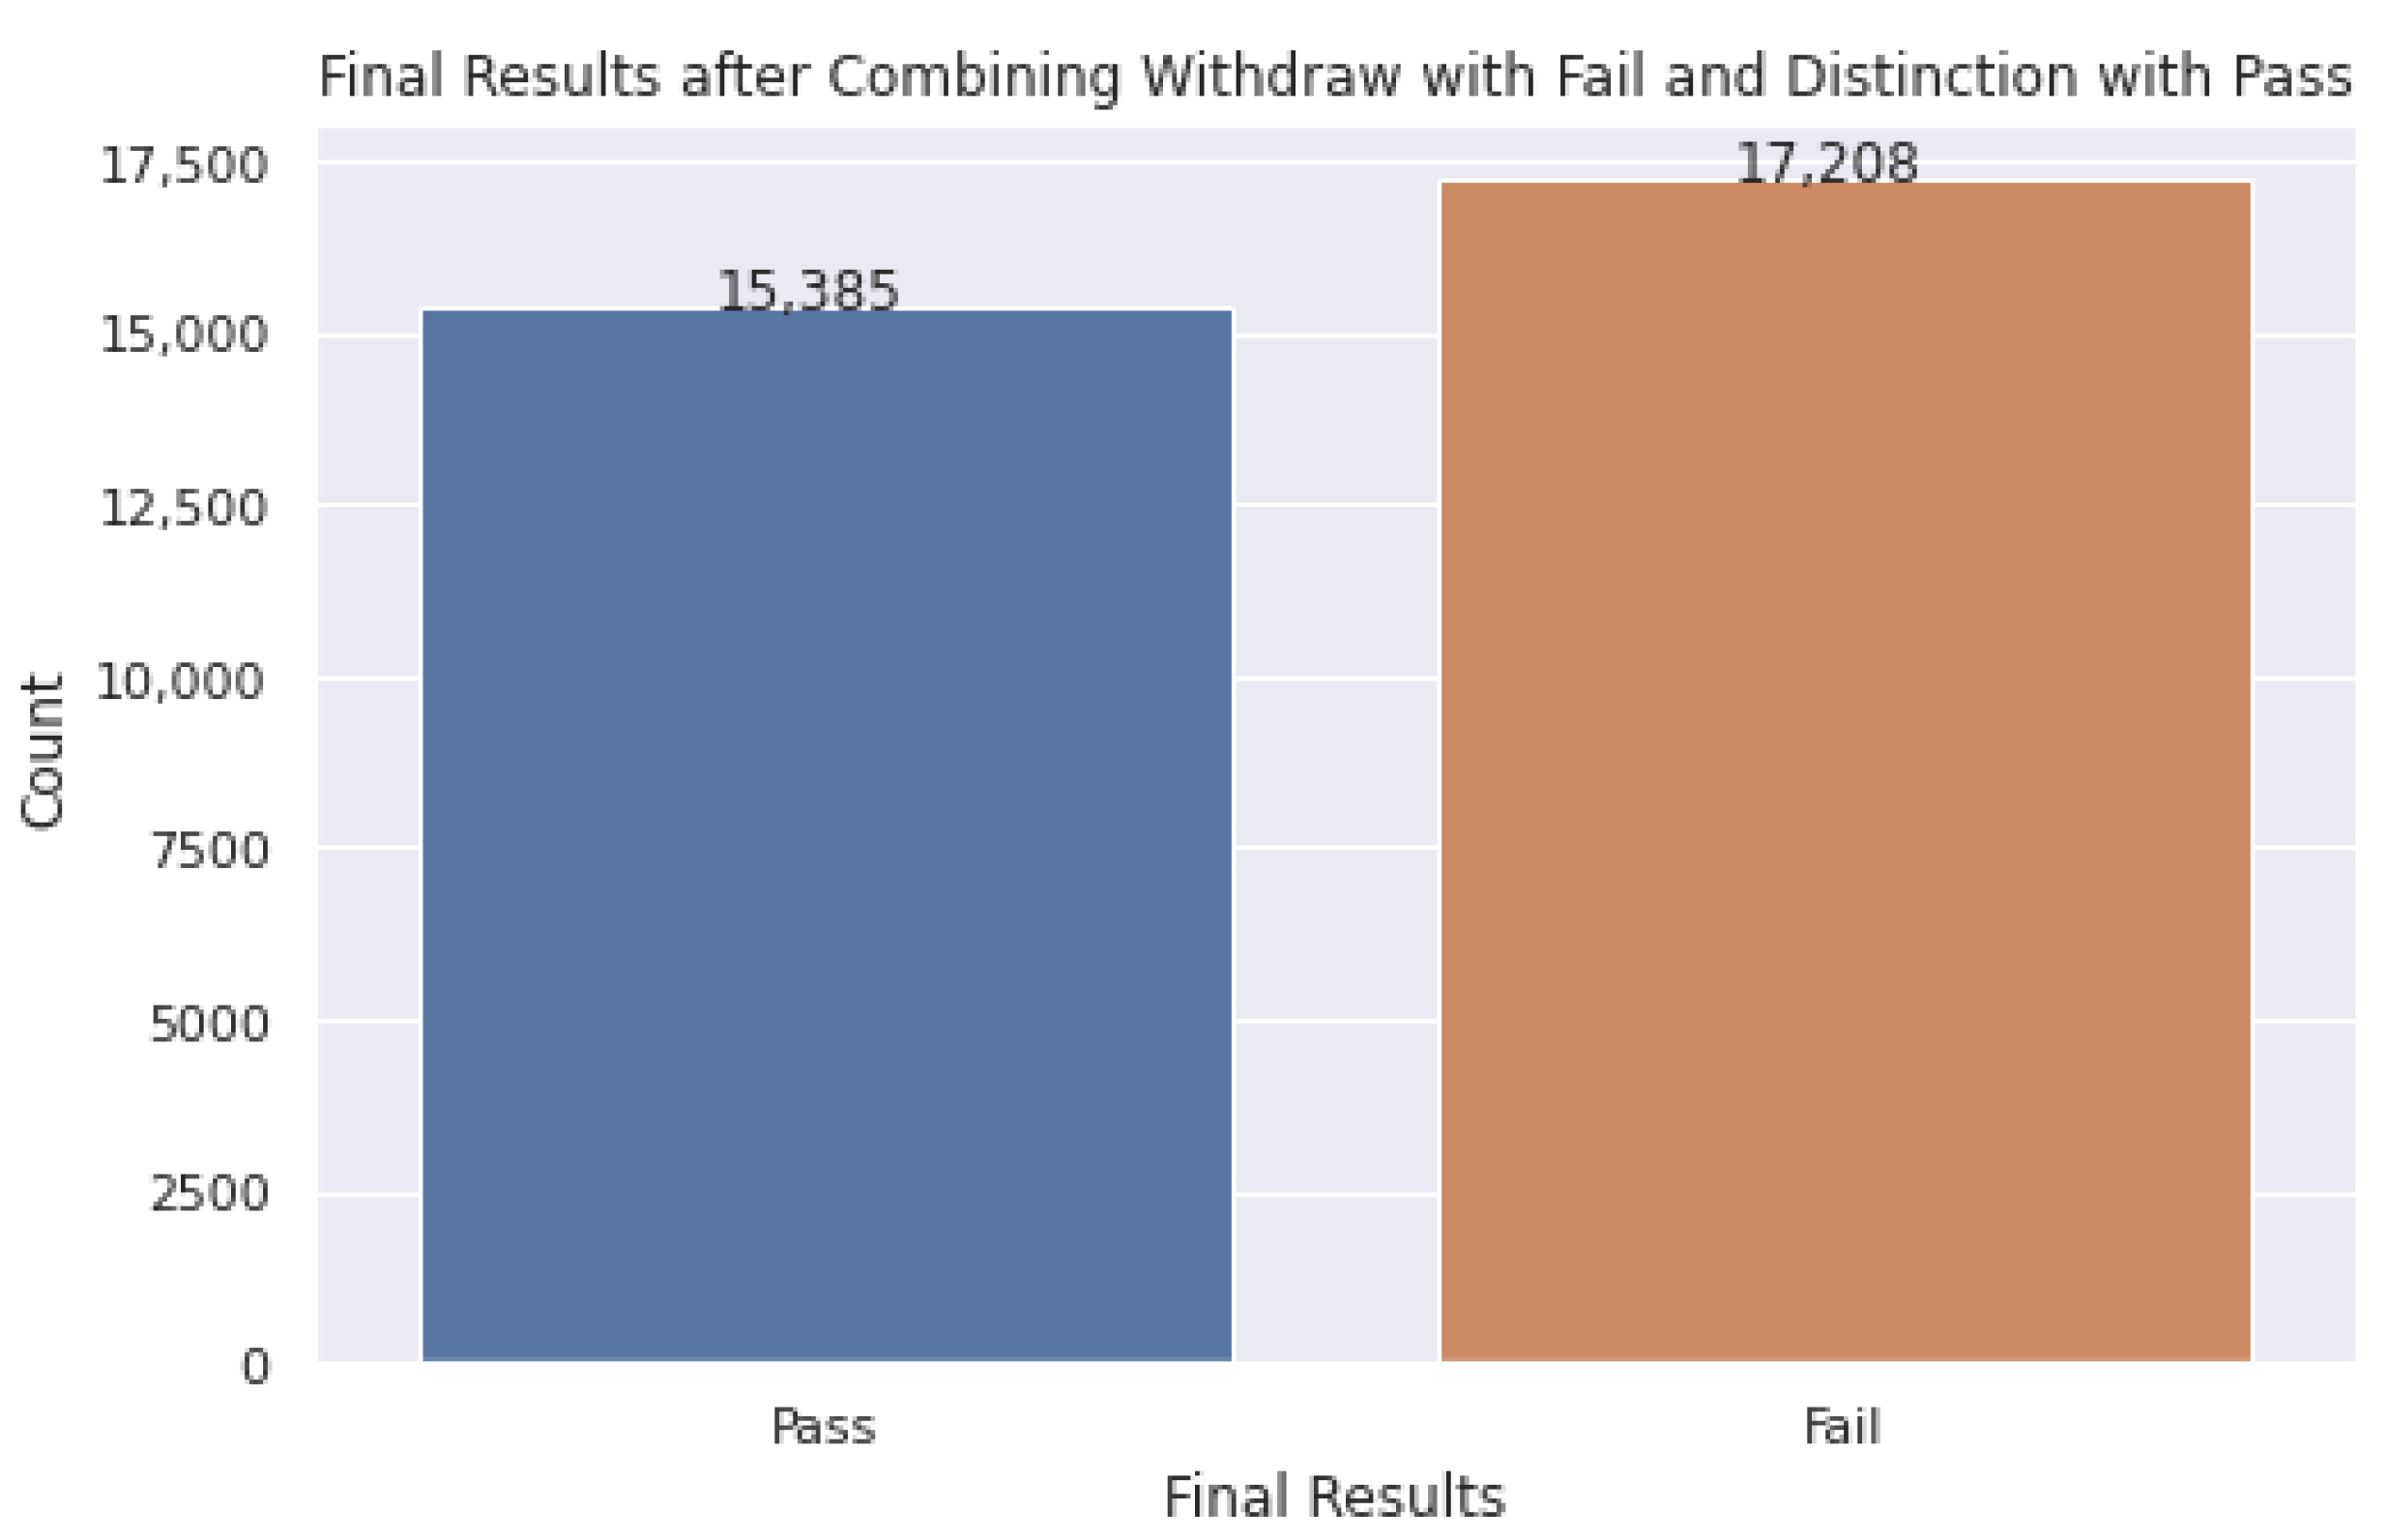
3.3.1. Data Pre-Processing

It was necessary to perform data preprocessing before applying predictive modeling. The data preprocessing includes dealing with inconsistent data, eliminating data noise and imputing missing values through a variety of techniques and strategies. We performed these preprocessing techniques to get the data ready for model application, including creating or changing attributes and selecting the required data object [23,24].
The students’ profiles were built from “assessments”, “studentAssessment”, “studentVle”, and “vle” tables putting together student information and the relevant site. All the sites reside in the “vle” table with their ids and types (homepage, content, glossary, subpage, forum, URL, etc.).
The student’s score-related information was extracted from the “assessments” and “studentAssessment” tables, which include the course name (code_module), the offered year and semester (code_presentation), the student identification number (id_student), and average score over all assessments for each student over the first number of days (mean_score_day120, i.e., 120 days in this case). Likewise, the student’s engagement with VLE-related information was extracted from “studentVle” and “vle” relations, which include course name (code_module), the offered year and semester (code_presentation), student identification number (id_student), and the resources accessed (i.e., dataplus, dualpane, externalquiz, forumng, glossary, homepage, htmlactivity, oucollaborate, oucontent, ouelluminate, ouwiki, page, questionnaire, quiz, repeatactivity, resource, sharedsubpage, subpage, and url).
The students’ interaction activities were calculated on different levels which depended on the number of days we considered for model development. We considered 120 days, 150 days, 180 days, 210 days, 230 days, and 260 days of activities to predict the final performance of the students while utilizing their engagement level. The engagement represents the students motivation level until the day of prediction. Engagement is the most impactful feature for performance prediction.
The number of students distributed in the original dataset without preprocessing is shown in Figure 4.
According to this distribution, the number of students passing the course, considering both simply pass and pass with distinction, is 15,385 whereas the number of students who are not successful is 17,208 (considering both the withdrawn and fail students), as shown in Figure 5.
The input to the machine-learning algorithm was a 30-dimensional feature vector comprising of students’ assessment scores and their engagement statistics with the VLE.

3.3.2. Build and Test the Predictive Model

There were a number of AI algorithms used to check their impact and capabilities in predicting the academic performance of students with respect to their profiling. We utilized random-forest classifier and, for the sake of comparison, used XGBoost classifier [25] and logistic regression as well.
A number of studies have used various AI algorithms in academic performance prediction. According to Wolpert and Macready [26], no AI classification algorithms can show better results than every other available for each problem domain. Hence, commonly adopted algorithms were taken into consideration for iteration and benchmarking to identify the best algorithm for the student-performance prediction task.
However, the computation time for training AI algorithms optimally was a bigger challenge, as there were six considered intervals.

3.4. Evaluation Measures

This section describes the performance parameters that are used in this article to evaluate the performance of our proposed models.

3.4.1. Accuracy

Accuracy is the prominent and most common quality-evaluation metric used in this study, as given in Equation (1).
A c c u r a c y = ( T P + T N ) / ( T P + F P + T N + F N )
This basically indicates the total number of all possible correct predictions divided by the total number of samples in the dataset used, where 0 is termed as the worst accuracy and 1 as the best accuracy. Note that TP, FP, TN, and FN refer to the number of true positives, false positives, true negatives, and false negatives.

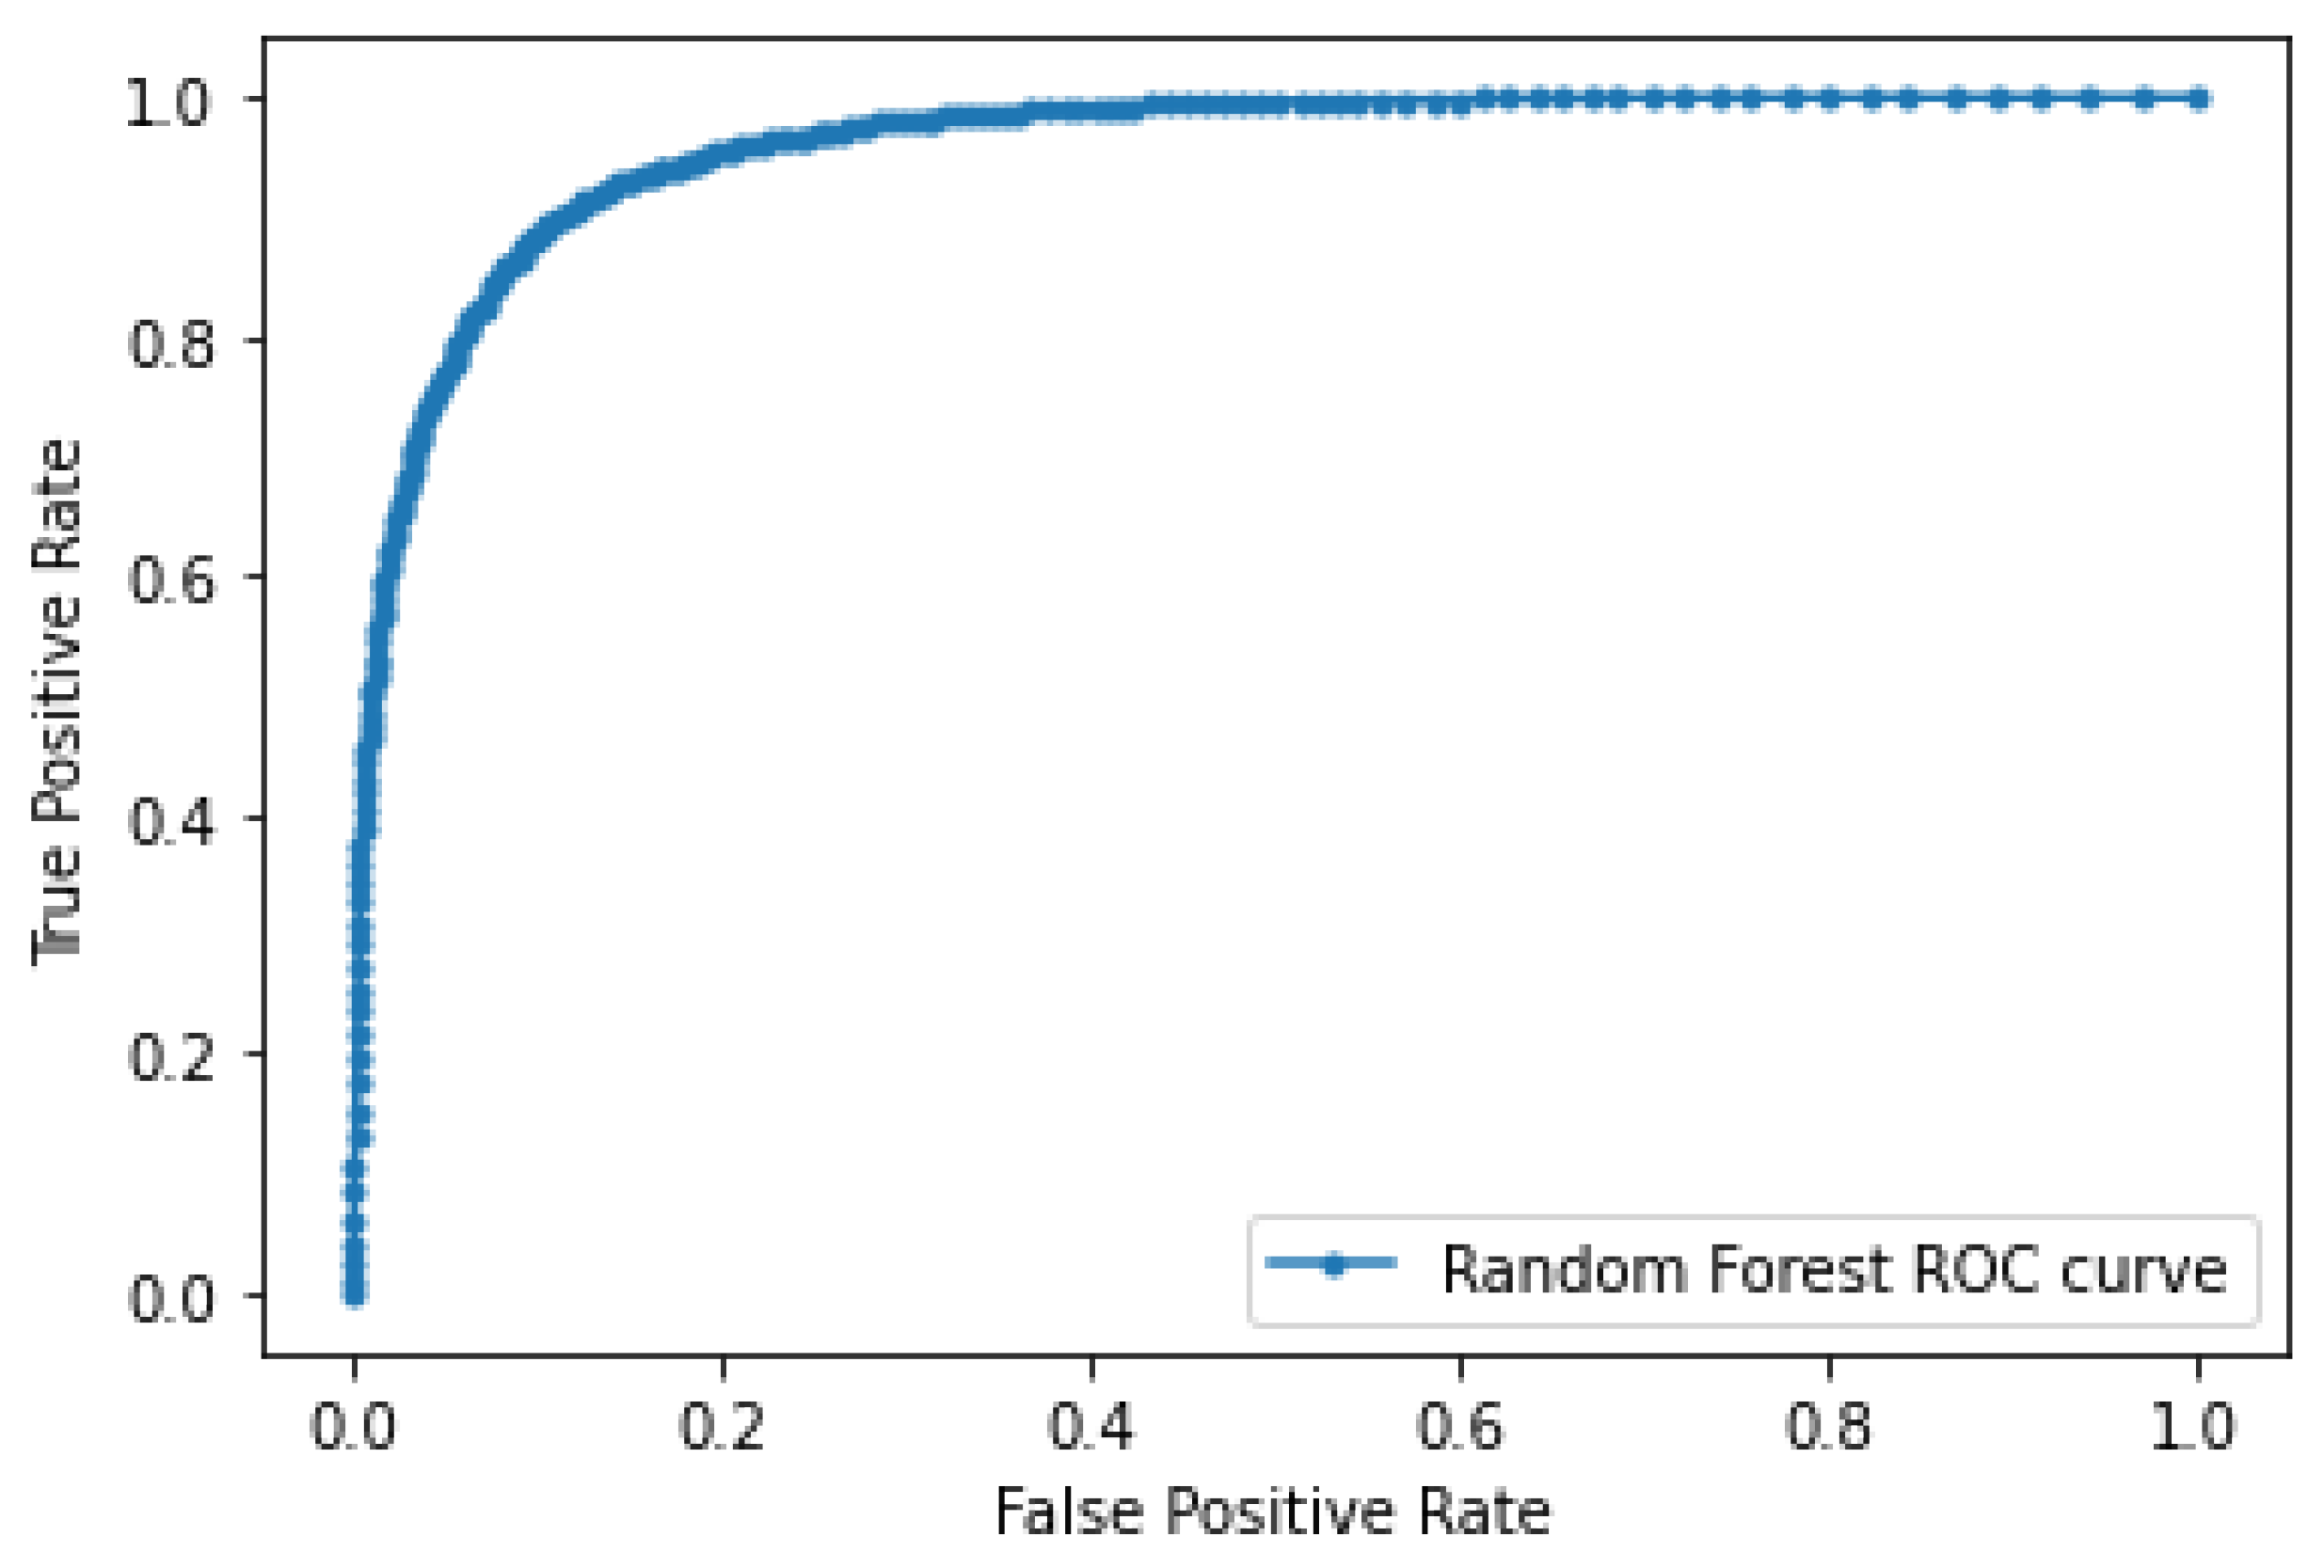
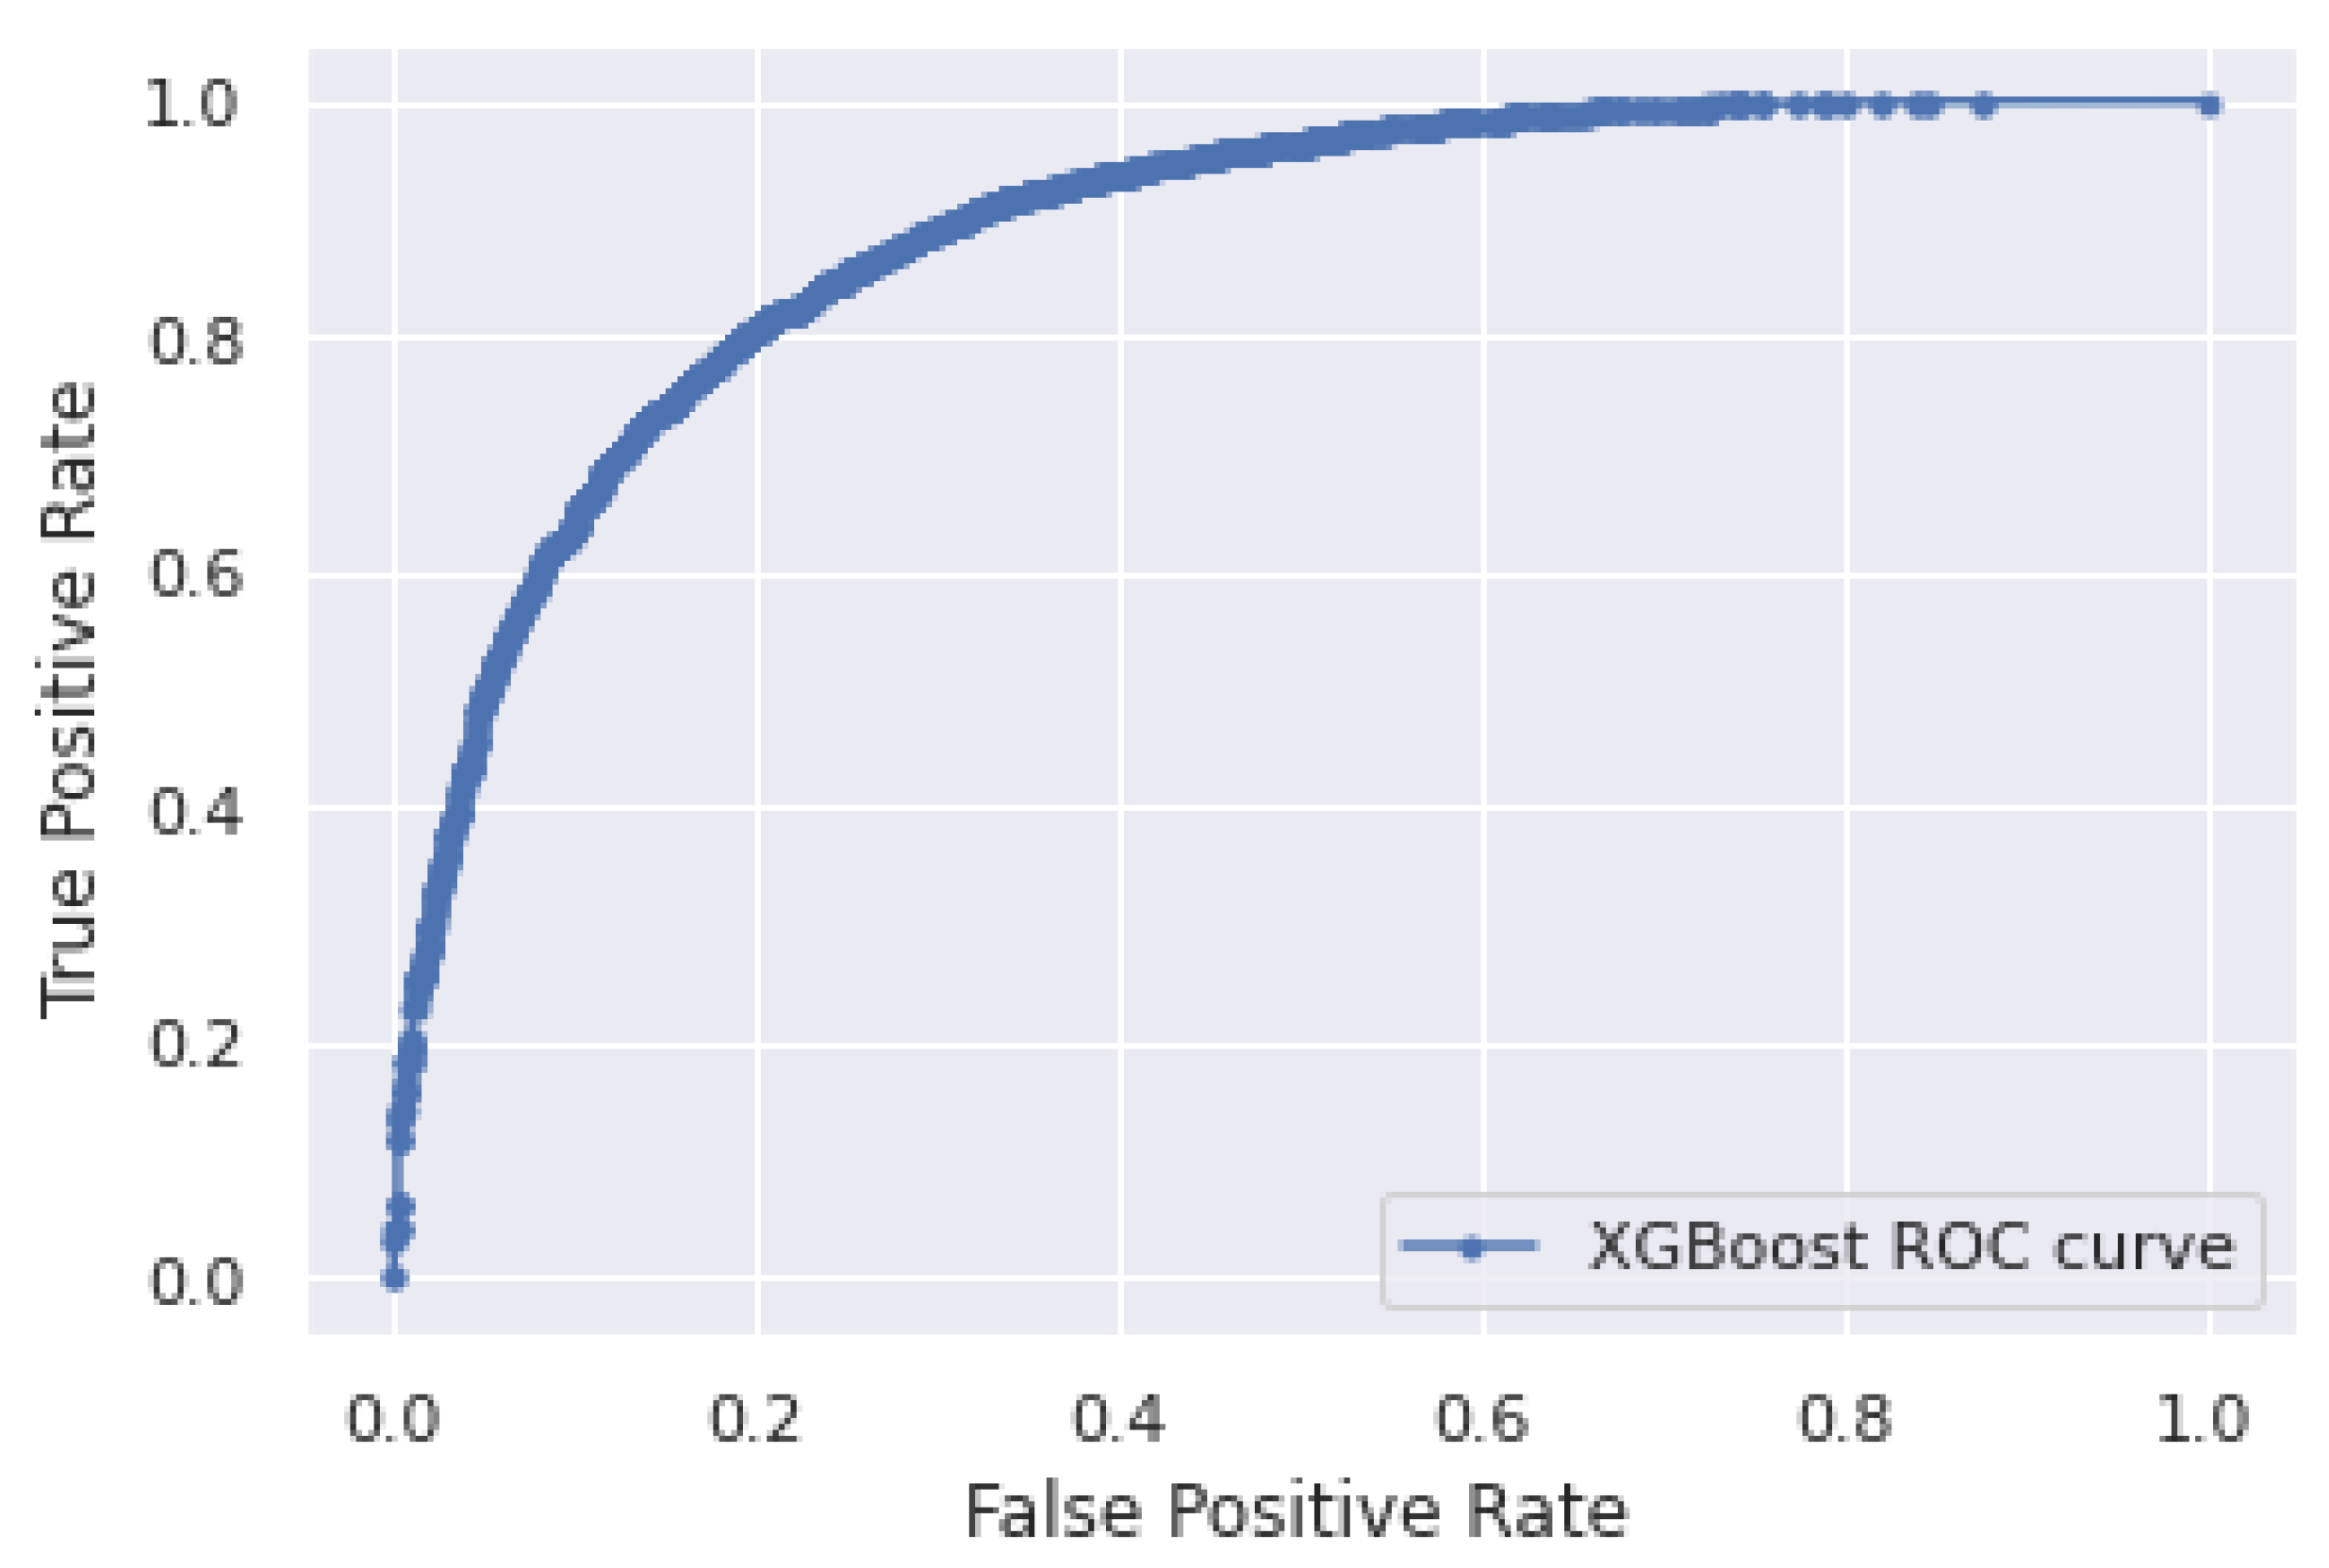
3.4.2. Receiver Operating Characteristic

Receiver operating characteristic (ROC) measures the prediction quality of a classifier especially in binary-class classification problems. ROC curve is obtained by plotting true-positive and false-positive rates along Y and X axes, respectively. In order to obtain ideal ROC curve, it is important to minimize false-positive rate while maximizing the true-positive rate. ROC curve estimates the trade off between true- and false-positive rates for a model using various probability threshold values ranging from 0.0 to 1.0.
True-positive rate, or sensitivity, describes the quality of the model at predicting the positive class and is given by Equation (2).
T r u e P o s i t i v e R a t e = T P / ( T P + F N )
The F P rate or false-alarm rate describes how many times the model predicted the positive class when the actual output is negative. It is given by Equation (3)
F a l s e P o s i t i v e R a t e = F P / ( F P + T N )

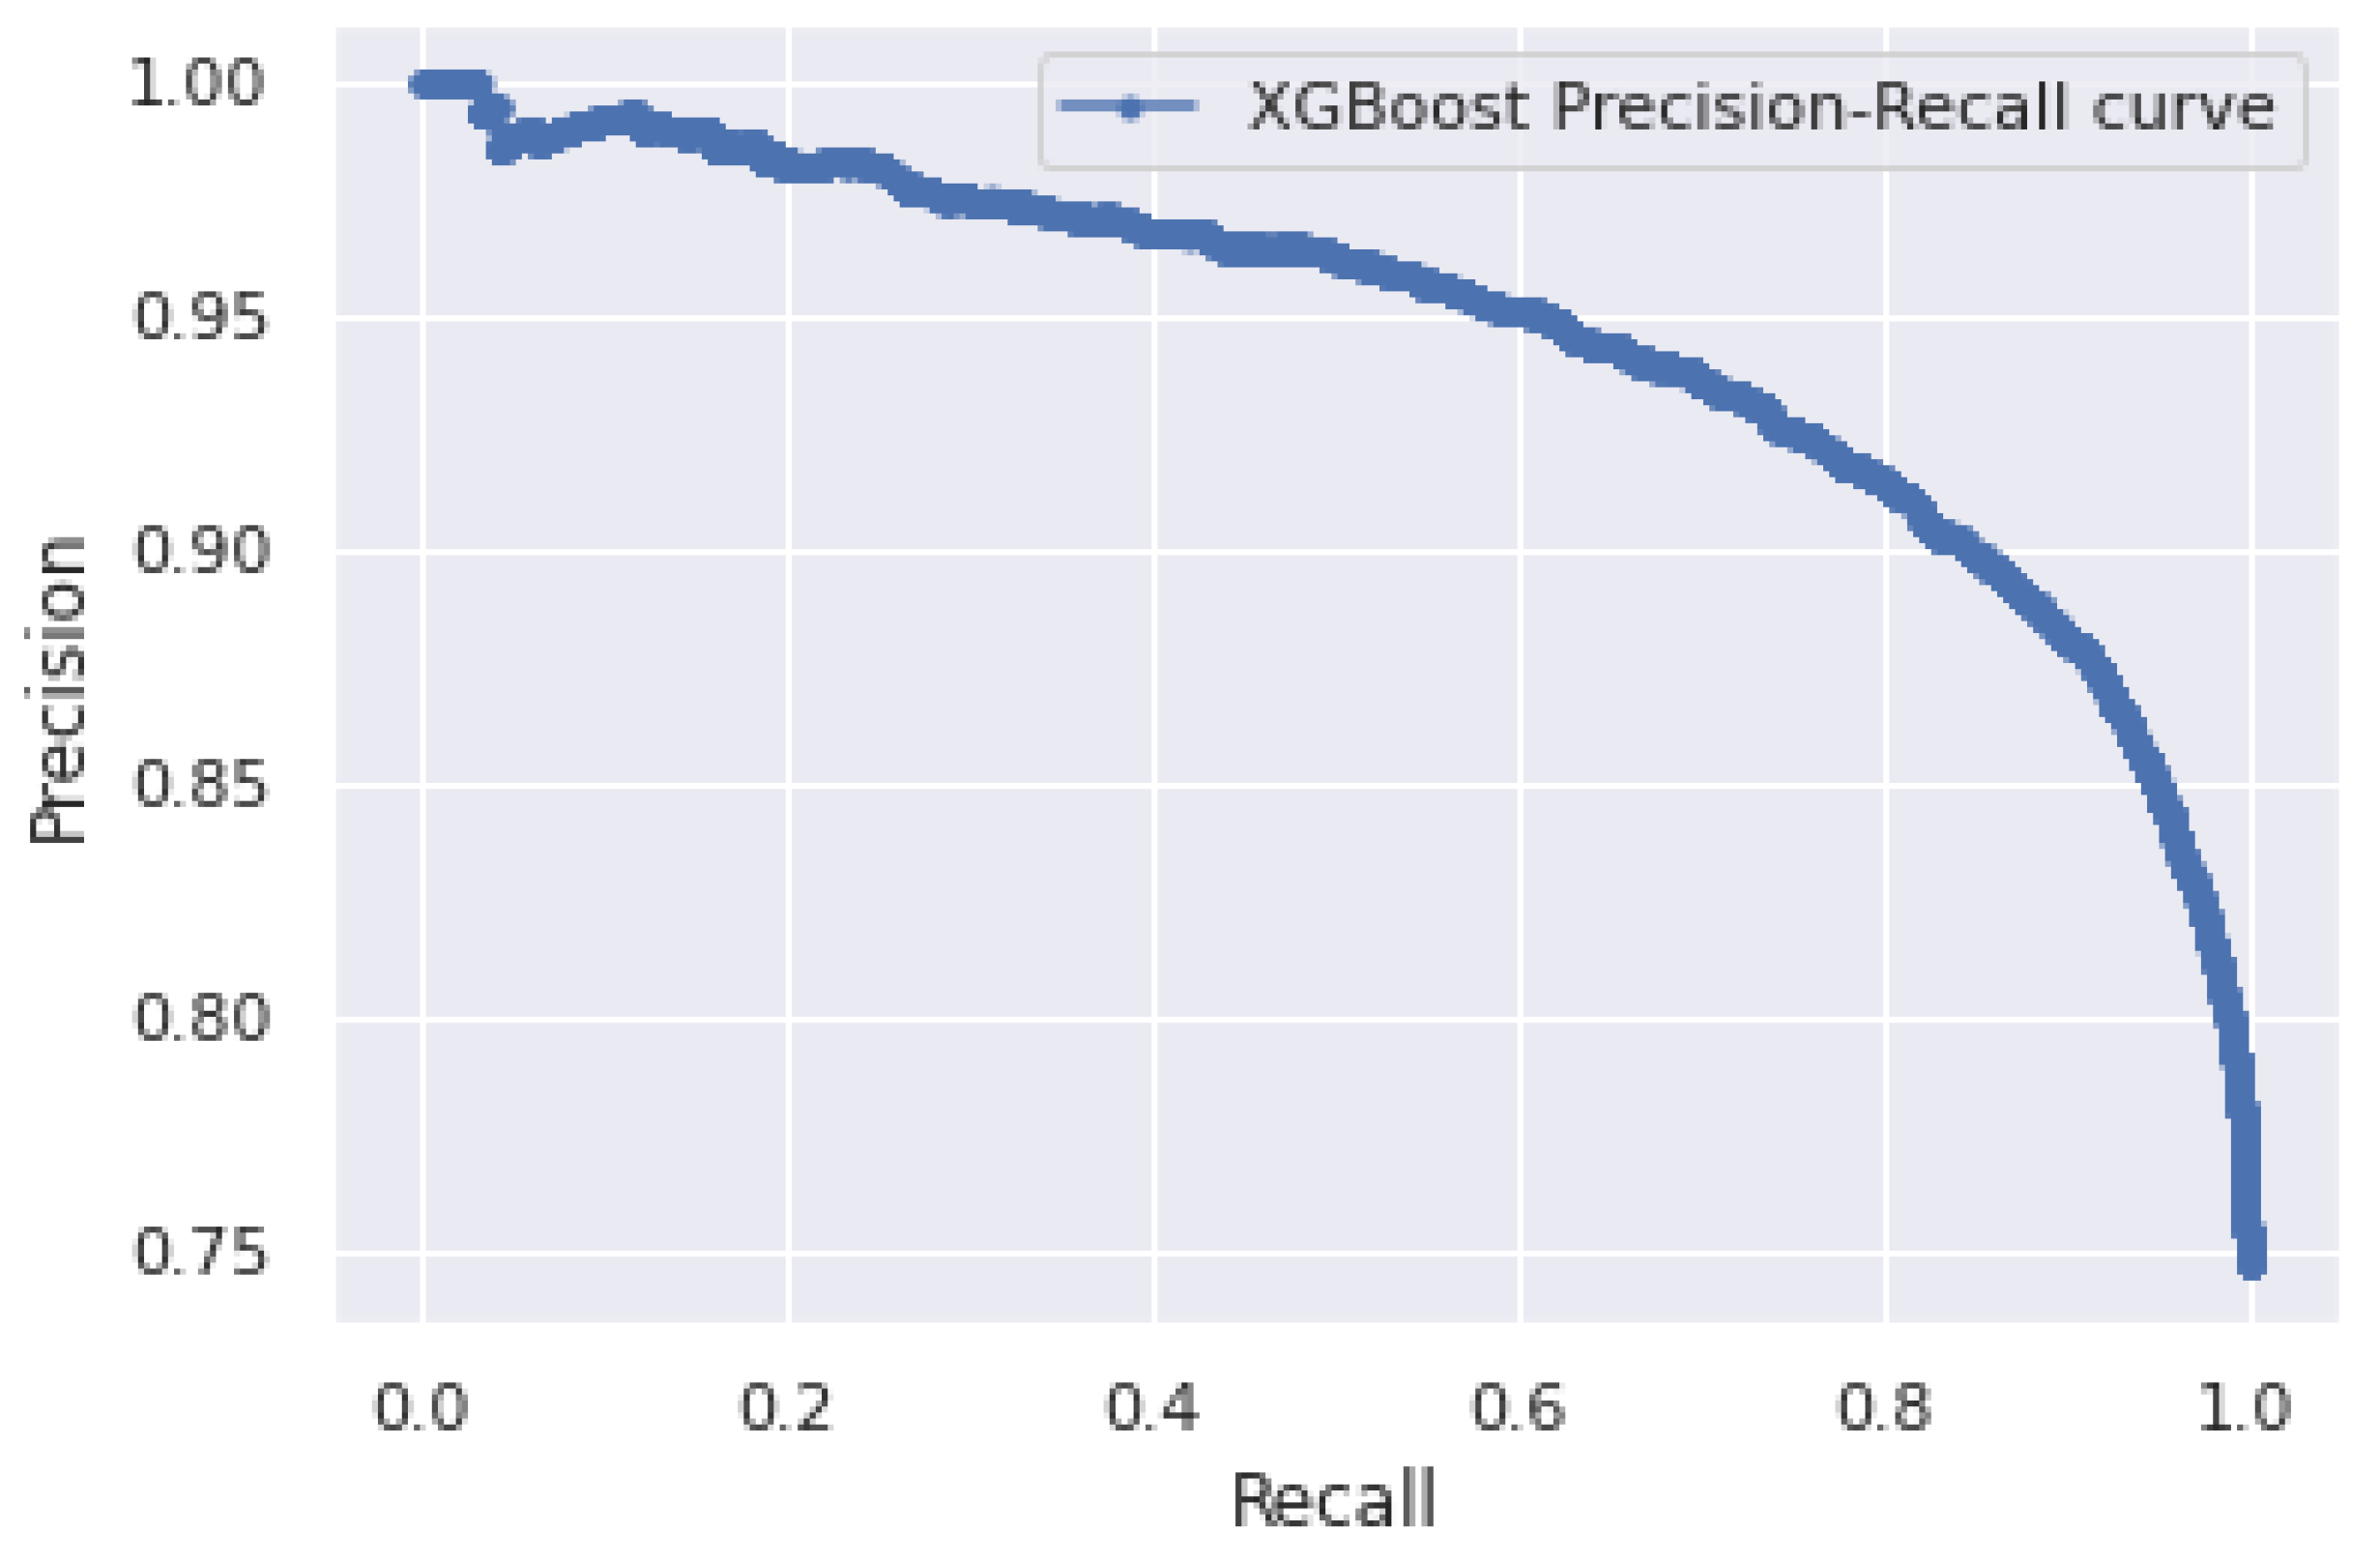
3.4.3. Precision–Recall Curve

Precision–recall curve estimates the trade off between TP rate and positive predicted value for a model on various probability thresholds. It is considered a suitable measure in the presence of imbalanced data.
P r e c i s i o n refers to the quality of a model at predicting positive class and is obtained using Equation (4).
P r e c i s i o n = T P / ( T P + F P )
R e c a l l is obtained using Equation (5).
R e c a l l = T P / ( T P + F N )

4. Experimental Setup

In this article, each set was generated by varying the number of days during which the students’ performance and the final result were evaluated. Fewer number of days indicate that less information was available, whereas larger number of days signifies the availability of more information about students. During each set of experiments, the data was divided in training and testings sets where 67% data was reserved for training and 33% was kept for testing. The best combination of parameters was obtained using RandomizedSearchCV method with RandomForestClassifier. The data was scaled using the StandardScaler() method of sklearn library.

5. Results

5.1. Performance Analysis of Random-Forest Classifier with Random Search Optimization

Table 2 highlights the performance of the random-forest classifier in terms of training and testing accuracy values, ROC-AUC, precision–recall AUC, and F1-score.
It is evident from the results in Table 2 that the performance of the classifier is enhanced with the increase in the engagement and score information of students to train the classifier. The highest accuracy is 84.2% when 260 days of data was used for training. Similarly, the values of area under the curves of ROC as well as precision–recall curves are higher for 260 days data as shown in Figure 6 and Figure 7, respectively. F1 score is also higher for the same number of days.
The obtained data for each of the number of days is highly imbalanced. Therefore, we used the SMOTE oversampling technique [27] in conjunction with the random-forest classifier using 260 days of profiling information. The training accuracy is 100% whereas the testing accuracy is 89.2%. As evident from Table 2, due to balancing the data, the testing accuracy is enhanced by 5%, which shows the significance of data balancing in predicting the students’ academic performance. The ROC curve is employed to select the appropriate values of decision thresholds to establish a trade off between true- and false-positive rates across each of the six time periods. The ROC curve presented in Figure 8 achieved the AUC score of 0.96.
Precision–recall curves were also utilized to assess the performance of the proposed model. The precision–recall curve computed using balanced data is illustrated in Figure 9 where the AUC value is 0.957 and F1-score value is 89.2.
Here, the precision–recall curve indicates the trade off between precision and recall for various threshold values. The AUC value of 0.957 indicates high precision and recall values. In the current problem, high precision shows the correct identification of failed students whereas high recall signifies the correct prediction of pass students. The proposed system produced accurate results as an indication of high precision and also achieved the majority of all pass students an an indication of high recall.

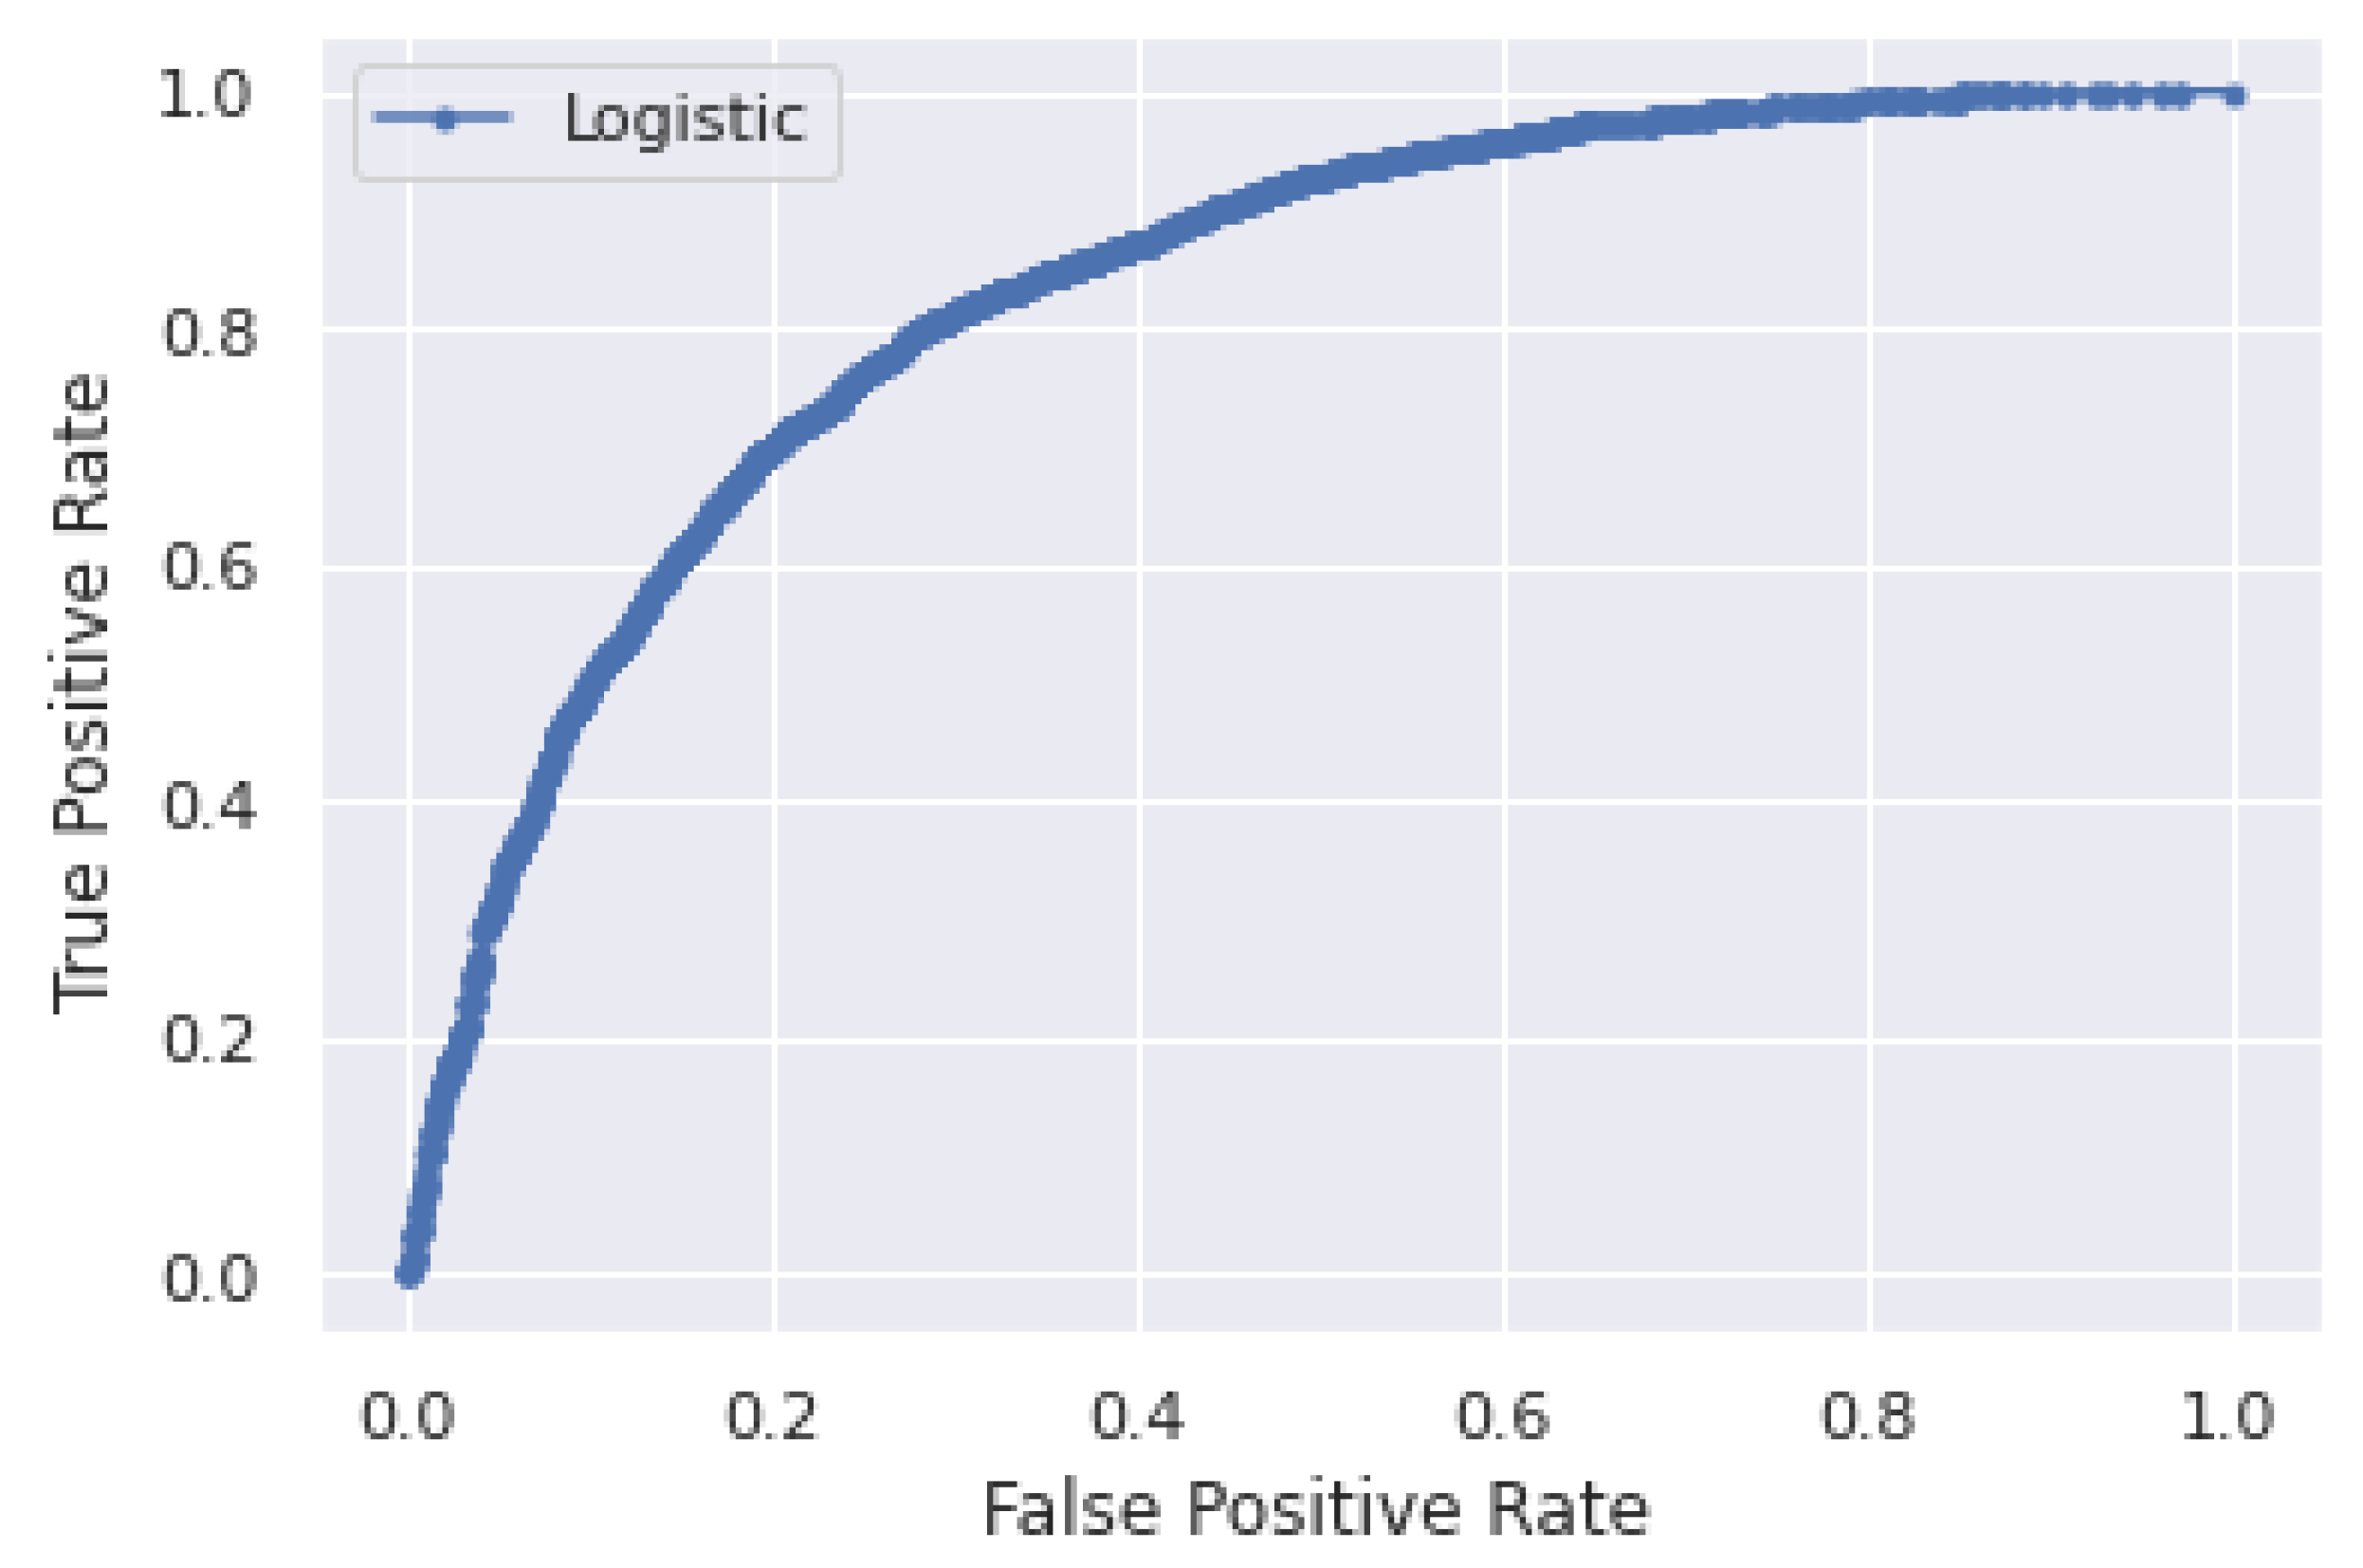
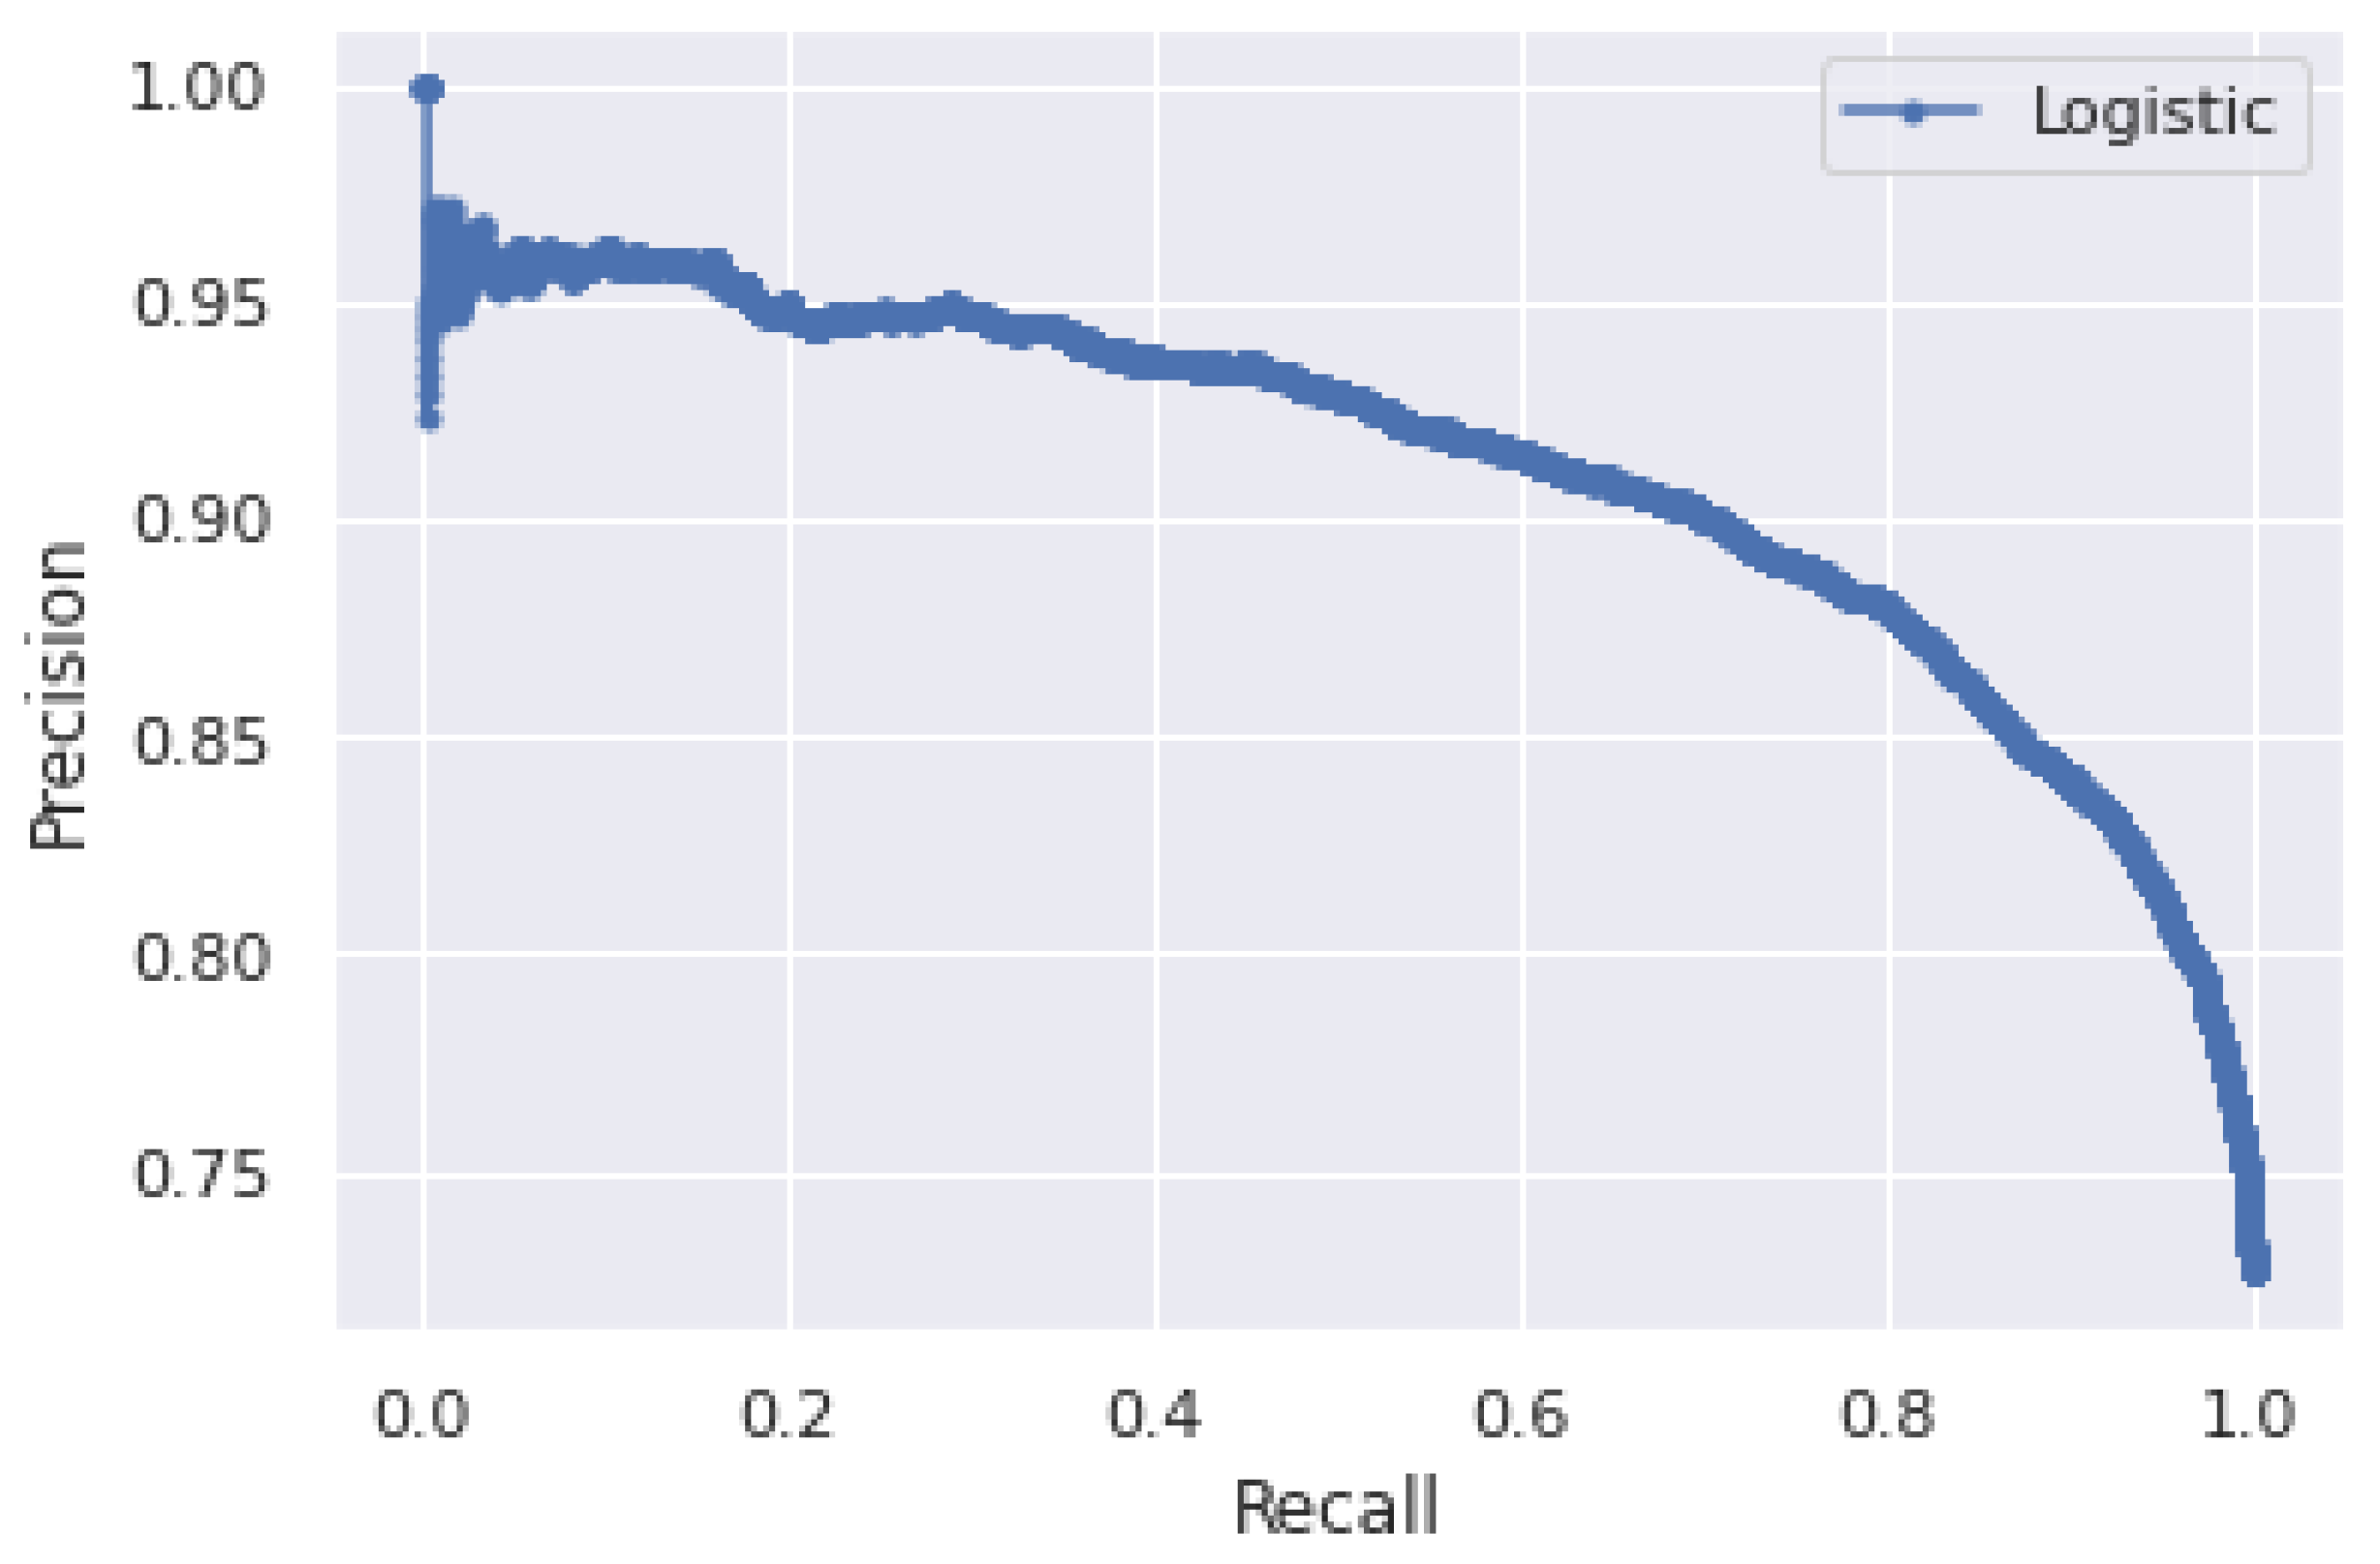
5.2. Performance Analysis of Logistic Regression and XGBoost Classifiers for 260 Days Data

In order to provide further insight, we also performed experiments using logistic regression, which achieved training and testing accuracy values of 80.4% and 80.9%, respectively. The AUC under the ROC curve is also 0.831, which is shown in Figure 10.
We also constructed the precision–recall curve as shown in Figure 11, where the AUC under the precision–recall curve is 0.912 and F1 score is 87.5.
Similarly, the XGBoost classifier was also employed to see its behaviour on the data consisting of 260 days score and engagement statistics. The obtained training and testing accuracy values are, respectively, 91.7% and 84.3%. The AUC under the ROC curve is 0.887, as shown in Figure 12.
The AUC under the precision–recall curve is 0.946, which is also depicted in Figure 13, and the F1 score is 89.7.

6. Discussion

In this article, we investigated the effect of students’ engagement with a VLE on their final results. It is observed from the obtained results that the students’ engagement with the VLE plays important role in predicting their final results. It indicates that day-to-day engagement with the VLE is of higher importance compared to the students’ personal information. The proposed model demonstrated that the effectiveness of engagement information is enhanced by adding data for a higher number of days. That is why the information for 260 days enabled the proposed system to demonstrate enhanced performance. The proposed random-forest-based model can inform the students about their probable failure in a course and guide them towards success. It is possible to identify an individual facing risk of failure; however, the currently proposed work can classify them as group due to the binary nature of the problem under consideration. Consequently, the privacy of individuals is maintained yet the accurate prediction of the entire class can help teachers take appropriate measures to enhance the overall performance of the students.
The trend shows better values towards the day end than from the beginning as more data is provided to the AI algorithm. It can be well-predicted from the trend that performances increase almost at the same pace as they start. Early information can help science students have the chance to improve their performances towards the end of course and before the examination. Connected to this, instructors are advised to execute the model 150 days after the commencement of the course to identify the students at risk of failure.

7. Conclusions

In this work, we analyzed students’ academic performance and their engagement with a VLE using random forest in combination with SMOTE. First, the students’ profile were developed from the OULAD dataset, which was then used to train a random-forest classifier.
The obtained results revealed the significant performance of the random-forest classifier in predicting the students’ academic performance. Data from six different time periods were identified and it is observed that the performance of random forest with SMOTE oversampling is better for the time period of 260 days, which was almost end of the course presentation. This is due to the fact that, towards the end of the academic session, more data on the students engagement and assessments’ score is available and more accurate predictions are possible.
Such analyses of students’ profiles in the context of a VLE are helpful in identifying weaknesses towards the successful completion of academic session. This will certainly help academicians help students preemptively and lead them to a successful end of their studies.

Author Contributions

Conceptualization, K.J. and M.A.S.; methodology, M.T. and M.A.S.; validation, K.J., M.A.S. and M.T.; formal analysis, M.A.S.; investigation, M.T. and M.A.S.; resources, K.J. and M.A.S.; data curation, M.T. and M.A.S.; writing—original draft preparation, K.J., M.T. and M.A.S.; writing—review and editing, K.J. and M.A.S.; visualization, M.T. and M.A.S.; supervision, M.T.; project administration, K.J.; funding acquisition, K.J. All authors have read and agreed to the published version of the manuscript.

Funding

The authors extend their appreciation to the Deputyship for Research & Innovation, Ministry of Education in Saudi Arabia for funding this research work through the project number 7897.

Institutional Review Board Statement

Not applicable.

Informed Consent Statement

Not applicable.

Data Availability Statement

The data presented in this study are openly available in https://analyse.kmi.open.ac.uk/open_dataset at https://doi.org/10.1038/sdata.2017.171, accessed on 18 May 2022, reference number 170171 (2017).

Conflicts of Interest

The authors declare no conflict of interest.

References

  1. Manjarres, A.V.; Sandoval, L.G.M.; Suárez, M.S. Data mining techniques applied in educational environments: Literature review. Digit. Educ. Rev. 2018, 33, 235–266. [Google Scholar] [CrossRef]
  2. Zareie, B.; Navimipour, N.J. The effect of electronic learning systems on the employee’s commitment. Int. J. Manag. Educ. 2016, 14, 167–175. [Google Scholar] [CrossRef]
  3. Muniasamy, A.; Alasiry, A. Deep Learning: The Impact on Future eLearning. Int. J. Emerg. Technol. Learn. 2020, 15, 188–199. [Google Scholar] [CrossRef] [Green Version]
  4. Alharthi, A.D.; Spichkova, M.; Hamilton, M. Sustainability requirements for elearning systems: A systematic literature review and analysis. Requir. Eng. 2019, 24, 523–543. [Google Scholar] [CrossRef]
  5. Umer, R.; Susnjak, T.; Mathrani, A.; Suriadi, S. On predicting academic performance with process mining in learning analytics. J. Res. Innov. Teach. Learn. 2017, 10, 160–176. [Google Scholar] [CrossRef]
  6. Lu, O.H.; Huang, A.Y.; Huang, J.C.; Lin, A.J.; Ogata, H.; Yang, S.J. Applying learning analytics for the early prediction of Students’ academic performance in blended learning. J. Educ. Technol. Soc. 2018, 21, 220–232. [Google Scholar]
  7. Widyahastuti, F.; Tjhin, V.U. Performance prediction in online discussion forum: State-of-the-art and comparative analysis. Procedia Comput. Sci. 2018, 135, 302–314. [Google Scholar] [CrossRef]
  8. Zhang, W.; Huang, X.; Wang, S.; Shu, J.; Liu, H.; Chen, H. Student performance prediction via online learning behavior analytics. In Proceedings of the 2017 International Symposium on Educational Technology (ISET), Hong Kong, China, 27–29 June 2017; pp. 153–157. [Google Scholar]
  9. Koutina, M.; Kermanidis, K.L. Predicting postgraduate students’ performance using machine learning techniques. In Artificial Intelligence Applications and Innovations; Springer: Berlin/Heidelberg, Germany, 2011; pp. 159–168. [Google Scholar]
  10. Alzahrani1, N.A.; Abdullah, M.A. Student Engagement Effectiveness in E-Learning System. Biosci. Biotechnol. Res. Commun. Spec. Issue Commun. Inf. Technol. 2019, 12, 208–218. [Google Scholar] [CrossRef]
  11. Brahim, G.B. Predicting Student Performance from Online Engagement Activities Using Novel Statistical Features. Arab. J. Sci. Eng. 2022, 10225–10243. [Google Scholar] [CrossRef]
  12. Tomasevic, N.; Gvozdenovic, N.; Vranes, S. An overview and comparison of supervised data mining techniques for student exam performance prediction. Comput. Educ. 2020, 143, 103676. [Google Scholar] [CrossRef]
  13. Sekeroglu, B.; Dimililer, K.; Tuncal, K. Student performance prediction and classification using machine learning algorithms. In Proceedings of the 2019 8th International Conference on Educational and Information Technology, Cambridge, UK, 2–4 March 2019; pp. 7–11. [Google Scholar]
  14. Burgos, D. Background similarities as a way to predict students’ Behaviour. Sustainability 2019, 11, 6883. [Google Scholar] [CrossRef]
  15. Cavus, N.; Zabadi, T. A comparison of open source learning management systems. Procedia-Soc. Behav. Sci. 2014, 143, 521–526. [Google Scholar] [CrossRef] [Green Version]
  16. Buenaño-Fernández, D.; Gil, D.; Luján-Mora, S. Application of machine learning in predicting performance for computer engineering students: A case study. Sustainability 2019, 11, 2833. [Google Scholar] [CrossRef] [Green Version]
  17. Hussain, M.; Zhu, W.; Zhang, W.; Abidi, S.M.R. Student engagement predictions in an e-learning system and their impact on student course assessment scores. Comput. Intell. Neurosci. 2018, 2018, 6347186. [Google Scholar] [CrossRef] [PubMed] [Green Version]
  18. Daghestani, L.F.; Ibrahim, L.F.; Al-Towirgi, R.S.; Salman, H.A. Adapting gamified learning systems using educational data mining techniques. Comput. Appl. Eng. Educ. 2020, 28, 568–589. [Google Scholar] [CrossRef]
  19. Sana, B.; Siddiqui, I.F.; Arain, Q.A. Analyzing students’ academic performance through educational data mining. 3C Tecnol. Glosas Innovación Apl. Pym 2019, 8, 402–421. [Google Scholar]
  20. Abubakar, Y.; Ahmad, N.B.H. Prediction of students’ performance in e-learning environment using random forest. Int. J. Innov. Comput. 2017, 7. [Google Scholar] [CrossRef]
  21. Kuzilek, J.; Hlosta, M.; Zdrahal, Z. Open university learning analytics dataset. Sci. Data 2017, 4, 170171. [Google Scholar] [CrossRef] [Green Version]
  22. Jiang, S.; Williams, A.; Schenke, K.; Warschauer, M.; O’dowd, D. Predicting MOOC performance with week 1 behavior. In Proceedings of the Educational Data Mining, London, UK, 4–7 July 2014. [Google Scholar]
  23. Baradwaj, B.K.; Pal, S. Mining educational data to analyze students’ performance. Int. J. Adv. Comput. Sci. Appl. 2015, 2, 63–69. [Google Scholar]
  24. Jović, A.; Brkić, K.; Bogunović, N. A review of feature selection methods with applications. In Proceedings of the 2015 38th International Convention on Information and Communication Technology, Electronics and Microelectronics (MIPRO), Opatija, Croatia, 25–29 May 2015; pp. 1200–1205. [Google Scholar]
  25. Tahir, M. Brain MRI Classification Using Gradient Boosting. In Machine Learning in Clinical Neuroimaging and Radiogenomics in Neuro-Oncology; Springer: Berlin/Heidelberg, Germany, 2020; pp. 294–301. [Google Scholar]
  26. Wolpert, D.H.; Macready, W.G. No free lunch theorems for optimization. IEEE Trans. Evol. Comput. 1997, 1, 67–82. [Google Scholar] [CrossRef] [Green Version]
  27. Tahir, M.; Khan, A.; Majid, A.; Lumini, A. Subcellular localization using fluorescence imagery: Utilizing ensemble classification with diverse feature extraction strategies and data balancing. Appl. Soft Comput. 2013, 13, 4231–4243. [Google Scholar] [CrossRef]
Figure 1. Open University Learning Analytics Dataset Schema [21].
Sustainability 14 14795 g001
Figure 2. Gender-wise distribution of students in OULAD dataset.
Sustainability 14 14795 g002
Figure 3. Our proposed research mechanics.
Sustainability 14 14795 g003
Figure 4. Distribution of the final results in 4 categories.
Sustainability 14 14795 g004
Figure 5. Distribution of the final results in 2 categories.
Sustainability 14 14795 g005
Figure 6. ROC plots of different days of data using fandom-forest classifier without SMOTE.
Sustainability 14 14795 g006
Figure 7. Precision-recall curves for data of different durations using random-forest classifier.
Sustainability 14 14795 g007
Figure 8. ROC curve for data of 260 days with random forest and SMOTE.
Sustainability 14 14795 g008
Figure 9. Precision–recall curve for data of 260 days with random forest and SMOTE.
Sustainability 14 14795 g009
Figure 10. ROC curve for data of 260 days using logistic regression.
Sustainability 14 14795 g010
Figure 11. Precision–recall curve for data of 260 days using logistic regression.
Sustainability 14 14795 g011
Figure 12. ROC curve for data of 260 days.
Sustainability 14 14795 g012
Figure 13. Precision–recall curve for data of 260 days.
Sustainability 14 14795 g013
Table 1. Dataset Summary.
ModuleAAABBBCCCDDDEEEFFFGGG
DomainSocial
Sciences
Social
Sciences
STEMSTEMSTEMSTEMSocial
Sciences
Presentations2424343
Students748790944346272293477622534
Table 2. Performance accuracy of the proposed technique using the random-forest classifier.
Random Forest
DaysTraining
Accuracy
Testing
Accuracy
ROC-AUCPrecision–Recall AUC F 1 Score
12090.776.30.7960.85783.1
1501.078.20.8200.89584.7
18098.981.30.8610.92687.3
2101.081.10.8540.92387.2
2301.083.40.8710.93688.9
26097.884.20.8940.95089.8
Publisher’s Note: MDPI stays neutral with regard to jurisdictional claims in published maps and institutional affiliations.

