


Abstract
Different energy requirements of the residential sector are varied, such as electricity, heating, cooling, water, etc., and these necessities are met by multi-energy systems using various energy sources and converters. In this paper, an optimal day-ahead operation of a large residential demand sector is presented based on the energy hub (EH) model with combined heat and power (CHP) as a cogeneration system. The purpose of the optimization is to maximize social welfare (SW) and minimize environmental emissions subjected to numerous technical constraints. To explore the effectiveness of the proposed model, real cases were studied and results were analyzed. Moreover, to evaluate the efficiency of the proposed methodology, the Archimedes optimization algorithm (AOA) is implemented for optimizing the EH system. The performance of the AOA is compared with the genetic algorithm, and the results depict that the AOA is better in terms of convergence speed and global search ability. Implementation of the proposed framework shows that the total SW is increased by 27.44% and environmental emissions are reduced by 18.36% compared to the base case without the EH. Additionally, there is 512.26 MWh and 149.4 m3 as a surplus in the electricity and water that are sold to every network, respectively.
1. Introduction
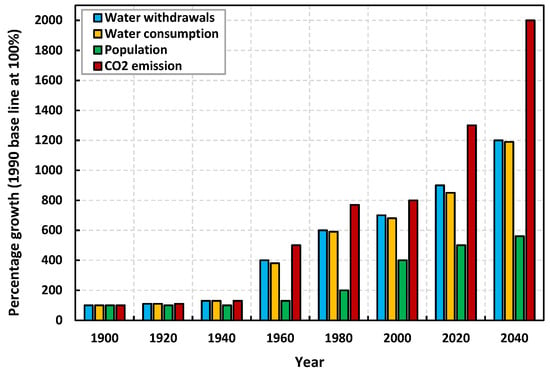
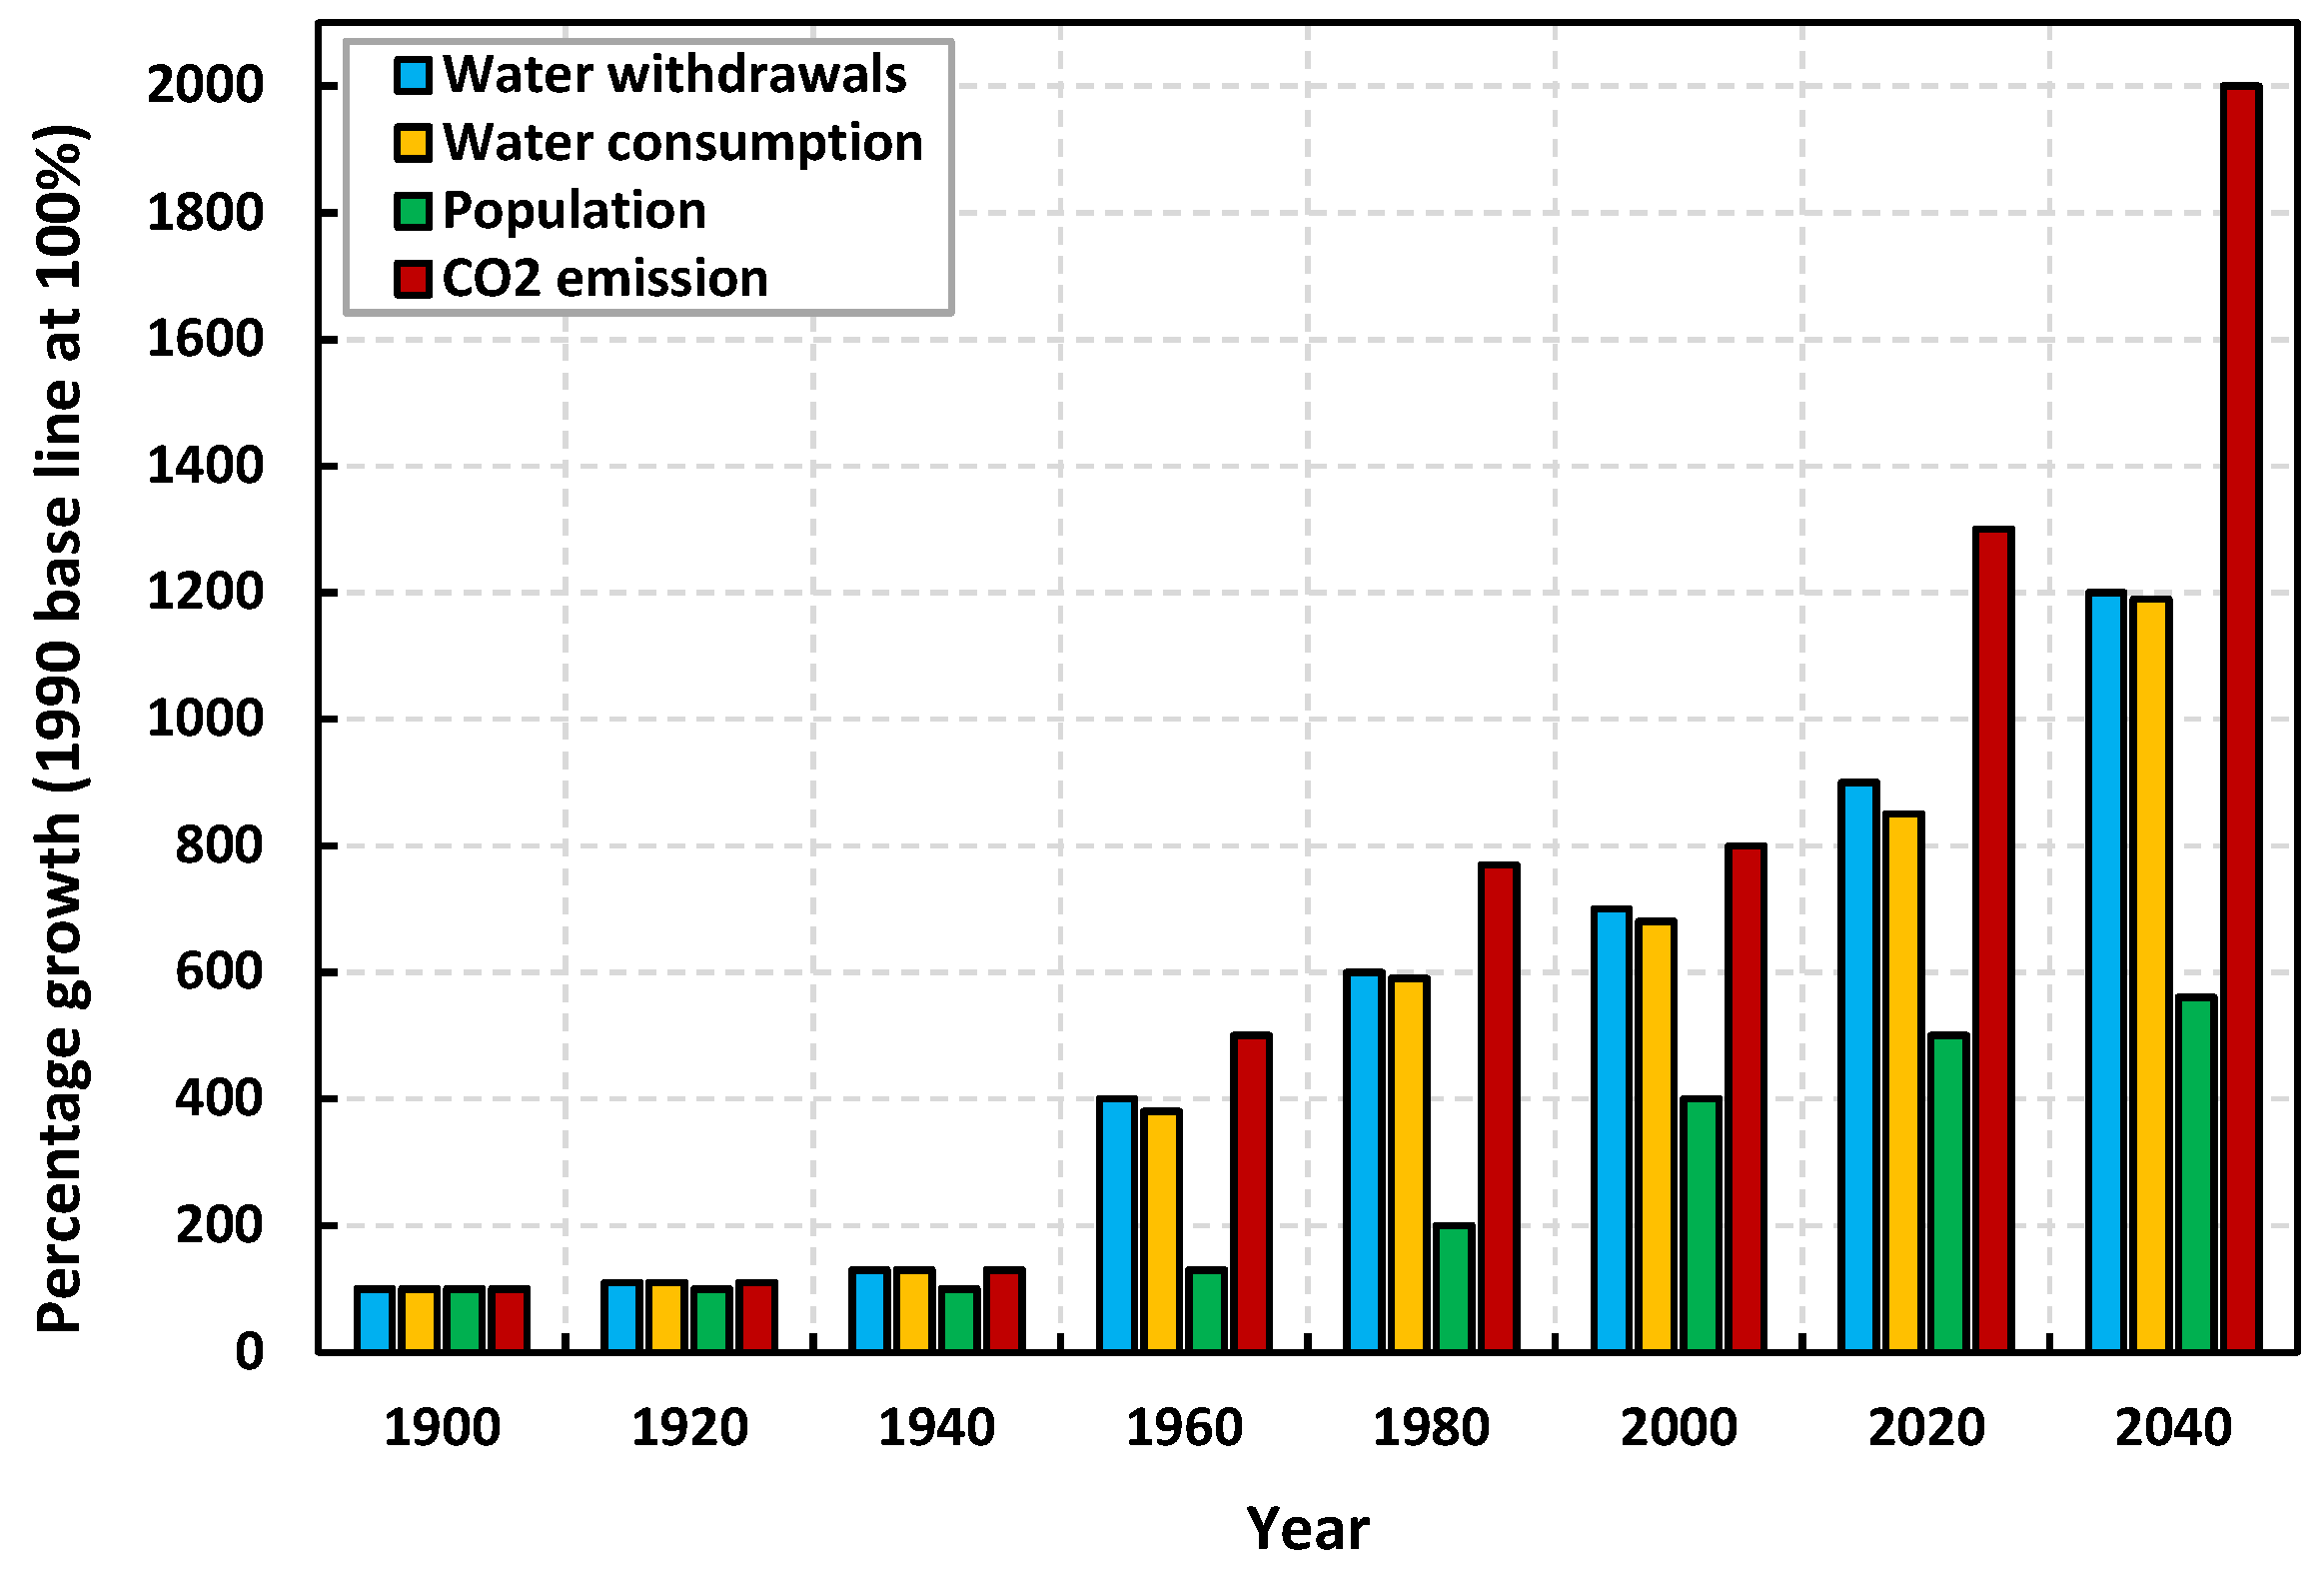
Currently, urban areas comprise more than half of the world’s population, and this number is expected to increase to nearly 5 billion by 2030 [1]. The increase in the world population has prompted researchers to conduct more studies on energy. To achieve this conclusion, researchers face serious economic and public issues that include the development of low carbon, pollution reduction, energy efficiency, shared energy supply, fresh water supply, and more. Figure 1 summarizes the percentage increase in world water withdrawals and consumption, population, and carbon dioxide emissions from 1900 to 2040 [2]. It can be seen that carbon dioxide emissions are predicted to reach a significant amount by 2040. Moreover, water withdrawal and consumption have also increased by more than 1000% [2]. On the other hand, the world was shocked in late December 2019 by the sudden outbreak of COVID-19, which impeded progress toward sustainable energy [3] and caused many major damages to the global economy [4]. As these circumstances persist, post-COVID-19 energy planning should be factored into an appropriate level of investment cost as the global economy continues to recover.
Figure 1.
Water, population and CO2 emission percentage growth rate from 1900 to 2040 (1900 baseline at 100%) [2].
One such suitable candidate is a cogeneration or combined heat and power (CHP) system. The operation mechanism of the CHP units depends on the generation of electricity and heat simultaneously, which increases its efficiency by 80–90%, compared to the traditional stand-alone generation, which has a typical efficiency of 35–55% [5]. Approximately 10–15% of the power transmission losses in the network can be eliminated by using CHP generators [6]. Applying the CHP units reduces overall energy production costs and greenhouse gas emissions because they use less fuel. Many energy systems are integrated through the CHP units such as electricity, gas, and heating systems, which are known as multi-energy systems. An energy hub (EH) concept is introduced for multi-energy systems modeling.
Nowadays, several works of literature have been presented investigating the scheduling of EH. Some different work has been carried out recently on EH planning in the stochastic situation. A new energy management technique for sustainable urban energy systems through EH is presented in [7]. This technique consists of two levels of integrated system modeling based mainly on CHP and renewable energy sources (RESs) but without taking into account these resources’ uncertainty. Residential, commercial, and industrial hubs with similar internal configurations and equipment are proposed in [8]. CHP is a major component of these hubs to feed both electrical and thermal requirements. Work in [9] investigated the optimal scheduling of an EH integrated with CHP and solar energy for two days considering uncertainties via various scenarios. In [10], a technical economic evaluation of EH based on CHP for a medical complex was presented. In this work, an improvement of EH model efficiency and the economic benefits of using CHP were discussed. The risk-constrained probabilistic schedule of an integrated EH with a CHP module has been optimized considering the demand-side resources of a multi-objective model in [11]. Additionally, a multi-objective scheduling model for a small network based on CHP with the integration of an energy storage system (ESS) was presented in [12]. In [13], the optimum size of the EH system was presented using a mid-size CHP unit, where the reliability of supply was evaluated. A robust operating model for an EH with multicarrier including electric vehicles and CHP was presented in [14]. An EH model with CHP was designed for a residential building in [15].
On the other hand, some studies investigated the role of electrical heat pumps (EHPs) in hub schemes. In [16], the performance of residential EH integrated with EHP was discussed. The optimal model of bidding strategy for EH to participate in the target energy market which includes the EHP system was proposed in [17]. The authors investigated the flexibility of an EH operation including CHP and EHP in [18]. A day-ahead optimized scheduling model for an EH including EHP was presented and discussed [19]. Mixed integer linear programming (MILP) was implemented to model the optimization problem in the general algebraic modeling language (GAMS) program for an EH with CHP and ESS to reduce annual costs and emissions without considering RESs [20]. The effect of CHP units feeding many loads to achieve less fuel consumption and less pollution was studied [21]. In [22], an optimal operating strategy for CHP was proposed to reduce the total cost while also satisfying the thermoelectric coupling reduction. An optimal operation technique has been proposed in buildings supplied with CHP units integrated with RESs [23]. The particle swarm algorithm (PSO) algorithm was applied for the optimum planning of multi-source EH systems including RES to feed electrical and thermal loads [24]. An optimal multi-objective method was proposed to optimize a hybrid combined cooling, heating, and power system in order to reduce the total cost, and carbon dioxide emissions and increase the system flexibility [25]. A multi-objective technique based on a genetic algorithm (GA) was proposed in [26] to optimize the performance of an integrated natural gas combined, cooling, heating, and power unit and a ground source heat pump from the energy, economy, and emission perspectives without considering uncertainties of RESs.
Providing clean and reliable fresh water sources for various uses of human societies has always been a major global problem, especially in water-deficient regions. Recently, water desalination (WD) based on reverse osmosis technology has received more attention compared to other technologies because of its economic performance [27]. An optimal day-ahead operation of a microgrid based on coastal EH to minimize operational and environmental costs was presented [2]. Authors in [1] proposed a new model of a smart island in the power system composed of different energy resources including smart EH equipped with a desalination unit to supply electricity, thermal, and water demand. Authors in [28] studied the operation of multi-carrier energy systems integrated with CHP, wind turbines (WTs), gas-fired power plants, heat buffer tanks, pumped-storage systems, and gas storage technologies to meet daily electric power, gas, heating, and water loads. In [29], the optimal management of a water grid constructed for a pilot agro-industrial district, based on greenhouse cultivation, was analyzed. The proposed algorithm was based on the EHs approach and took into account economic terms and the optimal use of the available resources. EH scheduling for day-ahead has been studied in the presence of WT and electrical, thermal, and pico-hydel energy storage [30]. In [31], a proposed EH consisting of electricity, heat, and WD production equipment was optimized based on the GA to reduce costs and pollutants and increase the exergy efficiency.
In light of the previous studies, the current study contributes to presenting an optimization-based model to address the planning and operation of the EH system. Different loads, unpredictable wind power, photovoltaic (PV) power, and ESSs are taken into account. The optimal integration among various types of resources, environmental requirements, and economic criteria will be explored. In addition, the optimization problem will be solved based on the Archimedes optimization algorithm (AOA) to maximize total social welfare (SW) by reducing the total system operation cost and carbon dioxide emissions. A comparison between the most recent applied research and the proposed method is shown in Table 1.
Table 1.
Comparison between the proposed system and some related literature.
The major contributions of this paper can be briefed as:
- ▪
- Proposing a methodology to address integrations among EH components and energy networks, while satisfying different system constraints. Economic and environmental objective functions are considered to address the configuration and optimal operation of the EH system. Moreover, seeking to address reliability enhancement for electrical, thermal, and drinking water as vital requirements.
- ▪
- Applying the AOA and GA to optimally solve the optimization problem to maximize the total SW and minimize emissions. Moreover, analyzing the performance of CHP units and verifying their effectiveness with EHs.
- ▪
- Verifying the effectiveness of the proposed method in a short-term situation; a day is examined within one hour.
2. Energy Hub (EH) Modelling
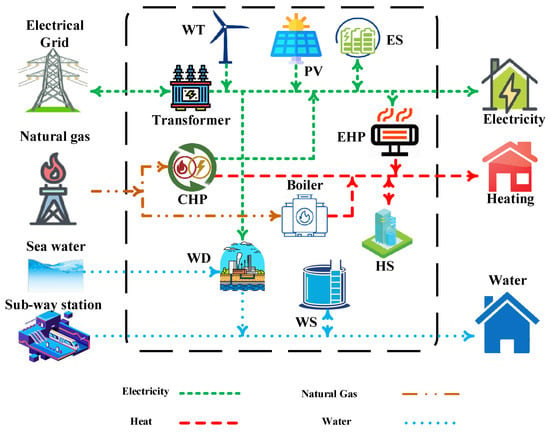
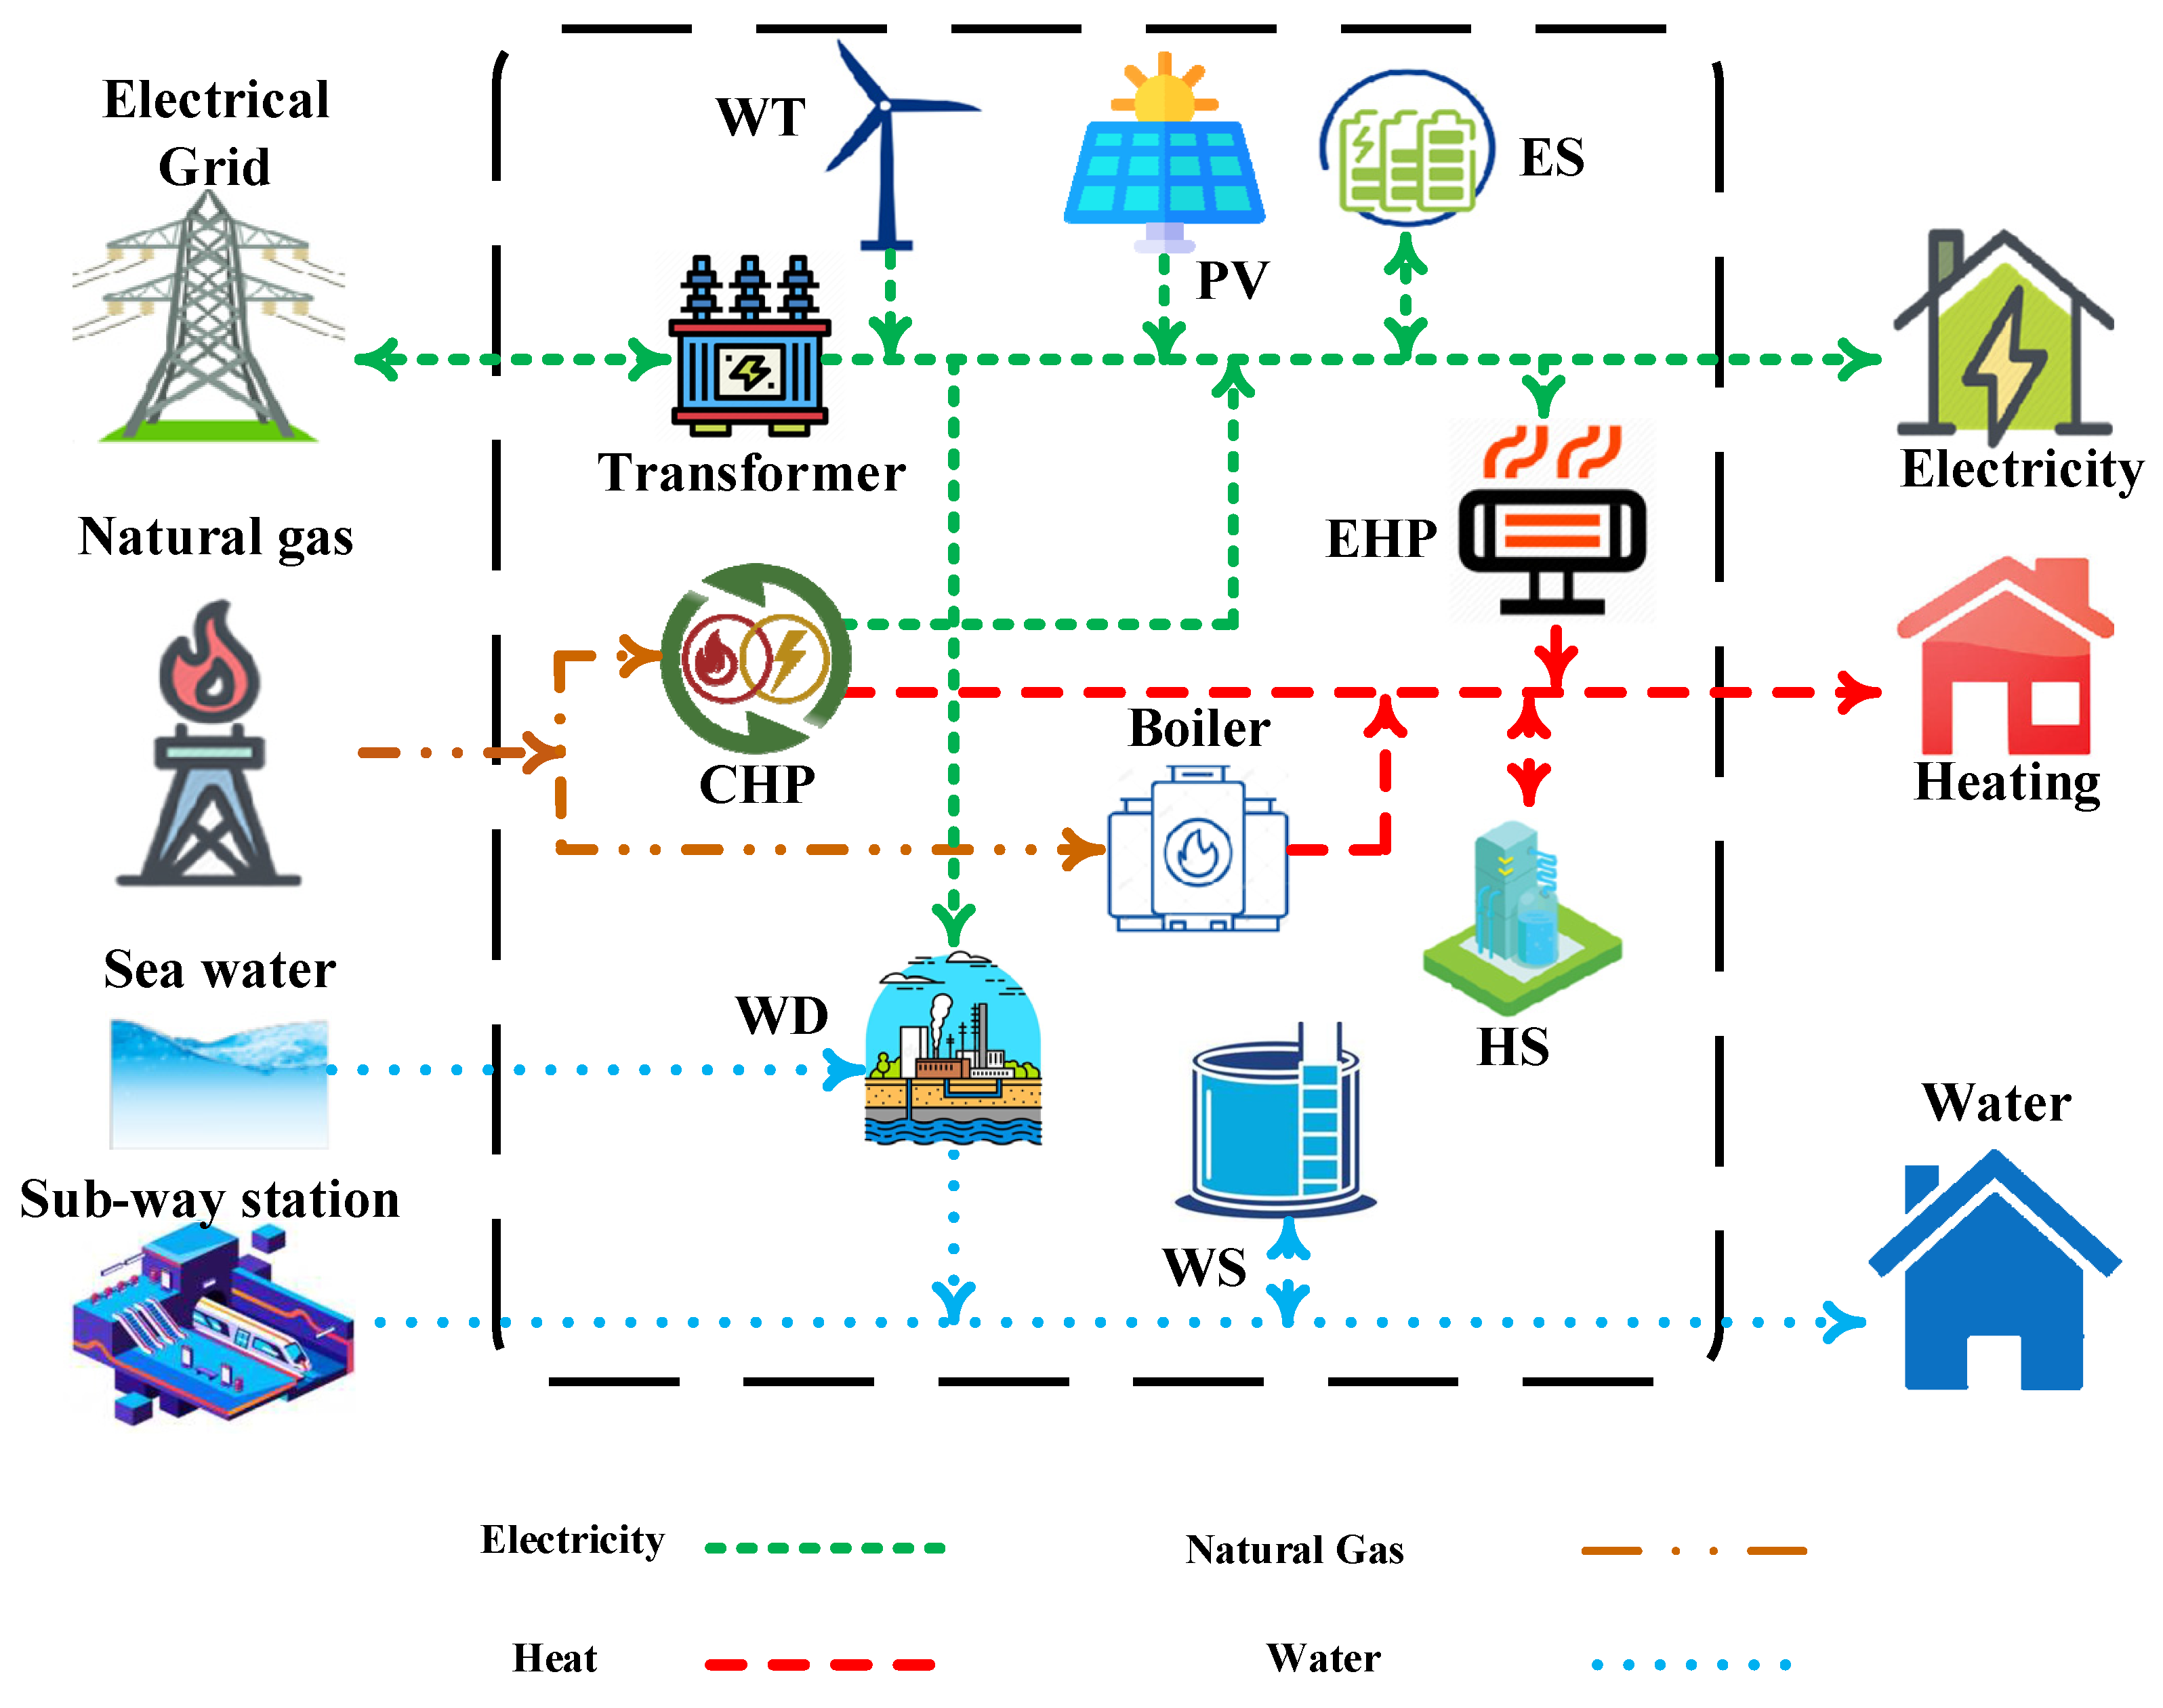
Figure 2 shows an architecture of a proposed EH. The proposed EH consists of three integrated networks. The main energy sources of the hub are electricity, natural gas, and water whereas the output side supplies electricity, heat, and freshwater loads. The integration among these networks occurs through the EH components, such as CHP, EHP, boiler, and WD. Additionally, electrical, thermal, and water storage units were used to maximize utilization during periods of low load and to fill the deficit at peak loads. RESs (PV and WT) are also used in the EH to minimize total operating costs and emissions. The EH input and output are coupled by mathematical relationships which are defined in (1) and (2) as follows [32]:
where and are output loads, coupling matrix, and input energy carriers, respectively, which are illustrated in detail in the following subsections.
Figure 2.
The architecture of studied EH.
Nowadays, many companies all over the world apply the EH concept and distribute water, gas, electric power, and RES. The first real EH was presented in Switzerland by the Regionalwerke AG Baden company [33]. The hub was composed of wood chips, a cogeneration plant, and methane gasification. The objective was to obtain natural gas and heat from burning wood chips available in the company’s supply area. Natural gas was pumped either directly into the natural gas system or converted into electricity through the cogeneration unit and integrated into the electrical grid. In either case, the wasted heat was injected into the local heating network. Nitrogen and steam were used for the gasification process which was also provided at the hub entrance in addition to the above-mentioned energy carriers.
2.1. PV Unit Output Power Modelling
Integrating PV modules into the electrical grid is a great solution to meet electrical demand and reduce carbon dioxide emissions. On the other hand, the development of PV modules faces a major challenge which is their unpredictable nature [34]. The power produced from PV arrays is calculated by:
where is the solar radiation at time (kW/m2), is the PV cell rated power (MW), and is PV cell efficiency.
2.2. WT Output Power Modelling
The generation of electrical energy from wind is one of the most promising types of generation in the world. The flow of air is converted into electrical energy without a negative impact on the environment [34]. Despite the different geographical conditions, seasonal changes, and other factors, the proposed model in this work of wind power is applicable under any operating conditions. Additionally, the power generation of WTs is highly uncertain and is formulated as a function of wind speed as represented in this work. The power generated of a WT is calculated by (4):
where , , , and are the actual wind speed at time , cut-in speed, cut-out speed, and rated speed (m/s), respectively. is the rated value of wind power (MW).
2.3. ESSs Model
ESSs are used to feed loads in case of low power generation. ESSs were modeled similarly to the authors presented in [35].
2.4. CHP Model
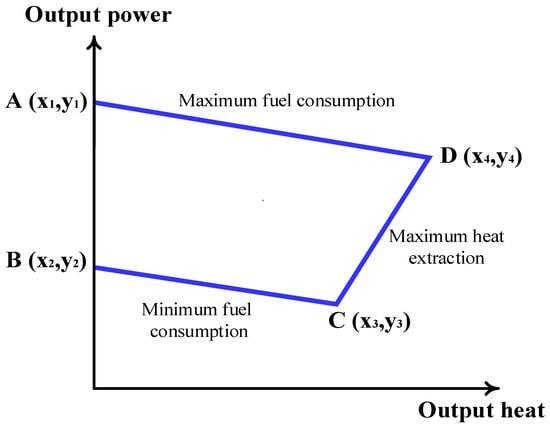
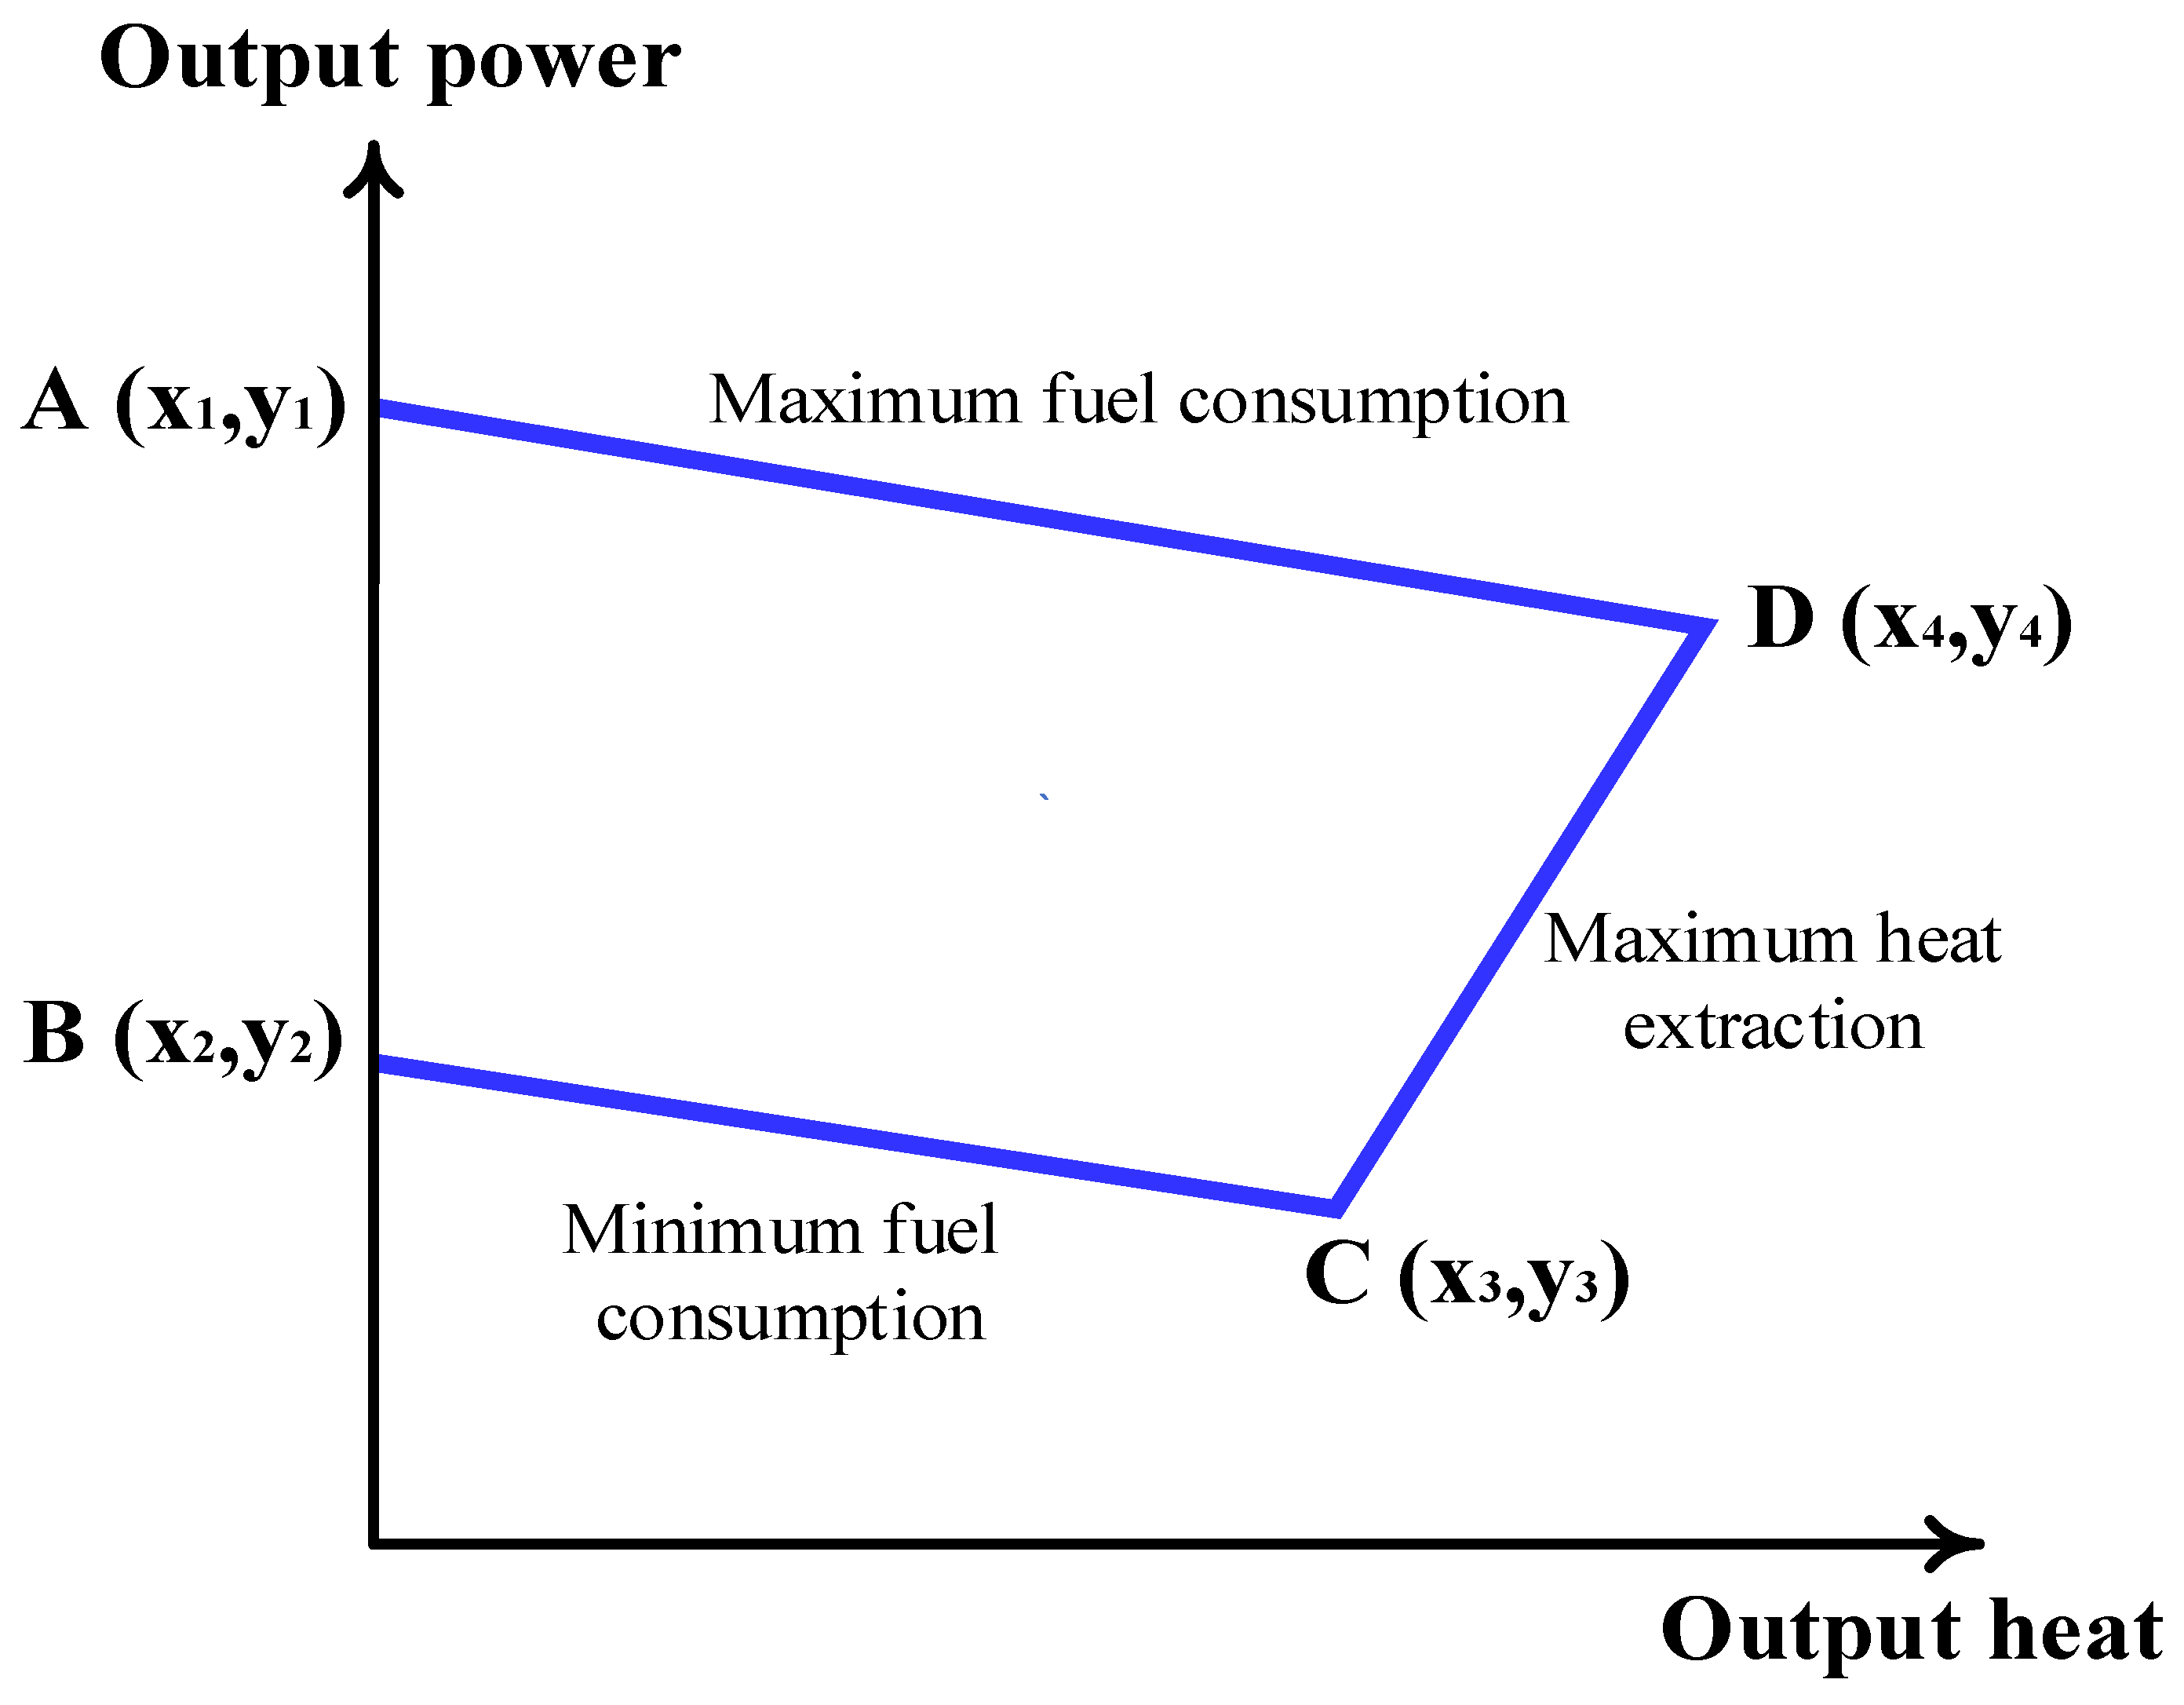
Both heat and power are generated from the CHP units. Each CHP unit has a thermal-electrical characteristic. One of the most used and feasible thermoelectric operation regions is shown in Figure 3. The complete model of CHP is illustrated in [11,36].
Figure 3.
The thermal-electrical characteristic of the CHP unit.
2.5. EHP Model
EHP is powered by electric energy and extracted the heat from the cold ambient air and transfers it to heat the water in the heating system. The electrical power () taken from EH by EHP is [37]:
where is the EHP coefficient of performance, and is EHP thermal energy produced (MWth) at time .
2.6. GB Model
In the proposed EH system, GB is a standby unit for supplying thermal demand requirements when the heat produced by the CHP and EHP, and the available ESS capacity, is insufficient. The heat produced by the GB unit is given as [21].
where is EHP thermal energy produced (MWth) at time , is the GB coefficient of performance, and is the quantity of natural gas absorbed by GB at time (MW).
2.7. WD Unit Modelling
In this paper, one of the components of a water supply system is a WD unit, which can be established anywhere in the system (near the sea or groundwater). This paper focused on reducing costs and emissions without addressing the optimal location of the WD units (which can be considered in future work). Additionally, the WD unit is considered an aggregate device that imports electrical energy from EH and exports fresh water. Therefore, the detailed thermodynamic formula for the water grid is not taken into account. The WD unit is supplied with electric power to produce fresh water from seawater. The relationship between the produced water () and the consumed electricity () can be calculated as [2]:
where is the performance coefficient of WD (m3/MW).
3. Uncertainty Analysis of RESs
The high uncertainty in the energy produced from RESs makes it important to model the stochastic behavior of these resources. So, the planning and operation of an EH are managed, taking into account the unpredictable nature of these units. In this section, the uncertainties in RESs power generation are addressed. In order to account for differences in wind speed data, the Weibull distribution is used to continuously track changes in wind speed through a scale factor k and a form factor c. The Weibull distribution probability density function () is defined as [32]:
where is the total available wind power (MW), and .
To model the uncertainties in the PV modules’ generated power, the beta distribution function is used [32]:
where is the total available PV power (MW), and are beta parameters.
4. Thermal Generation Emissions
In most electric power grids, the bulk of the electric power generated is by thermal power plants which produce high carbon dioxide emissions. Hence, the number of emissions can be expressed as [38]:
where ,,,, and are emission coefficients of the thermal generators and is the power of the thermal generator (MW).
5. Problem Formulation and Methodology
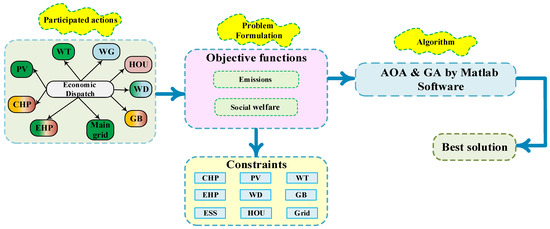
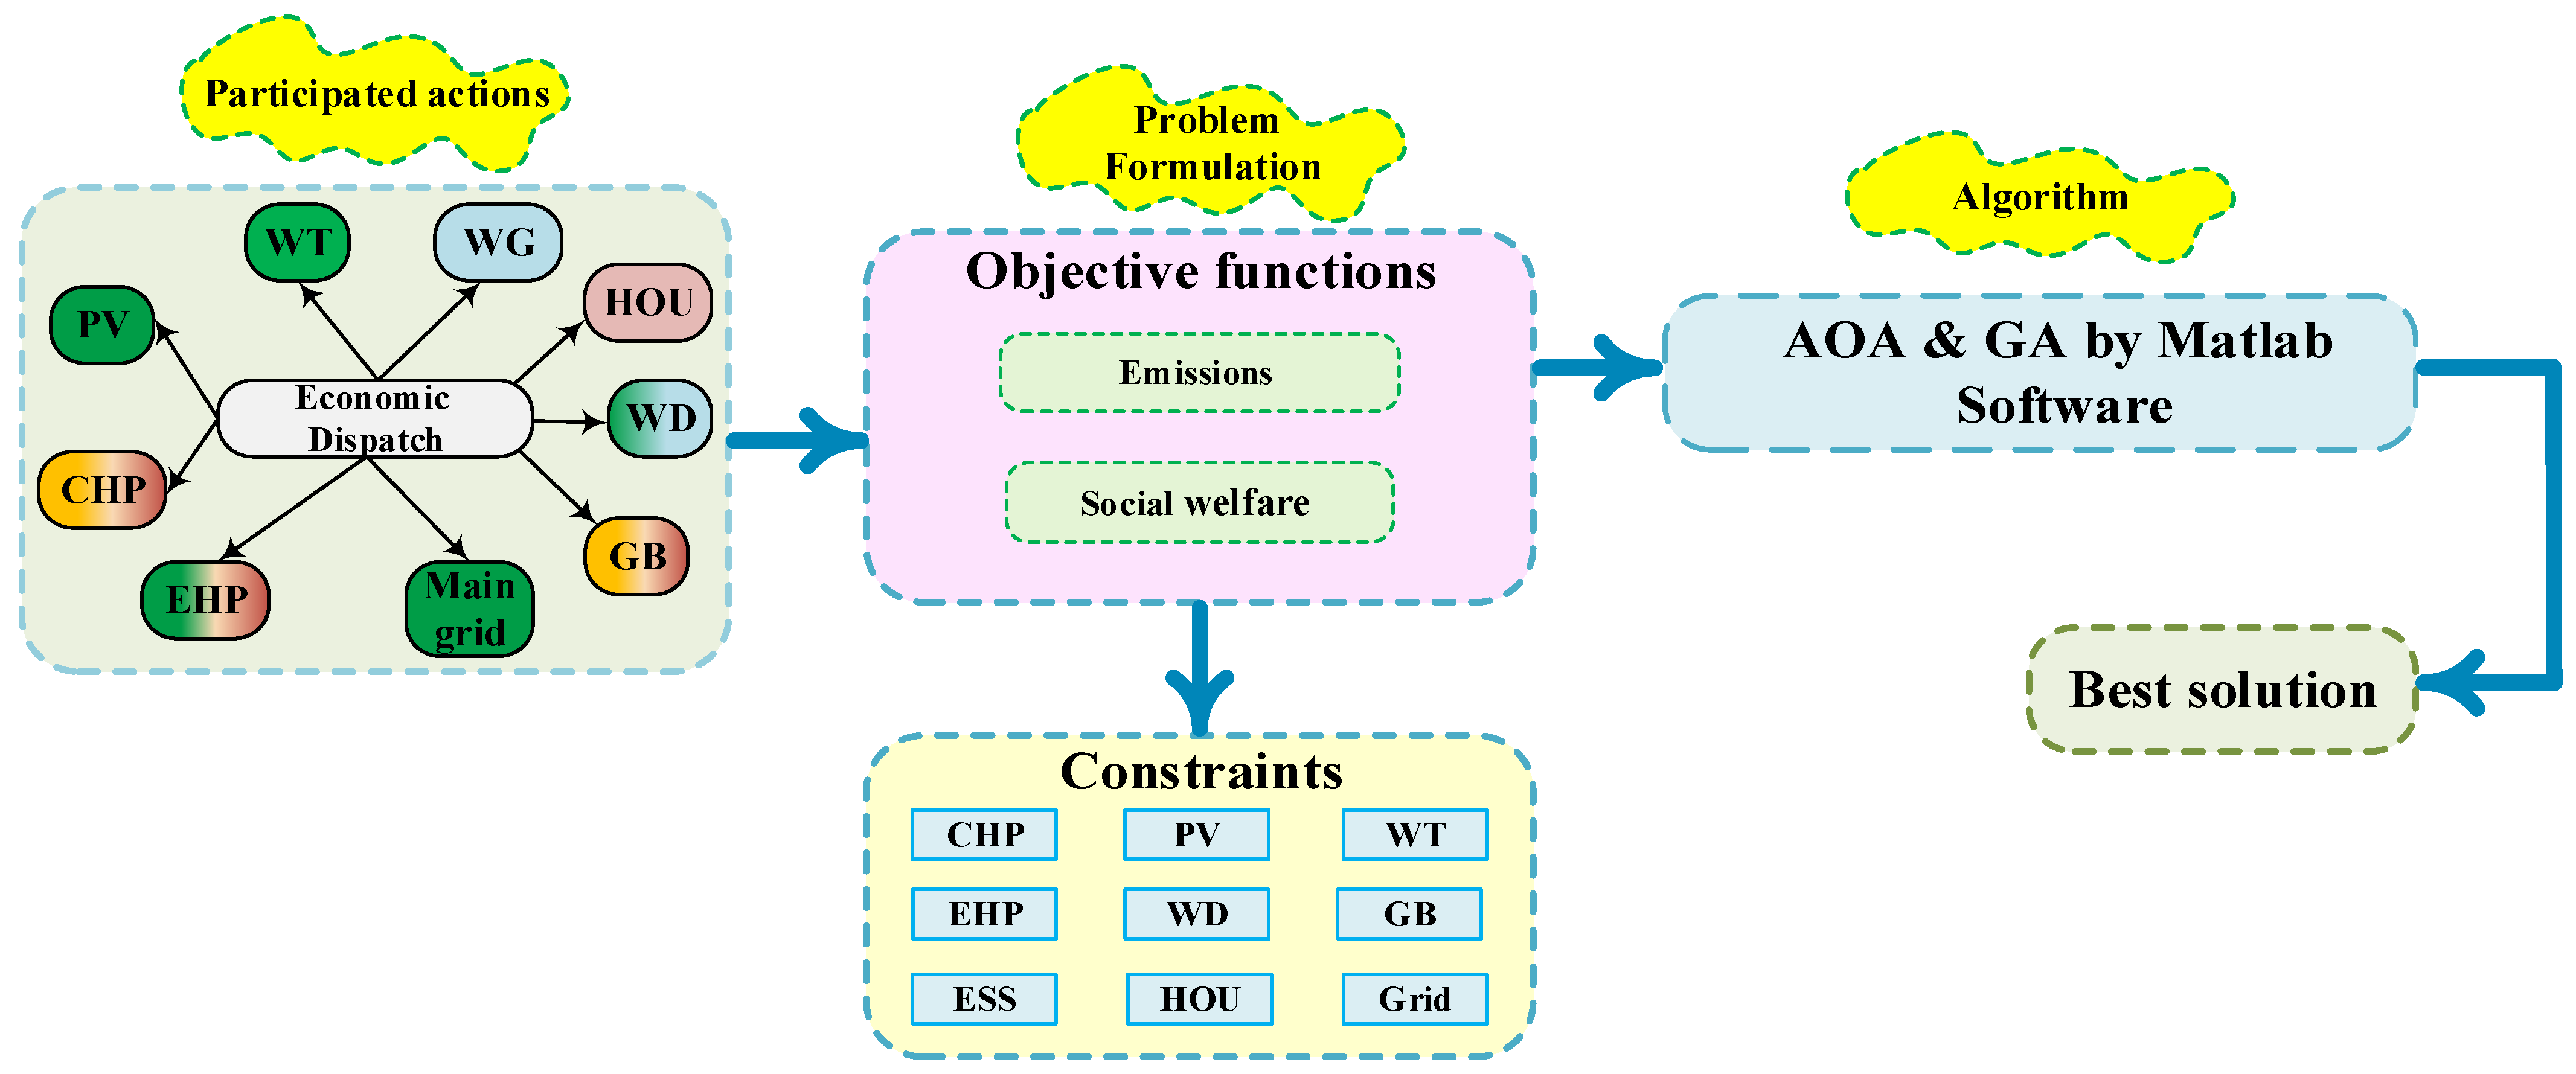
The primary objective of this paper is to provide the electricity, heating, and water requirements of EH at the highest SW by minimizing total system operating costs and lowering CO2 emissions while taking into account various system constraints.
5.1. Objective Function
This work aims to obtain the optimum values of power, heat, and water output from available generators subject to coordinated constraints. The total operating cost can be expressed as a summation of individual operating costs.
This paper deals with a system that includes a conventional power unit, a CHP unit, and an HOU. Reliable models describing the off-design process (partial load relationships between power production and fuel consumption) per unit as well as reliable optimization methods are required in order to improve the optimization problem. Depending on the nature of these relationships, the appropriate method should be applied to solve the optimization problem. However, in practice, second-order or linear convex input/output relationships are applied. The cost function per unit is obtained when the input/output curve is multiplied by the cost of fuel burned per unit. Assuming convex input/output curves for conventional power, CHP and HOU, their cost functions will also be convex [39] as follows:
- Conventional power generators’ operating cost can be represented by a quadratic form as [36]:where is the conventional generator-produced power cost ($), and , and are the conventional generator cost coefficients.
- CHP generator operation cost can be represented by a quadratic form as [32]:where is the CHP generator produced energy cost ($), and are the CHP generation cost coefficients, and are the electrical and heating outputs of the CHP unit.
- The operating cost of a heat-only unit (HOU) can be represented by a quadratic form as [36]:where is the produced heat cost ($), and , , and are the heat generation cost coefficients of an HOU.
- Because of the uncertainty of the available RESs at any given time, the factors for overestimating and underestimating the available RESs must be included in the model. The overestimation factor can be easily explained in that if a certain amount of RES power is assumed and that power is not available at the assumed time, then the power must be purchased from an alternative source or the loads must be disposed of. In the case of an underestimation penalty, if the available RES power is more than was assumed, then that power will be wasted, and it is reasonable for the system operator to pay a cost to the RES power product for the wastage of available capacity. Surplus RES power is usually sold to neighboring utilities, or by rapid redistribution. The output of non-RES generators is correspondingly reduced. Only if this cannot be achieved should the phantom load resistors be connected to “waste” the excess power. Obviously, these actions can be modeled by a simple minimization penalty cost function as [36]:where and are the total cost of WT and PV generators ($), and are the cost coefficient of WT and PV generators ($/MW), respectively, and are the Weibull and beta of WT and PV generator, respectively, and are the cost coefficient of WT and PV generators because of over-generation ($/MW), and are the scheduled output of WT and PV generators, and and are the cost coefficient of WT and PV generators because of under-generation ($/MW). The cost coefficients of WT and PV generation are calculated as follows [36]:
- The operating cost of charge/discharge of ESSs can be represented by different models but this paper deals with a simple linear function, as the ESSs should be considered as a load when being charged and be considered as a generation source when discharging to the network [40]:where is the ESS power cost ($), and are the discharging and charging cost of the ith ESSs ($/MW), respectively, and and are the discharging and charging power of the ith ESSs (MW), respectively.
The operation cost of GB, EHP, WD, and WG is supposed to be linear. Where the output energy of each unit is linearly related to the quantity of fuel entering the unit and the cost coefficients.
- The operating cost of EHP can be represented by a linear function as [37]:where is the power absorbed cost ($) and is the EHP unit cost coefficient ($/MW).
- The operating cost of GB can be represented by a linear function as [41]:where is the natural gas absorbed cost ($) and is GB unit cost coefficient ($/MW).
- The operating cost of a WD unit can be represented by a linear function as [42]:where is the power absorbed cost ($) and is the WD unit cost coefficient ($/MW).
- The operating cost of the water grid (WG) can be represented in a linear form as [35]:where is the total cost of water produced from WG ($), is the cost coefficient of the WG ($/m3), and is the volume of the water produced from the WG (m3).
To calculate the total system operation cost during period , (10)–(24) are integrated into one formula as follows:
In this work, a single objective optimization problem is solved to find the minimum cost. So, a penalty factor ($/kg) is used to convert emissions value into cost [38]. The optimum solutions are then achieved while minimizing operation cost, minimizing emission cost, and meeting the load requirements and system operation constraints. The maximum penalty rate factor is defined as the ratio between the highest predictable value of operating cost () and the highest estimated value for emissions (), which is given by:
Then, the corresponding cost of emissions () can be calculated by total emissions ( as follows [38]:
The revenue () achieved from selling the energy to end users can be expressed as:
where is electrical energy consumed cost ($/MW), is heat energy consumed cost ($/MWth), is water consumed cost ($/m3), and , , and are the electrical, heat, and water demand, respectively.
Social welfare is given by:
The overall objective function () is defined as:
This objective is constrained by the following:
- Electrical power balance
The sum of power generated by the EH components in addition to electricity supplied by the electrical grid should be equal to the total electrical requirements, EHP, WD, and electrical losses of the system. So, the electric power balance constraint is defined as:
where is the ES power (MW) and is the value of total power losses (MW) which is illustrated in [32].
- 2.
- Heating power balance
The sum of heat produced by CHP, GB, and EHP should be enough to supply heating demand in the EH. Therefore, the heat power balance can be met as follows:
where is the power of HS (MWth) and is the heat loss (MWth) which is illustrated in detail in [32].
- 3.
- Water balance
The total generated water from the WD unit, WS, and WG should supply water demand in the EH. This constraint can be met by water balance as follows:
where is the volume of water storage (m3).
- 4.
- Line flow and bus voltage limits:
- 5.
- Ramp rate limits for thermal generator, CHP, EHP, GB, WD, WG, and HOU:
- 6.
- Real operating power limits for wind, PV, CHPs, EHP, and WD units:
- 7.
- Heat limits for CHPs, HOUs, EHP, and GB:
- 8.
- Charging/discharging limits of ESSs:
- 9.
- Initial and final energy in ESSs:
5.2. Optimization Algorithm
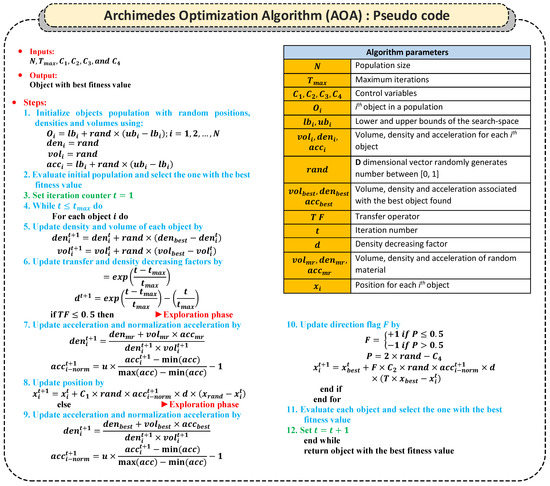
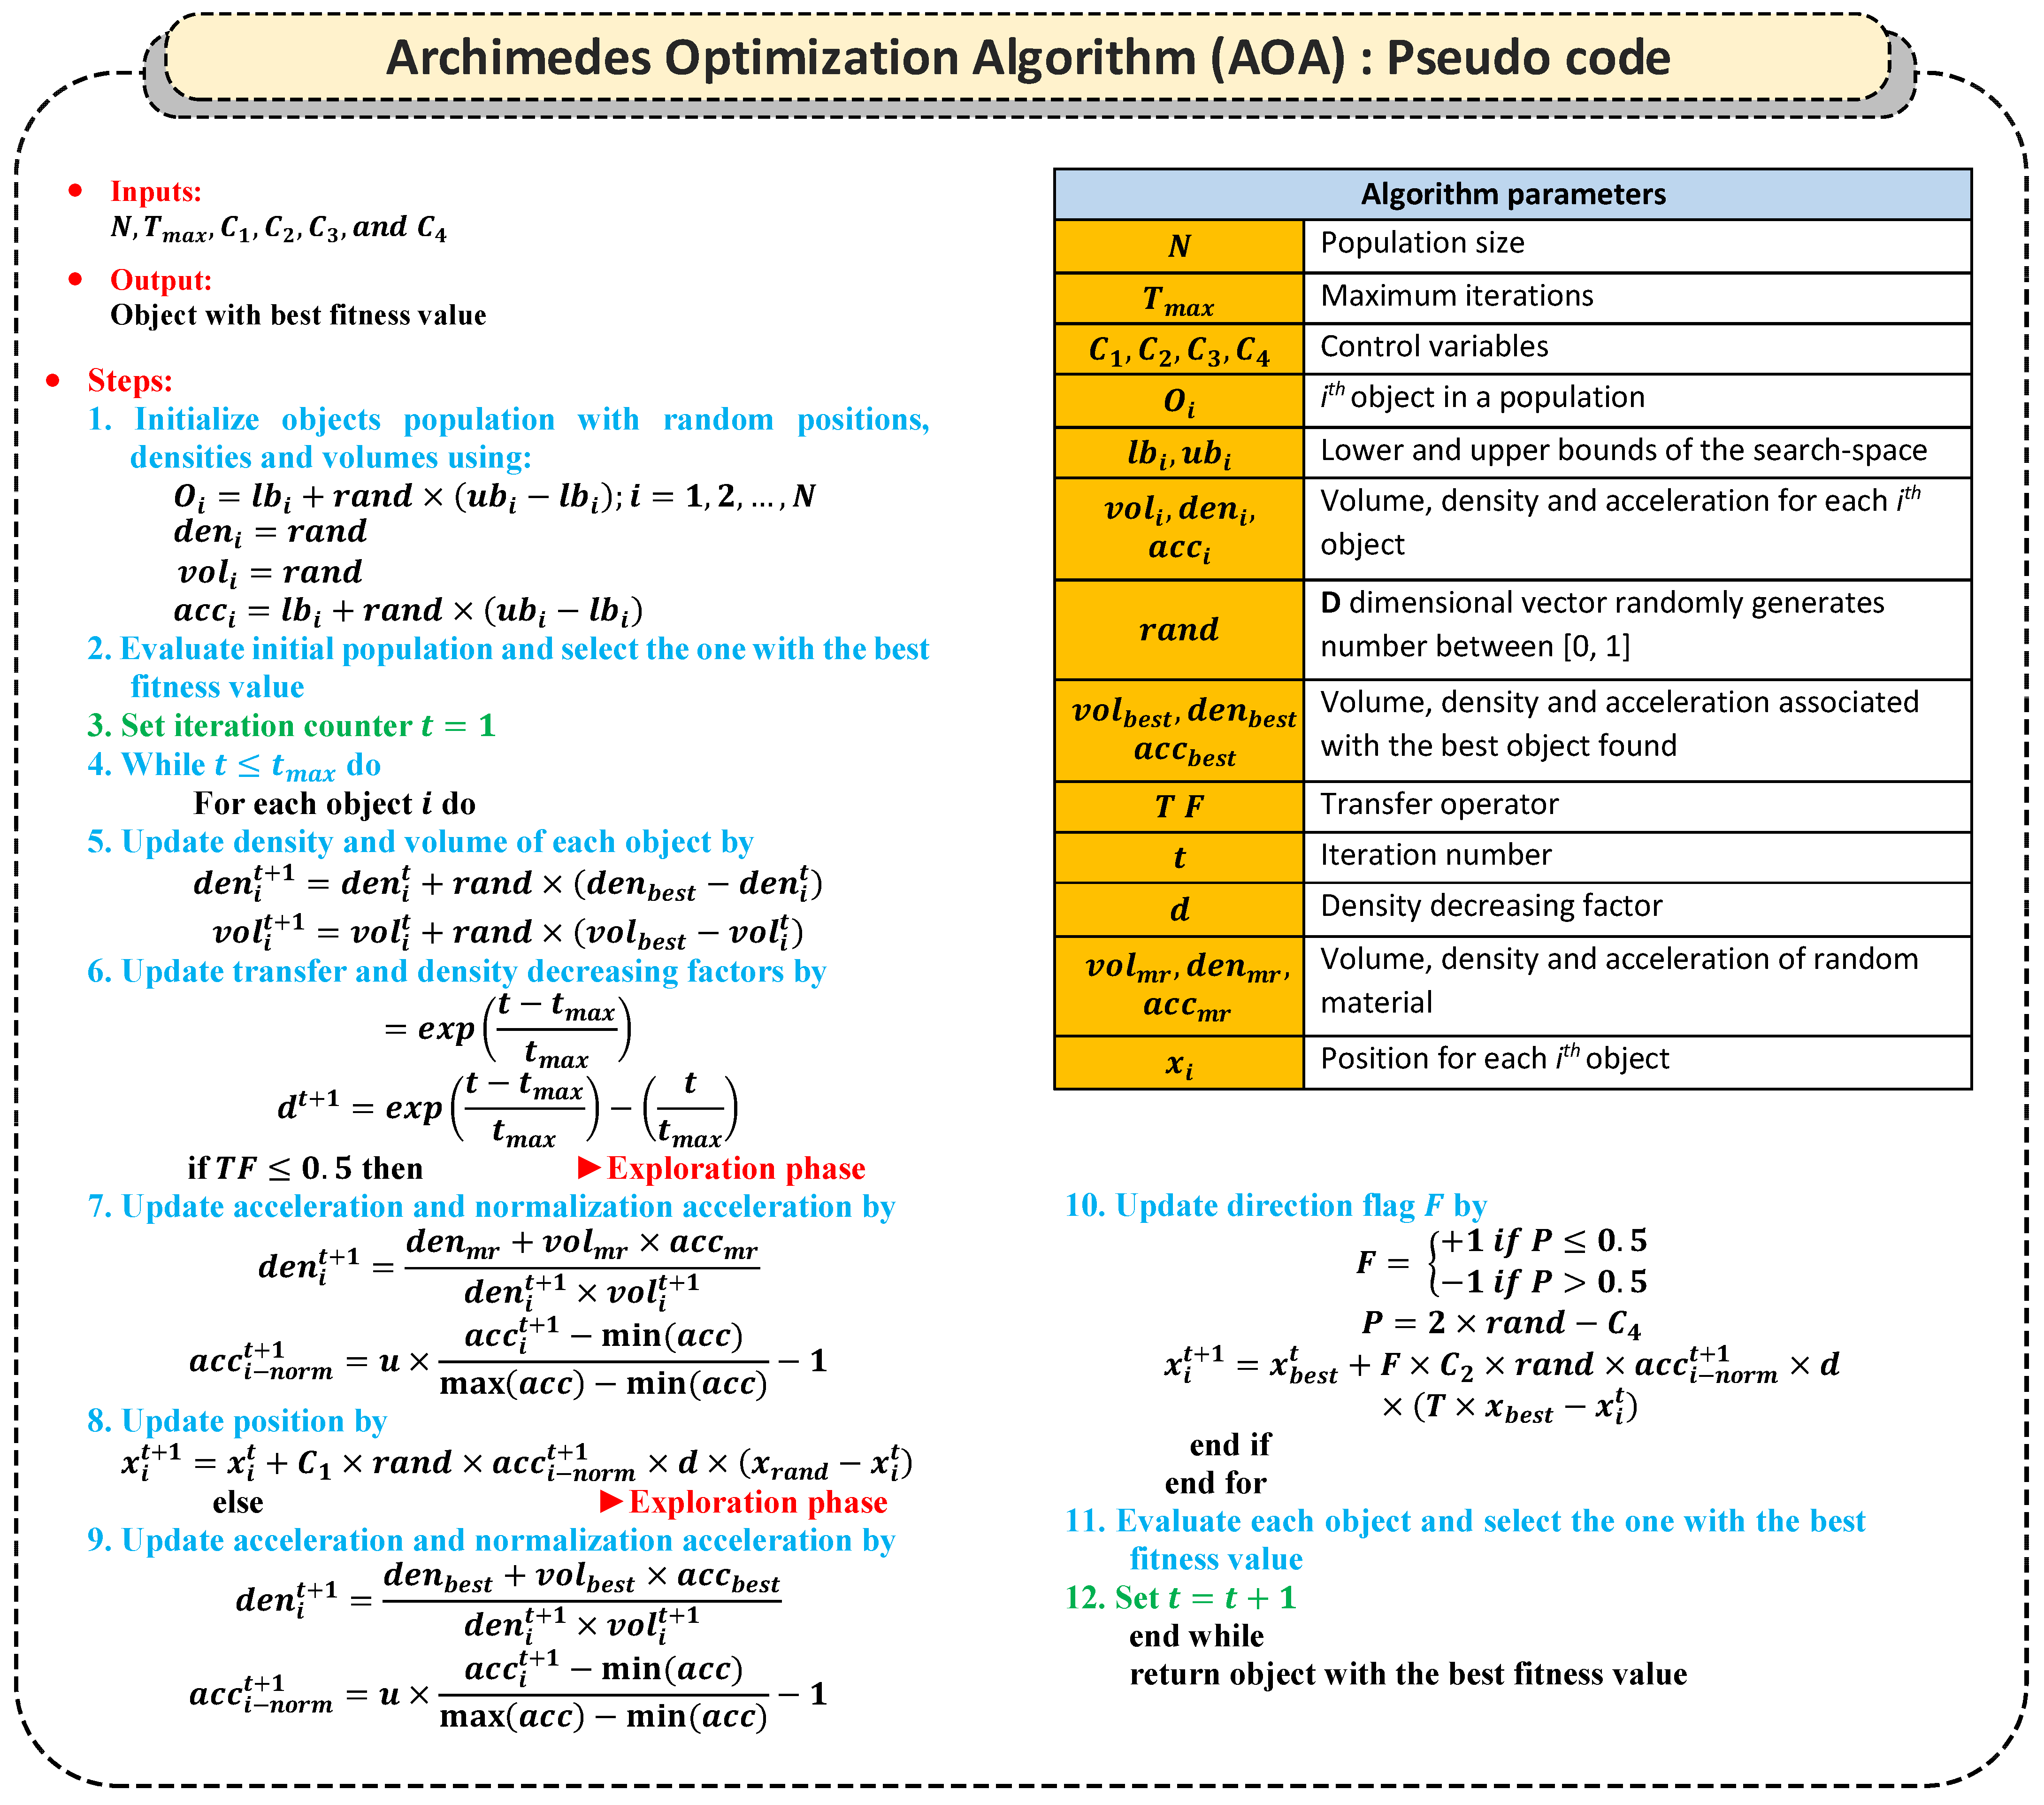
The AOA is a novel optimization algorithm that has been proposed to address real-world problems [43]. This optimizer derives the idea of his work from Archimedes’ principles states, and it depends on the behavior of the force exerted when an object is partially or completely immersed in a liquid. Similar to most swarm optimizers and metaheuristic algorithms, the AOA proposes population-based solutions. In this case, the proposed solutions are represented by immersed objects. The optimization process starts with proposing an initial set of random particles (objects/locations/solutions). Each particle has its size, density, and acceleration which are updated in an iterative process. Theoretically, the AOA includes many explorations and exploitations processes because it is a global optimization algorithm. Figure 4 introduces the pseudo-code of the AOA; including population initialization, population assessment, and parameter updating [44].
Figure 4.
AOA Pseudo code.
5.3. Proposed Stochastic Planning Structure
The primary objective of stochastic planning is the total SW and emissions reduction since all demand requirements are satisfied. In this paper, the AOA algorithm was used to improve the EH system performance. The suggested methodology for EH planning taking into account electrical, thermal, and water energy balancing is illustrated in Figure 5. Heat network, electrical grid, water network specifications, economic data, weather data, power generation of RESs, and various types of demands are the inputs to the proposed system. Further, the electrical, thermal, and water energy balances are analyzed in the planning procedure.
Figure 5.
Proposed algorithm.
5.4. EH Methodology to Satisfy Electrical, Thermal, and Water Demand
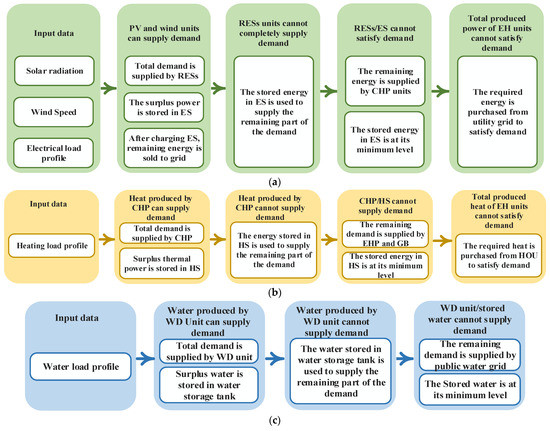
In this study, electrical, thermal, and water demands are considered. The overall methodology for supplying all electrical, thermal, and water loads is discussed. In addition, priority should be given to the various components and networks of EH to supply aggregate demand. The methodology is illustrated in the following subsections.
5.4.1. A proposed Methodology to Satisfy Electrical Requirements
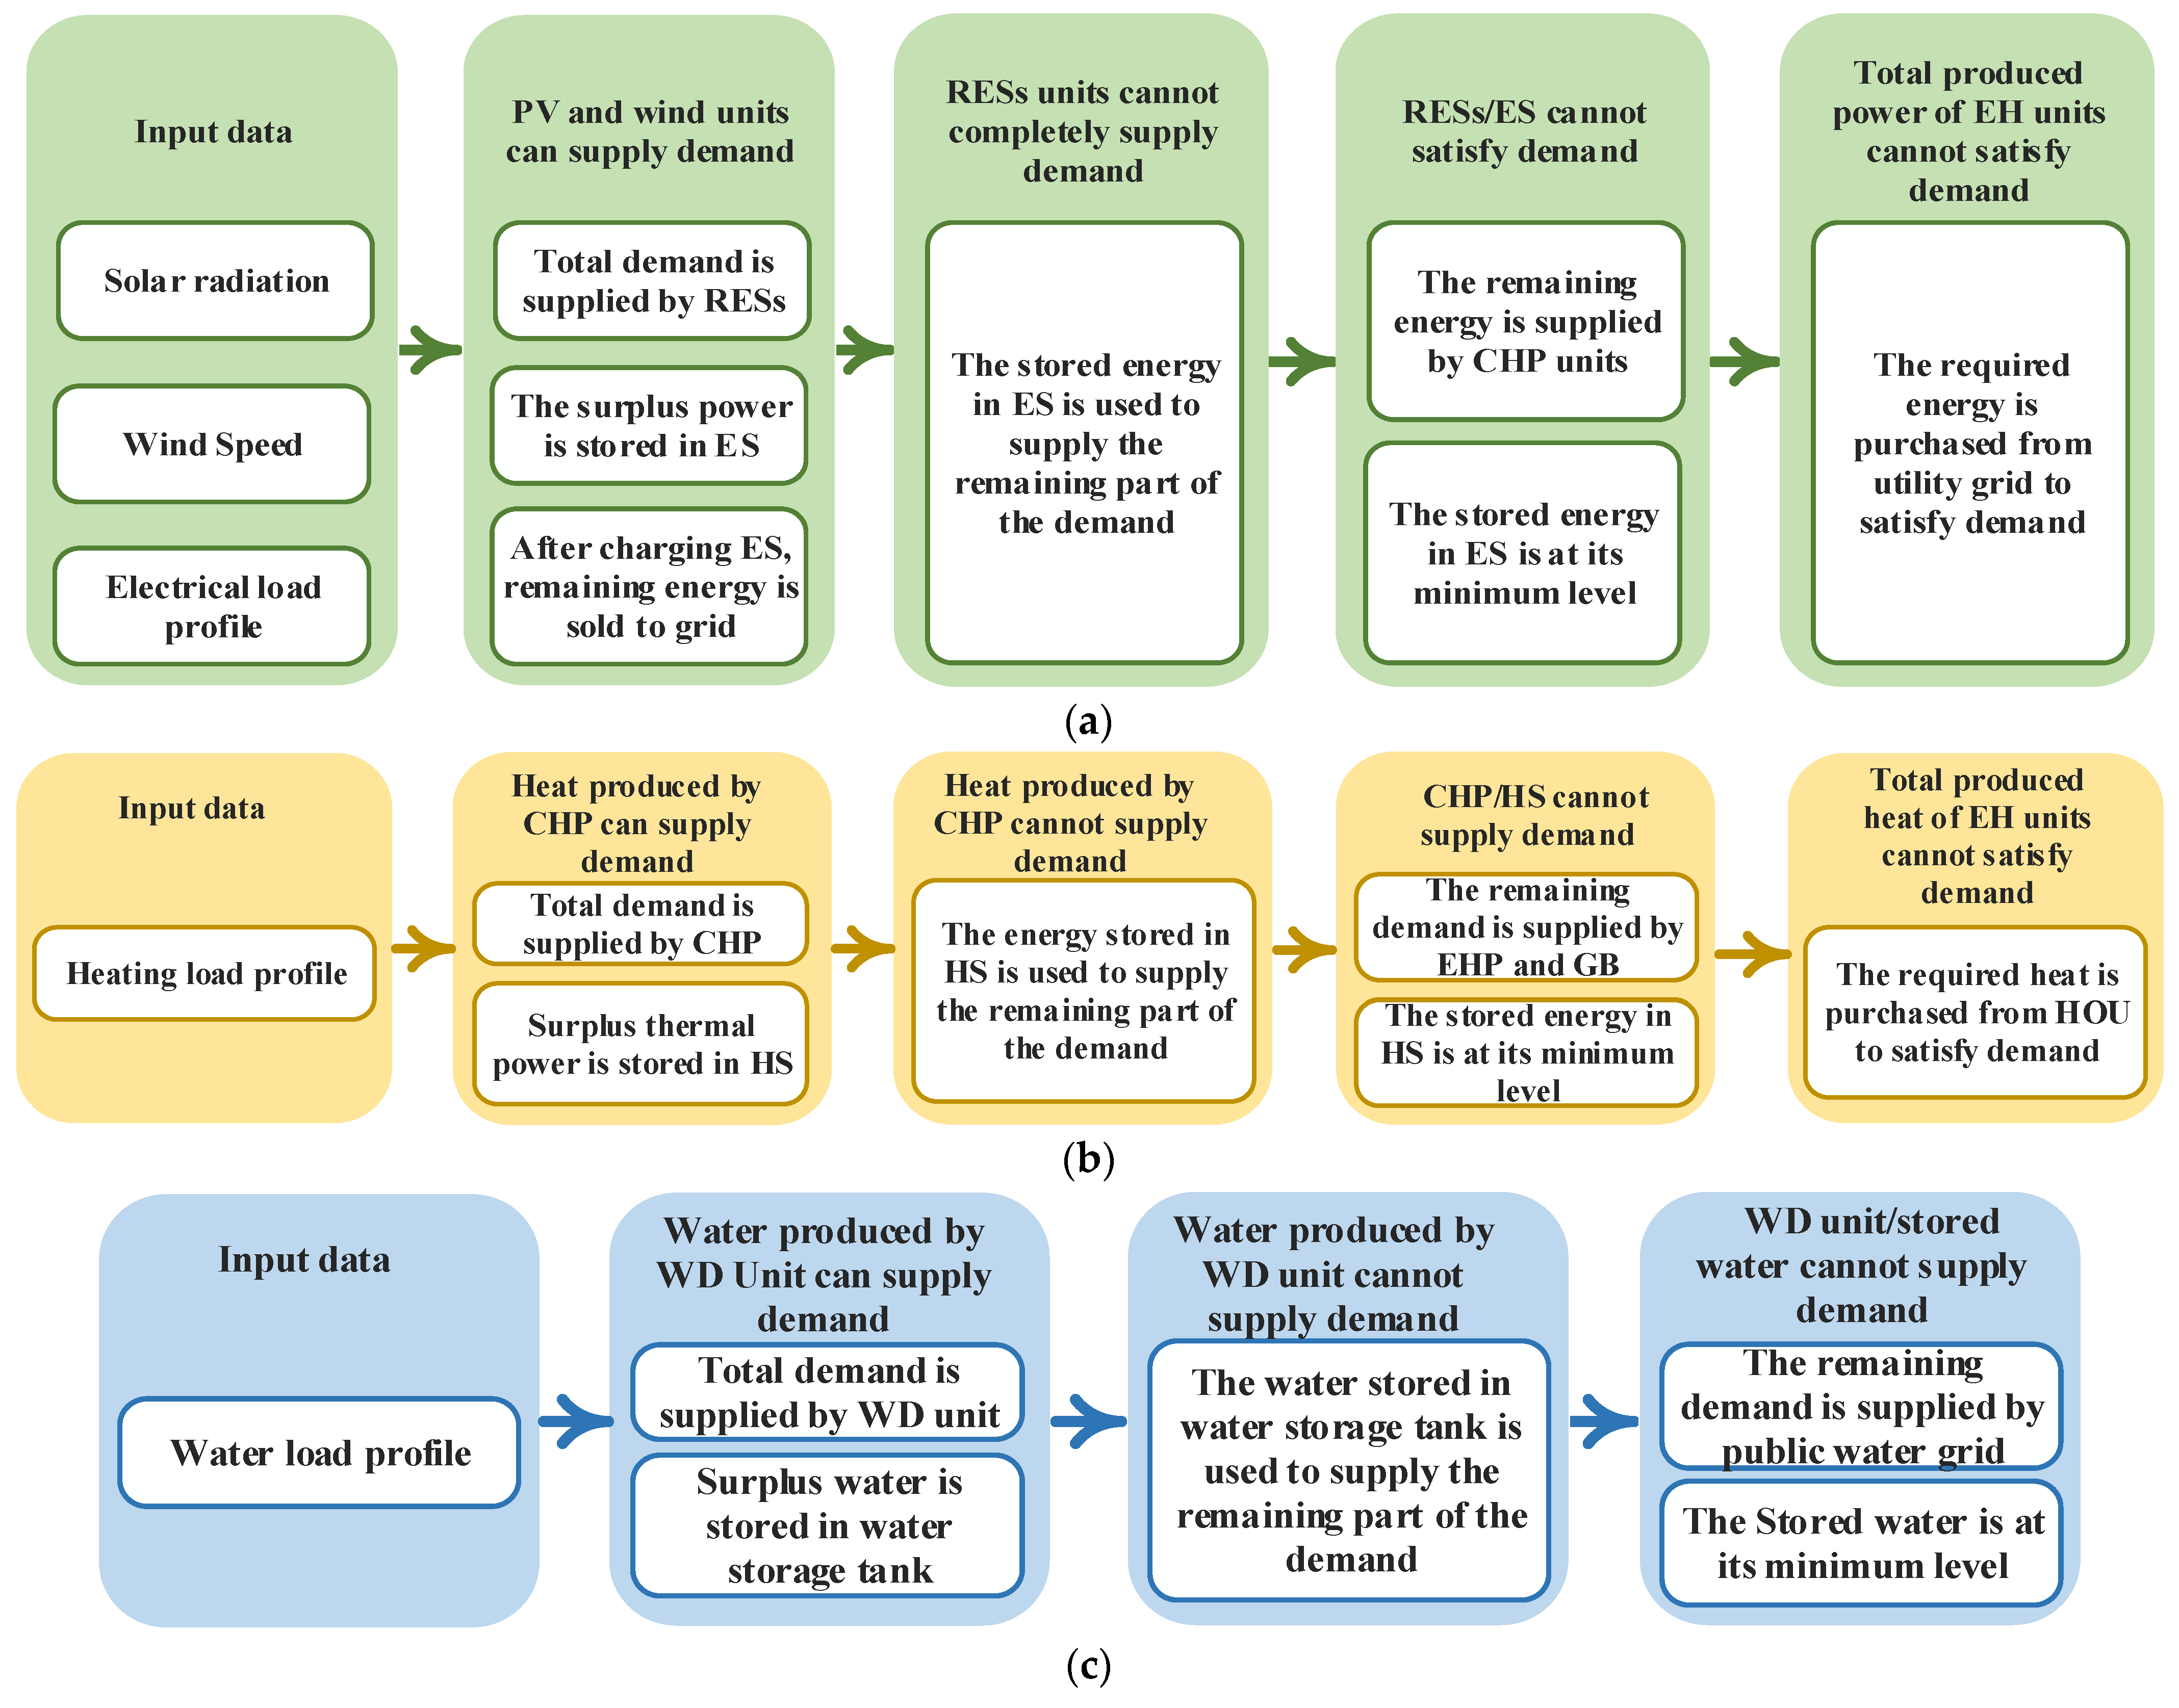
In the proposed EH, electrical loads are supplied by PV modules and WT. If the energy generated by RESs is more than the electrical demand, the surplus generated energy will be stored in the ES. Otherwise, if the energy produced by RESs is not sufficient to meet all the electrical loads, then the energy stored in the ES supplies the remaining part of the electrical loads. In all cases, if the energy produced from the RESs, and ES is not enough to supply demand requirements, the deficit energy is taken from CHP. If the energy produced from all EH units is not enough for demand, the required energy will be purchased from the electrical grid. On the other hand, whenever ES is fully charged and the energy produced from RESs and CHP is more than the electrical loads, the excess energy is sold to the electricity grid. Figure 6a illustrates the proposed methodology.
Figure 6.
Proposed methodologies to satisfy load requirements (a) electrical (b) heat (c) water.
5.4.2. A Proposed Methodology to Satisfy Thermal Requirements
The GB, CHP, and EHP are considered heat generators in the proposed EH configuration. If the thermal energy generated by the CHP is greater than the heating requirements, the additional thermal energy is stored in HS. Otherwise, when the energy produced from CHP is not sufficient to supply the heating demand, the energy stored in the HS is used to feed the remainder of the load. In all cases, if the energy produced from the CHP, and HS, is not enough to supply demand requirements, the deficit energy is taken from EHP, GB, and HOU, respectively. Figure 6b shows the proposed heating demand-saving strategy.
5.4.3. A Proposed Methodology to Satisfy Water Requirements
In the proposed EH system, the WD unit is considered the main water source. If the water generated by the WD unit is greater than the water demand for the loads, the additional water is stored in WS. In cases where the energy produced from the WD unit and WS is not enough to supply demand requirements, the deficit water is taken from the public WG. On the other hand, when WS is charged and the water produced from the WD unit is more than the water demand, the excess water is sold to the WG. Figure 6c shows the proposed water demand-saving strategy.
6. Simulation Results and Discussion
6.1. Simulation Setup
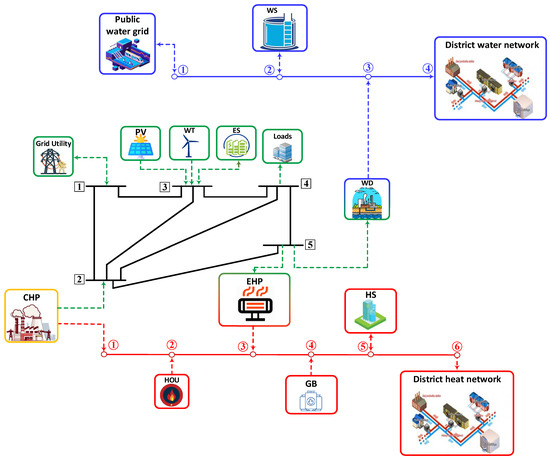
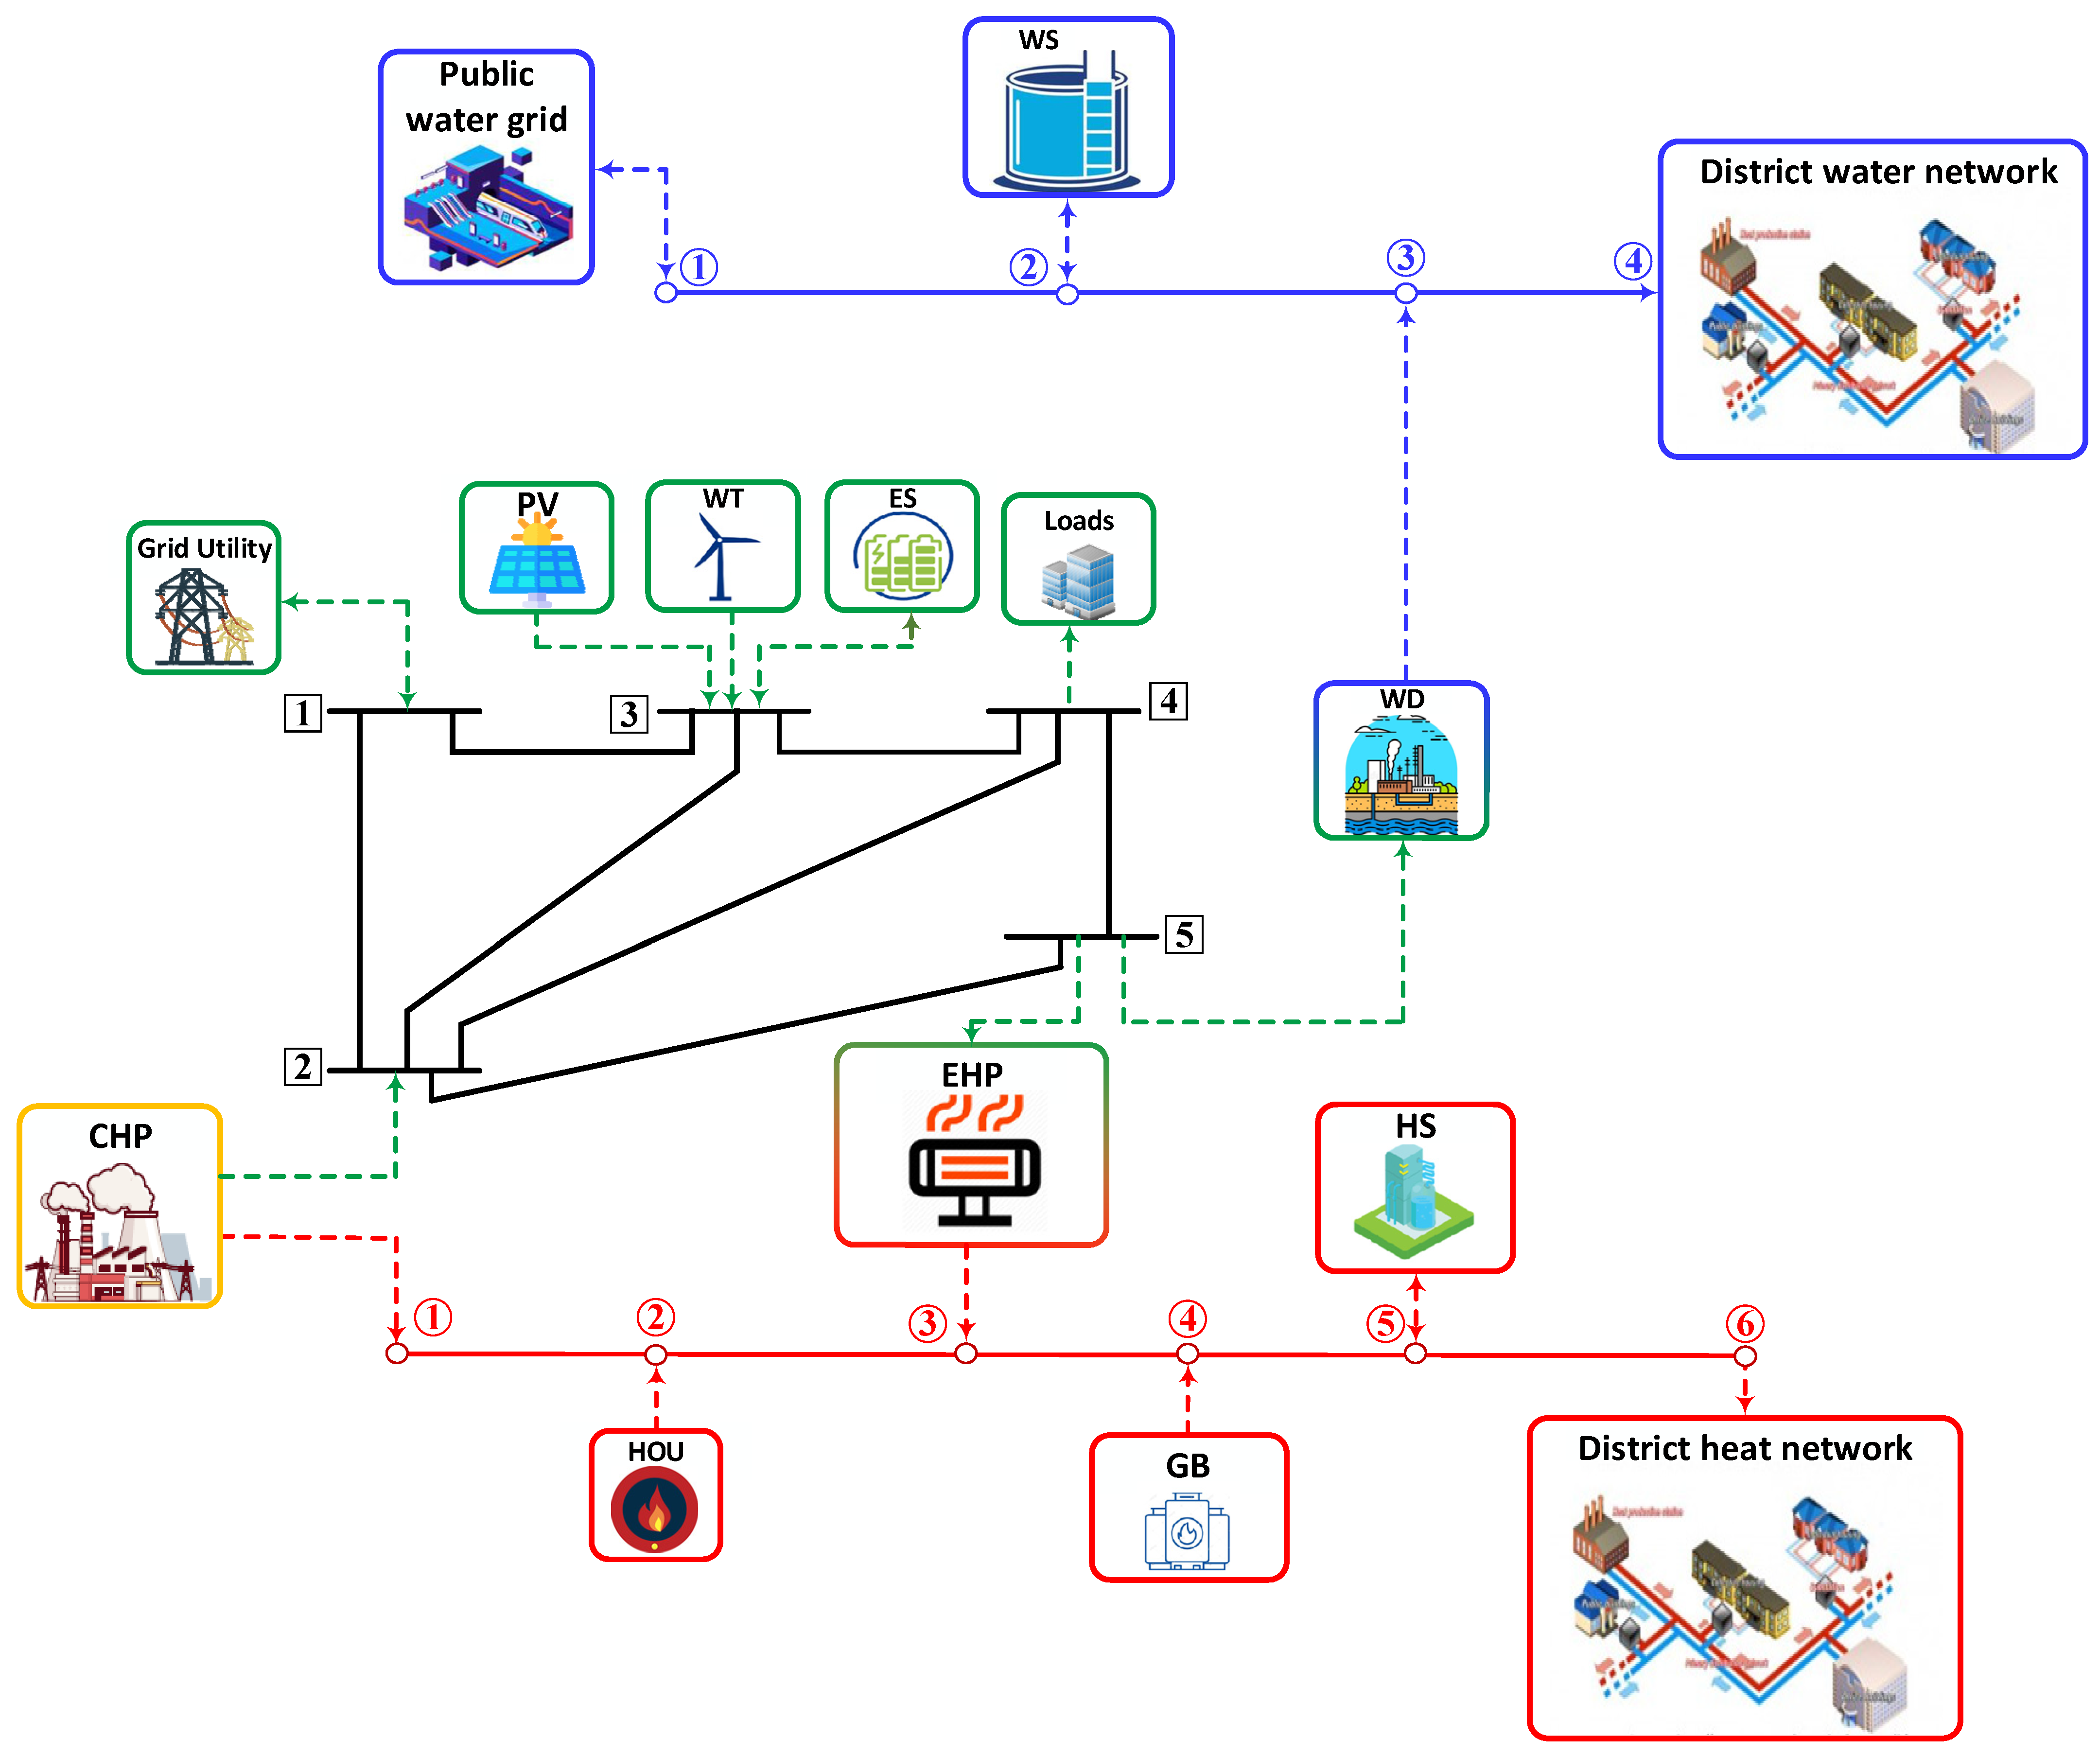
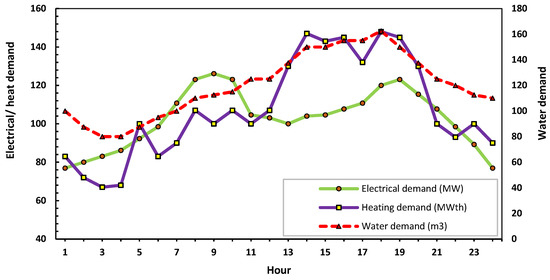
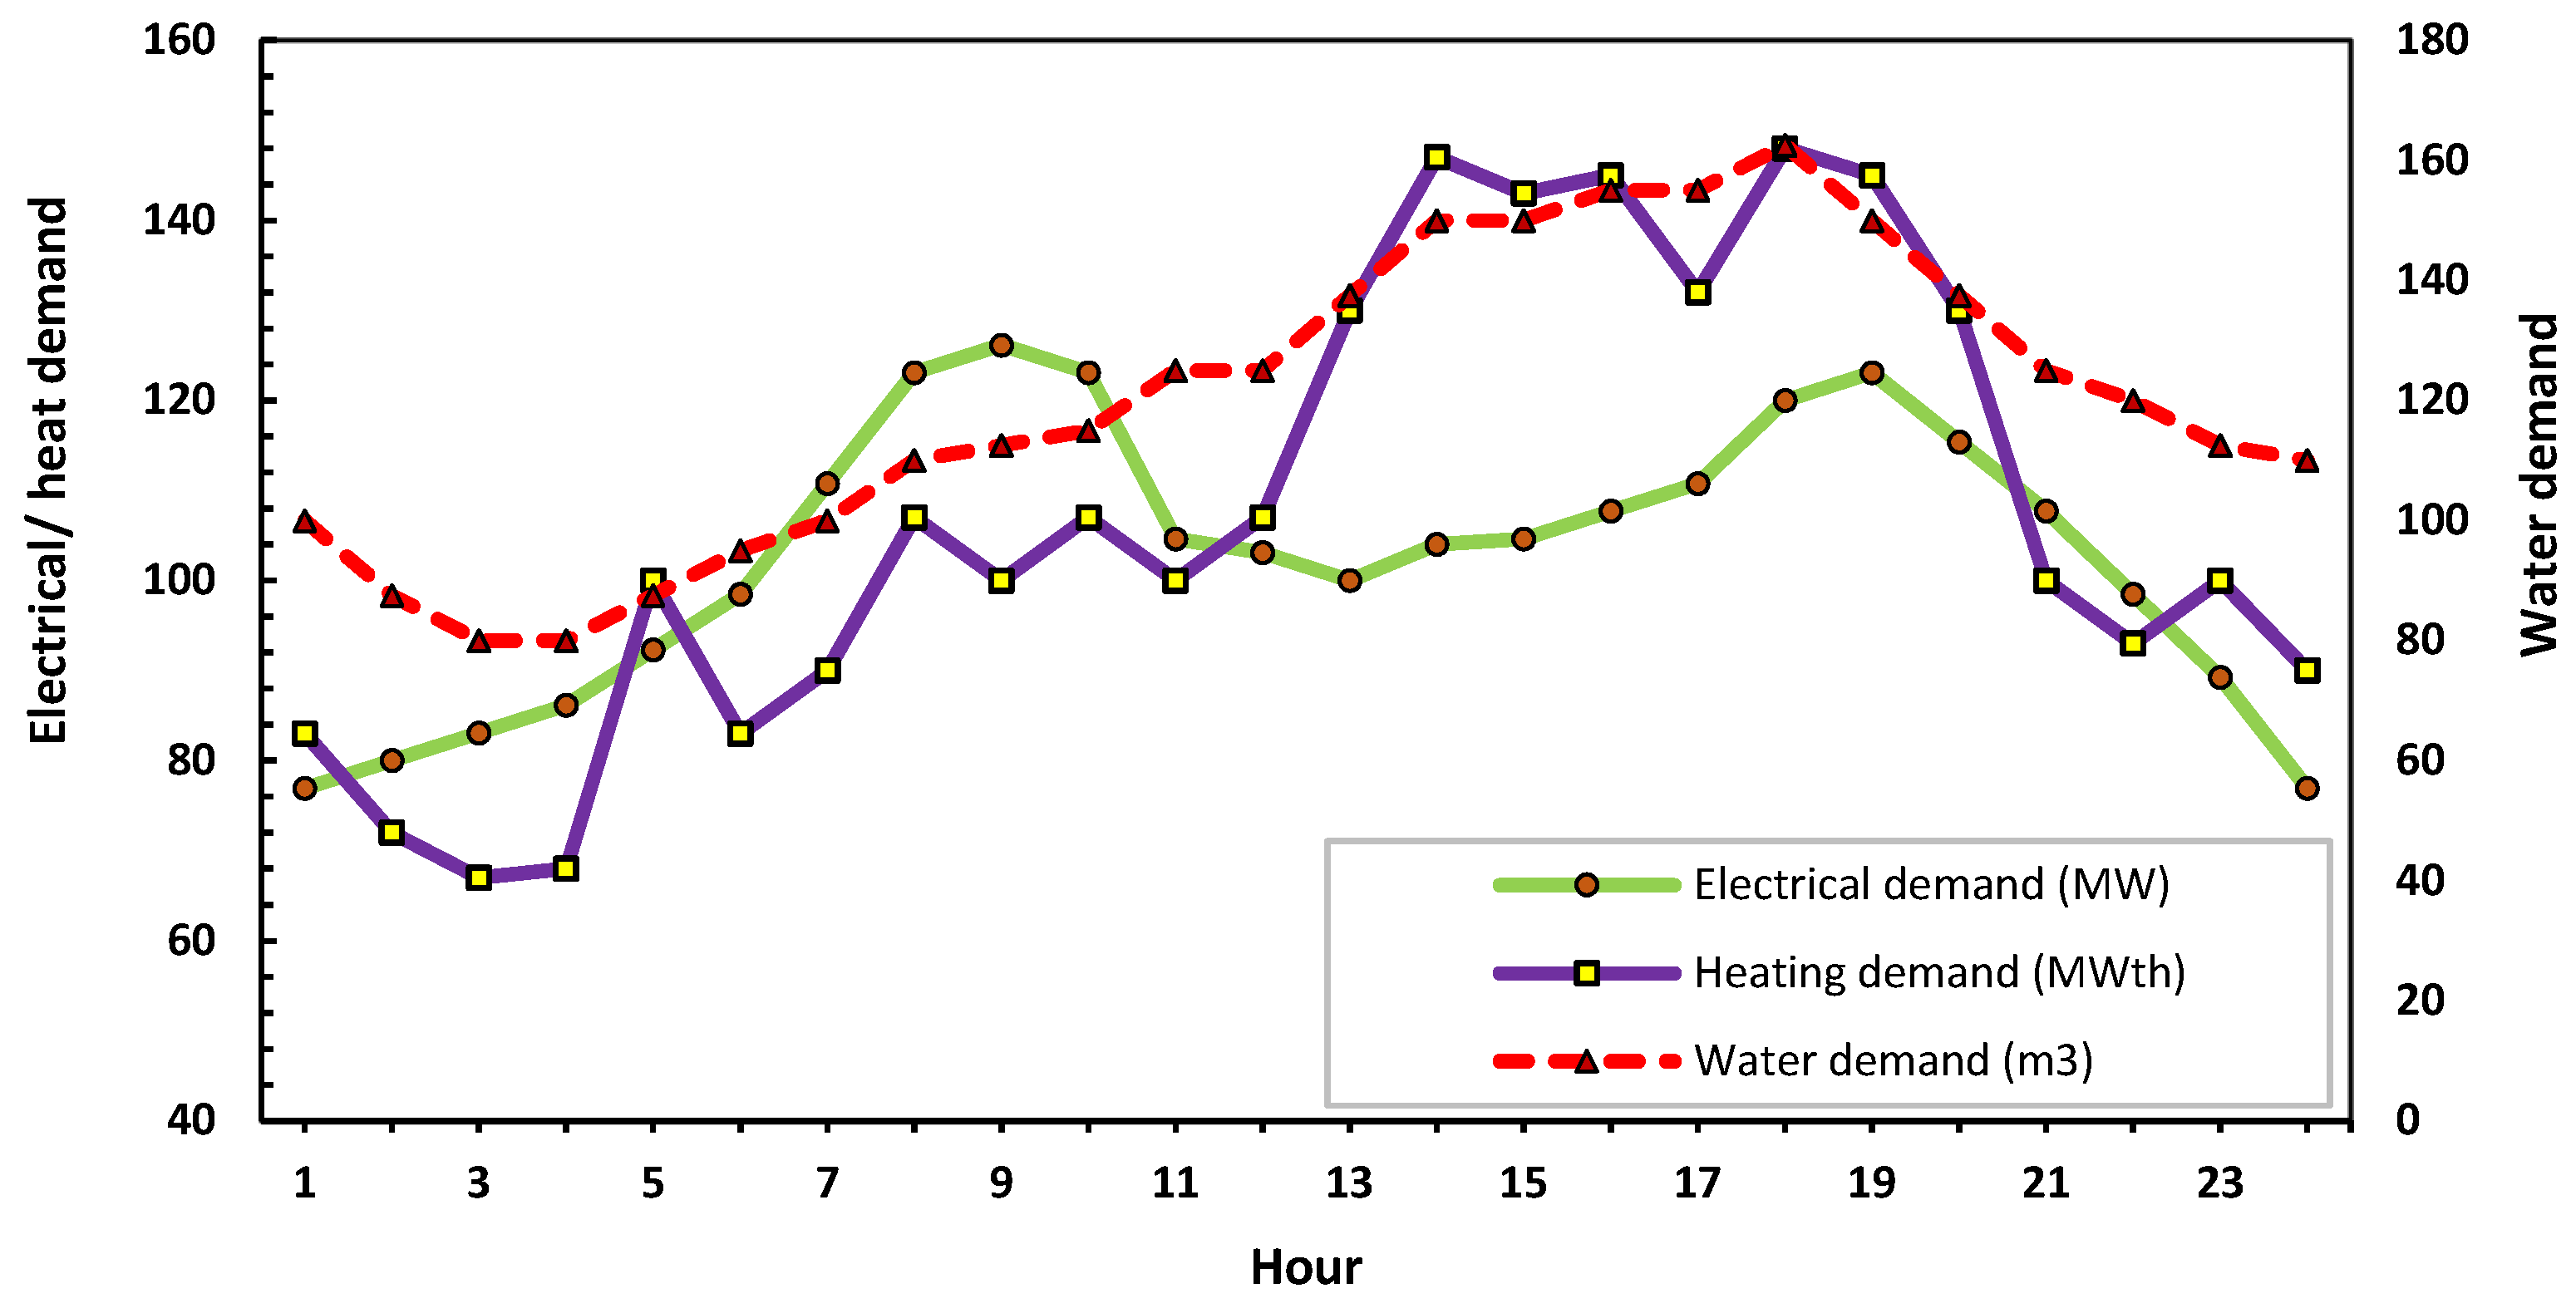
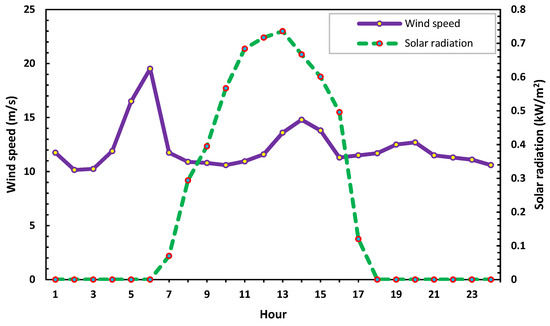
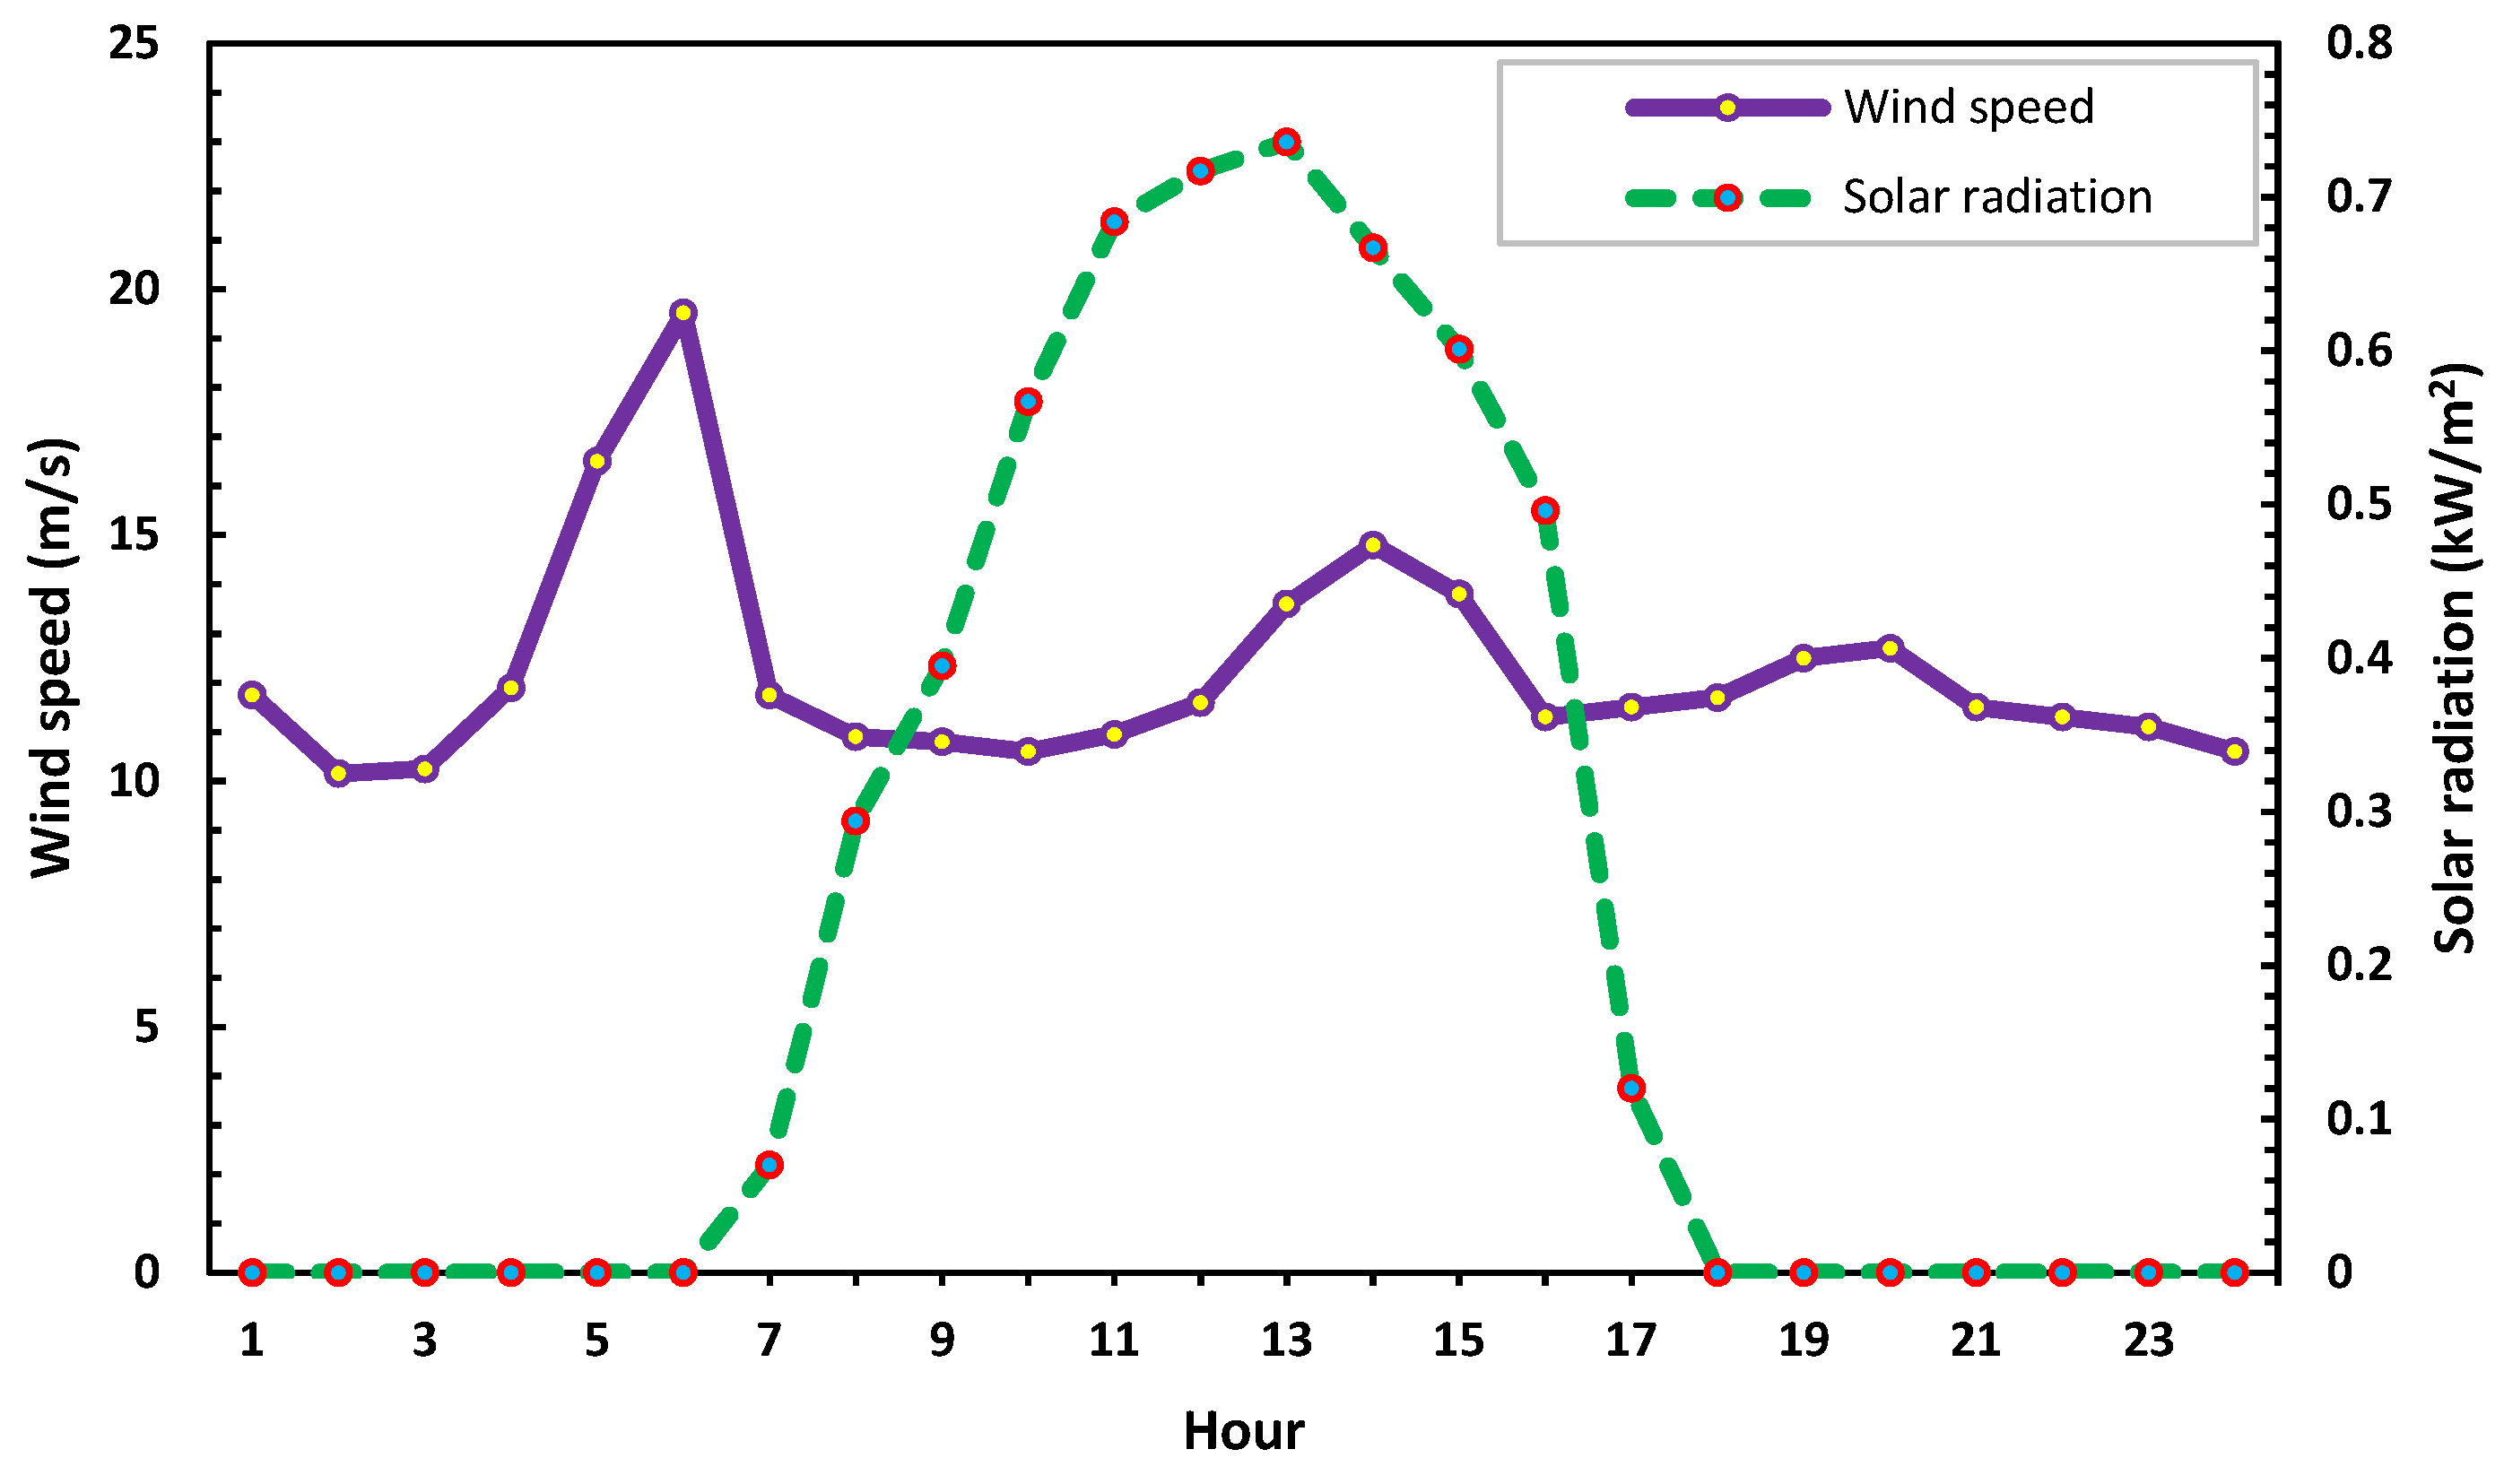
The methodology proposed is applied to an EH represented by a modified IEEE 5-bus electrical network over one day during a one-hour time interval. The modified IEEE 5-bus network, heat system, and water system are shown in Figure 7. Thermal, electrical, and water demands are assumed in the proposed EH as the curves shown in Figure 8 [19]. The electrical demand is divided into two parts, a fixed part (base load) and an elastic part (20% of the base demand). A percentage of the elastic part is fed only when the EH has a surplus of electrical power generation depending on the electricity price and amount of surplus power. Daily wind speed and solar radiation are shown in Figure 9 [32]. The data on the EH technologies are given in Appendix A. The optimization problem was solved for many case studies with various operating conditions and the results were analyzed. These simulations were carried out using MATLAB 2017a 64-bit version on a PC with an Intel (R) Core (TM) i5-8250U CPU 1.60 GHz, RAM 12 GB system, and 1 TB of storage.
Figure 7.
The layout of the proposed EH system.
Figure 8.
Energy carriers’ demand for the day under study.
Figure 9.
Wind speed and solar radiation.
6.2. Case Studies
Four cases are studied to explain the performance of CHP, WD, GB, and EHP, as shown in Table 2. In each case, many indicators are calculated, such as total SW, emissions, losses, and sold power/water to the electrical/water network are calculated (see Table 3).
Table 2.
Case studies in this work.
Table 3.
Different EH configurations’ daily operation results.
By analyzing the data in the previous table, it can be observed that:
- ▪
- In case 1 (base case), there is no EH and the loads are fed directly from electricity, HOU, and WG, respectively. This case was studied to explore the impact of EH on total SW, emissions, and losses. As reported in Table 3, total SW, emissions, and electrical and heat losses are 275,467.99 USD, 5638.27 kg, 3.05 MWh, and 108.27 MWhth, respectively. Additionally, there is no electrical power or water sold to the electricity grid and water network, respectively. The total electrical demand, in this case, is 2466.4 MWh (the base load curve).
- ▪
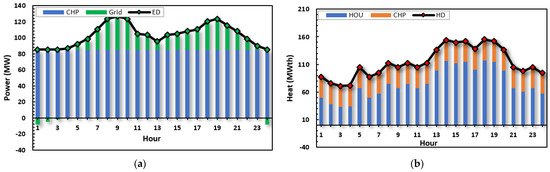
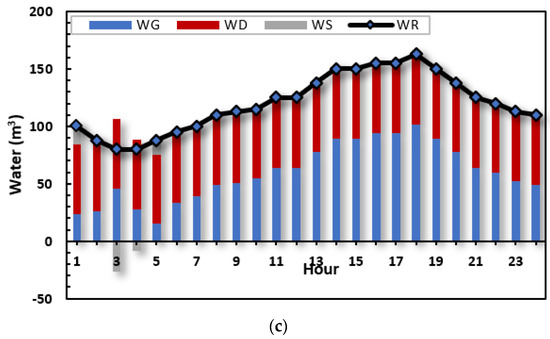
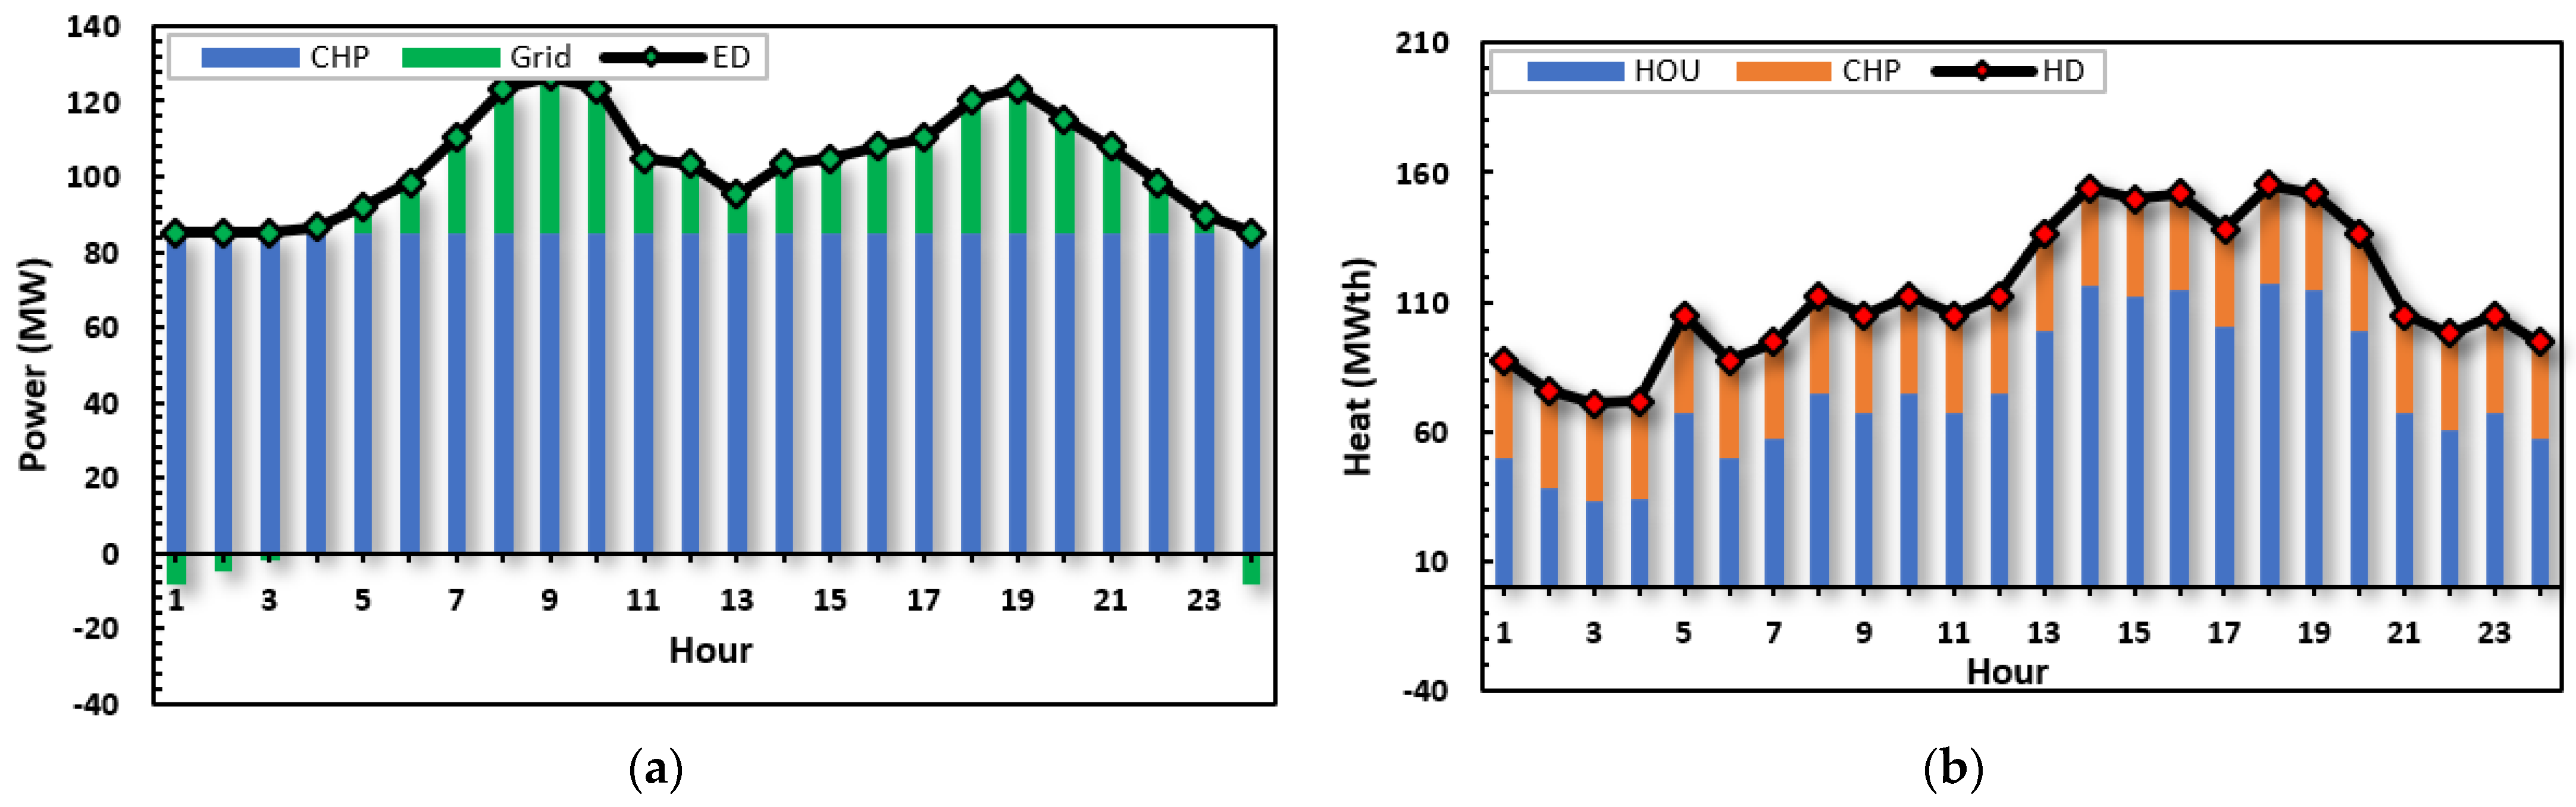
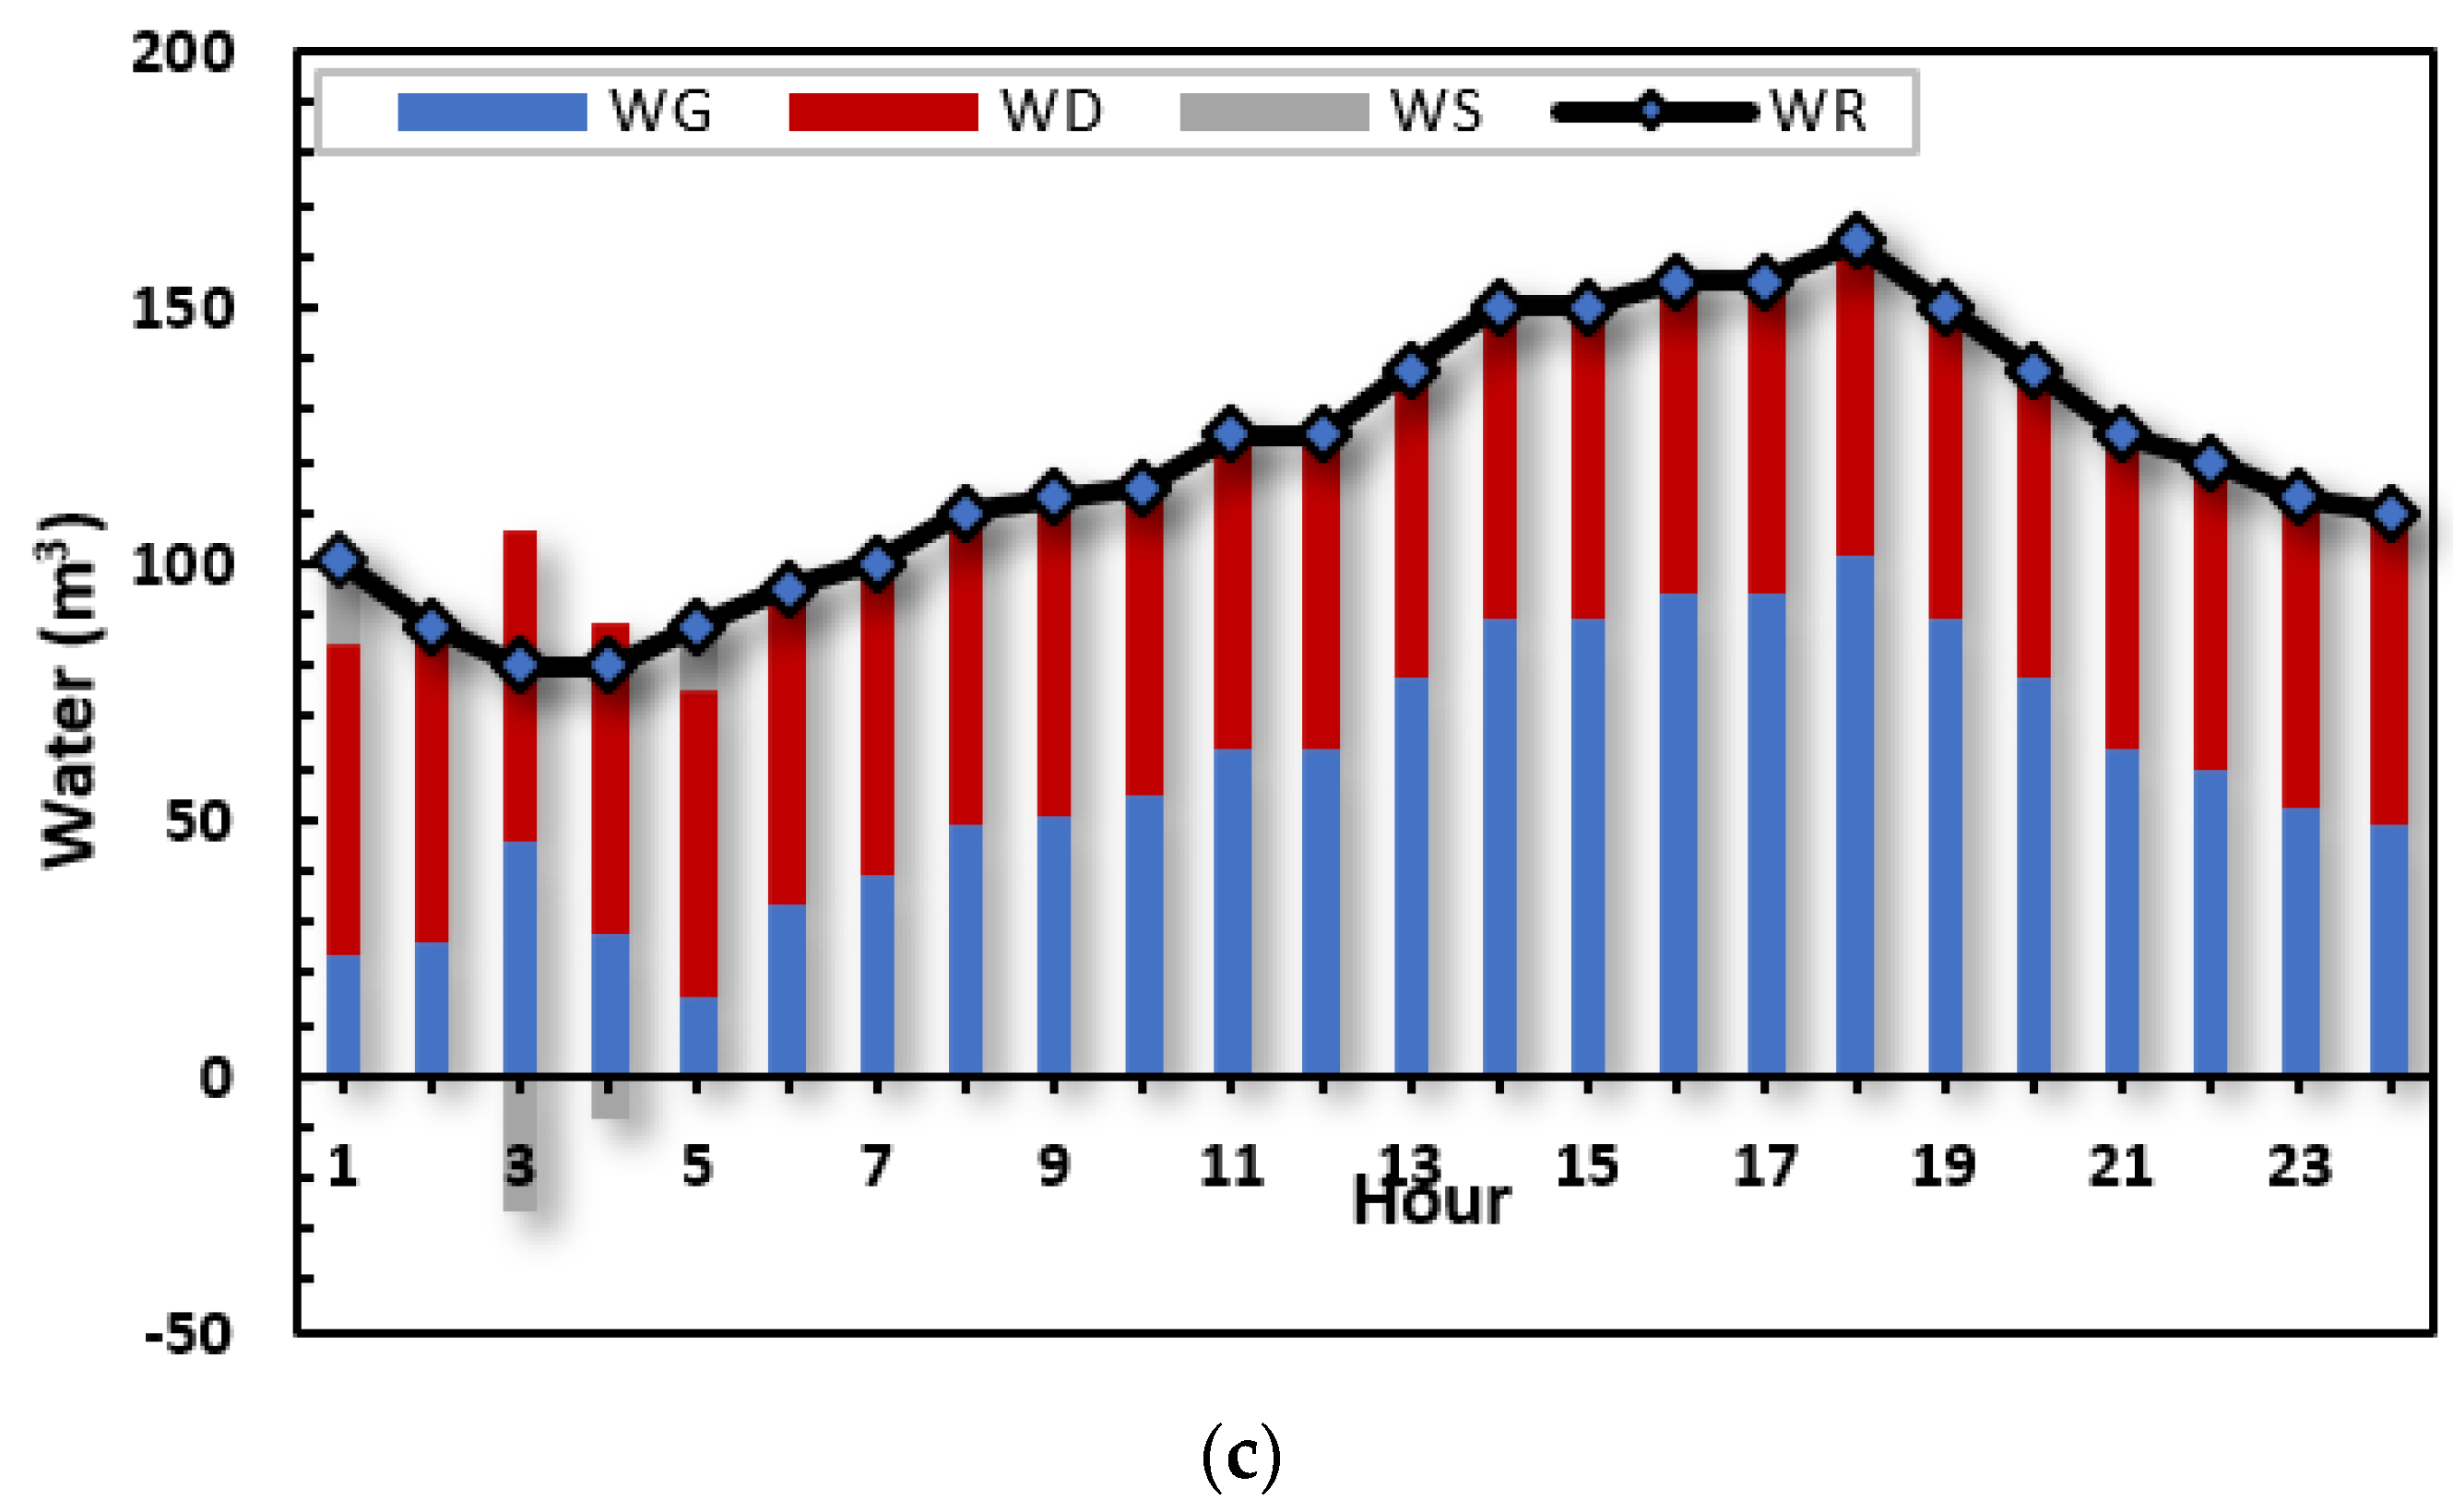
- In case 2, CHP was integrated with the EH to show the effect of this unit on the performance parameters. The main source to supply heating demand requirements is the CHP unit during the day because of the low price of natural gas as shown in Figure 10a,b. With the integration of the CHP unit, SW increased by 5.71% and emissions decrease by 9.97%, respectively, compared with the base case. Additionally, the elastic part of the electrical demand supplied by the hub increased by 0.7% and the hub sold 23.2 MWh to the electricity grid.Figure 10. Generation outputs for case 2 (a) electricity (b) heat (c) water.
- ▪
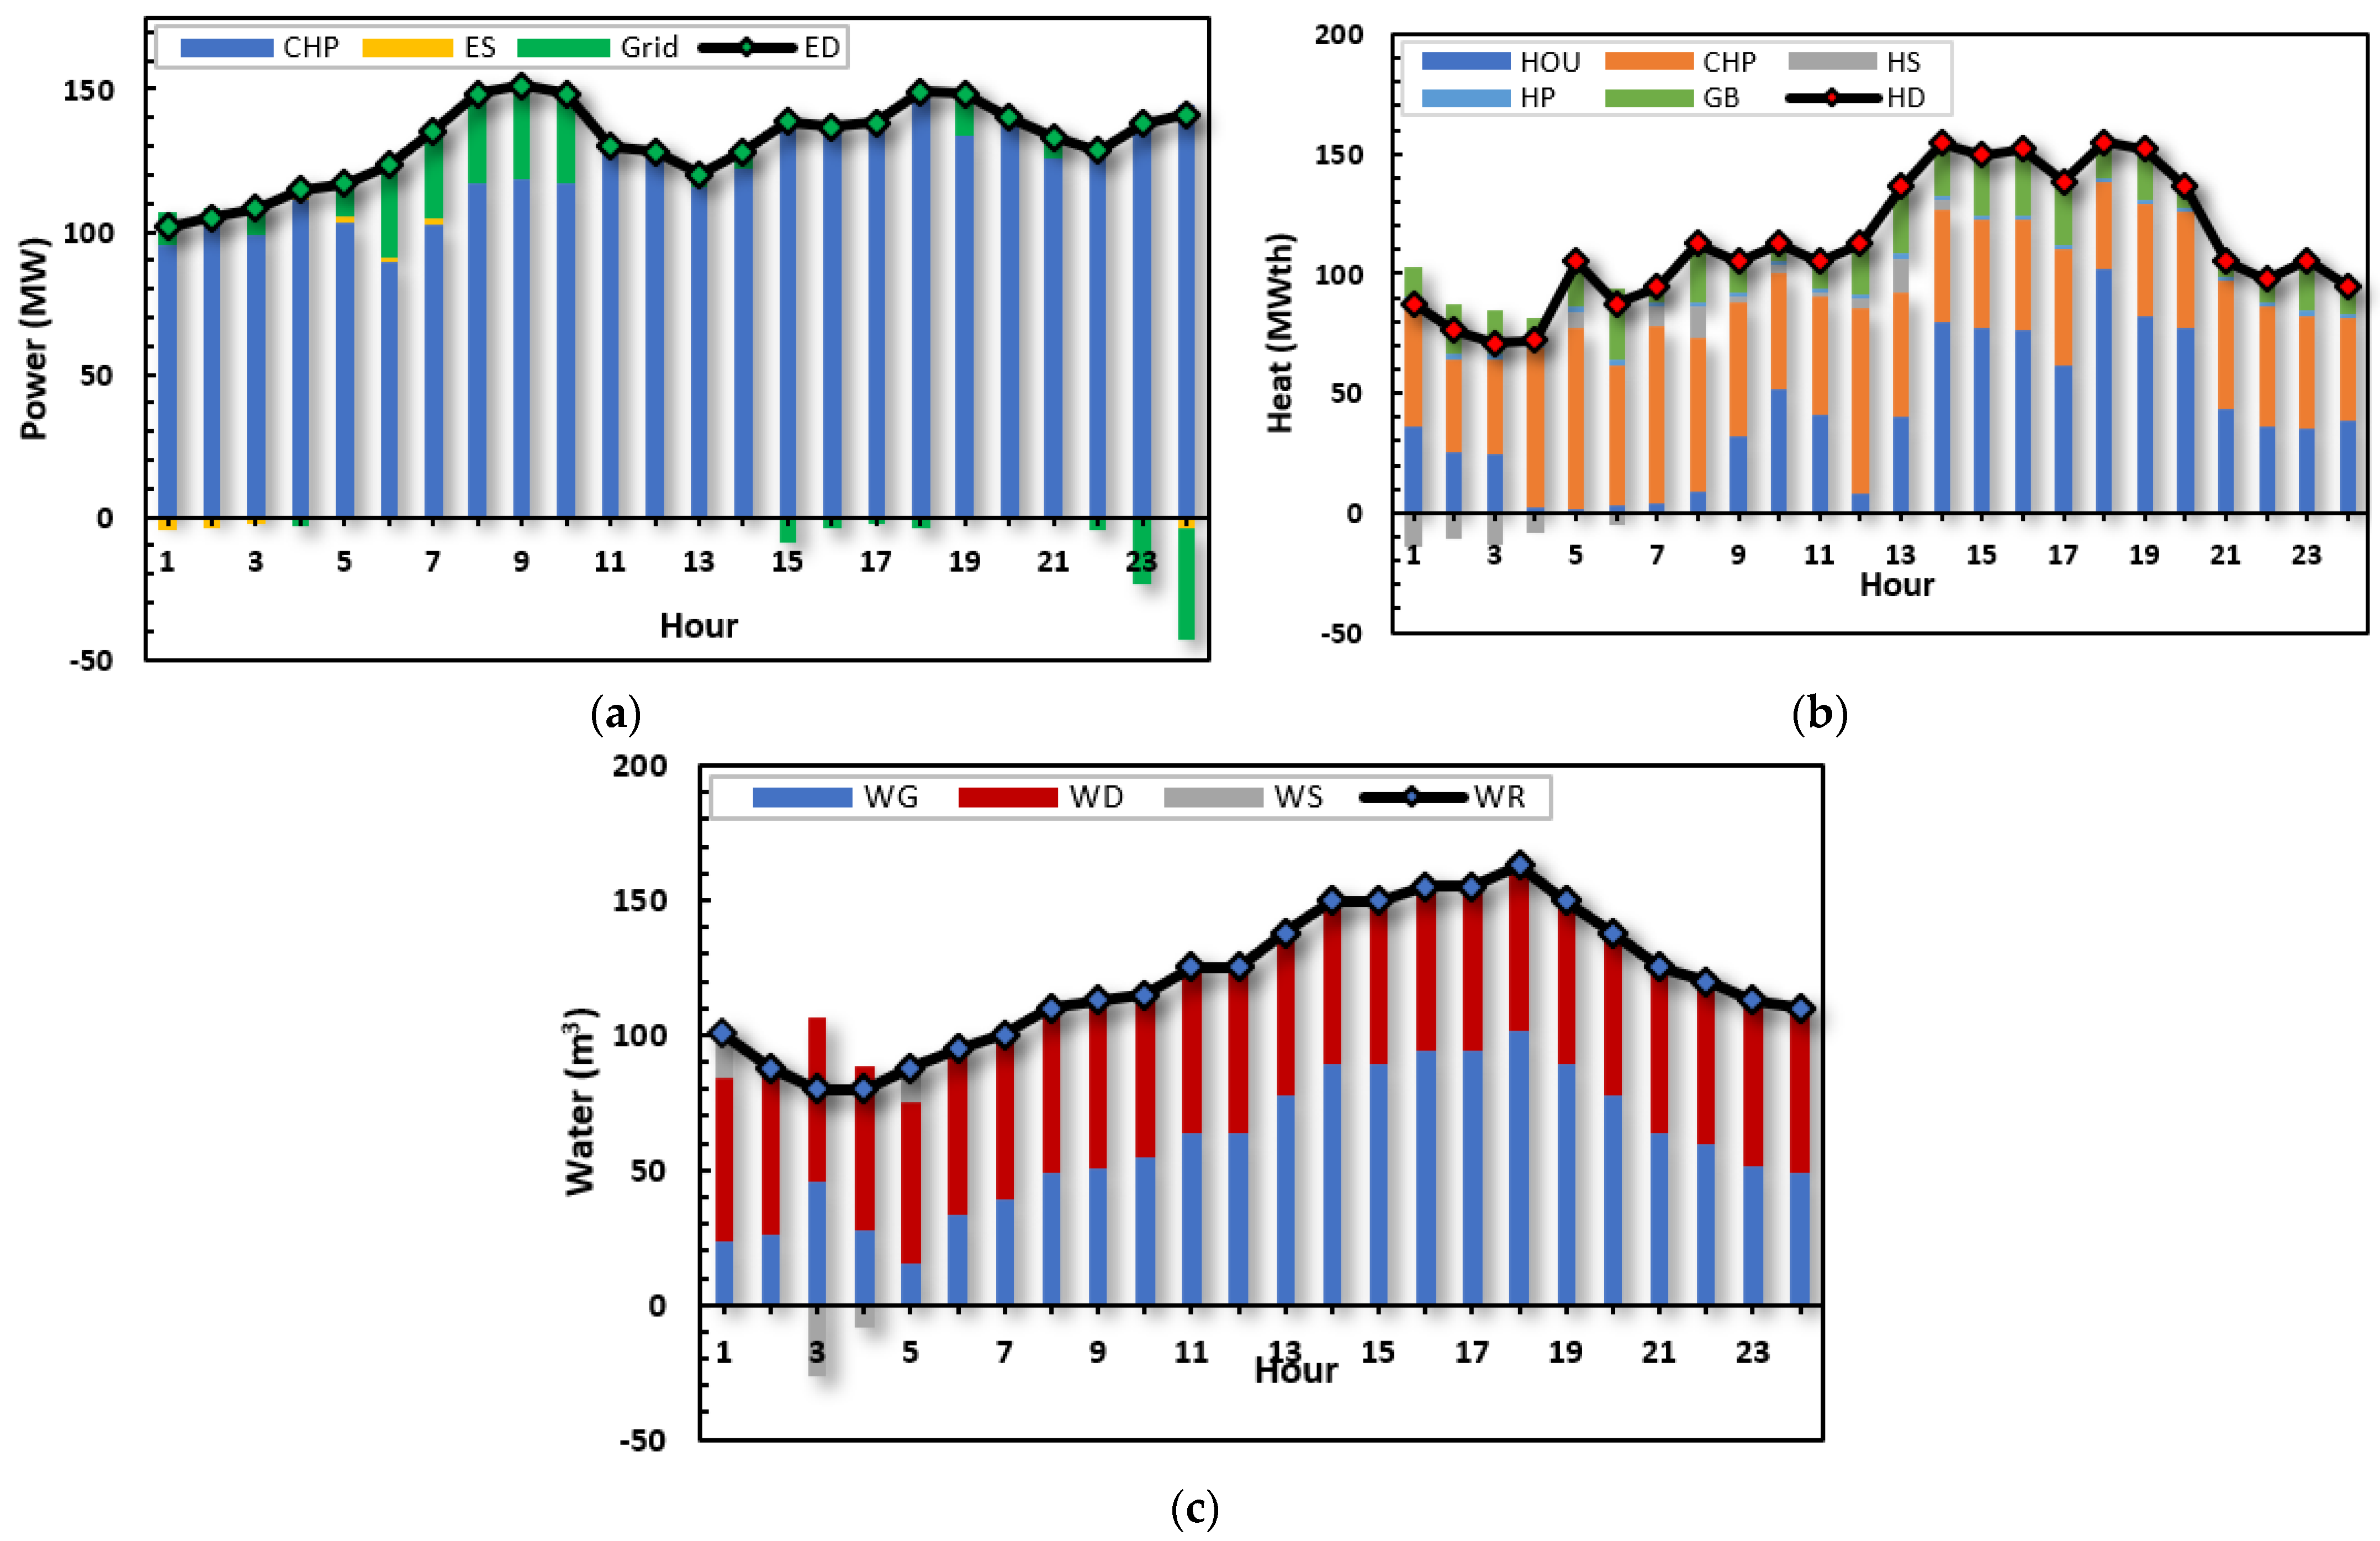
- In case 3, EHP, GB, WD units, and ESSs are added to the CHP in the previous case. This case results in an increase of 3151.24 MWh in the electrical demand because of adding the EHP and WD units. So, the total SW increased to 336,786.09 USD. On the other hand, total emissions increased a little compared to the base case. Figure 11 presents the results for this case.Figure 11. Generation outputs for case 3 (a) electricity (b) heat (c) water.
- ▪
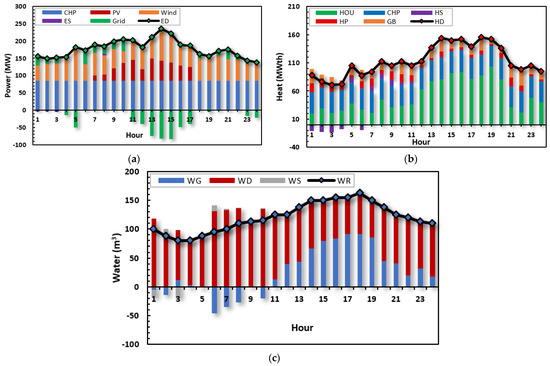
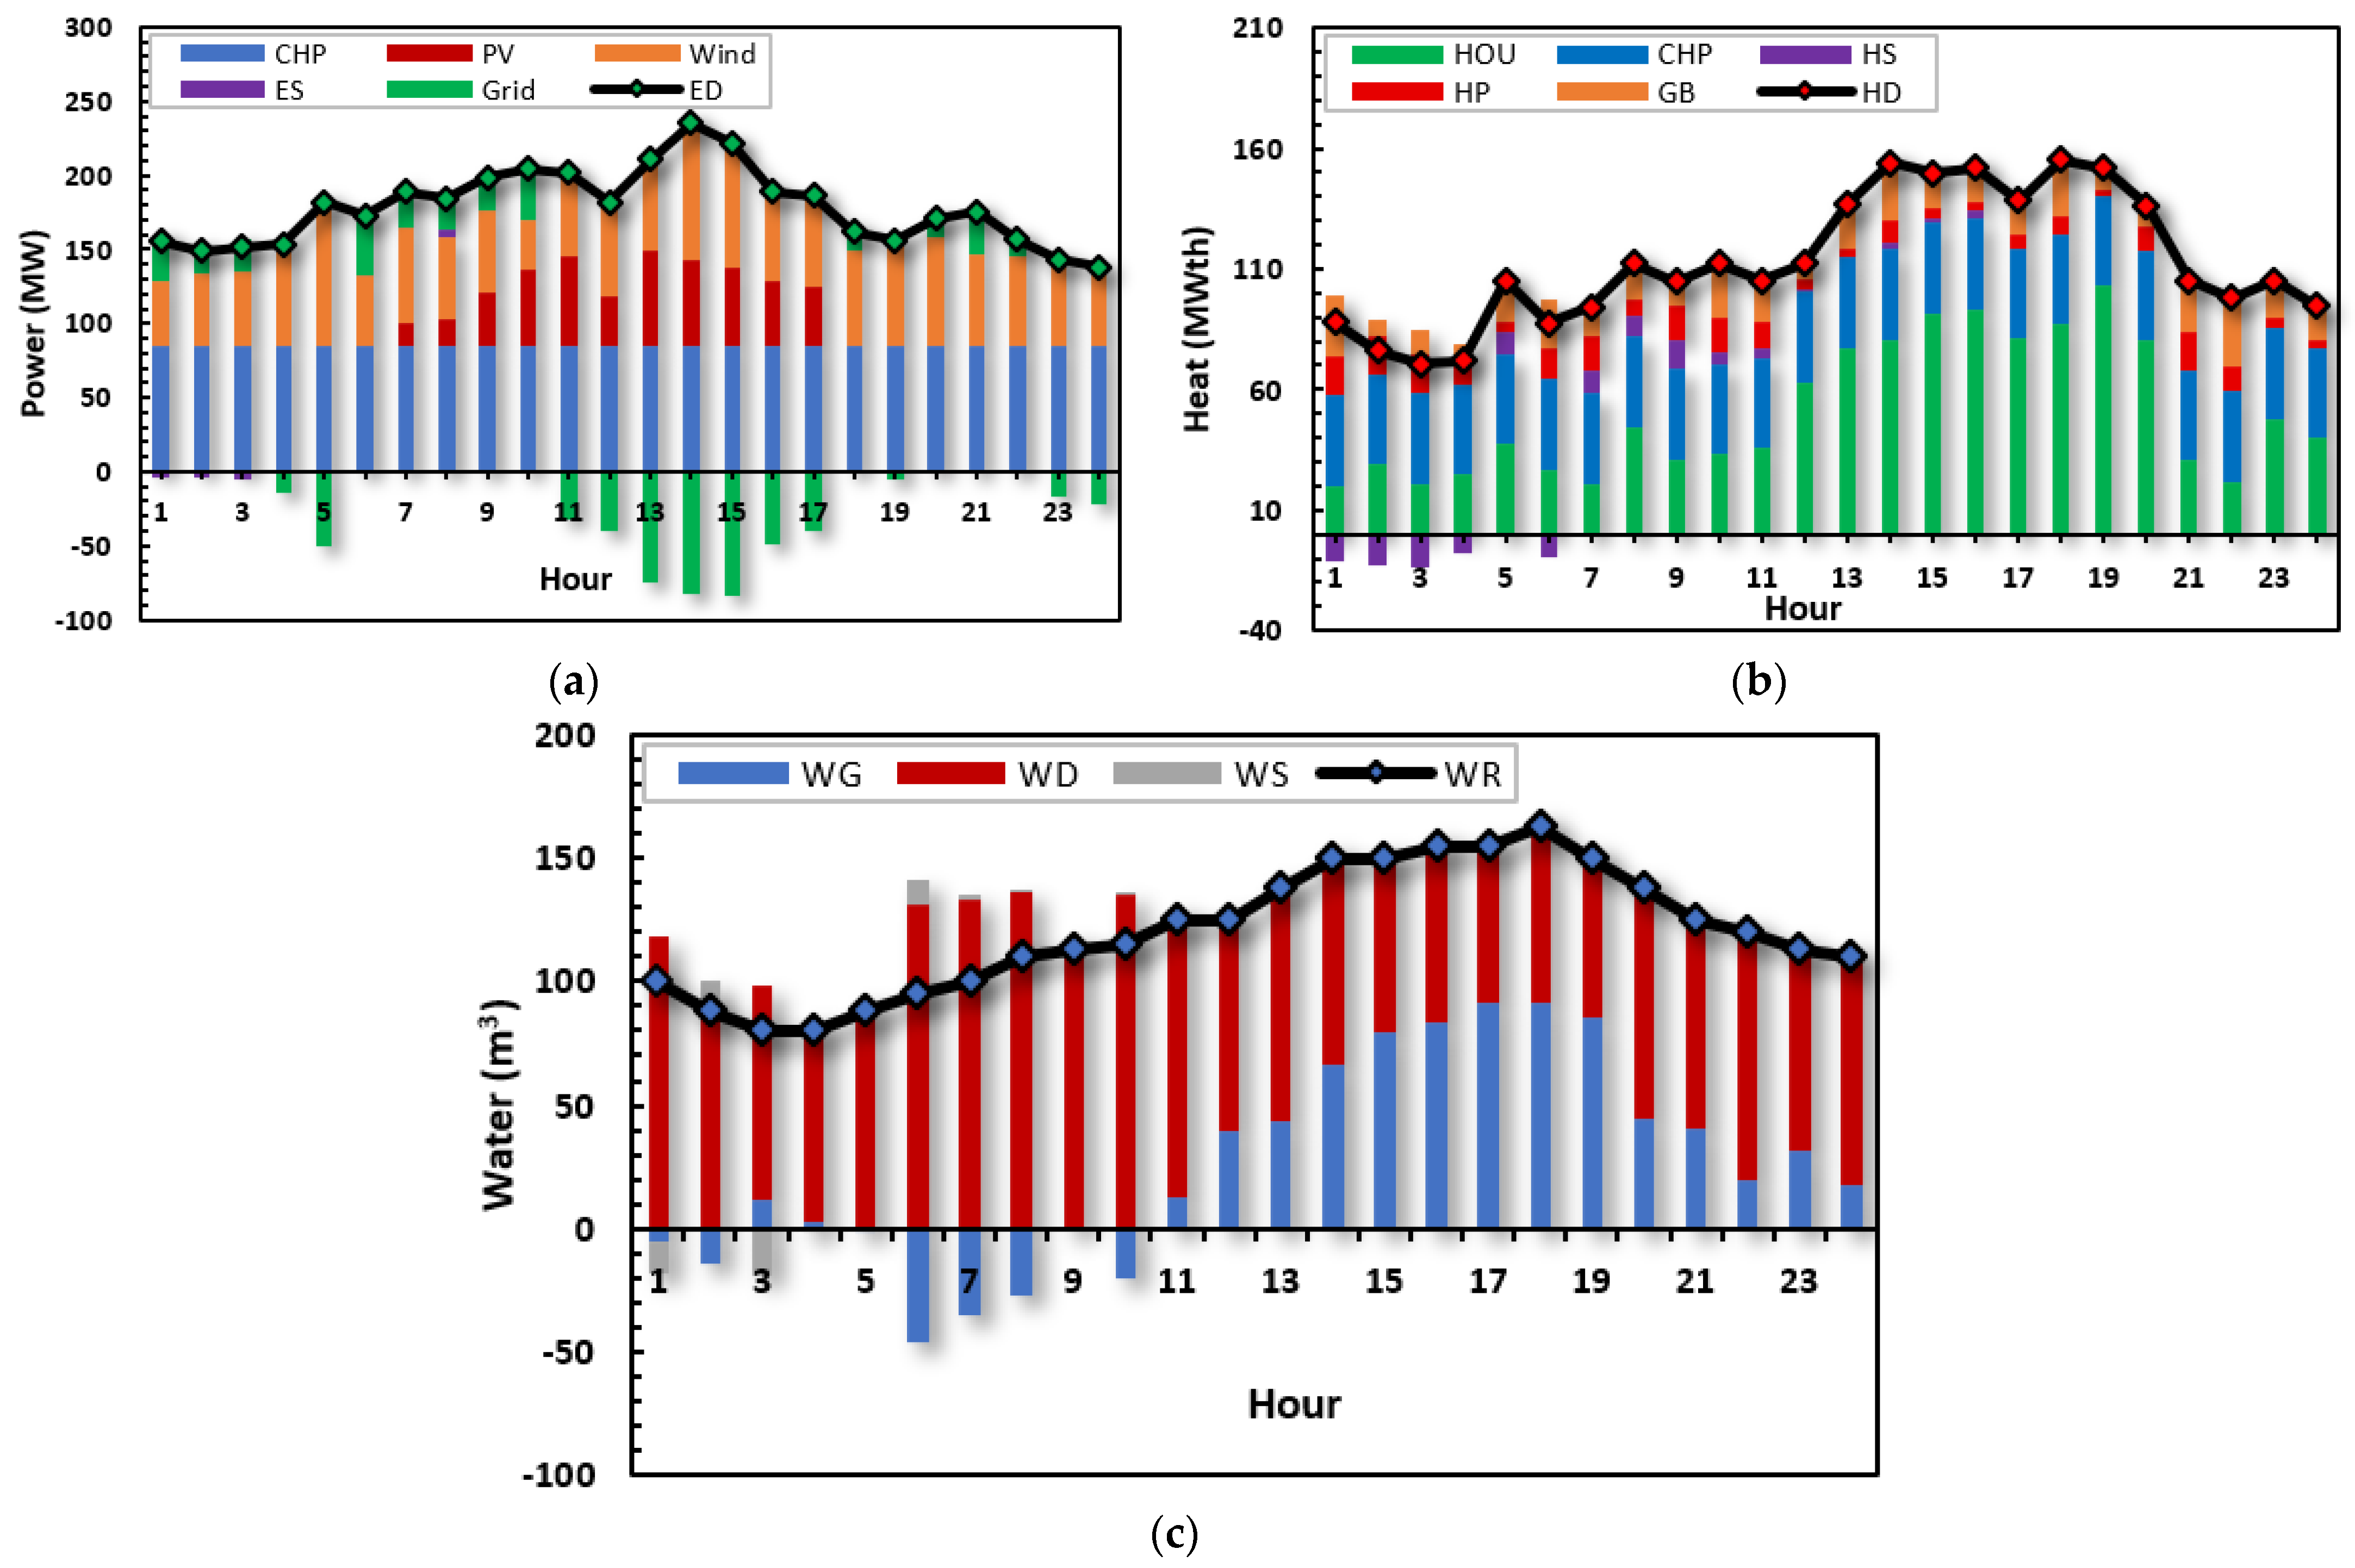
- In the last case (case 4), CHP, RESs, ESSs, EHP, WD, and GB are operating at the same time. This configuration enables the EH not only to meet demand requirements but also to sell electricity and water to the electrical and water networks during light load (11 AM to 5 PM in the electrical system and 1 AM to 10 AM in the water network) as shown in Figure 12a–c. So, compared with the base case, all performance parameters are improved, and total SW and emissions are 379,648 USD and 4603 kg. In addition, the total electrical demand supplied by the hub increased to 4269.82 and the hub sold 512.26 MWh to the electricity grid and 149.4 m3 to the water network.Figure 12. Generation outputs for case 4 (a) electricity (b) heat (c) water.
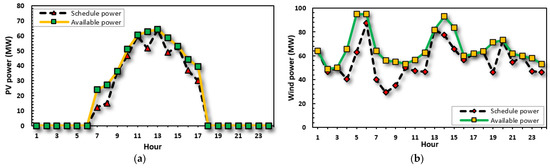
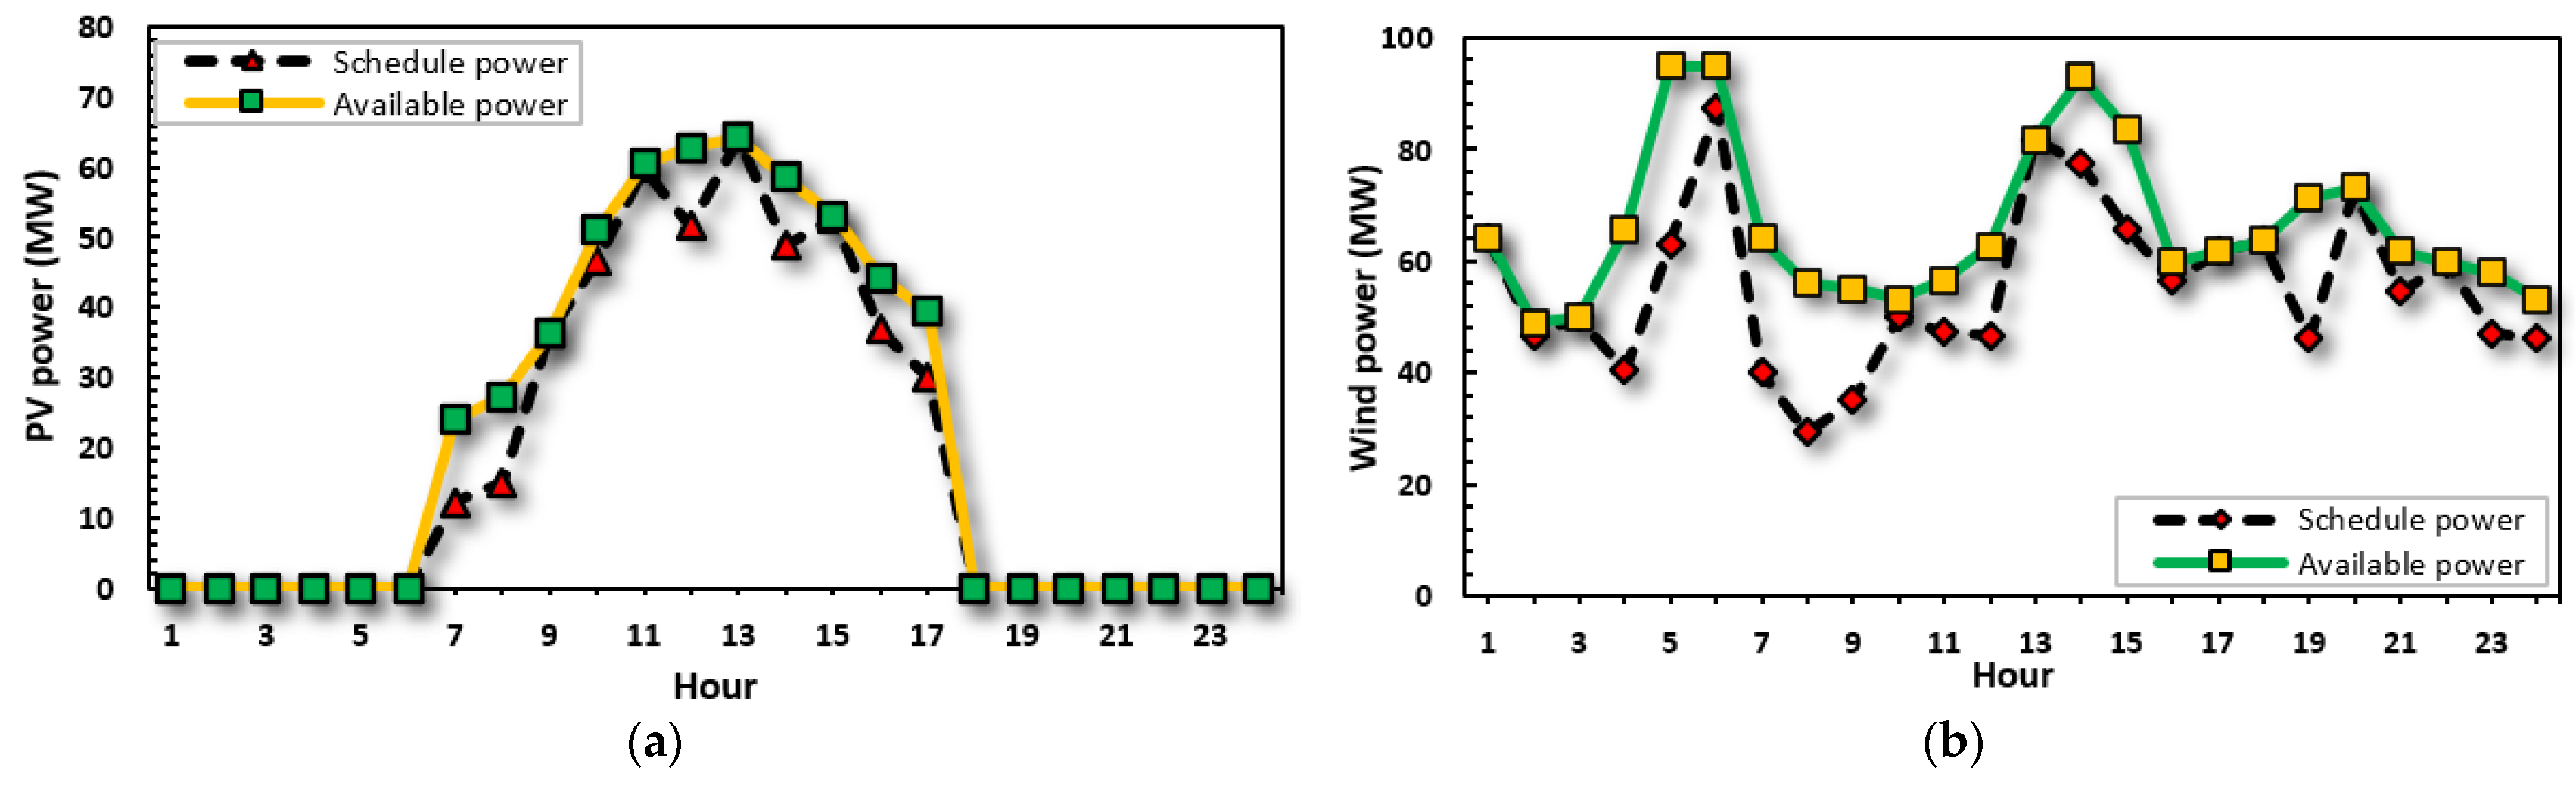
Figure 13 shows the available power for both wind turbines and PV panels compared to the scheduled values. It has been found that this power changes throughout the day depending on the availability of wind and PV production for the plants and the electricity prices. With the increase in demand for electricity, electricity prices are relatively high. Thus, wind turbines and PV panels are at high risk when delivering a large amount of power generation at that time because they may contain high imbalanced charges in event of non-fulfillment of the scheduled power. Meanwhile, they can also provide high power generation when demand is low, hence the electricity prices are becoming lower.
Figure 13.
Comparison of available and scheduled power for: (a) PV power plant. (b) wind farm.
6.3. Proposed Algorithm Validation
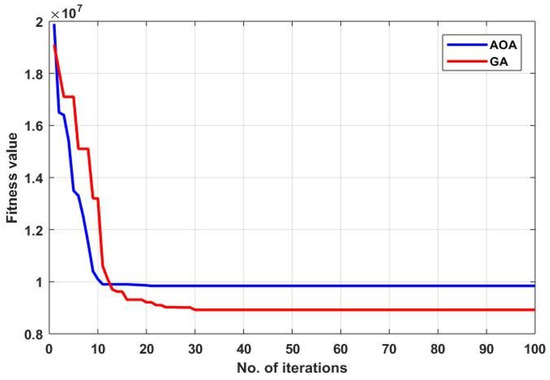
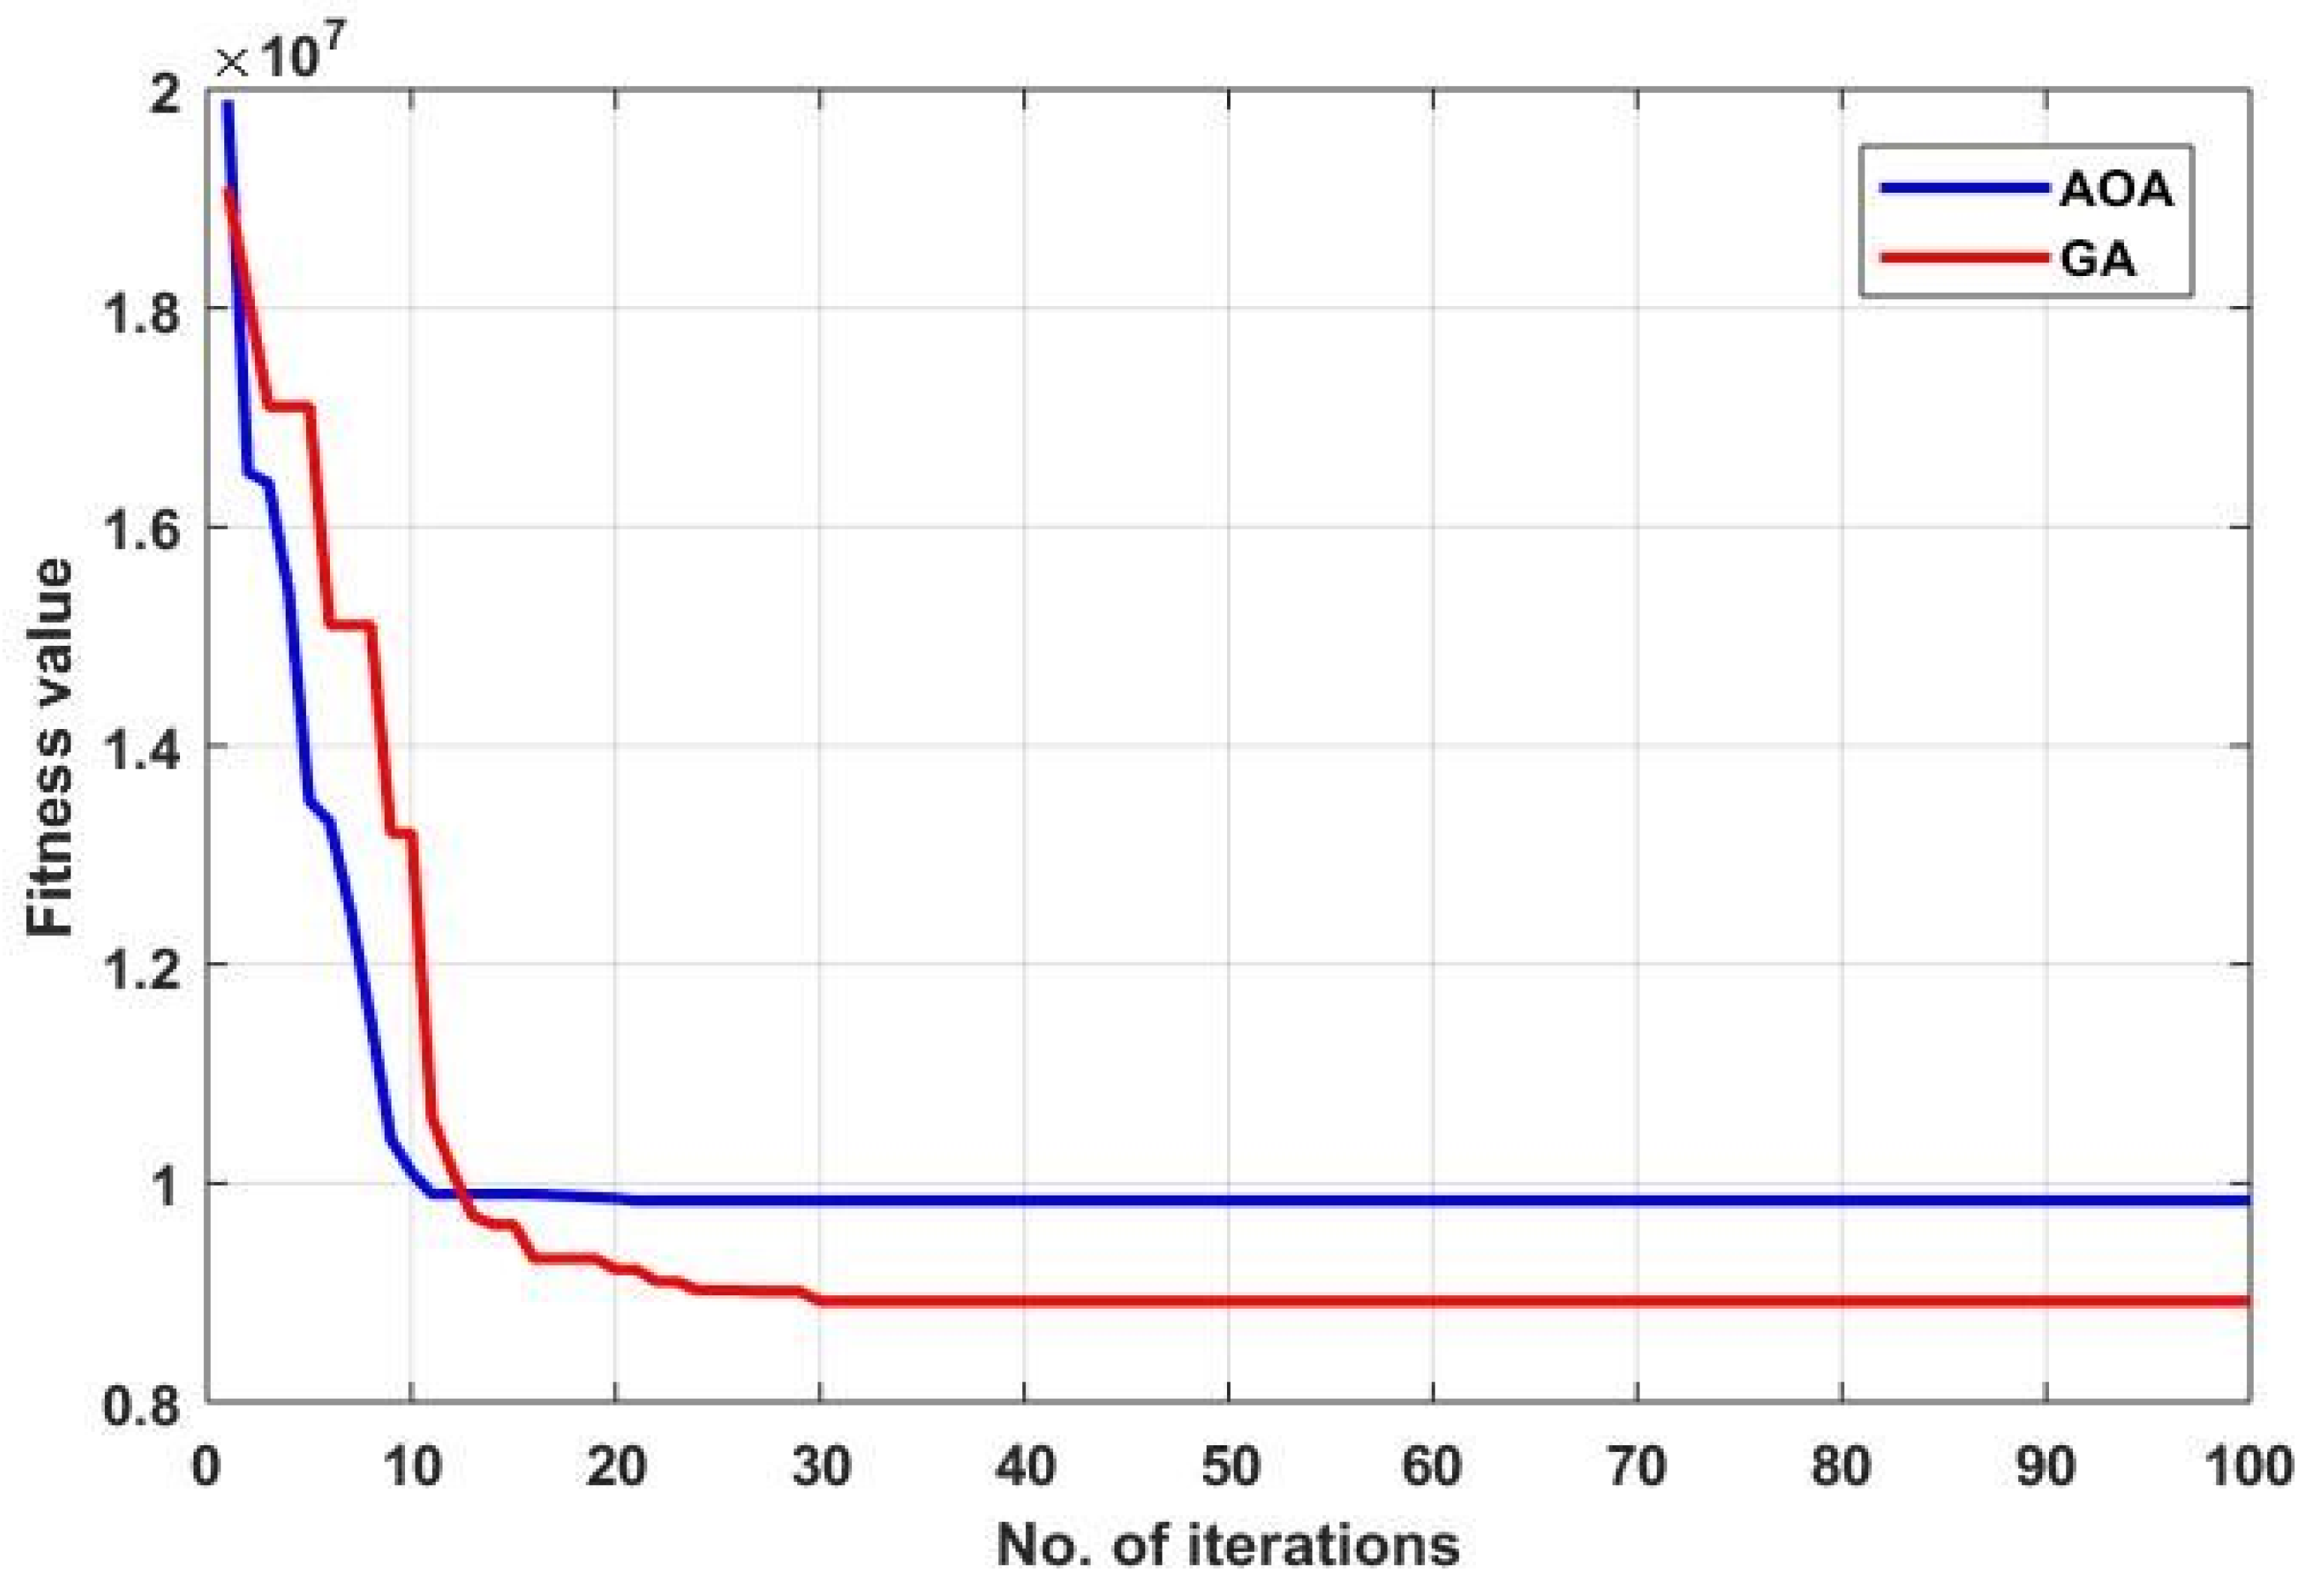
To verify the efficiency of the AOA, the results of case 4 (the best case) solved by the AOA are compared with that obtained by GA. Table 4 shows the characteristics of each algorithm. Although GAs is often criticized for being too slow, the studied problem is a planning problem that only needs to be solved offline. That is why the simulation time is not of great importance as the capability to converge. It was noticed that the convergence curve of the AOA is quite smooth and with no oscillations, as shown in Figure 14. Additionally, the AOA needs less time than GA.
Table 4.
AOA and GA characteristics.
Figure 14.
Fitness function convergence curves.
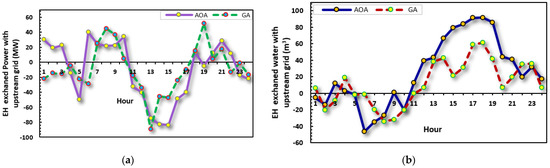
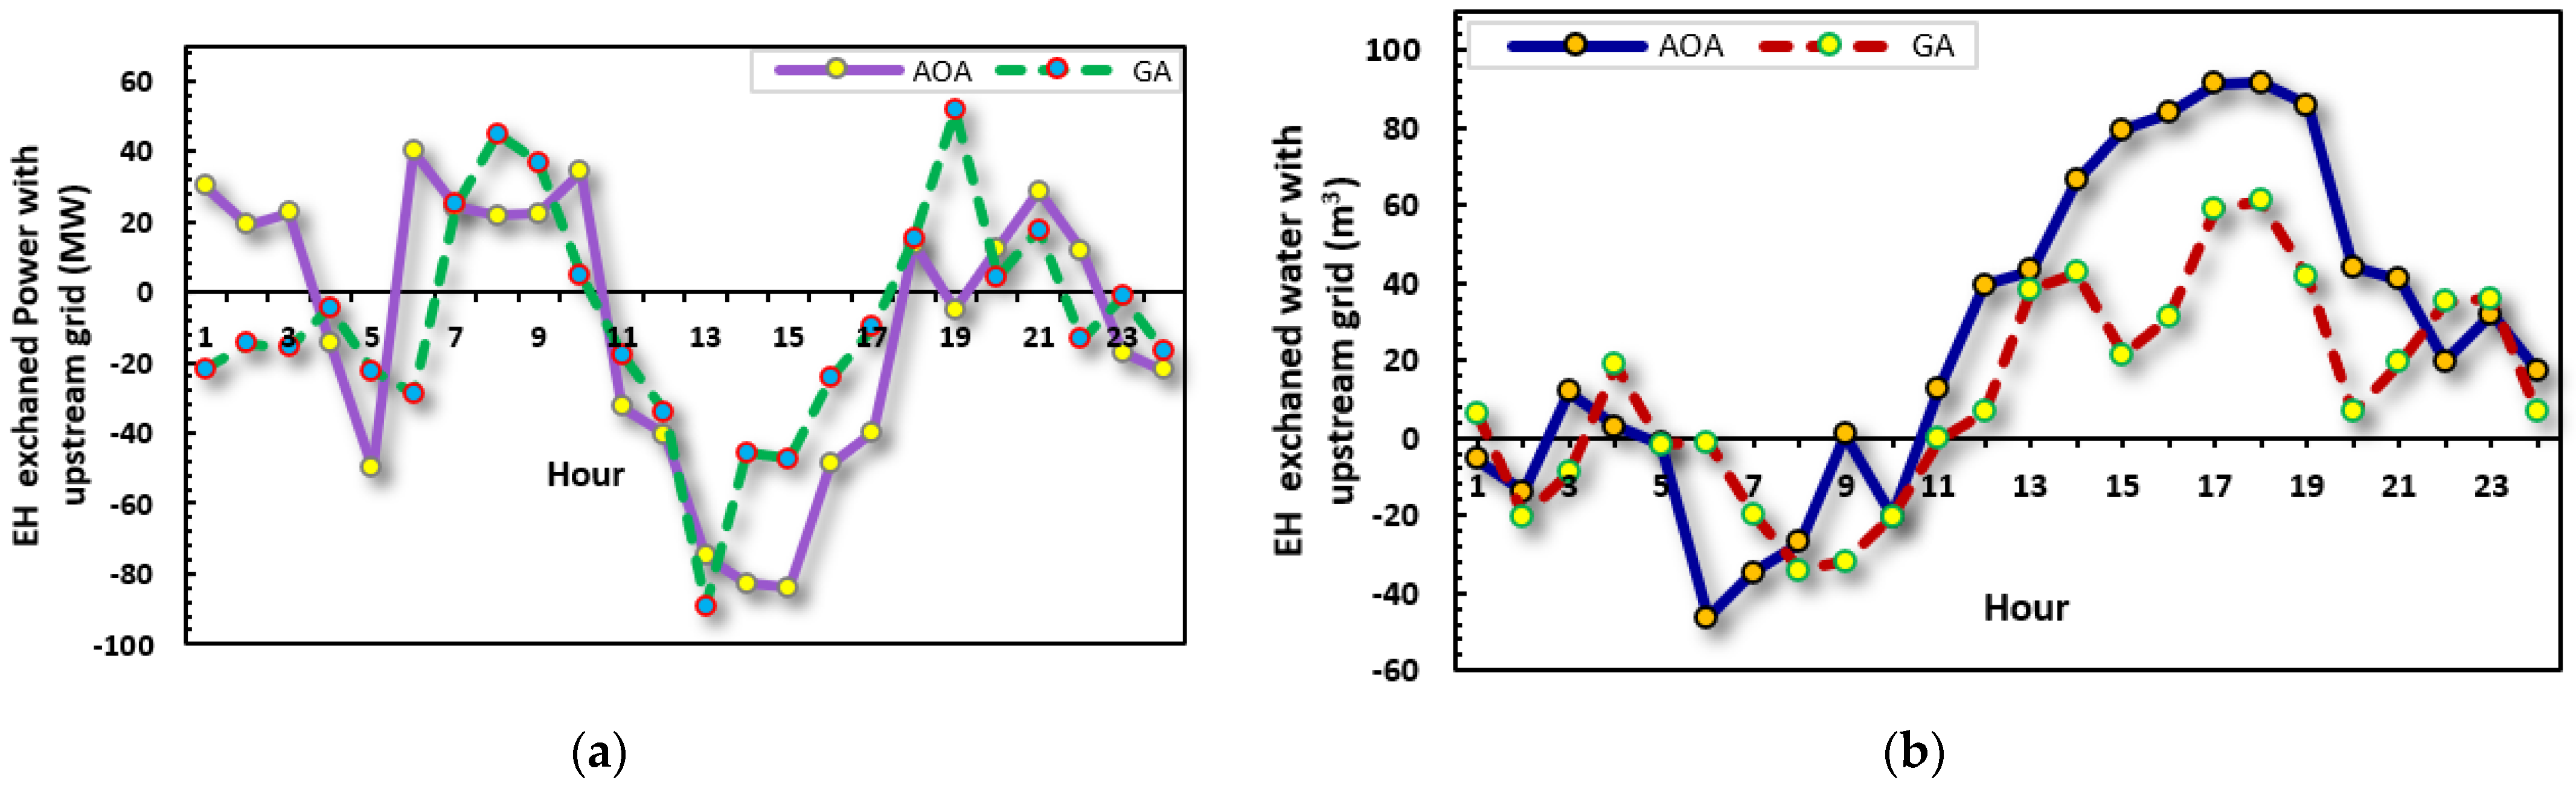
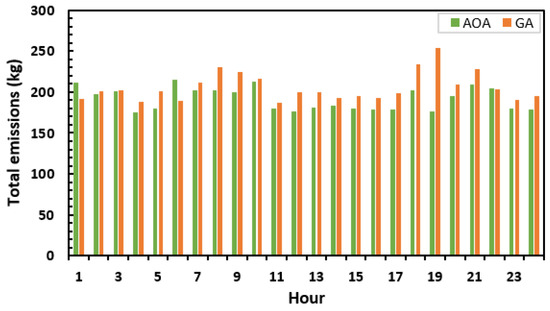
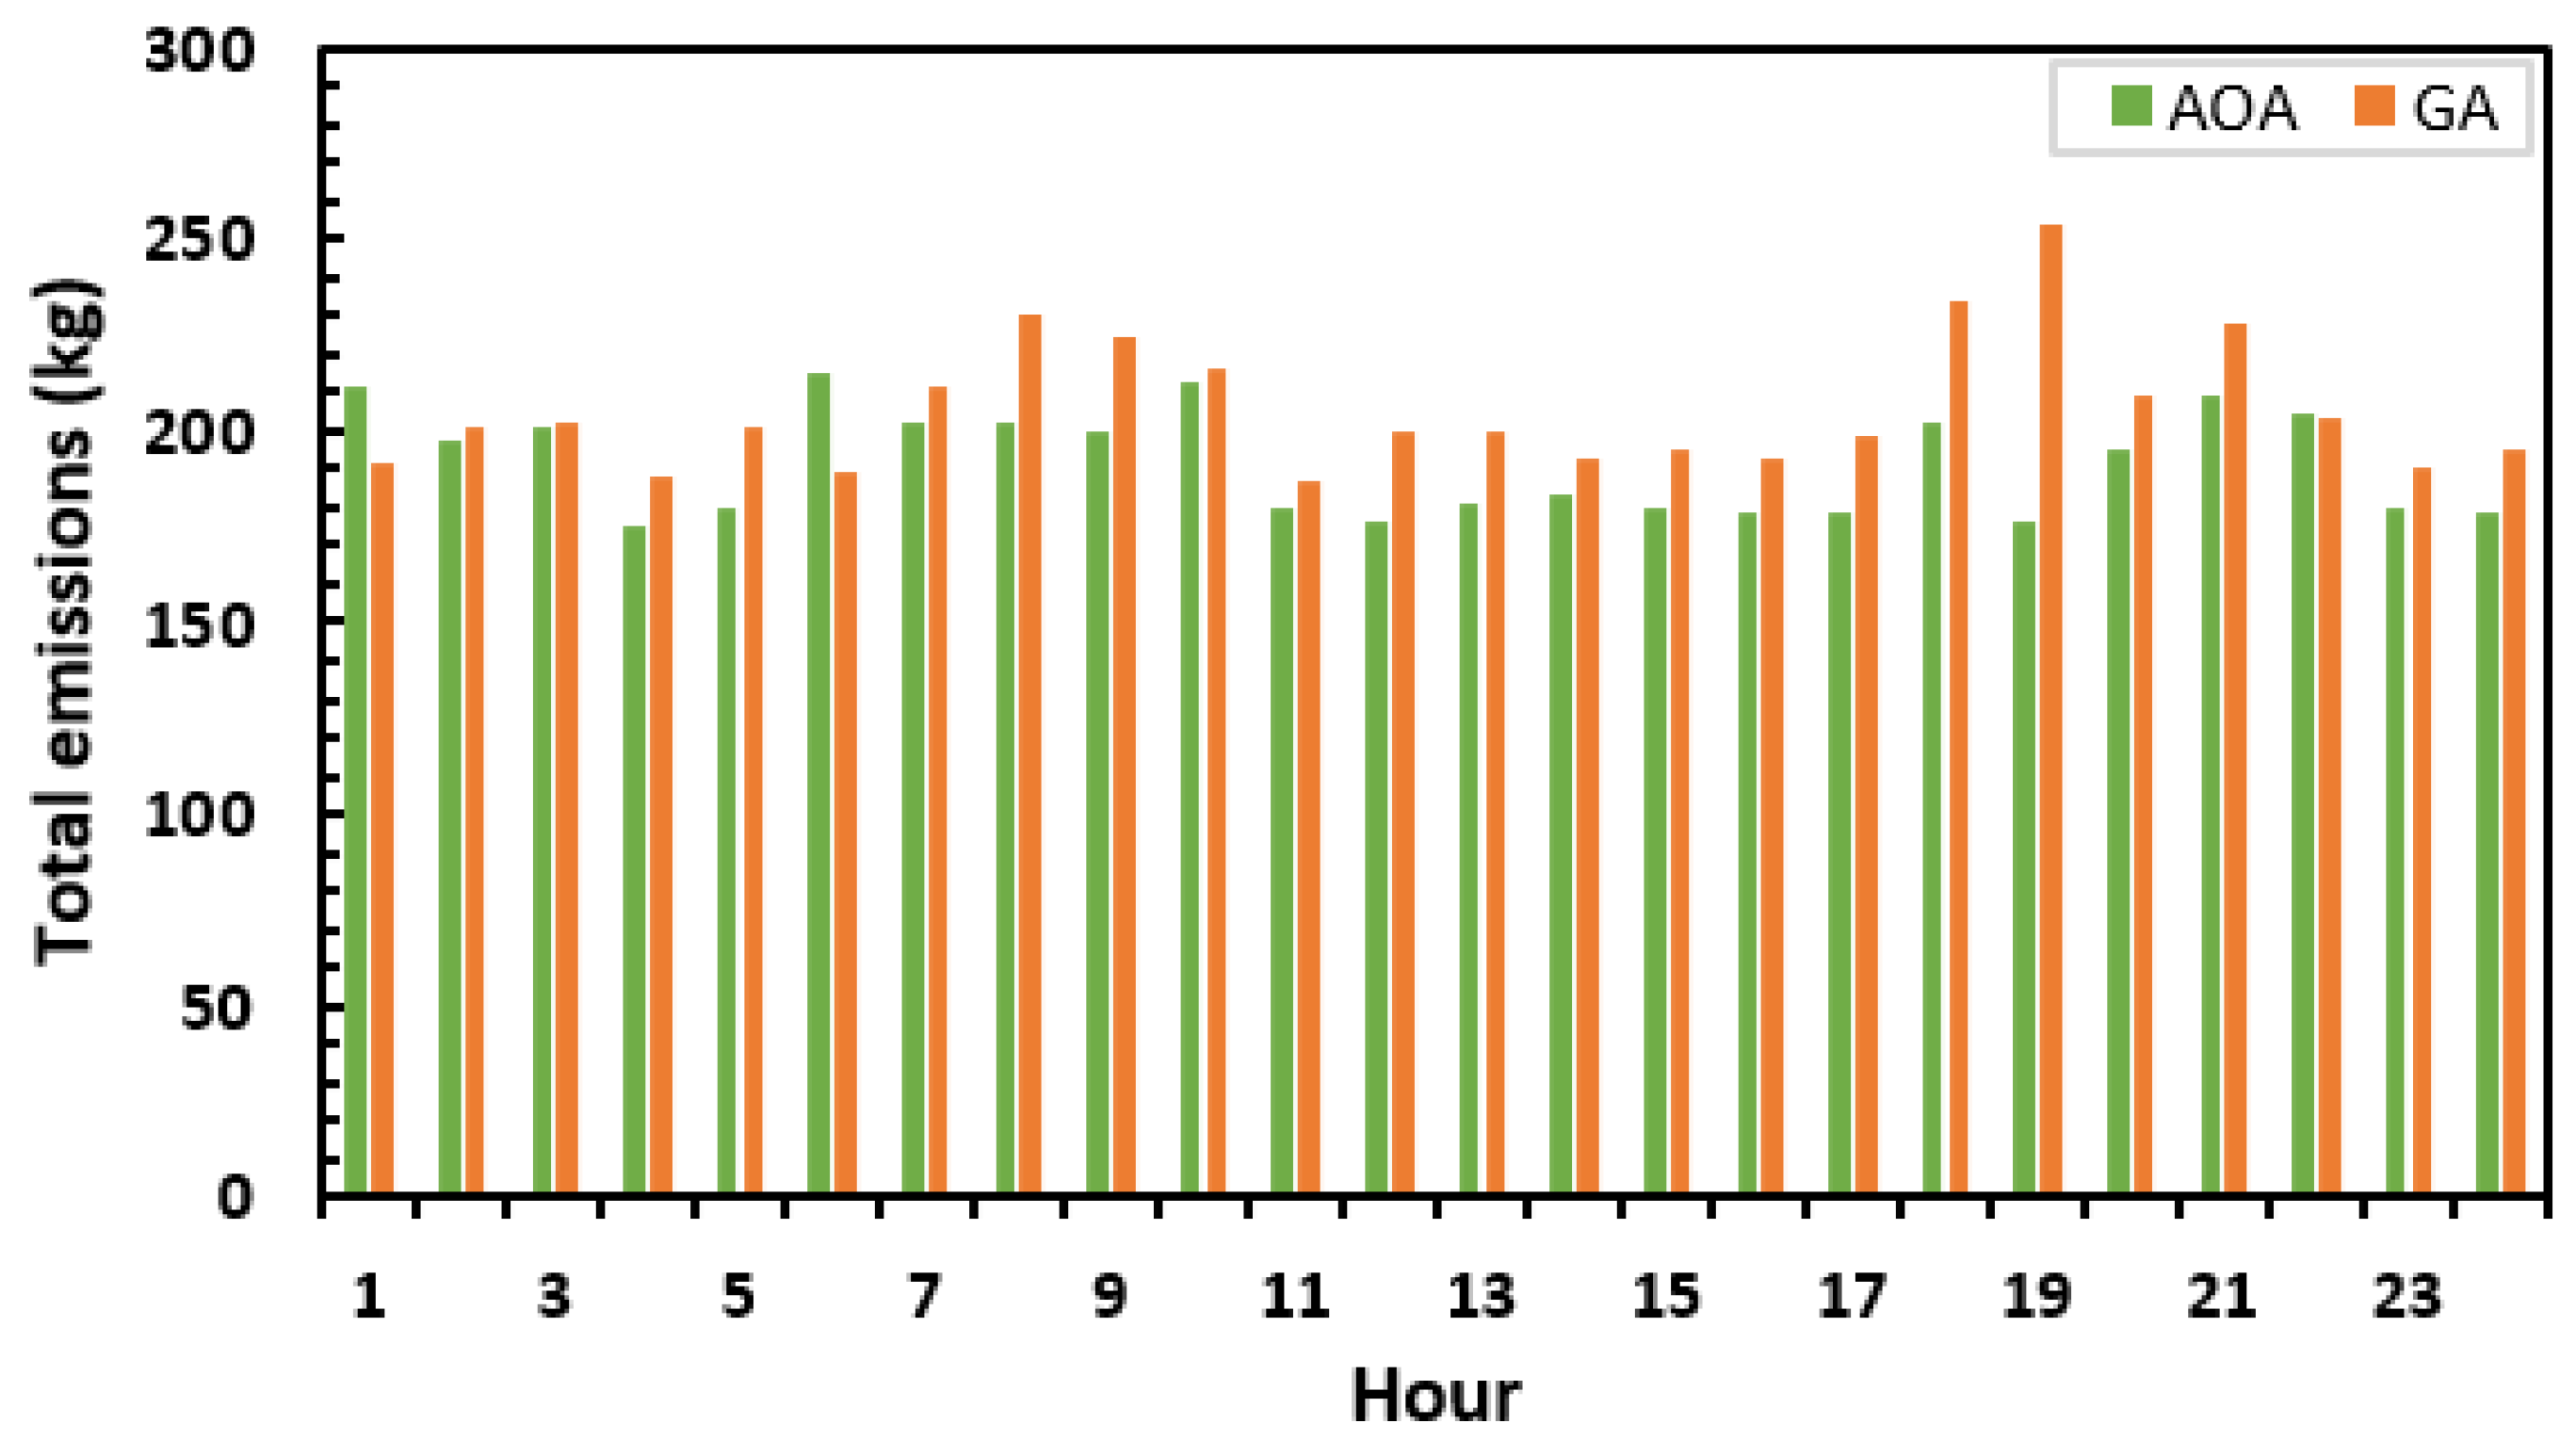
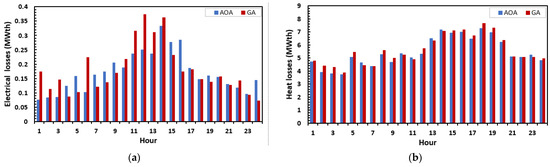
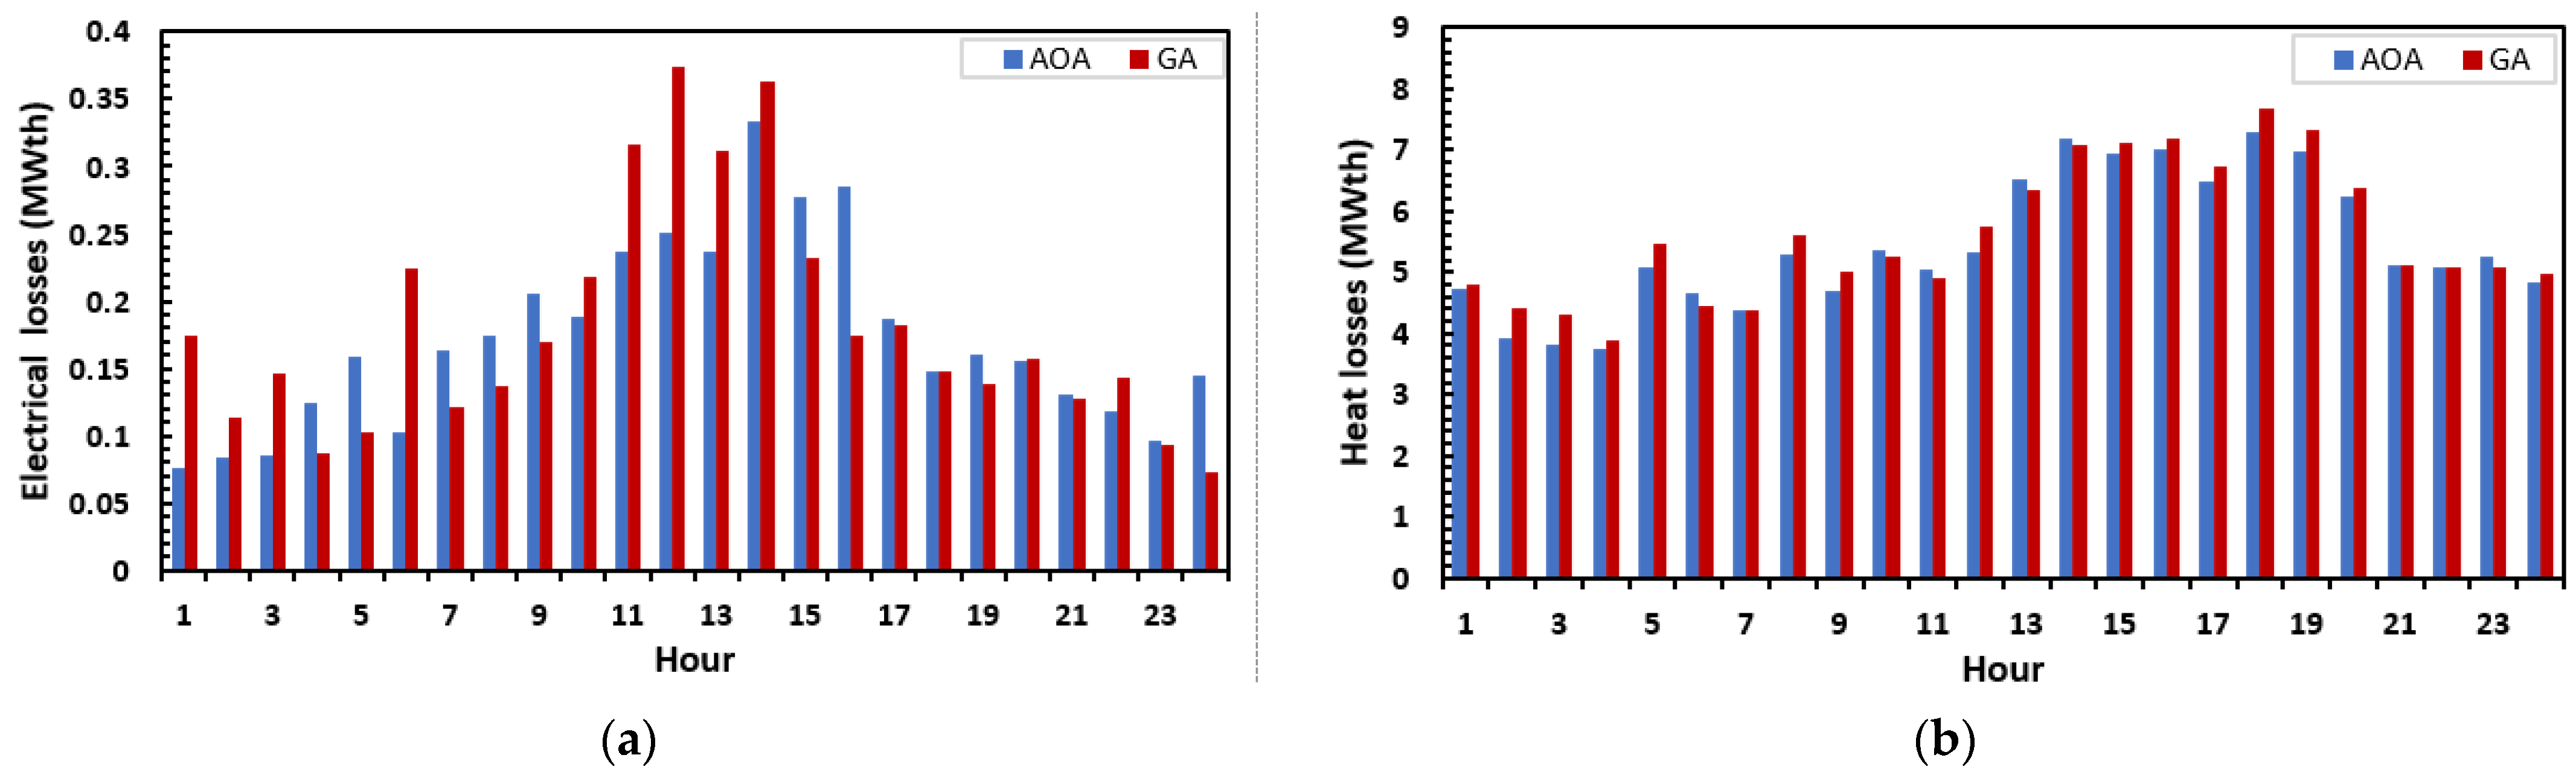
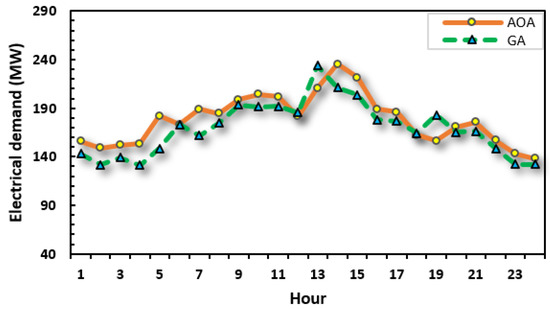
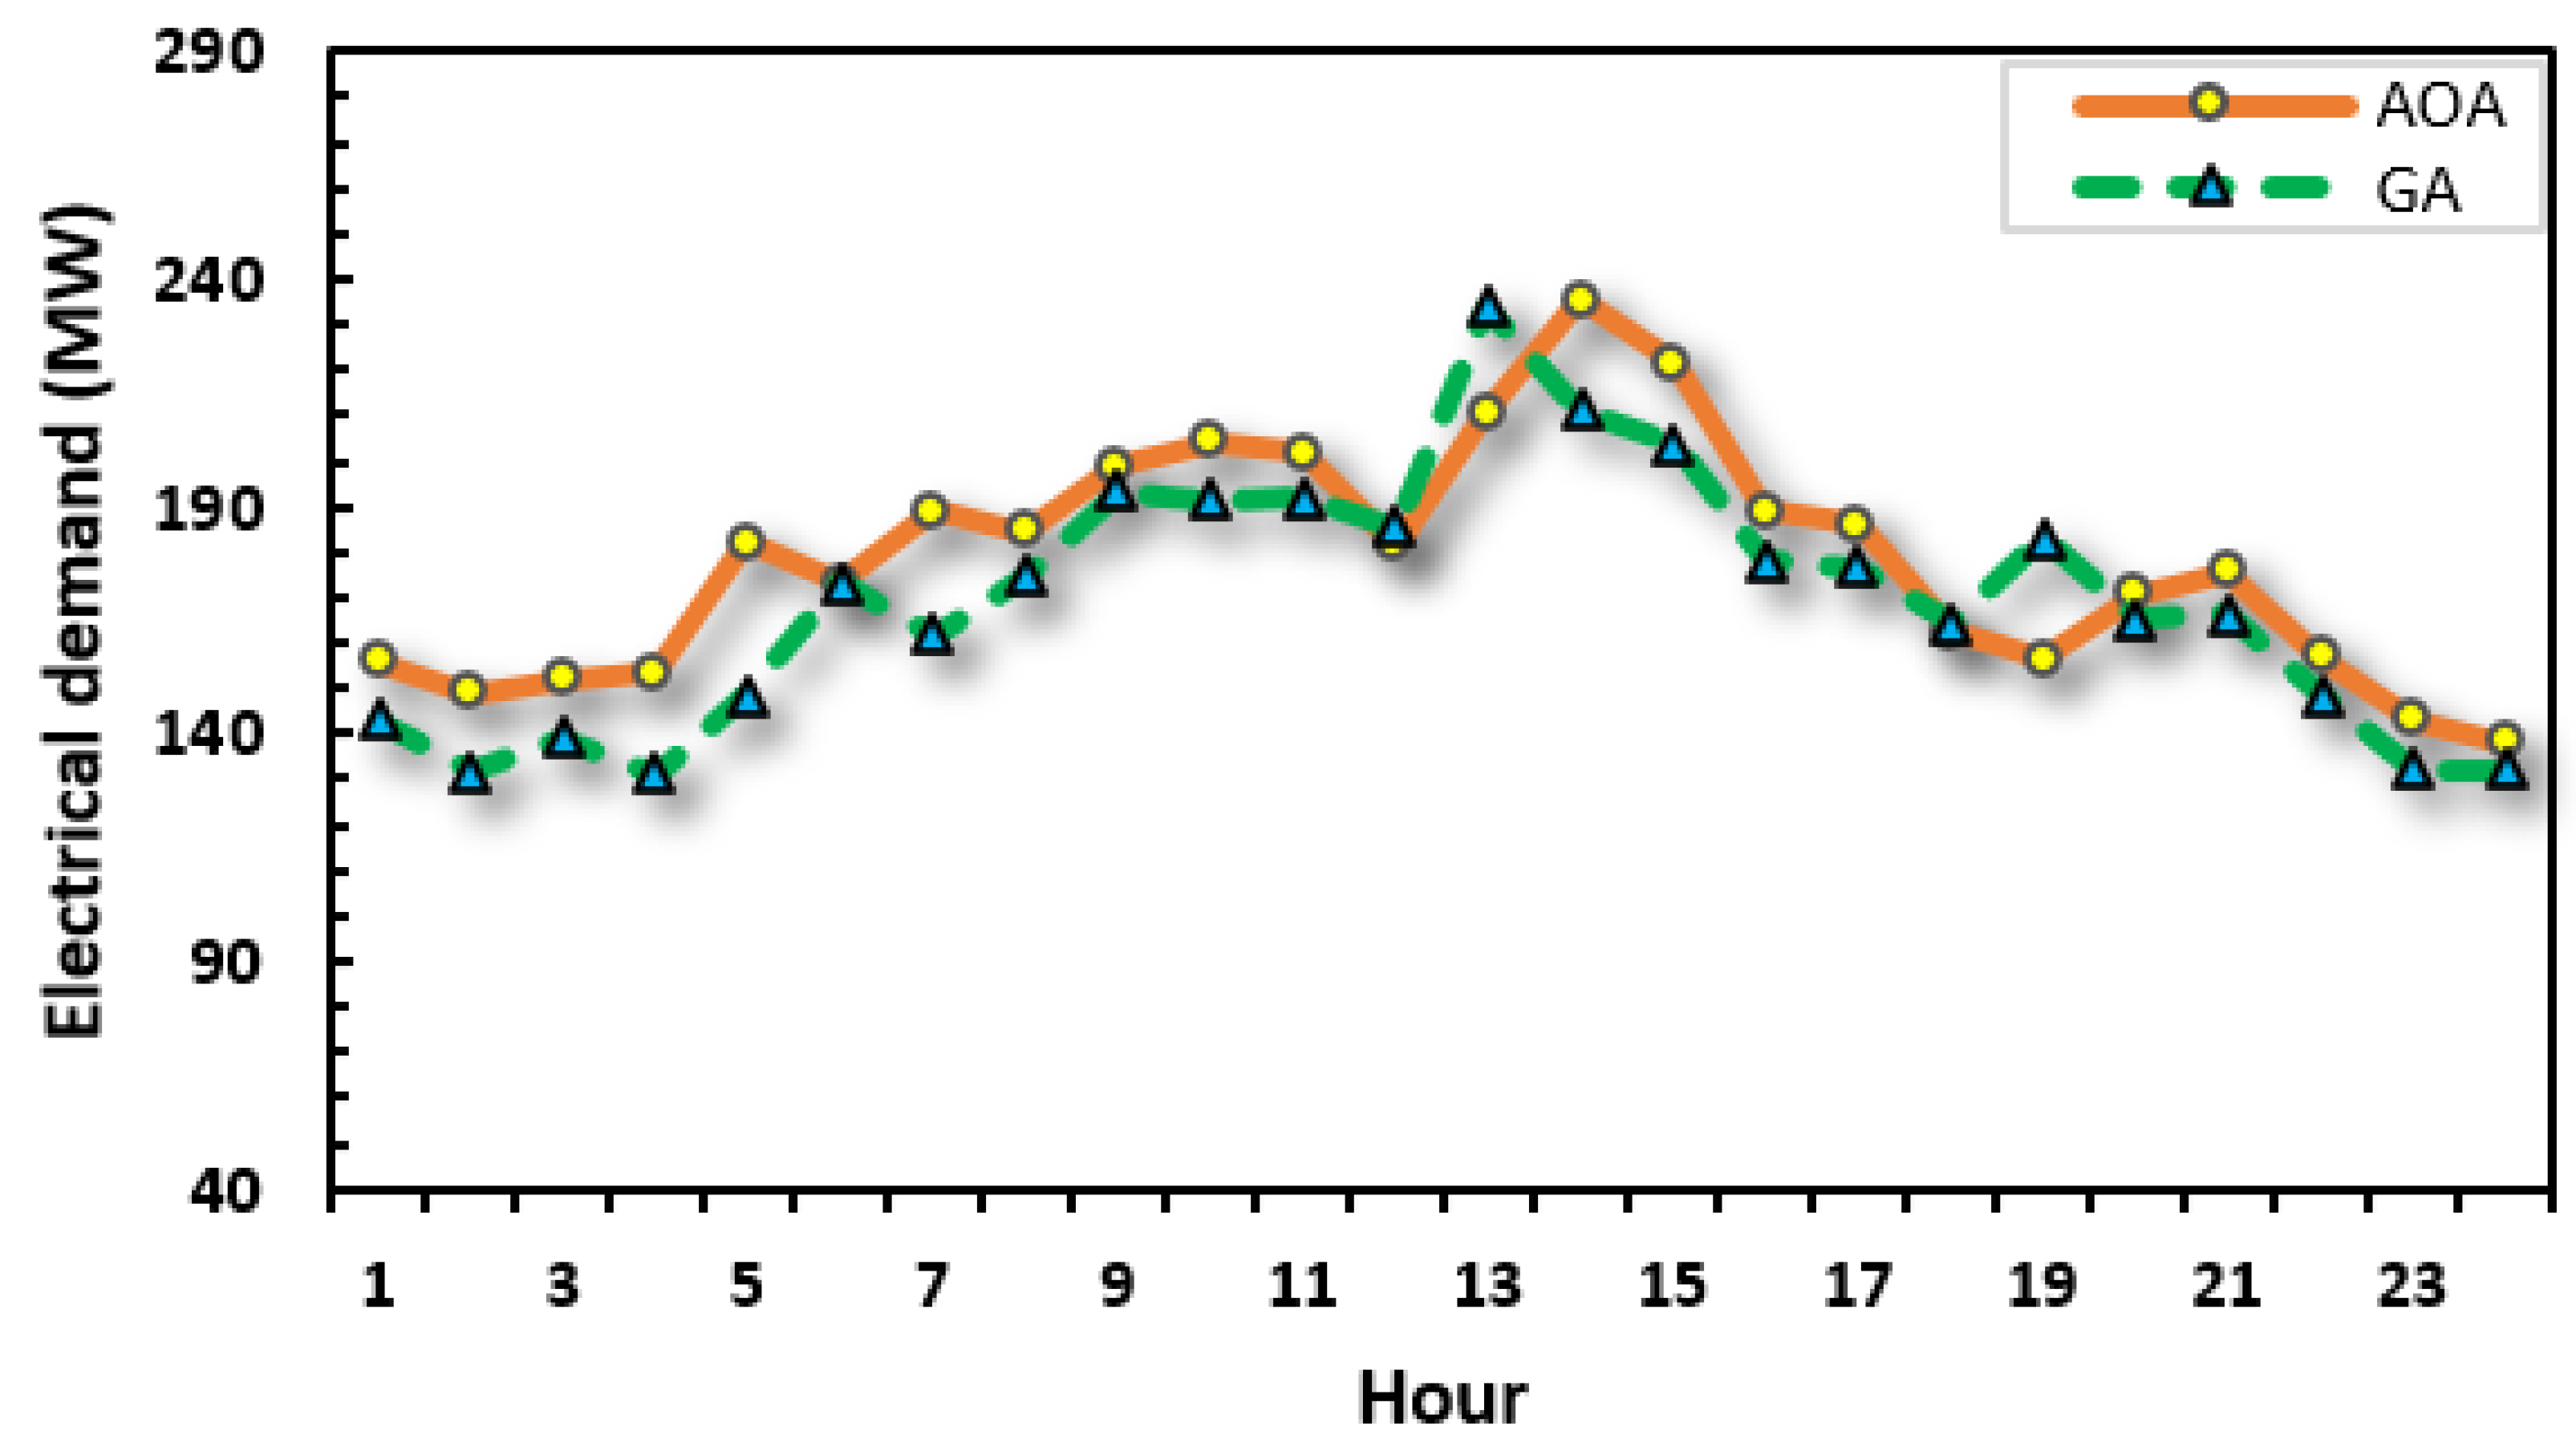
Table 5 and Table 6 present the hourly optimal values of EH variables for case 4 by applying the AOA and GA, respectively. It is clear from these tables that the power/water taken from the electrical/water network in the case of the AOA is less than GA, which is reflected in the sold capacity of the network, as shown in Figure 15a,b. Additionally, the power taken from the CHP unit increases in the case of GA. On the other hand, the power taken from RESs increases in the case of the AOA which leads to a decrease in the total emissions, as shown in Figure 16 and Table 7, a decrease in the total losses, as shown in Figure 17a,b, and an increase in the total electrical demand, as shown in Figure 18.
Table 5.
Hourly optimal values generated from the EH system of case 4 solved by AOA.
Table 6.
Hourly optimal values generated from the EH system of case 4 solved by GA.
Figure 15.
EH exchanged energy (a) EH exchanged power with the upstream grid (b) EH exchanged water with the water network.
Figure 16.
EH emissions.
Table 7.
The results for daily operation in case 4.
Figure 17.
EH losses (a) electrical (b) heat.
Figure 18.
EH electrical demand.
Table 7 summarized the main results obtained from the two algorithms. It can be observed that all operating parameters of the EH system are improved when the AOA is used to solve the optimization problem. Total emissions and electrical/heat losses are reduced by 6.76%, 14.52%, and 2.34%, respectively, and total electrical demand, total SW, electrical power sold to the grid, and amount of water sold to the water network are increased by 4.06%, 20.49%, and 7.03%, respectively.
7. Conclusions
An optimum operation and configuration for an EH integrated with CHP was developed in this paper. The proposed configuration of the EH is composed of different types of energy sources, generation, and ESSs to feed different demands. The main objective was to maximize the total SW by reducing total operating costs and reducing total emissions value. The emissions of the EH were transformed into a penalty cost function via the emissions coefficient. Many case studies were proposed to satisfy the demands of the EH. The optimal operation problem was solved using the AOA algorithm to determine the energy generated from each source and satisfy objective functions and operational constraints. The optimization problem was implemented in the MATLAB environment. Four cases with different configurations were studied to analyze the performance of CHP with the EH. According to the results, the best performance in terms of configuration, operation, and emissions was obtained with the hub including a combination of CHP, PV, WT, EHP, GB, WD, and ESSs. The AOA was validated by solving the same problem of case 4 by GA. The results proved that the performance of the AOA is better than GA in terms of total operating cost and emissions. The numerical results illustrated the following points:
With the integration of the CHP unit, SW increased by 5.71% and emissions decreased by 9.97%, respectively, compared with the base case. Additionally, the total electrical demand supplied by the hub increased by 0.7% and the hub sold 23.2 MWh to the electricity grid.
- ▪
- In case 4, all performance parameters were improved; the total SW and emissions are 379,648 USD and 4603 kg. Additionally, the total electrical demand supplied by the hub increased to 4269.82 MWh; the hub sold 512.26 MWh to the electricity grid and 149.4 m3 to the water network.
- ▪
- All operating parameters of the system (case 4) were improved by applying the AOA to solve the optimization problem. Total emissions and electrical/heat losses were reduced by 6.76%, 14.52%, and 2.34%, respectively, and total electrical demand, total SW, electrical power sold to the grid, and amount of water sold to the water network were increased by 4.06%, 20.49%, and 7.03%, respectively, compared to case 4 solved with GA.
- ▪
- The number of emissions was converted to cost by using a penalty factor h. The aim was achieved and emissions were reduced, which in turn reduced all associated social and environmental aspects.
In future work, the problem must be represented as a long-term economic model with detailed modeling of the water distribution system, as well as taking into account the losses in the water system and all types of emissions.
Author Contributions
M.I.E.-A.: Conceptualization, Methodology, and Validation; Resources, Visualization, and Investigation; M.M.S.: Data curation, Writing, and Original draft preparation; A.A.E.: Supervision, Writing, Reviewing, and Editing the Manuscript. All authors have read and agreed to the published version of the manuscript.
Funding
Publication fees of this article have been covered by Mansoura University, Egypt.
Institutional Review Board Statement
Not applicable.
Informed Consent Statement
Not applicable.
Data Availability Statement
Not applicable.
Acknowledgments
The authors would like to thank the financial support provided by funding 60 research proposals for the master’s and Ph.D. students’ projects, which have received funding from the research fund account of Mansoura University. The publication fees of this article have been supported by Mansoura University.
Conflicts of Interest
The authors declare no conflict of interest.
Nomenclature
| A. Abbreviations | Maximum and minimum power outputs of cogeneration generator (MW) | ||
| AOA | Archimedes optimization algorithm | Maximum installed capacity of the EHP unit (MW) | |
| CHP | Combined heat and power | Maximum installed capacity of the WD unit (MW) | |
| ED | Electric demand | Maximum and minimum heat outputs of the CHP generator (MWth) | |
| EH | Energy hub | Maximum and minimum heat outputs of HOU (MWth) | |
| EHP | Electric heat pump | Maximum installed capacity of the EHP unit (MWth) | |
| ES | Electric storage | Maximum installed capacity of GB unit (MWth) | |
| ESS | Energy storage system | Maximum apparent power flow limit in the ith line (MVA) | |
| GA | Genetic algorithm | Maximum and minimum voltage limits of the ith bus (p.u) | |
| GAMS | General algebraic modeling language | Heat generation cost coefficients of HOU | |
| GB | Gas boiler | Cut-in speed, cut-out speed, and rated speed (m/s) | |
| HD | Heat demand | GB coefficient of performance | |
| HOU | Heat only unit | Performance coefficient of WD (m3/MW) | |
| HS | Heat storage | PV cell efficiency | |
| MILP | Mixed integer linear programming | parameters | |
| MINLP | Mixed-integer nonlinear programming | Electrical, heat, and water consumed cost | |
| NSGA-II | Non-dominated sorting genetic algorithm-II | of WT and PV generator | |
| PSO | Particle swarm optimization | C. Variables | |
| PV | Photovoltaic | Highest predictable value of operating cost ($) | |
| QPSO | Quantum Particle Swarm Optimization | ESS power cost ($) | |
| RES | Renewable energy resource | Power absorbed by EHP cost ($) | |
| SW | Social welfare | Natural gas absorbed by GB cost ($) | |
| WD | Water desalination | Produced heat by HOU cost ($) | |
| WG | Water grid | Power absorbed by WD cost ($) | |
| WR | Water demand | Total cost of water produced from WG ($) | |
| WS | Water storage | Corresponding cost of emissions ($) | |
| WT | Wind turbine | Total cost of power produced from grid ($) | |
| B. Input values | Total cost of energy produced from CHP ($) | ||
| Emission coefficients of the thermal generators | Total cost of WT and PV generators ($) | ||
| Conventional generator cost coefficients | Total value of emissions (kg) | ||
| CHP generation cost coefficients | Highest estimated value for emissions (kg) | ||
| EHP unit cost coefficient ($/MW) | (kW/m2) | ||
| GB unit cost coefficient ($/MW) | (MW) | ||
| Form factor | |||
| Over-estimation cost coefficient of WT and PV generators ($/MW) | Consumed electricity by WD (MW) | ||
| Under-estimation cost coefficient of WT and PV generators ($/MW) | Power of the thermal generator (MW) | ||
| Discharging and charging cost of the ith ESSs ($/MW) | Electrical and heating outputs of the CHP (MW/MWth) | ||
| EHP coefficient of performance | Scheduled output of WT and PV generator (MW) | ||
| Operating cost of WT and PV generators ($/MW) | Discharging and charging power of the ith ESSs (MW) | ||
| Down-ramp rate and up-ramp rate limit of the ith unit | ES power (MW) | ||
| Maximum and minimum limit energy of ESSs (MWh) | Total power losses (MW) | ||
| Initial energy of the ith ESSs (MWh) | |||
| ℎ | Penalty rate factor ($/kg) | ||
| Scale factor | Power of HS (MWth) | ||
| WD unit cost coefficient ($/MW) | Heat loss (MWth) | ||
| Cost coefficient of the WG ($/m3) | (MWth) | ||
| Output loads, coupling matrix, input energy carriers | (MWth) | ||
| PV and WT rated power (MW) | Flow of apparent power in ith line (MVA) | ||
| Available PV and WT power (MW) | (m/s) | ||
| Electrical, heat, and water demand | Volume of the water produced from the WG (m3) | ||
| Maximum and minimum power limits of ESSs (MW) | Produced water by WD (m3) | ||
| PV output power at maximum solar radiation (MW) | Volume of water storage (m3) | ||
Appendix A
| Parameter | Unit | Value | Parameter | Unit | Value | ||
| CHP | $ | 1250 | Grid | $ | 550 | ||
| $/MW | 14.5 | $/MW | 8.1 | ||||
| $/MW2 | 0.0345 | $/MW2 | 0.00028 | ||||
| $/MWth | 4.2 | HOU | $ | 100 | |||
| $/MWth2 | 0.03 | $/MWth | 0.1 | ||||
| $/MW.MWth | 0.031 | $/MWth2 | 0.001 | ||||
| EHP | COP | - | 2.5 | WD | m3/MW | 3.03 | |
| MW | 40 | MW | 60 | ||||
| $/MW | 3.25 | $/MW | 2.66 | ||||
| HS | - | 1 | WG | $/m3 | 4 | ||
| - | 1 | WS | - | 0.9 | |||
| MWhth | 8 | - | 0.9 | ||||
| MWhth | 60 | m3/h | 8 | ||||
| MWhth | 12 | m3/h | 40 | ||||
| ES | - | 0.9 | m3/h | 10 | |||
| - | 0.9 | ||||||
| MWh | 3.3 | ||||||
| MWh | 30 | ||||||
| MWh | 3.3 |
References
- Mohamed, M.A.; Almalaq, A.; Mahrous Awwad, E.; El-Meligy, M.A.; Sharaf, M.; Ali, Z.M. An Effective Energy Management Approach within a Smart Island Considering Water-Energy Hub. IEEE Trans. Ind. Appl. 2020, 9994, 1–8. [Google Scholar] [CrossRef] [Scilit]
- Jalili, M.; Sedighizadeh, M.; Sheikhi Fini, A. Optimal operation of the coastal energy hub considering seawater desalination and compressed air energy storage system. Therm. Sci. Eng. Prog. 2021, 25, 101020. [Google Scholar] [CrossRef] [Scilit]
- Klemeš, J.J.; Van Fan, Y.; Jiang, P. COVID-19 pandemic facilitating energy transition opportunities. Int. J. Energy Res. 2021, 45, 3457–3463. [Google Scholar] [CrossRef] [Scilit] [PubMed]
- Buheji, M.; da Costa Cunha, K.; Beka, G.; Mavrić, B.; Leandro do Carmo de Souza, Y.; Souza da Costa Silva, S.; Hanafi, M.; Chetia Yein, T. The Extent of COVID-19 Pandemic Socio-Economic Impact on Global Poverty. A Global Integrative Multidisciplinary Review. Am. J. Econ. 2020, 10, 213–224. [Google Scholar] [CrossRef] [Scilit]
- Bilgen, S.; Keleş, S.; Sarikaya, I.; Kaygusuz, K. A perspective for potential and technology of bioenergy in Turkey: Present case and future view. Renew. Sustain. Energy Rev. 2015, 48, 228–239. [Google Scholar] [CrossRef] [Scilit]
- Bhatia, S.C. Advanced Renewable Energy Systems; CRC Press: Boca Raton, FL, USA, 2014. [Google Scholar]
- Sani, M.M.; Sani, H.M.; Fowler, M.; Elkamel, A.; Noorpoor, A.; Ghasemi, A. Optimal energy hub development to supply heating, cooling, electricity and freshwater for a coastal urban area taking into account economic and environmental factors. Energy 2022, 238, 121743. [Google Scholar] [CrossRef] [Scilit]
- Mansouri, S.A.; Javadi, M.S.; Ahmarinejad, A.; Nematbakhsh, E.; Zare, A.; Catalao, J.P. A coordinated energy management framework for industrial, residential and commercial energy hubs considering demand response programs. Sustain. Energy Technol. Assess. 2021, 47, 101376. [Google Scholar] [CrossRef] [Scilit]
- Xu, X.; Hu, W.; Liu, W.; Du, Y.; Huang, R.; Huang, Q.; Chen, Z. Look-ahead risk-constrained scheduling for an energy hub integrated with renewable energy. Appl. Energy 2021, 297, 117109. [Google Scholar] [CrossRef] [Scilit]
- Karkhaneh, J.; Allahvirdizadeh, Y.; Shayanfar, H.; Galvani, S. Risk-constrained probabilistic optimal scheduling of FCPP-CHP based energy hub considering demand-side resources. Int. J. Hydrogen Energy 2020, 45, 16751–16772. [Google Scholar] [CrossRef] [Scilit]
- Shahinzadeh, H.; Moradi, J.; Gharehpetian, G.B.; Abedi, M.; Hosseinian, S.H. Multi-Objective Scheduling of CHP-Based Microgrids with Cooperation of Thermal and Electrical Storage Units in Restructured Environment. In Proceedings of the 2018 Smart Grid Conference (SGC), Sanandaj, Iran, 28–29 November 2018; pp. 1–10. [Google Scholar] [CrossRef] [Scilit]
- Moradi, S.; Ghaffarpour, R.; Ranjbar, A.M.; Mozaffari, B. Optimal integrated sizing and planning of hubs with midsize/large CHP units considering reliability of supply. Energy Convers. Manag. 2017, 148, 974–992. [Google Scholar] [CrossRef] [Scilit]
- Zafarani, H.; Taher, S.A.; Shahidehpour, M. Robust operation of a multicarrier energy system considering EVs and CHP units. Energy 2020, 192, 116703. [Google Scholar] [CrossRef] [Scilit]
- Rastegar, M.; Fotuhi-Firuzabad, M.; Lehtonen, M. Home load management in a residential energy hub. Electr. Power Syst. Res. 2015, 119, 322–328. [Google Scholar] [CrossRef] [Scilit]
- Xie, S.; Wang, X.; Qu, C.; Wang, X.; Guo, J. Impacts of different wind speed simulation methods on conditional reliability indices. Int. Trans. Electr. Energy Syst. 2015, 25, 359–373. [Google Scholar] [CrossRef]
- Davatgaran, V.; Saniei, S.; Mortazavi, S.S. Optimal bidding strategy for an energy hub in energy market. Energy 2018, 148, 482–493. [Google Scholar] [CrossRef] [Scilit]
- Zhang, L.; Zhu, Y. Modeling of CHP-EHP coupled energy station considering load side flexibility. In Proceedings of the IEEE International Conference on Energy Internet, ICEI 2019, Nanjing, China, 21–31 May 2019; pp. 71–74. [Google Scholar] [CrossRef] [Scilit]
- Mirhedayati, A.S.; Shahinzadeh, H.; Nafisi, H.; Gharehpetian, G.B.; Benbouzid, M.; Shaneh, M. CHPs and EHPs Effectiveness Evaluation in a Residential Multi-Carrier Energy Hub. In Proceedings of the 2021 25th Electrical Power Distribution Conference (EPDC), Karaj, Iran, 18–19 May 2021; pp. 42–47. [Google Scholar] [CrossRef] [Scilit]
- Nosratabadi, S.M.; Jahandide, M.; Guerrero, J.M. Robust scenario-based concept for stochastic energy management of an energy hub contains intelligent parking lot considering convexity principle of CHP nonlinear model with triple operational zones. Sustain. Cities Soc. 2020, 68, 102795. [Google Scholar] [CrossRef] [Scilit]
- Tay, Z.X.; Lim, J.S.; Alwi, S.R.W.; Manan, Z.A. Optimal Planning for the Cogeneration Energy System using Energy Hub Model. Chem. Eng. Trans. 2021, 88, 349–354. [Google Scholar] [CrossRef]
- Shahrabi, E.; Hakimi, S.M.; Hasankhani, A.; Derakhshan, G.; Abdi, B. Developing optimal energy management of energy hub in the presence of stochastic renewable energy resources. Sustain. Energy Grids Netw. 2021, 26, 100428. [Google Scholar] [CrossRef] [Scilit]
- Teng, Y.; Sun, P.; Leng, O.; Chen, Z.; Zhou, G. Optimal Operation Strategy for Combined Heat and Power System Based on Solid Electric Thermal Storage Boiler and Thermal Inertia. IEEE Access 2019, 7, 180761–180770. [Google Scholar] [CrossRef] [Scilit]
- Zhou, Y.; Cao, S. Quantification of energy flexibility of residential net-zero-energy buildings involved with dynamic operations of hybrid energy storages and diversified energy conversion strategies. Sustain. Energy Grids Netw. 2020, 21, 100304. [Google Scholar] [CrossRef] [Scilit]
- Zhang, H.; Cao, Q.; Gao, H.; Wang, P.; Zhang, W.; Yousefi, N. Optimum design of a multi-form energy hub by applying particle swarm optimization. J. Clean. Prod. 2020, 260, 121079. [Google Scholar] [CrossRef] [Scilit]
- Wang, J.; Liu, Y.; Ren, F.; Lu, S. Multi-objective optimization and selection of hybrid combined cooling, heating and power systems considering operational flexibility. Energy 2020, 197, 117313. [Google Scholar] [CrossRef] [Scilit]
- Ren, F.; Wang, J.; Zhu, S.; Chen, Y. Multi-objective optimization of combined cooling, heating and power system integrated with solar and geothermal energies. Energy Convers. Manag. 2019, 197, 111866. [Google Scholar] [CrossRef] [Scilit]
- Shahzad, M.W.; Burhan, M.; Ng, K.C. Pushing desalination recovery to the maximum limit: Membrane and thermal processes integration. Desalination 2017, 416, 54–64. [Google Scholar] [CrossRef] [Scilit]
- Nazari-Heris, M.; Mohammadi-Ivatloo, B.; Asadi, S. Optimal operation of multi-carrier energy networks with gas, power, heating, and water energy sources considering different energy storage technologies. J. Energy Storage 2020, 31, 101574. [Google Scholar] [CrossRef] [Scilit]
- Ramos-Teodoro, J.; Gil, J.D.; Roca, L.; Rodríguez, F.; Berenguel, M. Optimal water management in agro-industrial districts: An energy hub’s case study in the southeast of Spain. Processes 2021, 9, 333. [Google Scholar] [CrossRef] [Scilit]
- Mokaramian, E.; Shayeghi, H.; Sedaghati, F.; Safari, A. Four-Objective Optimal Scheduling of Energy Hub Using a Novel Energy Storage, Considering Reliability and Risk Indices. J. Energy Storage 2021, 40, 102731. [Google Scholar] [CrossRef] [Scilit]
- Mostafavi Sani, M.; Noorpoor, A.; Shafie-Pour Motlagh, M. Optimal model development of energy hub to supply water, heating and electrical demands of a cement factory. Energy 2019, 177, 574–592. [Google Scholar] [CrossRef] [Scilit]
- Eladl, A.A.; El-Afifi, M.I.; Saeed, M.A.; El-Saadawi, M.M. Optimal operation of energy hubs integrated with renewable energy sources and storage devices considering CO2 emissions. Int. J. Electr. Power Energy Syst. 2019, 117, 105719. [Google Scholar] [CrossRef] [Scilit]
- Geidl, M. Integrated Modeling and Optimization of Multi-Carrier Energy Systems. Ph.D. Thesis, ETH Zurich, Zurich, Switzerland, 2007. [Google Scholar]
- Hasankhani, A.; Hakimi, S.H. Stochastic energy management of smart microgrid with intermittent renewable energy resources in electricity market. Energy 2021, 219, 119668. [Google Scholar] [CrossRef] [Scilit]
- Mokaramian, E.; Shayeghi, H.; Sedaghati, F.; Safari, A.; Alhelou, H.H. A CVaR-Robust-based multi-objective optimization model for energy hub considering uncertainty and E-fuel energy storage in energy and reserve markets. IEEE Access 2021, 9, 109447–109464. [Google Scholar] [CrossRef] [Scilit]
- Eladl, A.A.; ElDesouky, A.A. Optimal economic dispatch for multi heat-electric energy source power system. Int. J. Electr. Power Energy Syst. 2018, 110, 21–35. [Google Scholar] [CrossRef] [Scilit]
- Neves, D.; Silva, C.A. Modeling the impact of integrating solar thermal systems and heat pumps for domestic hot water in electric systems—The case study of Corvo Island. Renew. Energy 2014, 72, 113–124. [Google Scholar] [CrossRef] [Scilit]
- Damodaran, S.K.; Kumar, T.K.S. Economic and emission generation scheduling of thermal power plant incorporating wind energy. In Proceedings of the IEEE Region 10 International Conference TENCON, Penang, Malaysia, 5–8 November 2017; pp. 1487–1492. [Google Scholar] [CrossRef] [Scilit]
- Hetzer, J.; David, C.Y.; Bhattarai, K. An economic dispatch model incorporating wind power. IEEE Trans. Energy Convers. 2008, 23, 603–611. [Google Scholar] [CrossRef]
- Wang, Z.; Zhong, J.; Chen, D.; Lu, Y.; Men, K. A multi-period optimal power flow model including battery energy storage. IEEE Power Energy Soc. Gen. Meet. 2013. [CrossRef] [Scilit]
- Najafi, A.; Falaghi, H.; Contreras, J.; Ramezani, M. Medium-term energy hub management subject to electricity price and wind uncertainty. Appl. Energy 2016, 168, 418–433. [Google Scholar] [CrossRef] [Scilit]
- Zhang, G.; Hu, W.; Cao, D.; Liu, W.; Huang, R.; Huang, Q.; Blaabjerg, F. Data-driven optimal energy management for a wind-solar-diesel-battery-reverse osmosis hybrid energy system using a deep reinforcement learning approach. Energy Convers. Manag. 2020, 227, 113608. [Google Scholar] [CrossRef] [Scilit]
- Hashim, F.A.; Hussain, K.; Houssein, E.H.; Mabrouk, M.S.; Al-Atabany, W. Archimedes optimization algorithm: A new metaheuristic algorithm for solving optimization problems. Appl. Intell. 2021, 51, 1531–1551. [Google Scholar] [CrossRef] [Scilit]
- Houssein, E.H.; Helmy, B.E.D.; Rezk, H.; Nassef, A.M. An enhanced Archimedes optimization algorithm based on Local escaping operator and Orthogonal learning for PEM fuel cell parameter identification. Eng. Appl. Artif. Intell. 2021, 103, 104309. [Google Scholar] [CrossRef] [Scilit]

Publisher’s Note: MDPI stays neutral with regard to jurisdictional claims in published maps and institutional affiliations. |
© 2022 by the authors. Licensee MDPI, Basel, Switzerland. This article is an open access article distributed under the terms and conditions of the Creative Commons Attribution (CC BY) license (https://creativecommons.org/licenses/by/4.0/).