Abstract
As real-time indoor thermal data became available, the precision of the building thermal control systems has improved, but the use of resources has also increased. Therefore, it is imperative to examine the optimized point of energy use and thermal dissatisfaction for their efficient control. The aim of this research is to find an energy-efficient thermal control strategy to suppress the increase in thermal dissatisfaction. An adaptive control model utilizing the artificial neural network and the adjustment process of initial settings is proposed to examine its performance in controlling thermal supply air in terms of indoor thermal dissatisfaction and energy use. For a clear comparison, the standard deviation of each thermal dissatisfaction value and the weekly heating energy transfer are used. The proposed model successfully performs in reducing the indoor thermal dissatisfaction level and energy use. In comparison with two deterministic models, the performance is improved in terms of the constancy of suppressing thermal dissatisfaction levels by 72.1% and the improvement in energy efficiency by 18.8%, respectively. The significance of this study Is that it is possible to improve control precision by adding only a few modules without replacing the entire existing system, and that the model’s sustainability is increased by reducing the possibility of hardware and software retrofitting in the future.
1. Building Thermal Control
The performance of thermal system operation has improved to find optimized control rules for energy efficiency and human comfort. Several mechanical and statistical approaches have mainly examined the use of architectural and mechanical elements in buildings. In various components in building systems, the Heating, Ventilation, and Air Conditioning (HVAC) system has been gradually developed in association with the manual and automatic control strategies. The Proportional Integral Derivative (PID) rule has been frequently used to improve their performance. Through this method, it has been possible to effectively control the rotational speed of fan motors or the precise injection in plant levels in buildings and building networks [1,2]. The advantage of the PID control is that it does not require much effort to develop and install the physical devices, whereas the disadvantages are that it does not reflect the control characteristics of the systems, and that there is computational noise to perform real-time precision control [3,4]. In order to improve the performance of the control methods, several algorithms were combined with more advanced statistical approaches such as the Fuzzy Inference System (FIS) and Artificial Neural Network (ANN). The FIS is one of the most effective deterministic methods in the field when any exact numbers are not able to make appropriate decisions for situations influenced by subjectivity. Many different types of membership functions in the FIS were adopted to define appropriate values of output levels for amounts of fuel, air, and water in building thermal systems [5,6]. Its inner structure, dealing with ambiguous situations, was an effective method to investigate the performance of complex problems such as analyses of radiation, convection, ventilation, and infiltration effects. In the field of deterministic models, the FIS has been frequently utilized to define more reliable output signals reflecting both the subjective and objective variables [7,8,9]. The ANN model was developed to deal with hidden correlations of several variables. Before using the model, several variables in regression models were frequently regarded that had no clear correlation between them. That is because there were no effective calculation systems to deal with the huge data. With the help of an ANN algorithm and advanced hardware, several improved approaches could be sought to perform these complex problems. In particular, several problems that were almost impossible to solve by common linear methods, such as how the mechanical energy supply systems interact with architectural elements, have become more effectively approximated in a faster time [10,11]. In addition to these predictable simulation models, the ANN algorithm has allowed for the calculation of relatively validated statistical models from the data of experimental models or actual buildings that were not able to extract accurate regression models because of several unpredictable outliers [12,13,14].
As the precision and promptness of building systems have been improved, several methods to assess indoor thermal comfort have been investigated by using both qualitative and quantitative approaches. In order to increase the objectivity of various types of survey-based results, the Predicted Mean Vote (PMV) and the Predicted Percentage of Dissatisfied (PPD) indices were frequently used. The indices dealing with major thermal conditions and human factors were developed as the architectural and user characteristics were regularized by the increases in experimental data and simulated genetic algorithms. By using the methods, several assumptions and design scenarios were tested to confirm more reliable tuning rules for better performance of the comfort models [15,16]. In addition to the control framework, numerical impacts of several conventional variables such as building geometries and weather conditions were examined by using some computational tools of plug-in modules and co-simulation applications to define real-time interactions between the variables. These methods were used to improve the model’s real-time performance responding to the change in outdoor and indoor thermal conditions [17,18,19]. This approach was closely related to the understanding of several types of energy conservation measures, which have been regarded as very difficult to solve due to the unexplained correlation between architectural and mechanical elements. The data-driven approaches were used to deal with the complex and hidden correlations by use of multi-layered matrixes reflecting quantitative and qualitative regression models [20,21,22].
Even though many useful studies have been conducted, there have been some weaknesses in analyzing optimized conditions of heating and cooling supply air for a space scale associated with specific weather conditions and the users’ characteristics. This research proposes an adaptive control approach to optimize the supply of air conditioning during an in-between season when the heating and cooling processes are required simultaneously. In the Results and the Discussion Sections, the performance of the proposed model is compared to two different models, and their control patterns and characteristics are discussed. Finally, in the Conclusion, based on its strengths and the weaknesses, the performance of the proposed model is summarized and follow-up research is addressed to improve the methodology used here.
2. Methodology
2.1. Overall Framework
The proposed small office building was located in a suburb area of Incheon in South Korea, and a weather file of KOR_Incheon.471120_IWEC from the US Department of Energy was used. As indicated in Figure 1 and Table 1, the two story building model consisted of six spaces and four thermal zones: two open office areas on each floor; one lobby on the first floor; one conference area on the second floor; two restrooms on each floor. Based on the building geometries and the outdoor temperature, the model calculated its heating and cooling energy transfer and comfort levels. In this process, this simulation model utilized a heater and a cooler at a single duct. The proposed model was compared to a thermostat model and a fuzzy-based model to define its improved performance of controlling heating and cooling supply air and thermal comfort. For the additional thermal comfort controls, if the PMV level was out of the range of a setting value (−0.5 < x < 0.5), an adaptive comfort module adjusted the Tset. If the PMV value was still outside the setting values, the thermal model repeated the process. However, if the PMV value was within the initial setting value at any simulation phase, this process was carried out without any additional change of Tset [23,24]. During this process, the simulation geometries and parameters were extracted from the template of ASHRAE9012016_OfficeSmall of the Energy+ simulation applications and the real-time control was performed by the MATLAB application.
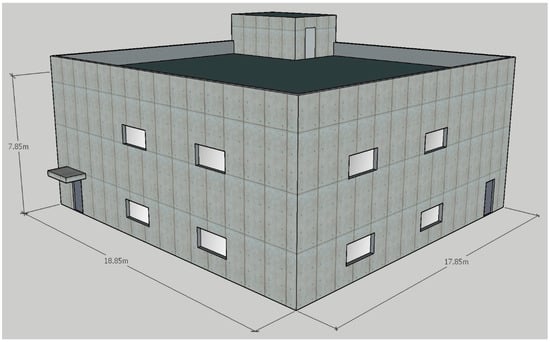
Figure 1.
Schematic building model.

Table 1.
Building geometries and simulation configurations.
2.2. Thermal and Comfort Rules
From the thermodynamic first law, the total heat loss and heat gain through the envelopes are given by [25]:
where is the heat loss through walls, a roof, windows, and doors; is the heat gain from a heater or a cooler; U is the internal energy; and t is the time.
From the heat conduction transfer through the envelopes, the heat loss of the building space,, is given by:
where T is the temperature; and are the heat transfer coefficients outside and inside; is the transmission coefficient; is the area; is the thickness of the envelopes.
From the enthalpy and the mass flow-rate, assuming that there is no work in the system, the heat gain transfer of the building space,, is given by [25]:
where is the mass flow-rate from the system; and is the specific heat capacity at a constant pressure.
The rate of internal energy is given by:
where is the mass flow-rate in room air; and is the specific heat capacity at a constant volume.
From the processes, the time derivative of Trm is rewritten by:
In many references, the PMV model by F.O. Fanger was used to mathematically define indoor thermal comfort, and the Predicted Percentage of Dissatisfied (PPD) is developed from the PMV function [26,27]:
where M is the metabolic rate; and L is the thermal load.
where is the average surface temperature of a clothed body; is ratio of clothed surface area to DuBois surface area; is the air temperature; is the convection heat transfer coefficient; is the mean radiant temperature; is the radiative heat transfer coefficient; is the air humidity ratio; and is the saturated humidity ratio of the skin temperature.
For the calculation of M and L, the PMV model utilized several factors, such as the respiratory convective heat exchange, the ratio of clothed surface area, the average surface temperature of the clothed body, the clothing insulation, the local mean air velocity, and the saturated humidity ratio of the skin temperature [26,27].
2.3. Control Rule
The thermostat model as a baseline model for a comparative analysis operated within the dead-band, ±1 °C. For instance, if the difference between Tset and Trm was larger than ±1 °C, it generated the turn-on or turn-off signals for a heater or a cooler.
The FIS model used two different input values for optimizing the amount of air and its temperature. It read the temperature difference between Tset and Trm (E), wherein the differences between En and En−1 were the derivative of the temperature difference (ΔE):
For the outputs, the FIS used two membership functions for each input variable with a universe of discourse from 0 (0%) to 1 (100%) for the amount of air, and from −10 °C to 10 °C for its temperature. The first layer consisted of inputs 1 and 2, which supplied the input values to the next layer. In the FIS inner structure, triangle membership functions were chosen with a maximum equal to 1 and a minimum equal to 0 [28,29]:
The intersections of each expression, such as Very, Quite, Neutral, Big, Small, Positive, Negative, and Zero, occurred at an interval. For instance, the fuzzy algorithm sent the signals through the fuzzy membership functions for the indoor temperature as a Very Big Positive change and a Quite Small Negative change when E and ΔE were estimated as 5 and −0.5, respectively. Then, the algorithm interpreted the signals to turn off for the amount of air and to increase the air temperature; thus, by these two control outputs, the ANN model was trained. As a principle, the ANN algorithm includes a large class of several structures, and the optimized selections of a nonlinear mapping function x with a network are required [30,31]. In this research, the ANN algorithm in function approximation was a multi-layer perceptron, which consisted of 2 input layers, 10 hidden layers, and an output layer for the amount of air and its temperature, respectively. The inputs of Equation (12), x1,…xk, to the neuron were multiplied by weights wki and summed up with the constant bias term θi., and the resulting ni was the input to the activation function g [32,33]. The input layers of the ANN model used the results of E and ΔE from the thermostat and the fuzzy-based control results were trained to find better control strategies to meet an effective PMV result within or near the initial setting range (−0.5 < a < 0.5). For its simulation configuration in MATLAB, a scaled conjugate gradient algorithm in the neural network fitting application was used, and the repetition of simulations was set to under 1000 times [32,33]. By use of the 1-year weather file, KOR Incheon 471120_IWEC, the difference between the control target and the actual control value (), and the time serial difference of the control errors () were learned as two inputs in the ANN. As the statistical validation of the results, the R2 values were confirmed as 0.99532 for controlling the amount of mass and 0.98993 for controlling its temperature, respectively.
2.4. Adaptive Rule
When the supply air condition calculated through the control module was entered into the cooling and heating supply models, the amount of mass and its temperature of the air supply were determined for each simulation interval. Thereafter, the cooling and heating Tset were readjusted again according to the correlation between the indoor temperature and the PMV value. For instance, in the case of the cooling process (Trm > Tset, PMV > 0) the control rule of this adaptive model is diagrammatically described in Figure 2.
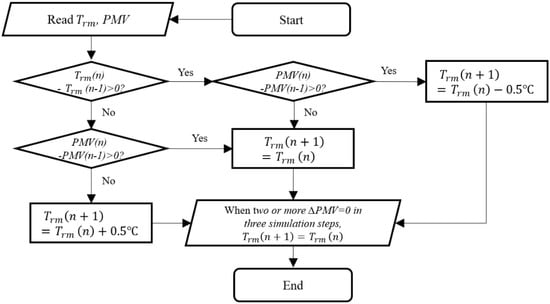
Figure 2.
Flow diagram of the adaptive process.
2.5. Simulation Model
A simulation model is consequently described in Figure 3, which consists of six different overall modules, including the Signal Generator, Adaptive Thermostat, Controller, Supply, Room, and PMV. As the thermal supply process was performed, the values from the PMV (PPD) module were sent to a plotting block every minute and simultaneously to a signal-merging module to adjust thermostat values for an adaptive process. For instance, if the values from the PMV module at a certain time were higher than 0.5 or lower than −0.5, the adaptive thermostat adjusted Tset by 10% lower for cooling or 10% higher for heating, respectively. It implied that the adaptive system worked in a way which mitigates indoor thermal dissatisfaction, but the energy use can increase by that amount.
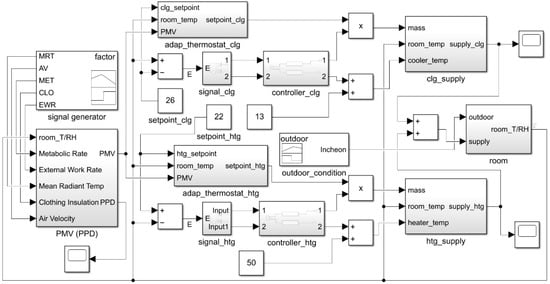
Figure 3.
Simulation block diagram.
3. Results
3.1. Room Temperature by the Control Models
Figure 4 displays Tout of the City of Incheon in South Korea from 6 to 13 April, which was retrieved from the weather data of the US Department of Energy. In particular, from around 11 April, there was an unexpected temperature change in which the temperature suddenly began to drop. The characteristics of how the control models effectively respond to these unlearned data will be discussed. Figure 5, Figure 6 and Figure 7 describe the change of Trm controlled by the simulation models and their scenarios. The performance of the thermostat shows quite regular patterns between 21 °C and 23.5 °C. This finding implies the fact that the thermostat model can be efficient in decreasing the system’s energy use because it immediately turns on and off for Tset, but the operation may deteriorate the thermal comfort due to the signal fluctuation.
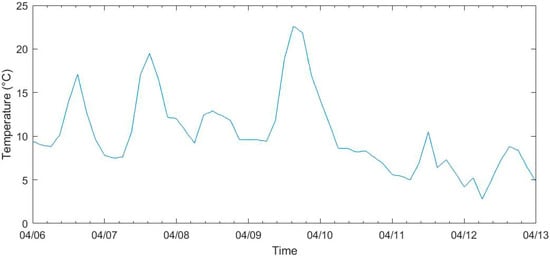
Figure 4.
Tout in early April in Incheon.
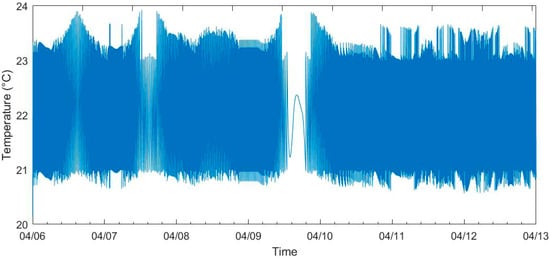
Figure 5.
Trm controlled by the thermostat.
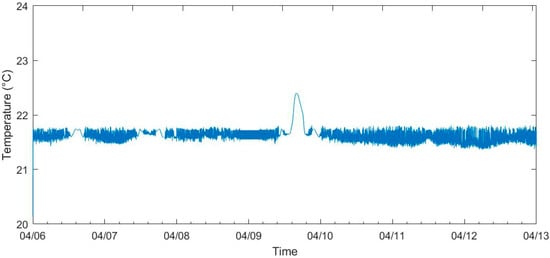
Figure 6.
Trm controlled by the FIS model.
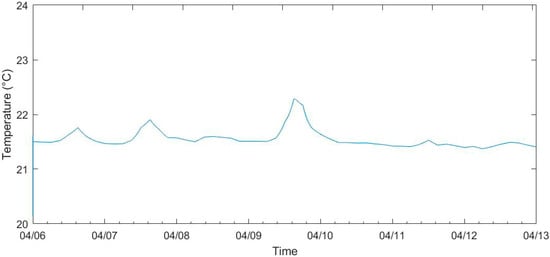
Figure 7.
Trm controlled by the ANN model.
Figure 6 displays the improved performance of the FIS model, which produced quite consistent changes in Trm as compared to the thermostat control. The graph shows the reduced fluctuations of Trm except for the daytime on 9 April (about 13:00 to 18:00). One possible situation can be inferred from the graph pattern is that the FIS model was also operating the same as the thermostat in sections that did not require cooling or heating. Figure 7 obviously shows the control effectiveness of the ANN algorithm, which reduced the fluctuations to make the graph pattern of Trm smooth at the same Tset. Therefore, it is expected that the level of thermal dissatisfaction that may appear according to the changes in Trm will be effectively lowered over the entire time period. On the other hand, due to this control precision, its energy use is expected to increase, and the results of how effectively the FIS and ANN models suppress the growth of energy use need to be investigated.
3.2. Heating Energy by the Control Models
Figure 8, Figure 9 and Figure 10 describe the total heating energy transfer between thermal supply, building space, and the outside to maintain Trm within Tset by the three different control models. Like the indoor temperature graph, Figure 8 shows a very consistent graph pattern form in most time ranges except for the daytime of 9 April. It can be confirmed that the system is turned off as Trm enters Tset, or that it turned on as Trm goes out of Tset, which is a simple repetition of the system operation. As can be seen from the FIS graph, the FIS algorithm performs very complex and precise control except for the time range when the outdoor and indoor temperatures enter into Tset and the system stops. In addition, it can be seen that the maximum heat transfer that occurs is lower than the thermostat in most time ranges, which can lead to a reduction in energy use.
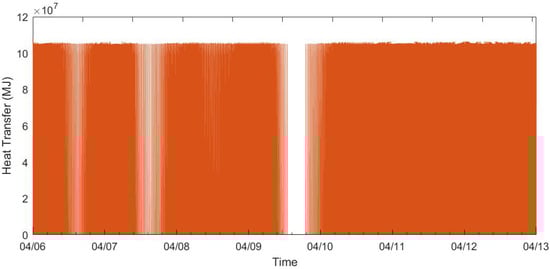
Figure 8.
Heating energy controlled by the thermostat.
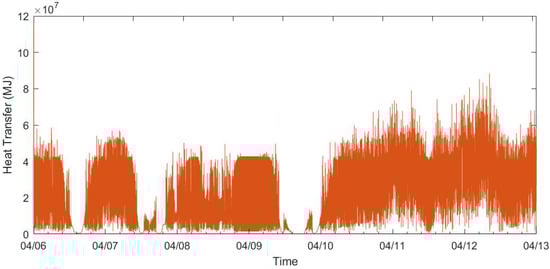
Figure 9.
Heating energy controlled by the FIS model.
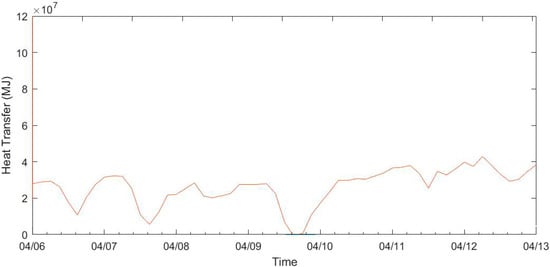
Figure 10.
Heating energy controlled by the ANN model.
As indicated in Figure 10, the ANN model shows a graph pattern in which significant energy savings are expected compared to the previous two models. Overshoot values are effectively suppressed while maintaining the designed PMV levels. It will be necessary to check the data by adjusting the scale of the time axis as to whether it comes out in smooth curves over all time ranges. Even if this is expected, it can be seen that the maximum overshoot values are significantly alleviated even in the time range of 12–13 April, where overshoots occurred particularly in the previous two models.
4. Discussion
Performance Comparison of Each Model
Table 2 and Table 3 show the simulation results separated into two types of the constancy of suppressing thermal dissatisfaction by the standard deviation of the PPD results and the energy use by the weekly heating energy use. In the case of the PPD, the standard deviation value is calculated for the PPD results calculated every minute, which can be said to be an indicator of how effectively each model maintains the indoor thermal environment. As shown in the table, it is confirmed that the ANN model performs 72.1% effective control compared to the thermostat model. Since the PPD model itself is a very intuitive indicator of the degree of thermal dissatisfaction, it can be said that this pattern of standard deviation relatively effectively represents the constancy of thermal dissatisfaction. In the case of energy use, the weekly heating energy usage is compared as a more intuitive indicator. As expected in Figure 9 and Figure 10, the effect of suppressing overshoot values and maximum energy use at a specific time of the FIS model and ANN model is confirmed in the weekly energy use. In particular, the ANN model shows an 18.8% reduction in energy use compared to the thermostat model, confirming that it can work as an effective algorithm that suppresses energy use, even though it performs precise control that maintains constancy in indoor thermal dissatisfaction. In addition, it is also confirmed that highly effective control is performed even in the unexpected changes in temperature that appeared from 11 April.
Table 2.
Comparison of the thermal dissatisfaction by the controllers.
Table 3.
Comparison of the energy use values by the controllers.
When confirming the results of the study that conducted the simulation pilot test based on a similar model, the comfort level by use of the standard deviation of the PMV was improved by about 17.8%, but energy consumption was reduced by about 3.1% [33]. Simple thermal comfort was calculated from the control pattern in the direction of reducing energy consumption in a system without an adaptive module, and it was analyzed that the energy saving effect was small, but the constancy of the PPD value was relatively large. The imbalance between energy savings and control precision can be confirmed due to the relatively regular comfort fluctuations within the dead-band setting without an adaptation process according to external temperature conditions. The proposed ANN model in relation to these results can be applied to the capacity design of mechanical systems requiring simultaneous cooling and heating strategies in the middle of spring. This is because unnecessary overshooting can be alleviated and the mass and temperature of the supply air can be optimized at the same time.
However, in the case of the ANN model, in addition to the adjusted signal to reduce cooling and heating energy use, the overall efficiency was improved by modifying additional signals by the adaptive module for the thermostats. This suggests that the ANN algorithm may not take much cost and time to install auxiliary systems to complement existing systems, without having to exchange operational and management systems as a whole in weather conditions that have not been previously learned. The advantage of this method is that modules can be used without a separate converting process (of course, a process to standardize raw data is necessary) regardless of the control value, and it is easy to expand the number of modules as an increase in the number of control variables. These characteristics can be an advantage of increasing economic feasibility when applied to actual building thermal systems. Therefore, through the installation of a partial adaptation and an adjustment model, it will be possible to expand the sustainability of various thermal systems whose performance has gradually deteriorated.
5. Conclusions
This simulation study investigated which algorithm effectively responds when an unexpected temperature change occurs in an intermediate period. The results were analyzed by dividing each algorithm into two factors which determine how effectively it suppresses indoor thermal dissatisfaction and energy use. As indicated in the figures and tables, the proposed controller successfully improved the constancy of the thermal comfort by 72.1% and increased the energy efficiency by 18.8% more than the conventional thermostat model, respectively.
As a result, the ANN algorithm effectively suppressed the increase in indoor thermal dissatisfaction and energy use. In particular, even though precise controls were performed to maintain the constancy of indoor discomfort level, the energy use pattern was effective; additionally, even though the temperature change was unexpected, the overshoot suppression performance was stable. These characteristics are identified as some of the advantages of improving the sustainability of the old system by improving the performance of some modules, without replacing the old thermal system as a whole. However, assuming that a thermostat, a fuzzy inference system, and an artificial neural network control model are installed in a simplified theoretical building, the model tests the possibility of an adaptive model that adjusts the supply of air conditioning according to indoor comfort. For this reason, so much of the fluid dynamics using computational fluid dynamics for the infiltration and ventilation is excluded, which can be weaknesses in defining the model’s realistic performance. Accordingly, a follow-up study will be conducted to improve the control precision and statistical validation of the results by increasing the number of thermal factors, variables, and the corresponding parameters.
Funding
This work was supported by the National Research Foundation of Korea (NRF) grant funded by the Korean government (MSIT) (No. 2022R1F1A1073896).
Conflicts of Interest
The author declares no conflict of interest.
Nomenclature
| A | area of material(s) (m2) |
| Cv | specific heat capacity at constant volume (J/kg·K) |
| Cp | specific heat capacity at constant pressure (J/kg·K) |
| D | thickness of material(s) (m) |
| G | thermal conductance (W/K) |
| hin, hout | convection heat transfer coefficient inside, outside (W/m2·K) |
| k | thermal conductivity (W/m·K) |
| ṁht | mass flow-rate from system (kg/h) |
| ṁin | mass flow-rate inside room (kg/h) |
| ṁout | mass flow-rate outside room (kg/h) |
| mrm | mass flow-rate in room air (kg) |
| Qloss | heat loss by convection and transmission (J) |
| Qgain | heat gain by convection and transmission (J) |
| R | thermal resistance (K/W) |
| Tht | air temperature from heater (°C) |
| Tout | outdoor temperature (°C) |
| Trm | room temperature (°C) |
| Tset | set-point temperature (°C) |
| U | internal energy (J) |
| W | work (J) |
References
- Tan, W.; Liu, J.; Fang, F.; Chen, Y. Tuning of PID controllers for boiler-turbine units. ISA Trans. 2004, 43, 571–583. [Google Scholar] [CrossRef]
- Blasco, C.; Monreal, J.; Benítez, I.; Lluna, A. Modelling and PID Control of HVAC System According to Energy Efficiency and Comfort Criteria. Sustain. Energy Build. 2012, 12, 365–374. [Google Scholar]
- Kull, T.; Thalfeldt, M.; Kurnitski, J. PI Parameter Influence on Underfloor Heating Energy Consumption and Setpoint Tracking in nZEBs. Energies 2020, 13, 68. [Google Scholar] [CrossRef]
- WaTalib, R.; Nablim, N.; Choi, W. Optimization-Based Data-Enabled Modeling Technique for HVAC Systems Components. Buildings 2020, 10, 163. [Google Scholar] [CrossRef]
- Fazzolari, M.; Alcala, R.; Nojima, Y.; Ishibuchi, H.; Herrera, F. A Review of the Application of Multiobjective Evolutionary Fuzzy Systems: Current Status and Further Directions. Fuzzy Syst. 2013, 21, 45–65. [Google Scholar] [CrossRef]
- Alcalá, R.; Benitez, J.M.; Casillas, J.; Cordón, O.; Pérez, R. Fuzzy Control of HVAC Systems Optimized by Genetic Algorithms. Appl. Intell. 2003, 18, 155–177. [Google Scholar] [CrossRef]
- Moon, J.; Ahn, J. Improving sustainability of ever-changing building spaces affected by users’ fickle taste: A focus on human comfort and energy use. Energy Build. 2020, 208, 109662. [Google Scholar] [CrossRef]
- Paris, B.; Eynard, J.; Grieu, S.; Polit, M. Hybrid PID-fuzzy control scheme for managing energy resources in buildings. Appl. Soft. Comput. 2011, 11, 315–319. [Google Scholar] [CrossRef]
- Kerdan, I.; Galvez, D. Artificial neural network structure optimisation for accurately prediction of exergy, comfort and life cycle cost performance of a low energy building. Appl. Energy 2020, 280, 115862. [Google Scholar] [CrossRef]
- Koulani, C.; Hviid, C.; Terkildsen, S. Optimized Damper Control of Pressure and Airflow in Ventilation Systems. In Proceedings of the 10th Nordic Symposium on Building Physics, Lund, Sweden, 15–19 July 2014; Lund University: Lund, Sweden, 2014; pp. 822–829. [Google Scholar]
- Ozbalta, T.; Sezer, A.; Tildiz, Y. Improving Occupant Wellness in Commercial Office Buildings through Energy Conservation Retrofits. Buildings 2015, 5, 1171. [Google Scholar] [CrossRef]
- Ahn, J.; Cho, S.; Chung, D. Performance analysis of space heating smart control models for energy and control effectiveness in five different climate zones. Build. Environ. 2017, 115, 316–331. [Google Scholar] [CrossRef]
- Tomar, D.; Tomar, P.; Bhardwaj, A.; Sinha, G.R. Deep Learning Neural Network Prediction System Enhanced with Best Window Size in Sliding Window Algorithm for Predicting Domestic Power Consumption in a Residential Building. Comput. Intell. Neurosci. 2022, 2022, 1–14. [Google Scholar] [CrossRef] [PubMed]
- Ahn, J. Thermal Control Processes by Deterministic and Net-work-based Models for Energy Use and Control Accuracy in a Building Space. Processes 2021, 9, 385. [Google Scholar] [CrossRef]
- Yang, S.; Wan, M.P.; Ng, B.F.; Zhang, T.; Babu, S.; Zhang, Z.; Chen, W.; Dubey, S. A state-space thermal model incorporating humidity and thermal comfort for model predictive control in buildings. Energy Build. 2018, 170, 25–39. [Google Scholar] [CrossRef]
- Ren, Z.; Chen, D. Modelling study of the impact of thermal comfort criteria on housing energy use in Australia. Appl. Energy 2018, 210, 152–166. [Google Scholar] [CrossRef]
- Marquez, A.; Carmona, A.; Antomarioni, S. A Process to Implement an Artificial Neural Network and Association Rules Techniques to Improve Asset Performance and Energy Efficiency. Energies 2019, 12, 3454. [Google Scholar] [CrossRef]
- Huang, X.; Qu, C. Research on Indoor Thermal Comfort and Age of Air in Qilou Street Shop under Mechanical Ventilation Scheme: A Case Study of Nanning Traditional Block in Southern China. Sustainability 2021, 13, 4037. [Google Scholar] [CrossRef]
- Alnuaimi, A.; Natarajan, S. The Energy Cost of Cold Thermal Discomfort in the Global Southu. Buildings 2020, 10, 93. [Google Scholar] [CrossRef]
- Ahn, J.; Cho, S. Anti-logic or common sense that can hinder machine’s energy performance: Energy and comfort control models based on artificial intelligence responding to abnormal indoor environments. Appl. Energy 2017, 204. [Google Scholar] [CrossRef]
- Park, S.; Cho, S.; Ahn, J. Improving the quality of building spaces that are planned mainly on loads rather than residents: Human comfort and energy savings for warehouses. Energy Build. 2018, 178, 38–48. [Google Scholar] [CrossRef]
- Boukhelkhal, I.; Bourbia, F. Experimental Study on the Thermal Behavior of Exterior Coating Textures of Building in Hot and Arid Climates. Sustainability 2021, 13, 4175. [Google Scholar] [CrossRef]
- National Institute of Building Science. Space Types. Whole Building Design Guide. 2018. Available online: https://www.wbdg.org/space-types (accessed on 15 October 2022).
- Ahn, J. Development of Energy Performance Metrics for Airport Terminal Buildings using Multivariate Regression Modeling; North Carolina State University: Raleigh, NC, USA, 2016. [Google Scholar]
- Incropera, F.P.; DeWitt, D.P.; Bergman, T.L.; Lavine, A.S. Fundamentals of Heat and Mass Transfer; Wiley: New York, NY, USA, 2018; ES8-1-119-32042-5. [Google Scholar]
- Engineering Toolbox. Recommended Indoor Temperatures Summer and Winter. Engineering Toolbox. 2016. Available online: http://www.engineeringtoolbox.com (accessed on 15 October 2022).
- ASHRAE Standard 55-2004; ASHRAE. ASHRAE: Atlanta, GA, USA, 2004.
- Petković, D.; Protić, M.; Shamshirband, S.; Akib, S.; Raos, M.; Marković, D. Evaluation of the most influential parameters of heat load in district heating systems. Energy Build. 2015, 104, 264–274. [Google Scholar] [CrossRef]
- Ahn, J.; Cho, S.; Chung, D. Analysis of energy and control efficiencies of fuzzy logic and artificial neural network technologies in the heating energy supply system. Appl. Energy 2017, 190, 155. [Google Scholar] [CrossRef]
- Ahn, J. Abatement of the Increases in Cooling Energy Use during a Period of Intense Heat by a Network-Based Adaptive Controller. Sustainability 2021, 13, 1353. [Google Scholar] [CrossRef]
- Marasco, G.; Rosso, M.M.; Aiello, S.; Aloisio, A.; Cirrincione, G.; Chiaia, B.; Marano, G.C. Ground Penetrating Radar Fourier Pre-processing for Deep Learning Tunnel Defects’ Automated Classification. In Proceedings of the International Conference on Engineering Applications of Neural Networks, Chersonisos, Crete, Greece, 17–20 June 2022. [Google Scholar] [CrossRef]
- Rosso, M.M.; Cucuzza, R.; Marano, G.C.; Aloisio, A.; Cirrincione, G. Review on Deep Learning in Structural Health Monitoring. In Bridge Safety, Maintenance, Management 2022, Life-Cycle, Resilience and Sustainability; CRC Press: London, UK, 2022. [Google Scholar] [CrossRef]
- Ahn, J. Performance Analyses of Temperature Controls by a Network-Based Learning Controller for an Indoor Space in a Cold Area. Sustainability 2020, 12, 8515. [Google Scholar] [CrossRef]
Publisher’s Note: MDPI stays neutral with regard to jurisdictional claims in published maps and institutional affiliations. |
© 2022 by the author. Licensee MDPI, Basel, Switzerland. This article is an open access article distributed under the terms and conditions of the Creative Commons Attribution (CC BY) license (https://creativecommons.org/licenses/by/4.0/).