Article

An Improved Publicness Assessment Tool Based on a Combined Spatial Model: Case Study of Guangzhou, China

1
Guangzhou Urban Planning & Design Survey Research Institute, Guangzhou 510060, China
2
Guangdong Enterprise Key Laboratory for Urban Sensing, Monitoring and Early Warning, Guangzhou 510060, China
3
School of Architecture, South China University of Technology, Guangzhou 510000, China
4
SOSArchitecture Urban Design Studio, Hong Kong 999077, China
5
Department of Architecture, Shenzhen University, Shenzhen 518060, China
6
Faculty of Architecture, The University of Hong Kong, Hong Kong 999077, China
*
Author to whom correspondence should be addressed.
Sustainability 2022, 14(22), 14711; https://doi.org/10.3390/su142214711
Submission received: 16 September 2022 / Revised: 21 October 2022 / Accepted: 3 November 2022 / Published: 8 November 2022

Abstract

:
By 2021, the urbanization rate of China had reached as high as 64.72%. At the same time, the efficiency-driven urban planning paradigm had shifted to that of an efficiency-and-fairness intent. Fairness refers to the publicness of public open spaces (POS) as an indicator of an inclusive and fair city. The authors are interested in the measure of POS. However, few studies evaluated POS by effective assessment frameworks and tools. Based on this critique, the authors propose to integrate a qualitative assessment tool—the Star Model, with that of a quantitative assessment tool—the Space Syntax, for assessing publicness and enhancing the understanding of POS (streets and squares). There are two conclusions: (1) The combined use of the quantitative and qualitative tools provides accuracy and enables a comprehensive understanding of public spaces, namely, the mechanism of publicness—of both bottom-up POS and top-down POS. On the one hand, bottom-up POS is an outcome of the spatial system enabled by a networked structure of space. On the other, the publicness of top-down POS can be largely twisted by the government and urban designers rather than the residents. (2) This research has introduced an improved combined tool for the benefits of both policymakers and planners.

1. Introduction

Traditionally, urban public space is defined by its physical form containing “streets, parks, recreation areas and plazas”, and originated from the Greek “agora” and Roman “forum” [1]. As new forms of public space emerge, such as cafés, shopping malls, clubs, etc., urban planners have realized that the core principle of public space is rooted in its social functions—public spaces are accessible and inclusive to different groups of users, allowing differences, conflicts, and shared voices [2,3].
Public spaces play an important role in urban vitality, civil action, social cohesion and personal well-being [2,4,5]. However, their importance was disregarded for a long time, which led to the pessimistic opinion that public space provision has come to an end. By the 1990s, in the context of neoliberalism, a rising number of semi-public spaces were produced in the commercial complex, and with this trend came “the death of public spaces”, as was publicized and became the dominant attitude in American cities [6,7]. In China, similar progress has emerged since the 1994 taxation and housing reform were launched [8]. For 30 years or so, public anxiety sparked by “the end of public spaces”, “privatized public spaces” or “pseudo-public spaces” has been the order of the day [3]. Urban planners have realized that judging spatial publicness by a dual concept that classifies spaces into “public owned spaces” and “privately owned spaces” is no longer practical [9]. What is more realistic is to assess the social function of POS by the degree of publicness [3,4,10,11]. This revelation inspires urban researchers to search for quantitative assessment systems capable of measuring multiple dimensions by a pragmatically driven assessment framework to enable a decision support tool for urban planning [12].
Quantitative assessment of the vitality of POS has been studied from different perspectives, but studies on the evaluation of publicness are insufficient. Garau and Annunziata used Space Syntax and spatial analysis techniques to investigate the conditions that influence the vibrancy and urbanity of the built environment [13]. Ye et al. researched the relationship between publicness and urban morphology, and focused on the influence of block density and typology [14]. Carta et al. performed similar research, but used big data to enhance the survey method [15]. Qi et al. explored the visual features of urban street publicness in Nanjing [16]. Kim discussed the relationship between land use and urban vitality [17]. Instead of revealing only a single physical factor of the publicness of spaces, Liu et al. established a multi-factor framework for assessing street vitality by physical indicators such as land-use density, land use mix, length of street, intersection, sky view and green view [18]. However, these studies discussed POS from the perspective of the built environment while lacking a social perspective and holistic framework from both physical and social dimensions.
Within this context, this research aims to evaluate the publicness of POS holistically to fill the gap. A milestone in this field is the Space Syntax theory developed by Hiller [19]. It makes quantitatively measuring the accessibility of a space possible--where accessibility is a core element of publicness. Another notable research development is the Star Model by Varna [11], which uses five key elements of publicness to produce a multi-dimensional qualitative tool of the publicness of space. However, there is a lack of studies that hybridize the two models to better assess and explain publicness. This research has selected two cases (the Lychee Bay Park and Yaohua Neighborhood) from the older, inner city of Guangzhou to study the effectiveness of planning in producing public open spaces (POS) in traditional urban neighborhoods. We found that the study cases represent the practice of POS production in China and are akin to POS provision globally to a certain extent. Nevertheless, they differ in the details of the production process. The purposes of this research are three-fold: (1) to investigate how POS publicness varied at different dimensions and different spaces; (2) to identify those factors influencing publicness, and the mechanism of how POS are generated and produced, and (3) to examine the adaptability and accuracy of the combined (quantitative and qualitative) tool created by this research for POS design and planning.
This study contributes to public space studies in two ways. Methodologically, adopting a more accurate approach by integrating the Star Model and Space Syntax Model, to better understand the publicness of POS, presents a novel attempt to research the publicness of spaces at the geographical level by means of a multi-dimensional evaluation system. Theoretically, the combined tool helps better explain the publicness of space based on both the physical environment and social interaction. Practically, this study provides some policy suggestions and a pragmatic tool for those cities globally in search of a people-oriented public space planning and operating mode.

2. Literature Review

2.1. Publicness and Its Assessment

Publicness is one of the substantial attributes of POS. The concept of publicness involves the definition of public (versus private). The topic has been discussed for a long time in the realm of urban planning, architecture, politics, philosophy and related social disciplines. Each discipline approaches POS in different ways and examines its publicness from different perspectives while sharing common characteristics. Political scientists, for example, focus on democratization and ownership [20,21,22]; anthropologists on the historical construction and subjective value of places [23]; sociologists on the deliberative democracy and political community [24,25]; geographers on the sense of place and “landlessness” [26,27]; architects on the making of architectural space for social and cultural activities [28]; and urban planners on the greenery, sustainability and accessibility of urban space [29,30,31]. In the recent decade, researchers have called for a more pragmatic assessment of publicness. Several attempts have been made to develop appropriate criteria to summarize the core values or dimensions of publicness. One type of assessment is the Diagram model. Using this approach, one can analyze the social elements of public spaces by a qualitative description and interpret the results by pictorial diagrams so that different public spaces can be compared intuitively. Some of the initial diagram models are the “spider” diagram of CABE used by the London government (2007) and the “cobweb” model of Van Melik, Van Aalst and Van Weesep [32]. The “spider” diagram is used with the organizing of workshops for residents and experts. In essence, many of the indicators are highly subjective. For example, the “you” indicator evaluates “how the space makes you feel”. The “cobweb” model analyzes the representation of “fear” and “fantasy” in two specific spaces—“secured” public space and “themed” public space—from the perspective of environmental psychology.
The following models are modified based on the “cobweb” model. Németh and Schmidt formulated 20 variables for assessing Manhattan Central in New York, each variable scored from 0 to 5 [4]. In 2011, they proposed a “tri-axial” model that consists of three core components: Ownership, Management, Uses/Users [33]. This is a highly conceptual model aiming at a robust assessment approach, allowing for bracketing one or more core indicators or dimensions. However, their research did not fully capture the complexity of publicness as they were looking at a limited sample of public places in the city of New York [11]. Additionally, in this model, two of the three dimensions focus on the “control” aspect by qualitative descriptors, while only the “Management” dimension has a scoring mechanism. Varna and Tiesdell interpreted five dimensions of publicness in their “Star Model” based on a rigorous review of available public space literature [11]. Each dimension incorporated one to several sub-items, while each sub-item is evaluated by a subjective score (0 to 5). Notably, in this model, the “Physical Configuration” dimension was added, which denotes spatial accessibility that activates usage. The indicators in the “Star” model are for universal coverage. For instance, when evaluating to what degree spaces provide opportunities for active engagement and discovery, the “Cobweb” model assessed it by the coverage of a pavement café, while the “Star” model assessed it by active frontage, seating location, and “loose” spaces.
As privately owned public spaces emerged, the critiques grew of the diagram models directed at flagship and Anglo-American cities. The “OMAI” model by Langstraat and Van Melik (2013) closely resembled the Star Model, but added a “consequences” dimension for the study of European cases [26]. However, this also meant that the model could not be used in the planning stage of public space. Mehta (2014) constructed the “public space index” and applied it in Padang, Indonesia [34]. The “public space index” has 45 indicators and different weightings assigned to various indicators. Next is the “six-axial” model by Mantey (2017), designed especially for suburban gathering places, particularly cafés, restaurants, etc. in Polish suburban environments [35]. In recent years, the research on POS evaluation has mainly focused on the quantitative research and evaluation of outdoor environmental qualities. Wojnarowska et al. constructed an index system to measure the environmental quality of public spaces from the perspective of urban design, including safety, comfort, accessibility, social and economic vitality, etc. [36]; Emad Mushtaha et al. used the Analytic Hierarchy Process (AHP) to develop a standardized hierarchy based on importance, and applied mathematical analysis to derive the overall livability level of open public spaces [37]. By means of fuzzy logic modeling, Ekdi and Çıracı evaluated and compared the publicness of public space in Istanbul. The authors argued that the value of this approach is that it is practical in simplifying and emphasizing the interdependent nature of the concept of publicity and its complexity [38]. The “fuzzy logic” model considers the interaction among different dimensions. It simulated human perception and their way of thinking toward the environment. Nevertheless, because of subjectivity, the assessment result by this model yielded more uncertainty and became unrealistic when applied to real projects.
In the end, among the research on assessing publicness, a branch of researchers have shifted the focus to quantitatively measure individuals’ feelings of public space. Notably, a semantic differential (SD) research method in psychology was introduced. The SD technique is a method proposed by Osgood, Suci, and Tannenbaum in 1957 using language as a scale to measure psychological feelings [39], which can quantify abstract perceptions. In recent years, many quantitative studies of public space performance have been based on the SD method. For example, Perović et al. studied creative street regeneration in the context of socio-spatial sustainability by using the case of a traditional city center in Podgorica, Montenegro. The SD method was used to quantitatively evaluate people’s perception of street dynamism [40]. Herranz-Pascual et al. assessed changes in the acoustic environment resulting from the renovation of public spaces, including end-user questionnaires, sound measurements and recordings related to the soundscape. The study combined measurements of several acoustic variables, as well as psychosocial variables regarding soundscape perception and other dimensions [41]. The strength of this SD assessment is that it directly portrays the attitudes and satisfaction of the public, although it also means that it cannot be applied in the preliminary stage of urban planning and design.
In the recent two decades, the majority of models for publicness assessment were developed into two kinds of paradigms. The first type decomposes various dimensions of publicness based on the social functions and spatial features of POS. The second type measures people’s perception of POS. The first type can be applied before and after POS in operation, while the second type can only be applied after POS in operation (Table 1). Among the first type of assessment, the Star Model is the most popular evaluative model for assessing public space in urban design applications. Compared with other models, the Star Model has the advantage of wide coverage, detailed classification of sub-items, clear evaluation criteria and easy operation. The assessor can easily detect missing considerations when applied in real situations under different contexts.

2.2. Integrating Space Syntax with Publicness Assessment

Alongside the trend of making POS publicness measurable and quantifiable, Space Syntax is found to have new use when integrating with the traditional POS assessment tools [42,43]. Accessibility is the core element that patterns the movement of flows and aggregation of activities [44,45,46]. Space Syntax provides the mathematical measurement of accessibility. Initially, it measures psychologically cognitive accessibility based on the axial map, which calculates the topological distance. Then, the Segment Map method is introduced to Space Syntax, and metric distance can thus be considered. Space Syntax provides a new scope for analyzing the impact of spatial configuration on pedestrian walking and social activities. Traditionally, studies used Space Syntax to predict transportation flows and pedestrian flows. But large amounts of evidence has shown that higher integration, choice and connectivity result in a higher volume of walking flow [47,48,49,50]. Recently, empirical studies have demonstrated the positive relationship between spatial configuration and various forms of timespan and activities on site by using Space Syntax. For one, leisure walking, which is triggered more by urban environment quality and reflects urban vitality, has proven to be relative to syntactic variables [51]. Passive activities like resident outdoor gathering, office communication, playing sports and so on are also verified by syntactic variables [48,52]. Based on these newer studies, Space Syntax also can analyze those configurative factors that have direct impacts on the publicness of public spaces.
Increasingly, empirical research has suggested that Space Syntax can assess the “accessibility and social effects” of space but the publicness of POS does not totally depend on it. Thus, a combination of Space Syntax and other tools would be more reasonable in assessing publicness [43]. For instance, Shen and Karimi (2016) combined Space Syntax, POIs and social media data to identify urban function connectivity so as to identify the urban regions with a high level of publicness [42]. Remarkably, Varna and Damiano (2013) have introduced the concept of pairing Space Syntax with the Star Model for visualizing and better assessing the publicness of POS [53] (Figure 1). In this way, Space Syntax as a quantitative tool is hypothesized to compensate for the shortness of the Star Model. For instance, in the assessment of the physical configuration, the “centrality and connectedness” indicators proposed by the Star Model could be represented by “Integration” in the Space Syntax. “Visual permeability” and the “Thresholds and gateways” are both indicators that have a close relationship with syntactic variables in Space Syntax. While in the Star Model, these indicators are scored by observation and absolute scales, Space Syntax outperformed it by computer simulation. Conversely, the determination of social activities is complex and relates to more than just spatial configuration. Computer simulation, which can produce scientific prediction such as “negative correlation, non-linear correlation and no significant correlation” between spatial configuration and human behavior, is useful for the study of social activities, e.g., leisure walking [47,48,49,54].
Integrating Space Syntax with the traditional analytical framework of publicness for assessing the quality of POS has been verified to be a more scientific method. However, prior research has two shortages: (1) the concept has not yet been transformed into a practical tool for actual urban planning and urban design projects. Although there are few studies combining Space Syntax with the Star Model, these studies did not verify the assessment results with the actual use of POS. Meanwhile, there is a lack of evaluation studies on urban renewal. (2) The use of the tools has not achieved precision. They can only compare the overall situation of different cases, which limits their application to guiding spatial design. From this perspective, this research aims to improve the combined use of Space Syntax (which provides quantitative results) and Star Model (which considers non-configurative factors) in the publicness assessment of POS.

3. Methodology

3.1. Study Cases

3.1.1. POS Types and Trends

There are three stages of POS construction in Chinese cities after 1949, i.e., the establishment of the PRC. China implemented the planned economic system from the late 1940s to the late 1970s. Under this system, all POS are wholly constructed and financed by the government. During Chinese economic reform from the 1980s to the 1990s, the government adopted a strategy of redeveloping historical streets into themed commercial streets and POS. This resolved the otherwise financial burden for the government in providing new POS. However, critics noted that when it destroyed the functional configuration and structure of the historical block and architectures, it also demolished the local memory and, as a result, publicness of the POS.
Since 2000, more attention has been paid to the publicness connotation of POS in Chinese urban planning and urban design. Gradually, two types of POS are formed. One is the top-down POS, whose construction and maintenance are led by the government. Unlike the previous types of “Disney” POS or “themed” POS, these government-led POSs (after 2000) have focused more on maintaining and rebounding the relationship between place and people. Waterfront POS is a stereotype of top-down POS because a historic waterbody can always host the memory of multi-generations; for instance, the Singapore River. The local government established three quay reserves–Boat Quay, Clarke Quay, and Robertson Quay, each with its own culture and development themes (Figure 2). Another example is Suzhou Creek in Shanghai, China, which also adopted the architectural historian concept of “renovating with history.” Another is the bottom-up POS, whose construction and maintenance are led by residents. European neighborhoods are famous for this type of neighborhood as autonomous POS, mainly referring to those street settings that Jane Jacob referred to in her books.

3.1.2. Cases Selection

The Lychee Bay Park and Yaohua Neighborhood in Guangzhou are selected as study cases for the research (Table 2). Three principles are considered in the cases selection. Firstly, to a certain extent, the study cases should be the stereotypes of POS globally to improve the robustness of the new assessment model of publicness. The POS in both cases are mainly composed of street networks. Jane Jacob described the social activities on the streets as an “intricate ballet”, implicating that the publicness of streets counts [55]. Until today, streets continue to form the everyday environment for the residents, sustaining their existence is a key factor in making cities livable and lively [56]. For that, the street is a kind of POS with meaningful social connotation all over the world and meets the objective of the research of inventing a universal assessment tool. Secondly, the study cases should represent the POS in China, so as to offer a case supplementing existing studies focusing on the United States and European countries [11,32,35,40,41]. The production of POS in China is a particular type of urbanism intertwining neoliberal elements and authoritarian centralized control [57,58,59,60]. Additionally, POS in China are often associated with a multiplicity of social processes, except that the social aspect is sometimes overlooked. A growing number of research studies found that POS in China is a product of “state-market-society” forces [59]. In this sense, the Lychee Bay Park and Yaohua Neighborhood belong to the same typology. For Lychee Bay Park, the government is the main force behind the production. In 2009, as the single investor, the government completed the uncovering of the Lychee Waterway and installed a series of renovations of the nearby districts because of the 2010 Asian Games. Many residents were resettled in these processes, generating a variety of negotiations between the government and residents. As for the Yaohua Neighborhood, the community is the one driving the production of the POS. Since the 1990s, migrants working in the wholesale industry have been moving into the Yaohua Neighborhood. Despite this, the residents in the neighborhood have known each other through generations and the spatial configuration and community network have not changed much over time. Nevertheless, the government is a significant force as it leads the maintenance of the municipal infrastructure aiming at the reconstruction of the community identity. The market force is not explicit in the two cases, but it has motivated the government to publish a series of regulations and planning guidelines to incentivize commercial investments and projects. Thirdly, the selected two cases represent different modes of POS production in China. Lychee Bay Park represents the top-down mode led by the government, while the Yaohua Neighborhood represents the bottom-up mode led by residents. The assessment results of these two cases assist policymakers and urban planners in comparing different planning strategies.

3.2. Design of Research

3.2.1. The Overall Route

This research measures the publicness of POS by combining the qualitative (Star Model) and quantitative (Space Syntax) tools (the ‘combined tool’ in abbreviation). There are altogether four steps: (1) collecting manifested data of publicness from chosen sites, and interpreting it by means of behavior maps to reflect the pattern of actual use of the POS. Meanwhile, the actual data is used as a control group to test the research results; (2) obtaining the publicness rating—scored by the assessor at site visit–of these places against each of the five indicators in the Star Model, “ownership, control, civility, animation and spatial configuration”. Meanwhile, applying Space Syntax to measure the “spatial configuration”; (3) quantifying and normalizing different factors from the Star Model and Space Syntax analyses to form the combined tool assessment and obtain the results. At the end of this stage, through comparing the combined behavior maps and assessment results, the benefit of the combined tool shall thus be proven; (4) finally, extracting findings from the results by the “Star + Space Syntax” combined model.

3.2.2. Field Investigation

Field investigation was conducted from May to June 2020. The investigation adopted stratified sampling, with the observed street segments ranging from high, moderate to low integration/choice. The investigation lasted 10:00~12:00, 13:00~15:00, and 16:00~18:00 on weekdays and weekends; each period of observation at each location lasted 5 min. Because the two sites are adjacent to each other within a 15-min walking distance, the local residential population’s influence on social activities and intensity could be ignored in the overall equation. The intensity of the social activities has been recorded and sorted by 5 min intervals. Additionally, gender, age and types (passive, fleeting and enduring sociability, by Mehta, 2019 [2]) were also observed.

3.2.3. Space Syntax Assessment

Space syntax is a system explaining the morphology of architecture and urban space originated from biology [19]. Space Syntax theory has two core ideas: (1) Space is self-organized and ingrained, developed before function; (2) Space Syntax can map the interaction between spatial configurations and social activities.
In the Space Syntax theory, space is the sum of spatial relationships. The first step for Space Syntax modeling is defining the remapping relationship of geographical spaces. Secondly, a J-graph without coordinates and other attributes is outputted. The J-graph listed the angular degrees (or the angular depth, represents the inaccessibility) of a certain space (Figure 3 uses Space #a1 and Space #f as example) and all other spaces. Thirdly, by adding all the angular depths up, one can get the total angular depth, which is the core index that measures the inaccessibility of a space. Associated indices like Total Angular Depth, Mean Depth, Choice, Connectivity, Integration etc. are calculated for further simulation (detailed formula and derivation in Table A1 in Appendix A). An extent equal to the study area plus a buffer area is applied in the simulation to avoid the edge effect. The buffer area is 1.5 times the one of the study area (Figure 3). When it comes to the choice on topological mapping using the axial map and segment map, it is found that the Axial Map has two limitations: (1) it omits the geographical scale; (2) different segments of a street may have different spatial relationships; because in the Axial Map a street represents only one element, the error would be bigger for micro-scale analysis. On the other hand, the Segment Map makes improvement to these aspects by cutting a line into the segments and treating them as different elements. For this study, which engages the sites at a micro-scale, the Segment Map is thus preferable. For the Integration and Choice analysis of the streets in the two sites, only those streets within the 1000 m radius are included in the computation to simulate accessibility by walking in the public space. NAIN and NACH represent the centrality of a street/road segment or space deployed (Note that there is no difference between street and road in this study).

3.2.4. Star Model Assessment

(1)
Ownership: Ownership denotes the legal status of a place [12]. It can be rated by three aspects—ownership, function and use [61].
(2)
Control: Control indicates the managerial aspect of publicness by overt manipulations. For a more public place, rules aim at protecting people; while for a less public place, rules aim at prohibiting certain behaviors or groups to promote profitability or marketability [3,62].
(3)
Civility: Civility indicates the managerial aspect of publicness by implicit tactics. The key criterion of publicness is that a place is well cared for [63,64,65].
(4)
Animation: Animation is the design-oriented factor focusing on the microscale. It factors in design features that support passive and active engagement, discovery and display [2,66].
(5)
Physical Configuration: This is the micro aspect of spatial design that consists of Animation. It factors in centrality and connectedness, visual access, thresholds and gateways.
Table 3 is the scoring standard used when conducting an on-site investigation, modified by considering the cultural, political and climatic context of Guangzhou in this research.

3.2.5. The Combined Tool

In order to further verify that a combined tool is more efficient in assessing the publicness of open spaces, this research overlaps the Space Syntax Maps with the Star Model Dimension Maps to inform the assessment. The following described the process of the overlapped contributions of these two mappings. The values of the four Space Syntax Indices (NAIN, NACH, Isovist Area and Visual Integration) are normalized to Indices within 0~100 (Equation (1)), while spatial-related Star Model Indicators are evenly assigned to them in order to derive the final publicness score of spaces (Equation (2)). Simultaneously, using Arcmap 10.2, the NAIN and NACH values of the line value (value for streets or roads) can be assigned to the polygons (surrounding spaces) based on the principle of distance attenuation.
N o r m a l i z e d   V a l u e i = 100 m a x i m i n i × V a l u e i m i n i
where m a x i denotes the maximum value of i n d e x i , m i n i denotes the minimum value of i n d e x i .
P u b l i c n e s s   I n d e x = a v e r a g e   n o r m a l i z e d s p a c e   s y n t a x   i n d e x e s + n o r m a l i z e d spatial relatedStar   Model   indicators
where the four indices of Space Syntax equals, (1) NAIN (r = 1 km), (2) NACH (r = 1 km), (3) Isovist Area, and (4) Visual Integration.
Spatial-related Star Model Indicators are selected and localized from Table 3, based on actual use case investigation.

4. Results

4.1. Actual Use of POS

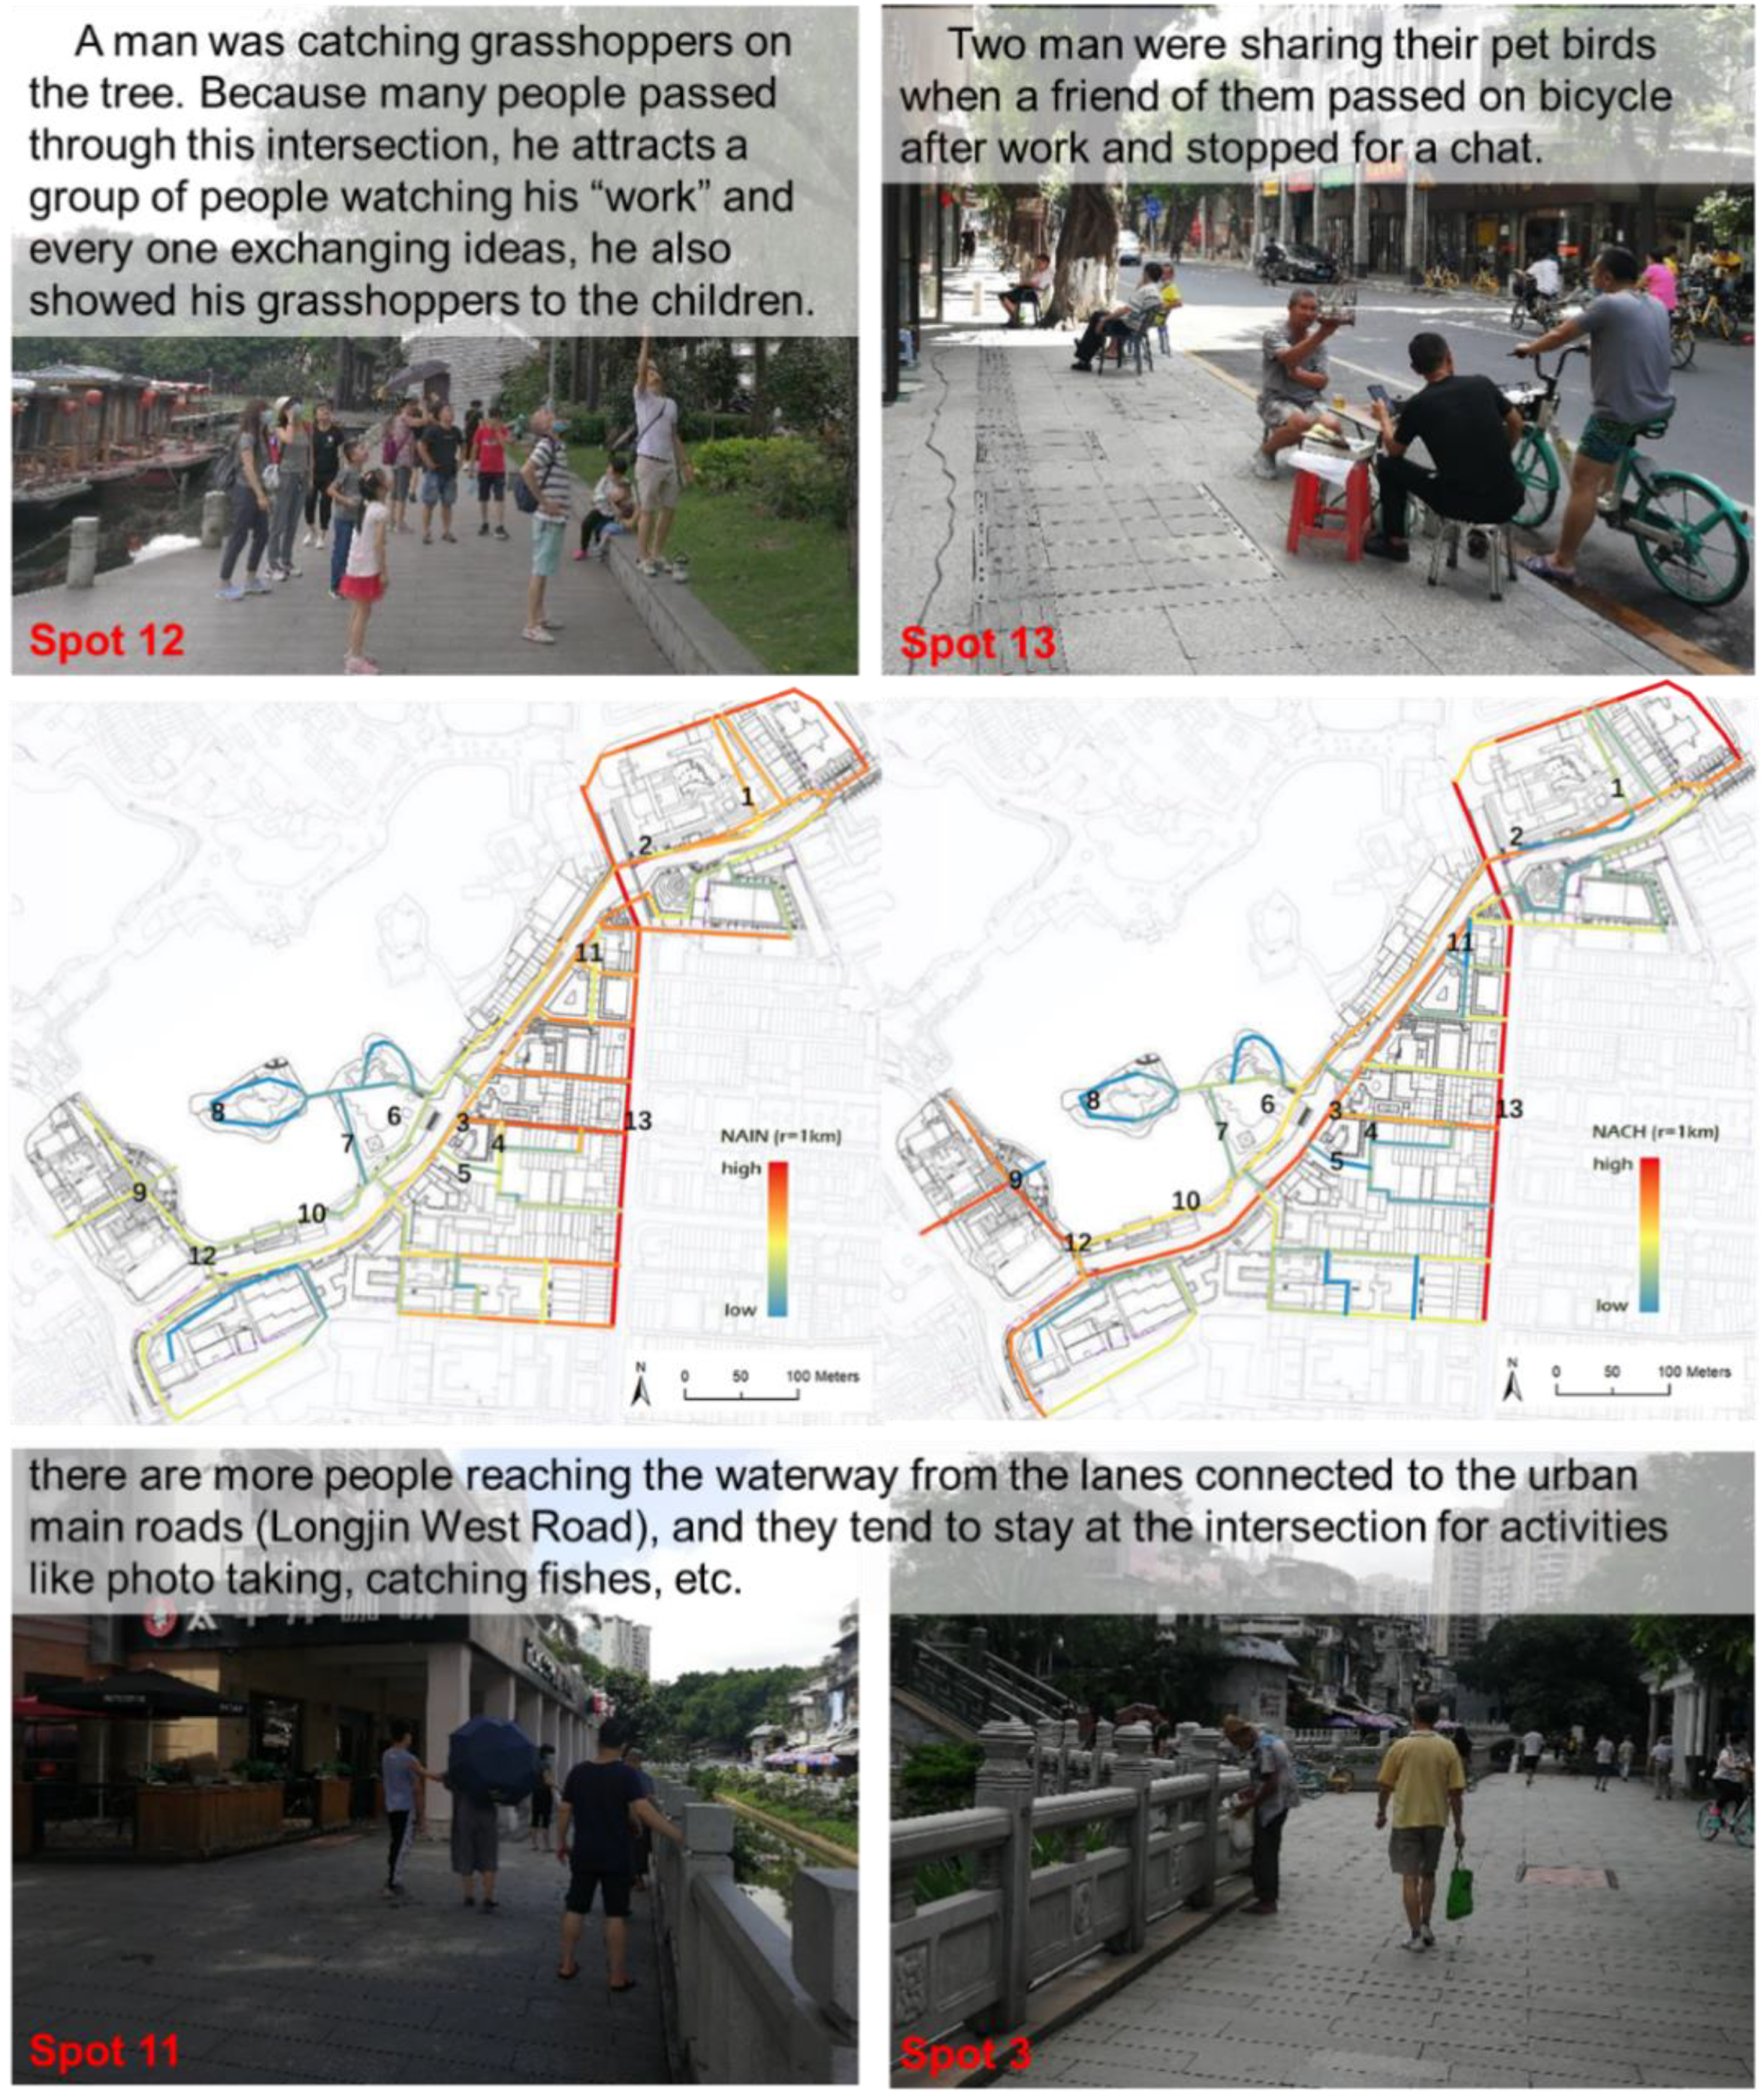
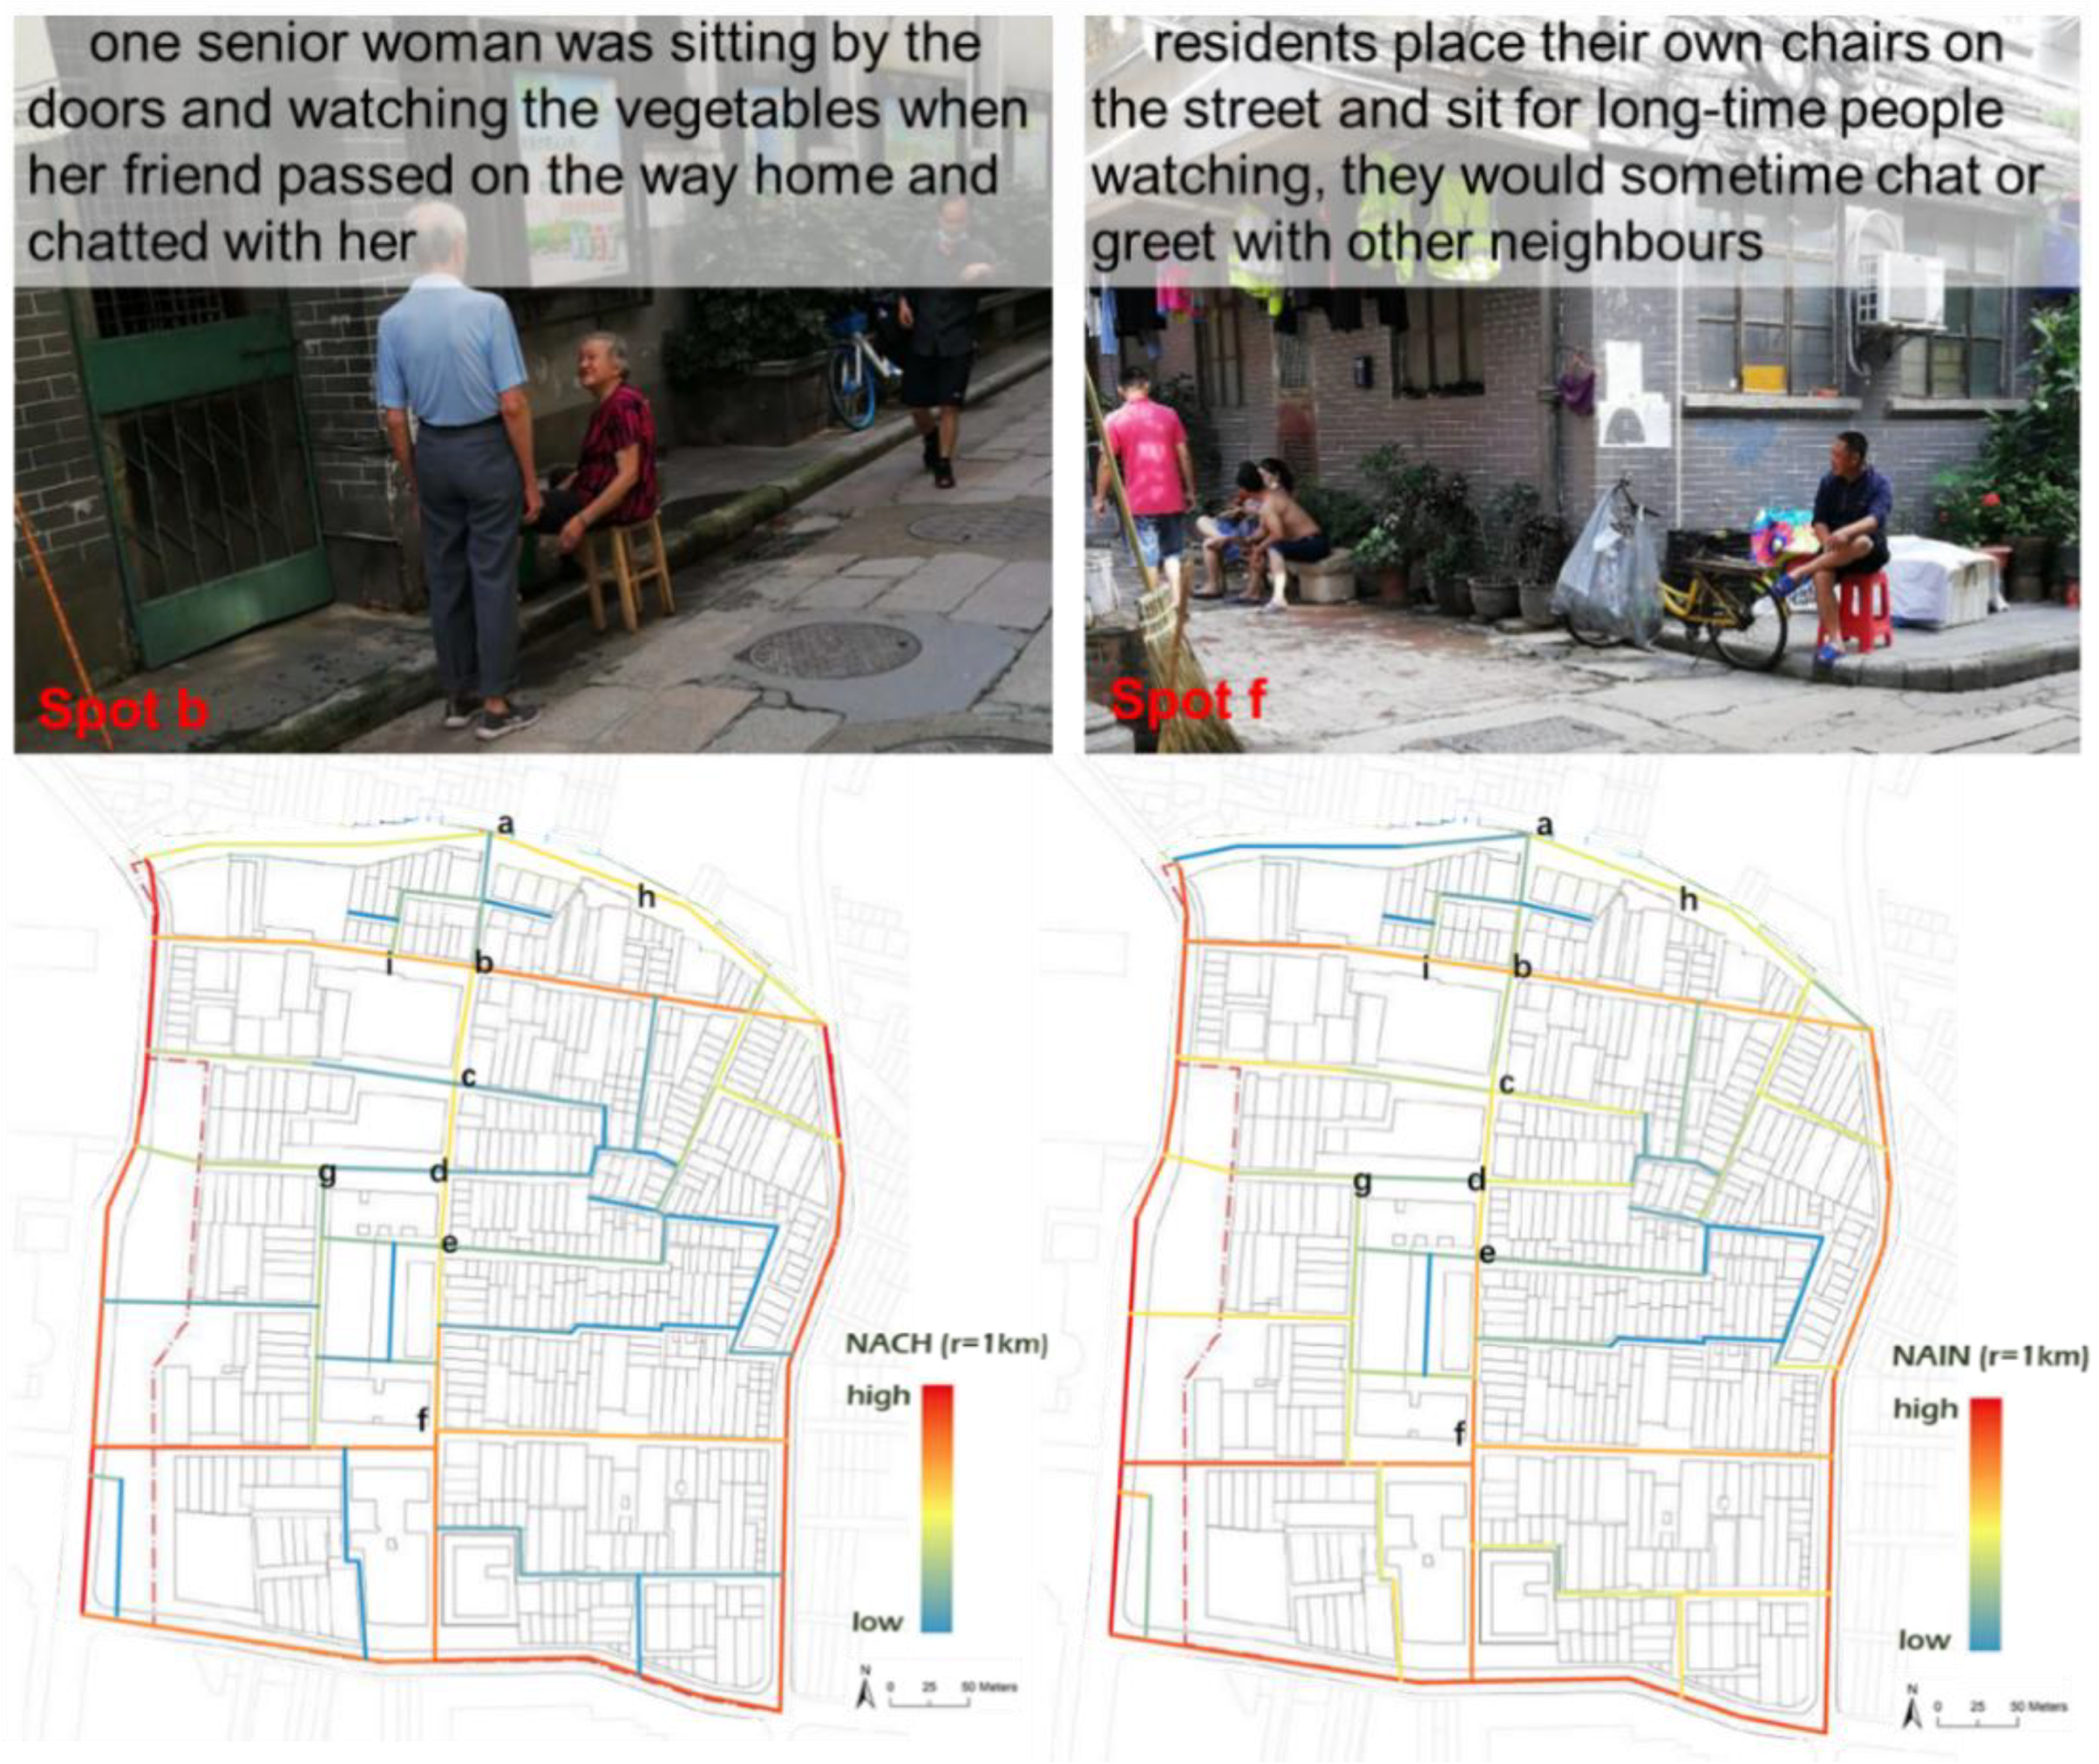
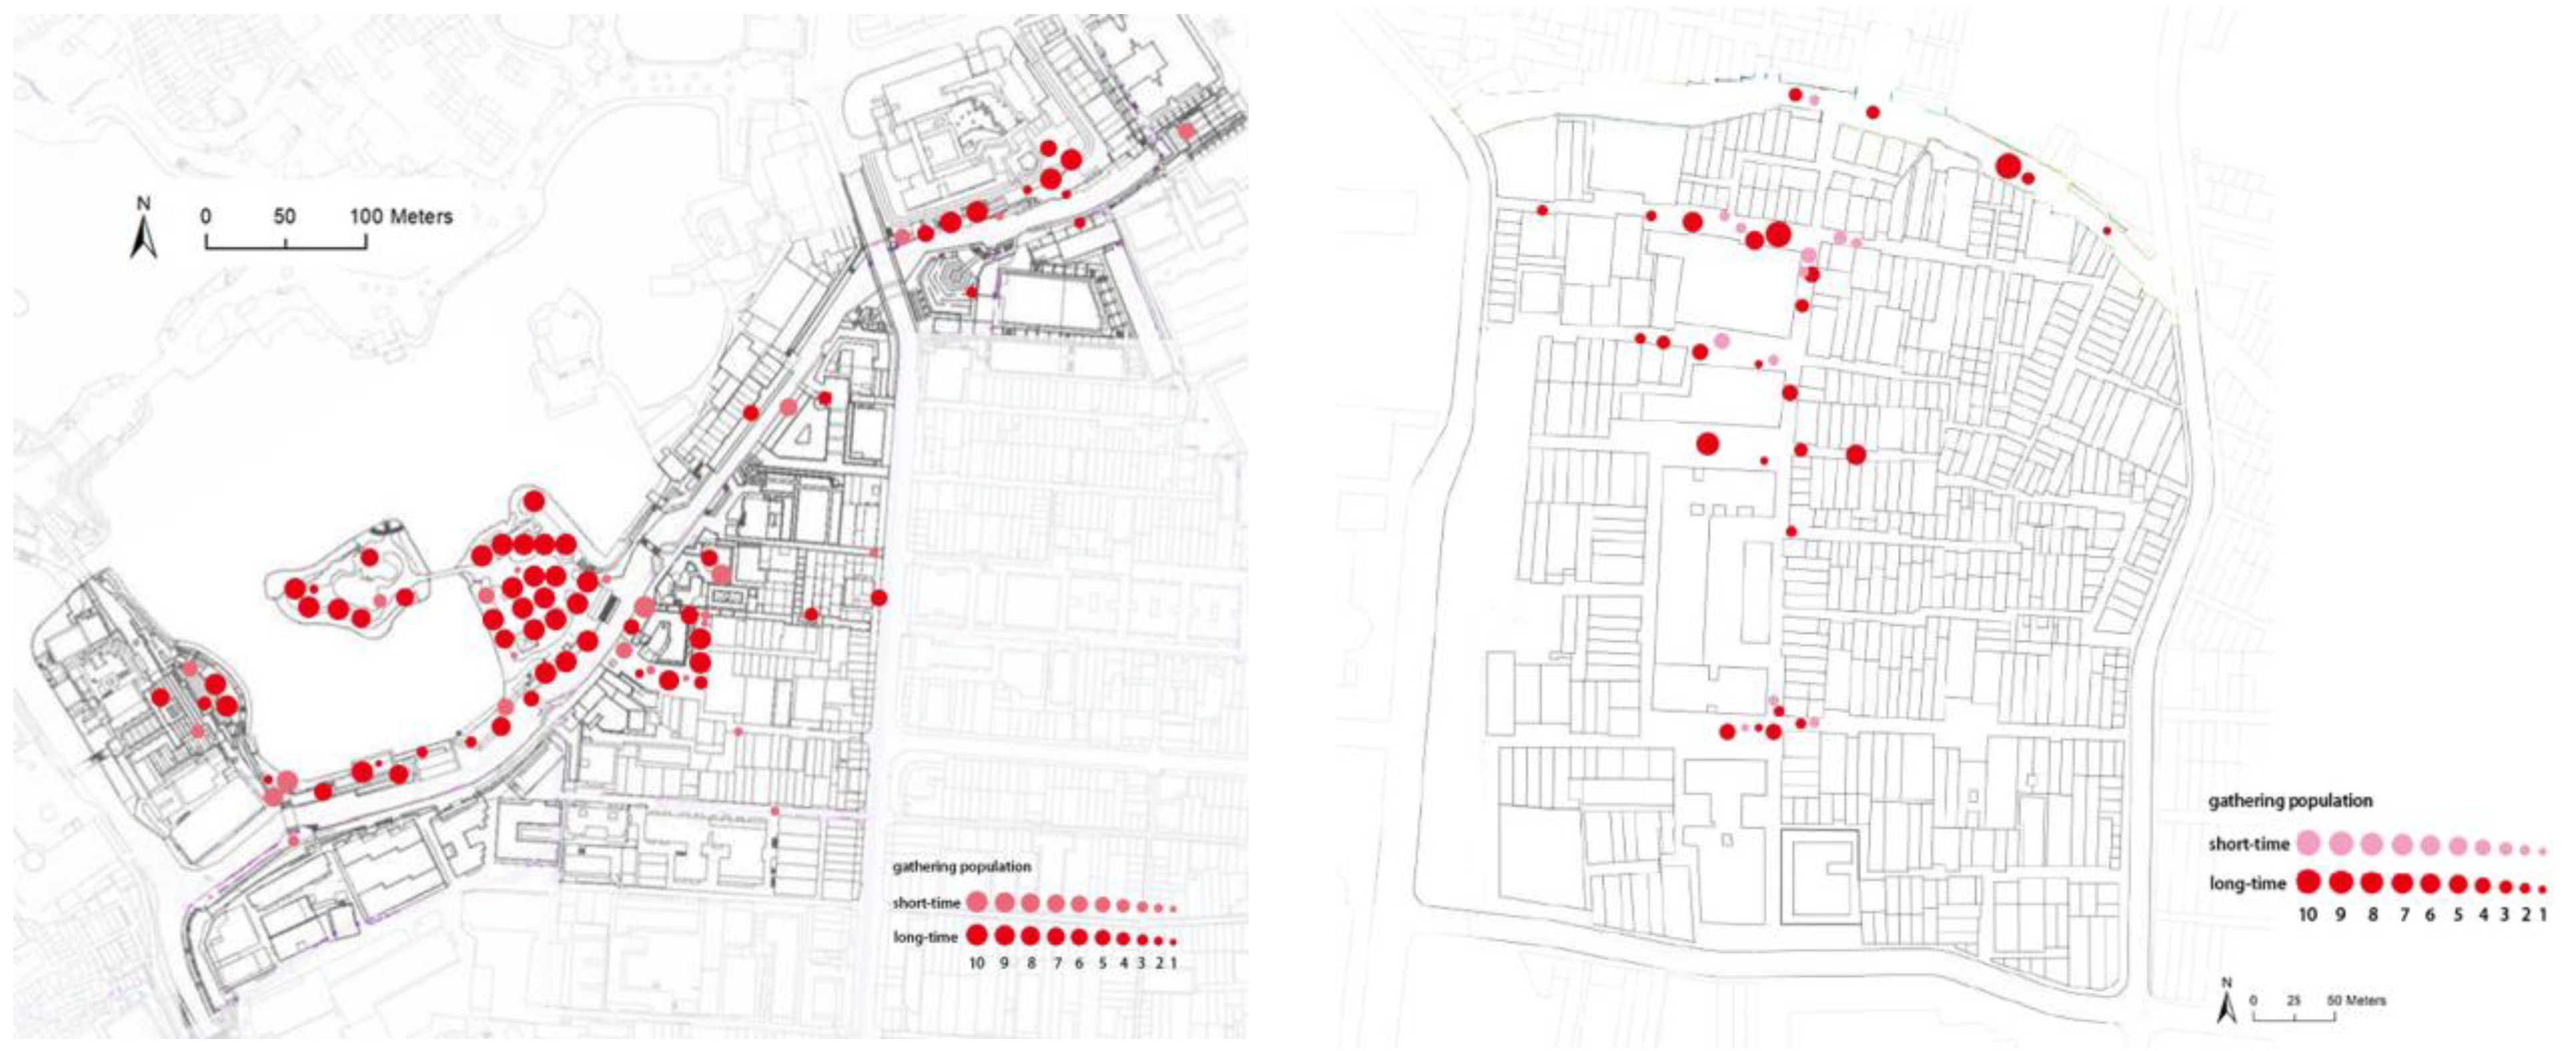
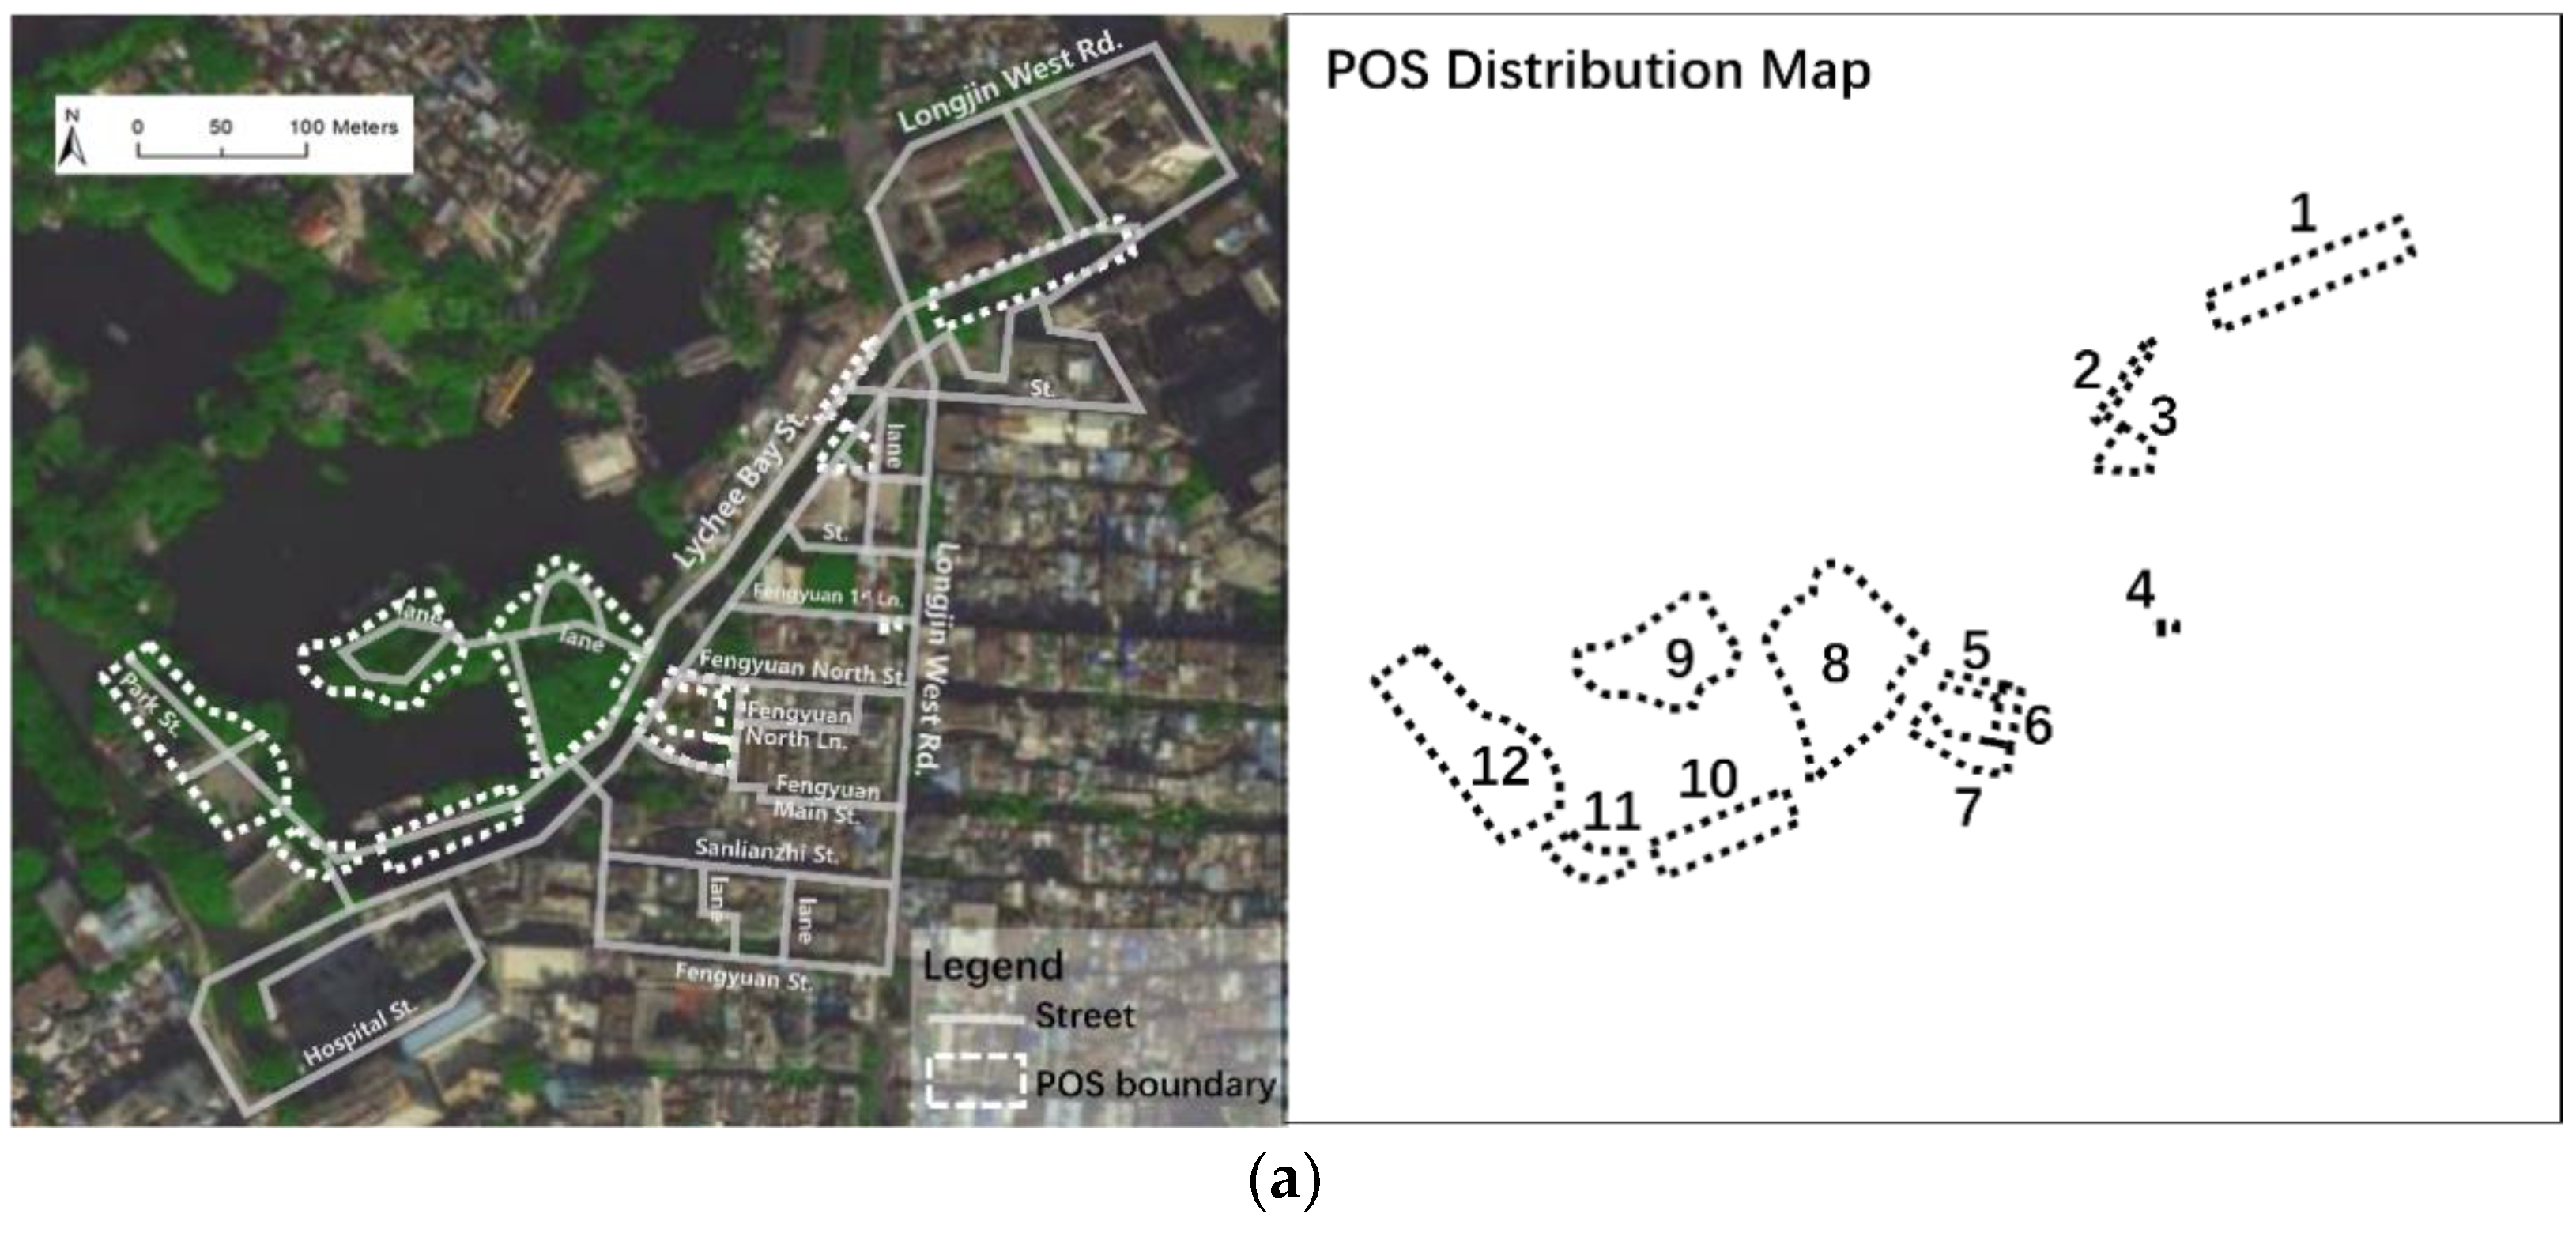
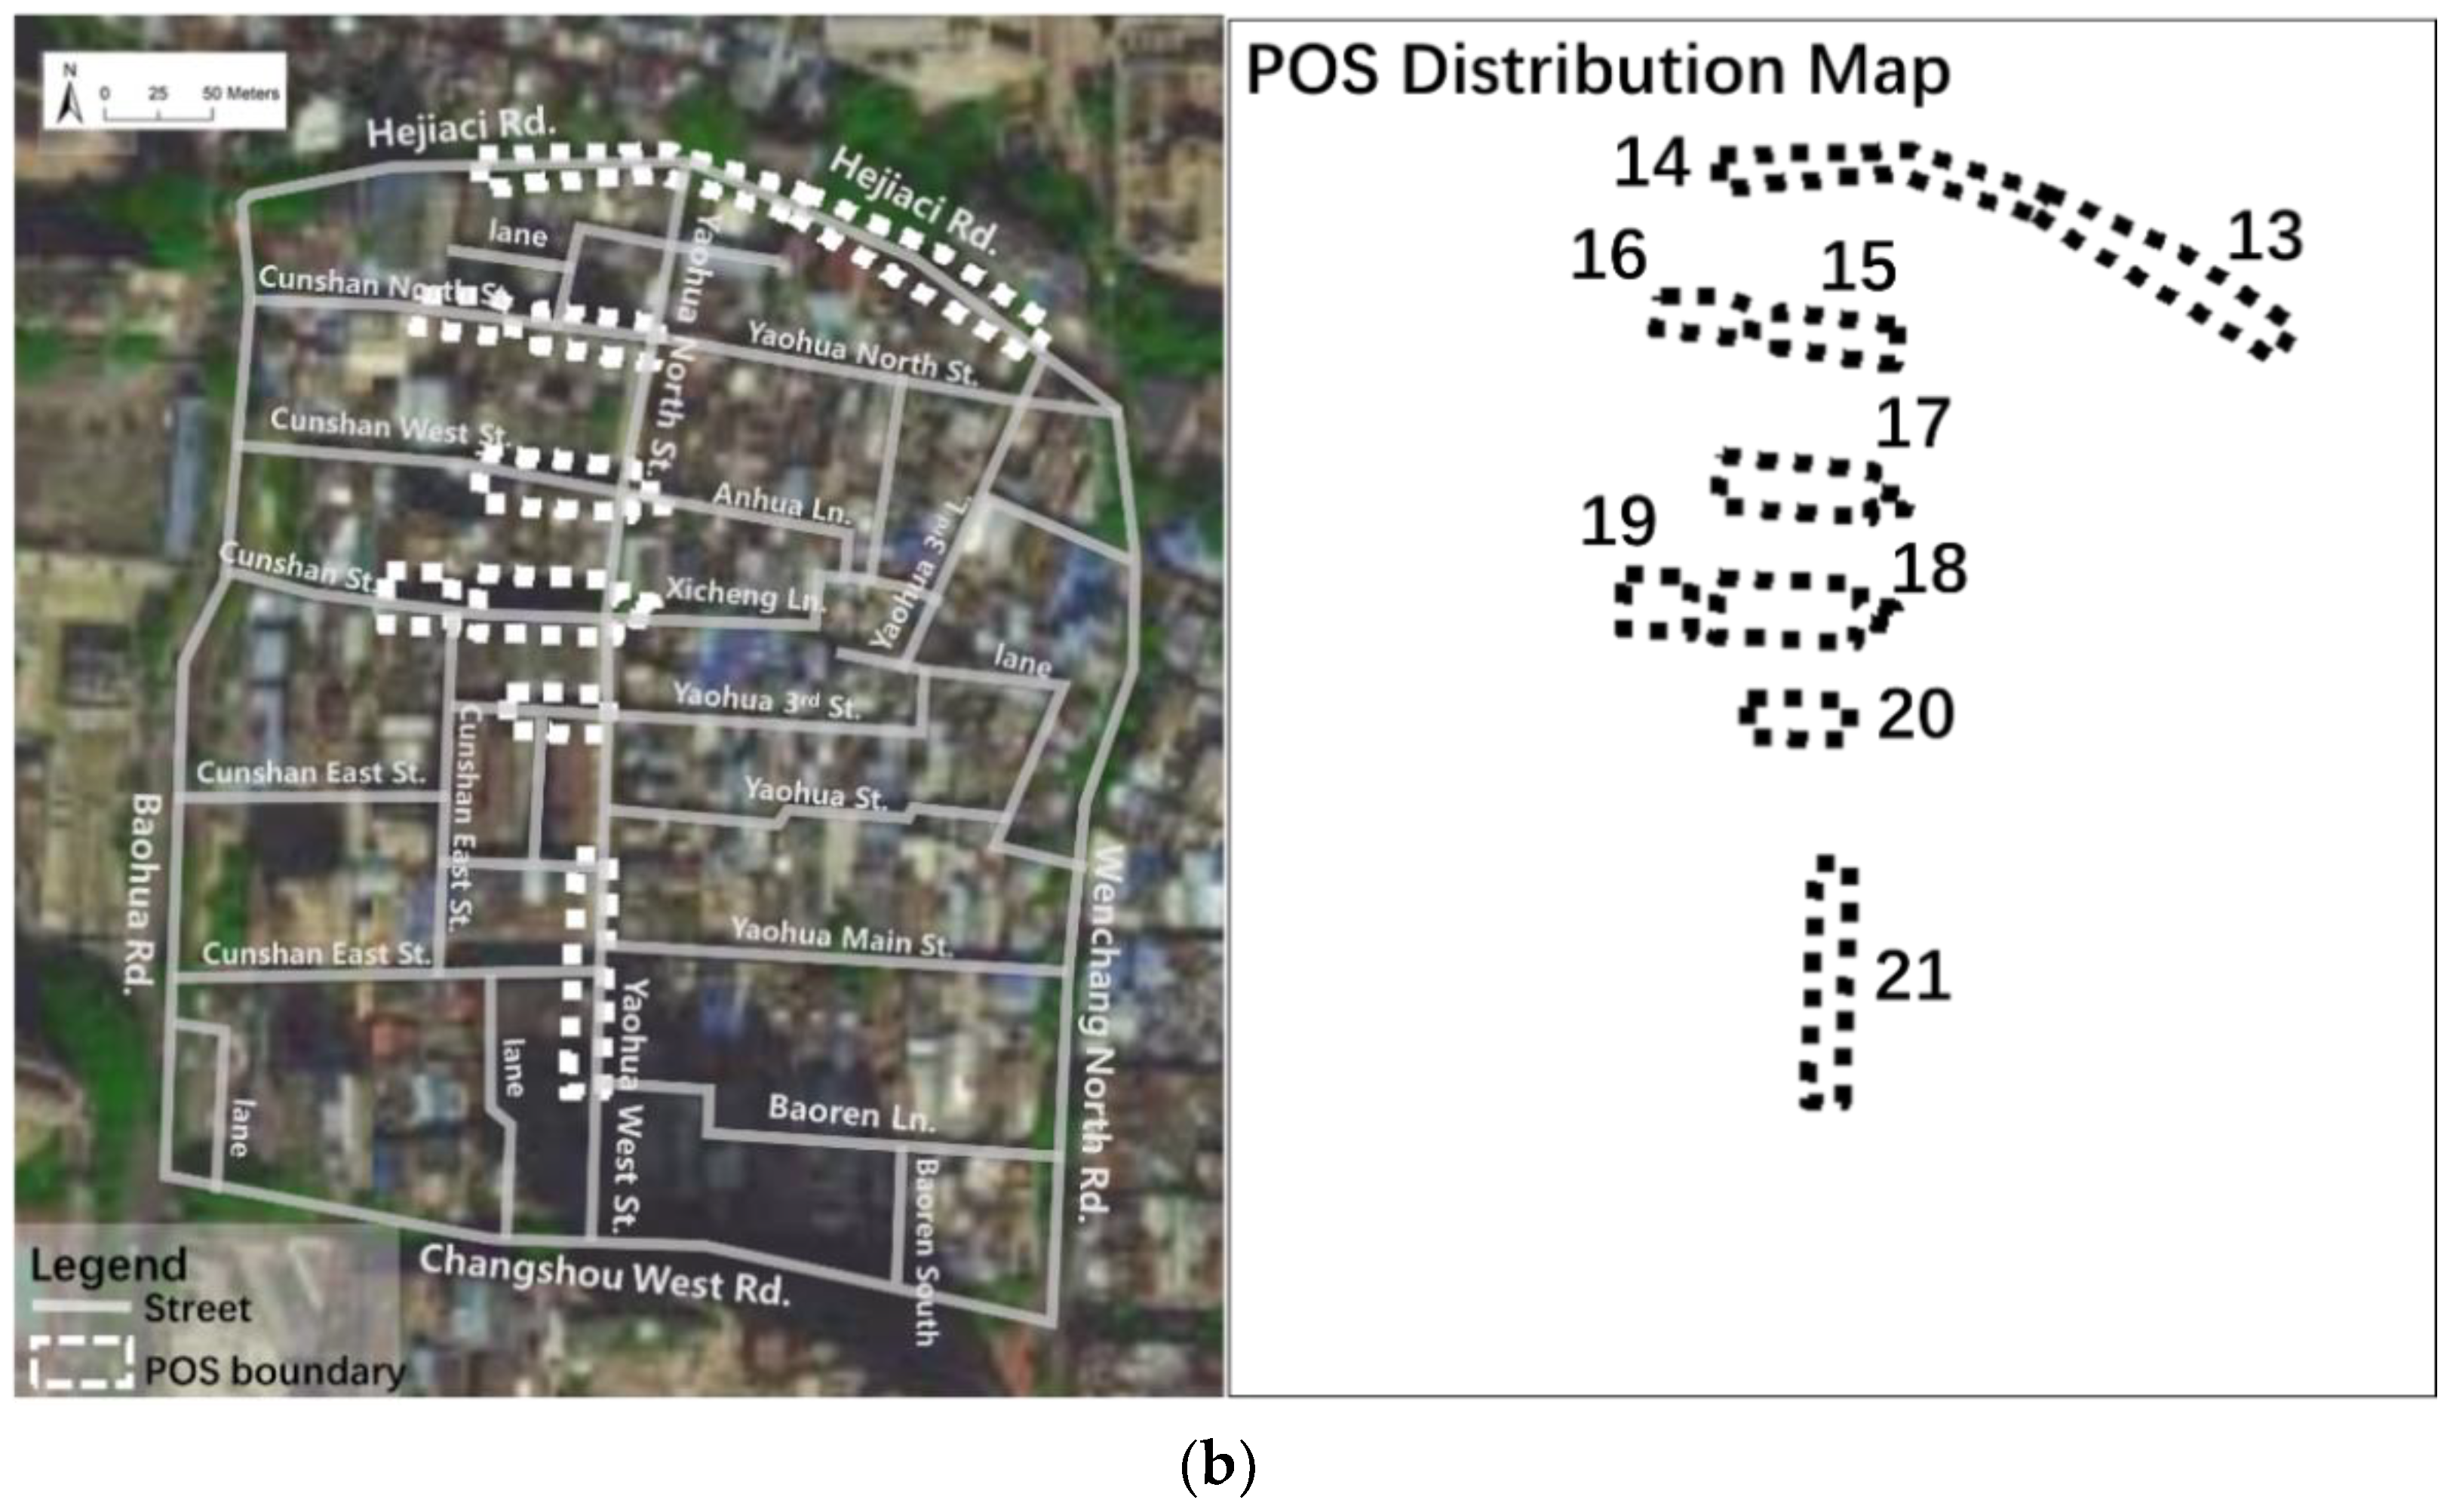
The actual use and condition of public space is assessed by long-time (>5 min) and short-time (<5 min) gathering of crowds. Figure 4 recorded the distribution pattern of average time spent by resident gathering at the two sites. At the Lychee Bay Park, residents mainly gather at the open squares (POS #8 in Figure 5a) and the sheltered passageways (POS #10 in Figure 5a), especially for long-time gathering. At the Yaohua Neighborhood, residents congregate along specific streets (POS #13~21 in Figure 5b). Whereas, short-time gatherings are common at intersections.

4.2. Assessing Publicness

4.2.1. Space Syntax-Results (Quantitative)

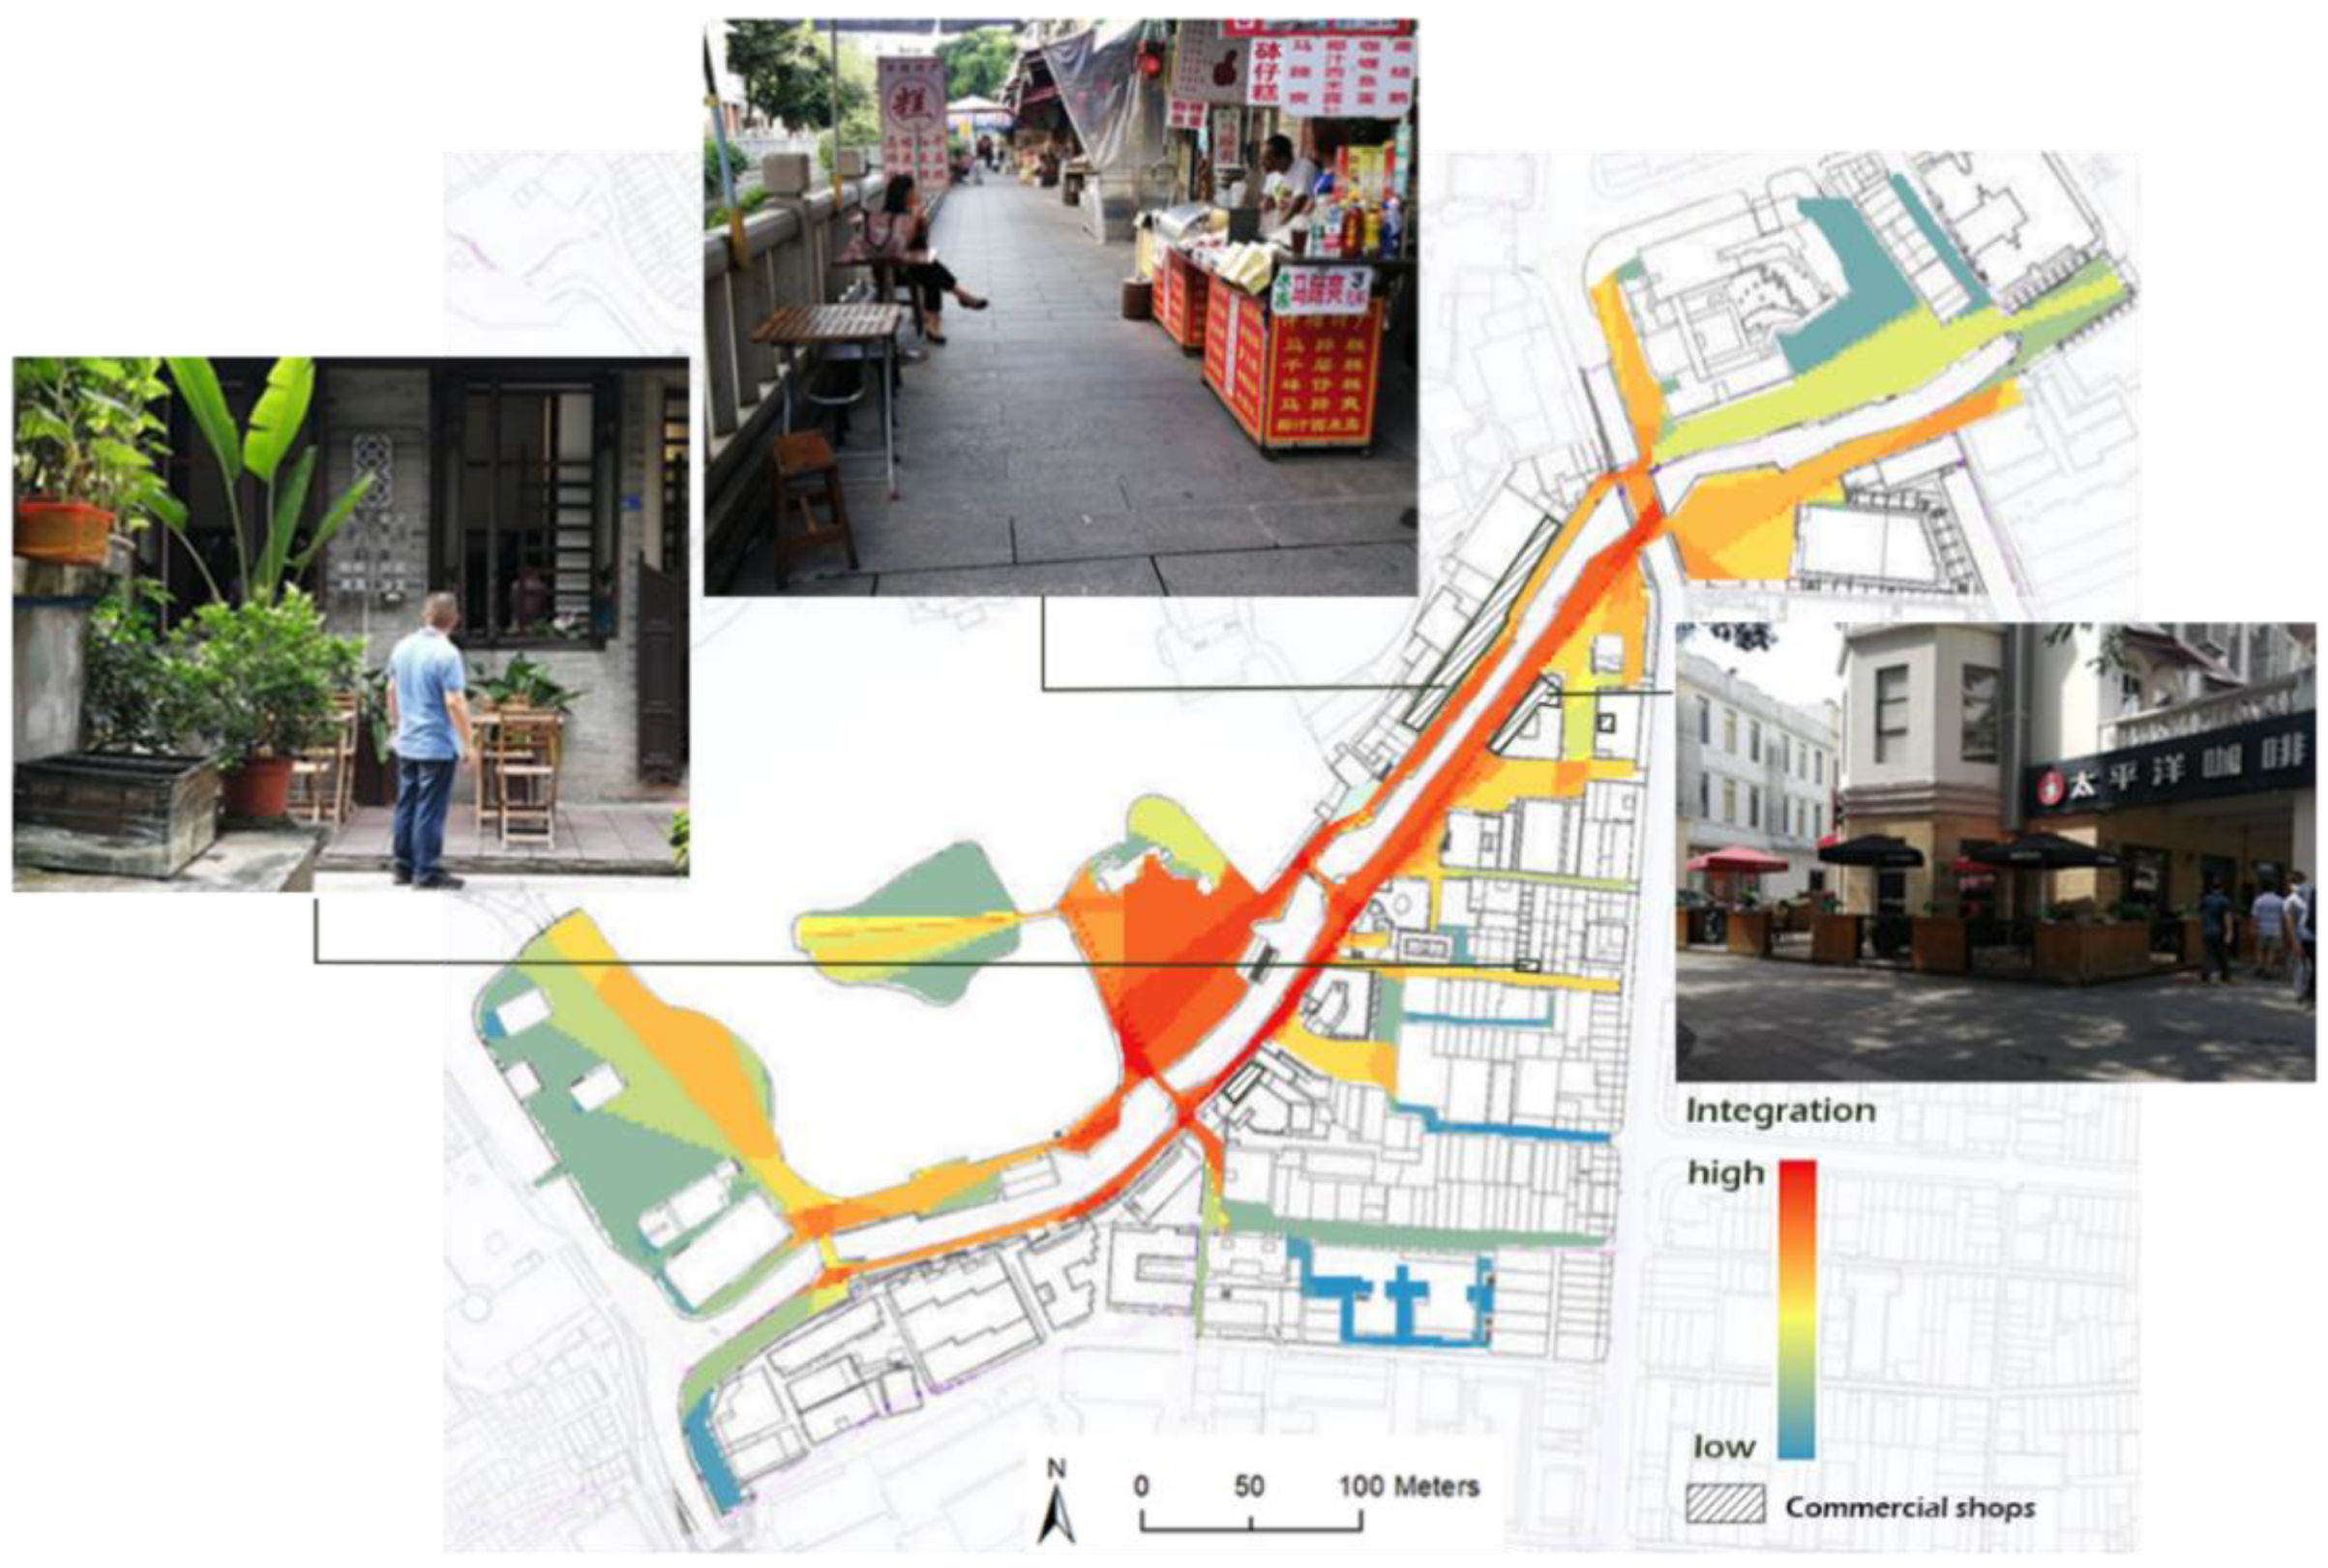
The segment map analysis (represented by NAIH and NACH) illustrates the accessibility of the space, which contributes to the publicness of the POS. Spaces with higher visual connections allow them to be discovered and correspond with accessibility psychologically (represented by Visual Integration). The Yaohua Neighborhood has higher average NAIN, NACH and Visual Integration than Lychee Bay Park. (Table 4) POS #1~4, POS #15~18 and POS #20~21 are the highest recorded NAIH and NACH. What they have in common is that they all intersect with the main street. The lowest NAIH and NACH are POS #8~12. Most of them are lanes with low accessibility. POS #2~3 along the waterway and POS #8, which is a big square, has the highest Visual Integration. POS #15~21 at the main street (The Yaohua West Street) is identified by simulation to be the highest Visual Integration (Figure 5 and Figure 6).

4.2.2. Star Model-Results (Qualitative)

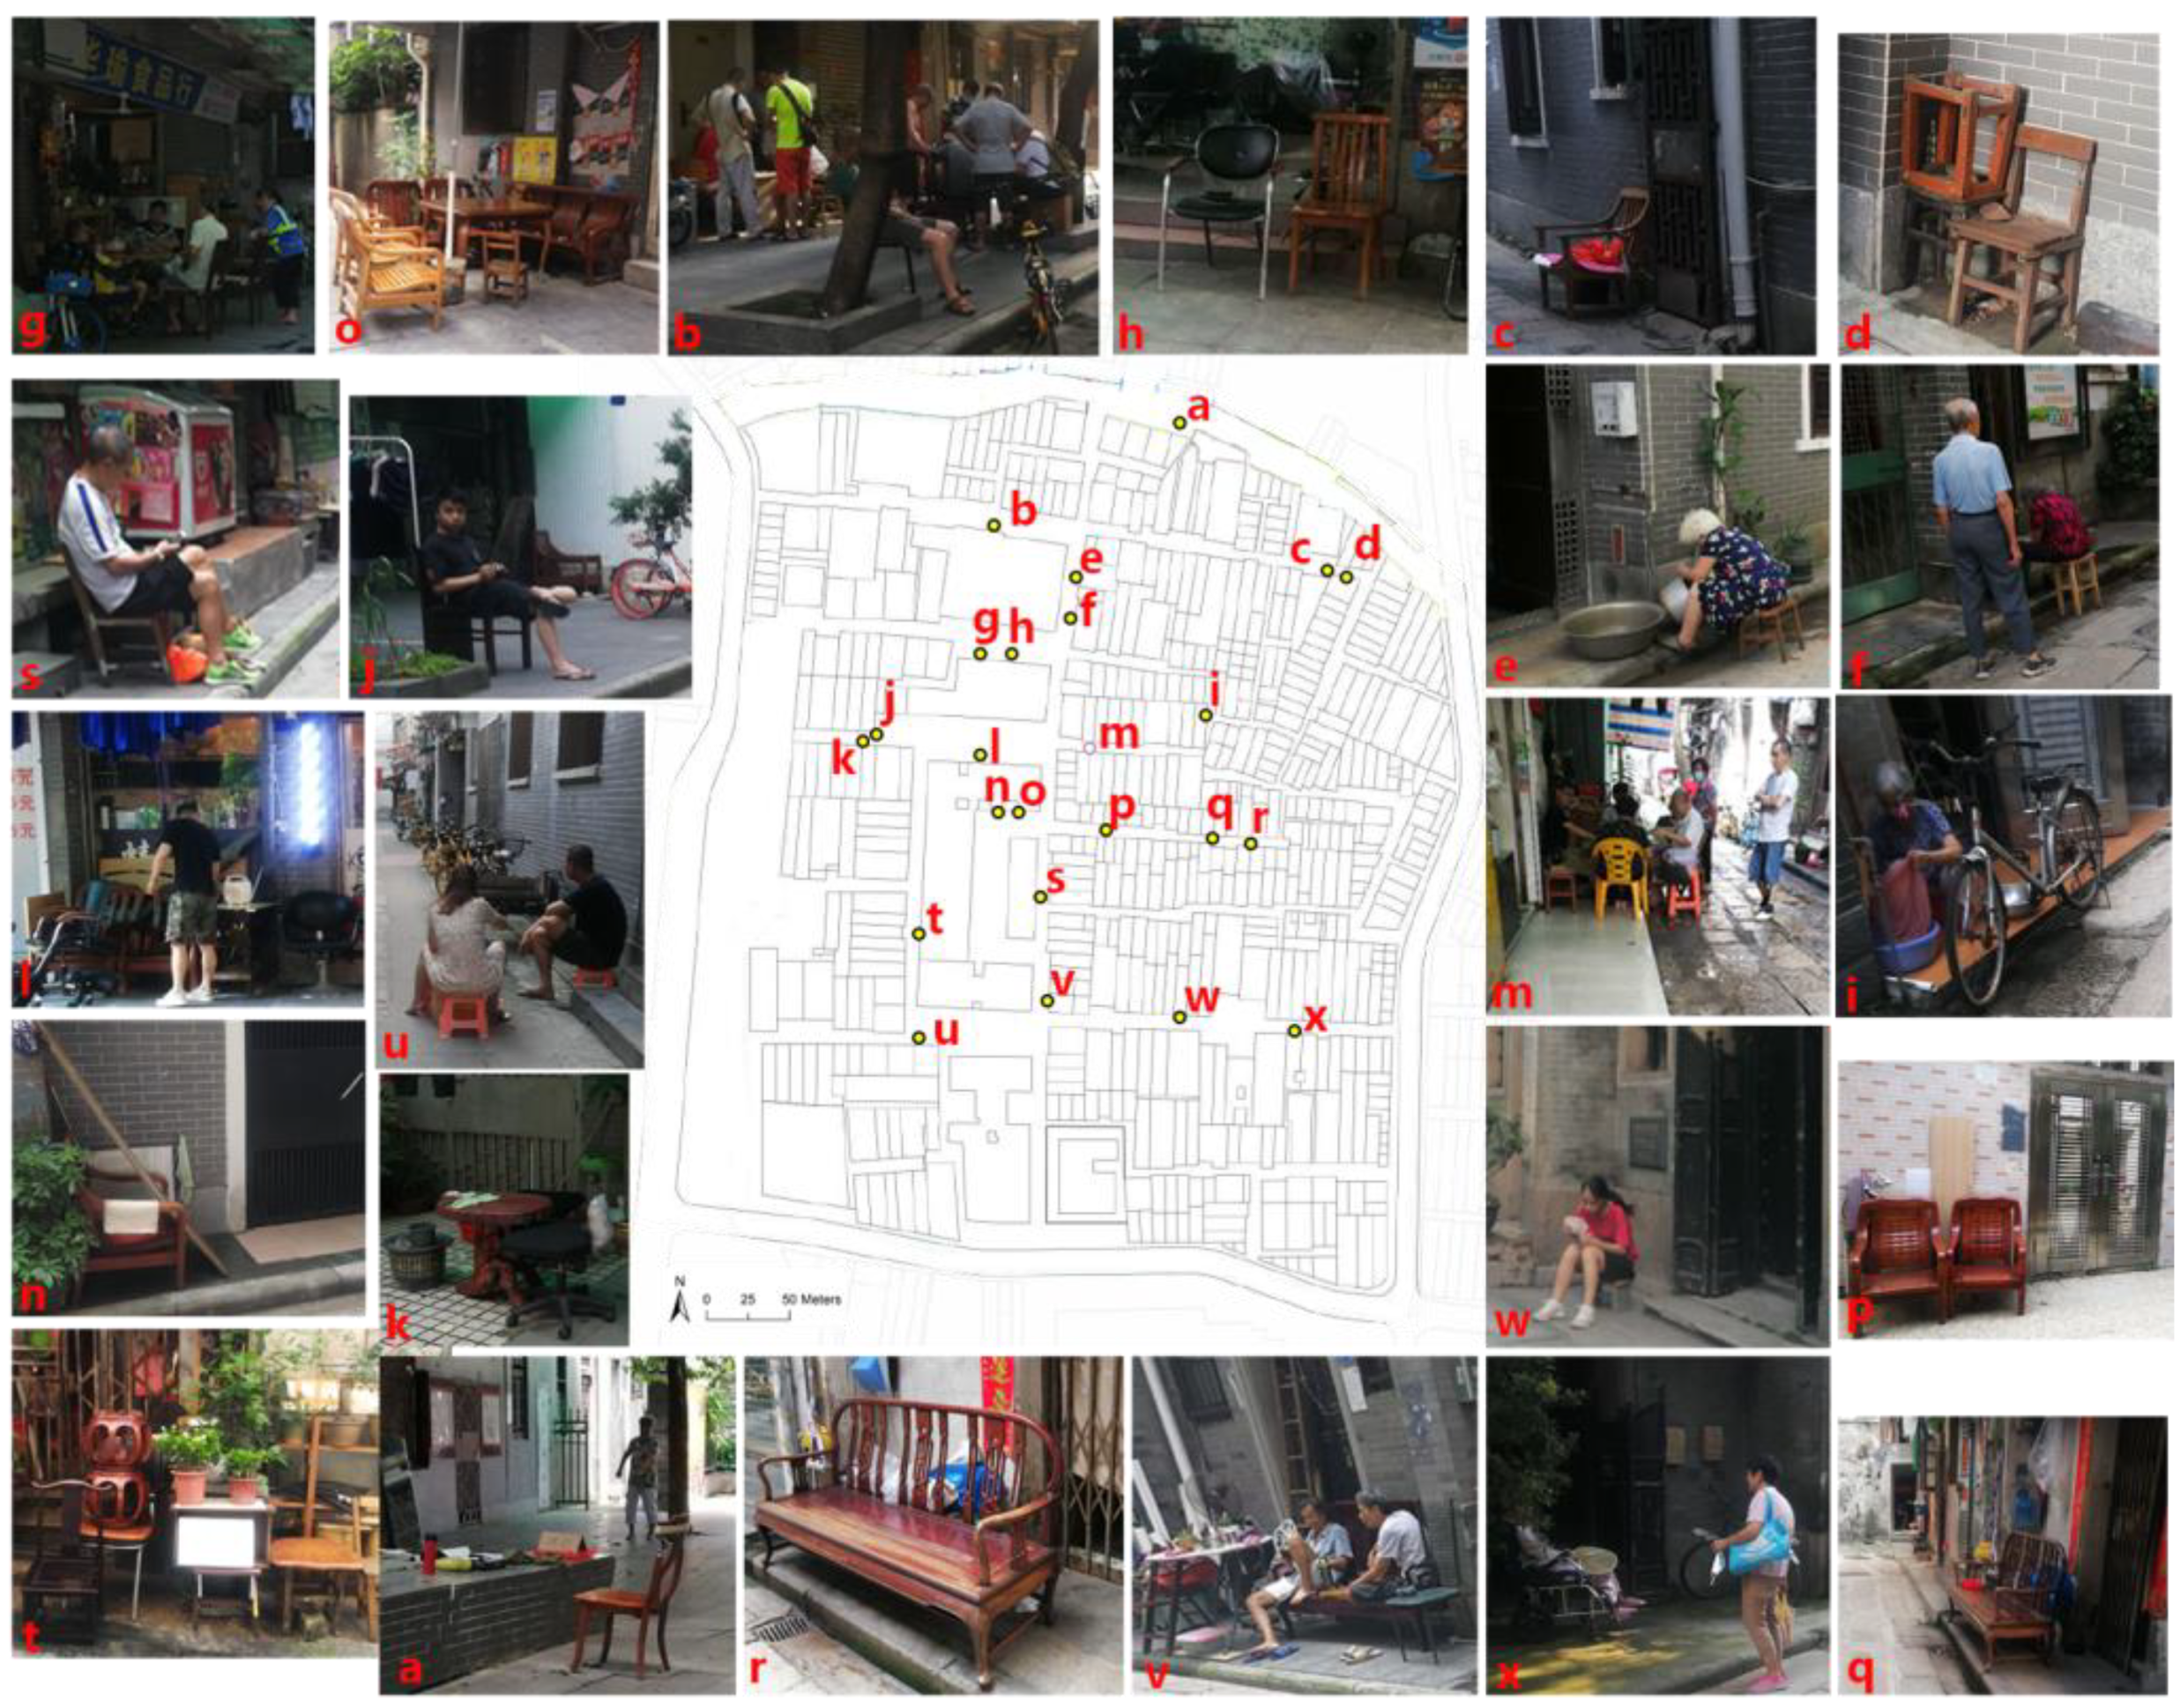
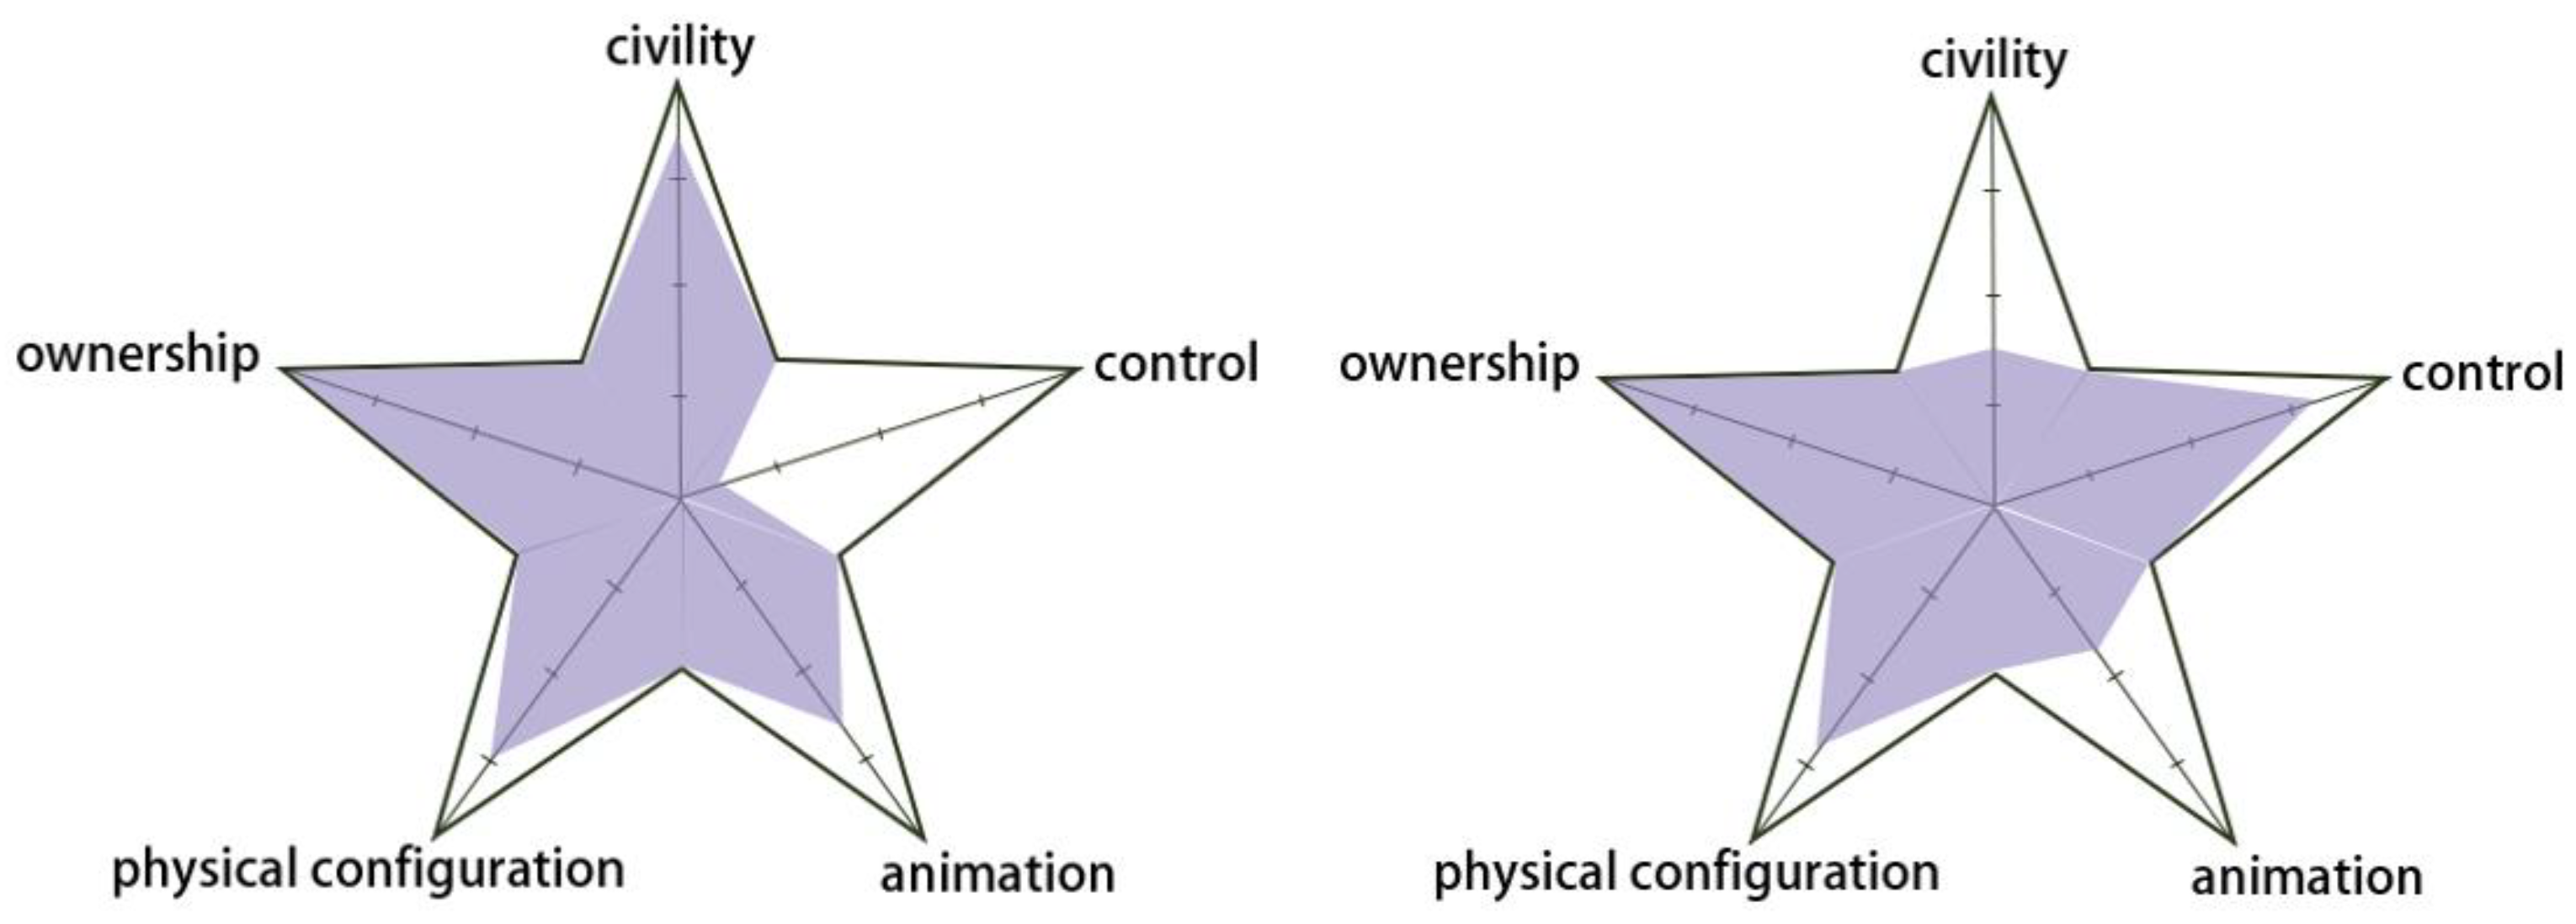
The total score assessed by Star Model is 3.5 for Lychee Bay Park and 3.2 (or 3.3) for the Yaohua Neighborhood (details of scoring in Table A2 in Appendix A). From Figure 7, Lychee Bay Park has a lower score in “Control” and the Yaohua Neighborhood is high in “Control”. The Lychee Bay Park is managed by the government and accessible to the people, while the outdoor spaces of the Yaohua Neighborhood are completely opened. However, in “Civility” and “Animation”, Lychee Bay Park has a higher score, whereas the Yaohua Neighborhood has a lower score. This is explained by the better maintenance of the Lychee Bay Park through arranged events and activities. The cleansing and maintenance in the Yaohua Neighborhood appear insufficient by comparison since it has little formal seating, although the residents create informal seating by themselves (Figure A8).

4.2.3. Results of the Combined Tool (Quantitative/Qualitative)

After analyzing and comparing the overall publicness of the two study cases from different dimensions, the research further selected 21 representative POS in the two study cases for a microscale assessment. A Composite Publicness Index is calculated for them (i.e., the integrated Space Syntax simulation and Star Model evaluation described in Equations (1) and (2) above). The total 21 main POS in the two cases are composed of 18 street spaces and 3 squares (Figure 5). Through on-site investigation, it is found that green and shelter are important indicators of POS in a sub-tropical city. For this localization reason, the Star Model score is calculated by seating intensity indicator and green ratio indicator. The results are shown in Table 5.

5. Discussions and Findings

5.1. Accurately Assessing Publicness Using the Combined Tool

Using the combined tool to assess the publicness of POS has an advantage in improving objectivity and accuracy. Firstly, by using Space Syntax to quantitatively evaluate the physical configuration dimension in the Star Model, the overall assessment results of the two cases are more objectively verified. Space Syntax, as a method expressing the cum relationship of space and the human perception of space, has been verified to measure spatial accessibility [53]. This research conducts both the original assessment method and the Space Syntax assessment method on the physical configuration aspect of the Star Model and compares the results. The original assessment refers to the subjective assessment of (5) Physical Configuration by “centrality and connectedness”, “visual access” and “thresholds and gateways” in Table 4. The results produced were genuine. Assessed by the original method, the score of the Lychee Bay area is higher than that of the Yaohua Neighborhood. When assessed by the Space Syntax, contrary results are produced (Table 4). This indicates that the original assessment of physical configuration when assessing the publicness of a space might be subjective and inaccurate. This is so because one could hardly numerate a physical configuration. As defined, physical configuration is “between a place’s macro-design—its relationship with its hinterland, including the routes into it and its connections with its surroundings [12]”. The specific criterion used in the field investigation is the “Centrality and connectedness, visual access and thresholds & gateways [11]”. This criterion is not tangible. Therefore, by replacing it by Space Syntax, the researcher can transfer it into a mathematical model and numerate the assessment result to make it more accurate.
Secondly, the combined tool (equations in Section 3.2.5) adopts the concept of integrating Space Syntax based on the framework of the Star Model but extends its scope of application from a mesoscopic scale to a micro scale. “Animation” assessed by green ratio, and seating and “physical configuration” assessed by Space Syntax are combined to evaluate the publicness of the POS. The results are verified to be more effective and accurate when compared with merely using the Star Model or Space Syntax (Figure 8). Because the score of the actual use (meaning the popularity of the POS) and three assessment models is not based on the same scoring system, the authors proposed that comparison between the actual use and the models should start from a tendency (curve) comparison; in other words, the relativity. Of the three, it could be seen that the tendency of the combined tool is nearly the same with that of the actual use, while the tendency of the Star Model shares less similarity with that of the actual use. The tendency of the Space Syntax is the most different to that of the actual use. In order to further estimate the accuracy of the combined tool and Star Model, the standard deviation of the difference between the actual use scoring and assessed scoring (the combined tool scoring and Star Model scoring, respectively) are calculated. The standard deviations are 0.1197 and 0.1613 of the combined tool and Star Model, respectively. The combined tool assessment result has better fitting with the actual use. Thus, the combined tool contributes by producing a more accurate level. Here the formula of standard deviation is i = 1 n x i x ¯ 2 n 1 , where x i is the value of the i th point in the data set, n is the sample size and the value of the i th point is the i th difference in the actual use scoring and combined tool scoring or the Star Model scoring. The lower standard deviation means the better the fit to the actual use of the assessment.

5.2. Mechanism of Publicness of POS

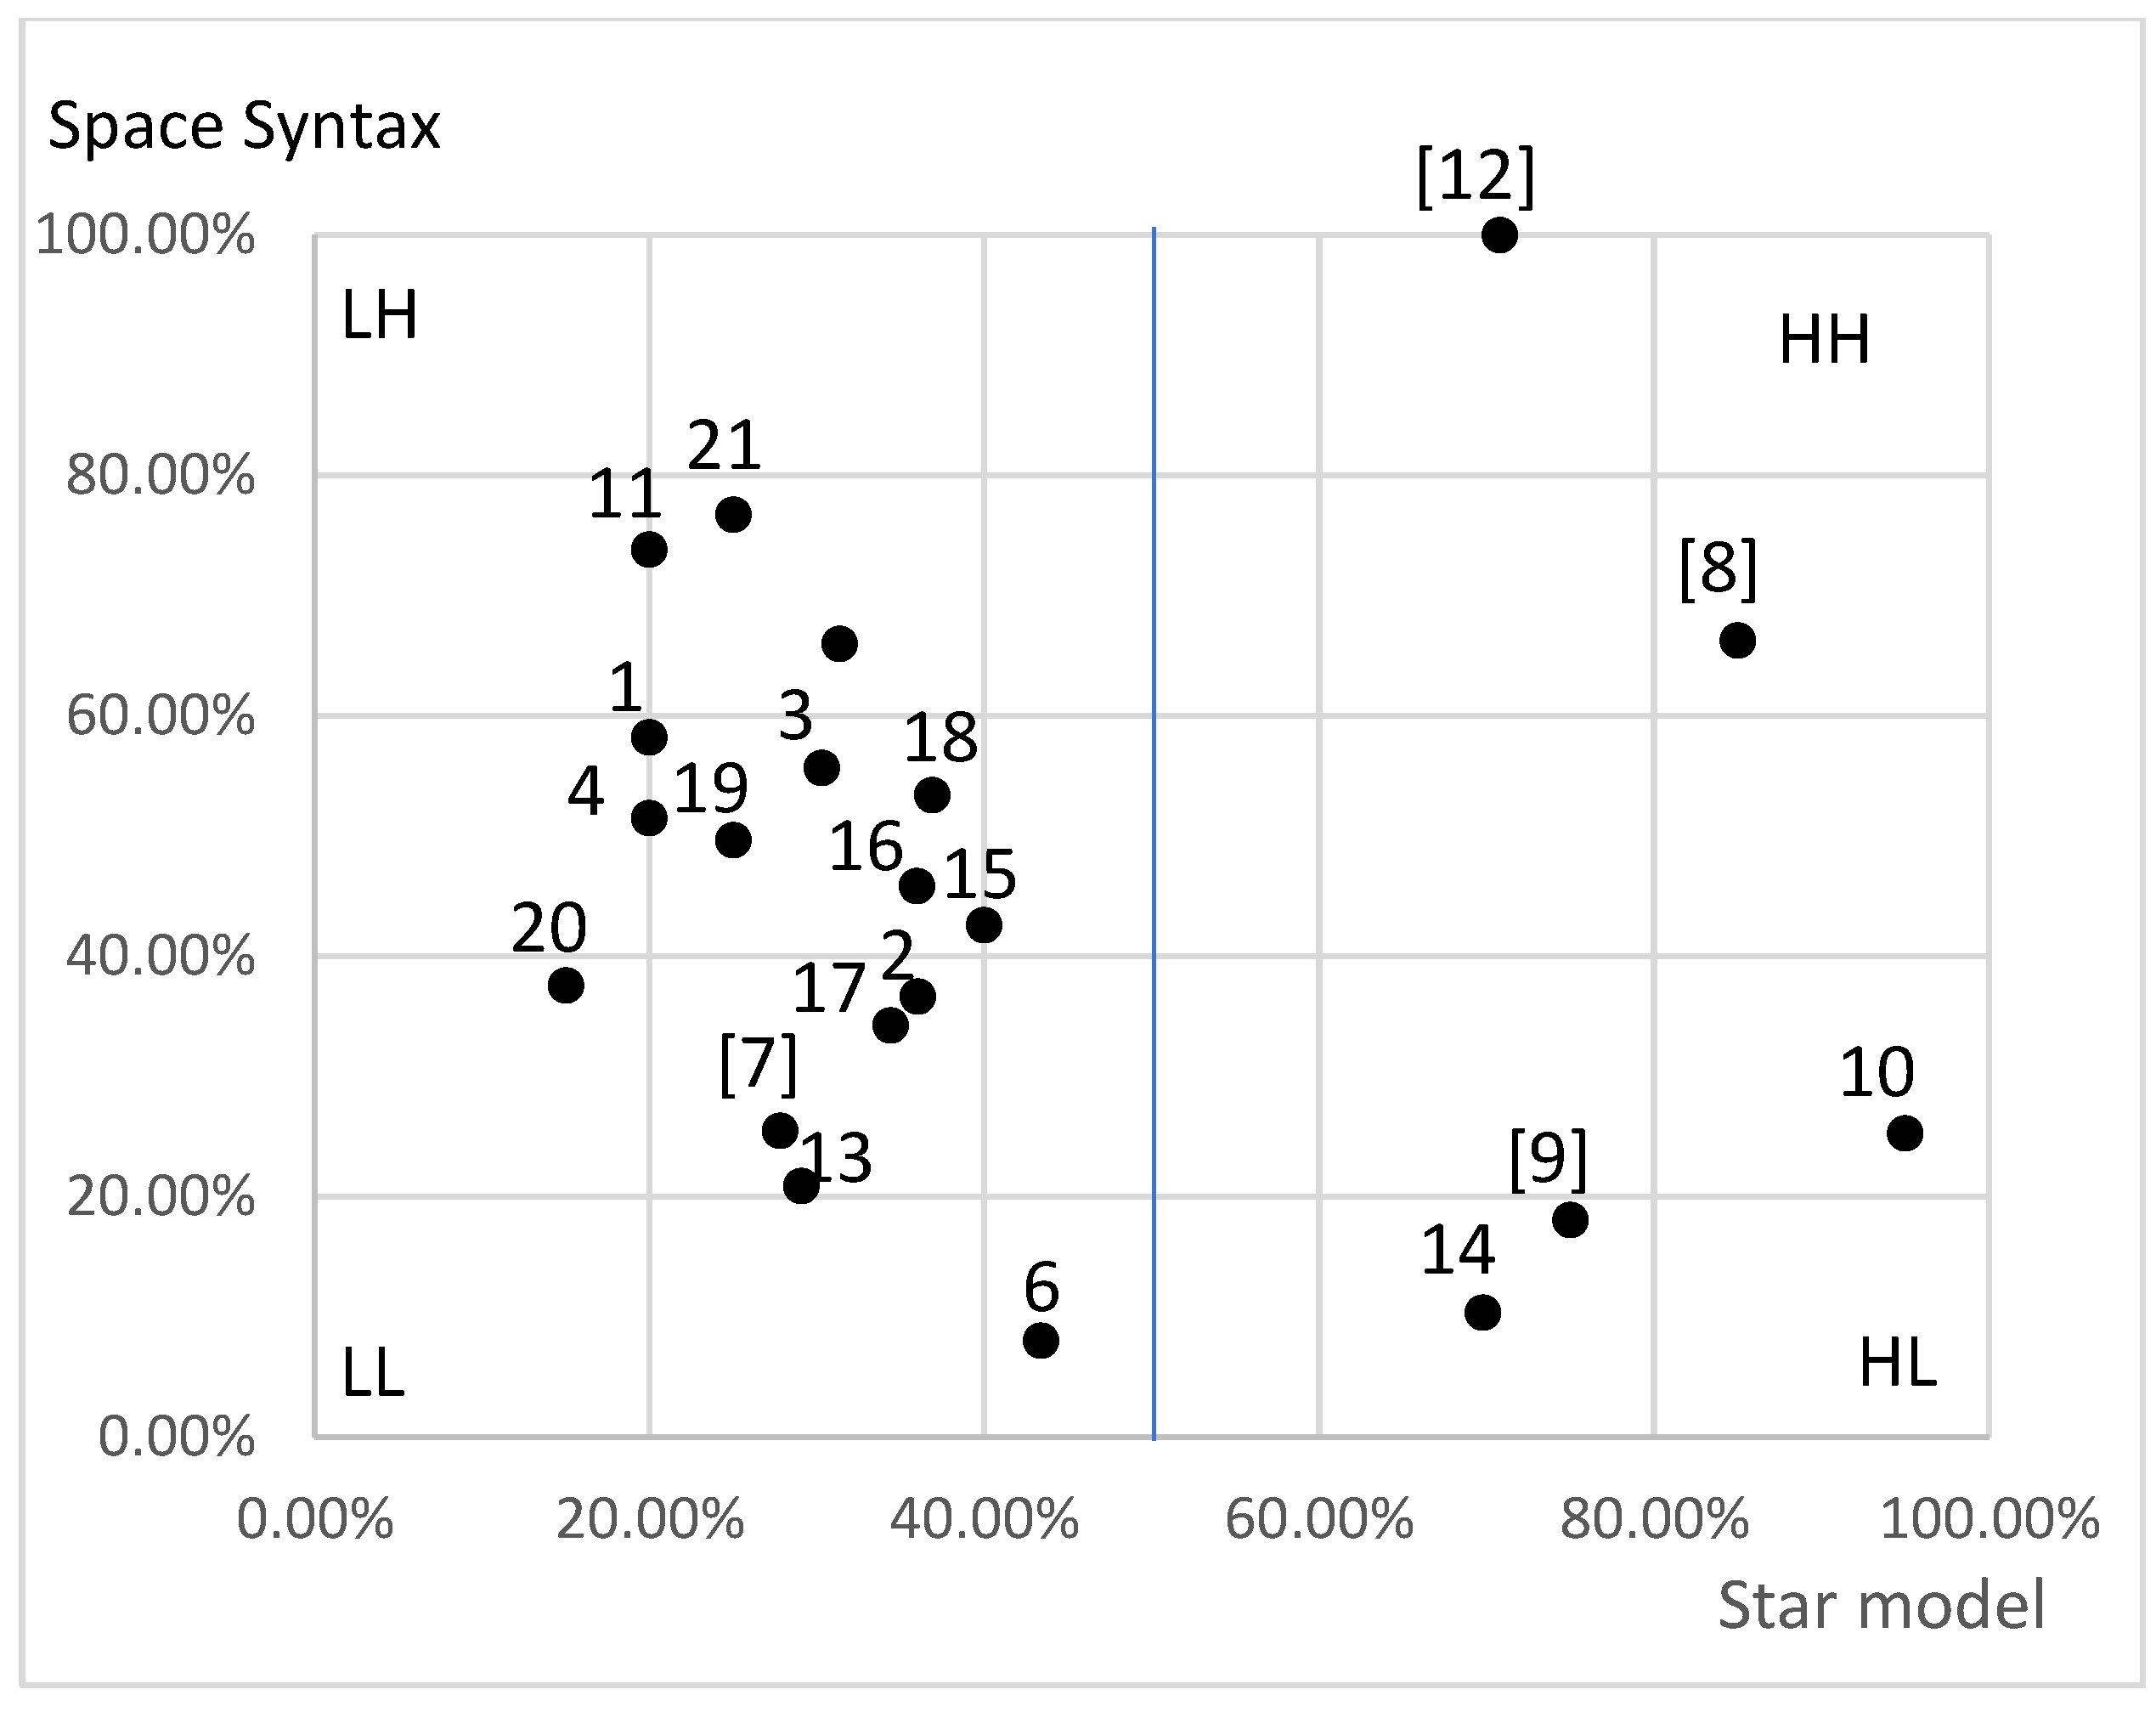
In addition to exporting accurate scores to compare the publicness degree of different POS, integrating the Star Model and Space Syntax enable urban researchers to analyze how publicness is generated in POS. By assuming that the X axle is the Star Model score, and the Y axle is the Space Syntax score, we classified the 21 POS in Table 5 into 4 categories shown in Figure 9. For POS that are higher in both scores (in our cases, higher than 50), their generic spatial configuration and environmental animation both performed well in design and integration with each other. As for POS that are lower in both scores, they need greater improvement in design. As for POS that are higher in the Space Syntax score and lower in the Star Model score, their spatial configurations are easily perceptible but are insufficient in environmental animation. POS #21 in Figure 5b belongs to this classification. POS #21 is located at the main road (Yaohua West St.) in the Yaohua Neighborhood, which gives it a higher level of accessibility. This is also shown by its high NAIH and NACH when applying Space Syntax assessment (76.77%). Thus, POS #21 has a high level of publicness from the aspect of spatial configuration, and it attracts the residents around for social activities. However, POS #21 is lacking in civility and environmental animation and scores only 25% by Star Model assessment. Facilities like public toilets, seats, rain shelter, urban furniture and so on are not provided. Notably, this induces the residents to bring their private chairs to the open space for sitting. For this reason, POS #21 does not rank high in the Combined Score (50.88%) and its users are limited by the designated group of residents from the community. As for POS that are higher in the Star Model score and lower in the Space Syntax score, they demonstrate an inversed scenario. POS #10 in Figure 5a is a typical case of this situation. It is located at the end of Lychee Bay Park, which is far away from the entrance. Thus, it is less accessible and more difficult to make accessible. This is shown by the Space Syntax score (25.29%). However, POS #10 is elaborately designed by the planners and high in environmental animation, which makes it higher in the Star Model score (70.78%). It is designed as a Cantonese-style pavilion, which makes it both a cultural symbol and functional shelter for sunshine and rain. Additionally, it provides sufficient seats. For these reasons, its combined tool score is 60.14%. Another notable observation is that although POS #10 is not that easily accessible, it motivates people to stay once they reach here, which in turn makes it a popular POS.
The Star Model and the Space Syntax are related with different attributes when assessing different types of POS (Table 6). For the methods themselves, Space Syntax is a quantitative method while the Star Model a qualitative one. As for the targets they directly assess, Space Syntax assesses the space of “flow”, while the Star Model assesses the space of “place”. The application of the integrated tool to the actual cases helps us to analyze the mechanism of how “space of flow” and “space of place” simultaneously act on the POS.
Since the rise of the “space of flow” theory and Space Syntax theory, the structure of space is regarded as a complex network structure and the POS are the nodes in it. For one aspect, evidence can be found from the analysis results that POS with high (Visual) Integration and high Choice often are frequently used in both cases. They are aggregating pedestrian flows from different directions. For another, the example of POS #14 and POS #15 (Figure 5b) reflect the effect of the aggregation of factors of important POS. In the Yaohua Neighborhood, publicness assessed by the Star Model of POS #14 (Figure 5b) is much higher than that of POS #15 (Figure 5b), because POS #14 (Figure 5b) is a main gateway assigned by the government, and new seats and sports facilities are placed there. On the contrary, POS #15 (Figure 5b) does not attract the attention of urban designers, so it is worn out and lacks new facilities. However, in actual use, POS #14 and #15 (Figure 5b) are both popularized by the residences. The reason is that POS #15 (Figure 5b) is more accessible to the residences and nearer to the outer road, so it has a stronger ability of aggregating people and other factors, which can be informed by Space Syntax.
Nevertheless, classified discussion required to be made in different types of POS. Assessing the publicness of POS using “space of flow” theory by Space Syntax is suitable in bottom-up POS but does not always work in top-down POS. Because the assumption of this method is the residents and government own the same level of the right to the space. However, in top-down POS, users do not have the right to design the space. This would twist the publicness of POS. One evidence is the comparison of POS #10 and POS #11 (Figure 5a) in the Lychee Bay area. The higher Space Syntax score of POS #11 implicated its stronger ability aggregating factors and higher level of publicness. But in actual use, POS #11 is used less by people than POS #10 (Figure 5a). According to the Star Model, we found that POS #10 (Figure 5a) was designed by the government into a Chinese-style corridor passage with shelters, which makes it a cool and comfortable place for resting in sub-tropical Guangzhou. Although the residences should have more preferred POS #11 (Figure 5a), due to the forbidding of pitching tents or other informal modifications to the space, they are to some degree “forced” to aggregate at POS #10 (Figure 5a).

5.3. Application of Combined Tool in POS Design

This research applies an assessment integrating the Star Model and Space Syntax to assess the publicness of POS. It enables us to scientifically evaluate the intensity and various dimensions of publicness, spatial and social manners of POS at the same time. Because the combined tool is constructed on the basis of a stable and holistic framework for publicness analysis (the Star Model) and transferred into a quantitative tool by Space Syntax, it could be further applied to different countries and regions. What is more, through field investigations, we have localized the assessment method to a sub-tropical Asian city. In particular, we add a green and shelter ratio to the Star Model in the “animation” dimension. This addition can significantly improve the thermal comfort in sub-tropical cities, like the traditional shophouses prevalent in East Asia and Southeast Asia. This localization of the assessment is verified to be more applicable in East Asian and Southeast Asian cities.
From another aspect, this research creates a combined tool that can be applied to the micro-scale study of space. With this combined tool, one can evaluate the cool and hot spots of publicness in a case, rather than just comparing cases in a general framework. Additionally, by digging out the differences in the assessment results between the Star Model and Space Syntax, we can pertinently improve the design of the POS. In the Lychee Bay area, the strategies of injecting cultural activities, recalling memory and improving the maintenance of the space mentioned in the Star Model are applied to make up for the fact that these POS should be of low quality of publicness. This is because they have low Integration and Choice scores in the Space Syntax in Figure 6. These results imply that one can intentionally and strategically implement certain kinds of spatial designs or activities to improve inferior POS. Using the combined tool in the micro-scale study of space assists the administrator in evaluating POS policy and modifying their strategies accordingly. The recent regeneration launched by the government in the Yaohua Neighborhood provided a learning lesson for us when we applied the combined tool to it. The entertainment and sport facilities newly added in this action are placed at POS #14 (Figure 5b), located at the edge of the neighborhood shown to have low accessibility. Instead, the intersections of serval main streets assessed as the POS most frequently used and most urgently in need of renewal were ignored by the government. As a result, the residents keep spontaneously moving their chairs and tables to the streets to self-regenerate the “genuine” POS. These findings remind us that using the combined tool can reveal those problems, as well as solutions for improving the publicness of POS. One can use the combined method to conduct more effective POS urban planning and urban design.

6. Conclusions

This research proposes the combined use of the Star Model and Space Syntax for assessing publicness of spaces in the context of an Asian city. Through the on-site investigation of two cases in Guangzhou, the feasibility of combining the two has been verified.
Integrating Space Syntax and the Star Model provides a much more effective and accurate assessment of POS than merely applying a single tool. The purpose of evaluating the publicness of open spaces is to improve the quality of POS in a targeted manner, so that POS can break through the limitations of functions and have the most extensive inclusiveness and participation, thereby enhancing the vitality of the entire area. In assessing the publicness of public space, Space Syntax regards space as an independent entity, which can be quantitatively described, evaluated (spatial forms), analyzed (relationships between various factors), so as to reach a precise urban form. However, the Star Model excelled in the generic evaluation of public space, providing a worldwide framework for assessing public space. It investigates the main dimensions of public space through visual language (the five dimensions). Of the five, the physical function is reflected by the ‘physical configuration’ dimension, while the other four dimensions are mainly related to social functions. It can be seen that the Star Model is more biased by the evaluation of the social function of space than the Space Syntax. Weaknesses of the Star Model include its standardization of public places, removing the fact that public space has its own unique identifier corresponding to setting or atmosphere. Therefore, this model should be adjustable and localized when applied to differing contexts. For these reasons, integrating the two tools would provide a more comprehensive evaluation of public space, and enable a rational understanding of activating the publicness of open spaces.
Therefore, in this research, the assessment of “physical configuration” in the Star Model is firstly upgraded by importing Space Syntax. The Star Model provides a comprehensive framework for evaluating the POS in its social and physical attributes, but the qualitative assessment method depends mainly on the assessor. By integrating quantitative Space Syntax into the Star Model, the accuracy of the publicness results of the POS is improved. Secondly, a combined tool has been produced by a creative equation. This combined tool improved the degree of spatial precision of publicness so that it can assess the micro-scale of POS. What is more, the combined tool provides an objective and fair assessment of public space performance. As a pilot attempt, this research has applied the combined tool on two POS cases. The robustness of the combined tool has been verified. The combined tool is a quantitative analytical tool that is unlimited by geographic scale so that comparisons can be further applied in different regions and locations.
Furthermore, this research analyzes the mechanism of publicness of top-down POS and bottom-up POS. Because Space Syntax reflects the “space of flow” and the Star Model reflects the “space of place,” the combined tool reveals the interaction of them. In a bottom-up POS in which factors freely move, spatial flows are aggregated at nodes and they become important public spaces. In a top-down POS, the residents have little right to construct their own. By importing external and artificial design (as opposed to introverted and spontaneous spatial production), the publicness of top-down POS can be twisted mainly by the government and urban designers rather than the residents.
Lastly, the combined tool is more applicable in actual use since the localization of the indicators and an improvement of spatial precision are achieved. For one, this research introduces the green and shelter ratio, which is an important factor in sub-tropical cities in the Star Model to make it more applicable. For another, the combined tool has a high spatial precision to point, and it contains two dimensions of publicness. Thus, it can be extended to provide suggestions on the design of the micro-scale of POS. That means in POS design and planning, different parts and nodes can be adapted to make different resolutions. Therefore, we achieve the goal of designing and planning a more inclusive and participative space, and city for the people.
For further research, quantitative statistical methods such as regression analysis can be used to further validate the correlations between social interactions and spatial-related factors. More cases of different kinds of POS could be surveyed to enrich the application of the combined assessment tool. In this way, this paper has proposed to apply a combined Space Syntax and Star Model to the publicness assessment of POS to promote a comprehensive and scientific evaluation of different POS.

Author Contributions

Conceptualization, Y.W., S.S.Y.L. and J.W.; methodology, Y.W., Y.M., S.S.-Y.L.; software, Y.W.; investigation, Y.W.; writing—original draft preparation, Y.W.; writing—review and editing, S.S.-Y.L., Y.M. and S.S.Y.L. All authors have read and agreed to the published version of the manuscript.

Funding

This research was funded by the Guangdong Enterprise Key Laboratory for Urban Sensing, Monitoring and Early Warning, grant number 2020B121202019, National Natural Science Foundation of China, grant number 41401432, and the Science and Technology Foundation of Guangzhou Urban Planning & Design Survey Research Institute, grant number RDI2220205141.

Institutional Review Board Statement

Not applicable.

Informed Consent Statement

Not applicable.

Data Availability Statement

Not applicable.

Acknowledgments

The authors would like to thank for inspiration the coursework from the Module on “HSGS 6100 Independent Research” at the MSSc. in Housing Studies of the Chinese University of Hong Kong (2019–2020). The authors would like to thank for financial support the Guangdong Enterprise Key Laboratory for Urban Sensing, Monitoring and Early Warning (No.2020B121202019), National Natural Science Foundation of China (Grant No. 41401432), the State Key Laboratory of Subtropical Building Science (2019ZA03), Application of Photovoltaic System in Curtain Wall Transformation, and National Natural Science Foundation of China (52178014), Study on the Optimization of Assessment Standard for Green Campus Based on Carbon Emission Characteristics: Taking University Campus in Subtropical Region as a Case. Thanks for support are also owed to the Center for Human-Oriented Environment and Sustainable Design at the Shenzhen University, which has guided this work from beginning to end.

Conflicts of Interest

The authors declare no conflict of interest.

Appendix A

Table A1. Formula and Definition of Space Syntax Indexes.
ConceptFormulaMeaning
Total depth T D = d = 1 S d × N d
where, d indicates the depth from a unit to other ones. s is the maximum depth. Nd stands for the number of units with the same depth as this unit.
The higher Total depth, the lower accessibility
Mean depth M D = T D / n 1 )
where, n stands for the total number of units
The higher Mean depth, the lower accessibility
IntegrationIntegration = RA/RRA
where, RA represents Relativized Asymmetry, it is used for eliminating the error caused by the asymmetry in the topological structure.
R A = 2 M D     1 / n     2
where, RRA represents Relativized RA, it further eliminates the error caused by connective form.
R R A = 2 n l o g 2 n   +   2 3     1   +   1 n     1 n     2 ,
where, n stands for the total number of units
The higher Integration, the higher accessibility
Angular Choice A C H = j k d j k i d j k ( j < k )
where, djk refers to the least-angle between line j and line k, and djk(i) refers to the least-angle containing line i between line j and line k.
The higher Angular Choice, the higher possibility of being chosen to pass
Normalized Angular Choice (NACH) N A C H r = log A C H r   +   1 log A T D r   +   3
where, NACH_r denotes NACH at a metric radius of r, ACH_r indicates angular choice at r, ATD_r means angular total depth at metric radius of r. This normalized processing can eliminate the error of Angular Choice occurring when increasing node count.
The higher NACH, the higher possibility of being chosen to pass
Normalized Angular Integration (NAIN)NAIN can be seen as the reciprocal of NAtd, where,
N A t d r = A T D r N C r   +   2 1.2
where, NAtd_r denotes the normalised angular total depth at metric radius of r, ATD_r indicates angular total depth at r, and NC_r means node count at r. This normalized processing can eliminate the error of Angular Integration occurring when increasing node count.
The higher NAIN, the higher accessibility
Source: Author’s summary based on related articles.
Table A2. Scores of Star Model Evaluation.
IndicatorsScore
Lychee Bay ParkYaohua Neighborhood
(1) Ownership55
(2) Control **1.34.3
CCTV Cameras13
Rules and Regulations15
Policing and Security Guards25
(3) Civility4.51.5
Physical Maintenance and Cleansing Regime51
Physical Provision of Facilities42
(4) Animation3.62.6
Various types of seating33
Diversity of activities and events51
Art and culture enhancement42
Informal spaces24
Greening and shelter53
(5) Physical Configuration
(original)3.32.7
Centrality and connectedness44
Visual access32
Thresholds and gateways32
(Space Syntax)2.83.2
NAIN3.64.5
NACH4.05.9
Isovist Area2.50.5
Visual Integration1.31.7
Total Score (original)3.53.2
Total Score (Space Syntax integrated)3.53.3
Legend ** = note that the higher the value refers to more publicness; Normalization for Space Syntax indicator assumes the mean index of the whole extent equals to score 3.

Appendix B

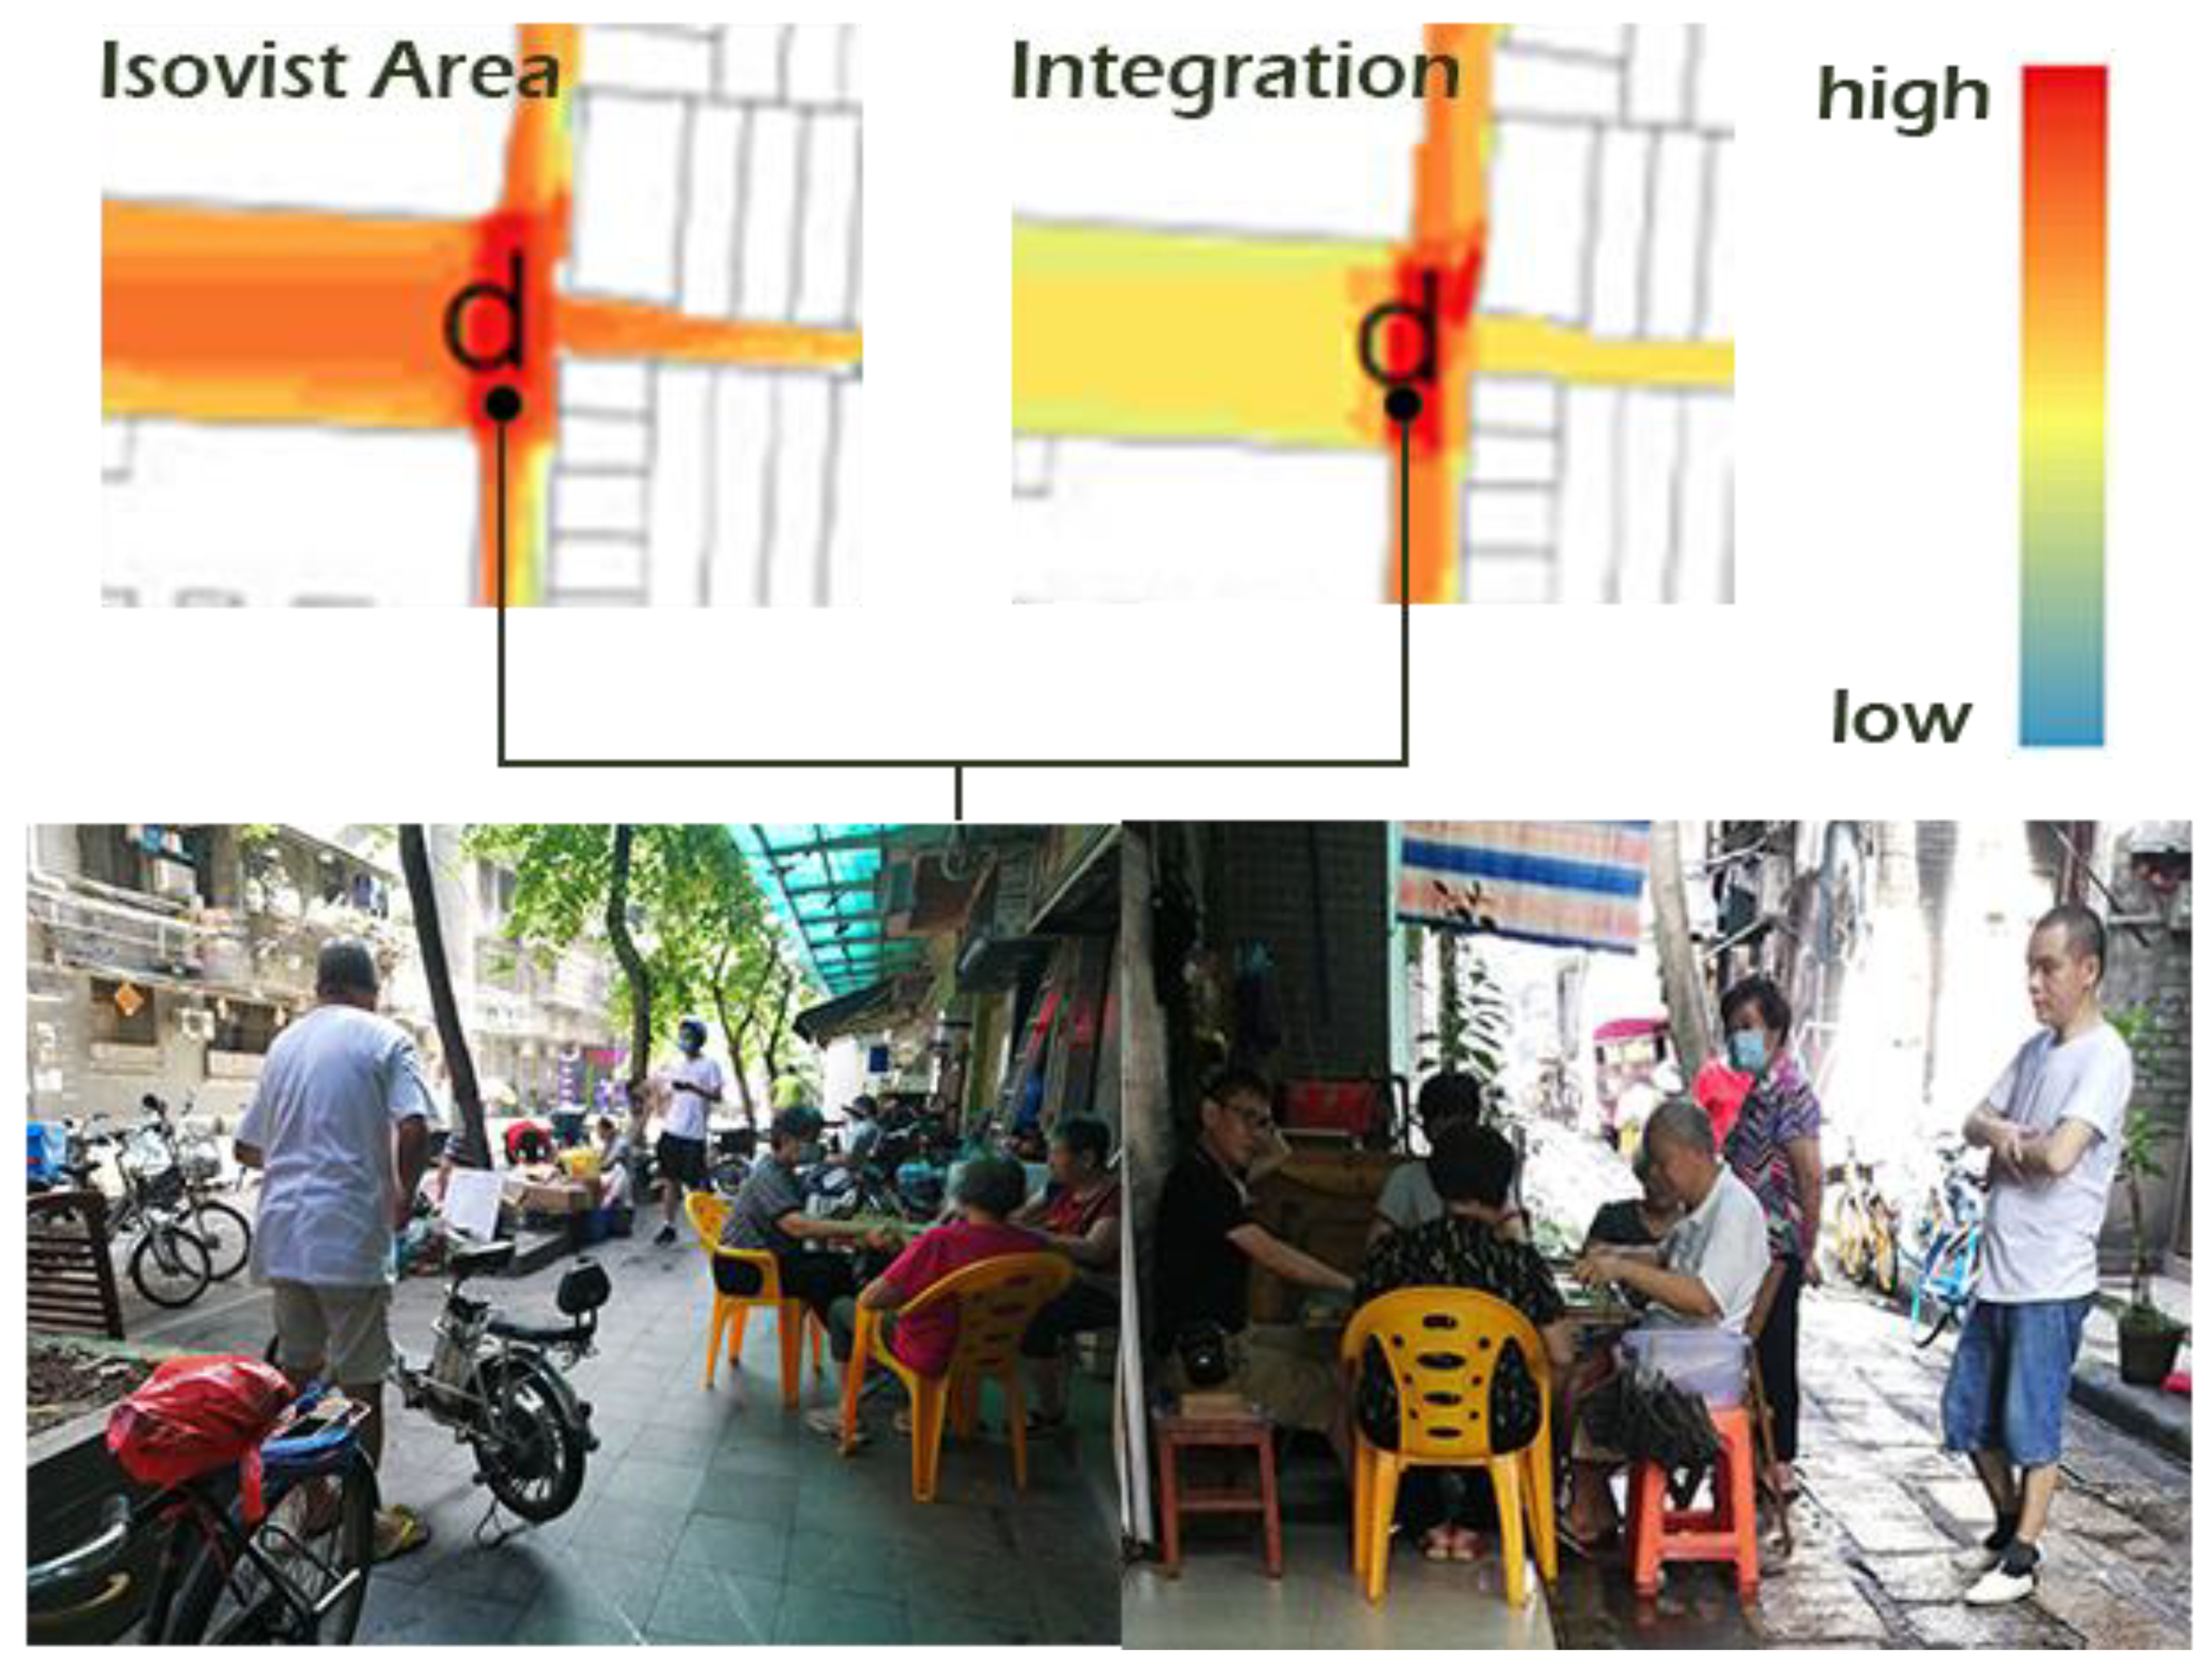
Figure A1. POS #8, which has a higher ‘Isovist Area’, and ‘Visual Integration’ is observed to be the most popular public space.
Sustainability 14 14711 g0a1
Figure A2. POS #17 is also observed to be a popular public space. There is a street vendor selling second-hand goods, which attracted residents to stay and mingle with each other.
Sustainability 14 14711 g0a2
Figure A3. Intersections of two or more highly accessible roads boost social interactions at POS #3.
Sustainability 14 14711 g0a3
Figure A4. Intersections of two or more highly accessible roads boost social interactions in the Yaohua Neighborhood.
Sustainability 14 14711 g0a4
Figure A5. Coffeeshops and food stalls offer outdoor seating at the Lychee Bay Park.
Sustainability 14 14711 g0a5
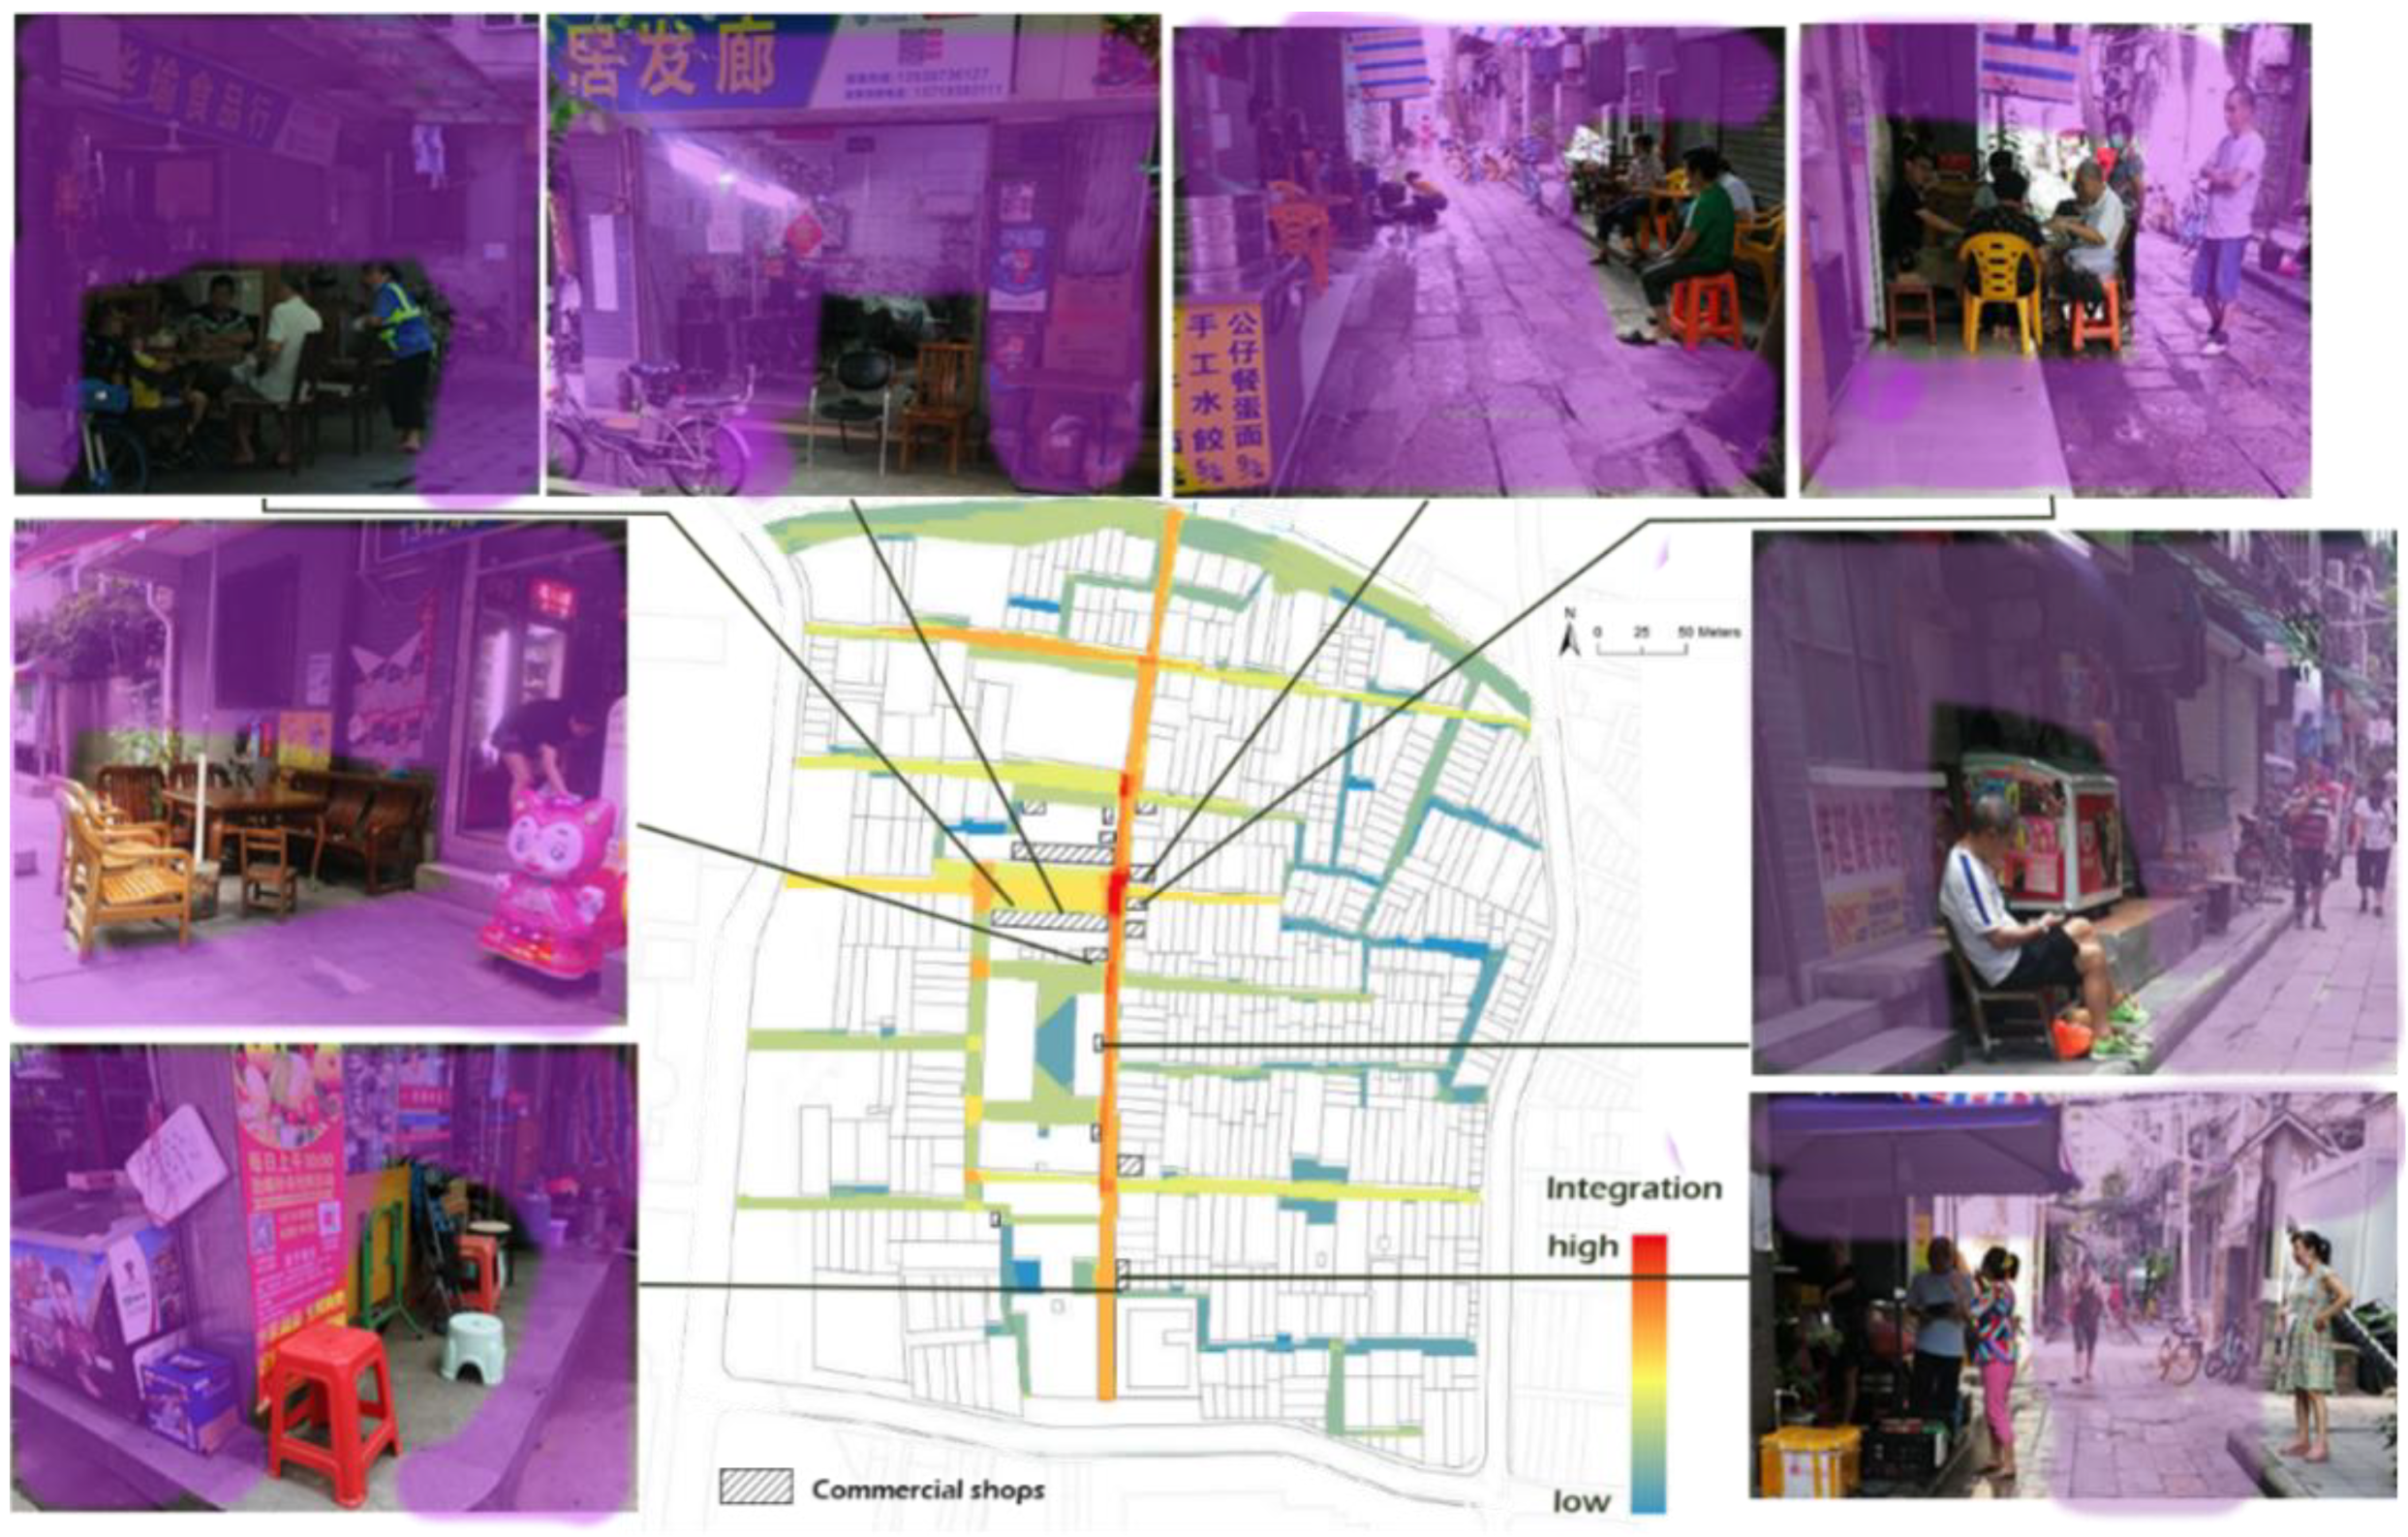
Figure A6. Community shops in the Yaohua Neighborhood incorporate chairs, dining tables, sunshade etc. and create public spaces.
Sustainability 14 14711 g0a6
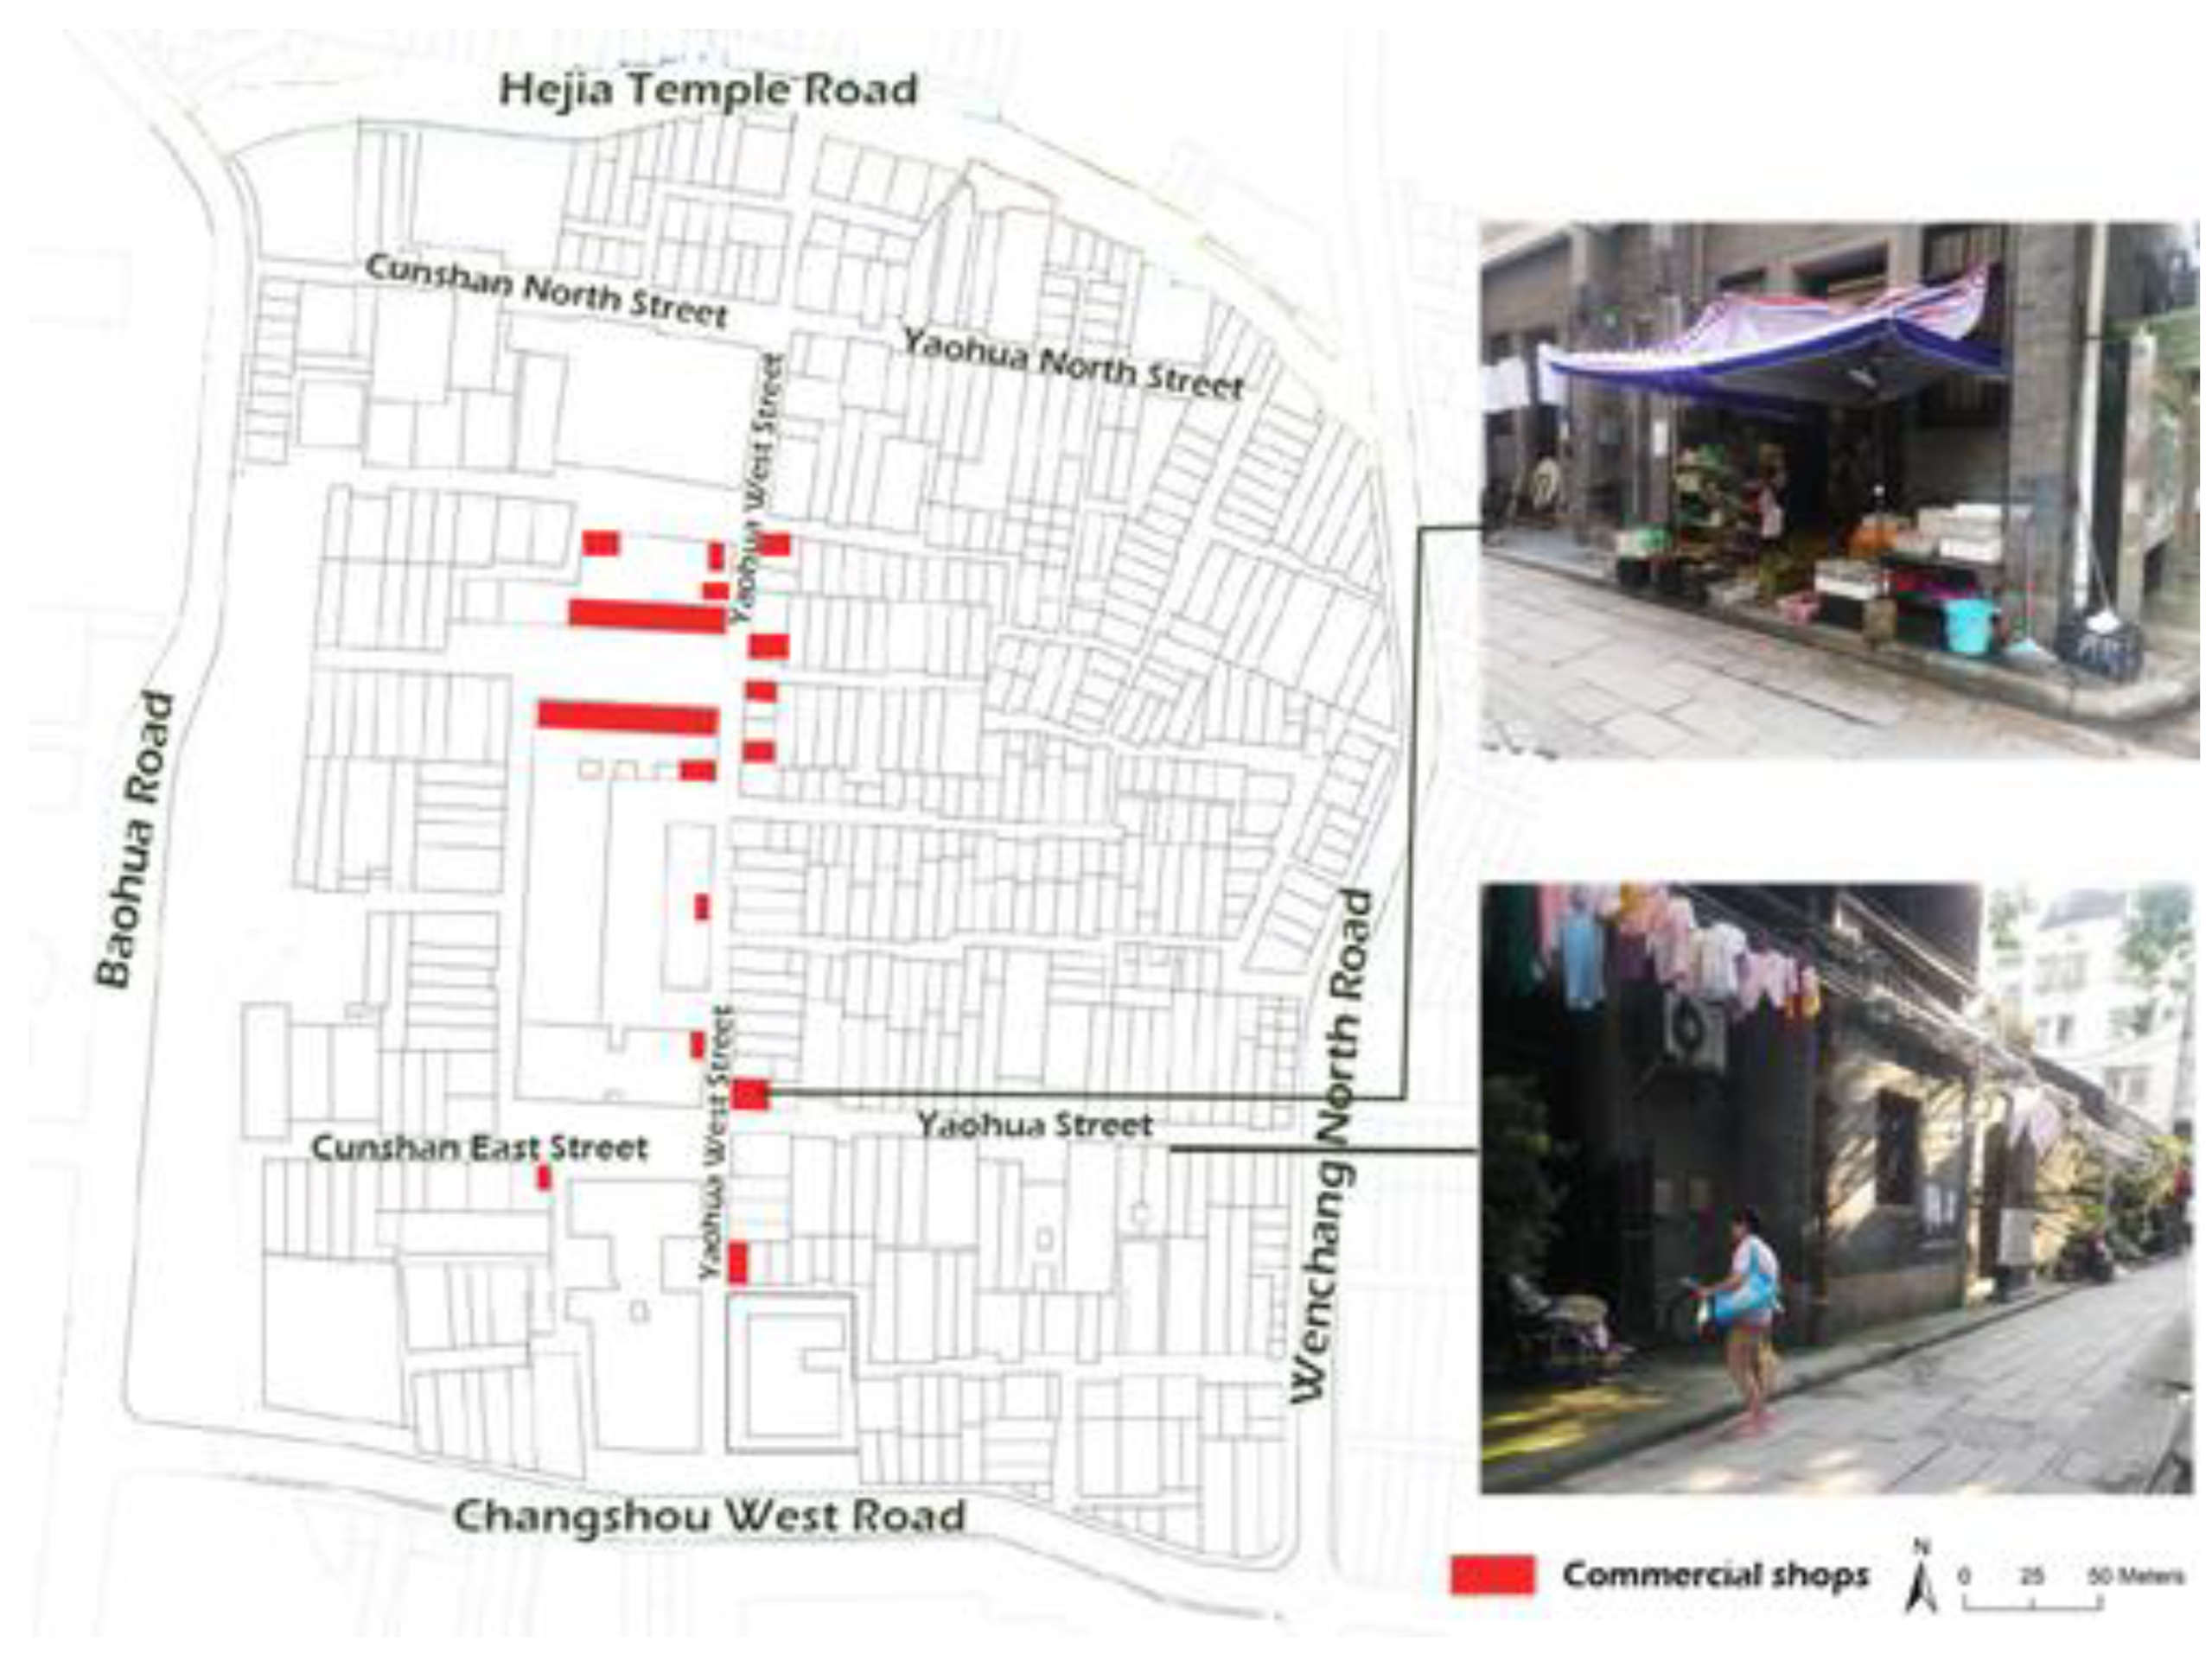
Figure A7. Spatial and streets texture of the Yaohua Neighborhood.
Sustainability 14 14711 g0a7
Figure A8. Distribution of informal use of public space in the Yaohua Neighborhood.
Sustainability 14 14711 g0a8

References

  1. Tonnelat, S. The sociology of urban public spaces. In Territorial Evolution and Planning Solution: Experiences from China and France; Atlantis Press: Amsterdam, The Netherlands, 2010; pp. 84–92. [Google Scholar]
  2. Mehta, V. Streets and social life in cities: A taxonomy of sociability. Urban Des. Int. 2019, 24, 16–37. [Google Scholar] [CrossRef]
  3. Loukaitou-Sideris, A.; Banerjee, T. Urban Design Downtown: Poetics and Politics of Form; University of California Press: Oakland, CA, USA, 1998. [Google Scholar]
  4. Németh, J. Defining a public: The management of privately owned public space. Urban Stud. 2009, 46, 2463–2490. [Google Scholar] [CrossRef]
  5. Francis, M. The making of democratic streets. Contesti Città Territ. Progett. 2016, 1–2, 192–213. [Google Scholar]
  6. Davis, M. Fortress Los Angeles: The militarization of urban space. In Cultural Criminology; Routledge: Abingdon, UK, 2017; pp. 287–314. [Google Scholar]
  7. Sorkin, M. Variations on a Theme Park: The New American City and the End of Public Space; Macmillan: New York, NY, USA, 1992. [Google Scholar]
  8. Huan, L.; Guozhi, H.; Liangxiong, H. The Mystery of China’s Land Finance Growth. China Econ. Q. 2013, 12, 1141–1160. [Google Scholar]
  9. Carmona, M. Contemporary public space, part two: Classification. J. Urban Des. 2010, 15, 157–173. [Google Scholar] [CrossRef]
  10. Parlette, V.; Cowen, D. Dead malls: Suburban activism, local spaces, global logistics. Int. J. Urban Reg. Res. 2011, 35, 794–811. [Google Scholar] [CrossRef] [Green Version]
  11. Varna, G.; Tiesdell, S. Assessing the publicness of public space: The star model of publicness. J. Urban Des. 2010, 15, 575–598. [Google Scholar] [CrossRef]
  12. Varna, G. Measuring Public Space: The Star Model; Routledge: New York, NY, USA, 2016. [Google Scholar]
  13. Garau, C.; Annunziata, A. A method for assessing the vitality potential of urban areas. The case study of the Metropolitan City of Cagliari, Italy. City Territ. Archit. 2022, 9, 7. [Google Scholar] [CrossRef]
  14. Ye, Y.; Li, D.; Liu, X. How block density and typology affect urban vitality: An exploratory analysis in Shenzhen, China. Urban Geogr. 2018, 39, 631–652. [Google Scholar] [CrossRef]
  15. Carta, S.; Onafuye, R.; De Kock, P. Standing out in a crowd: Big data to produce new forms of publicness. In Architecture and the Smart City; Routledge: New York, NY, USA, 2019; pp. 223–233. [Google Scholar]
  16. Qi, Y.; Chodron Drolma, S.; Zhang, X.; Liang, J.; Jiang, H.; Xu, J.; Ni, T. An investigation of the visual features of urban street vitality using a convolutional neural network. Geo-Spat. Inf. Sci. 2020, 23, 341–351. [Google Scholar] [CrossRef]
  17. Kim, S. Urban Vitality, urban form, and land use: Their relations within a geographical boundary for walkers. Sustainability 2020, 12, 10633. [Google Scholar] [CrossRef]
  18. Liu, M.; Jiang, Y.; He, J. Quantitative evaluation on street vitality: A case study of Zhoujiadu community in Shanghai. Sustainability 2021, 13, 3027. [Google Scholar] [CrossRef]
  19. Hillier, B.; Hanson, J. The Social Logic of Space; Cambridge University Press: Cambridge, UK, 1989. [Google Scholar]
  20. Bozeman, B.; Bretschneider, S. The “publicness puzzle” in organization theory: A test of alternative explanations of differences between public and private organizations. J. Public Adm. Res. Theory 1994, 4, 197–224. [Google Scholar]
  21. Pesch, U. The publicness of public administration. Adm. Soc. 2008, 40, 170–193. [Google Scholar] [CrossRef] [Green Version]
  22. Walker, R.M.; Bozeman, B. Publicness and organizational performance. J. Public Adm. Res. Theory 2011, 21, i279–i281. [Google Scholar] [CrossRef]
  23. Bailey, M. Rethinking public service broadcasting: The historical limits to publicness. In Media and Public Spheres; Palgrave Macmillan: London, UK, 2007; pp. 96–108. [Google Scholar]
  24. Young, I.M. Inclusion and Democracy; Oxford University Press on Demand: Oxford, UK, 2002. [Google Scholar]
  25. Habermas, J. The Theory of Communicative Action: Lifeworld and Systems, a Critique of Functionalist Reason; Wiley: Hoboken, NJ, USA, 2015; Volume 2. [Google Scholar]
  26. Langstraat, F.; Van Melik, R. Challenging the ‘end of public space’: A comparative analysis of publicness in British and Dutch urban spaces. J. Urban Des. 2013, 18, 429–448. [Google Scholar] [CrossRef]
  27. Corkery, L. Reclaiming and making places of distinction through landscape architecture. In Place and Placelessness Revisited; Routledge: New York, NY, USA, 2016; pp. 61–75. [Google Scholar]
  28. Han, S.; Kim, J.W.; Kwon, Y. Contemporary spatial publicness: Its new characteristics and democratic possibilities. Sustainability 2019, 11, 4729. [Google Scholar] [CrossRef] [Green Version]
  29. Madanipour, A. Whose Public Space?: International Case Studies in Urban Design and Development; Routledge: New York, NY, USA, 2013. [Google Scholar]
  30. Fan, P.; Xu, L.; Yue, W.; Chen, J. Accessibility of public urban green space in an urban periphery: The case of Shanghai. Landsc. Urban Plan. 2017, 165, 177–192. [Google Scholar] [CrossRef]
  31. Szczepańska, A.; Pietrzyk, K. An evaluation of public spaces with the use of direct and remote methods. Land 2020, 9, 419. [Google Scholar] [CrossRef]
  32. Van Melik, R.; Van Aalst, I.; Van Weesep, J. Fear and fantasy in the public domain: The development of secured and themed urban space. J. Urban Des. 2007, 12, 25–42. [Google Scholar] [CrossRef]
  33. Németh, J.; Schmidt, S. The privatization of public space: Modeling and measuring publicness. Environ. Plan. B Plan. Des. 2011, 38, 5–23. [Google Scholar] [CrossRef]
  34. Mehta, V. Evaluating public space. J. Urban Des. 2014, 19, 53–88. [Google Scholar] [CrossRef]
  35. Mantey, D. The ‘publicness’ of suburban gathering places: The example of Podkowa Leśna (Warsaw urban region, Poland). Cities 2017, 60, 1–12. [Google Scholar] [CrossRef]
  36. Wojnarowska, A. Model for assessment of public space quality in town centers. Eur. Spat. Res. Policy 2016, 23, 81–109. [Google Scholar] [CrossRef]
  37. Mushtaha, E.; Alsyouf, I.; Al Labadi, L.; Hamad, R.; Khatib, N.; Al Mutawa, M. Application of AHP and a mathematical index to estimate livability in tourist districts: The case of Al Qasba in Sharjah. Front. Archit. Res. 2020, 9, 872–889. [Google Scholar] [CrossRef]
  38. Ekdi, F.P.; Çıracı, H. Really public? Evaluating the publicness of public spaces in Istanbul by means of fuzzy logic modelling. J. Urban Des. 2015, 20, 658–676. [Google Scholar] [CrossRef]
  39. Osgood, C.E.; Suci, G.J.; Tannenbaum, P.H. The Measurement of Meaning; University of Illinois Press: Champaign, IL, USA, 1957. [Google Scholar]
  40. Perovic, S.K.; Šestovic, J.B. Creative Street Regeneration in the Context of Socio-Spatial Sustainability: A Case Study of a Traditional City Centre in Podgorica, Montenegro. Sustainability 2019, 11, 39. [Google Scholar] [CrossRef] [Green Version]
  41. Herranz-Pascual, K.; Iraurgi, I.; Aspuru, I.; Garcia-Pérez, I.; Santander, A.; Eguiguren, J.L. Integrating Soundscape Criteria in Urban Sustainable Regeneration Processes: An Example of Comfort and Health Improvement. Sustainability 2022, 14, 3143. [Google Scholar] [CrossRef]
  42. Shen, Y.; Karimi, K. Urban function connectivity: Characterisation of functional urban streets with social media check-in data. Cities 2016, 55, 9–21. [Google Scholar] [CrossRef] [Green Version]
  43. Harvey, C.; Aultman-Hall, L. Measuring urban streetscapes for livability: A review of approaches. Prof. Geogr. 2016, 68, 149–158. [Google Scholar] [CrossRef]
  44. Rokicki, B.; Stępniak, M. Major transport infrastructure investment and regional economic development–An accessibility-based approach. J. Transp. Geogr. 2018, 72, 36–49. [Google Scholar] [CrossRef]
  45. Sun, G.; Haining, R.; Lin, H.; Oreskovic, N.M.; He, J. Comparing the perception with the reality of walking in a hilly environment: An accessibility method applied to a University campus in Hong Kong. Geospat. Health 2015, 10, 32–39. [Google Scholar] [CrossRef] [PubMed] [Green Version]
  46. Ekkel, E.D.; de Vries, S. Nearby green space and human health: Evaluating accessibility metrics. Landsc. Urban Plan. 2017, 157, 214–220. [Google Scholar] [CrossRef]
  47. Rashid, M.; Wineman, J.; Zimring, C. Space, behavior, and environmental perception in open plan offices: A prospective study. Environ. Plan. B Plan. Des. 2009, 36, 432–449. [Google Scholar] [CrossRef]
  48. Trova, V.; Hadjinikolaou, E.; Xenopoulos, S.; Peponis, J. The Structure of Public Spacein Sparsely Urban Areas. In Proceedings of the Second International Space Syntax Symposium, Brazilia, Brazil, 29 March–2 April 1999; pp. 1–12. [Google Scholar]
  49. Baran, P.K.; Rodríguez, D.A.; Khattak, A.J. Space syntax and walking in a new urbanist and suburban neighbourhoods. J. Urban Des. 2008, 13, 5–28. [Google Scholar] [CrossRef]
  50. Hajrasouliha, A.; Yin, L. The impact of street network connectivity on pedestrian volume. Urban Stud. 2015, 52, 2483–2497. [Google Scholar] [CrossRef]
  51. Hillier, B.; Penn, A.; Hanson, J.; Grajewski, T.; Xu, J. Natural movement: Or, configuration and attraction in urban pedestrian movement. Environ. Plan. B Plan. Des. 1993, 20, 29–66. [Google Scholar] [CrossRef] [Green Version]
  52. Abbasi, A.; Alalouch, C.; Bramley, G. Open space quality in deprived urban areas: User perspective and use pattern. Procedia-Soc. Behav. Sci. 2016, 216, 194–205. [Google Scholar] [CrossRef] [Green Version]
  53. Varna, G.; Damiano, C. Making the publicness of public space visible: From space syntax to the star model of public space. In Proceedings of the EAEA-11 Conference 2013, Track 1 Visualizing Sustainability: Making the Invisible Visible, Milan, Italy, 25–28 September 2013; p. 101. [Google Scholar]
  54. Koohsari, M.J.; Karakiewicz, J.A.; Kaczynski, A.T. Public open space and walking: The role of proximity, perceptual qualities of the surrounding built environment, and street configuration. Environ. Behav. 2013, 45, 706–736. [Google Scholar] [CrossRef]
  55. Jacobs, J. The uses of sidewalks: Safety. City Read. 1961, 114–118. [Google Scholar]
  56. Furchtlehner, J.; Lička, L. Back on the Street: Vienna, Copenhagen, Munich, and Rotterdam in focus. J. Landsc. Archit. 2019, 14, 72–83. [Google Scholar] [CrossRef]
  57. Harvey, D. A Brief History of Neoliberalism; Oxford University Press: New York, NY, USA, 2007. [Google Scholar]
  58. Amin, S. Theory and practice of the Chinese “market socialism” project: Is “market socialism” an alternative to liberal globalization? In The Chinese Model of Modern Development; Routledge: New York, NY, USA, 2005; pp. 140–160. [Google Scholar]
  59. He, S.; Lin, G.C. Producing and consuming China’s new urban space: State, market and society. Urban Stud. 2015, 52, 2757–2773. [Google Scholar] [CrossRef]
  60. Wang, Y.; Chen, J. Does the rise of pseudo-public spaces lead to the ‘end of public space’in large Chinese cities? Evidence from Shanghai and Chongqing. Urban Des. Int. 2018, 23, 215–235. [Google Scholar] [CrossRef]
  61. Marcuse, P. The Threat of Terrorism and the Right to the City. Fordham Urban Law J. 2004, 32, 767. [Google Scholar]
  62. Flusty, S.; Ellin, N. Building Paranoia//Architecture of Fear; Princeton Architectural Press: New York, NY, USA, 1997. [Google Scholar]
  63. Oc, T.; Tiesdell, S. The fortress, the panoptic, the regulatory and the animated: Planning and urban design approaches to safer city centres. Landsc. Res. 1999, 24, 265–286. [Google Scholar] [CrossRef]
  64. Oc, T.; Tiesdell, S. Urban design approaches to safer city centers: The fortress, the panoptic, the regulatory and the animated. In Landscapes of Defence; Routledge: London, UK, 2000; pp. 188–208. [Google Scholar]
  65. Carmona, M. Contemporary public space: Critique and classification, part one: Critique. J. Urban Des. 2010, 15, 123–148. [Google Scholar] [CrossRef]
  66. Gehl, J. Life between Buildings; Van Nostrand Reinhold: New York, NY, USA, 1987; Volume 23. [Google Scholar]
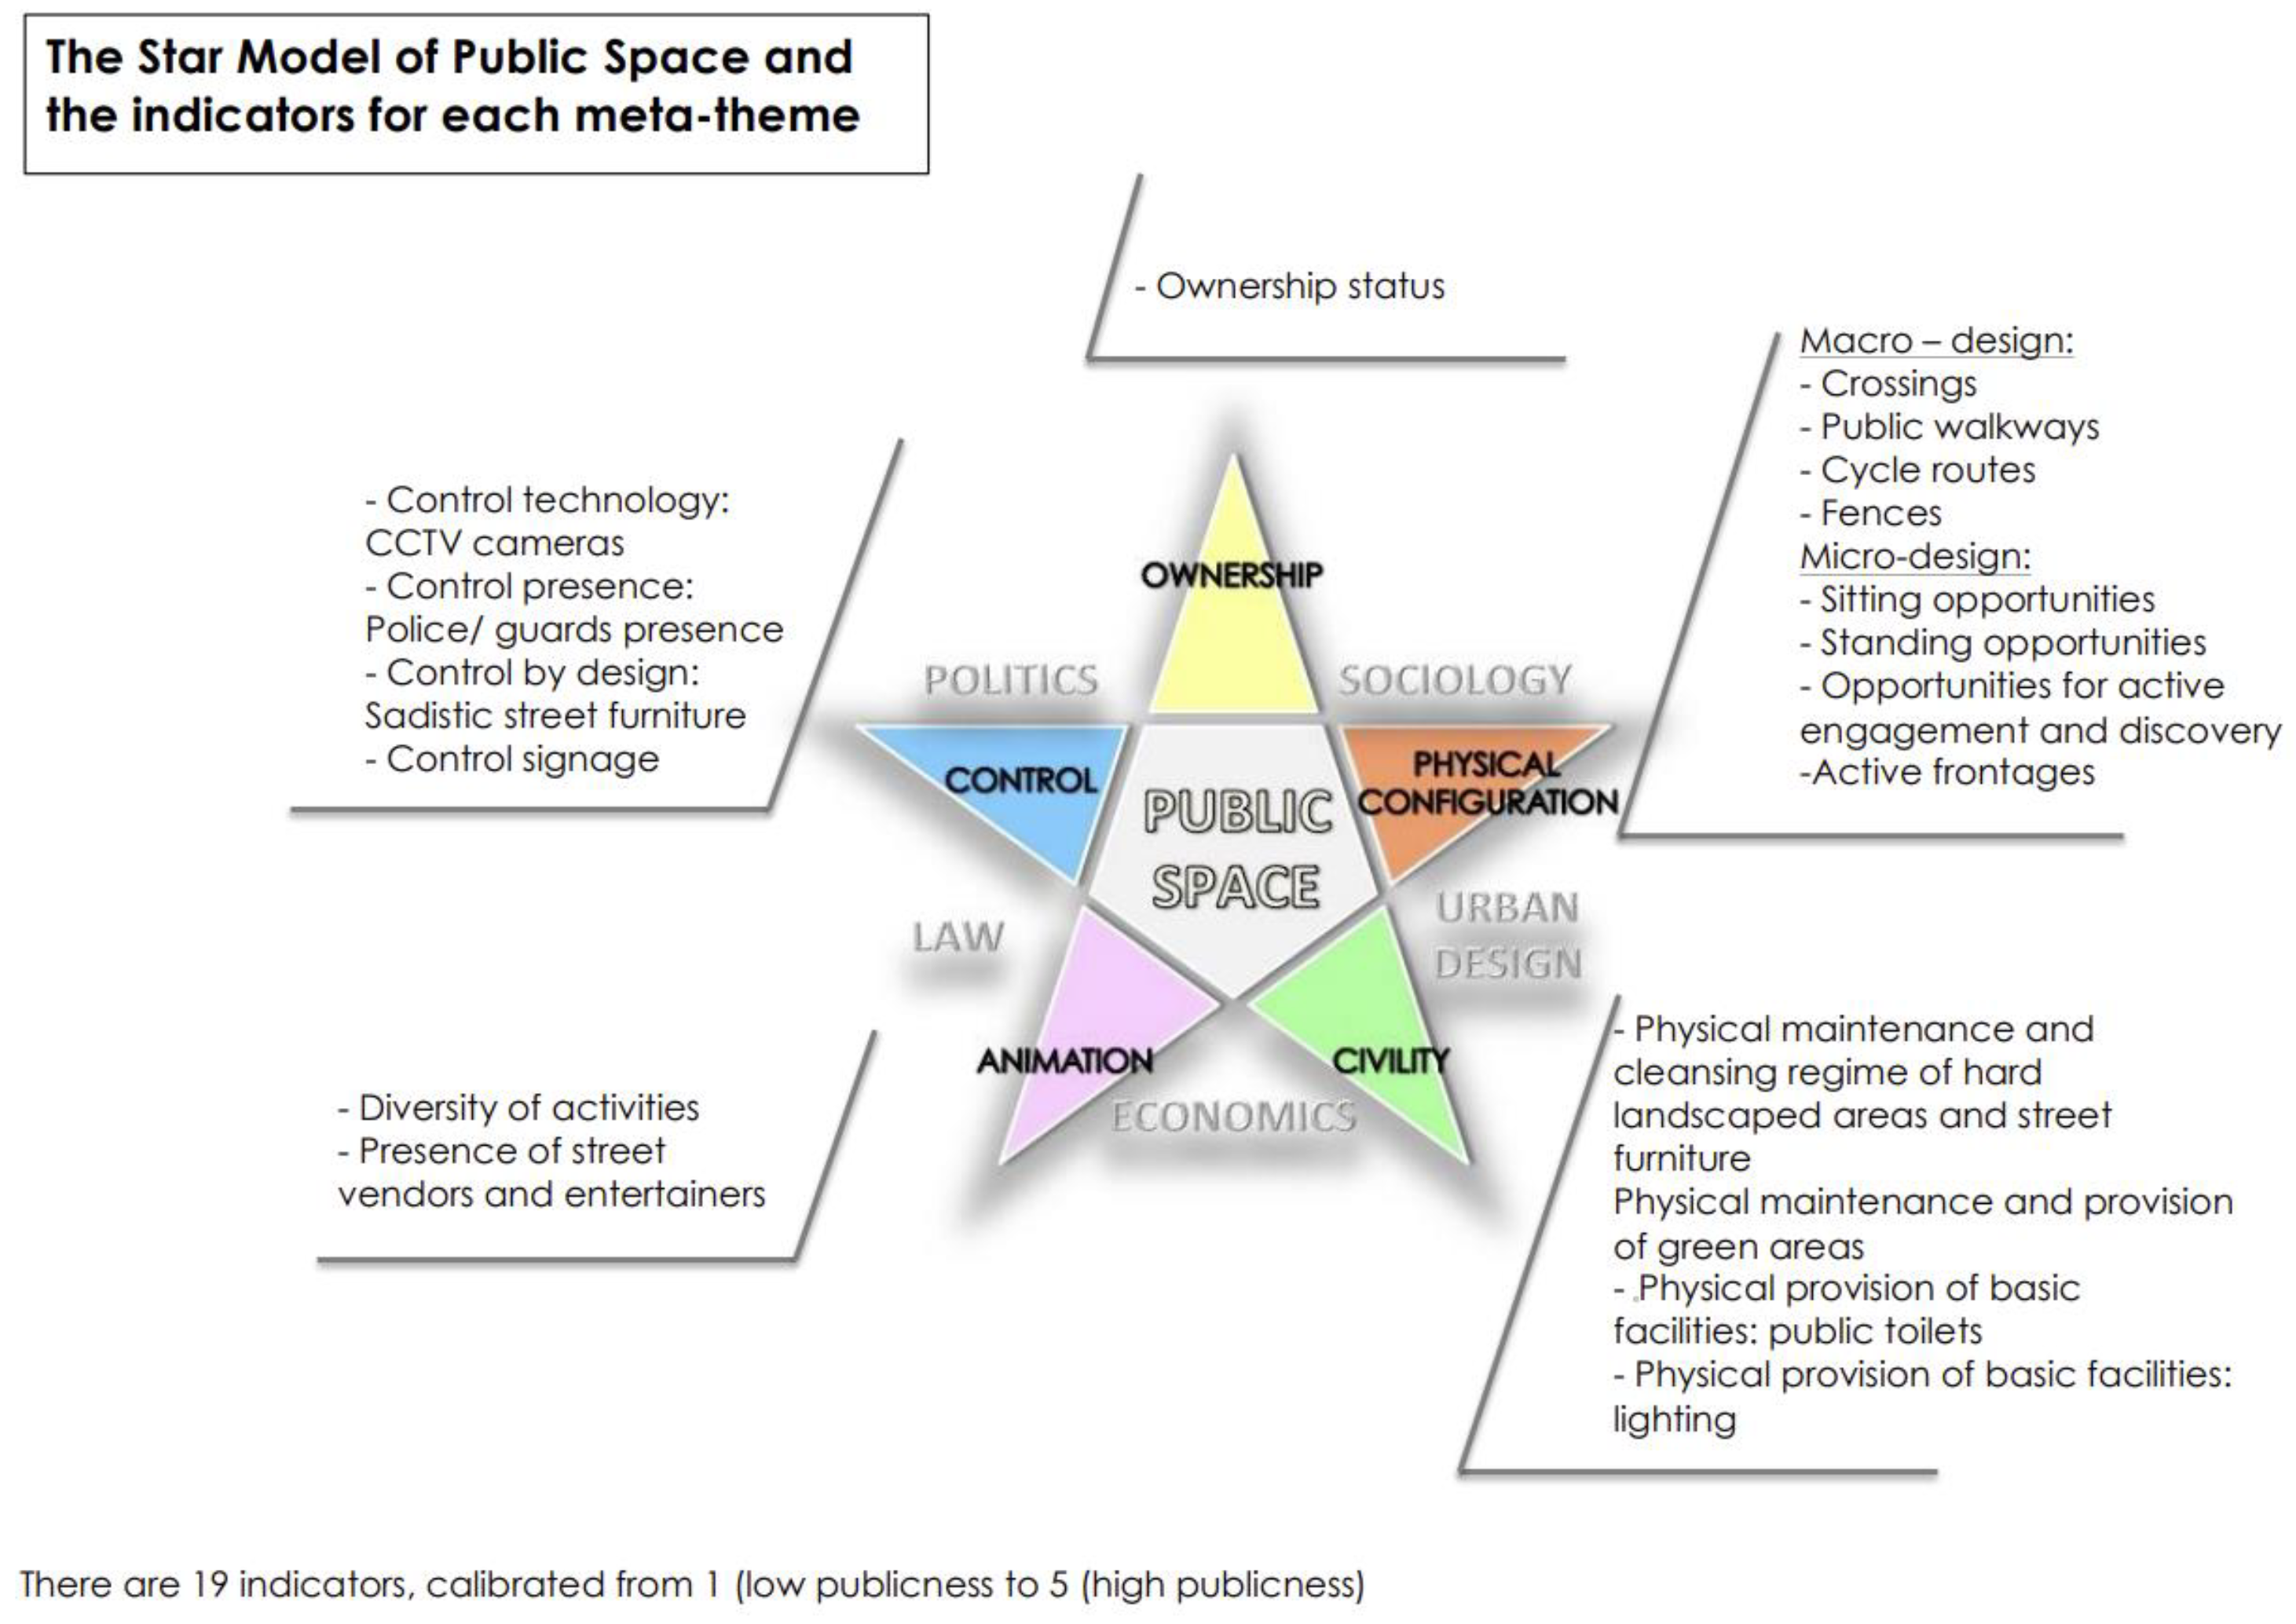
Figure 1. The Star Model of Public Space and indicators for each meta-theme. Source: Varna & Damiano [53].
Sustainability 14 14711 g001
Figure 2. Singapore River (Left), Shanghai Suzhou River (Middle) and traditional neighborhood in Naples (Right). Source: Photos from the Qunar website (Left); Google map (Middle); the authors (Right).
Sustainability 14 14711 g002
Figure 3. The calculation of depth and the input segment map in this research.
Sustainability 14 14711 g003
Figure 4. Spatial distribution of social interaction in the Lychee Bay Park (left) and Yaohua Neighborhood (right).
Sustainability 14 14711 g004
Figure 5. (a) Main POS in the Lychee Bay Area; (b) Main POS in the Yaohua Neighborhood.
Sustainability 14 14711 g005aSustainability 14 14711 g005b
Figure 6. Analysis of (a) Integration (b) Choice (c) Visual Isovist (d) Visual Integration in Lychee Bay Park; (e) Integration (f) Choice (g) Visual Isovist (h) Visual Integration in the Yaohua Neighborhood.
Sustainability 14 14711 g006
Figure 7. Star Model Summary of Lychee Bay Park (left), and Yaohua Neighborhood (right).
Sustainability 14 14711 g007
Figure 8. Comparison of the three assessment results with the actual use (by onsite investigation) of the POS.
Sustainability 14 14711 g008
Figure 9. Two-dimensional graph of POS by the composite publicness index. Notes: HH refers to higher scores in both the Space Syntax and Star model; HL refers to higher scores in the Star model and lower scores in Space Syntax; LH refers to lower scores in the Star model and higher scores in Space Syntax; LL refers to both lower scores in Space Syntax and the Star model. The threshold value of high and low scores is 50%. POS is in the shape of a square, marked with [square] brackets.
Sustainability 14 14711 g009
Table 1. Brief characteristics of different assessments of publicness (compiled by the authors).
ModelDimensions of PublicnessScoring
Criterion
Pictorial
Result
Comparison among CasesApplication
The “spider” diagram of CABE Spaceshaper (2007) [32]access, use, other people, maintenance, environment, design and appearance, community, you-
The publicly accessible spaces index of Németh and Schmidt (2007) [4]laws & rules, surveillance & policing, design & image, access & territoriality--
The “cobweb” model of Van Melik, Van Aalst, and Van Weesep (2007) [26]criteria of secured public space: surveillance, restraints on loitering, regulation
criteria of themed public space: events, fun-shopping, pavement cafés
--
The Star Model of Varna and Tiesdell (2010) [11]ownership, control, civility, animation, physical configuration
Scotland & Northern Europe
The “tri-axial” model of Németh and Schmidt (2011) [33]ownership, control, civility, animation, physical configuration-
New York, USA
The “OMAI” model of Langstraat and Van Melik (2013) [26]ownership, management, uses/users-
The “public space index” of Mehta (2014) [34]ownership, management, accessibility, inclusiveness-
Padang, Indonesia
The “fuzzy logic” model of Ekdi and Çıracı (2015) [38]inclusiveness, meaningful activities, comfort, safety, pleasure--
The “six-axial” mode of Mantey (2017) [35]accessibility, management, user-
Poland
AHP method, represented by Emad Mushtaha et al., 2020 [37]environmental quality, social & culture elements, accessibility and safety, amenities and services
Sharjah, UAE
SD method, represented by Perović et al. (2019) [40]; Herranz-Pascual et al., 2022 [41]visual, tactile, and auditory perception
Podgorica, Montenegro
✔ those functions that the model has considered well; those functions that the model has considered in parts only. Source: summarized by the authors.
Table 2. Basic information on Lychee Bay Park and Yaohua Neighborhood, 2020.
Lychee Bay ParkYaohua Neighborhood
Area6.5 ha7.1 ha
Building area193,412 m2148,047 m2
Population3273 persons4949 persons
Population density50,354 person/km269,704 person/km2
Source: 2020 National Population Census, Guangzhou Regulatory Plan.
Table 3. Scoring criteria for each meta-dimension.
More Public Less Public
54321
(1)
Ownership
Both ownership, function and use are publicBoth ownership and function are public; use is administrativeOne attribute is privateTwo attributes are privateBoth ownership, function and use are private
(2)
Control
Purpose of controlProtecting the freedoms and liberties of citizensProtecting the interests of the powerful
Control strategiesRules, policing, security guards and CCTV cameras all protecting people rather than property, from harmMost strategies protect peopleHalf & halfMost strategies protect propertyRules, policing, security guards and CCTV cameras all prohibiting certain behaviors or groups to promote profitability or marketability
(3)
Civility
Physical maintenance and cleansing regimeEmptying of bins; cleansing of graffiti; repairs; well-maintained green spaces; clean public toiletsOne regime gets one score
Physical provision of facilitiesUniversal design; shelter or trees; lighting; food vendors; formal seatingOne regime gets one score
(4)
Animation
Opportunities for passive & active engagement and discovery & displayVarious types of seating, diversity of events and activities occur whether spontaneously or programmed, art and culture enhancement, informal space can be used for different functions
(5)
Physical Configuration
Centrality and connectednessCentrality within the overall movement network; desire lines within surrounding area do or do not continue into and through the space.
Visual accessVisual permeability or access is the ability to see into a place.
Thresholds and gatewaysThe more evident the threshold, the greater its potential significance as a decision point. Thresholds also relate to physical access.
Source: Modified from Indicators of publicness for each meta-dimension based on Marcuse [11]; Varna & Tiesdell [11].
Table 4. Value of the Space Syntax simulation.
Lychee Bay ParkYaohua NeighborhoodWhole Area Including 1 km Radius of Two Sites
Average NAIN883011,0577367
Average NACH20,245,28330,241,14215,365,035
Average Isovist Area32107193929
Average Visual Integration3.655.098.74
Table 5. Results of different assessments of the studied POS in the two cases.
Lychee Bay ParkYaohua Neighborhood
POSTypeStar Model ScoreSpace Syntax ScoreCombined ToolPOSTypeStar Model ScoreSpace Syntax ScoreCombined Tool
1street31.35%66.00%48.68%13street29.08%20.85%24.97%
2street36.01%36.67%36.34%14street69.80%10.37%40.09%
3street20.00%58.23%39.12%15street40.00%42.59%41.30%
4street20.00%51.48%35.74%16street35.97%45.85%40.91%
5street36.90%53.41%45.15%17street34.41%34.22%34.32%
6street43.38%8.00%25.69%18street30.30%55.67%42.98%
[7]square27.80%25.47%26.63%19street25.00%49.66%37.33%
[8]square85.00%66.29%75.65%20street15.00%37.58%26.29%
[9]square75.00%18.03%46.51%21street25.00%76.77%50.88%
10street95.00%25.29%60.14%
11street20.00%73.84%46.92%
[12]square70.78%100.00%85.39%
Note: square type of POS is marked with square brackets.
Table 6. Comparison of the actual application of Space Syntax and Star Model for POS.
Space SyntaxStar Model
MethodQuantitativeQualitative
Assessed targetPhysical function, spatial flowPhysical and social function, place
StrengthsScientifically evaluates the influence of spatial configuration on publicness of POS and portrays in spatial flows patternReflects various dimensions of publicness of open spaces, which are highly generalized as ownership, control, civility, animation, physical configuration
Effectiveness in different casesMore effective in bottom-up POSMore effective in top-down POS
Publisher’s Note: MDPI stays neutral with regard to jurisdictional claims in published maps and institutional affiliations.