
The Effect of Pore Pressure on the Mechanical Behavior of Coal with Burst Tendency at a Constant Effective Stress


Abstract
:1. Introduction
2. Materials and Methods
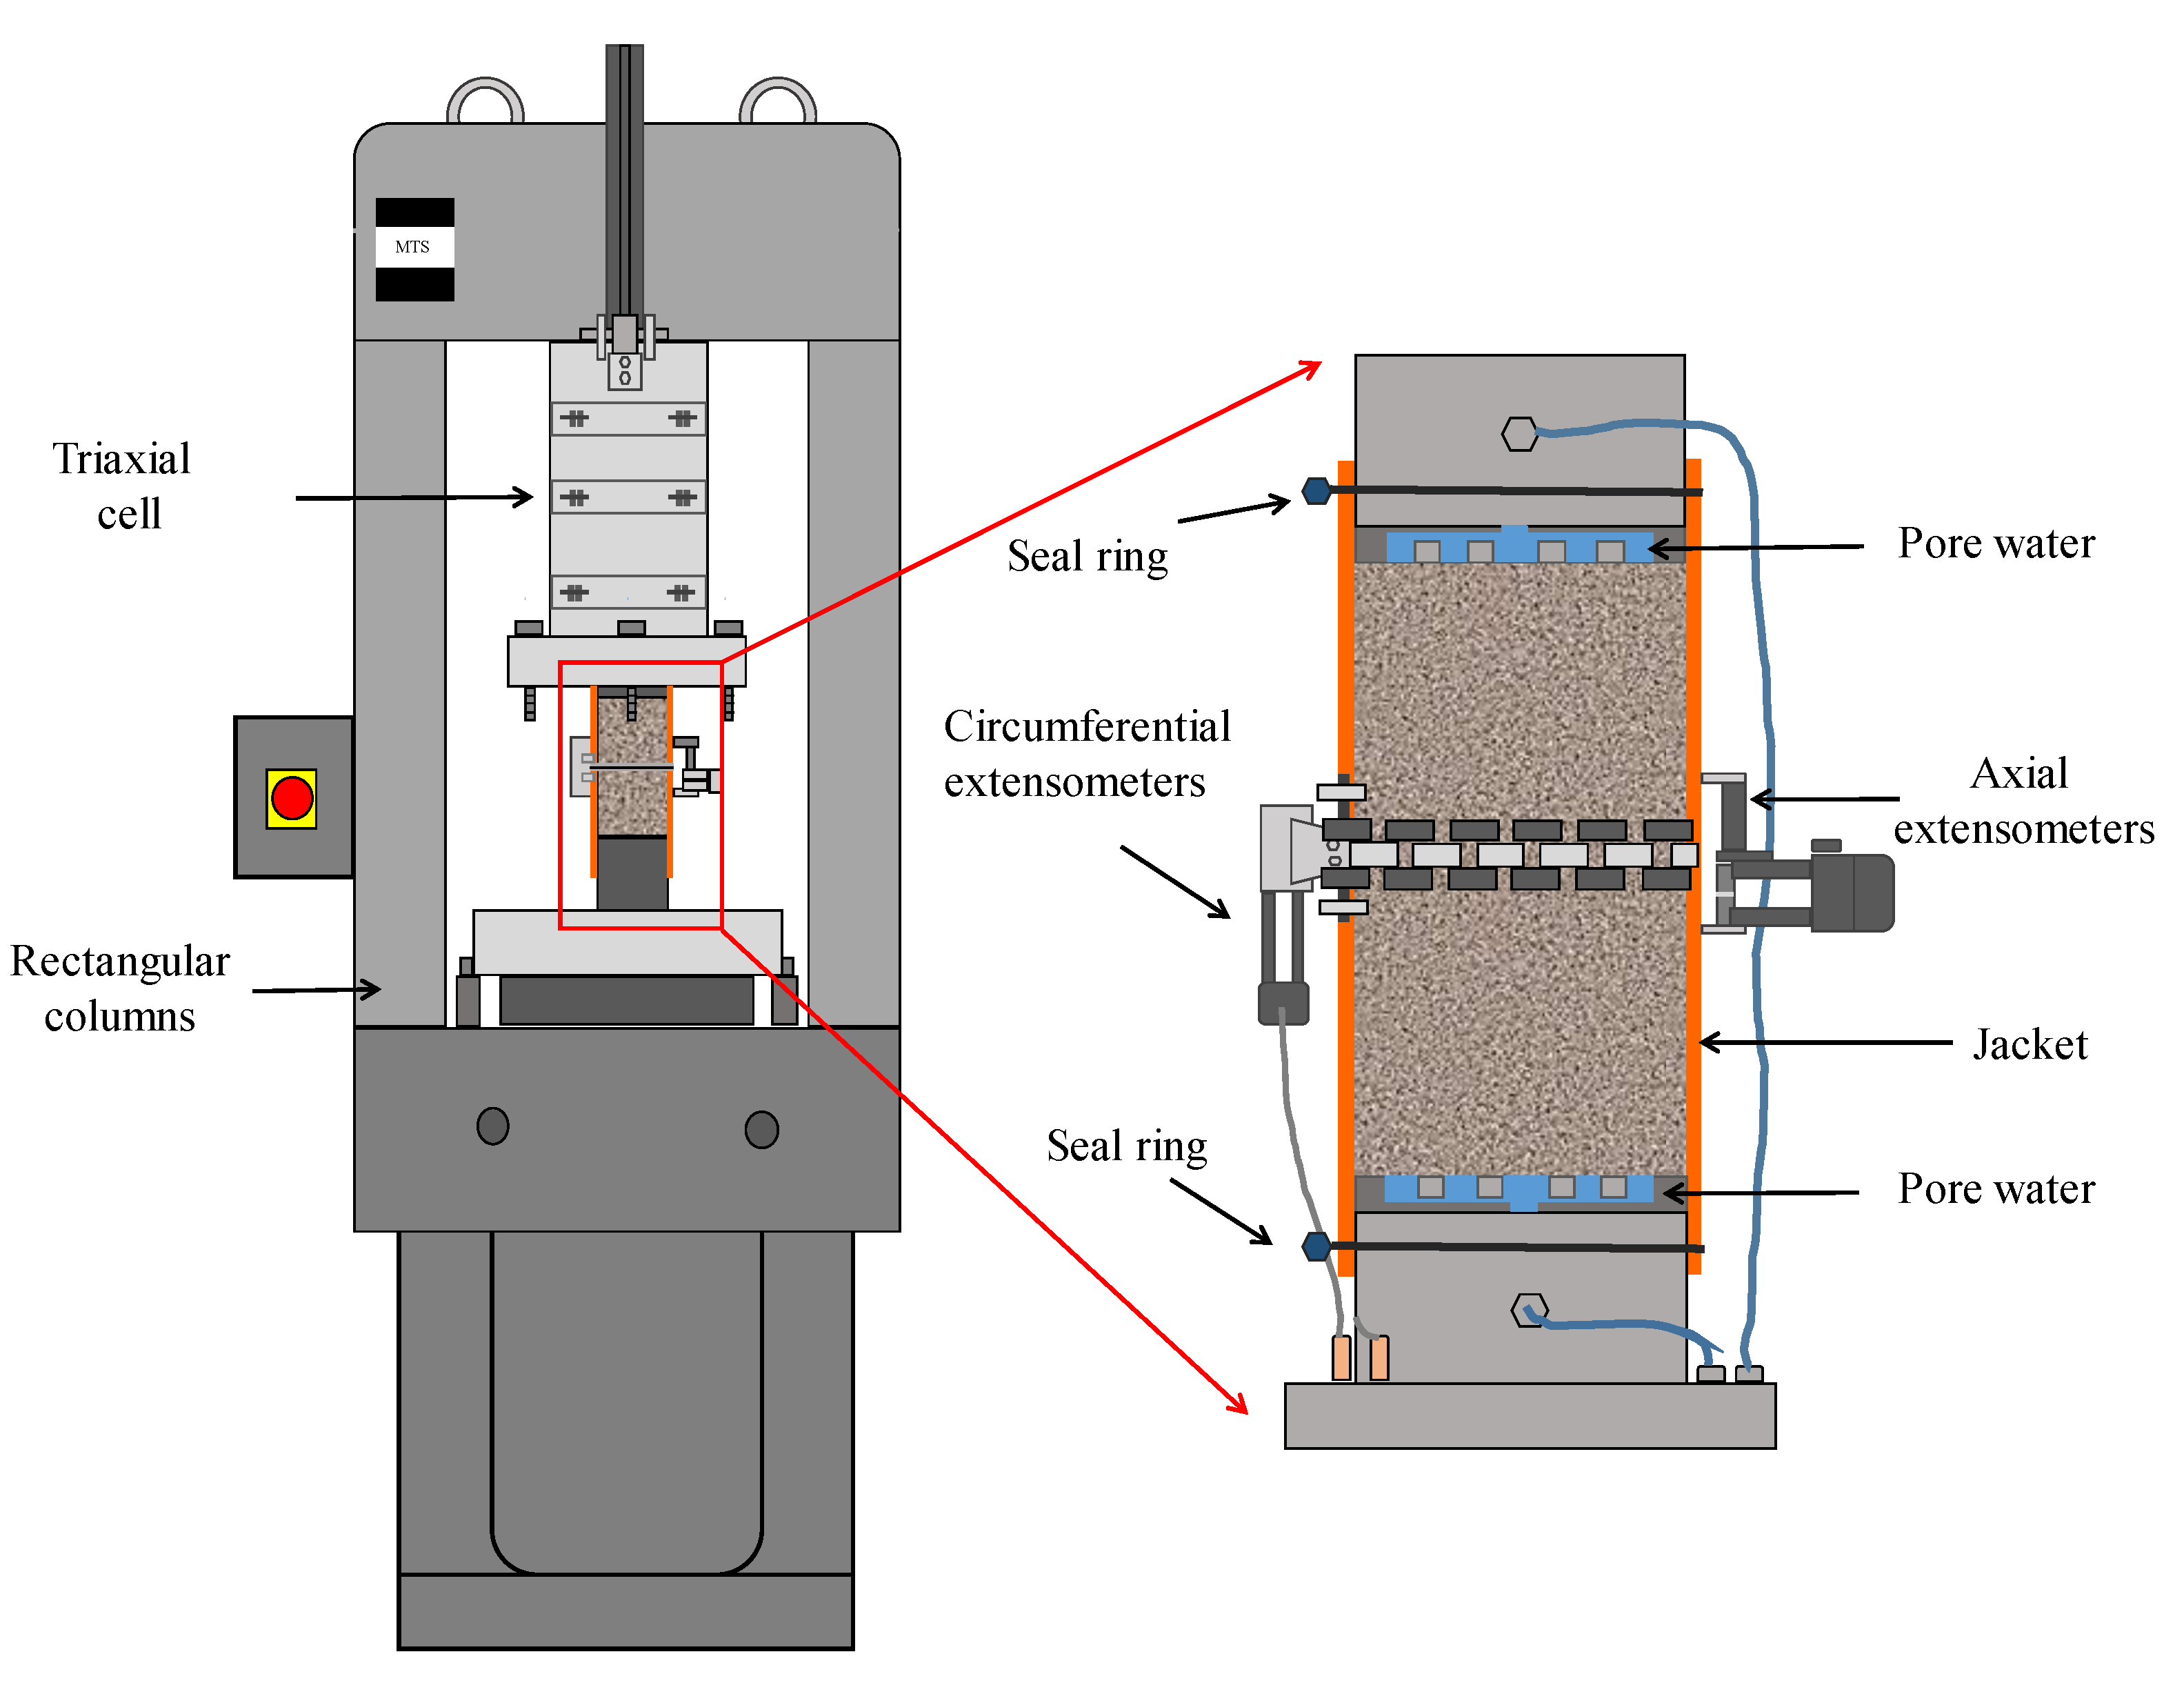
2.1. Test Apparatus
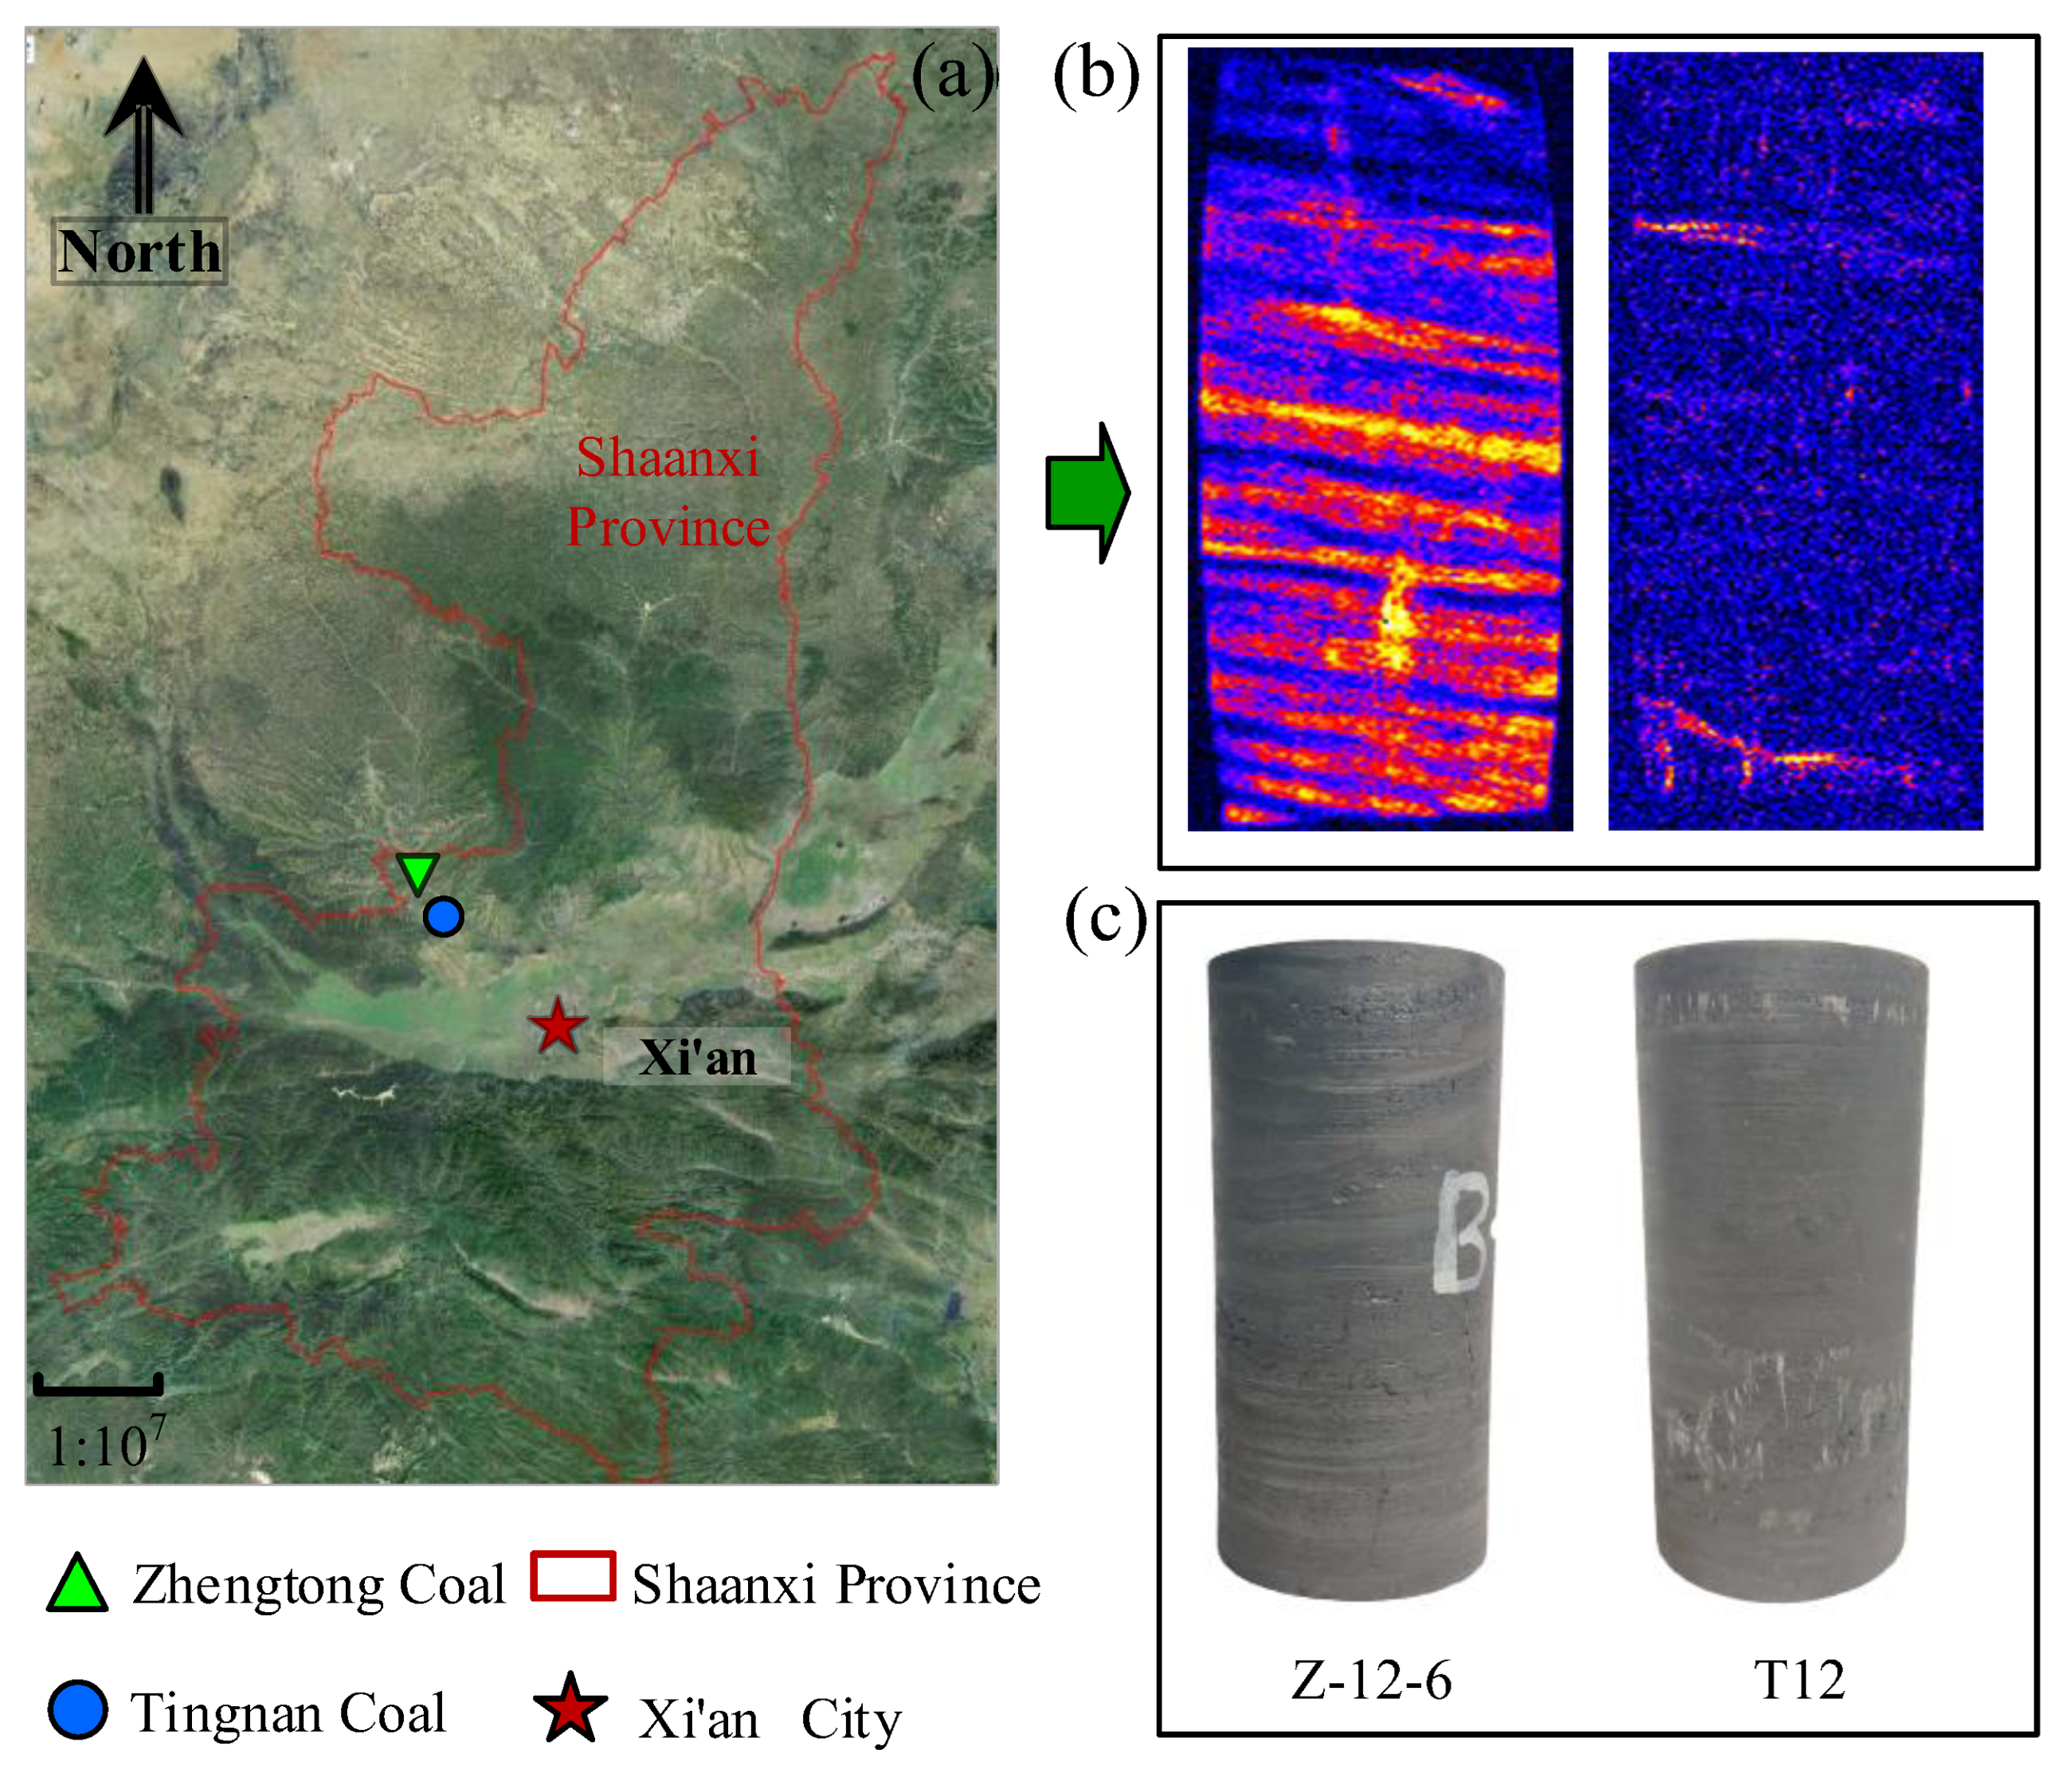
2.2. Samples
2.3. Testing Methods
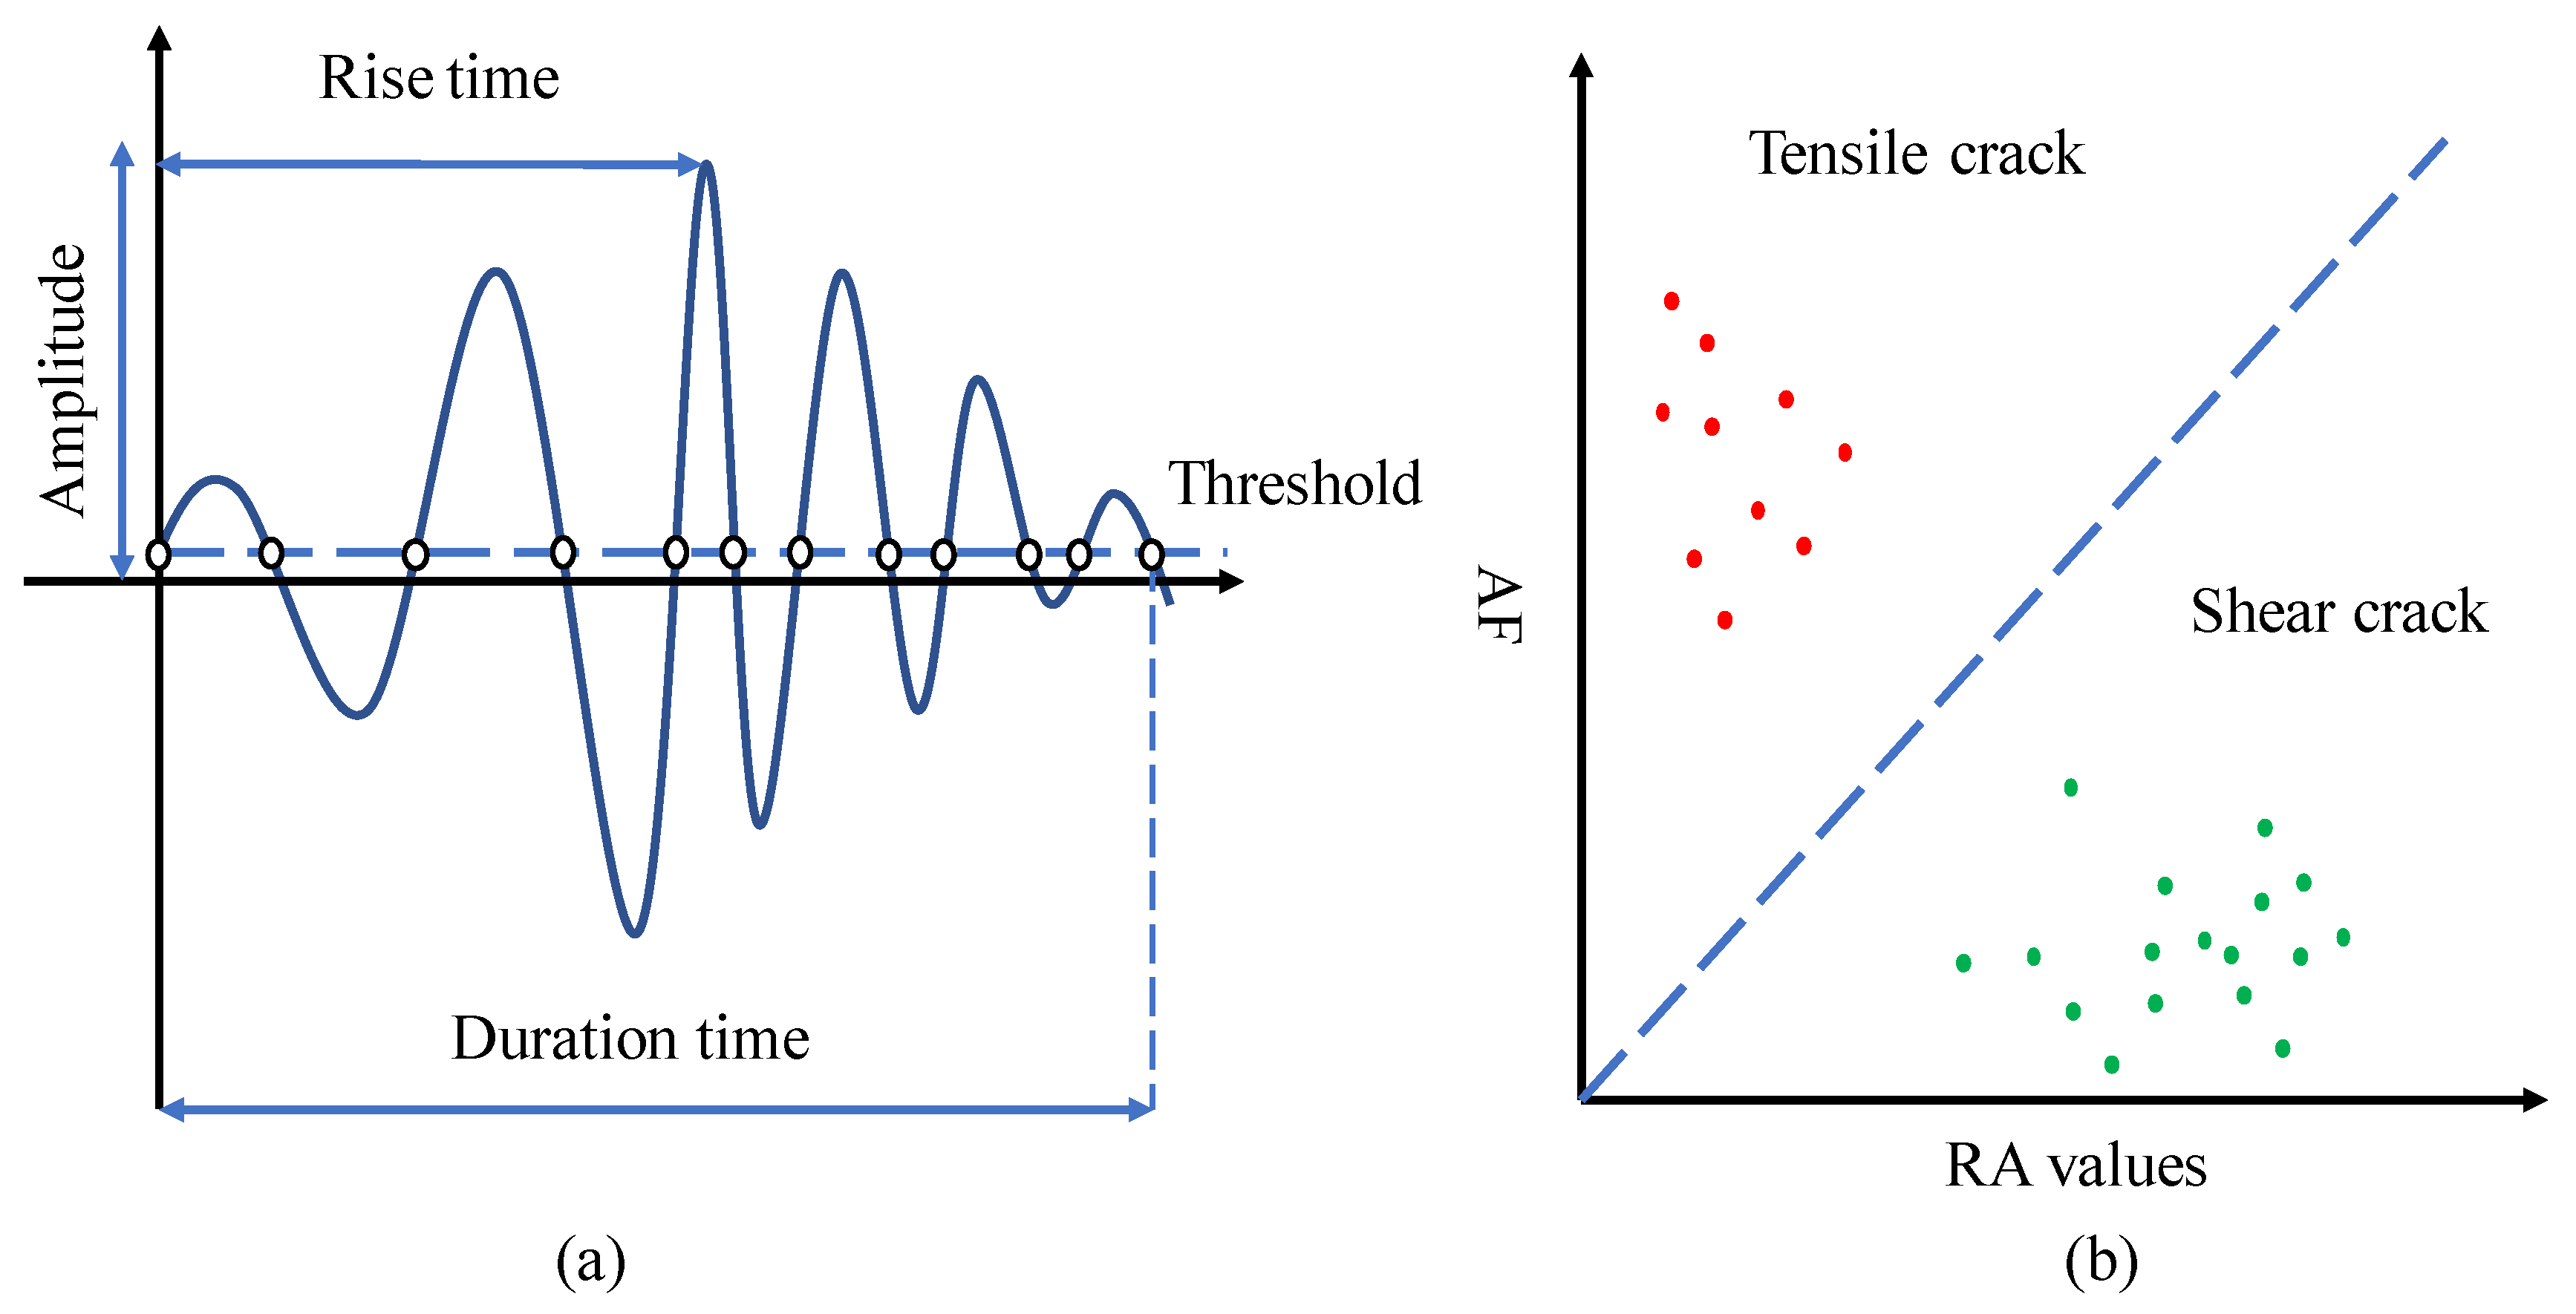
2.4. AE Analysis Methods
3. Experimental Results
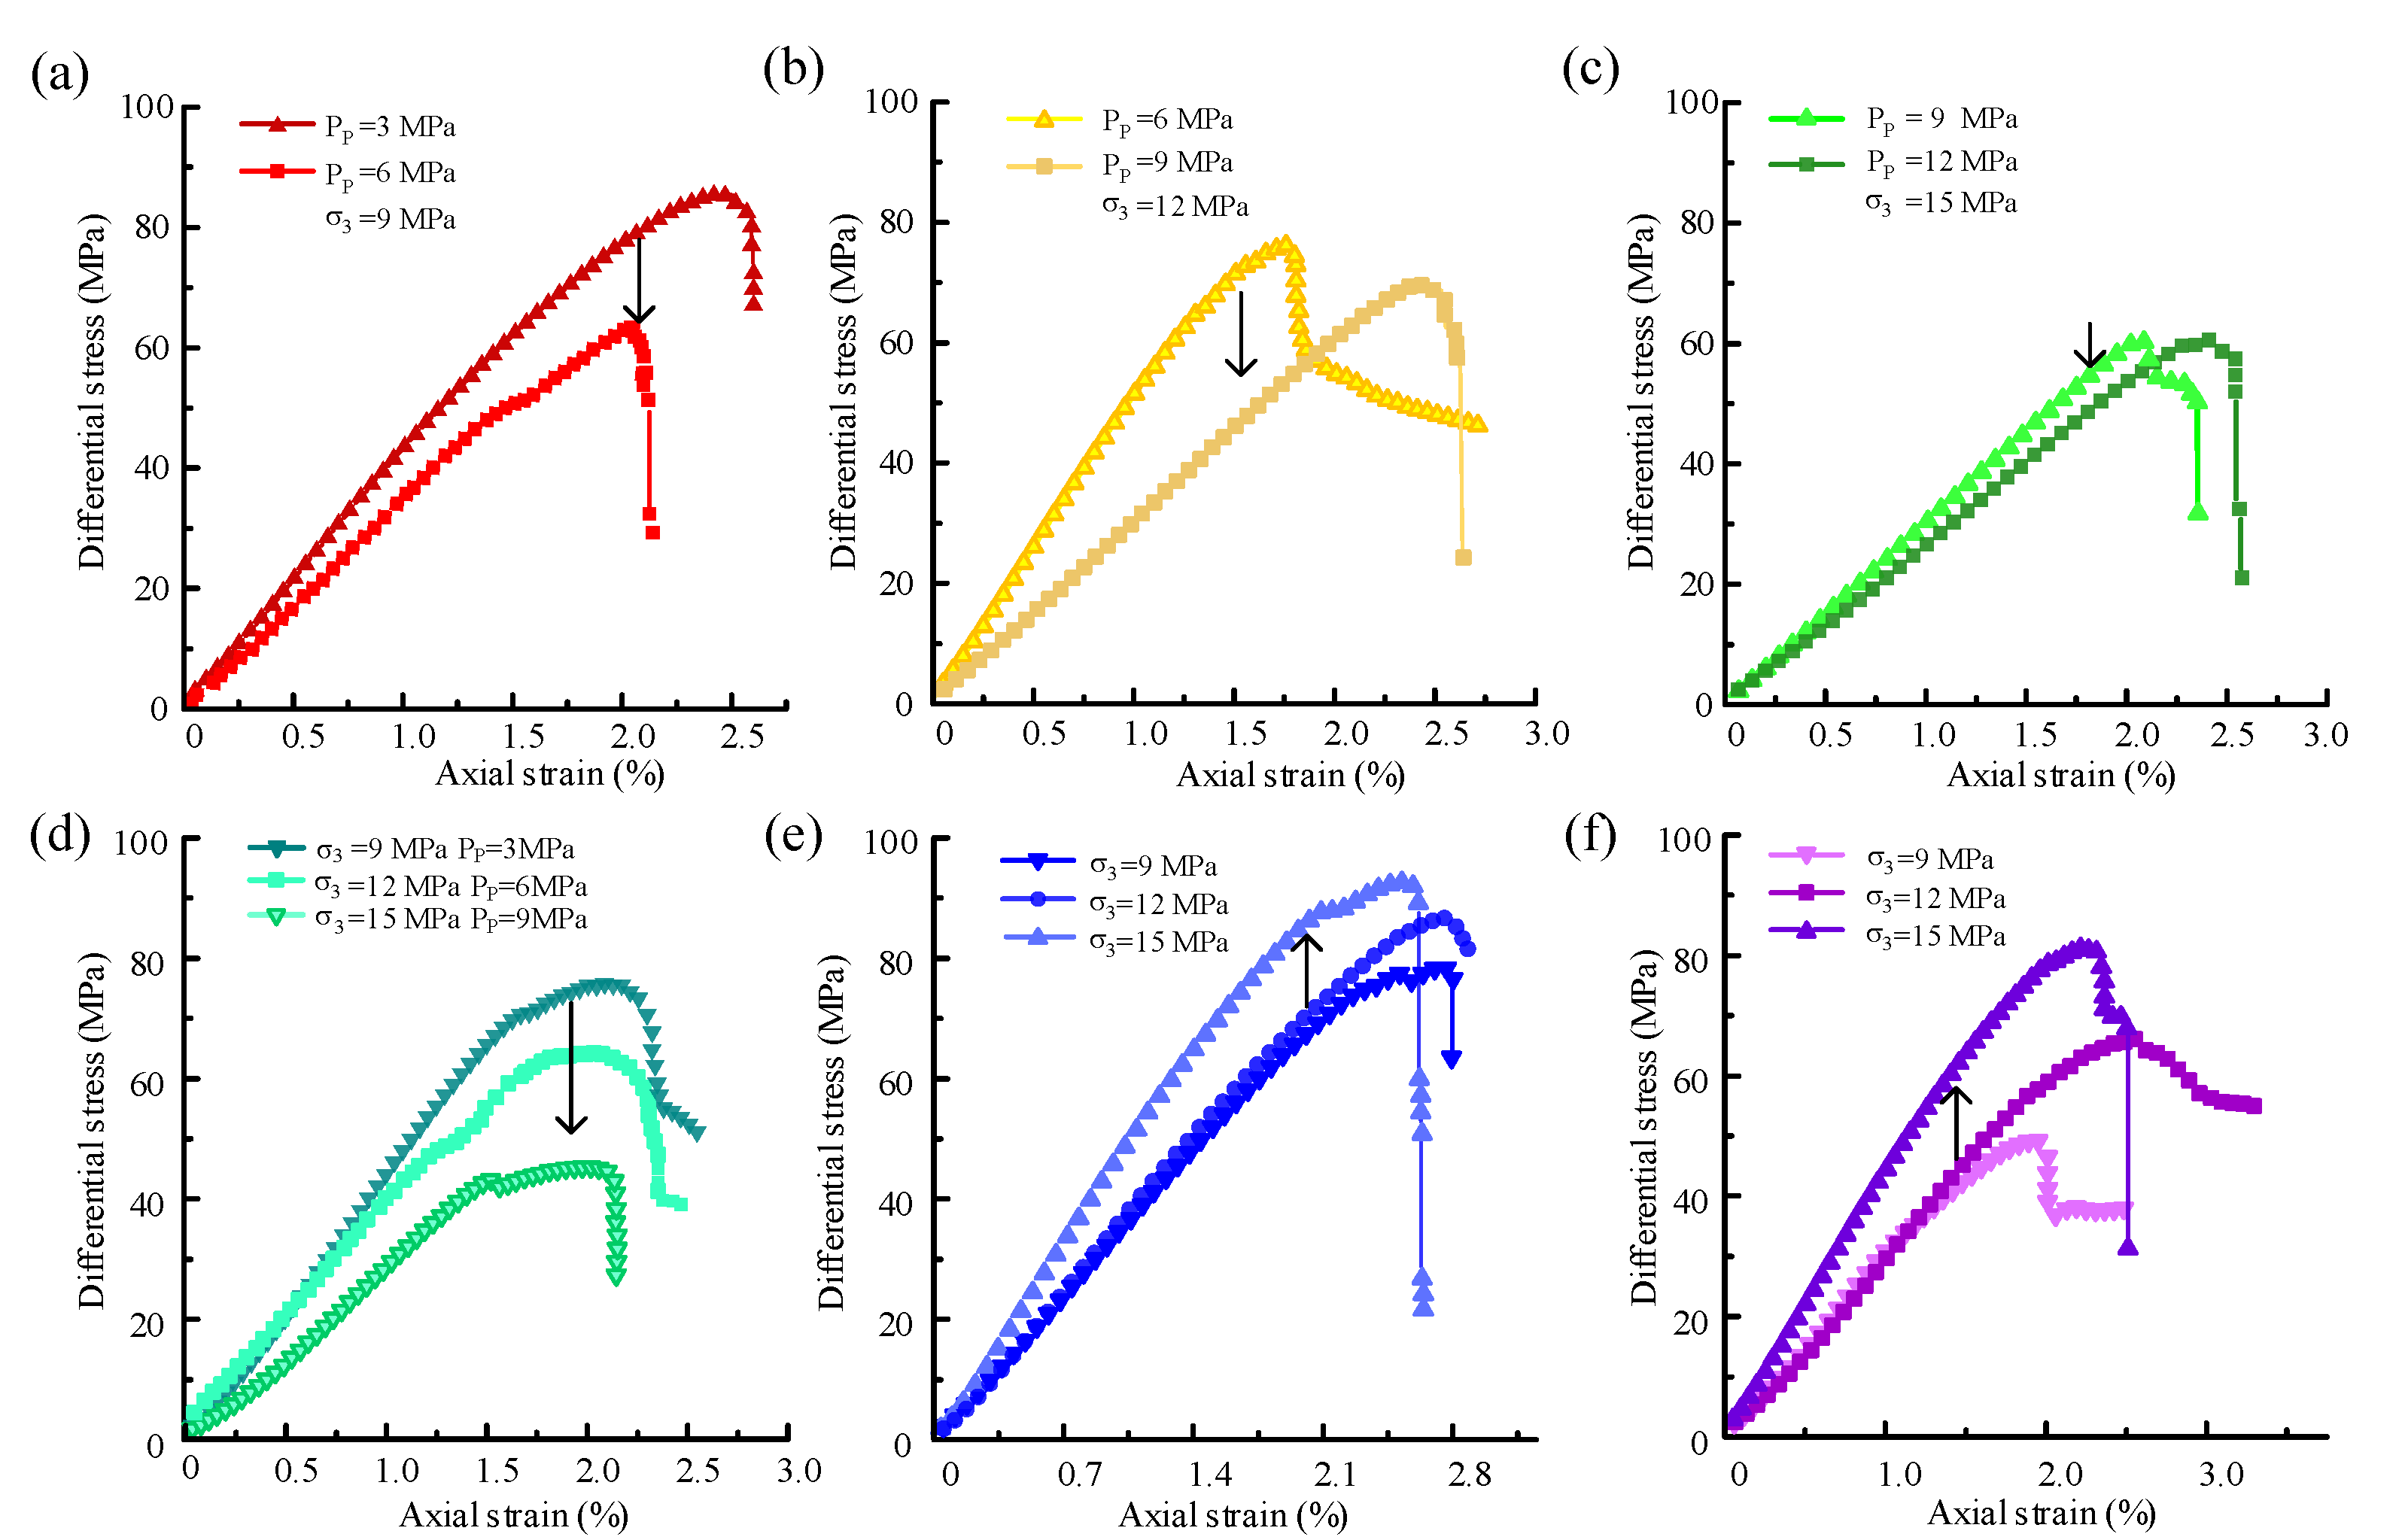
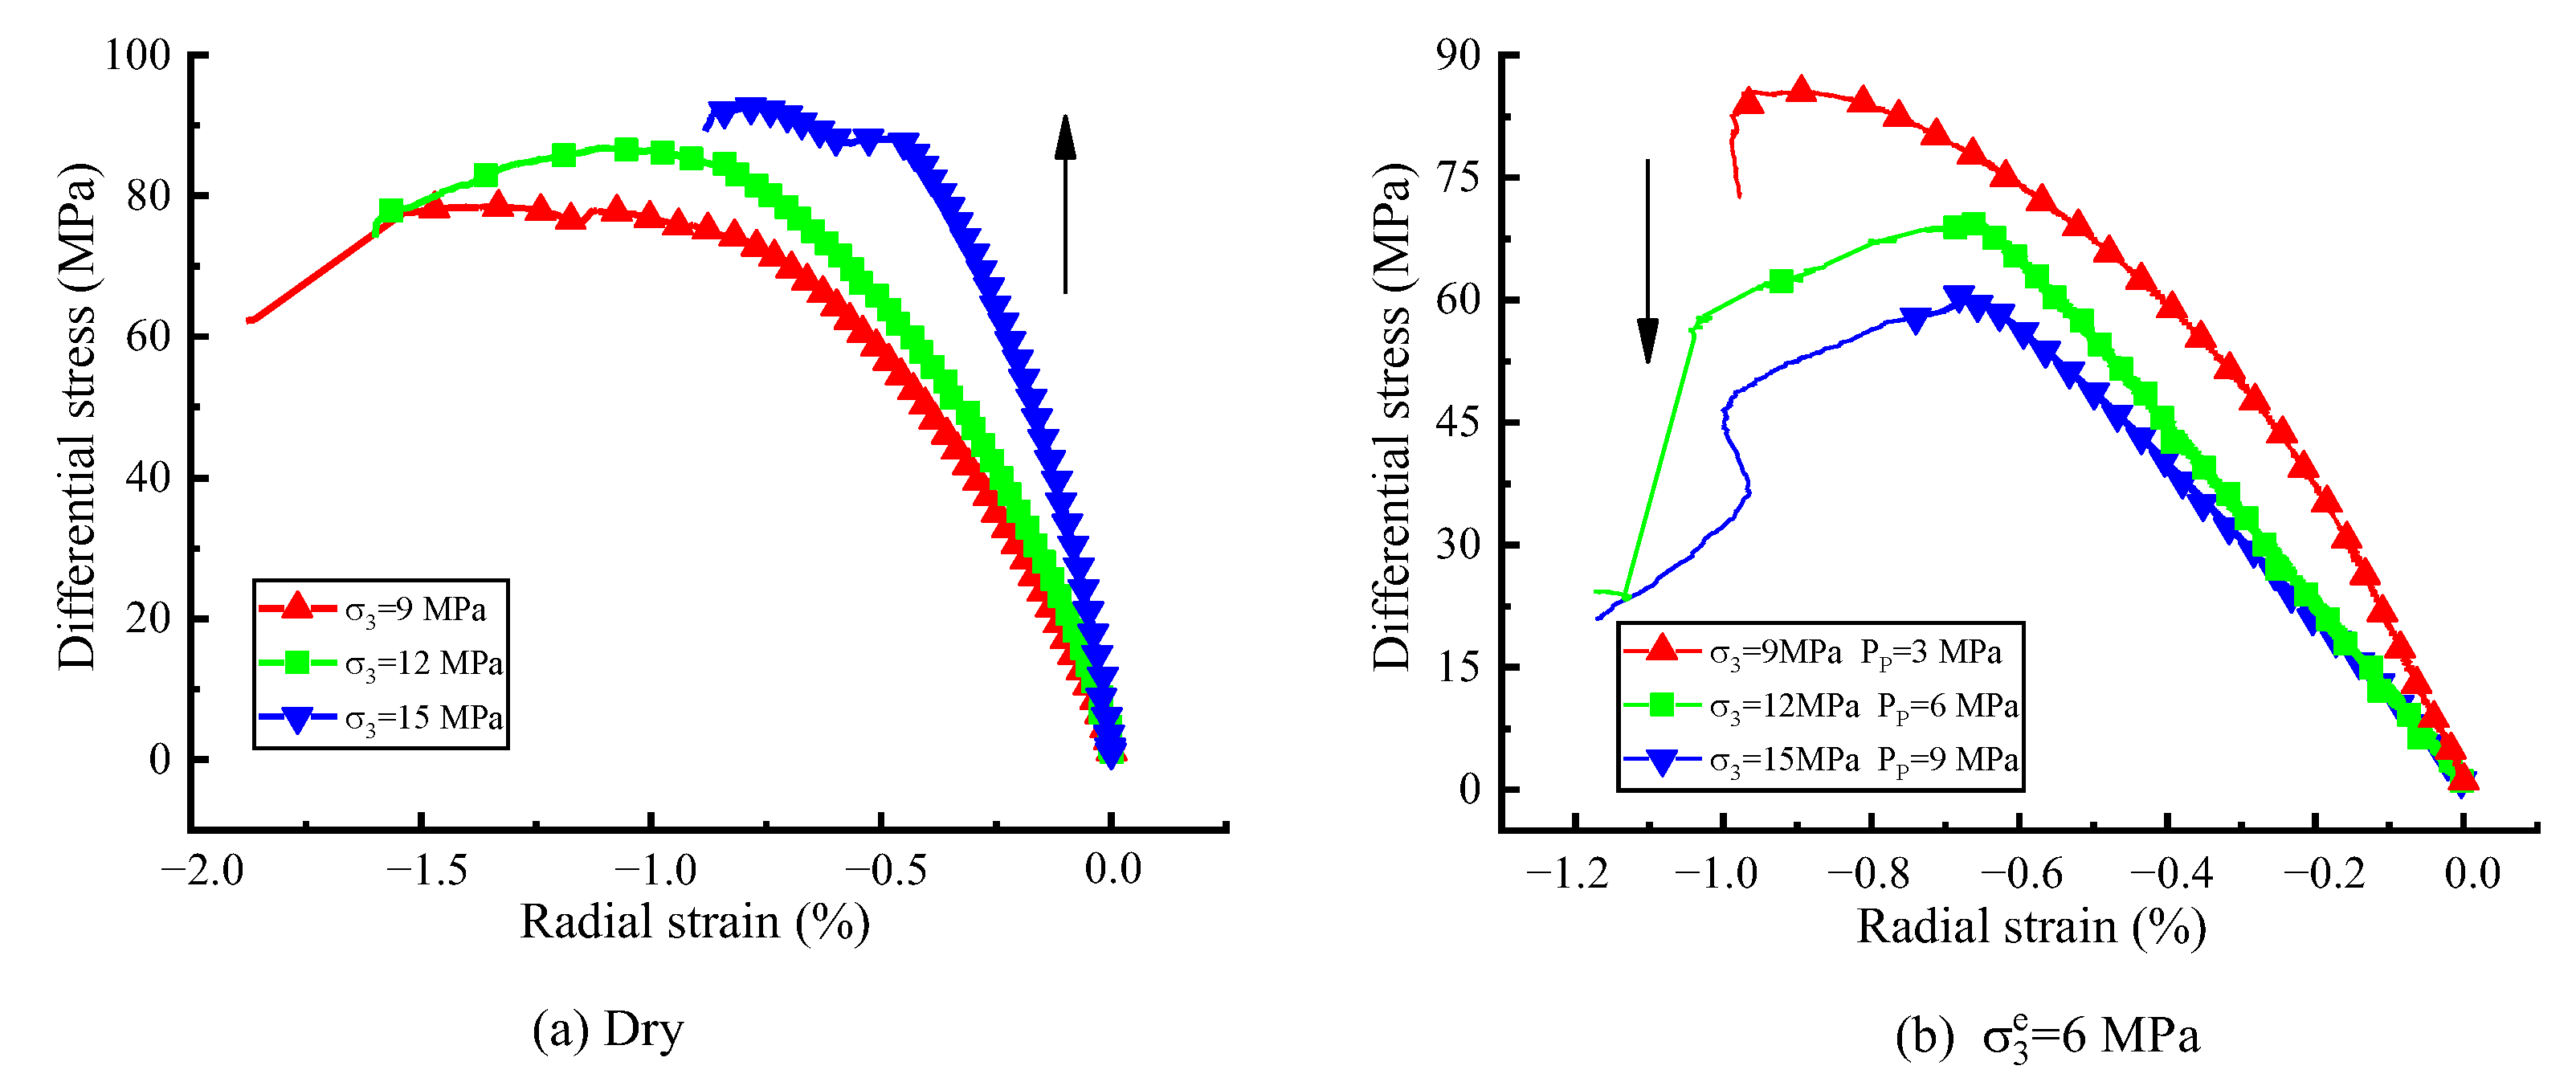
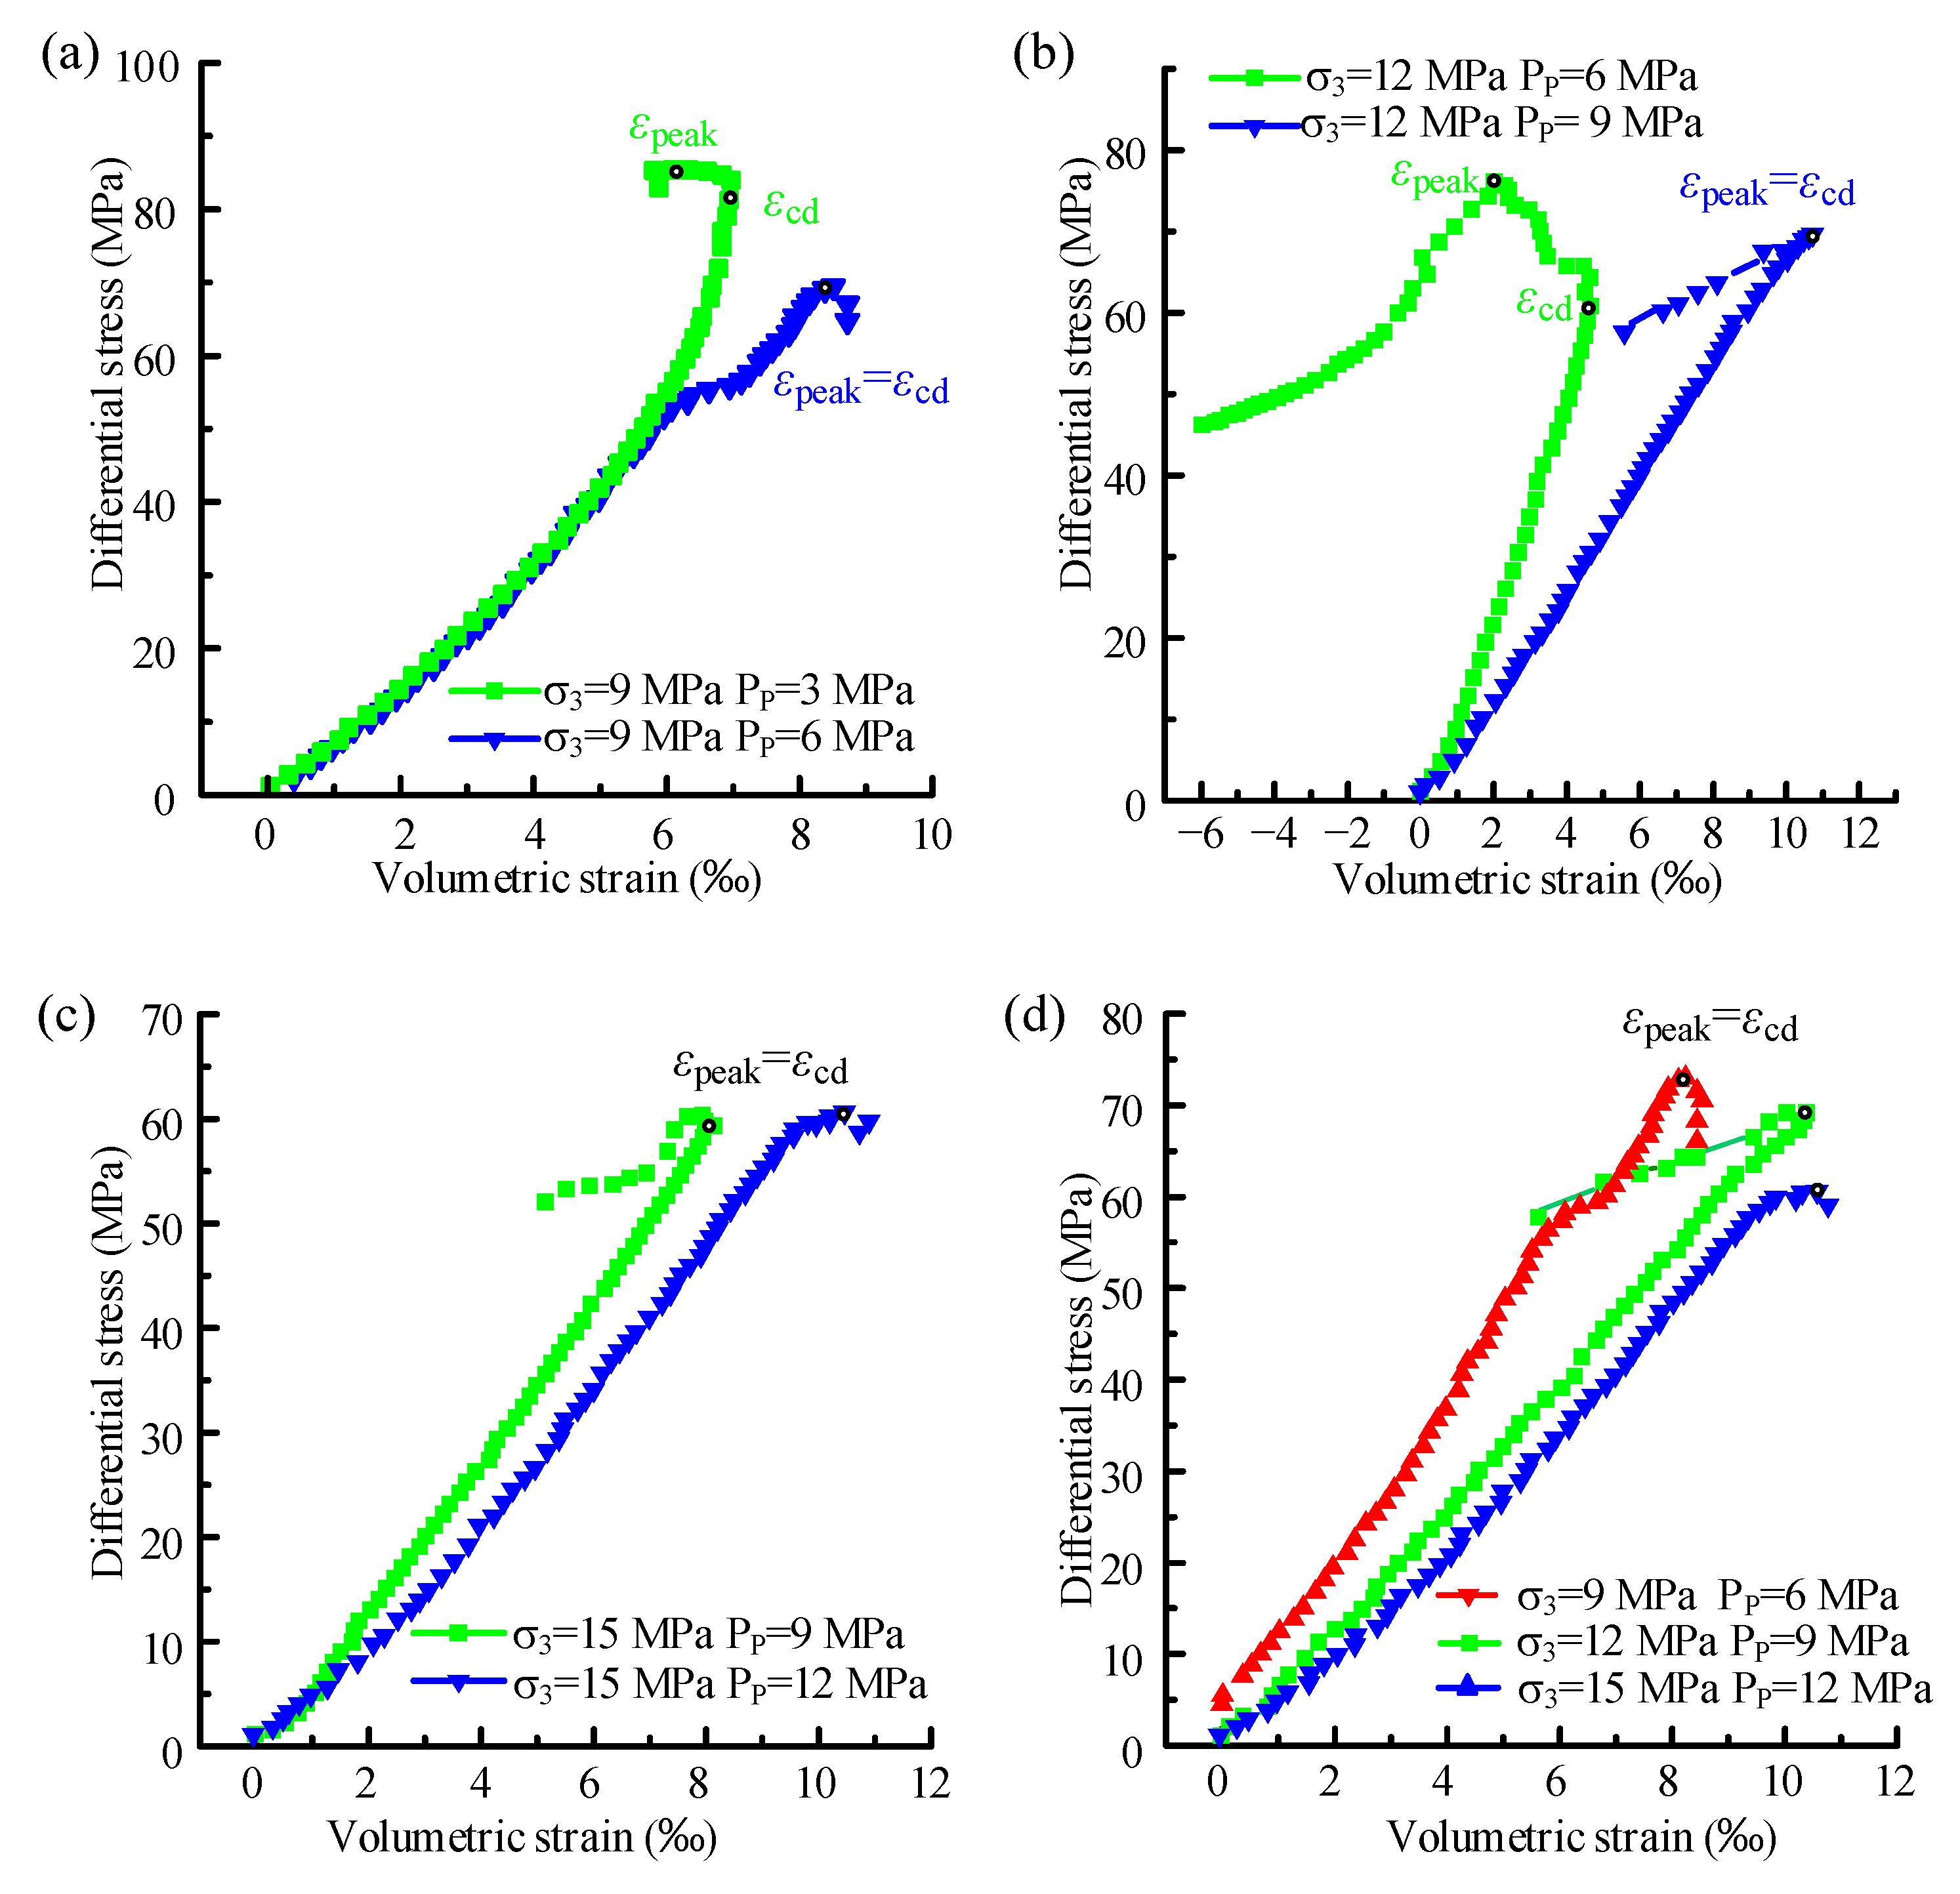
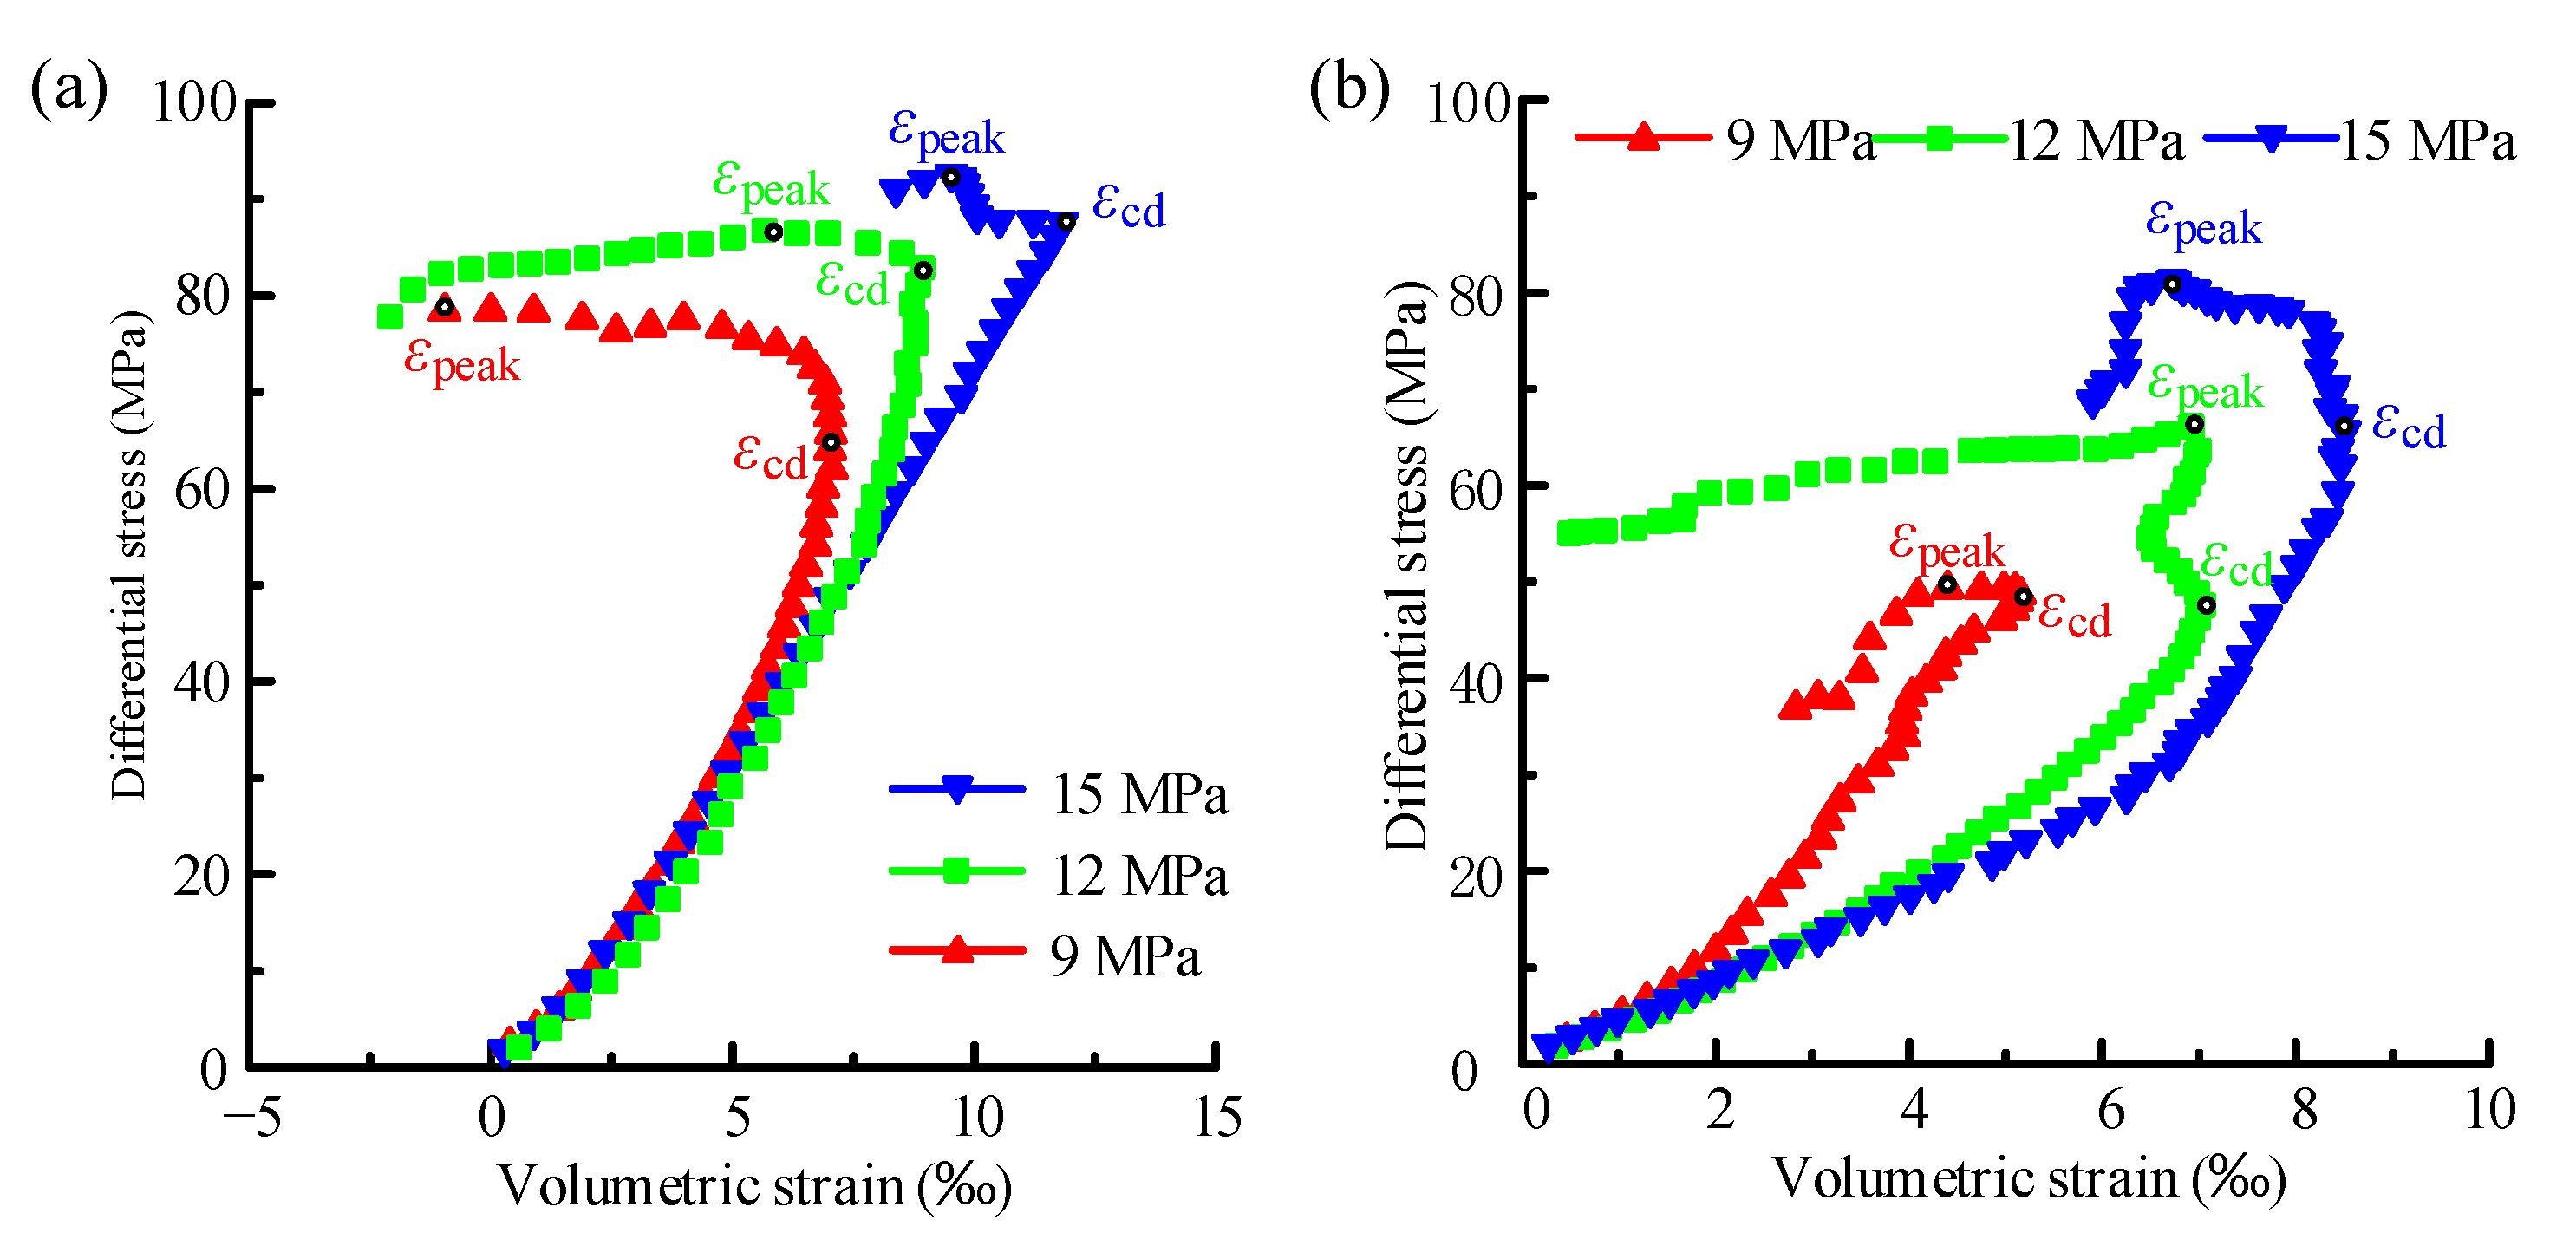
3.1. Effect of Pore Pressure on the Stress–Strain Curves
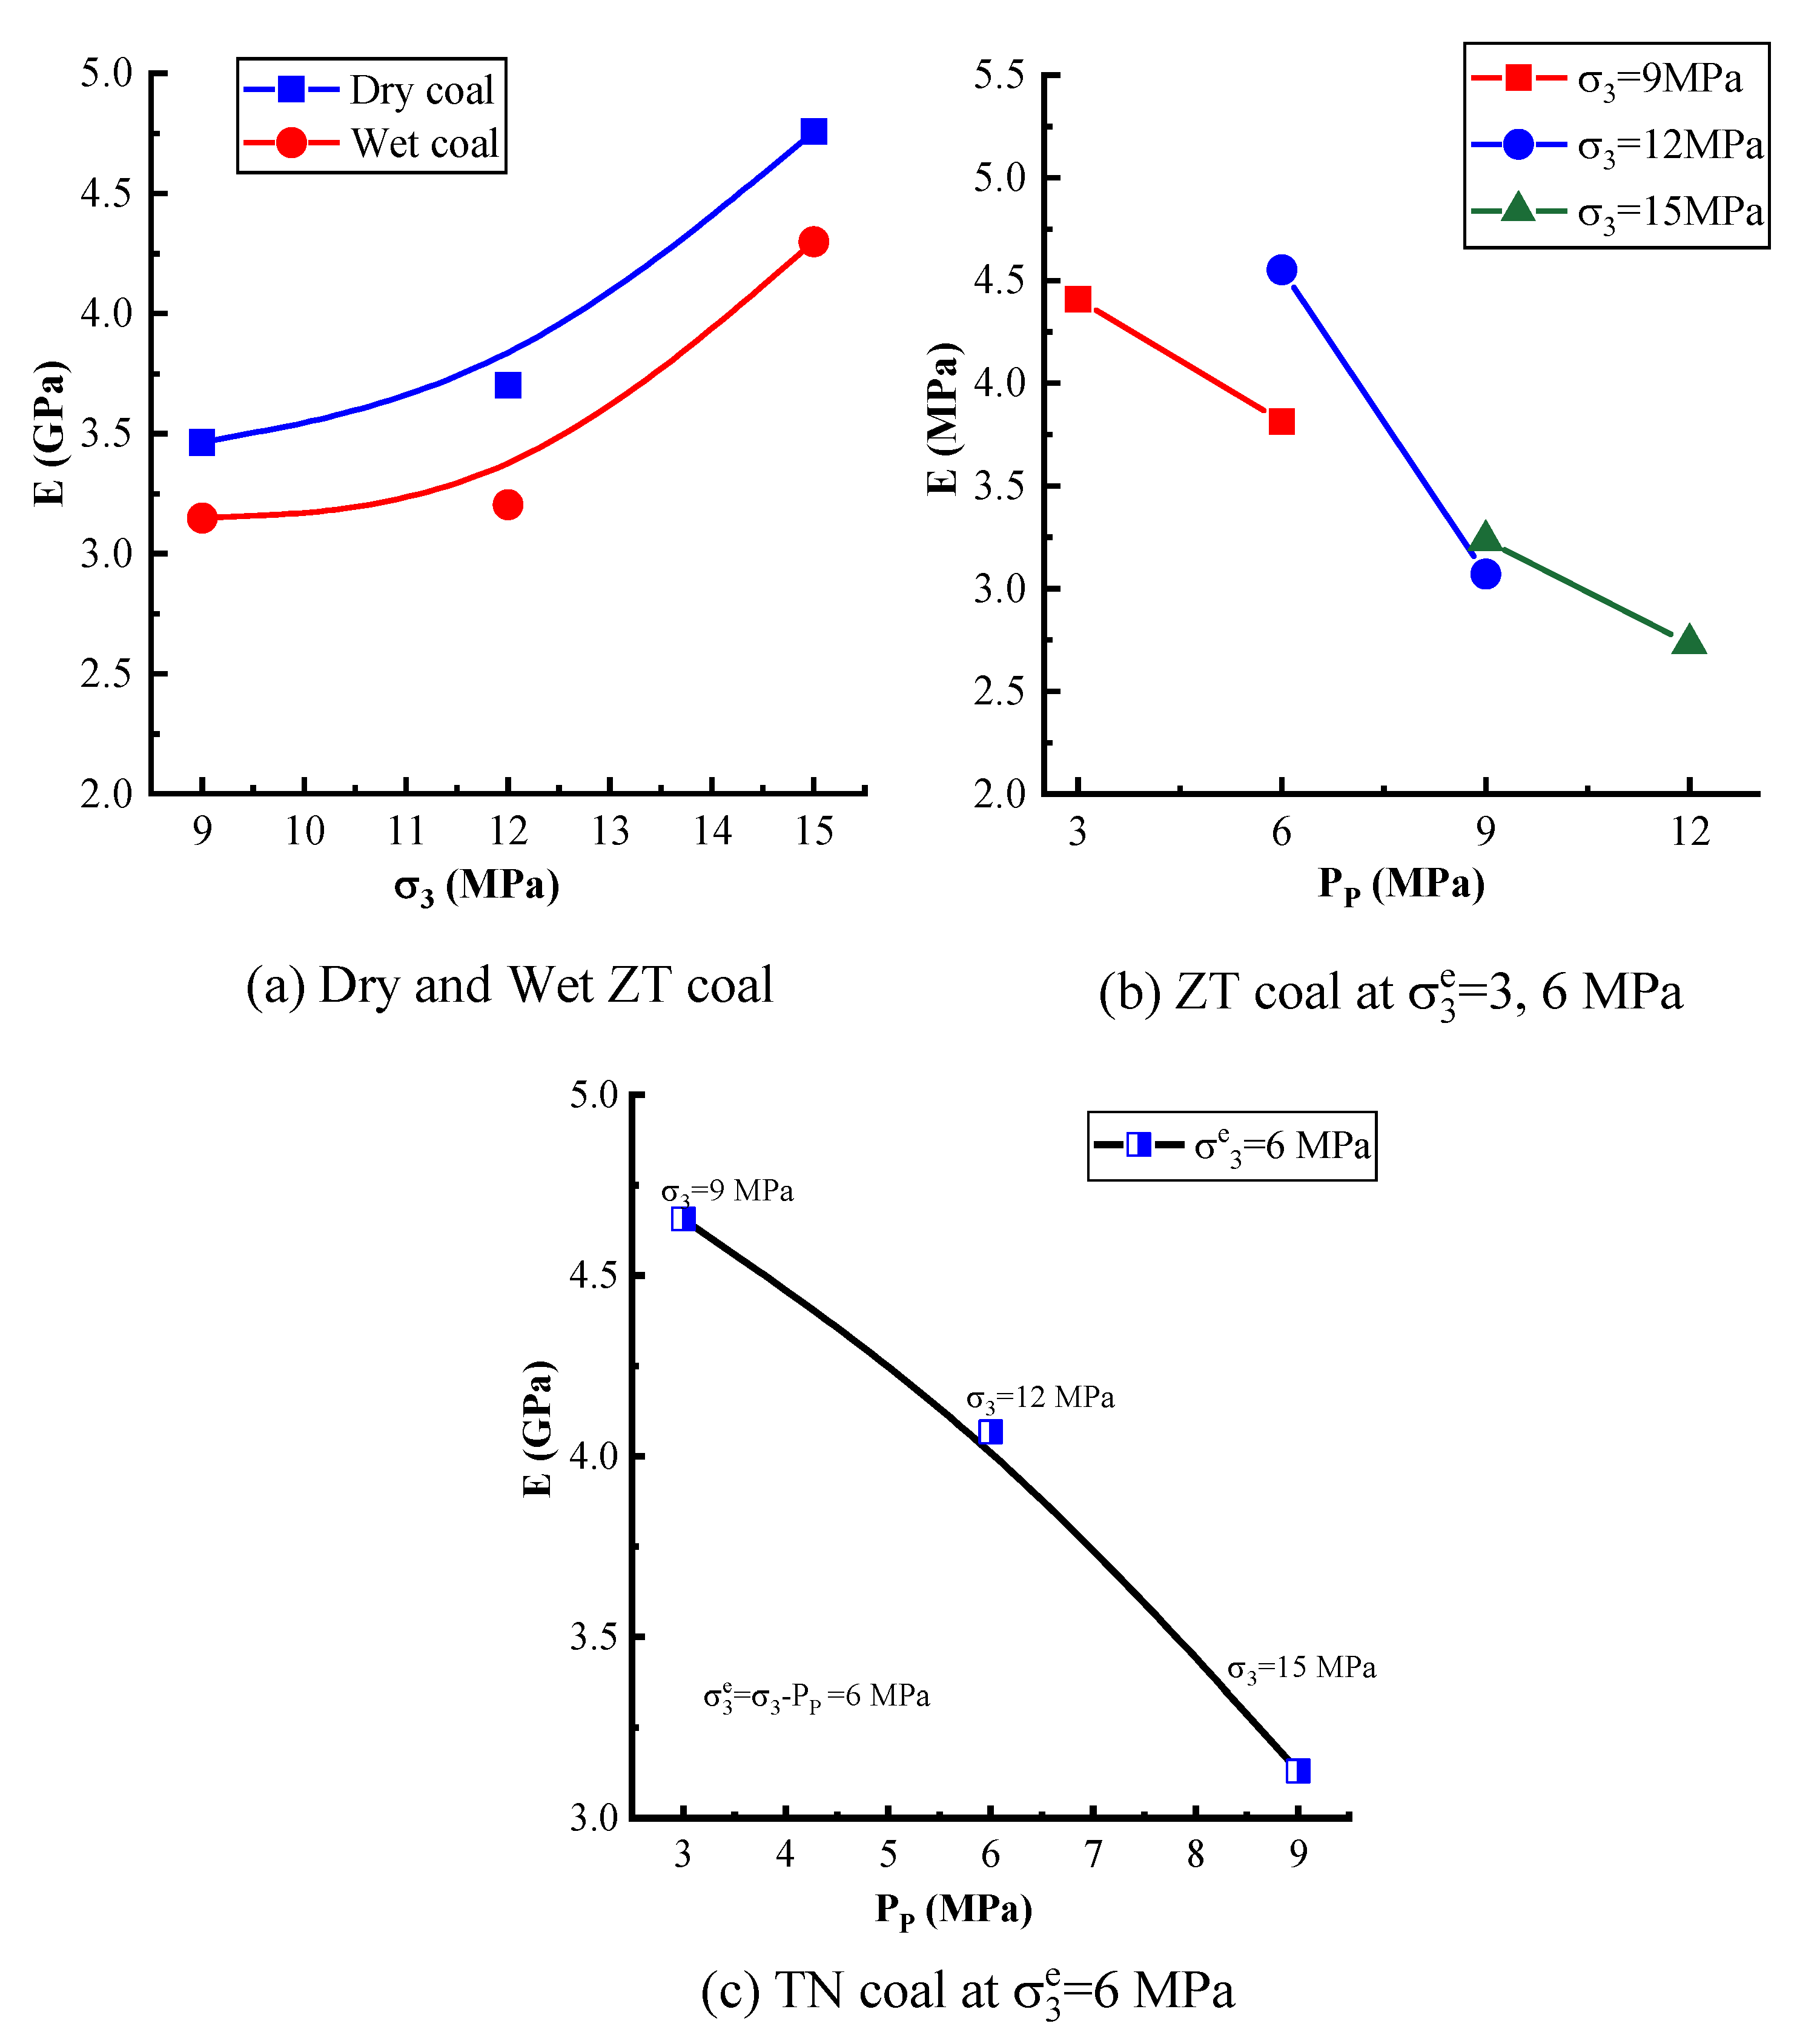
3.2. Effect of Pore Pressure on Elastic Modulus
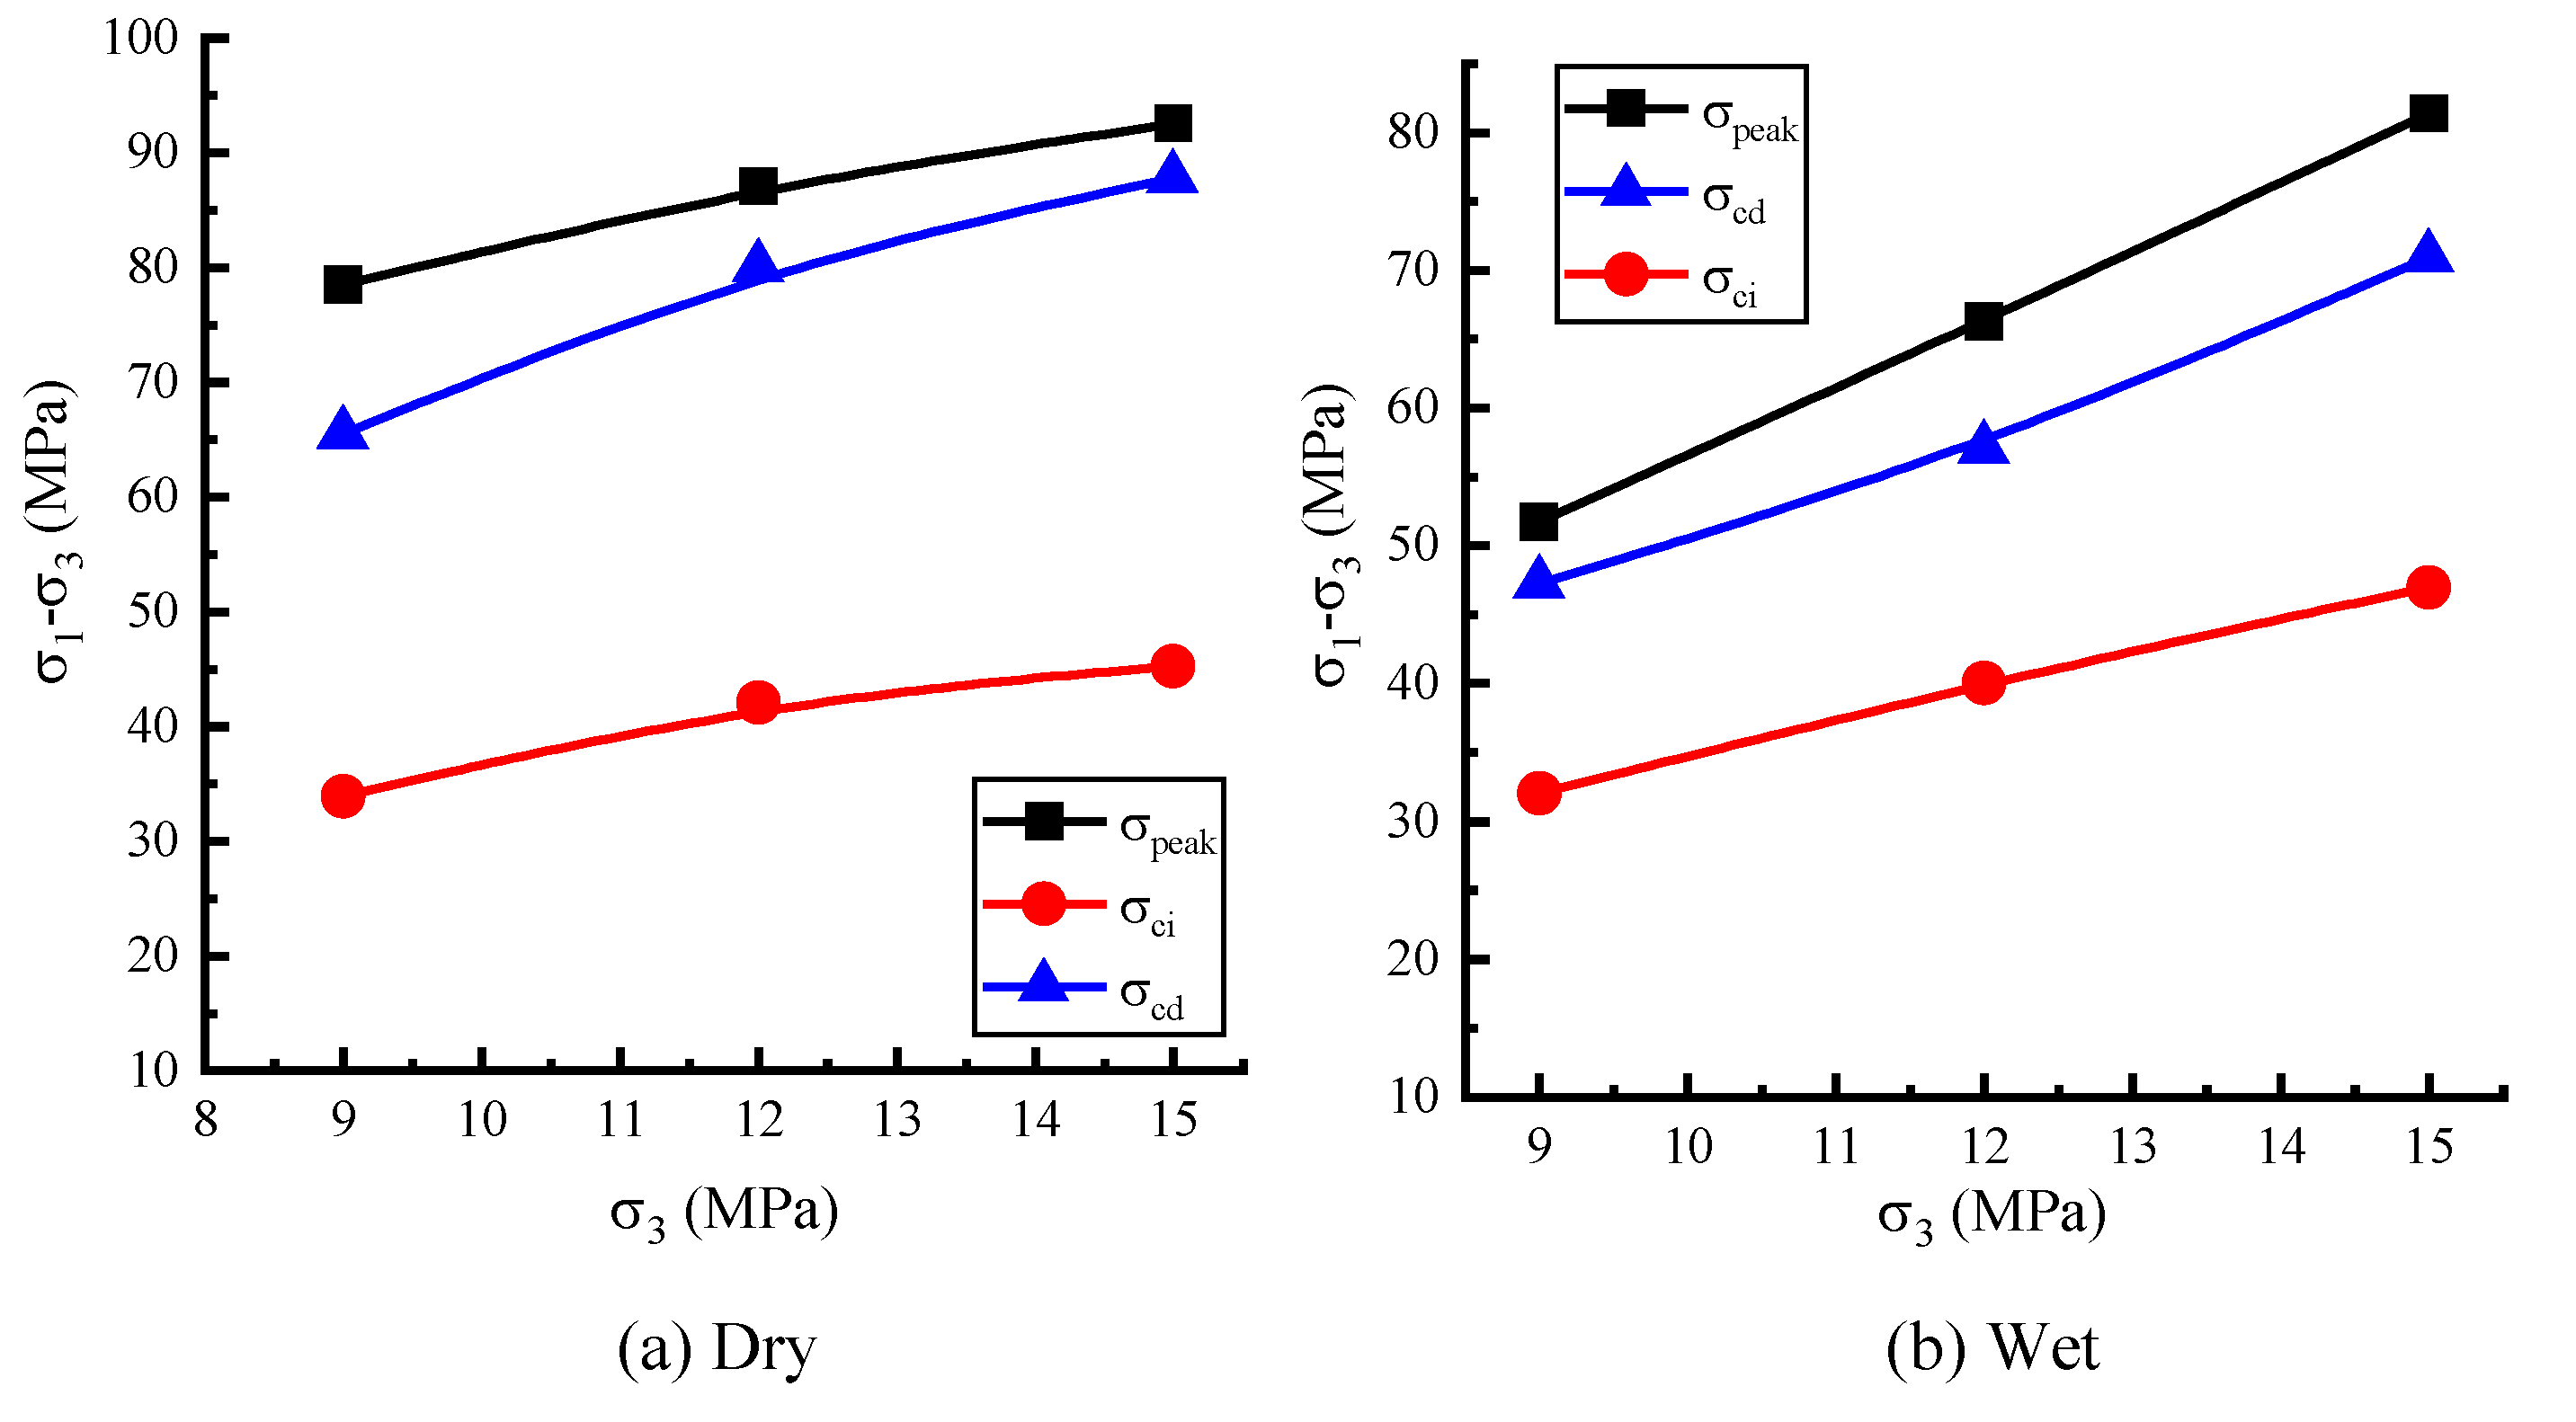
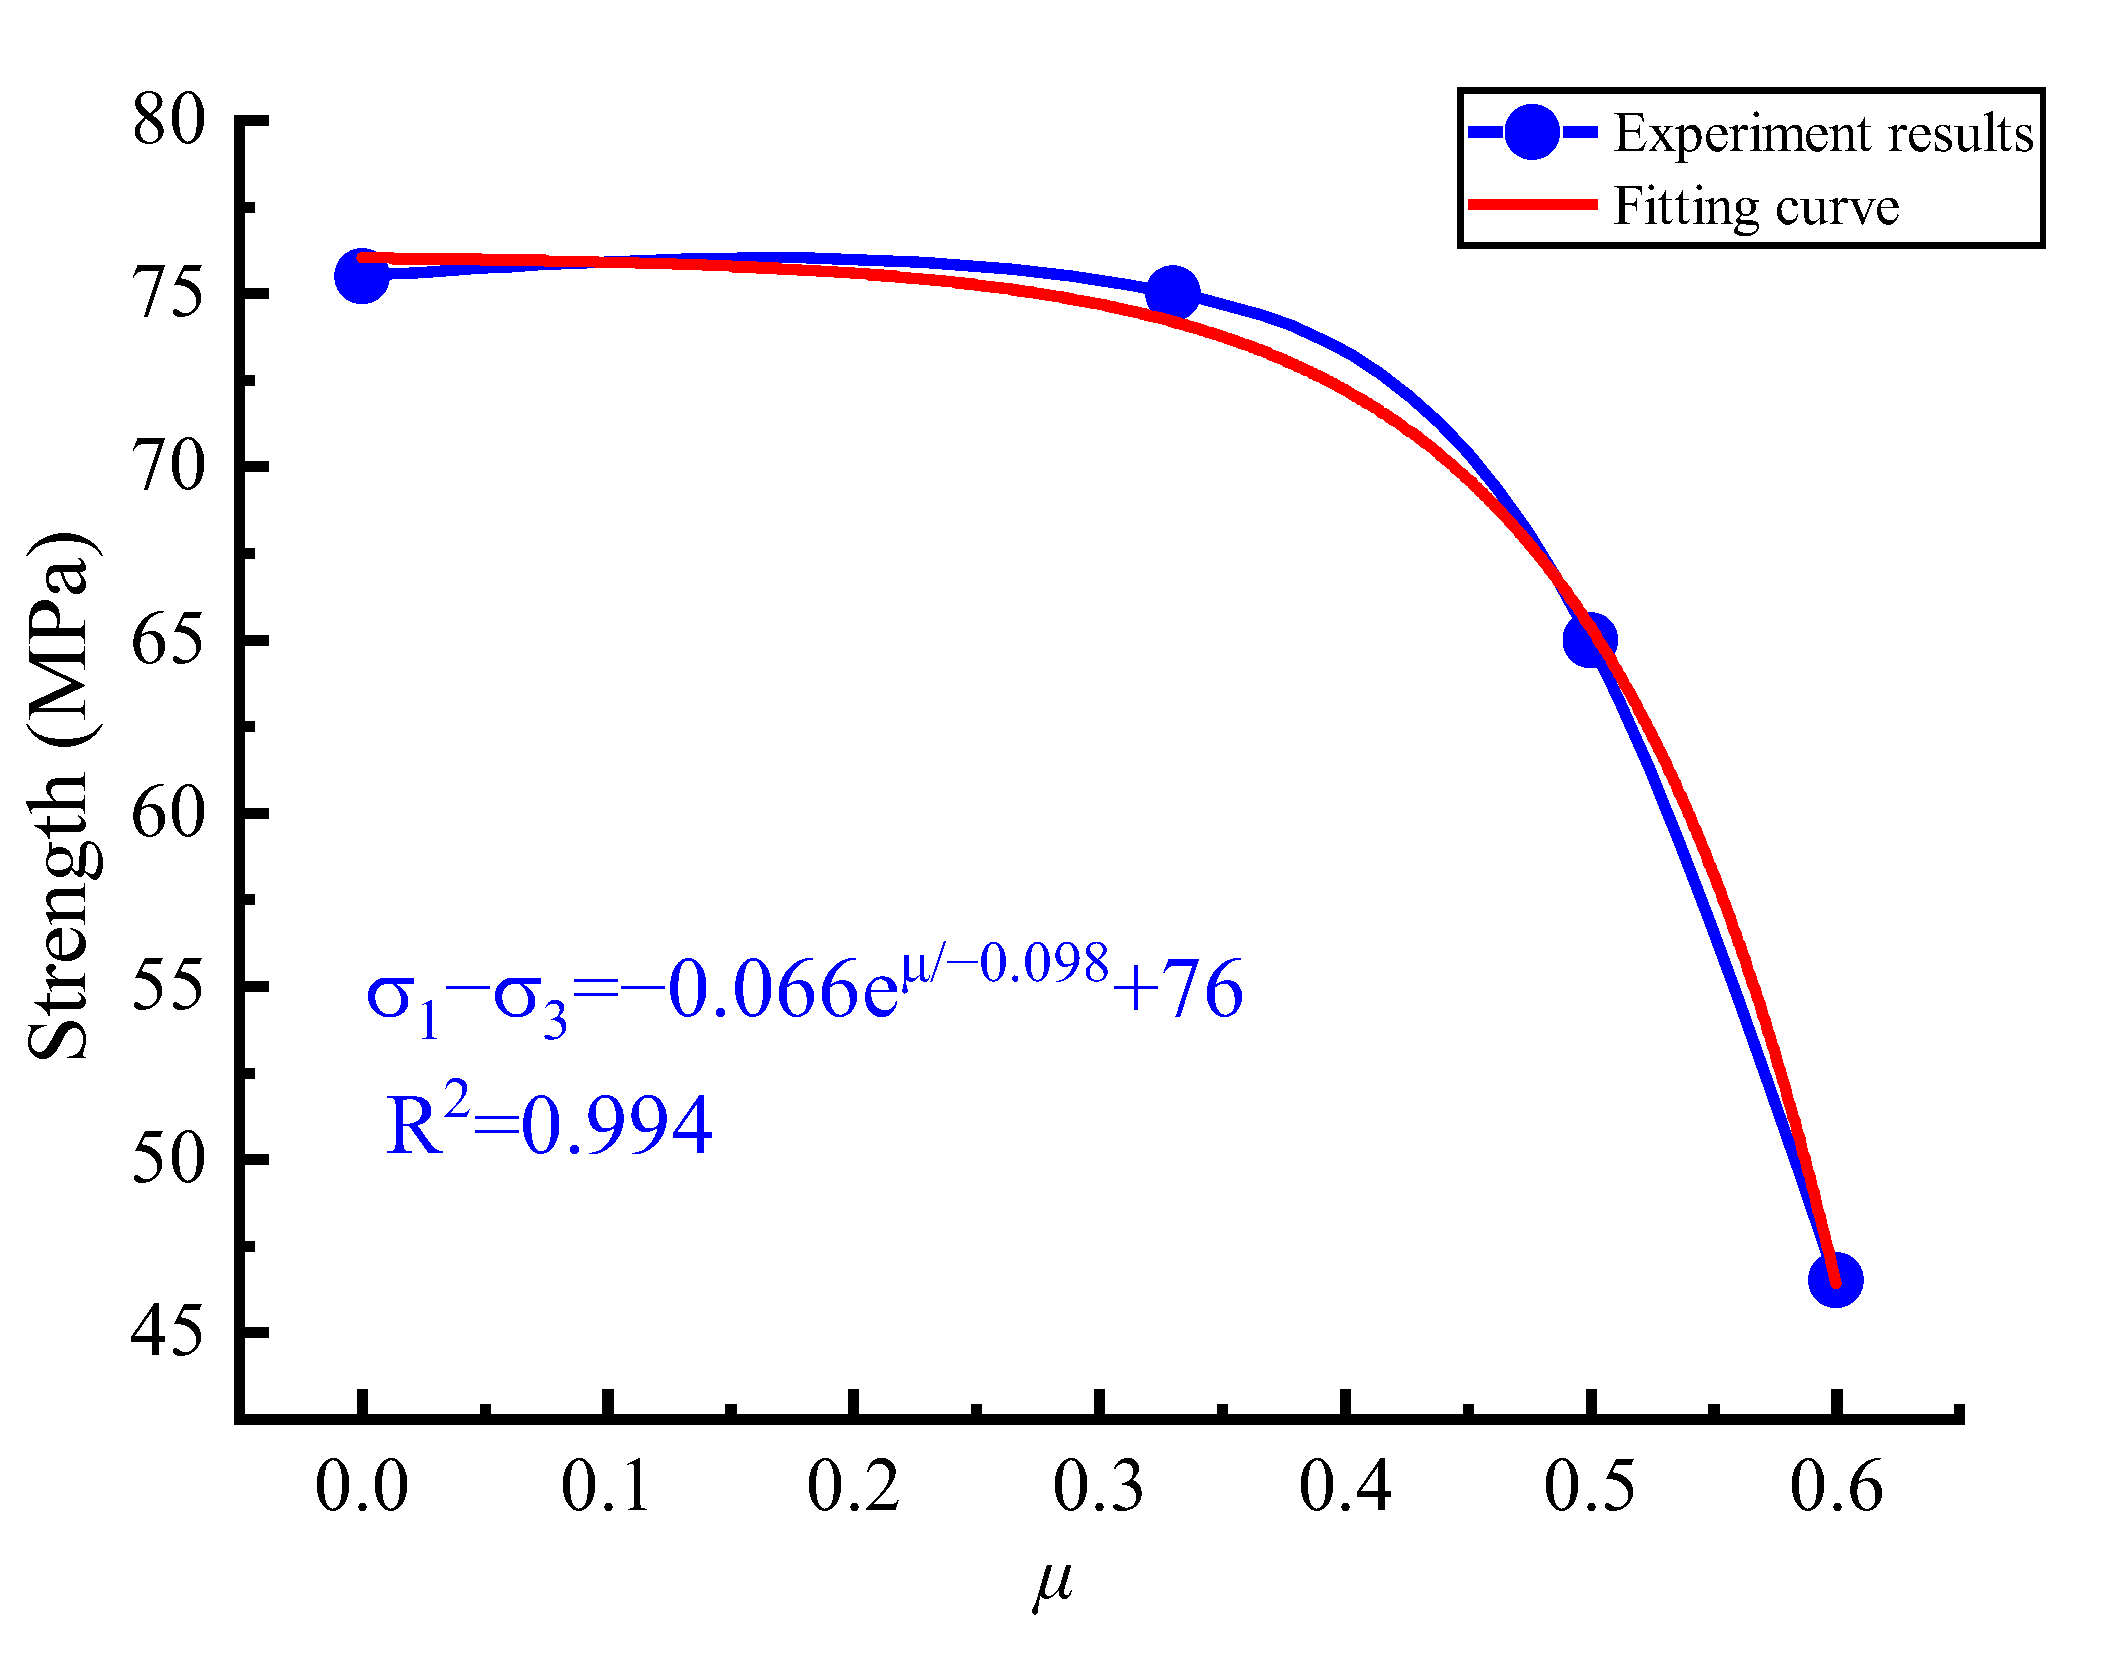
3.3. Effect of Pore Pressure on Strength and the Coefficient μ
3.3.1. Strength and Mohr’s Stress Circle Characteristics in the Absence of Pore Pressure
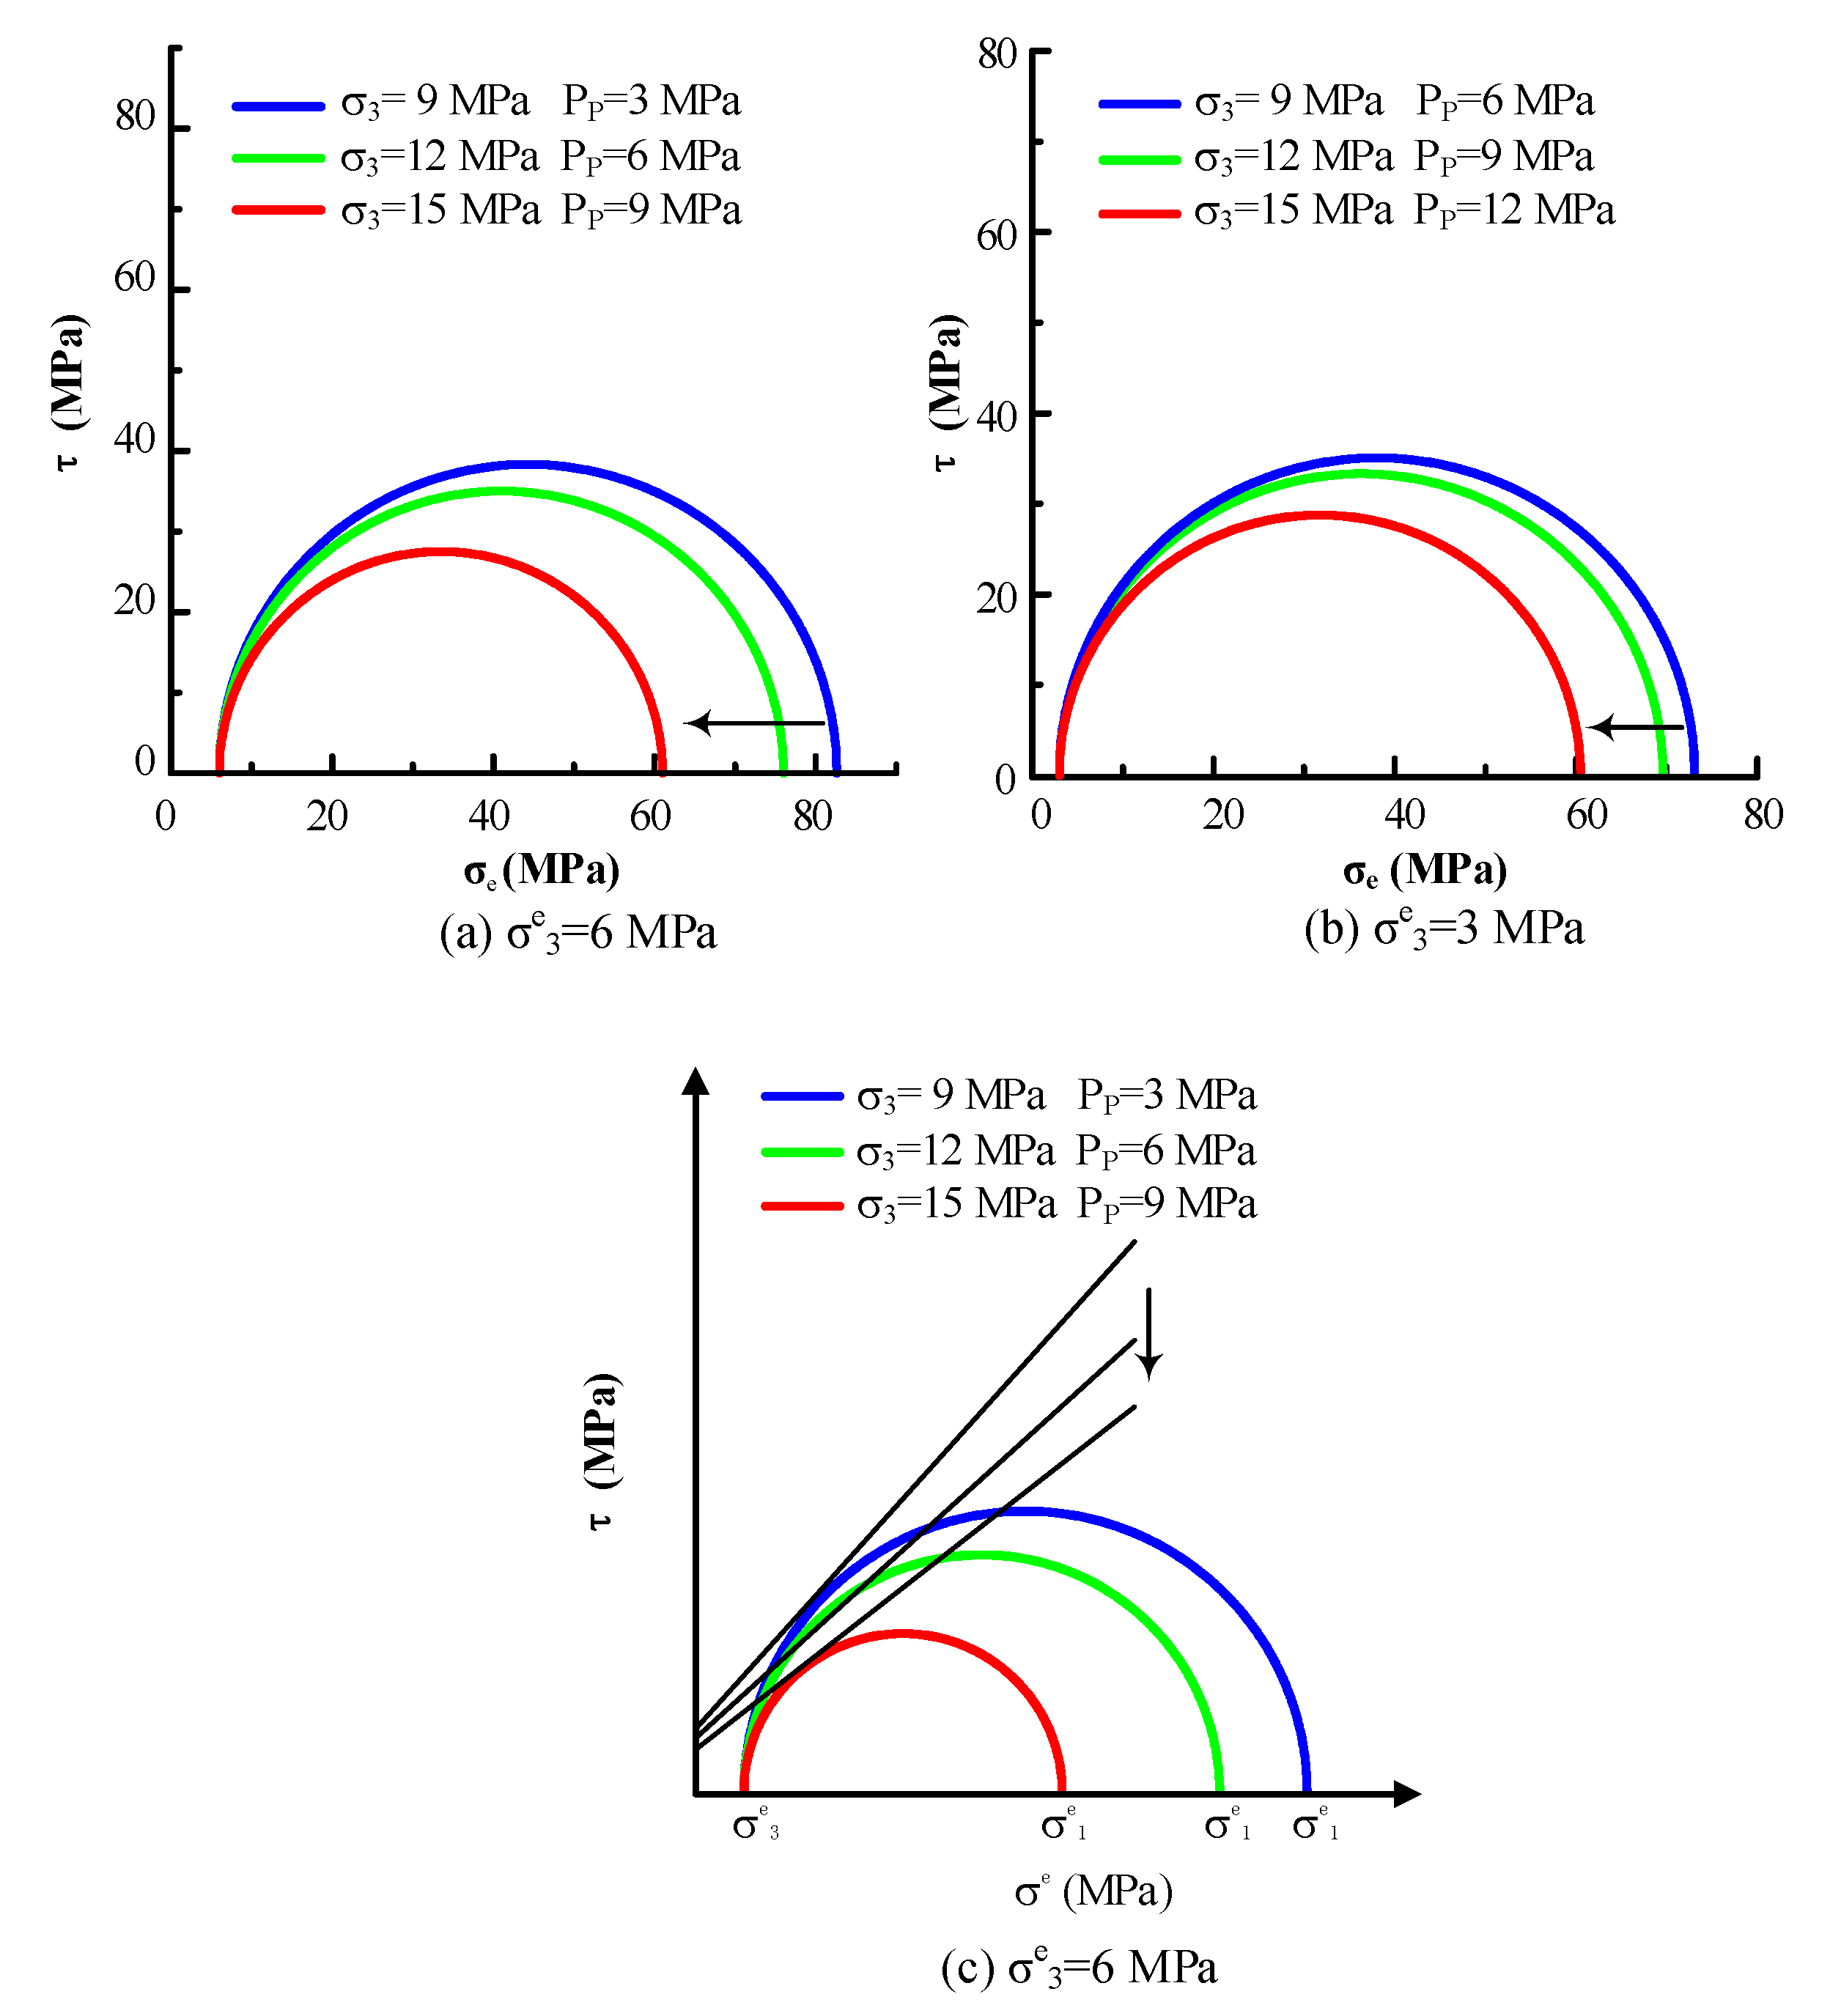
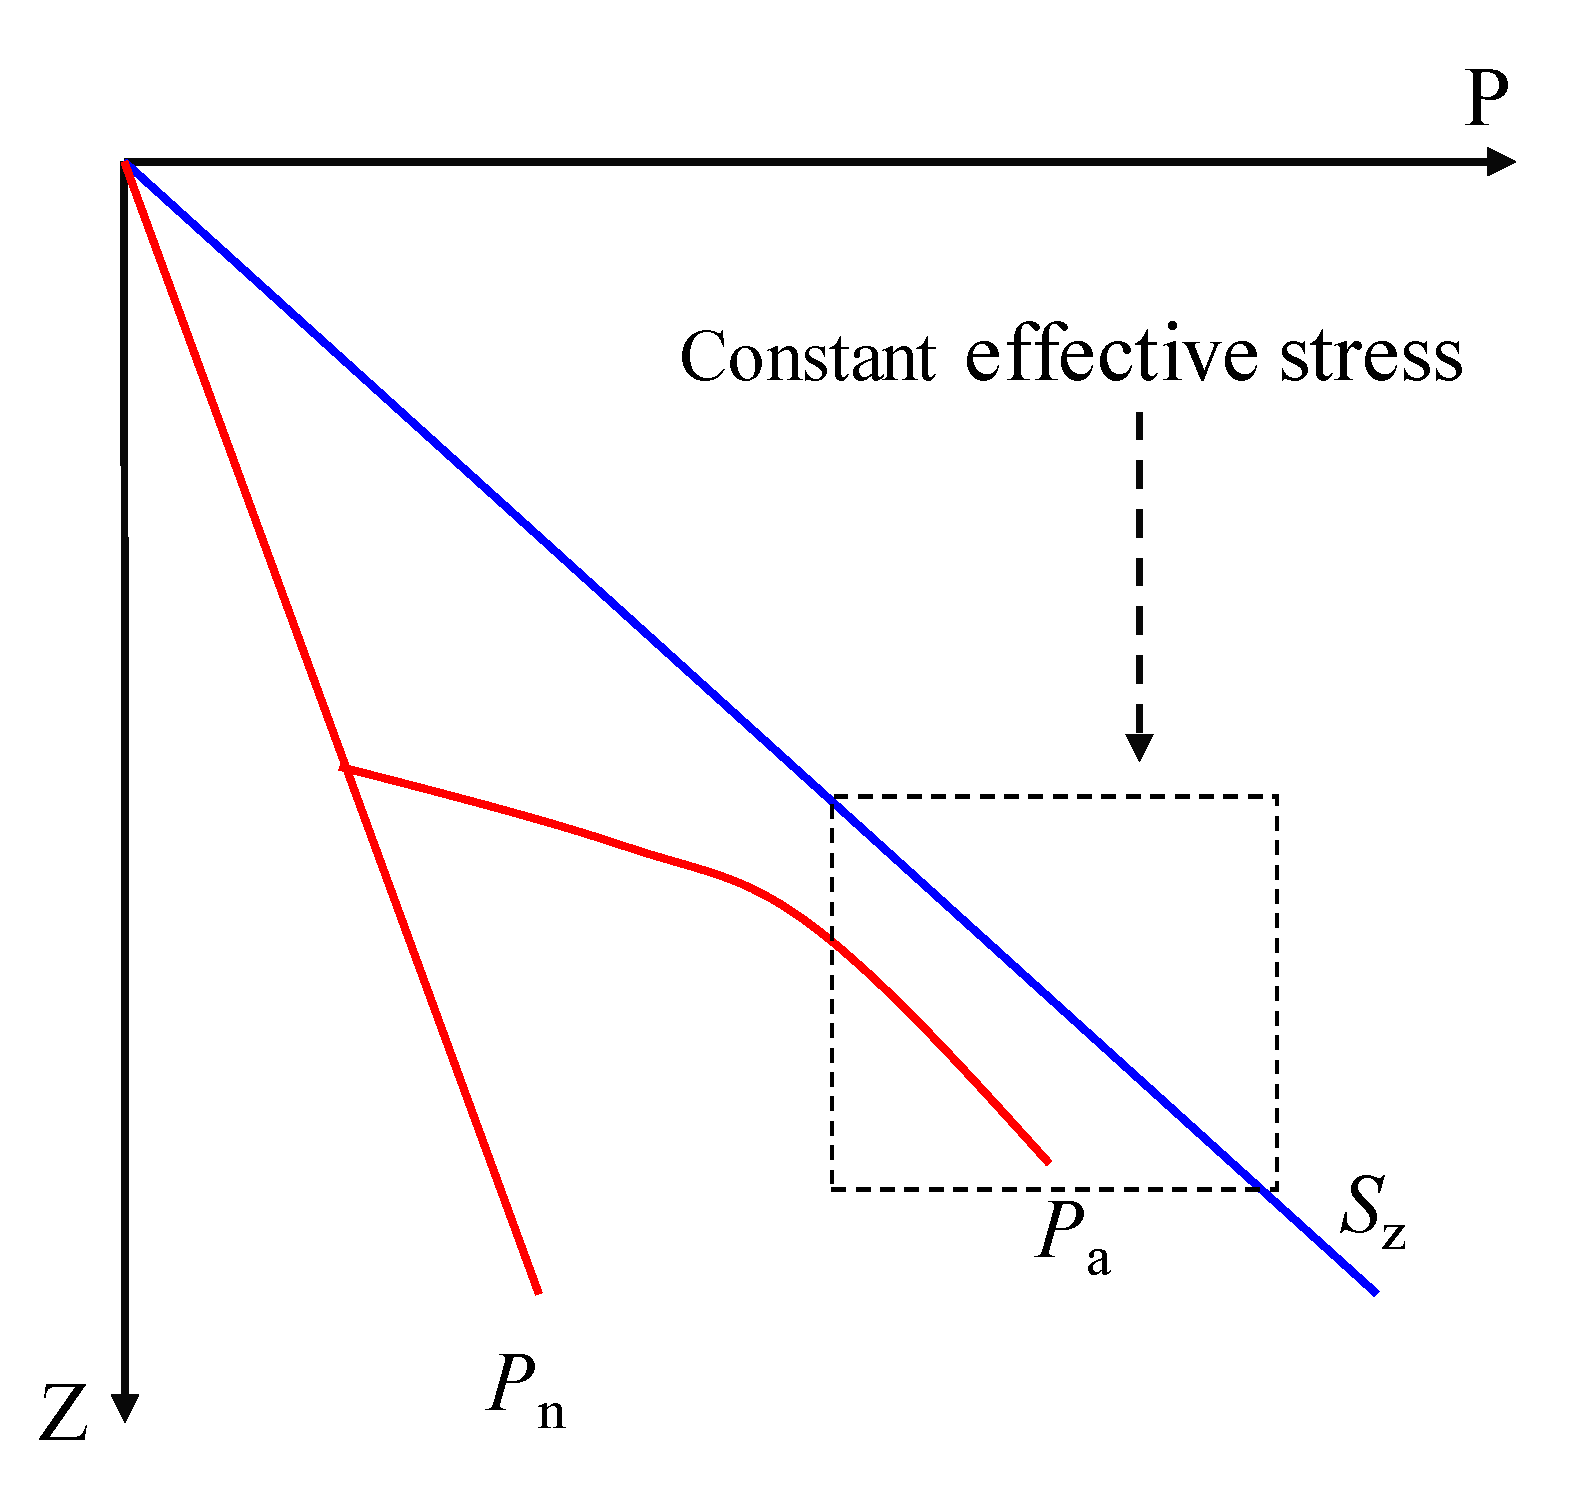
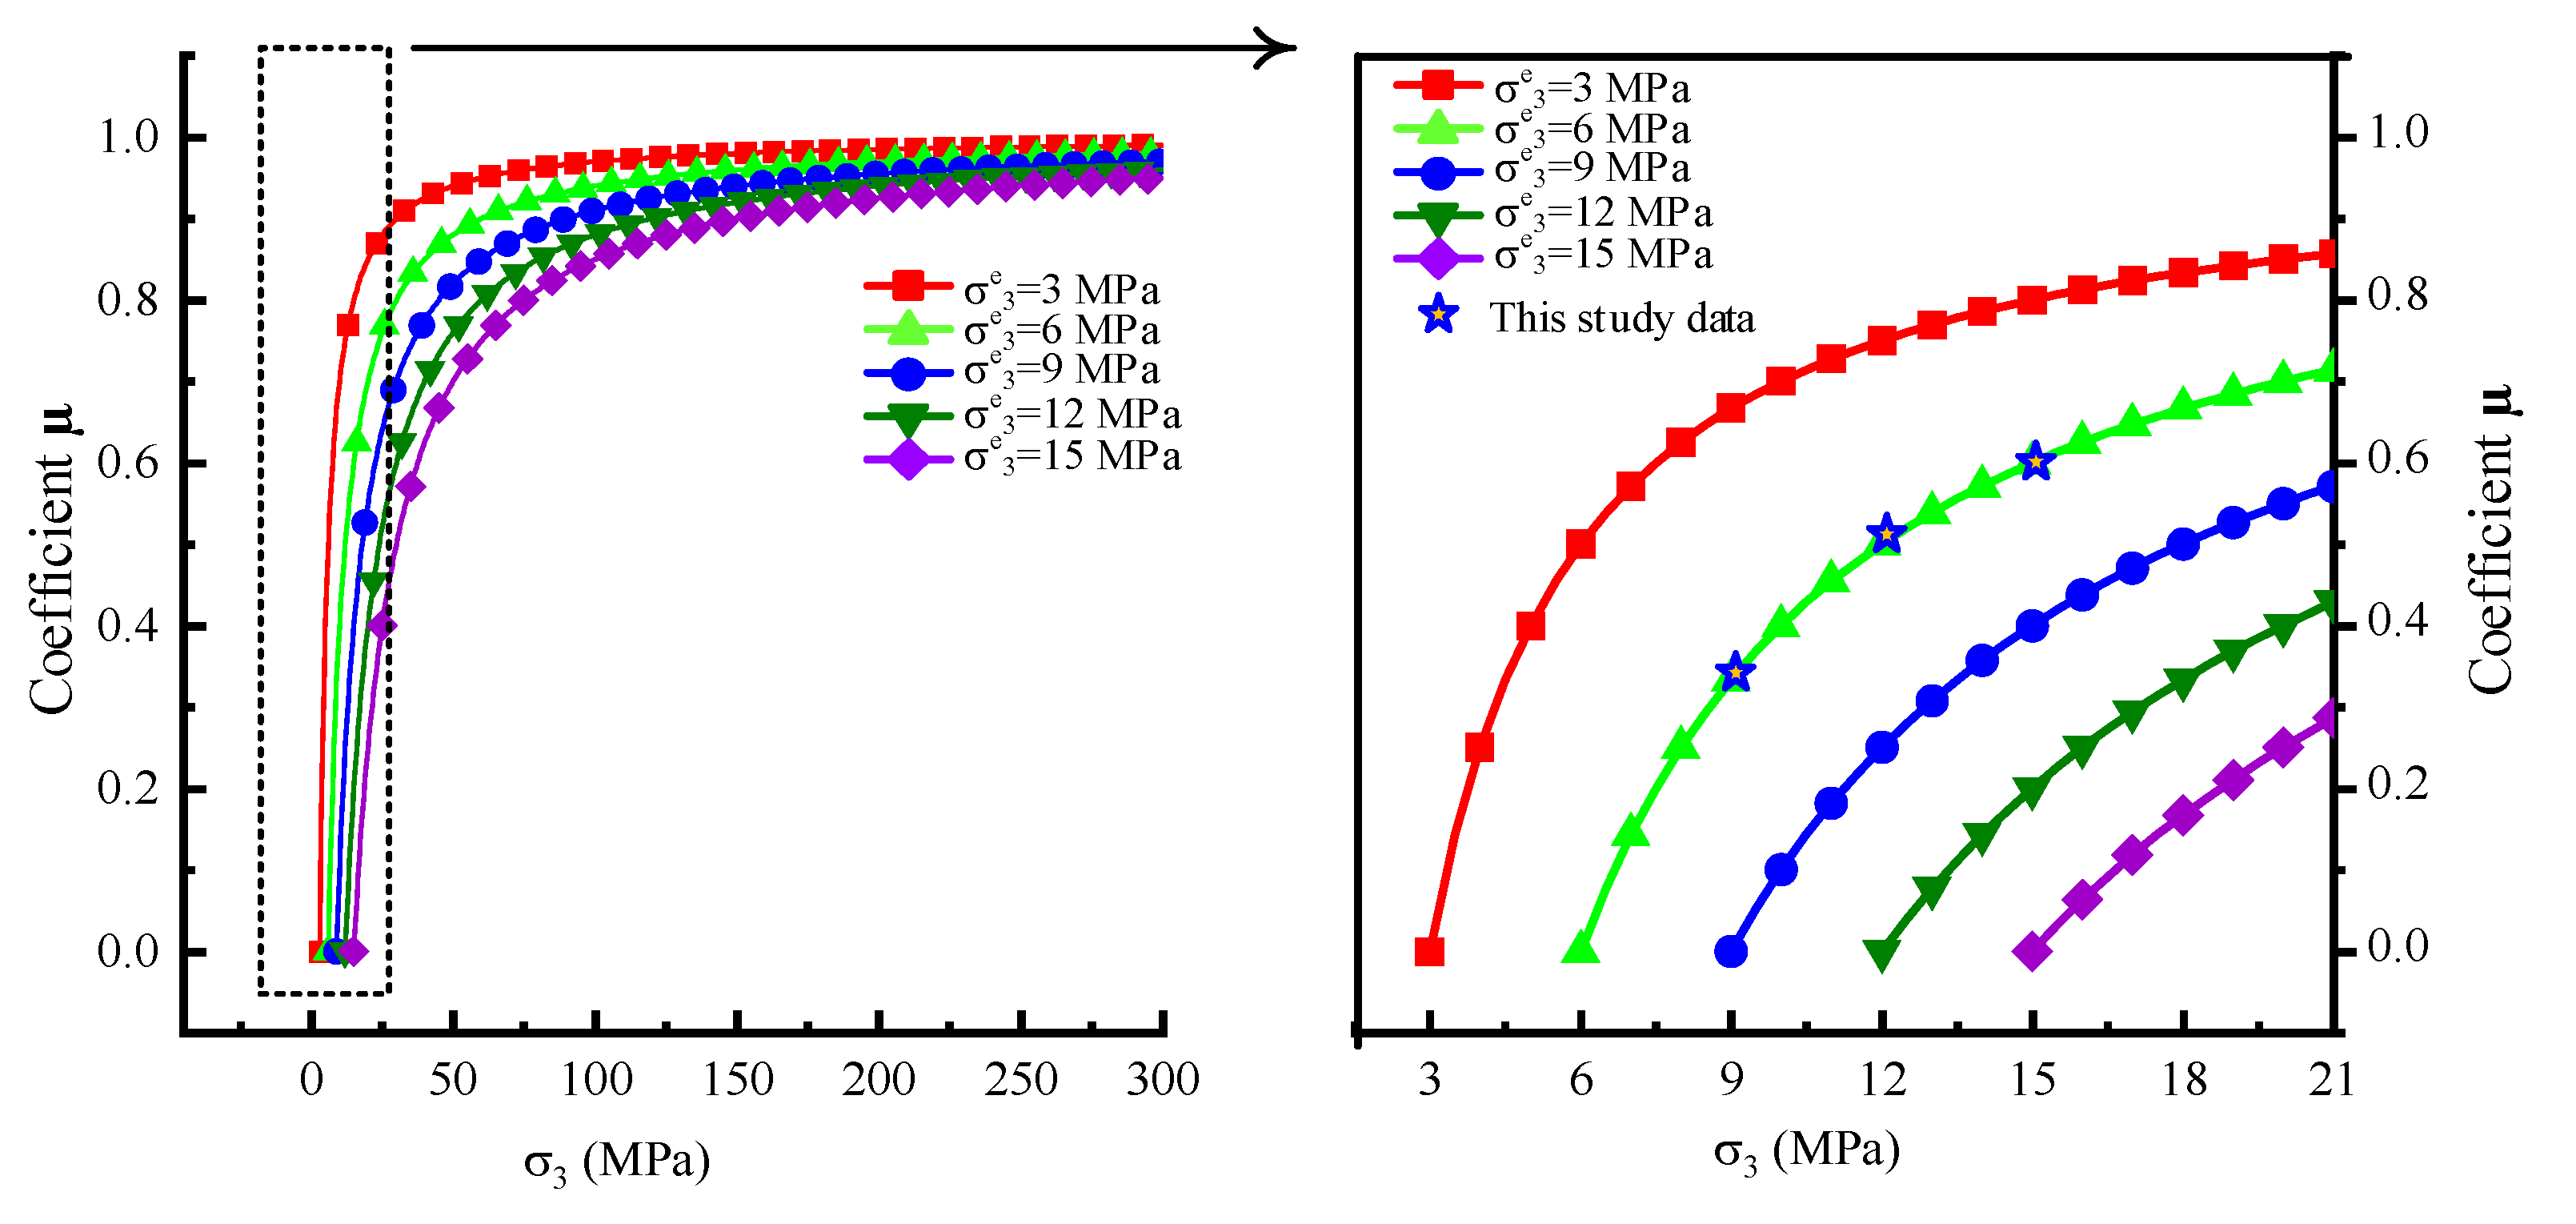
3.3.2. Stress Analysis under the Effect of Pore Pressure
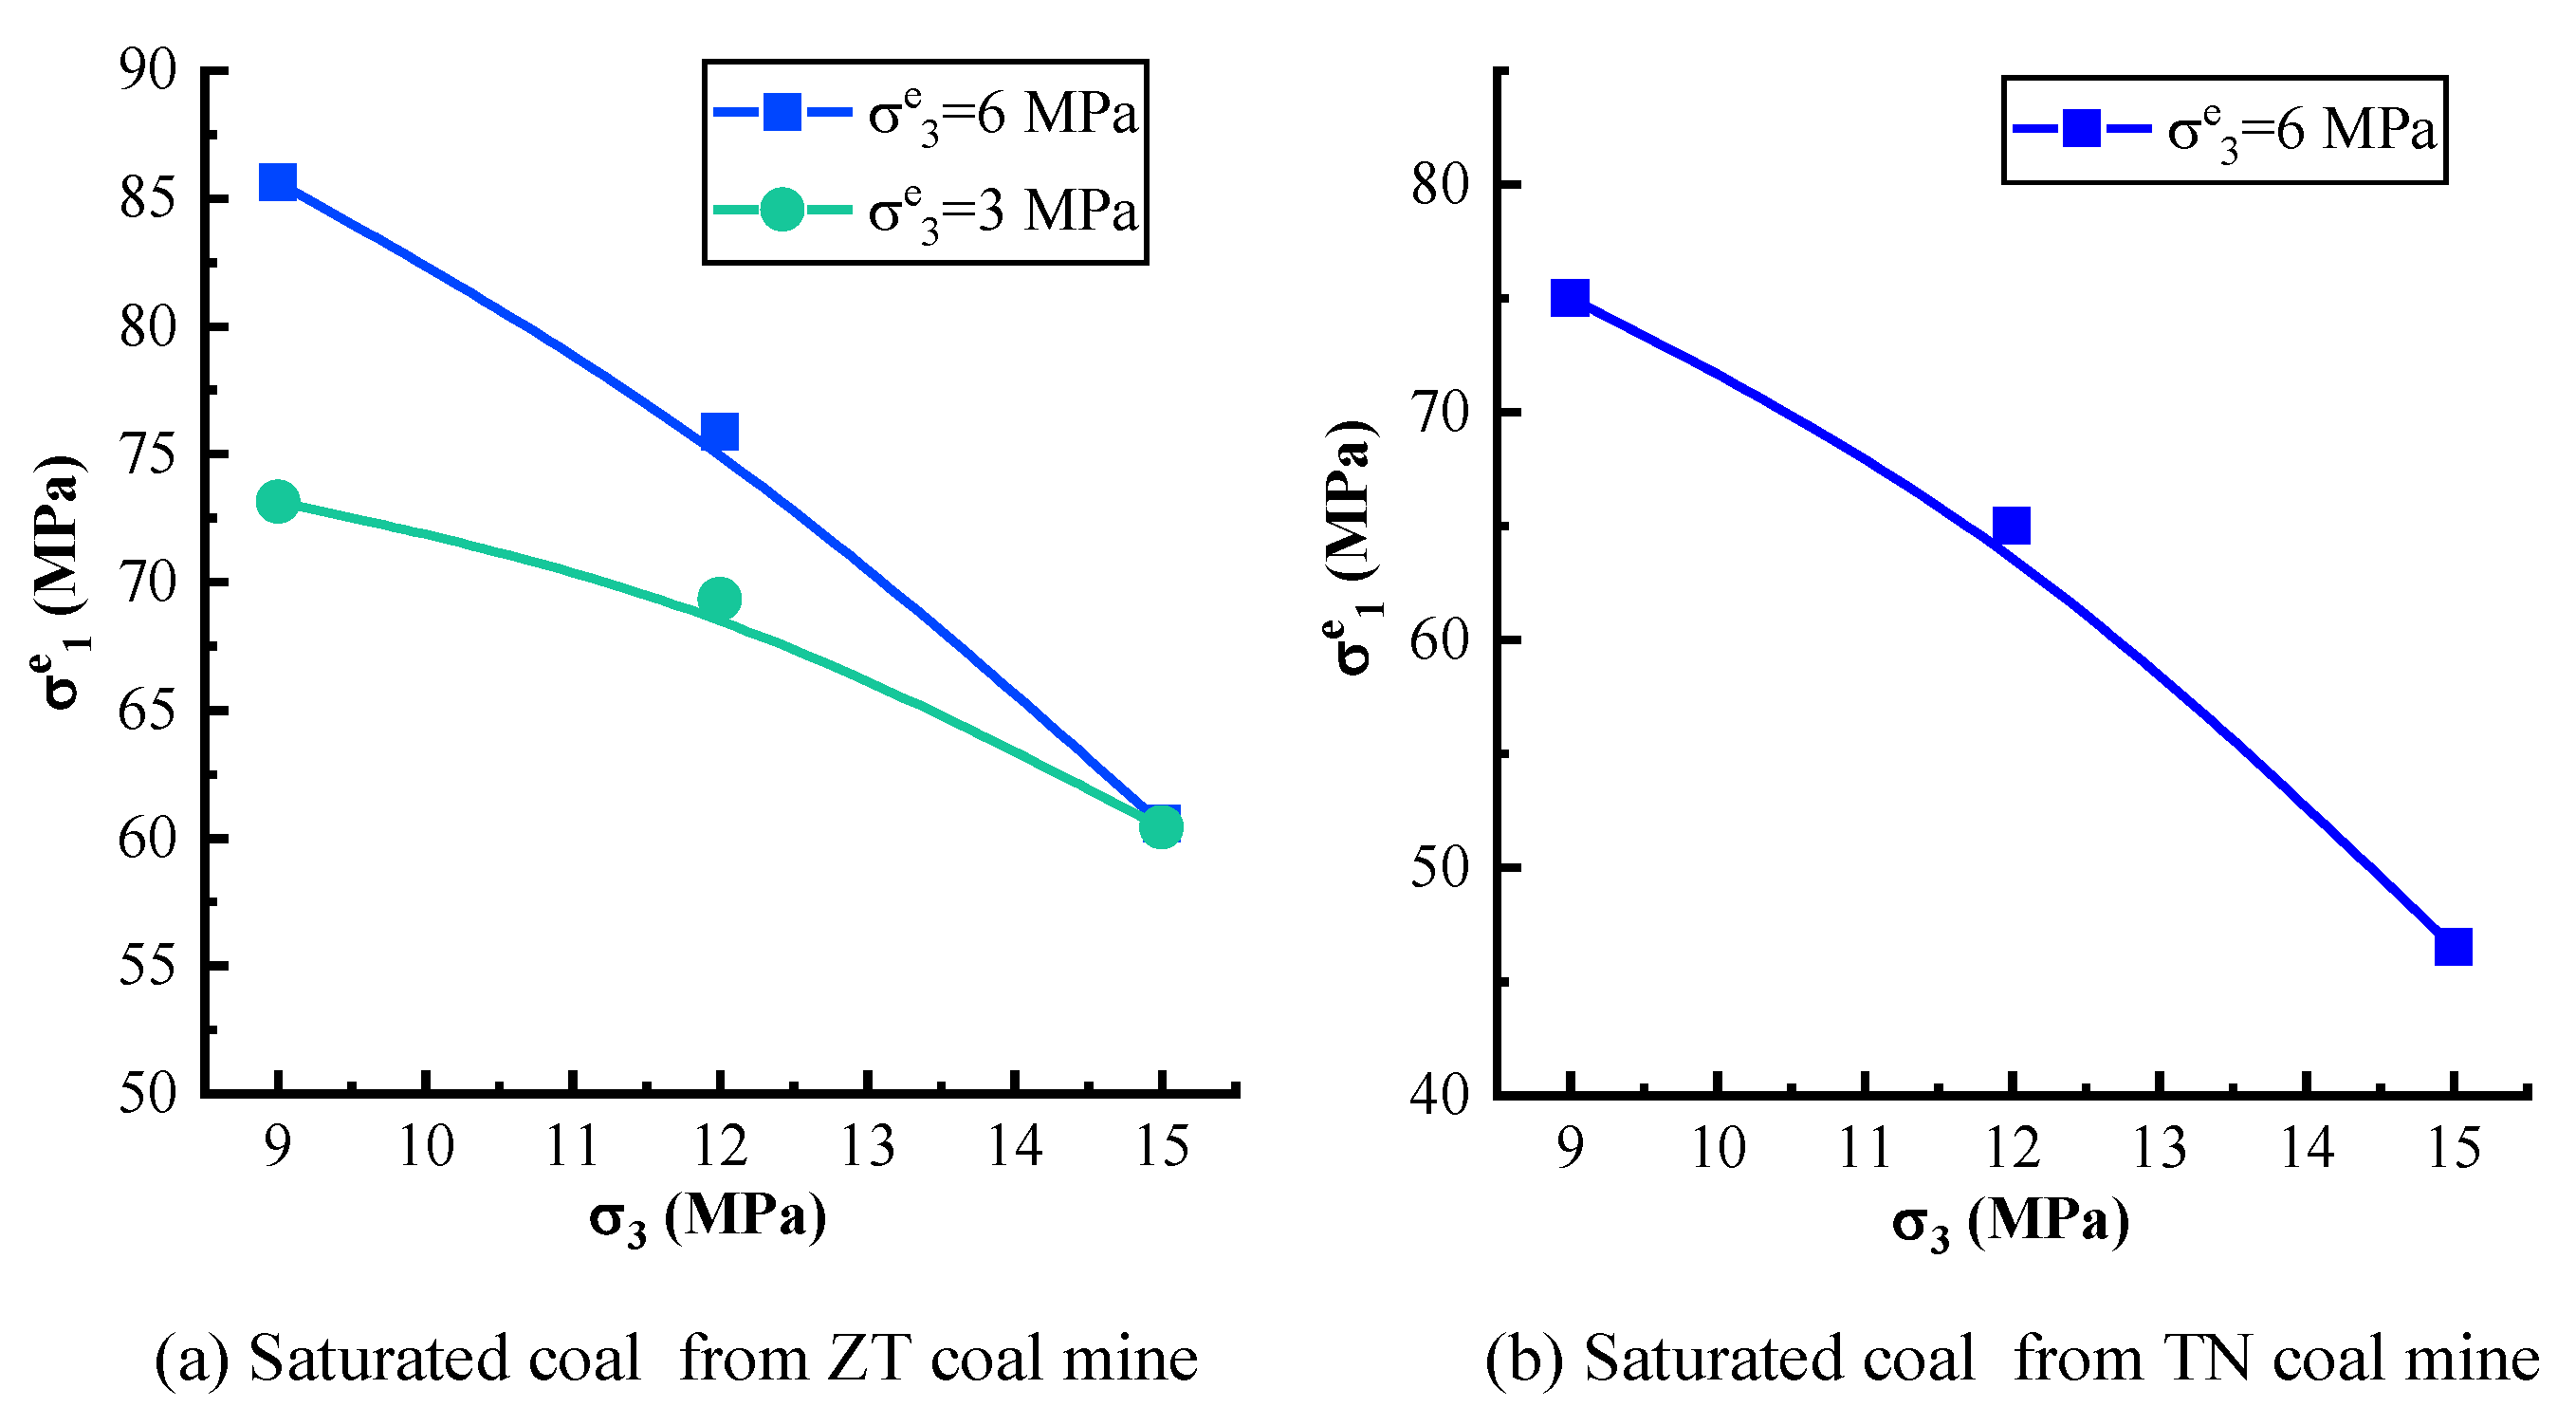
3.3.3. Multivalued Strength Characteristics under Pore Pressure
3.4. Effect of Pore Pressure on Macrocracks in Coal
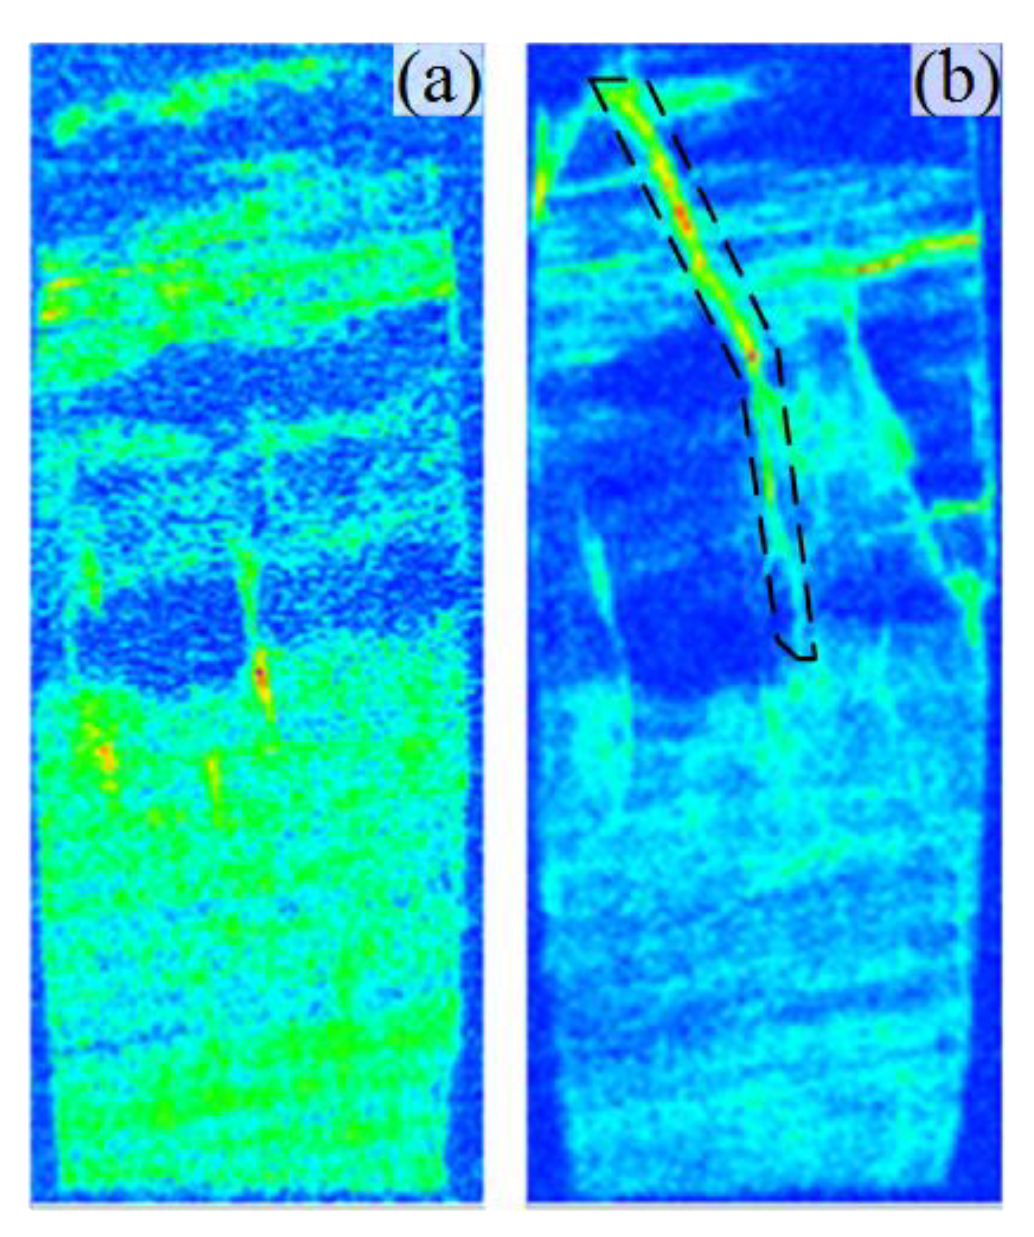
3.4.1. Angle Evolution of the Macro Failure Plane
3.4.2. Porous-Rich Layer Effect on Mechanical Behaviors
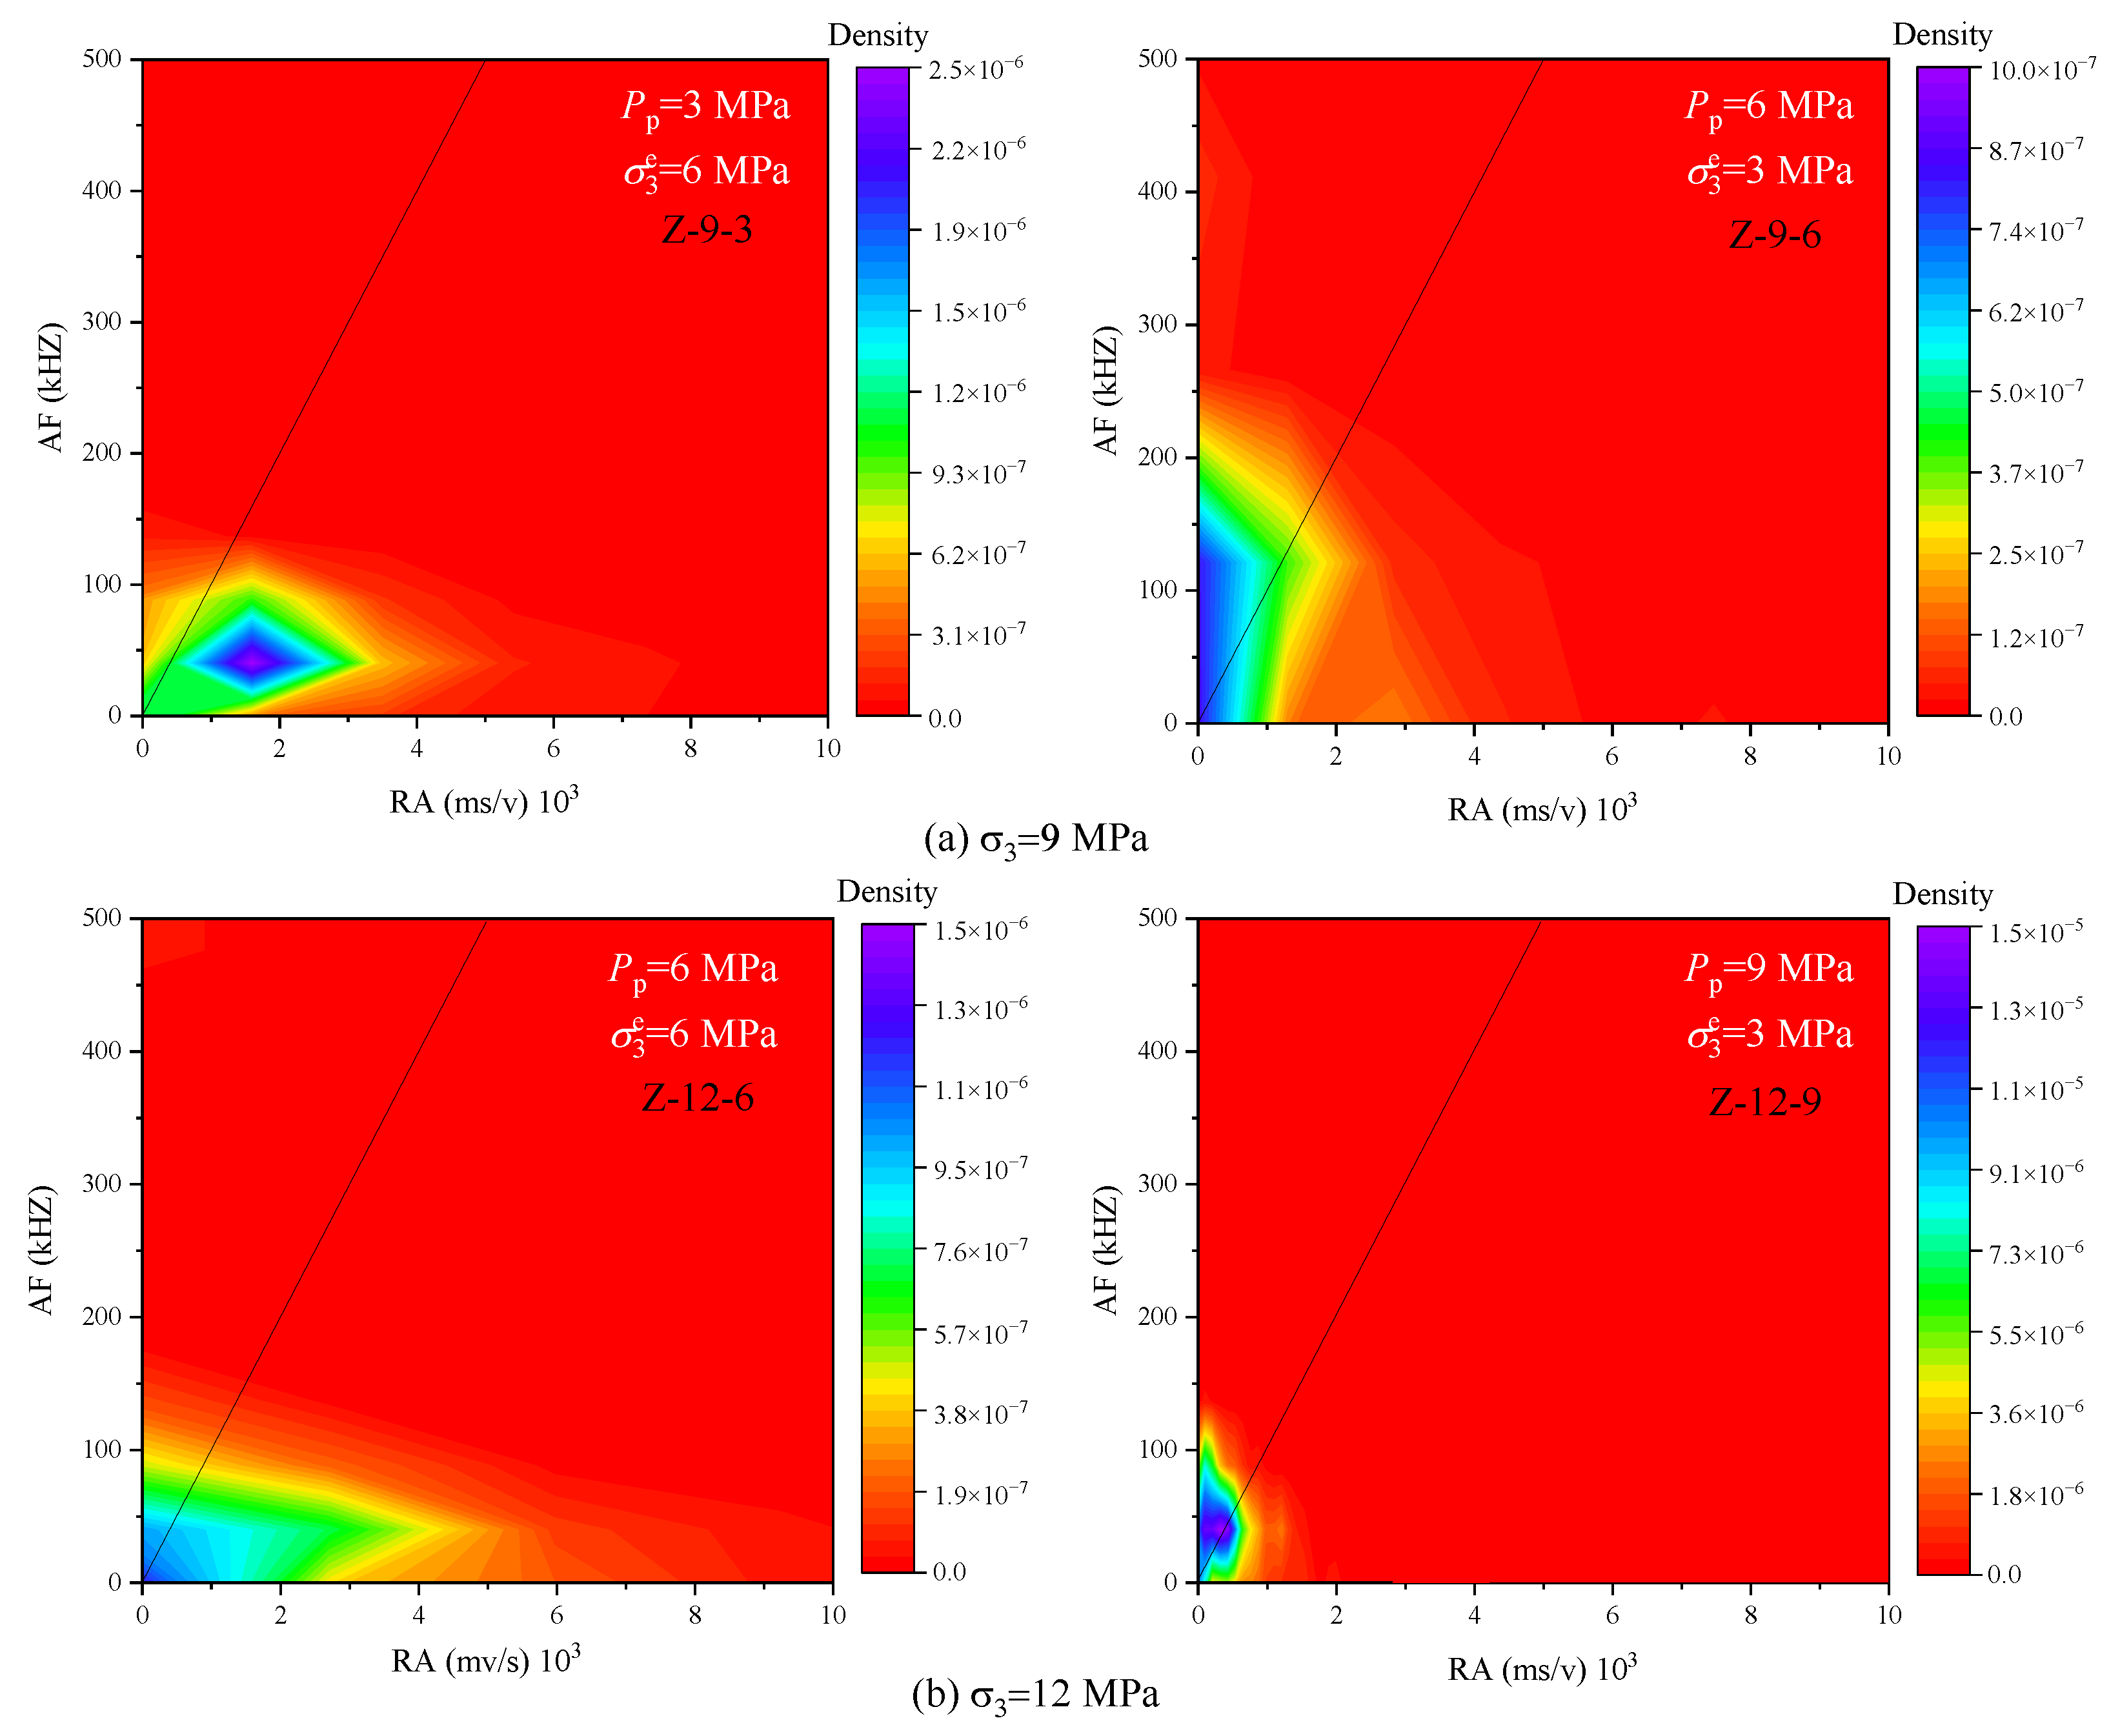
3.5. Effect of Pore Pressure on Cracks by AE Analysis
4. Discussion
5. Conclusions
Author Contributions
Funding
Institutional Review Board Statement
Informed Consent Statement
Data Availability Statement
Conflicts of Interest
Appendix A
References
- Wang, K.; Du, F. Coal-gas compound dynamic disasters in China: A review. Process Saf. Environ. Prot. 2020, 133, 1–17. [Google Scholar] [CrossRef]
- Pan, Y.S. Integrated study on compound dynamic disaster of coal-gas outburst and rockburst. J. China Coal Soc. 2016, 41, 105–112. [Google Scholar]
- Qing, Q.X.; Pan, Y.S.; Li, H.T.; Jiang, D.Y.; Shu, L.Y.; Zhao, S.K.; Zhang, Y.J.; Pan, J.F.; Hongyan, L.; Pan, P.Z. Theoretical basis and key technology of prevention and control of coal-rock dynamic disasters in deep coal mining. J. China Coal Soc. 2020, 45, 1567–1584. [Google Scholar]
- Wang, K.; Du, F.; Zhang, X.; Wang, L.; Xin, C. Mechanical properties and permeability evolution in gas-bearing coal–rock combination body under triaxial conditions. Environ. Earth Sci. 2017, 76, 815. [Google Scholar] [CrossRef]
- Li, T.; Cai, M.F.; Cai, M. A review of mining-induced seismicity in China. Int. J. Rock Mech. Min. Sci. 2007, 44, 1149–1171. [Google Scholar] [CrossRef]
- Yin, G.; Qin, H.; Huang, G.; Lv, Y.; Dai, Z. Acoustic emission from gas-filled coal under triaxial compression. Int. J. Min. Sci. Technol. 2012, 22, 775–778. [Google Scholar] [CrossRef]
- Xue, S.; Zheng, C.; Zheng, X.; Jiang, B.; Li, Y.; Wang, Z. Experimental determination of the outburst threshold value of energy strength in coal mines for mining safety. Process Saf. Environ. Prot. 2020, 138, 263–268. [Google Scholar] [CrossRef]
- Du, F.; Wang, K.; Wang, G.; Jiang, Y.; Xin, C.; Zhang, X. Investigation of the acoustic emission characteristics during deformation and failure of gas-bearing coal-rock combined bodies. J. Loss Prev. Process Ind. 2018, 55, 253–266. [Google Scholar] [CrossRef]
- Masoudian, M.S.; Airey, D.W.; El-Zein, A. Experimental investigations on the effect of CO2 on mechanics of coal. Int. J. Coal Geol. 2014, 2014. 128, 12–23. [Google Scholar] [CrossRef]
- Niu, Y.; Li, Z.; Wang, E.; Gao, F.; Wang, F.; Zhang, Z.; Deng, Q.; Long, Z.; Zhang, X.; Tian, H. An experimental study on precursor identification for gas-bearing coal failure from electric potential responses in the loading process. Meas. J. Int. Meas. Confed. 2022, 196, 111229. [Google Scholar] [CrossRef]
- Wang, C.; Xu, X.; Zhang, Y.; Arif, M.; Wang, Q.; Iglauer, S. Experimental and numerical investigation on the dynamic damage behavior of gas-bearing coal. Geomech. Geophys. Geo-Energy Geo-Resour. 2022, 8, 49. [Google Scholar] [CrossRef]
- Liu, S.; Li, X.; Wang, D.; Zhang, D. Investigations on the mechanism of the microstructural evolution of different coal ranks under liquid nitrogen cold soaking. Energy Sources Part A Recovery Util. Environ. Eff. 2020, 1–17. [Google Scholar] [CrossRef]
- Zhang, C.; Wang, E.; Li, B.; Kong, X.; Xu, J.; Peng, S.; Chen, Y. Laboratory experiments of CO2-enhanced coalbed methane recovery considering CO2 sequestration in a coal seam. Energy 2022, 262, 125473. [Google Scholar] [CrossRef]
- Luo, P.; Zhang, Z.; Geng, X.; Xue, K.; Guang, W. Evaluation of ScCO2-water performance on bituminous coal: Insights from experiments and 3D CT image reconstruction. Geomech. Geophys. Geo-Energy Geo-Resour. 2022, 8, 118. [Google Scholar] [CrossRef]
- Kang, H.; Yi, B.; Gao, F.; Lü, H. Database and characteristics of underground in situ stress distribution in chinese coal mines. J. China Coal Soc. 2019, 44, 23–33. [Google Scholar]
- Guang, W.; Liu, X.; Zhang, Z.; Luo, P. Effects of sub-and supercritical CO2 on coal diffusivity and surface Thermodynamics. Energy Fuels 2022, 36, 3737–3748. [Google Scholar] [CrossRef]
- Xue, K.; Zhang, Z.; Zhong, C.; Jiang, Y.; Geng, X. A fast numerical method and optimization of 3D discrete fracture network considering fracture aperture heterogeneity. Adv. Water Resour. 2022, 162, 104164. [Google Scholar] [CrossRef]
- Wang, Y.; Zhang, Z.; Ranjith, P.G.; Luo, Y. Water-gas flow in rough rock fractures: Insights from coupled triaxial compression experiments. Hydrogeol. J. 2022, 30, 1569–1581. [Google Scholar] [CrossRef]
- Zhang, C.; Wang, E.; Xu, J.; Peng, S. A new method for coal and gas outburst prediction and prevention based on the fragmentation of ejected coal. Fuel 2021, 287, 119493. [Google Scholar] [CrossRef]
- Ning, J.; Wang, J.; Jiang, J.; Hu, S.; Jiang, L.; Liu, X. Estimation of crack initiation and propagation thresholds of confined brittle coal specimens based on energy dissipation theory. Rock Mech. Rock Eng. 2017, 51, 119–134. [Google Scholar] [CrossRef]
- Long, K.; Zhang, Z.; Li, S.; Li, K.; Luo, Y. The roles of crack development and water in stress rotation and fault weakening. Tectonophysics 2022, 823, 229190. [Google Scholar] [CrossRef]
- Ranathunga, A.S.; Perera, M.S.A.; Ranjith, P.G. Influence of CO2 adsorption on the strength and elastic modulus of low rank Australian coal under confining pressure. Int. J. Coal Geol. 2016, 167, 148–156. [Google Scholar] [CrossRef]
- Li, X.; Chen, S.; Wang, S.; Zhao, M.; Liu, H. Study on in Situ Stress Distribution Law of the Deep Mine: Taking Linyi Mining Area as an Example. Adv. Mater. Sci. Eng. 2021, 2021, 5594181. [Google Scholar] [CrossRef]
- Zhang, Z.; Xie, H.; Zhang, R.; Zhang, Z.; Gao, M.; Jia, Z.; Xie, J. Deformation damage and energy evolution characteristics of coal at different depths. Rock Mech. Rock Eng. 2019, 52, 1491–1503. [Google Scholar] [CrossRef]
- Yang, S.Q.; Jing, H.W.; Cheng, L. Influences of pore pressure on short-term and creep mechanical behavior of red sandstone. Eng. Geol. 2014, 179, 10–23. [Google Scholar] [CrossRef]
- Han, B.; Shen, W.Q.; Xie, S.Y.; Shao, J.F. Influence of pore pressure on plastic deformation and strength of limestone under compressive stress. Acta Geotech. 2019, 14, 535–545. [Google Scholar] [CrossRef]
- Terzaghi, K.T. Theoretical Soil Mechanics; John Wiley and Sons Inc.: New York, NY, USA, 1943; p. 314. [Google Scholar]
- Biot; Maurice, A. General theory of three-dimensional consolidation. J. Appl. Phys. 1941, 12, 155–164. [Google Scholar] [CrossRef]
- Saurabh, S.; Harpalani, S. The effective stress law for stress-sensitive transversely isotropic rocks. Int. J. Rock Mech. Min. Sci. 2018, 101, 69–77. [Google Scholar] [CrossRef]
- Wang, Y.; Meng, F.; Wang, X.; Baud, P.; Wong, T.F. Effective stress law for the permeability and deformation of four porous limestones. J. Geophys. Res. Solid Earth 2018, 123, 4707–4729. [Google Scholar] [CrossRef]
- Zhang, L.; Kan, Z.; Zhang, C.; Tang, J. Experimental study of coal flow characteristics under mining disturbance in China. Int. J. Coal Sci. Technol. 2022, 9, 66. [Google Scholar] [CrossRef]
- Sing, K.S.W. Reporting physisorption data for gas/solid systems with special reference to the determination of surface area and porosity (Recommendations 1984). Pure Appl. Chem. 1985, 57, 603–619. [Google Scholar] [CrossRef]
- Culshaw, M.G.; Ulusay, R. The ISRM suggested methods for rock characterization, testing and monitoring: 2007–2014: Cham, Switzerland: Springer. Bull. Eng. Geol. Environ. 2015, 74, 1499–1500. [Google Scholar] [CrossRef]
- Liu, Y.; Wang, J.H.; Lu, C.P.; Wang, C.; Xie, H.D.; Yan, X.Y. Research on instability characteristics and precursory effect of coal-rock parting-coal structures. Sci. Rep. 2022, 12, 12091. [Google Scholar] [CrossRef] [PubMed]
- Noorsuhada, M.N. An overview on fatigue damage assessment of reinforced concrete structures with the aid of acoustic emission technique. Constr. Build. Mater. 2016, 112, 424–439. [Google Scholar] [CrossRef]
- Ohno, K.; Ohtsu, M. Crack classification in concrete based on acoustic emission. Constr. Build. Mater. 2010, 24, 2339–2346. [Google Scholar] [CrossRef]
- Yao, Q.; Chen, T.; Tang, C.; Sedighi, M.; Wang, S.; Huang, Q. Influence of moisture on crack propagation in coal and its failure modes. Eng. Geol. 2019, 258, 105156. [Google Scholar] [CrossRef]
- Martin, C.D.; Chandler, N.A. The Progressive fracture of Lac du Bonnet granite. Int. J. Rock Mech. Min. Sci. Geomech. Abstr. 1994, 31, 643–659. [Google Scholar] [CrossRef]
- Nicksiar, M.; Martin, C.D. Evaluation of methods for determining crack initiation in compression tests on low-porosity rocks. Rock Mech. Rock Eng. 2012, 45, 607–617. [Google Scholar] [CrossRef]
- Han, B.; Xie, S.Y.; Shao, J.F. Experimental investigation on mechanical behavior and permeability evolution of a porous limestone under compression. Rock Mech. Rock Eng. 2016, 49, 3425–3435. [Google Scholar] [CrossRef]
- Zhang, B.; Wu, H.; Liu, C.; Han, F.; Ma, Y. The effect of stress on pore pressure in rocks and the mechanism of water table anomaly before earthquakes. Acta Seismol. Sin. 1992, 5, 153–159. [Google Scholar] [CrossRef]
- Wong, T.F.; David, C.; Zhu, W. The transition from brittle faulting to cataclastic flow in porous sandstones; mechanical deformation. J. Geophys. Res. Solid Earth 1997, 102, 3009–3025. [Google Scholar] [CrossRef]
- Rubey, W.W.; King, H.M. Role of fluid pressure in mechanics of overthrust faulting: II overthrust belt in geosybclinal area of western Wyoming in light of fluid-pressure hypothesis. GSA Bull. 1959, 70, 167–206. [Google Scholar] [CrossRef]
- Luo, H.; Yu, J.K.; Pan, Y.S.; Wang, J.L.; Zhang, Y. Electric charge induction law of coal rock containing gas with bursting tendency during loading failure process. J. China Coal Soc. 2020, 45, 684–694. [Google Scholar]
- Song, Z.L.; Han, P.B.; Li, W.P.; Yin, G.Z.; Li, M.H.; Kang, X.T. Impact of energy dissipation of coal samples with rockburst tendency from gas in its failure process. J. China Coal Soc. 2015, 40, 843–849. [Google Scholar]
- Qing, Q.X.; Pan, Y.S.; Shu, L.Y.; Li, H.Y.; Jiang, D.Y.; Zhao, S.K.; Zou, Y.H.; Pan, J.F.; Wang, K.J.; Li, H.T. Theory and technical framework of prevention and control with different sources in multi-scales for coal and rock dynamic disasters in deep mining of coal mines. J. China Coal Soc. 2018, 43, 1801–1810. [Google Scholar]
- Gretener, P.E. Pore Pressure: Fundamentals, General Ramifications and Implications for Structural Geology (Revised Edition); American Association of Petroleum Geologists United States: Tulsa, OK, USA, 1979. [Google Scholar]


| Sample Name | σ3 MPa | PP MPa | Porosity % | Condition | Sample Name | σ3 MPa | PP MPa | Porosity % | Condition |
|---|---|---|---|---|---|---|---|---|---|
| Z-9-3 | 9 | 3 | 7.29 | Saturated | T-9-3 | 9 | 3 | 2.58 | Saturated |
| Z-9-6 | 9 | 6 | 8.70 | Saturated | T-12-6 | 12 | 6 | 4.05 | Saturated |
| Z-12-6 | 12 | 6 | 6.89 | Saturated | T-15-9 | 15 | 9 | 5.20 | Saturated |
| Z-12-9 | 12 | 9 | 7.69 | Saturated | Z-9 | 9 | 0 | 6.86 | Dry |
| Z-15-9 | 15 | 9 | 8.17 | Saturated | Z-12 | 12 | 0 | 9.66 | Dry |
| Z-15-12 | 15 | 12 | 6.83 | Saturated | Z-15 | 15 | 0 | 9.49 | Dry |
| Z-12-0 | 12 | 0 | 7.78 | Wet | Z-9-0 | 9 | 0 | 9.07 | Wet |
| Z-15-0 | 15 | 0 | 6.55 | Wet |
| Sample Condition | σ3 (MPa) | β (°) | Sample Condition | σ3 (MPa) | β (°) | Sample Condition | σ3 (MPa) | β (°) |
|---|---|---|---|---|---|---|---|---|
| dry | 9 | 64.2 | wet | 9 | 68.7 | σe3 = 6 MPa | 9 | 67.6 |
| dry | 12 | 63.2 | wet | 12 | 64.8 | σe3 = 6 MPa | 12 | 69.0 |
| dry | 15 | 56.5 | wet | 15 | 64.5 | σe3 = 6 MPa | 15 | 70.5 |
| σe3 = 3 MPa | 9 | 64.7 | σe3 = 6 MPa | 9 | 53.5 | |||
| σe3 = 3 MPa | 12 | 68.4 | σe3 = 6 MPa | 12 | 67.6 | |||
| σe3 = 3 MPa | 15 | 72.4 | σe3 = 6 MPa | 15 | 71.9 |
Publisher’s Note: MDPI stays neutral with regard to jurisdictional claims in published maps and institutional affiliations. |
© 2022 by the authors. Licensee MDPI, Basel, Switzerland. This article is an open access article distributed under the terms and conditions of the Creative Commons Attribution (CC BY) license (https://creativecommons.org/licenses/by/4.0/).
Share and Cite
Liu, X.; Xue, K.; Luo, Y.; Long, K.; Liu, Y.; Liang, Z. The Effect of Pore Pressure on the Mechanical Behavior of Coal with Burst Tendency at a Constant Effective Stress. Sustainability 2022, 14, 14568. https://doi.org/10.3390/su142114568
Liu X, Xue K, Luo Y, Long K, Liu Y, Liang Z. The Effect of Pore Pressure on the Mechanical Behavior of Coal with Burst Tendency at a Constant Effective Stress. Sustainability. 2022; 14(21):14568. https://doi.org/10.3390/su142114568
Chicago/Turabian StyleLiu, Xiaobo, Kangsheng Xue, Yong Luo, Kun Long, Yanan Liu, and Zhiming Liang. 2022. "The Effect of Pore Pressure on the Mechanical Behavior of Coal with Burst Tendency at a Constant Effective Stress" Sustainability 14, no. 21: 14568. https://doi.org/10.3390/su142114568
APA StyleLiu, X., Xue, K., Luo, Y., Long, K., Liu, Y., & Liang, Z. (2022). The Effect of Pore Pressure on the Mechanical Behavior of Coal with Burst Tendency at a Constant Effective Stress. Sustainability, 14(21), 14568. https://doi.org/10.3390/su142114568