Article

Influence of Technology on Perceived Obsolescence though Product Design Properties

by
Miguel-Angel Pardo-Vicente
*,
Patricia Camacho-Magriñan
and
Pablo Pavon-Dominguez
Department of Mechanical Engineering & Industrial Design, Faculty of Engineering, University of Cadiz, Av. Universidad de Cádiz 10, Puerto Real, E-11519 Cadiz, Spain
*
Author to whom correspondence should be addressed.
Sustainability 2022, 14(21), 14555; https://doi.org/10.3390/su142114555
Submission received: 5 October 2022 / Revised: 28 October 2022 / Accepted: 2 November 2022 / Published: 5 November 2022
(This article belongs to the Special Issue Product Design Innovation and Consumer Psychology)

Abstract

:
Formal or perceived obsolescence describes the fact that users decide to stop using a product, even though it still fulfils its function. This is because the design is perceived as obsolete, which also leads to negative product semantics. This is often the case with products that are frequently updated to incorporate the latest technology. The aim of this paper is to understand the influence of technology on the perception of design. To this end, 297 people were surveyed about their perception of formal obsolescence in regard to different elements of a car and a smartphone, based on their design properties: shape, colour and material. In addition, technological attributes (some of which were dystopian) were added to these products to assess the influence of current or obsolete technology on participants’ perception of obsolescence. Possible correlations were assessed by means of a chi-square analysis. The results show that technology does not influence all design properties in the same way, with shape being more important than colour or material. This is especially true for multimedia products, such as vehicle displays or smartphones. The results of this paper can help design engineers to create products that last longer, while also reducing their environmental impact.

1. Introduction

Since the second half of the 20th century, society has increasingly demanded product redesigns, and over time, these products have had to adapt to an ever-changing market [1]. User-driven changes are motivated by two main reasons: functional and product semantics [2,3,4]. Functional reasons relate to the pragmatic needs of the user, while semantic reasons are related to the user’s perception of the product, for example, they use it to communicate their way of life to other users [5,6]. Thus, if a manufacturer does not redesign its products, they will be perceived as formally obsolete by users over time [7,8]. There are also a number of sectors where formal renewal occurs more frequently. Many of these products have an important technological component [9]. This is the case, for example, with automobiles, laptops, tablets or smartphones. Notably, these products are often discarded by users before the end of their useful life, even if they are still functional. This is in contrast to planned obsolescence, where users are forced to discard a product because it no longer fulfils its function due to mechanical failures that are planned during its design and manufacture [10,11,12,13,14]. Thus, formal or perceived obsolescence is understood as when the user decides to dispense with a product even though it is capable of performing the function for which it was created, either because its design has not been adapted to the user’s changing needs, or because the technology it is equipped with is not state-of-the-art [15]. There is also so-called indirect obsolescence, which occurs when there are no compatible spare parts to repair a damaged product [16], as well as obsolescence due to incompatibility [16,17]; this occurs especially in technological products that are due to receive a software update and the device does not support it or it fails. The least studied type of obsolescence, which largely affects the most in-demand technological products, is formal or perceived obsolescence that derives from the user’s conscious and unconscious cognitive processing. The study of all these types of obsolescence reveals a fundamental part of the design and manufacturing process: the human side. The user’s behaviour with regard to the product, and their power over it, generates a very complex field of study while also providing interesting opportunities for design teams.
However, such studies are very scarce and very few literature reviews can be found in this field of study. Perceived obsolescence influences the user’s decision to dispose of a product before the end of its useful life, even before the expiry date that the company has set according to its economic estimations. Obviously, this has enormous repercussions for the environment, and might also influence the brand image, since the product may be perceived as obsolete sooner than expected. Given this context, the objectives of this work are as follows: (1) to describe the formal renewal cycles of two typologies of technological products; and (2) to examine what influence having different generations of technology has on the perception of product obsolescence. These objectives are intended to guide design teams on how a user perceives design properties depending on the type of product and technology used. Thus, it is possible to quantify the user’s perception of the impact of small technological or design changes. In this way, the success of a product in the market can be predicted and quantified, thus mitigating the economic, energy and environmental issues resulting from poor planning in the design phase. In order to achieve these objectives, we studied the evolution of the design of two of the most in-demand technological products in our society, which also suffer the most from formal obsolescence: automobiles and smartphones. The former costs more than €6000 and manufacturers base generational changes on technological improvements [18], while the second is a small device that starts at €100, depending on the model, and which has seen a steady increase in use since the beginning of the 21st century [19]. The smartphone is also one of the most frequently renewed technological products. Thus, the following section reviews these products, their renewal frequency, and analyses the characteristics that provide the most information in regard to the semantics of the product.
The remainder of this work is structured as follows: Section 2 describes the formal renewal periods of automobiles and smartphones and details the areas of special interest in relation to the product semantics. This information lays the foundation for the design of the experimental methodology shown in Section 3. In this section, based on surveys, we collected information on the level of perceived obsolescence for those parts of the products of special relevance. In Section 4, by means of a chi-square study, the results of this perception are shown for shape, color and material. Finally, the conclusions are provided in Section 5.

2. Evolution of Automobile and Smartphone Design

In order to better understand the influence that technology has on the perception of its design and how the product can be classified as current or obsolete, a retrospective study was made of the different types of products studied. This section considers the formal renewal cycles of several of the most outstanding automobiles and smartphones of recent years and analyses their product semantics.

2.1. The Evolution of the Automobile

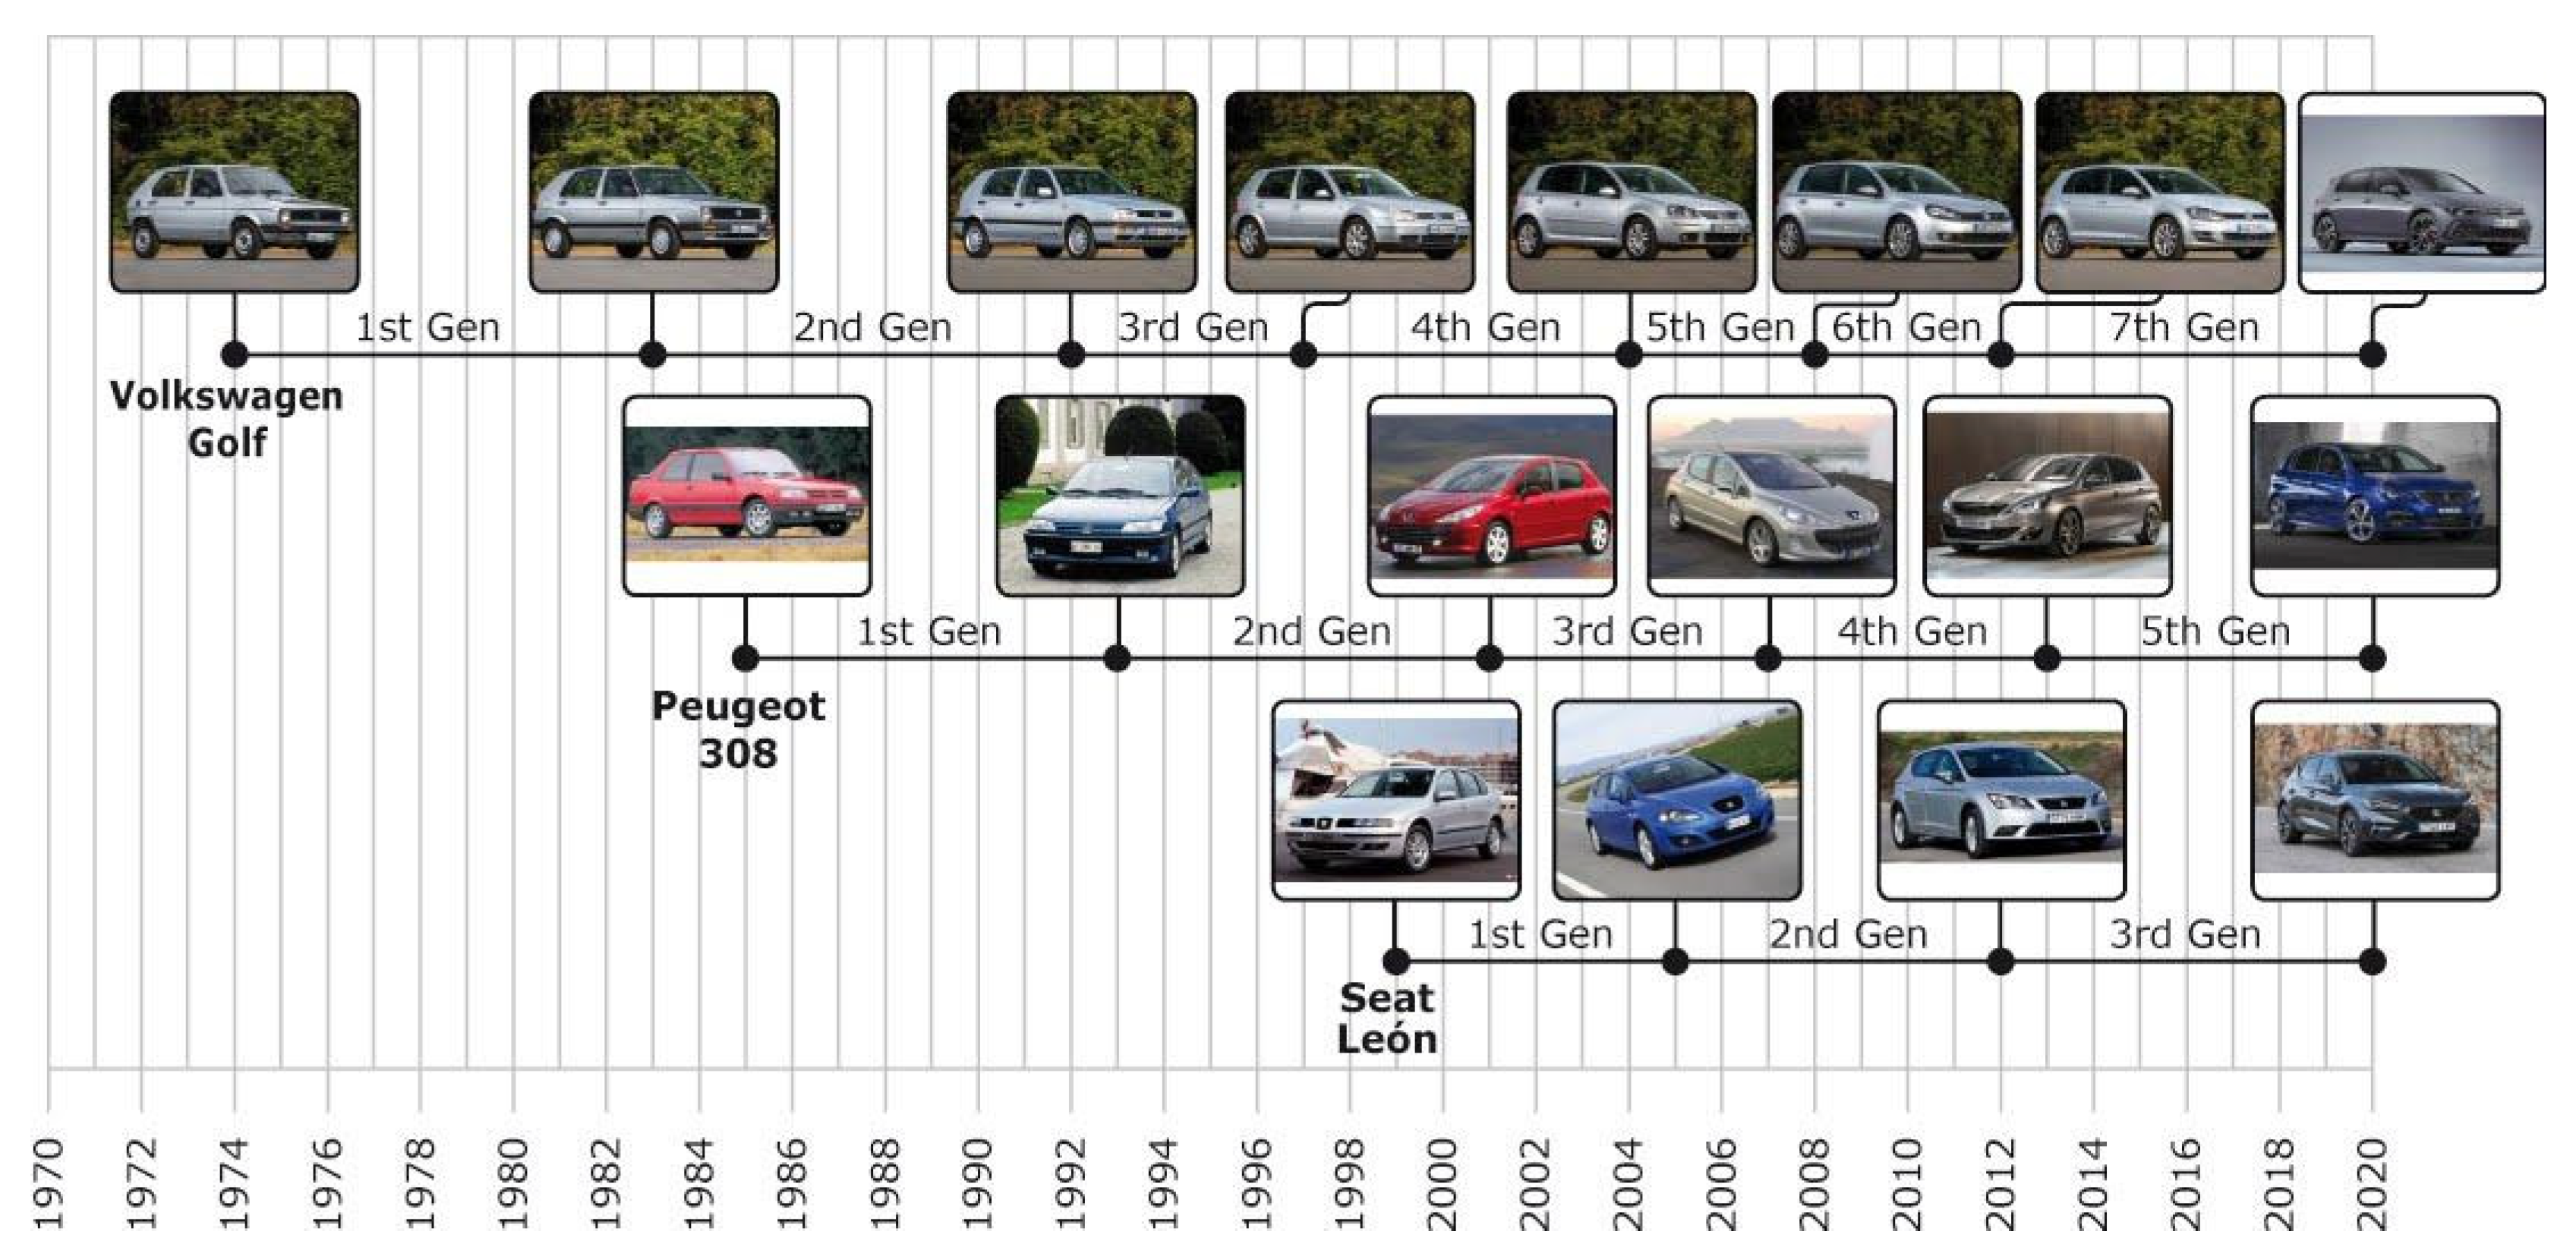
Figure 1 shows the evolution of the design of one of the longest-lasting cars of the 20th and 21st century, the Volkswagen Golf [20], which is German-built, and two of its competitors in the Spanish market, the Peugeot 308 and the Seat Leon, all of them in the C category. These brands were selected because of their different market launch dates and because their manufacturers are based in different countries, in France in the case of the Peugeot 308, and in Spain in the case of the Seat Leon.
Figure 1 shows that the model with the longest tradition is the Volkswagen Golf, which was produced without interruption for 46 years until 2020 [20]. From the time of its launch in 1974 up until the production of its seventh generation in 2012, the average renewal period was 6.3 years. However, the frequency of these renewals increased, from 9 years in the first generation to 4 years in the seventh generation. The Peugeot 308 was launched in 1984 and its fifth generation was launched in 2013. The brand renews its design every 7 years on average, which is a longer period of time than the Volkswagen, but with a smaller dispersion of between 6 and 8 years. The third model, the Seat Leon, was launched in 1999 and currently has only three generations with 6 and 7 years of renewal time between them, that is, an average of 6.5 years. The difference in the formal renewal averages for the three models is 0.7 years, which means that although the launch dates of the first models are very different, the renewal times are quite similar. This also shows that the renewal times have shortened over time for all three automobile models, confirming the trend towards shorter and shorter renewal cycles. As already mentioned, there are several reasons for this need to increase the frequency of renewal, but it can be seen that the market is demanding more frequent design changes; thus, the perception of formal obsolescence is accelerated. On the other hand, it should also be noted that along with this renewal in product design, there is also an increase in the technology used in these models over time, which improves their performance with each generation. Thus, brands not only improve the technological aspects of the vehicle, but they also attempt to highlight this change through design. In this way, they achieve a greater impact on the consumer [21].

2.2. Developments in Smartphones

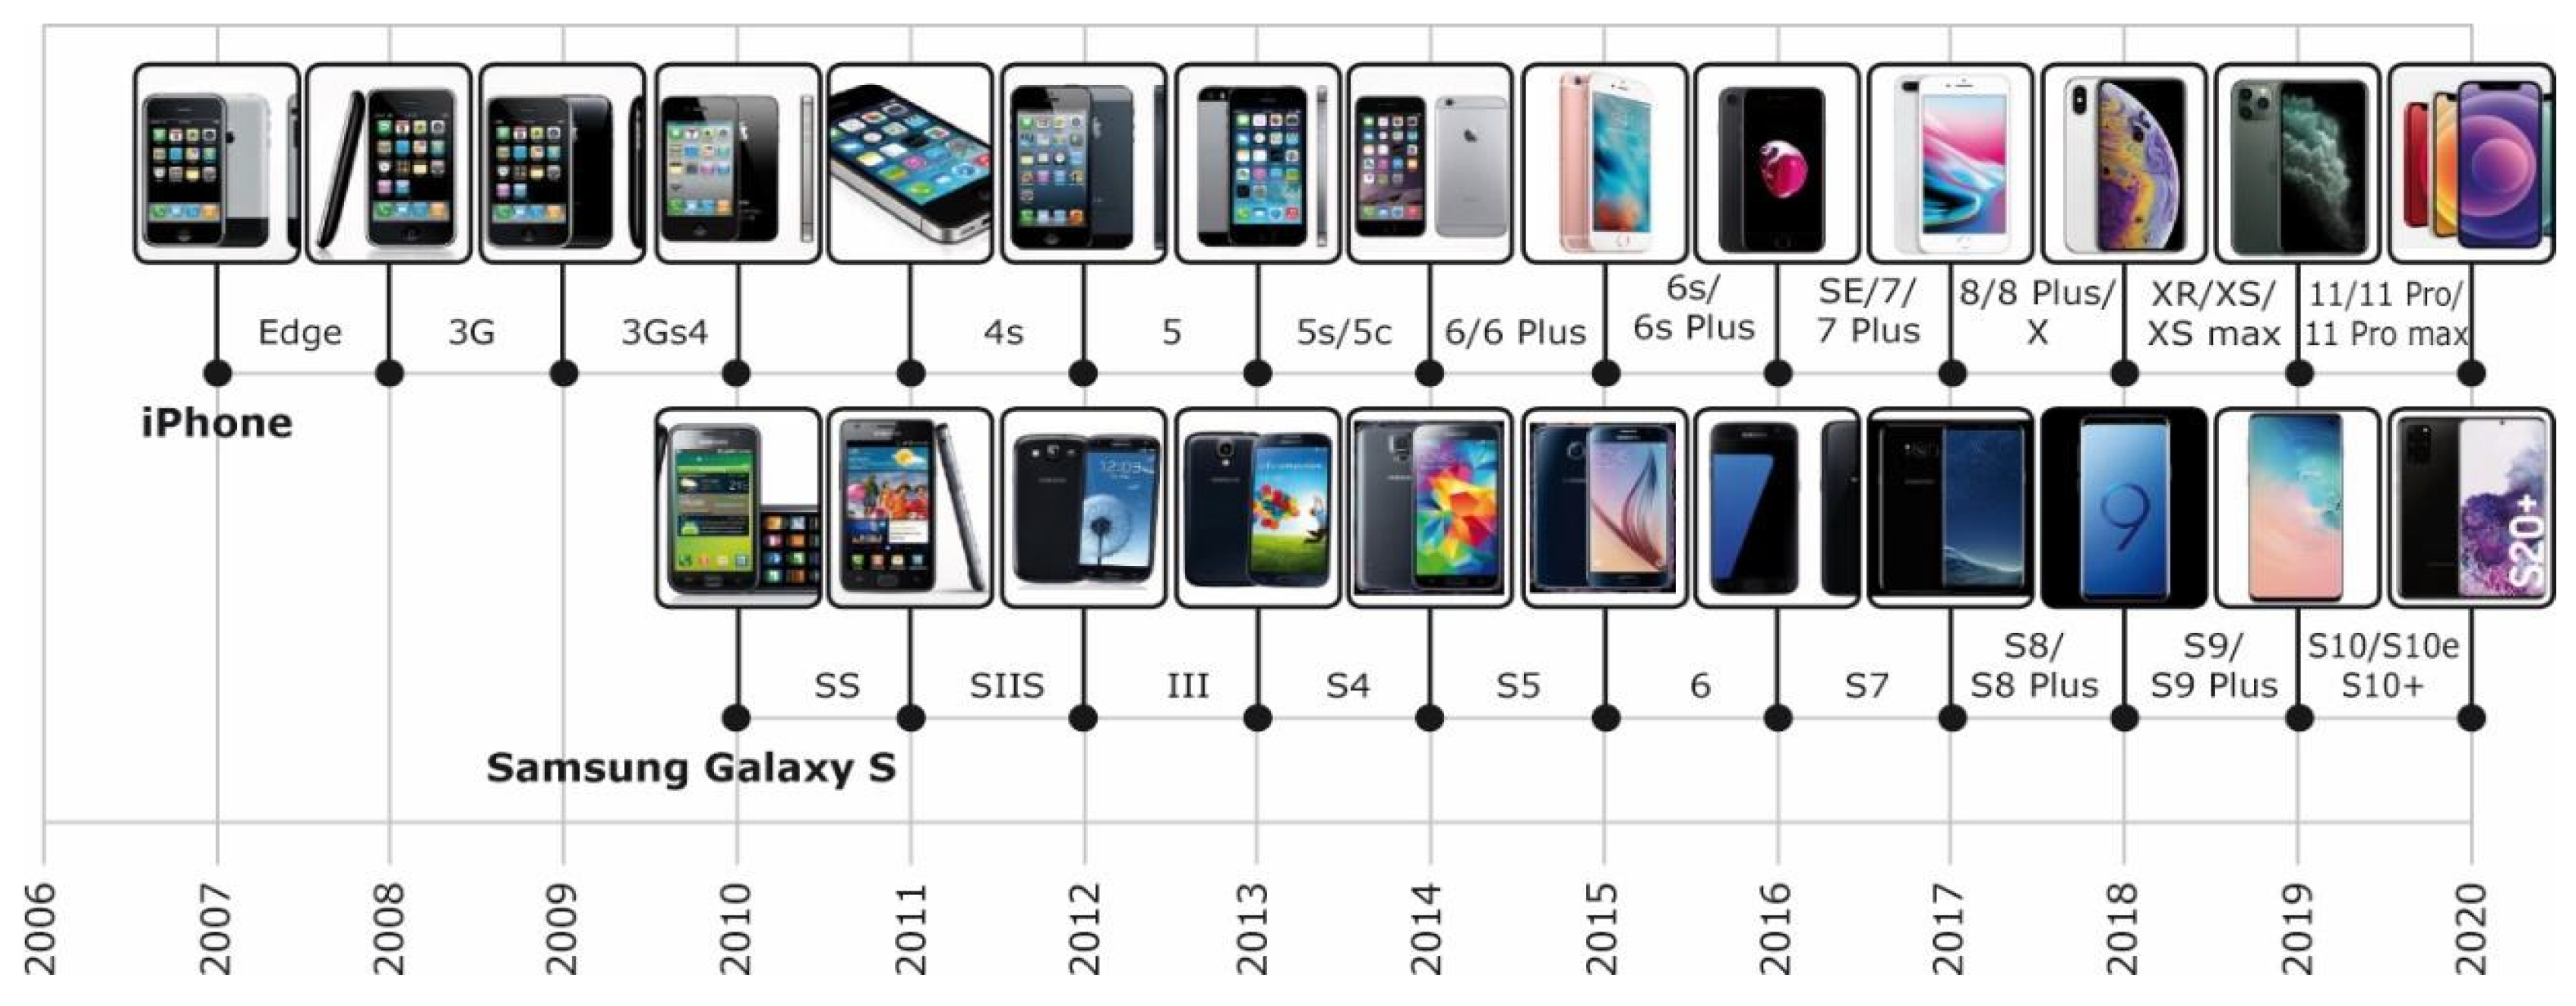
Figure 2 shows the evolution of smartphones and how their design has changed over time. For this type of product, the leading brands in the Spanish and European market were chosen [25]: Apple [26] and Samsung [27], the former is based in the USA and the latter in South Korea. In order for the products to be comparable, models of a similar range were chosen. In this case, Apple only had one iPhone model until 2013, so it was compared with Samsung’s Galaxy S model because it is technically similar.
According to the data, both brands launch a new generation onto the market every year. This indicates that there has been fairly high market pressure in terms of formal renewal from 2006 to the present. In this respect, and like the automobile, formal renewal is accompanied by technological improvements. This high frequency of renewal compared to the automobile is feasible, because, among other reasons, the cost of a smartphone is much lower than that of an automobile. However, the cost of these smartphones is high compared to the Gross Domestic Product (GDP) per capita per month. In the case of Spain, this index was 2202 €/person/month in 2019 [28], when the cost of an iPhone in that year was up to €1659 [26] and that of a Galaxy S was up to €1609 [27]. In this case, technology is used, as in the automotive industry, as a lure to attract the user; however, unlike the automobile, smartphone brands use design as a basic factor to highlight this technological change and achieve great differentiation in a short time. Thus, a smartphone that is two years old is designed so that its appearance communicates a very significant formal obsolescence within a short period of time.
In terms of materials, the first mobile phones were made of plastic materials, and it was not until 2010 that Apple launched a smartphone with a glass body [29]. Although these two materials currently coexist alongside others such as metal and ceramics, the chronology of their appearance shows that plastic materials are the most traditional materials in this industry and glass is the most recent. Aluminium and ceramics are intermediate materials in the chronology of the smartphone.

2.3. Areas of Particular Relevance for Product Semantics

Further analysis of the historical evolution of the product design shows that there are several components of the products that are renewed more frequently and in greater depth. These elements are used by designers as carriers of meaning. They convey perceived meaning and produce the perception of evolution in the user [7]. This change in the semantics of forms is led by those elements that carry the greater meaning. For this reason, the areas that are most frequently renewed play a leading role in the perception of obsolescence.
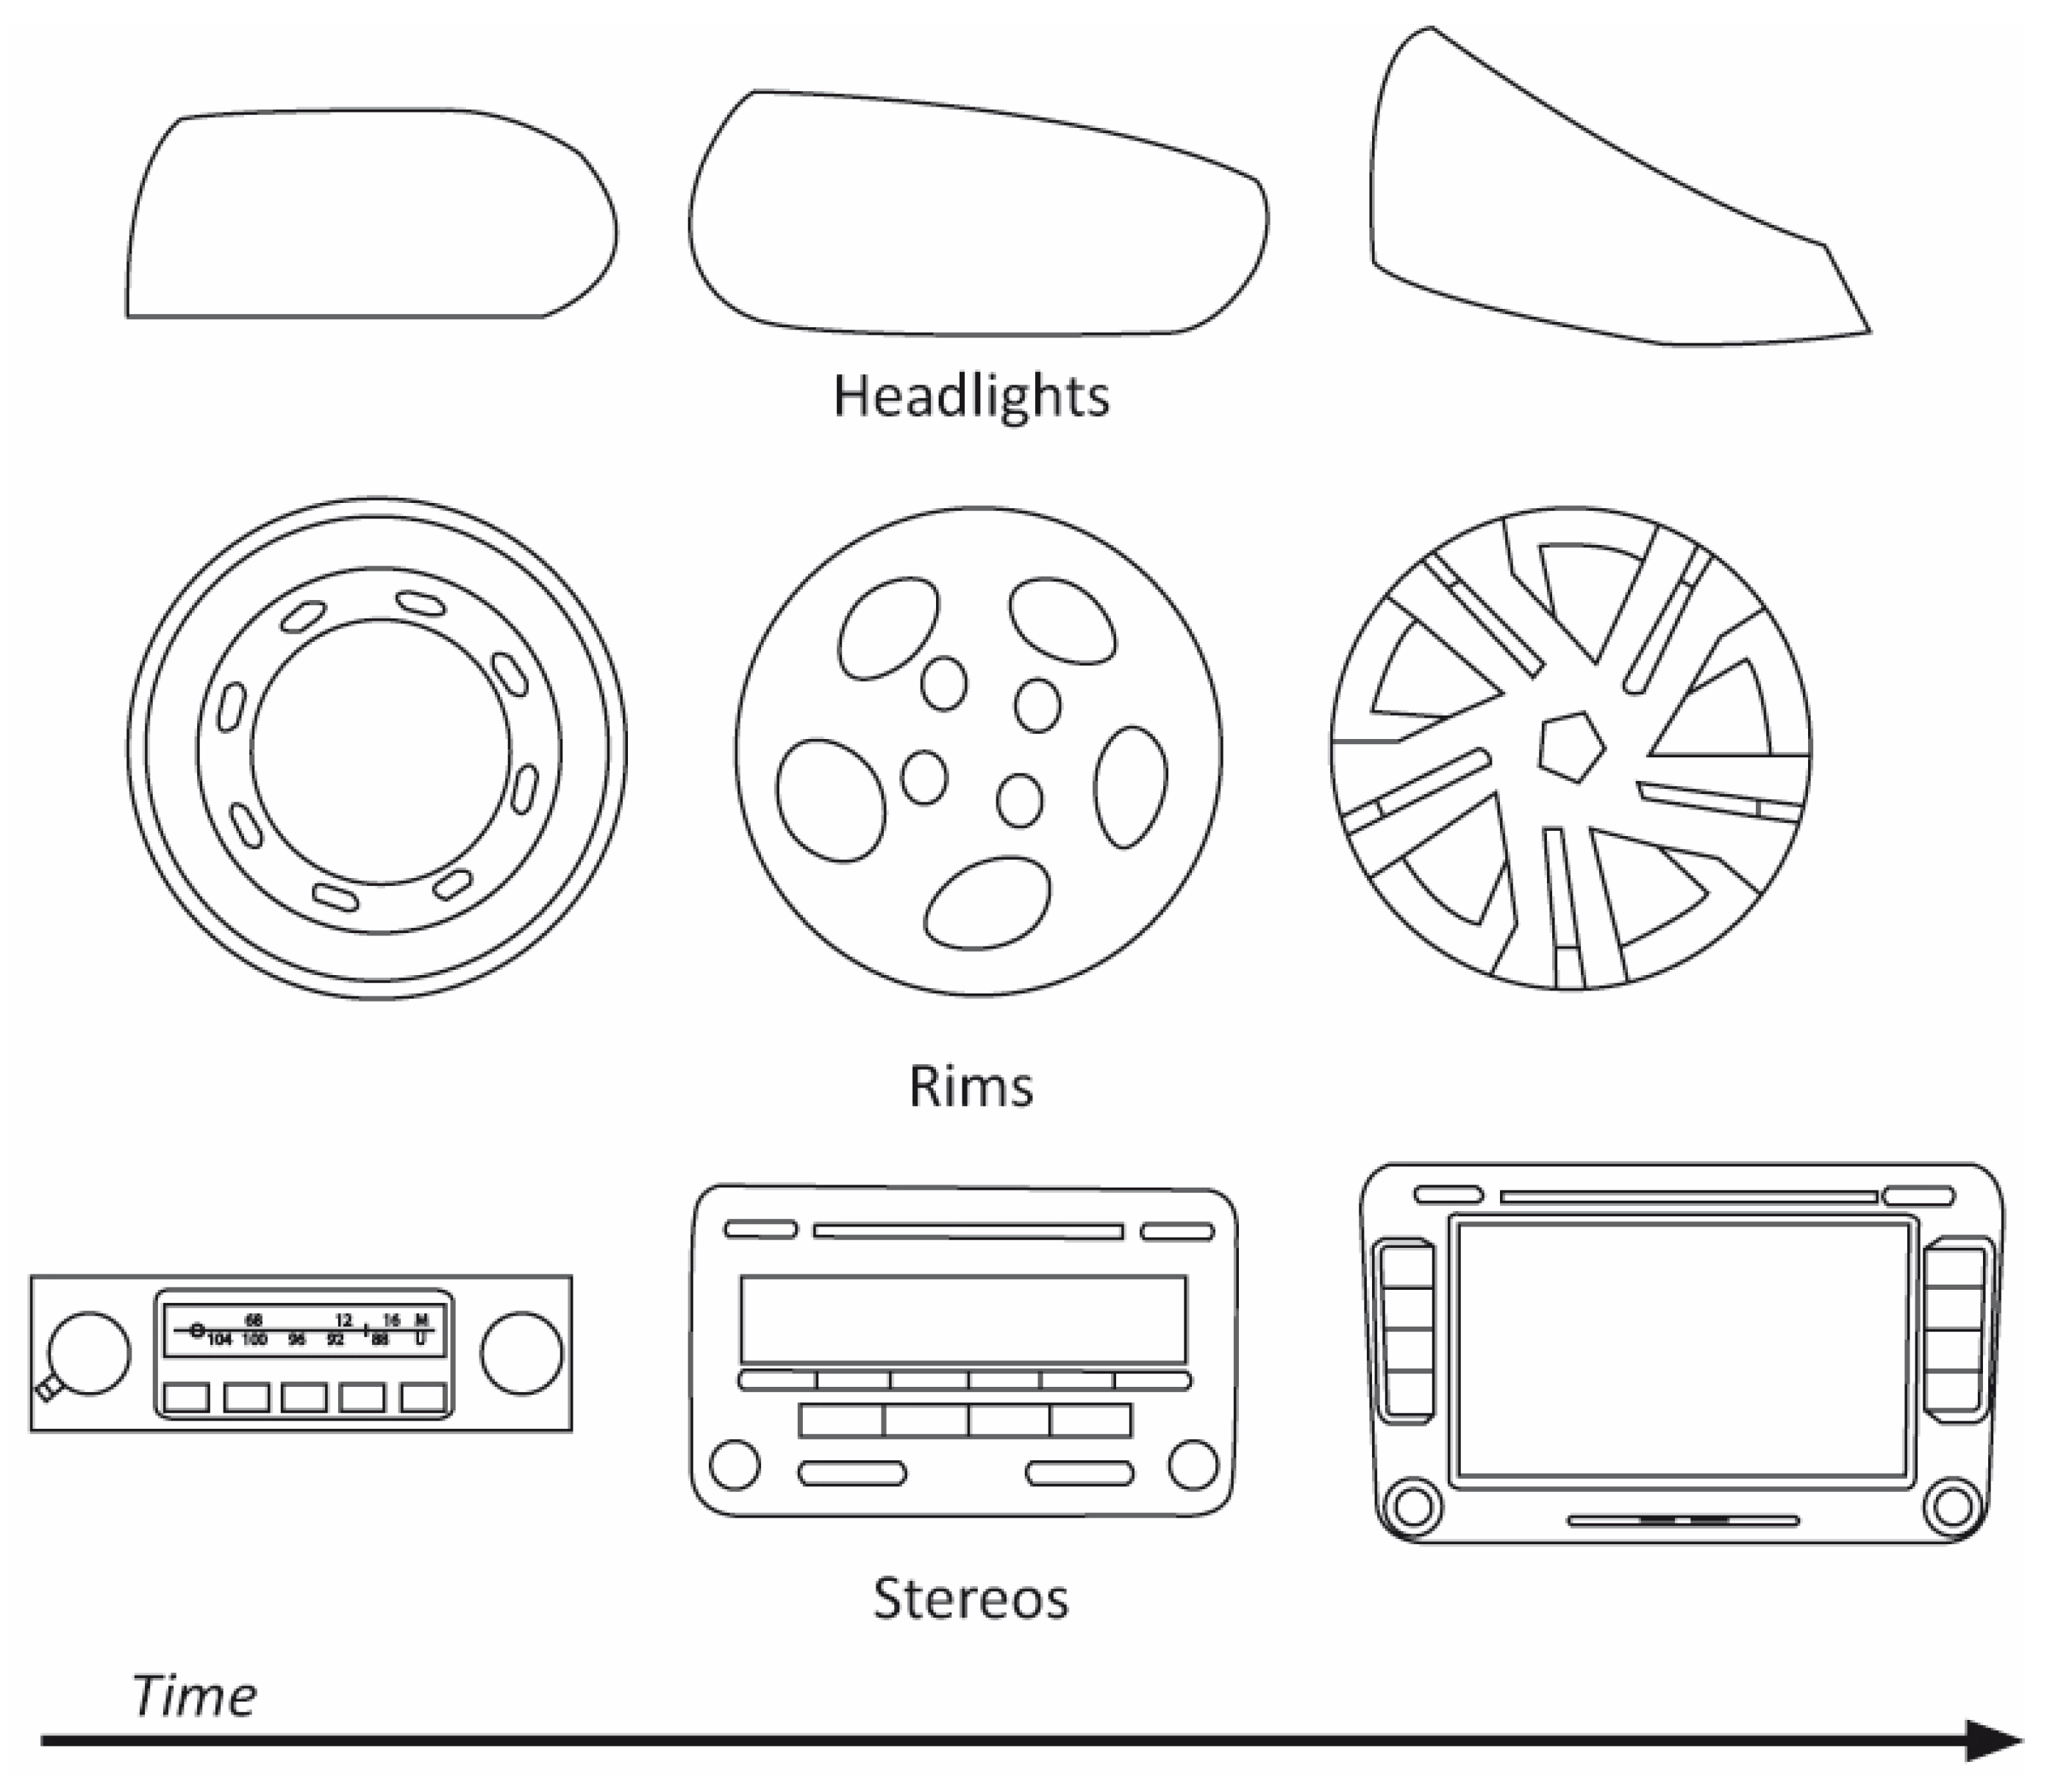
Similarly, in automobiles, two distinct categories can be distinguished in the discipline of automotive design: the exterior and the interior. With regard to the exterior, the front of the vehicle is one of the areas where the most profound changes occur, especially the headlamps, which are always symmetrical and emphasise the shape of the bodywork. Headlamps have evolved from a round shape, where the most important factor was their function, that is, to illuminate, to other more complex shapes designed to evoke emotions in the users [30,31,32,33]. Figure 3 shows this formal evolution. Following this trend, there are two other elements on the exterior that not only change frequently, but which are also used by brands to allow users to customise the product according to their preferences: these are the wheels, both in terms of shape and size, and the colour of the bodywork. These three elements signify the changes in exterior design over time.
In terms of interior design, and the frequency and depth of its renewal, the main focus has been on the design of the dashboard, specifically the screen area, which is where the change in multimedia technology is most clearly located. Likewise, the sound and navigation system has greatly increased in size and prominence. The most visible change has been the increase in the size of the screen and the way the user interacts with it, which has gone from being controlled via buttons to being mostly touch-sensitive.
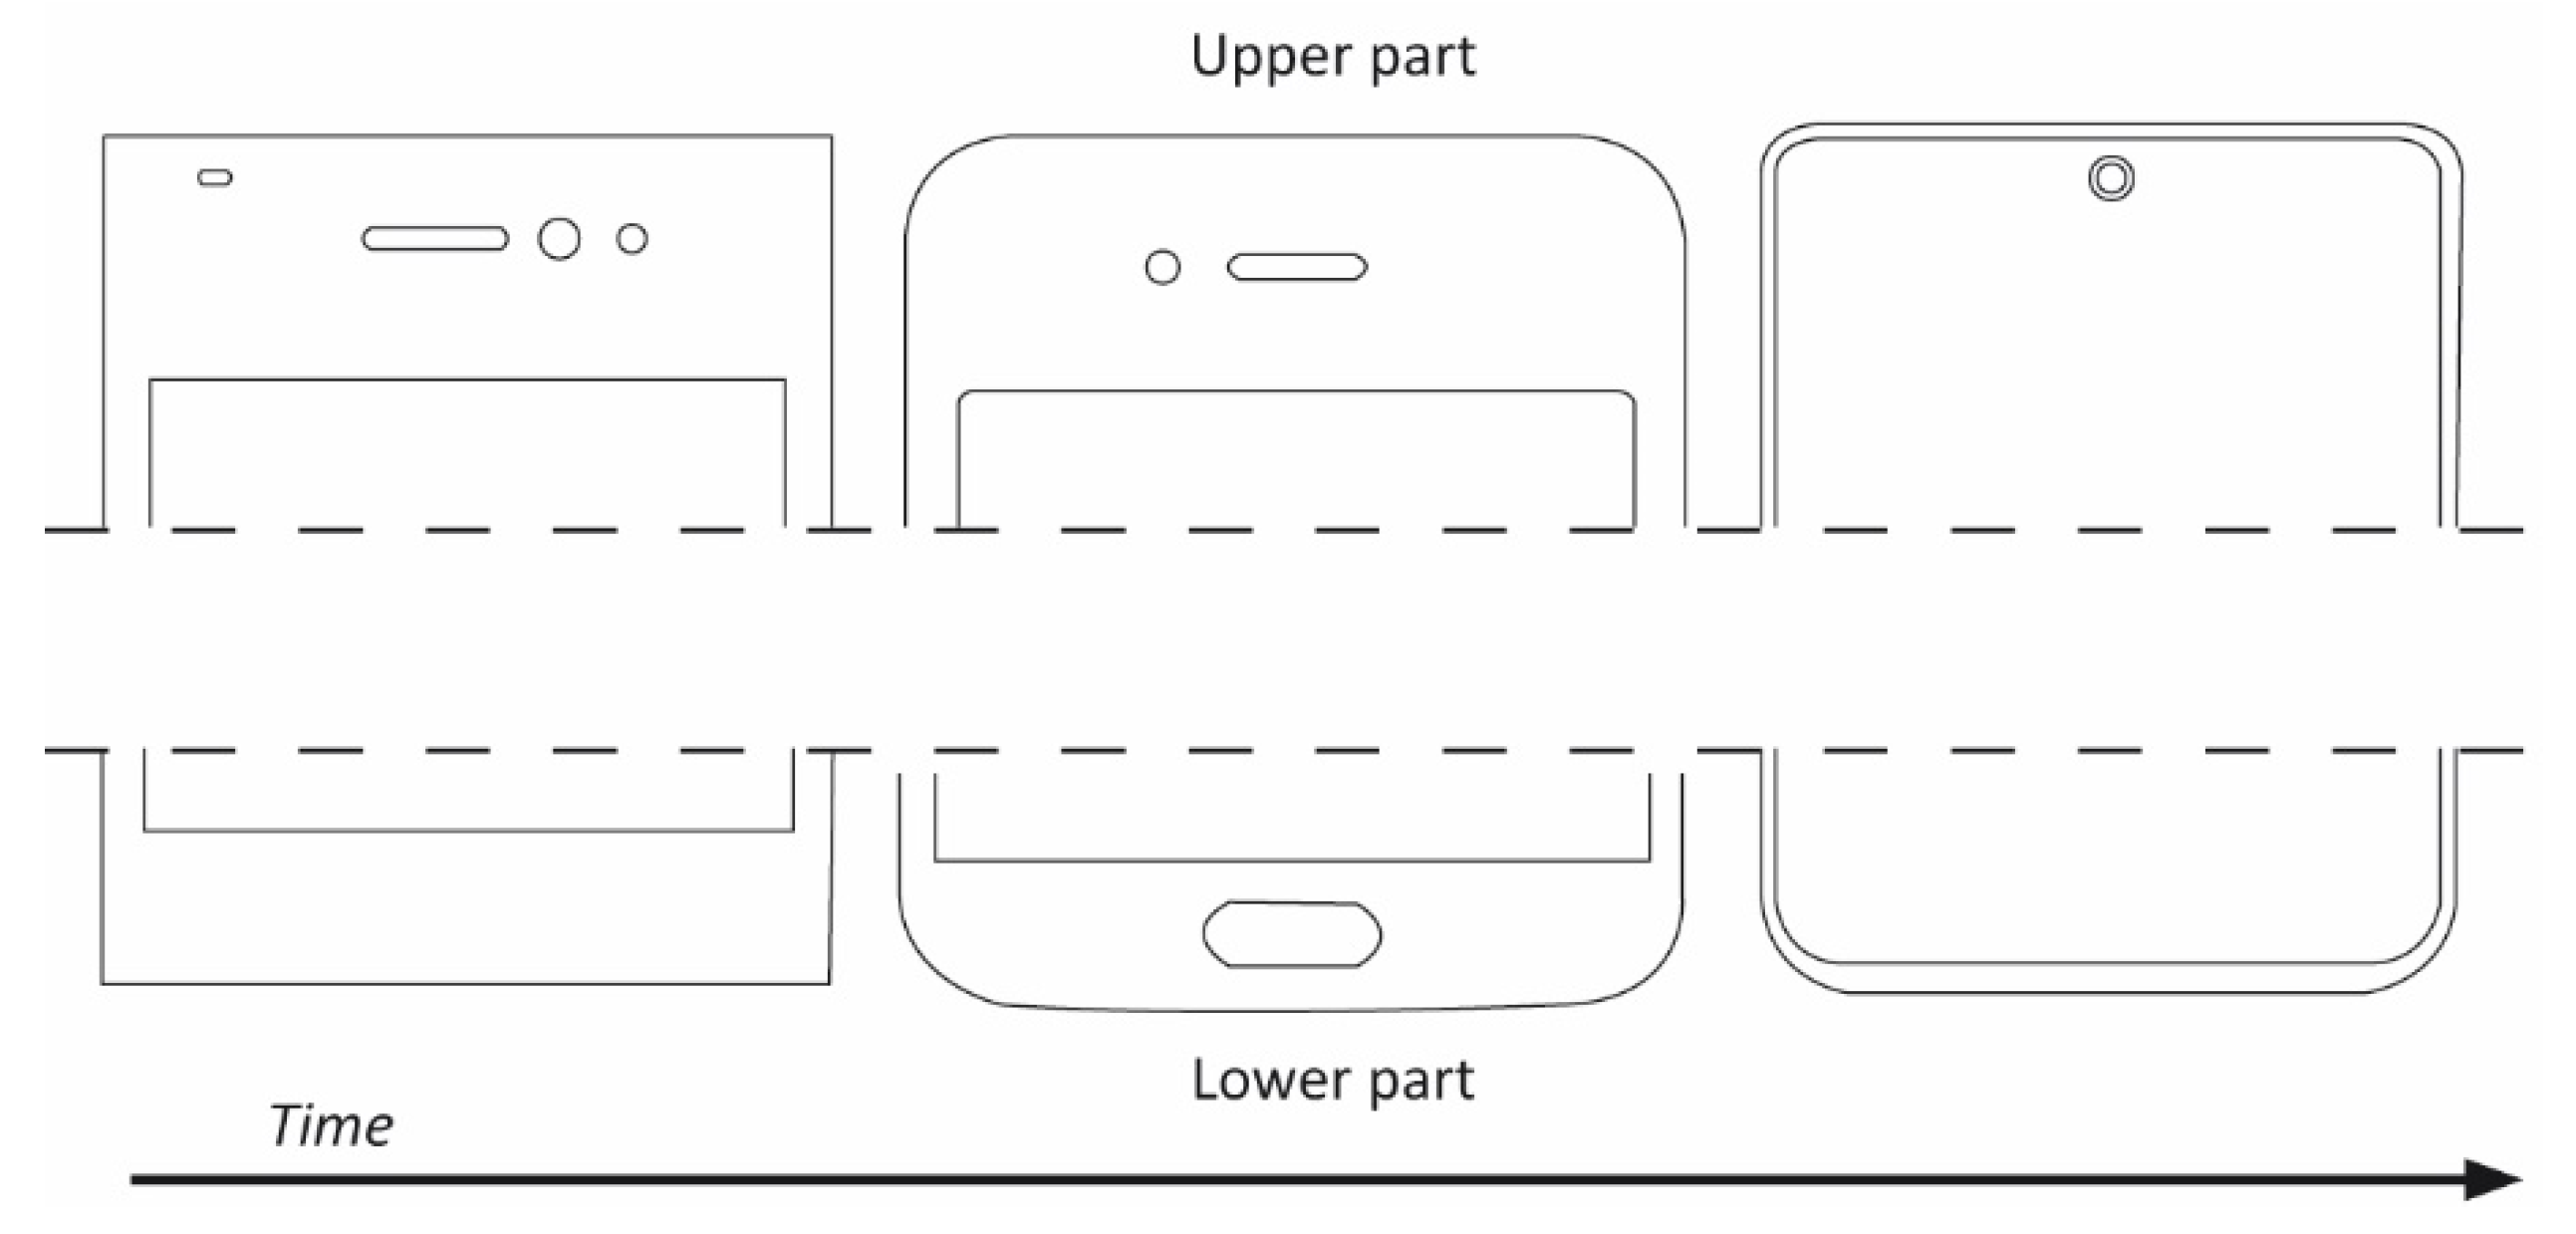
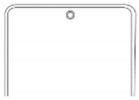
In the case of smartphones, the elements that carry most of the meaning are restricted to small changes in their design. Thus, the design of a smartphone can be divided into a top and a bottom part, due to the presence of the bezel or physical buttons. The material from which the body is made is also important as it is an eminently haptic product that the user always carries with him or her. For this reason, the material is an important element in the interaction between the user and the product. Figure 4 shows a schematisation of the formal evolution of the upper and lower areas of smartphones.
In this way, and through changes in design properties, i.e., shape, colour or material, design teams manage to update their products so that the user clearly perceives a generational change, thus controlling the perception of formal obsolescence. This obsolescence is reinforced by major technological changes in these product typologies. The interrelation of these technological changes and changes in design properties is fundamental in the perception of the obsolescence of a product. The choice of design properties, which depends on the technology with which a product is to be equipped, will have a major impact on the user’s perception. It is therefore important to quantify the relationship between technology and design to help product engineering teams to produce vehicles or smartphones that will be perceived as current for the chosen period of time, and that will not lead to premature rejection of the product. Otherwise, this can lead to financial losses, environmental costs due to changes in production lines, and negative perceptions of the company’s brand image.

3. Methodology

3.1. Methodology of the Experimental Study

3.1.1. Participants

The experimental study was carried out by means of an online questionnaire during the first quarter of 2020, with 297 participants aged 18 to 55 years old and living in Spain. Of these, 183 were women and 114 were men.

3.1.2. Data Collection

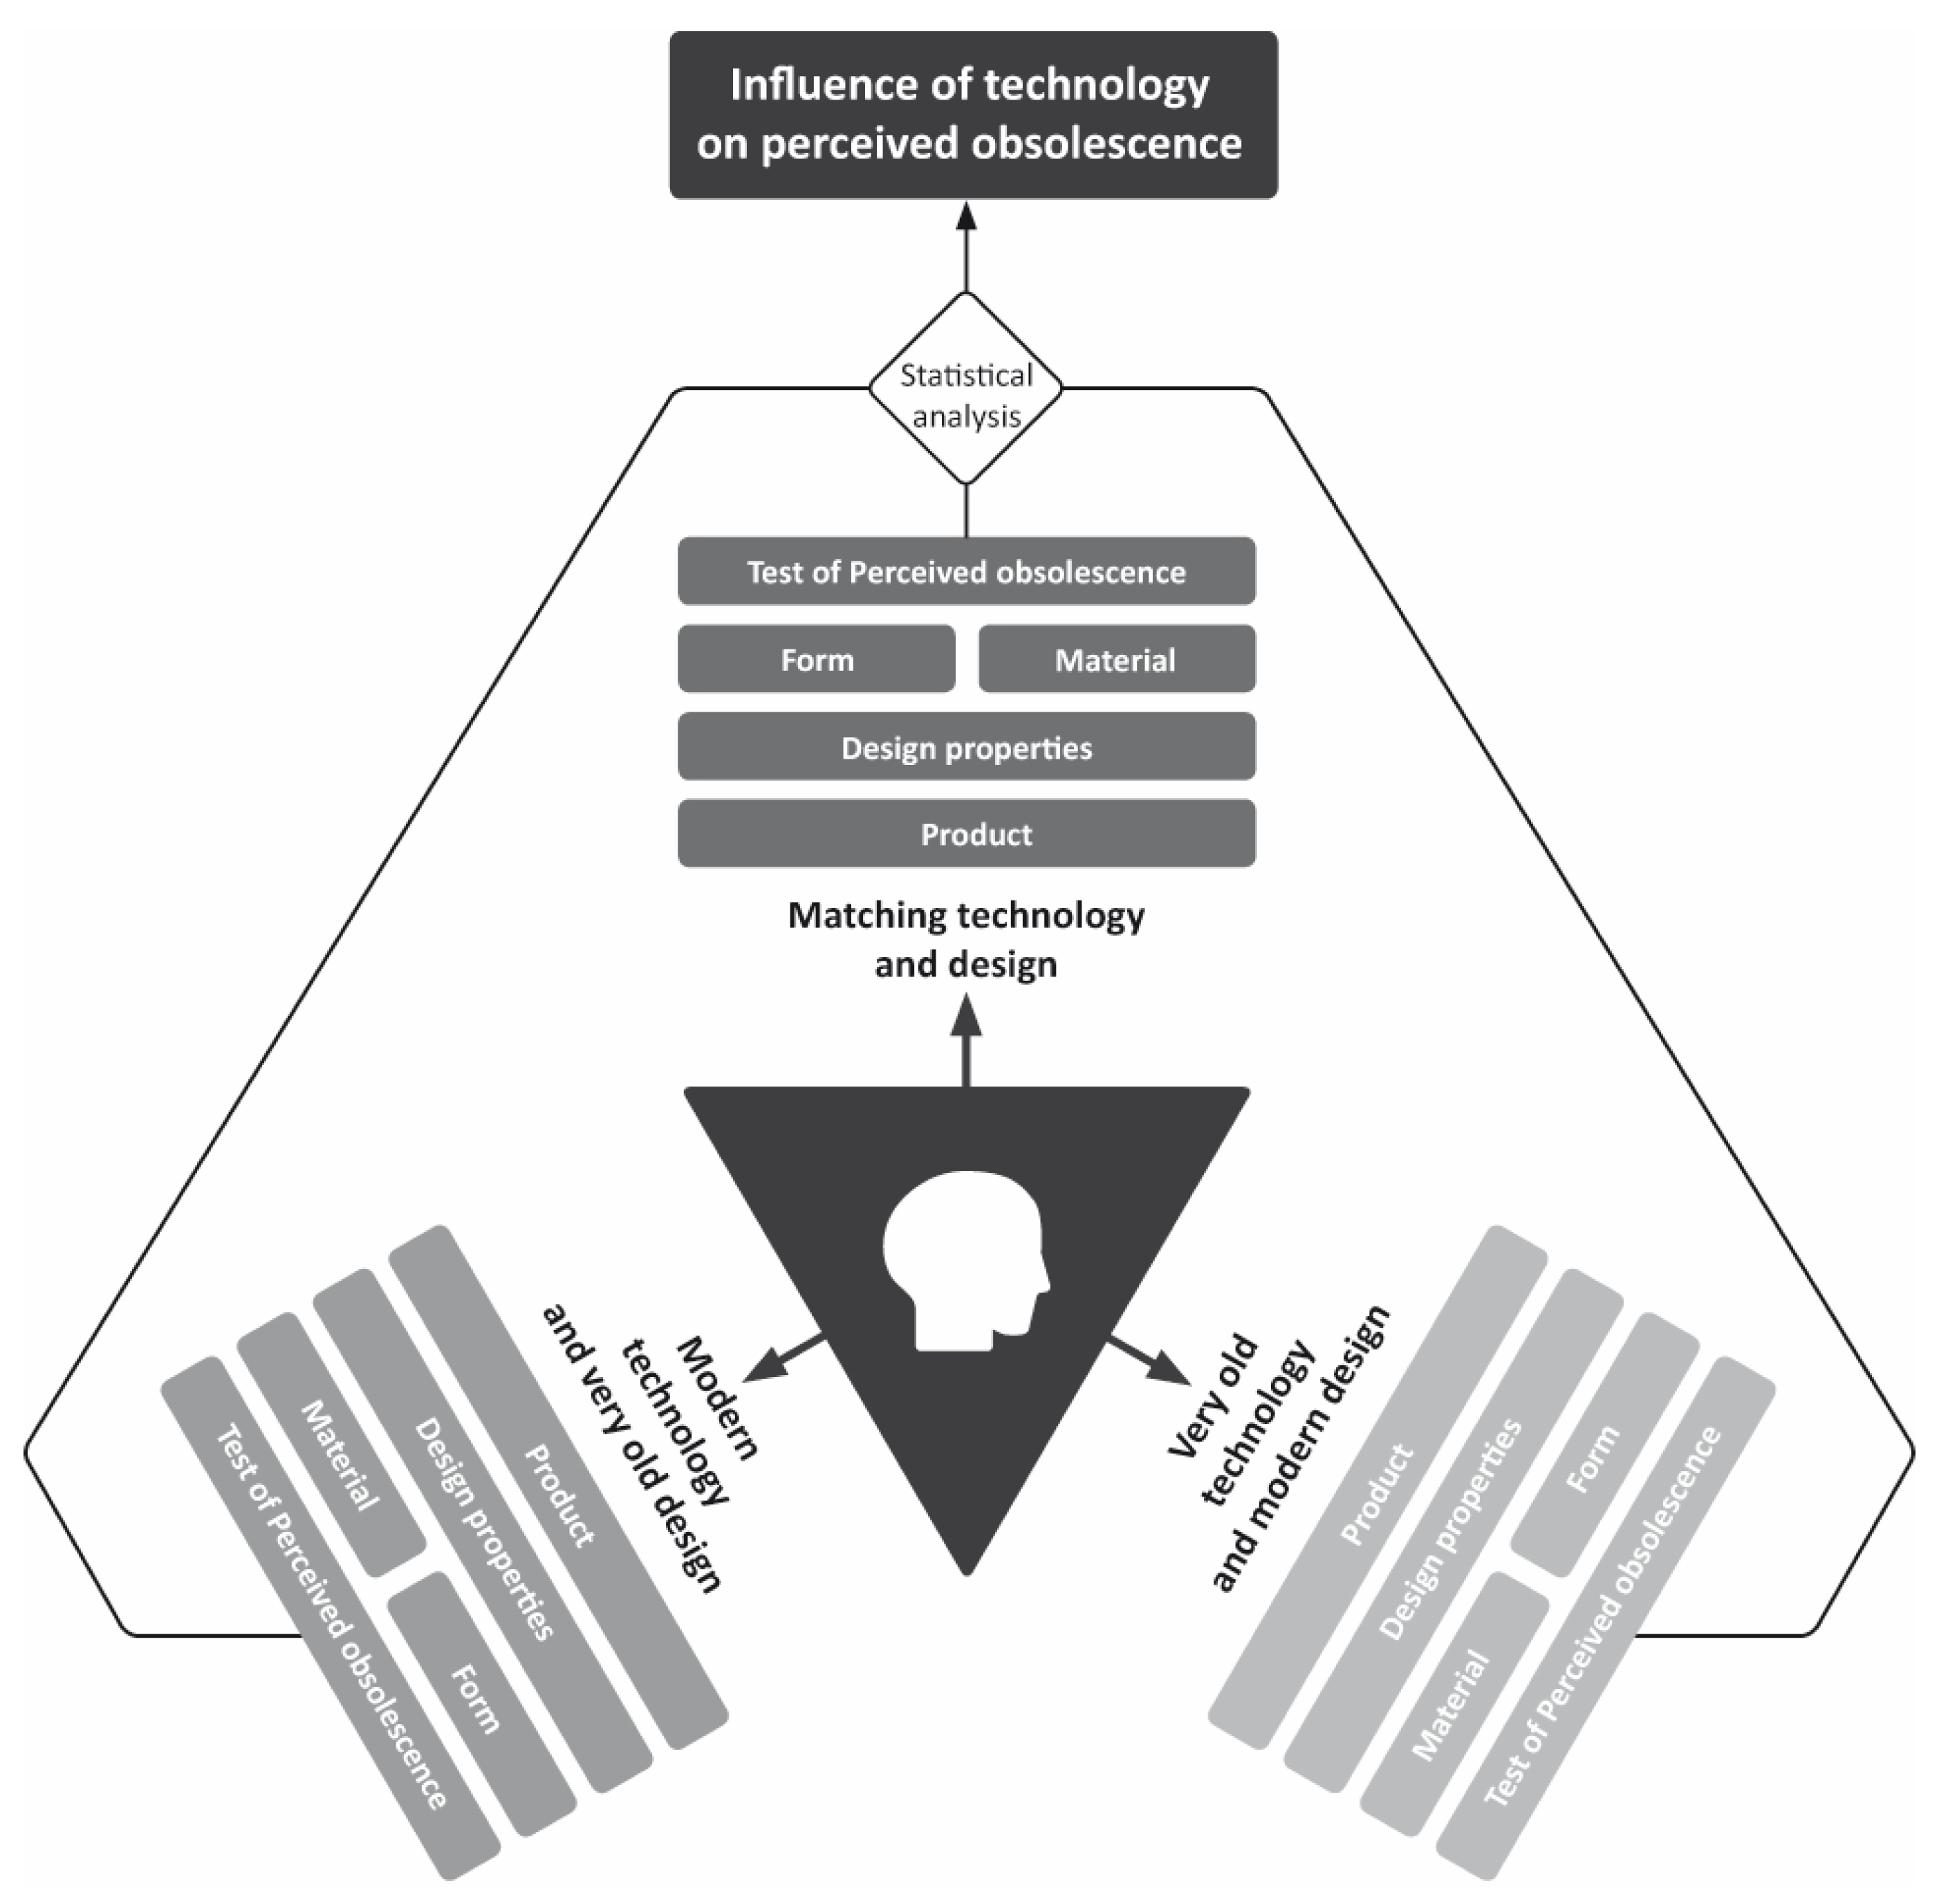
The questionnaire was divided into two parts. The first part assessed the perceived obsolescence of automobiles and smartphones based on partial images of these products. The images of automobiles and smartphones that were used correspond to Figure 3 and Figure 4, respectively. The images were classified as very old, old and modern. The images were displayed in a random order, so that the user did not link the shapes to their time sequence. The images were evaluated by the users on the basis of their design properties of shape, colour and material on a Likert scale of 1 to 5 points, with 1 being perceived as obsolete and 5 as current. The aim was to compare the results obtained in the study to the evolution of the design of these products. In this way, it is possible to relate whether the users’ perception of the modernity or obsolescence of the product corresponds to the chronological development of the product by the manufacturers. In the second part, a technological attribute was associated with the previous images by means of a short description, which provided information on how sophisticated the product was. This attribute could change the user’s perception of the modernity, and therefore, the relevance of the design. The objective was to evaluate the influence of this technological attribute on the perception of obsolescence previously revealed by the user. Therefore, the second part aimed to reveal the influence of technology on perceived obsolescence. Figure 5 summarises the methodology. It shows how a user will evaluate the product images using the design properties through the proposed test. The user will evaluate the products categorised in the previous phase as modern or old technologies. In order to provide statistical significance to the results and to analyse the trends in the perception of obsolescence and the influence of technology on design properties, a statistical analysis using contingency tables and chi-square was used to corroborate the differences between the users’ responses before and after the inclusion of the technological factor. This study used extreme cases, that is, very old and modern design.
Figure 5 shows a diagram of the experimental methodology.

4. Results and Discussion

4.1. Design Property: Shape

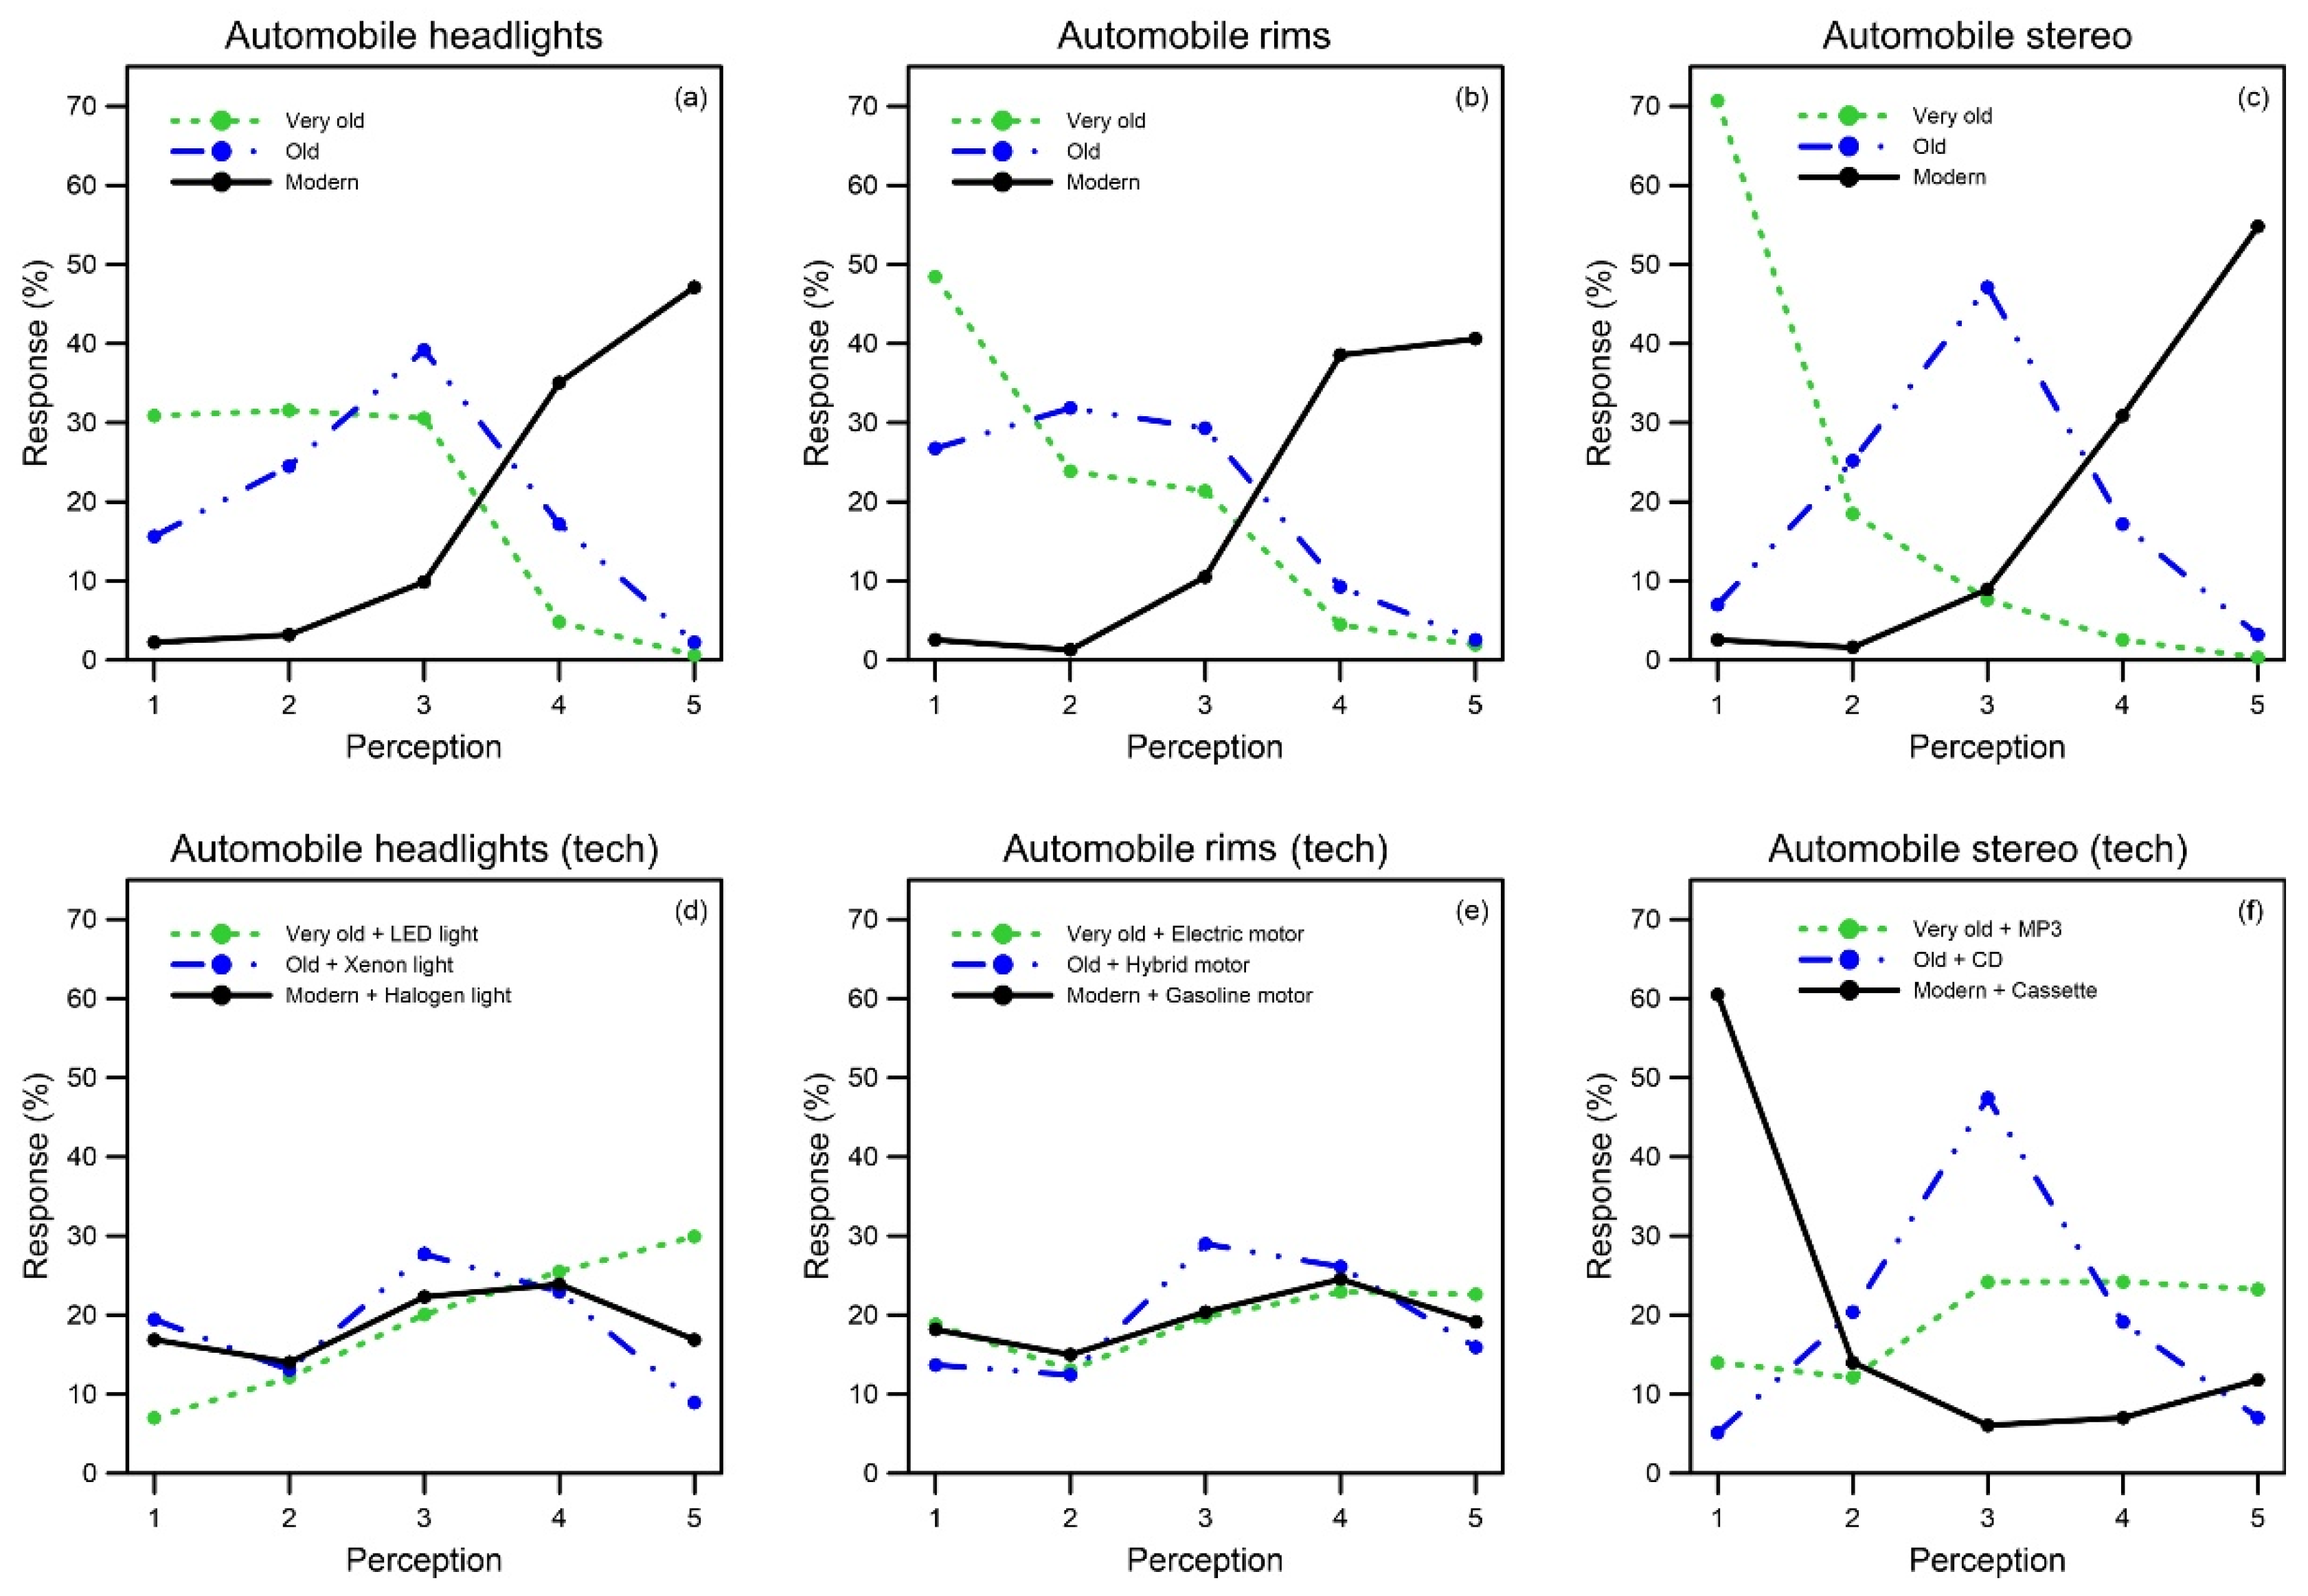
Figure 6 shows the results of the respondents’ ratings of their perceived obsolescence of the shapes of different vehicle parts: (a) headlights; (b) rims; and (c) the stereo. In all three cases the trend line for very old products (dotted line) decreases as a function of perceived obsolescence. The percentage of users who rated these shapes as obsolete (values 1 and 2 on the Likert scale) was 62.4% in the case of headlights, 72.3% in the case of tyres and 89.2% in the case of the stereo. Therefore, users rated products as obsolete that had actually been on the market for several years.
On the other hand, users rated modern shapes (solid line) as current (values 4 and 5 on the Likert scale) with 83.0% for headlights, 83.1% for wheels, and 85.7% for stereos. The line representing the old shape (double dot-dash line) indicates that users tend to rate such shapes in the middle zone of the Likert scale (value 3 on the Likert scale). Their percentages were: 39.2% headlights, 29.3% wheels and 47.1% stereos.
As can be seen, respondents perceive the semantics of the product in a similar way to the chronology outlined in the section on design evolution, with the most modern products being perceived as current in a more obvious way. This indicates that when several images are shown for comparison, it is easier for the user to discern the more modern forms and assess them as current. In the case of the stereo, there was a consensus that this product was very old, perhaps due to the fact that it is a multimedia product and lacks a screen. The design this part of the vehicle forces the user to interact with it in different ways, and therefore, it requires greater attention. Thus, regardless of whether a particular user is more or less sensitive to design changes, having to interact with the product in different ways (by hand, touch or voice) makes formal and technological changes more apparent, and therefore the older product was easily identified as obsolete.
Subsequently, respondents were asked for their assessment of the degree of obsolescence of the aforementioned forms by assigning them a technological attribute. The technological attributes were associated in an anachronistic way. Modern headlight shapes were assigned an obsolete halogen light technology, while very old shapes were assigned modern technology, in this case LED lights; old headlights were associated with xenon light as it is a chronologically intermediate technology. Similarly, in the case of the wheel rims, the most modern forms were assigned an old petrol engine, the very old forms were assigned an electric motor, while the old forms were assigned a hybrid engine. Likewise, in the case of the stereos, modern forms were assigned obsolete cassette technology, very old forms were assigned MP3 technology, and old forms were assigned intermediate CD technology.
By comparing the initial responses with these assessments, it was possible to measure the influence of technology on the perception of formal obsolescence.
According to the results, the responses changed significantly with the inclusion of the technological attribute (see Figure 6). Two behavioural patterns were distinguished. In Figure 6d,e, the three lines are overlapping and flat, indicating that there is no consensus among users and that from a semantic point of view, they interpret in an undefined way what was previously interpreted as clearly obsolete or current. This not only indicates the users perception, but also the clarity with which users interpret the forms. It should be noted that these two graphs refer to the headlights and wheels, while in Figure 6c,f, the stereo, which is a multimedia device, is analysed. In this case, user responses also changed significantly. However, the responses were diametrically opposed. Users who perceived stereo forms as obsolete, valued them as modern by including a current technological attribute. Similarly, very modern stereos were perceived as obsolete because they were associated with obsolete technologies. On the other hand, intermediate stereos were still interpreted in a similar way, having been assigned an intermediate attribute.
In order to assess whether the technological variable had a significant influence on the perception of obsolescence, the chi-square statistical test was used, which provides information on the dependence or independence at a given level of significance. In this work, a minimum significance level of p < 0.01 was used, i.e., if there was dependence between the variables studied, the level of certainty had to have at least 99% confidence. For this purpose, the corresponding contingency tables were calculated for the oldest and most modern vehicle shapes for the headlamps, wheels and stereo. Table 1 shows the chi-square values for each of the vehicle shape attributes.
For four degrees of freedom and a significance level of 99%, the cut-off value for the Chi-square statistic was 13.27. Thus, statistical values lower than the above cut-off value imply the acceptance of the null hypothesis, i.e., they indicate that the variables analysed are independent and that the values obtained are due to a random distribution. However, if the values obtained are higher than this limit, the alternative hypothesis is accepted, which leads to the conclusion that there is dependence between the variables analysed. Given that the Chi-square values are much higher than the threshold value (Table 1), it can be concluded that there is a relationship between the perception of obsolescence and the technological variable; therefore, when a technological factor is incorporated into different parts of the vehicle, users’ responses change significantly, modifying their perception of obsolescence.
Based on the analysis of the above information, two models of user perception can be recognised: on the one hand, behaviour linked to products in which minimal actions are required by the user to make them work (headlights and tyres), and on the other hand, products in which interaction with the user is fundamental to their operation (stereo). Indeed, in recent years, the automotive industry has relied on the use of multimedia elements as a way to update its models, such as voice control, music streaming, GPS navigation, among others.
Figure 7 shows the results of the respondents’ ratings of their perception of obsolescence regarding the shapes of the different parts of the smartphone: (a) upper front; (b) and lower front.
The trend lines for the modern upper and lower front (solid line) are similar, and were rated mainly with scores between 4 and 5 on the Likert scale, with 80.9% for the upper front and 83.1% for the lower front. The old components had percentages of 24.8% and 31.5%, respectively, while the very old component was evaluated with scores of 59.2% and 55.7%. As can be seen, respondents perceive obsolescence in a similar way to the chronology presented in the case study. As in the case of the vehicle, modern components were clearly perceived as current. For the older components, the curves are bell-shaped, with maximum scores at values of 2–3 on the Likert scale, and for the very old components, the curves are decreasing with maximum scores at values of 1–2 on the Likert scale (see Figure 7a,b). The similarity between the two graphs may be due to the fact that the user is evaluating a multimedia product that requires direct interaction for its operation, as in the case with stereos.
The fact that the user is clear about the evaluation of this product can be explained by the prominence of screens in audiovisual technologies, since their historical development has progressed from more balanced formats, such as a ratio of 4:3, to more panoramic ones such as 16:9. This evolution of the screen ratio, as well as the increase in the size of the screen, has occurred in many devices in which screens play a leading role, such as televisions, computer monitors and tablets.
Next, users were again asked about the degree of perceived obsolescence of the product shapes. However, on this occasion, these shapes were linked to a technological attribute. The differences between the responses obtained enabled us to assess the influence of the technological factor. In the same way as for vehicles, the technological factor was anachronistically linked to images of smartphone parts. For the upper front: 5G was linked to very old components, 4G to intermediate ones and GSM to modern ones; for the lower front: face lock was linked to very old components, fingerprint unlock was kinked to intermediate ones and a security pattern was linked to modern smartphones.
These results are shown in Figure 7c,d. The percentages for the modern case range between 37.6% for the upper front and 24.8% for the lower front (values 4 and 5 on the Likert scale). In the intermediate (old) case, the values range between 34.1% and 31.5%, respectively (values 3 on the Likert scale); and in the very old case they range between 15.3% and 17.5%, respectively (values between 1 and 2). In the case of the modern components, it can be observed that the responses have changed and there is no consensus among the respondents, resulting in a flatter graph. In the intermediate case, the bell curve has shifted to the right, indicating that it is perceived to be slightly more current with this technological assignment. In a similar way, the graph shows a clearer response from users in the case of very old components and with regard to both the upper front and the lower front, when the component was assigned a state-of-the-art technological attribute.
For four degrees of freedom and a significance level of 99%, the cut-off value for the Chi-square statistic is 13.27. Thus, statistical values lower than the above threshold value lead to the acceptance of the null hypothesis, i.e., they indicate that the variables analysed are independent and that the values obtained are due to a random distribution. However, if the values obtained are higher than this limit, the alternative hypothesis is accepted, which leads to the conclusion that there is dependence between the variables analysed. Given that the Chi-square values are much higher than the threshold value (Table 2), it can be concluded that there is a relationship between the perception of obsolescence and the technological variable, so that when a technological factor is incorporated into different parts of the smartphone, users’ responses change significantly, modifying their perception of obsolescence.
These results indicated that the smartphone, being a multimedia product, is very sensitive to changes in technology. In the case of very old components with state-of-the-art technology, users attributed more importance to the technological factor, which is similar to the car stereo. With regard to the intermediate (old) component, the technological factor also improved the users’ perception of topicality, but not as much as in the previous case, as less cutting-edge technologies were used. The linking of obsolete technologies, such as GSM or an unlocking pattern to modern shapes reduces the degree of perceived obsolescence; they go from being shapes valued as very current to a situation of little consensus, as can be deduced from the flattened lines or lines with a slight negative slope (Figure 6a,b). The reason for this lack of consensus may be due to several factors. In the case of GSM, it may be due to a certain lack of user awareness of the technology. It is worth noting that the percentage of users who replied NS/NC to the GSM question was 13.4%, which was higher than the other questions. Unlocking patterns are technologies that currently coexist with other more cutting-edge technologies. In any case, the effect of assigning an obsolete technological factor also significantly modifies the perception of the obsolescence of the product with modern forms, which confirms that the technological factor has a modulating effect on the perception of formal obsolescence; this is of greater significance in the case of multimedia devices.

4.2. Design Property: Colour and Material

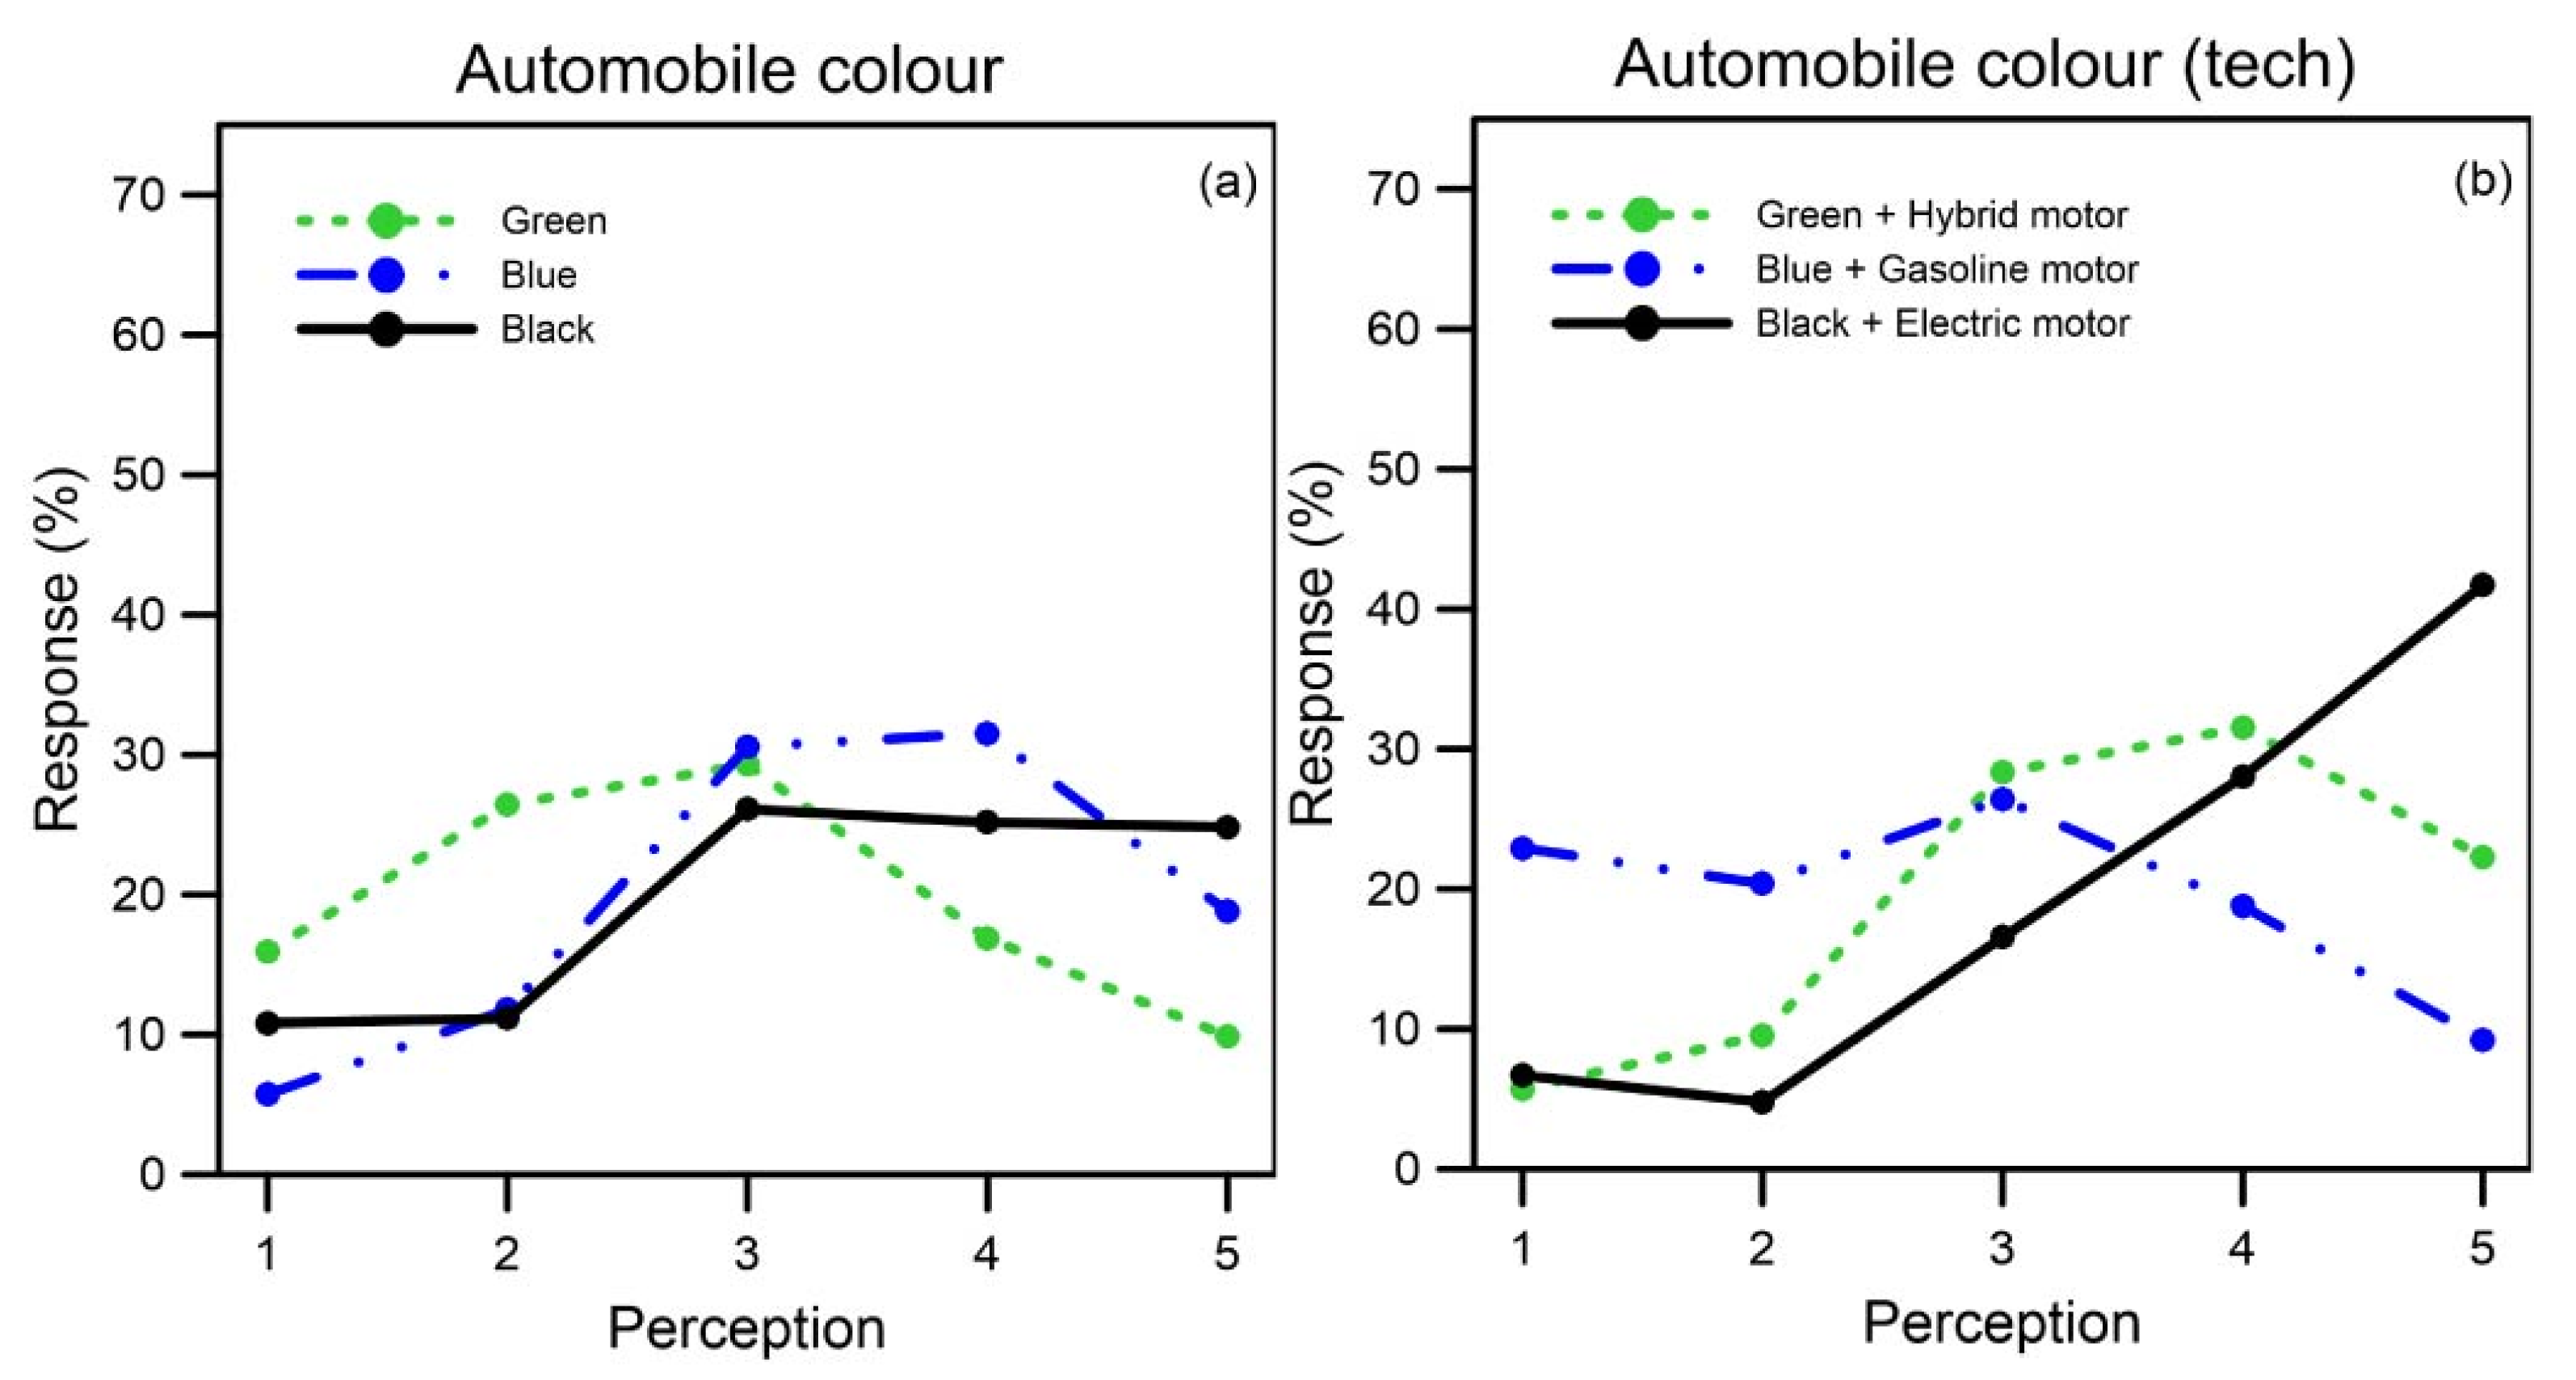
The colours green, blue and black were analysed by applying them to the bodywork of automobiles. Unlike the previous sections, the colours did not follow a chronological order, so the interest lies in discovering whether there is a link between a timeless design property and perceived obsolescence when including a technological component. Figure 8 demonstrates that none of the three colours show an obvious trend related to the respondent’s perception. In general, most of the scores for the three colours fall between the intermediate values of 2, 3 and 4. This indicates that users were not clear about the degree of obsolescence of these three colours. Despite this, there are slight differences in the trends of the lines, which allowed us to establish that green is considered slightly more obsolete, while blue and black are considered more current.
When the technological factor is introduced, it is observed that the green colour changes from being slightly flared to the left to being slightly flared to the right. This is due to the fact that it is associated with a hybrid engine, which is perceived as more modern. In the case of the blue colour, the behaviour is the opposite of the previous one, although with slight shifts from the right to the left of the graph. This is due to the fact that a petrol engine was selected and was interpreted as more obsolete. Finally, the black colour shows a clear tendency to be valued as very modern, as it is associated with an electric motor.
This suggests that the influence of technology on colour is considerably less than on the shape property. Therefore, major technological changes with respect to colour lead to moderate changes in the perception of users.
For four degrees of freedom and a significance level of 99%, the cut-off value for the Chi-square statistic is 13.27. Thus, statistical values lower than the above cut-off value imply the acceptance of the null hypothesis, i.e., they indicate that the variables analysed are independent and that the values obtained are due to a random distribution. However, if the values obtained are higher than this limit, the alternative hypothesis is accepted, which leads to the conclusion that there is dependence between the variables analysed. Given that the Chi-square values are higher than the threshold value (Table 3), it can be concluded that there is a relationship between the perception of obsolescence and the technological variable, so that when a technological factor is incorporated into the vehicle colours, the users’ responses change significantly, modifying their perception of obsolescence.
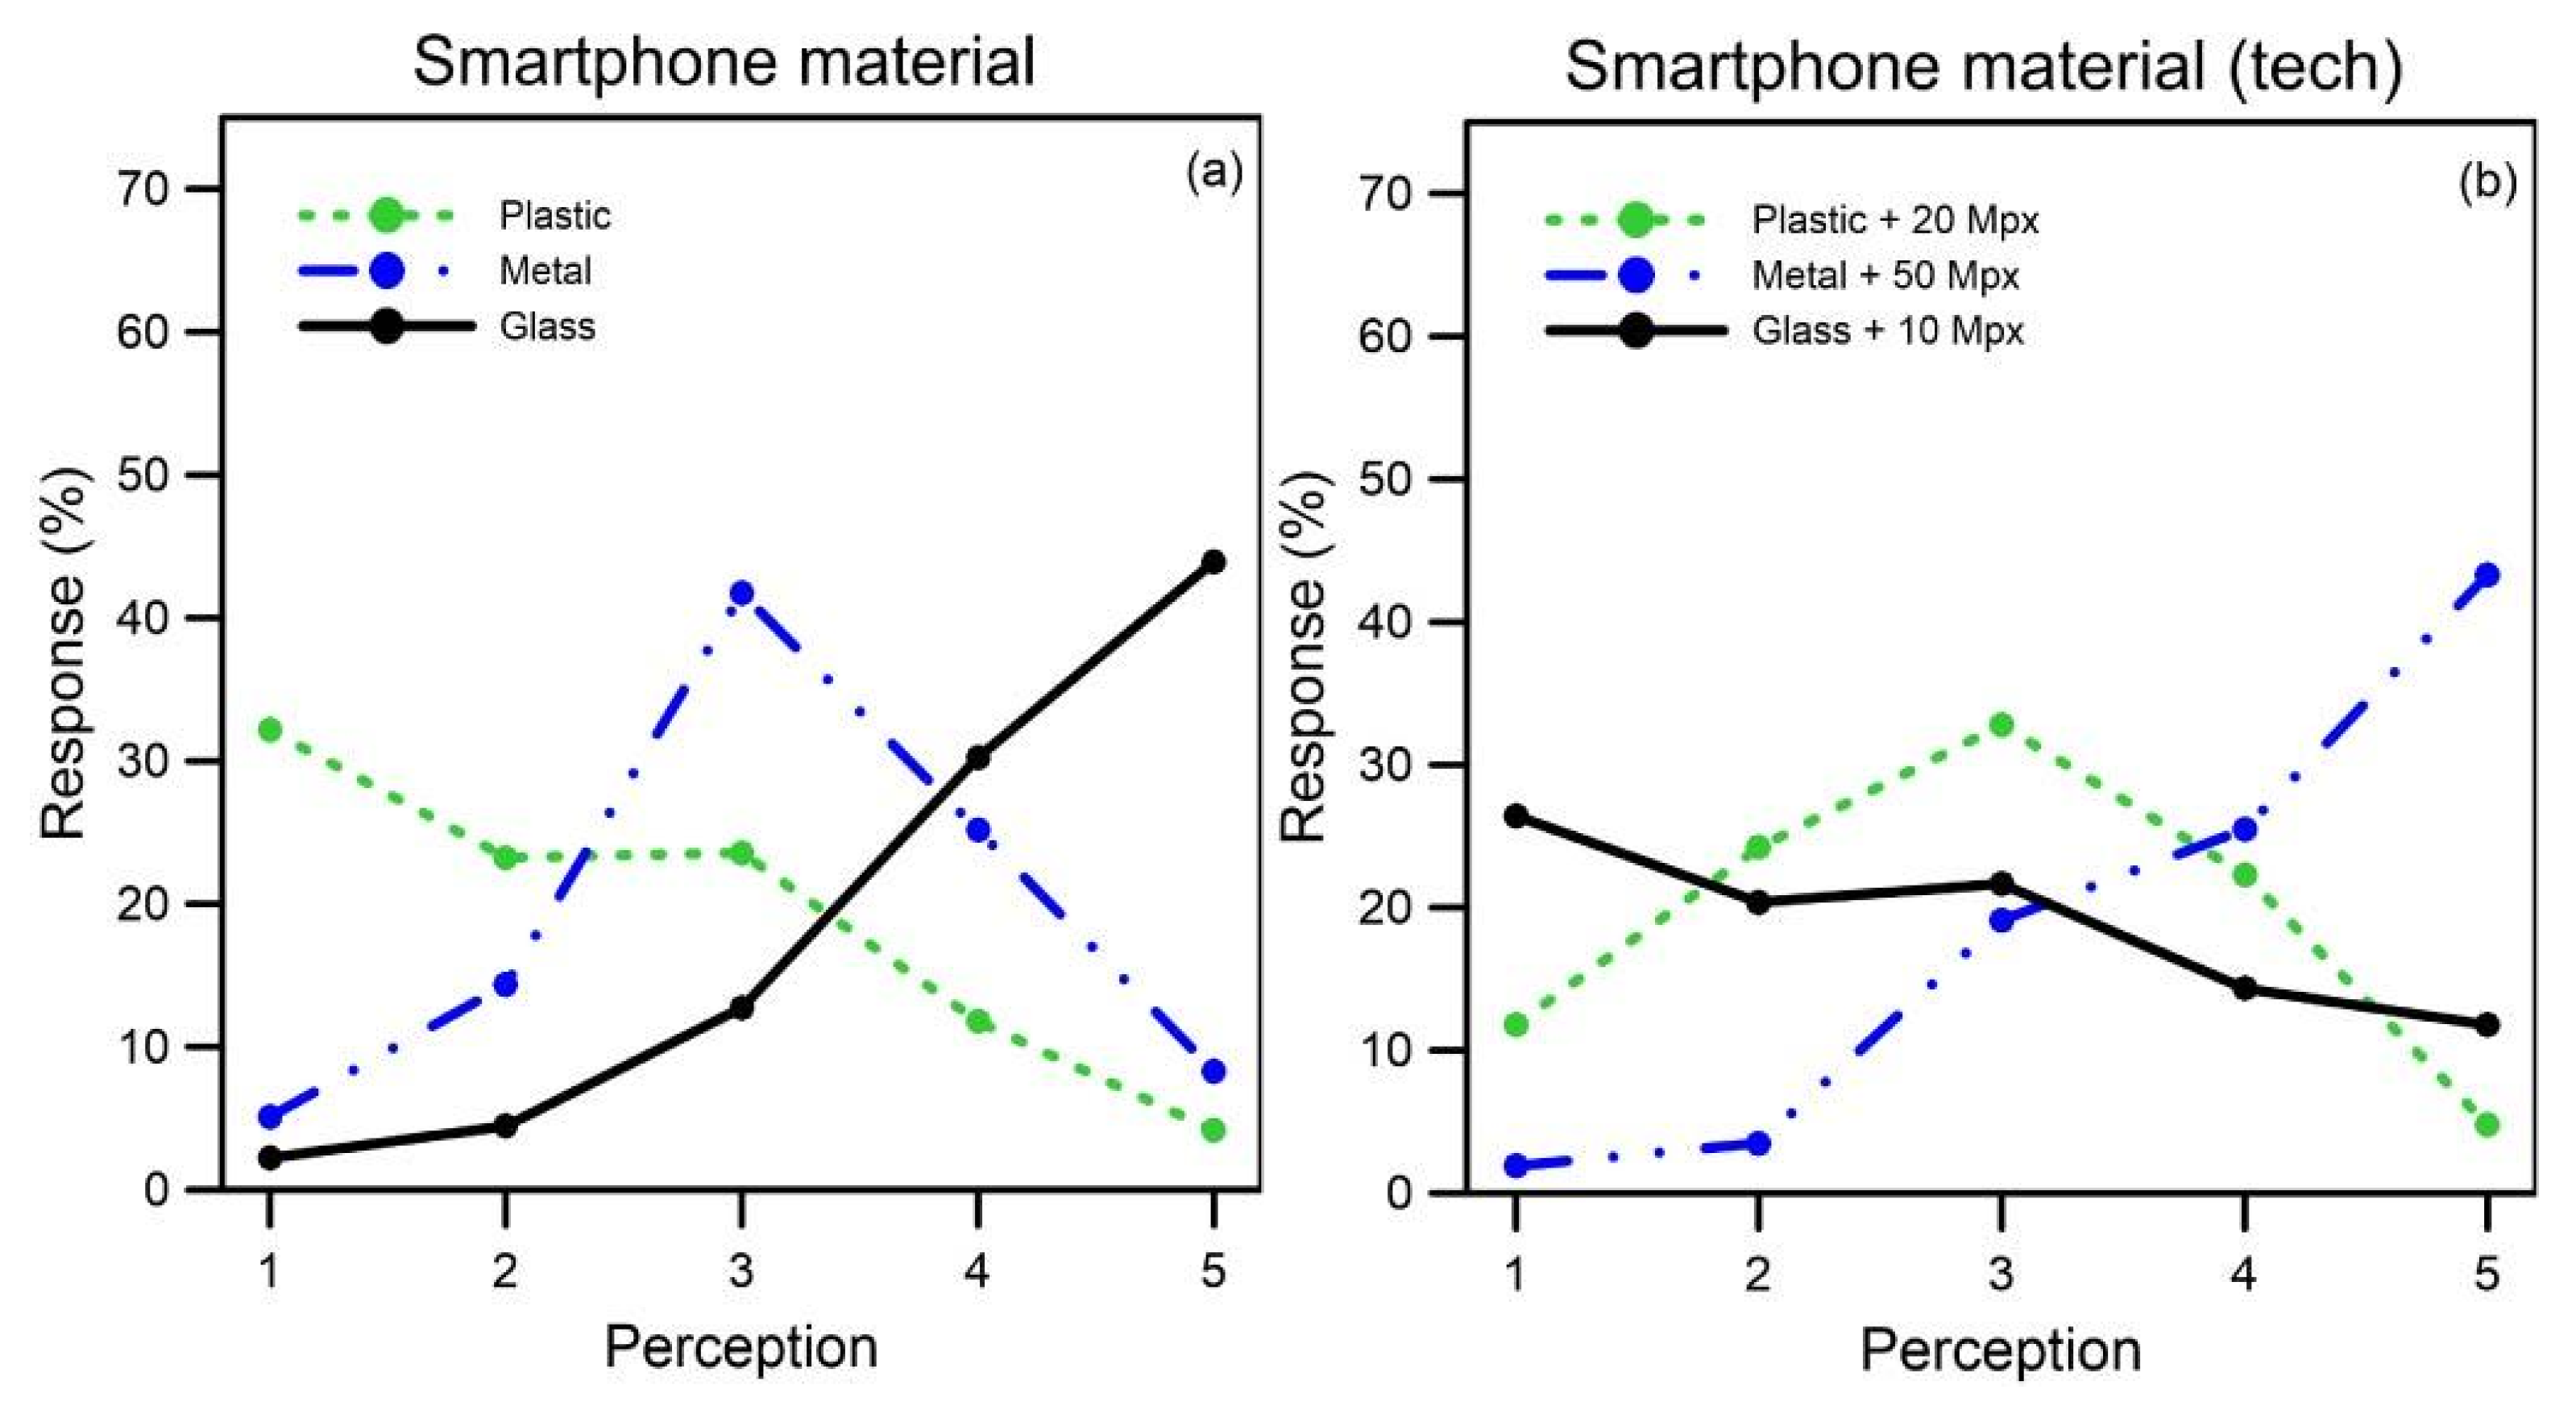
For the study of the material in smartphones, the casing was used as a perceptible design property due to the importance it plays in their appearance. The following materials were used: plastic, metal and glass. Figure 9 shows a clear differentiation between the perception rating of the three materials. Plastic shows a clear downward trend with a percentage of 55.4% in Likert scale scores 1 and 2, which indicates that it is perceived as an obsolete material. In the middle position is metal, with a bell-shaped graph and with a score of 3 being chosen by 41.7% of the respondents. Finally, glass is considered to be a current material, since the graph is ascending and 74.2% of the respondents chose values of 4 and 5 on the Likert scale. This assessment also coincides with the chronology of the historical application of these materials in smartphones.
When the technological aspect is introduced, the situation changes considerably, with plastic, together with a 20 Mpx camera, being rated with a percentage of 36.0% for values between 1 and 2 on the Likert scale, with a flared shape in the middle of the graph. In the case of metal, the percentage is 19.1%, stopping at the value of 3 on the graph. Therefore, there is a change from a bell-shaped line to a clearly ascending one with very high ratings at point 5. This is due to the fact that it was linked to the latest technology, in this case, a 50 Mpx camera, and last but not least, the rating for glass material change diametrically. When the technological factor is added, the respondents rate it with 26.1% at values of 4 and 5.
For four degrees of freedom and a significance level of 99%, the cut-off value for the Chi-square statistic is 13.27. Thus, statistical values lower than the above cut-off value imply the acceptance of the null hypothesis, i.e., they indicate that the variables analysed are independent and that the values obtained are due to a random distribution. However, if the values obtained are higher than this limit, the alternative hypothesis is accepted, which leads to the conclusion that there is dependence between the variables analysed. Given that the Chi-square values are higher than the threshold value (Table 4), it can be concluded that there is a relationship between the perception of obsolescence and the technological variable, so that when a technological factor is incorporated into the material of the smartphones, the users’ responses change significantly, modifying their perception of obsolescence.
5. Conclusions

After analysing the results, it can be concluded that technological factors have a significant influence on the perception of obsolescence measured in different design properties. However, technology affects the design properties unequally. Technology has a greater influence on the shape property, as opposed to colour and material. Form has a greater impact on multimedia components when the user interacts with the device. Thus, technology exhibits a notable influence on multimedia devices, due to the fact that the user must modify the way he/she interacts with it. By contrast, elements that do not require direct interaction are given less attention. This experiment demonstrates not only which elements are the most semantically loaded, but also how clearly the user perceives and processes the changes.
Therefore, companies and manufacturers that market automotive products or smartphones can obtain a greater perception of modernity by investing efforts in the formal redesign of multimedia devices; these efforts will achieve greater profitability. It should also be noted that there are old products on the market that are considered retro, for example, they have very old shapes but they incorporate cutting-edge technologies, and this is accepted and understood by users. However, there are no products with modern shapes and obsolete technology. The latter generates a lack of consensus in regard to the perception of obsolescence and demonstrates that the influence of technology is greater when it is applied to very old products than when it is applied to modern products.
This study confirms the relevance of these design properties in relation to the technology for specific products. However, it might be interesting to consider the implications of generalising this approach, and to consider the impact on any type of product from the perspective of perceived obsolescence. In this regard, a product analysed from this perspective could last for the lifetime of the product, rather than being discarded for perceptual reasons. This could extend the lifetime of a product, amortise the energy expenditure, and reduce the level of waste. In addition, it would create a more competitive second-hand market, as the products would be less devalued despite the passage of time, as they would still be perceived as relevant in the user’s mind. Having a well-regarded product on the market for a long period of time could improve the brand image of the manufacturing company Another implication is related not to the products, but to the designers, since, if this type of study proves successful, it adds weight to the need to think more deeply about the user from a psychological perspective, leading to multidisciplinary and collaborative work by design teams. This approach is in agreement with current design thinking, and also provides an additional working tool. On the other hand, considering the limits of this work, we should consider that there are properties of design that are susceptible to being evaluated by sensory channels other than the visual one, such as the haptic channel. A multimodal evaluation of perception has not been undertaken in this work; therefore, there are design properties whose results may vary, especially the evaluation of colour and material. In future works, it will be necessary to test other types of products as well as to study new sensory pathways in order to obtain more complete results.

Author Contributions

M.-A.P.-V.: conceptualization, methodology, writing original draft preparation. P.C.-M.: visualization, investigation, data curation. P.P.-D.: supervision, validation, writing—reviewing and editing. All authors have read and agreed to the published version of the manuscript.

Funding

This research received no external funding.

Institutional Review Board Statement

The study was conducted in accordance with the Declaration of Helsinki, and approved by the Institutional Review Board of CEENB-OMGs (Ethics Committee for Non-Biomedical Experimentation and Evaluation of Experimentation with Genetically Modified Organisms). Protocol code 007/2022 and date of approval 10.24.2022.

Informed Consent Statement

Informed consent was obtained from all subjects involved in the study.

Conflicts of Interest

The authors declare no conflict of interest.

References

  1. Kidd, M.T.; Anderson, K.E. Laying hens in the U.S. market: An appraisal of trends from the beginning of the 20th century to present. J. Appl. Poult. Res. 2019, 28, 771–784. [Google Scholar] [CrossRef]
  2. Krippendorff, K. The Semantic Turn: A New Foundation for Design; CRC: Boca Raton, FL, USA, 2005. [Google Scholar]
  3. Krippendorff, K. Propositions of Human-Centeredness: A Philosophy for Design. In Doctoral Education in Design: Foundations for the Future; Durling, D., Friedman, K., Eds.; Penn Libraries: Philadelphia, PA, USA, 2000; pp. 55–63. [Google Scholar]
  4. Krippendorff, K.; Butter, R. Product Semantics: Exploring the Symbolic Qualities of Form. Penn Libr. Unviersity Pennssylvania 1984, 3, 4–9. Available online: http://repository.upenn.edu/asc_papershttp://repository.upenn.edu/asc_papers/40http://repository.upenn.edu/asc_papers/40 (accessed on 22 August 2018).
  5. Karjalainen, T.-M.; Snelders, D. Designing Visual Recognition for the Brand. J. Prod. Innov. Manag. 2010, 27, 6–22. [Google Scholar] [CrossRef]
  6. Karjalainen, T.-M. Semantic Transformation in Design: Communicating Strategic Brand Identity through Product Design References; University of Art and Design in Helsinki: Helsinki, Finland, 2006. [Google Scholar]
  7. Blonigen, B.A.; Knittel, C.R.; Soderbery, A. Keeping it fresh: Strategic product redesigns and welfare. Int. J. Ind. Organ. 2017, 53, 170–214. [Google Scholar] [CrossRef] [Green Version]
  8. Smith, S.; Smith, G.; Shen, Y.-T. Redesign for product innovation. Des. Stud. 2012, 33, 160–184. [Google Scholar] [CrossRef]
  9. Yamamoto, H.; Murakami, S. Product obsolescence and its relationship with product lifetime: An empirical case study of consumer appliances in Japan. Resour. Conserv. Recycl. 2021, 174, 105798. [Google Scholar] [CrossRef]
  10. Vanacker, H.; Lemieux, A.-A.; Bonnier, S. Different dimensions of durability in the luxury fashion industry: An analysis framework to conduct a literature review. J. Clean. Prod. 2022, 377, 134179. [Google Scholar] [CrossRef]
  11. Kerwin, K.; Andrews, D.; Whitehead, B.; Adibi, N.; Lavandeira, S. The significance of product design in the circular economy: A sustainable approach to the design of data centre equipment as demonstrated via the CEDaCI design case study. Mater. Today Proc. 2022, 64, 1283–1289. [Google Scholar] [CrossRef]
  12. Uriarte-Ruiz, M. Exploring the obstacles towards the creation of a circular economy: Replacement and reuse of mobile phones in Greater Mexico City. J. Clean. Prod. 2022, 374, 133398. [Google Scholar] [CrossRef]
  13. Kuppelwieser, V.G.; Klaus, P.; Manthiou, A.; Boujena, O. Consumer responses to planned obsolescence. J. Retail. Consum. Serv. 2019, 47, 157–165. [Google Scholar] [CrossRef]
  14. Makov, T.; Fitzpatrick, C. Is repairability enough? big data insights into smartphone obsolescence and consumer interest in repair. J. Clean. Prod. 2021, 313, 127561. [Google Scholar] [CrossRef]
  15. Fels, A.; Falk, B.; Schmitt, R. Social Media Analysis of Perceived Product Obsolescence. Procedia CIRP 2016, 50, 571–576. [Google Scholar] [CrossRef] [Green Version]
  16. DG Environment; European Commission. Sustainable Consumption—Tackling Premature Obsolescence|European Economic and Social Committee. Available online: https://www.eesc.europa.eu/en/news-media/presentations/sustainable-consumption-tackling-premature-obsolescence (accessed on 14 July 2021).
  17. Bieser, J.C.; Blumer, Y.; Burkhalter, L.; Itten, R.; Jobin, M.; Hilty, L.M. Consumer-oriented interventions to extend smartphones’ service lifetime. Clean. Responsible Consum. 2022, 7, 100074. [Google Scholar] [CrossRef]
  18. Zapata, C.; Nieuwenhuis, P. Exploring innovation in the automotive industry: New technologies for cleaner cars. J. Clean. Prod. 2010, 18, 14–20. [Google Scholar] [CrossRef]
  19. Geng, Y.; Gu, J.; Wang, J.; Zhang, R. Smartphone addiction and depression, anxiety: The role of bedtime procrastination and self-control. J. Affect. Disord. 2021, 293, 415–421. [Google Scholar] [CrossRef] [PubMed]
  20. Hayes, R. The Volkswagen Golf Story: 40 Years of the Second People’s Car, 1st ed.; Behemoth Publishing Limited: Wincanton, UK, 2014. [Google Scholar]
  21. Korenok, O.; Hoffer, G.E.; Millner, E.L. Non-price determinants of automotive demand: Restyling matters most. J. Bus. Res. 2010, 63, 1282–1289. [Google Scholar] [CrossRef] [Green Version]
  22. Volkswagen. From Mono-Radio to Online Connectivity-the Golf Radio Generations|Volkswagen Newsroom. Available online: https://www.volkswagen-newsroom.com/en/stories/from-mono-radio-to-online-connectivity-the-golf-radio-generations-2213 (accessed on 14 July 2021).
  23. PEUGEOT History. An incredible Story Since 1810. Available online: https://www.peugeot.ph/brand-and-technology/history/ (accessed on 14 July 2021).
  24. Seat. Seat History. 2021. Available online: https://www.seat.com/company/history/2000.html (accessed on 14 July 2021).
  25. Gartner Says Worldwide Smartphone Sales Declined 5% in Fourth Quarter of 2020. Available online: https://www.gartner.com/en/newsroom/press-releases/2021-02-22-4q20-smartphone-market-share-release (accessed on 15 July 2021).
  26. Apple. Available online: https://www.apple.com/ (accessed on 19 July 2021).
  27. Samsung. Available online: https://www.samsung.com (accessed on 19 July 2021).
  28. Instituto Nacional de Estadística (INE). Gross Domestic Product Per Capita. 2019. Available online: https://www.ine.es/dyngs/INEbase/es/operacion.htm?c=Estadistica_C&cid=1254736167628&menu=ultiDatos&idp=1254735576581 (accessed on 2 June 2021).
  29. Apple Presenta el iPhone 4-Apple (ES). Available online: https://www.apple.com/es/newsroom/2010/06/07Apple-Presents-iPhone-4/ (accessed on 28 July 2021).
  30. Desmet, P.M.A.; Xue, H.; Fokkinga, S.F. The Same Person Is Never the Same: Introducing Mood-Stimulated Thought/Action Tendencies for User-Centered Design. J. Des. Econ. Innov. 2019, 5, 167–187. [Google Scholar] [CrossRef]
  31. Desmet, P.; Overbeeke, K.; Tax, S. Designing Products with Added Emotional Value: Development and Appllcation of an Approach for Research through Design. Des. J. 2001, 4, 32–47. [Google Scholar] [CrossRef]
  32. Desmet, P.; Hekkert, P. Framework of Product Experience. Int. J. Des. 2007, 1, 57–66. [Google Scholar] [CrossRef]
  33. Norman, D.A. Designing emotions pieter desmet. Des. J. 2003, 6, 60–62. [Google Scholar] [CrossRef]
Figure 1. Design evolution of the Volkswagen Golf, the Peugeot 308 and the Seat Leon. Adapted from Volkswagen©, Seat© and Peugeot© (2021) [22,23,24].
Sustainability 14 14555 g001
Figure 2. Design evolution of the iPhone and Samsung Galaxy S. Adapted from Samsung© and Apple© (2021) [26,27].
Sustainability 14 14555 g002
Figure 3. Diagram of the evolution of headlamp, wheel rim and multimedia equipment design in vehicles over time.
Sustainability 14 14555 g003
Figure 4. Diagram of the evolution of top and bottom zone design in smartphones over time.
Sustainability 14 14555 g004
Figure 5. Diagram of the experimental methodology.
Sustainability 14 14555 g005
Figure 6. Rating of perceived obsolescence of the design form factor for the automobile: (a) headlights; (b) rims; (c) stereo; (d) headlights (tech); (e) rims (tech); (f) stereo (tech). Likert scale (1 = very old and 5 = very modern).
Sustainability 14 14555 g006
Figure 7. Assessment of the perceived obsolescence of the design form factor for the smartphone: (a) upper front; (b) lower front; (c) upper front (tech); (d) lower front (tech). Likert scale (1 very old and 5 very modern).
Sustainability 14 14555 g007
Figure 8. Assessment of the perceived obsolescence of the design factor of automobile colour: (a) automobile colour; (b) automobile colour (tech).
Sustainability 14 14555 g008
Figure 9. Assessment of the perceived obsolescence of the material design factor for the smartphone: (a) smartphone; (b) smartphone (tech).
Sustainability 14 14555 g009
Table 1. Chi-square values according to areas of special relevance for product semantics in automobiles.
HeadlightsRimsStereo
Very oldModernVery oldModernVery oldModern
Sustainability 14 14555 i001Sustainability 14 14555 i002Sustainability 14 14555 i003Sustainability 14 14555 i004Sustainability 14 14555 i005Sustainability 14 14555 i006
205.18114.61139.73116.32267.56319.42
Table 2. Chi-square values according to areas of special relevance for product semantics for smartphones.
Upper FrontLower Front
Very oldModernVery oldModern
Sustainability 14 14555 i007Sustainability 14 14555 i008Sustainability 14 14555 i009Sustainability 14 14555 i010
164.41100.24172.98215.72
Table 3. Chi-square values for automobile colour.
BlackGreenBlue
Sustainability 14 14555 i011Sustainability 14 14555 i012Sustainability 14 14555 i013
32.0567.6158.98
Table 4. Chi-square values for smartphone material.
PlasticGlass
Sustainability 14 14555 i014Sustainability 14 14555 i015
40.86170.09
Publisher’s Note: MDPI stays neutral with regard to jurisdictional claims in published maps and institutional affiliations.