Article

The Impact of Topographic Relief on Population and Economy in the Southern Anhui Mountainous Area, China

1
School of Spatial Informatics and Geomatics Engineering, Anhui University of Science and Technology, Huainan 232001, China
2
Key Laboratory of Aviation-aerospace-ground Cooperative Monitoring and Early Warning of Coal Mining-Induced Disasters of Anhui Higher Education Institutes, Anhui University of Science and Technology, Huainan 232001, China
3
Coal Industry Engineering Research Center of Mining Area Environmental and Disaster Cooperative Monitoring, Anhui University of Science and Technology, Huainan 232001, China
*
Author to whom correspondence should be addressed.
Sustainability 2022, 14(21), 14332; https://doi.org/10.3390/su142114332
Submission received: 24 September 2022 / Revised: 27 October 2022 / Accepted: 1 November 2022 / Published: 2 November 2022

Abstract

:
Topographic relief is a key factor limiting population distribution and economic development in mountainous areas, especially in the transition zone from mountains to plains. Taking the southern Anhui mountainous area as an example, based on the digital elevation model (DEM) with a resolution of 30 m, we used ‘quadratic’ mean change-point analysis to calculate the optimal statistical unit, and then extracted the topographic relief. Taking the county as the unit of analysis, two indicators of population density and economic density were selected. Spatial statistics and correlation analysis were used to quantitatively analyze the impact of topographic relief on population and economy. Finally, the impact of slope and elevation was analyzed. The following results were obtained. (1) The topography of the study area was dominated by medium relief (200–500 m), followed by small relief (70–200 m), flat (0–30 m), and slight relief (30–70 m), and a small proportion of large relief (≥500 m). (2) The impact of topographic relief on population and economy was slightly stronger than that of slope and elevation. The impact on population distribution was stronger than that on economic development. The impact on primary industry was stronger than that on secondary and tertiary industries. (3) In the southern Anhui mountainous area, 72.35% of the population and 76.72% of GDP were distributed in the area with a topographic relief of 155 m or less, while the land area only accounted for 43.93%. The area with a topographic relief greater than 245 m accounted for 28.76%, but only 10.69% of the population, and only 8.34% of GDP. The population distribution and economic development were obviously concentrated in the low topographic relief area. However, the characteristics of high topographic relief not only hindered the agricultural mechanization and limited the development of the primary industry, but also had a significant impact on infrastructure development, investment, and industrial layout, thus weakening regional economic advantages. In the future, the economic level of these areas needs to be improved.

1. Introduction

Topography is one of the elements of physical geography, which includes topographic relief, slope, elevation, and other features, and is the basis for the survival and development of human society. Thus, topographic relief greatly impacts population distribution [1], economic development [2], agricultural production [3], urban construction [4,5,6], tourism planning [7], and ecological effects [8]. Therefore, the study of topographic relief and spatial patterns, and the exploration of their mechanisms affecting human production and social activities, provides insight into the interrelationship between the natural environment and human society.
Studies have investigated the impact of topographic relief on population and economy based on different spatial scales. Meybeck et al. used topographic relief and elevation to classify mountains globally and explored the impact of different mountain types on global surface water resources and population distribution [9]. At the country level, Feng et al. explored the correlation between the effects of topographic relief on population distribution and economic development in China based on both raster and county unit scales and suggested that topographic relief is an important indicator of the natural suitability of China’s habitat [10,11]. Meanwhile, at the small and medium scale, quantitative analysis of the relationship between topographic relief and population and economy showed that topographic relief is highly accurate and practical in natural habitat evaluation at the small and medium scale [1,12,13,14,15]. Other studies used a geographic detector to investigate the constraints of topographic factors on the distribution and impoverishment of villages [16,17]. Therefore, the study of topographic relief provides theoretical support and reference for a rational layout of population, habitat optimization, and improvement of regional economic development policies.
Topographic relief entails regional elevation, surface fragmentation, and cutting depth, and represents the basis for the division of geomorphic types [18,19,20]. However, the calculation of topographic relief is variable and scale dependent [21,22,23,24,25]. A scientific and reasonable analysis window (i.e., the optimal statistical unit) is key to the determination of regional topographic relief [26,27]. The determination of optimal statistical units is a typical change-point analysis problem. The commonly used methods include artificial drawing, maximum elevation difference, fuzzy mathematics, cumulative sum analysis, and mean change-point analysis. Chen et al. used the above five methods to calculate the optimal statistical unit and found that the mean change-point analysis was best, followed by cumulative sum analysis, while the other methods were no longer applicable [28]. Zhao et al. compared and analyzed the effectiveness of artificial drawing, mean change-point analysis, maximum elevation difference, and fuzzy mathematics to determine the optimal statistical unit. The results showed that mean change-point analysis and artificial drawing were relatively effective, while maximum elevation difference and fuzzy mathematics were poorly effective [29]. Since artificial drawing relies on manual judgment of the change-point position and is easily affected by subjective factors [28,30,31,32], the mean change-point analysis is the most effective method to calculate the optimal statistical unit. Other studies reported that this method can be used to rapidly and accurately calculate the optimal statistical unit [21,33,34,35,36,37,38,39,40,41].
Only a single change point was detected in the topographic relief curve [20]. The change point based on the ‘preliminary’ mean change-point analysis did not analyze the physical significance of the regional variation curve or the actual geography. We therefore propose a new method known as ‘quadratic’ mean change-point analysis, that is, the first change point was obtained via mean change-point analysis of the total topographic relief data, while the second change point was obtained by repeating the mean change-point analysis of the subsequent topographic relief data twice, which was consistent with objective reality to calculate the optimal statistical unit.
The southern Anhui mountainous area is located in the transition zone between the second and third terraces of China. It is also the transition zone from the southeast hills to the plains in the middle and lower reaches of the Yangtze River, which leads to complex and changeable geomorphic types in this area. The district is adjacent to the Yangtze River Delta, connected with southern Jiangsu and northern Zhejiang, and is the top priority for the industrial transfer of the Yangtze River Delta. Studies have investigated the population distribution and economic development of the southern Anhui mountainous area. Yu et al. analyzed the spatial characteristics of population contraction and growth in the southern Anhui mountainous area and indicated that the change in urbanization rate and per capita GDP were the main factors driving population growth, while the growth of primary industry and the change in total retail sales of consumer goods were the main factors underlying population contraction [42]. Rong et al. discussed the spatiotemporal evolution of economy and ecology, and the coordination in the southern Anhui mountainous area from the perspectives of tourism industry, urbanization and ecology [43]. However, few studies have examined the population distribution and economic development in this area from a topographic perspective. Significant topographic relief is the main topographic feature in population distribution and economic growth. Therefore, it is essential to study the impact of topographic relief on population and economy at the county level in the southern Anhui mountainous area.
Based on the 30 m resolution digital elevation model (DEM), the ‘quadratic’ mean change-point analysis was used to extract the optimal statistical unit. The topographic relief of each county in the southern Anhui mountainous area was calculated. The differences in the effect of topographic relief and other topographic factors (slope and elevation) on the population and economy were analyzed and discussed to provide a scientific basis and reference for rational population distribution and coordinated economic development in the study area.

2. Materials and Methods

2.1. Study Area

The southern Anhui mountainous area is bounded by the Yangtze River in the north, Zhejiang in the southeast, and Jiangxi in the southwest. Its geographical coordinates are 29°31′ N to 31°00′ N and 116°31′ E to 119°45′ E. A total of 35 county administrative units were found in 6 prefecture-level cities of Huangshan, Wuhu, Ma’anshan, Tongling, Xuancheng, and Chizhou. The administrative units included 16 general counties, 16 municipal districts, and 3 county-level cities (Figure 1).
In 2020, the population of the study area was 11.92 million, and the GDP was 876.07 billion yuan, accounting for 19.5% and 22.6% of Anhui Province, respectively. The land area was 43,429 km2, accounting for 31.0% of Anhui Province. The population density was relatively small, and the level of economic development was relatively low.
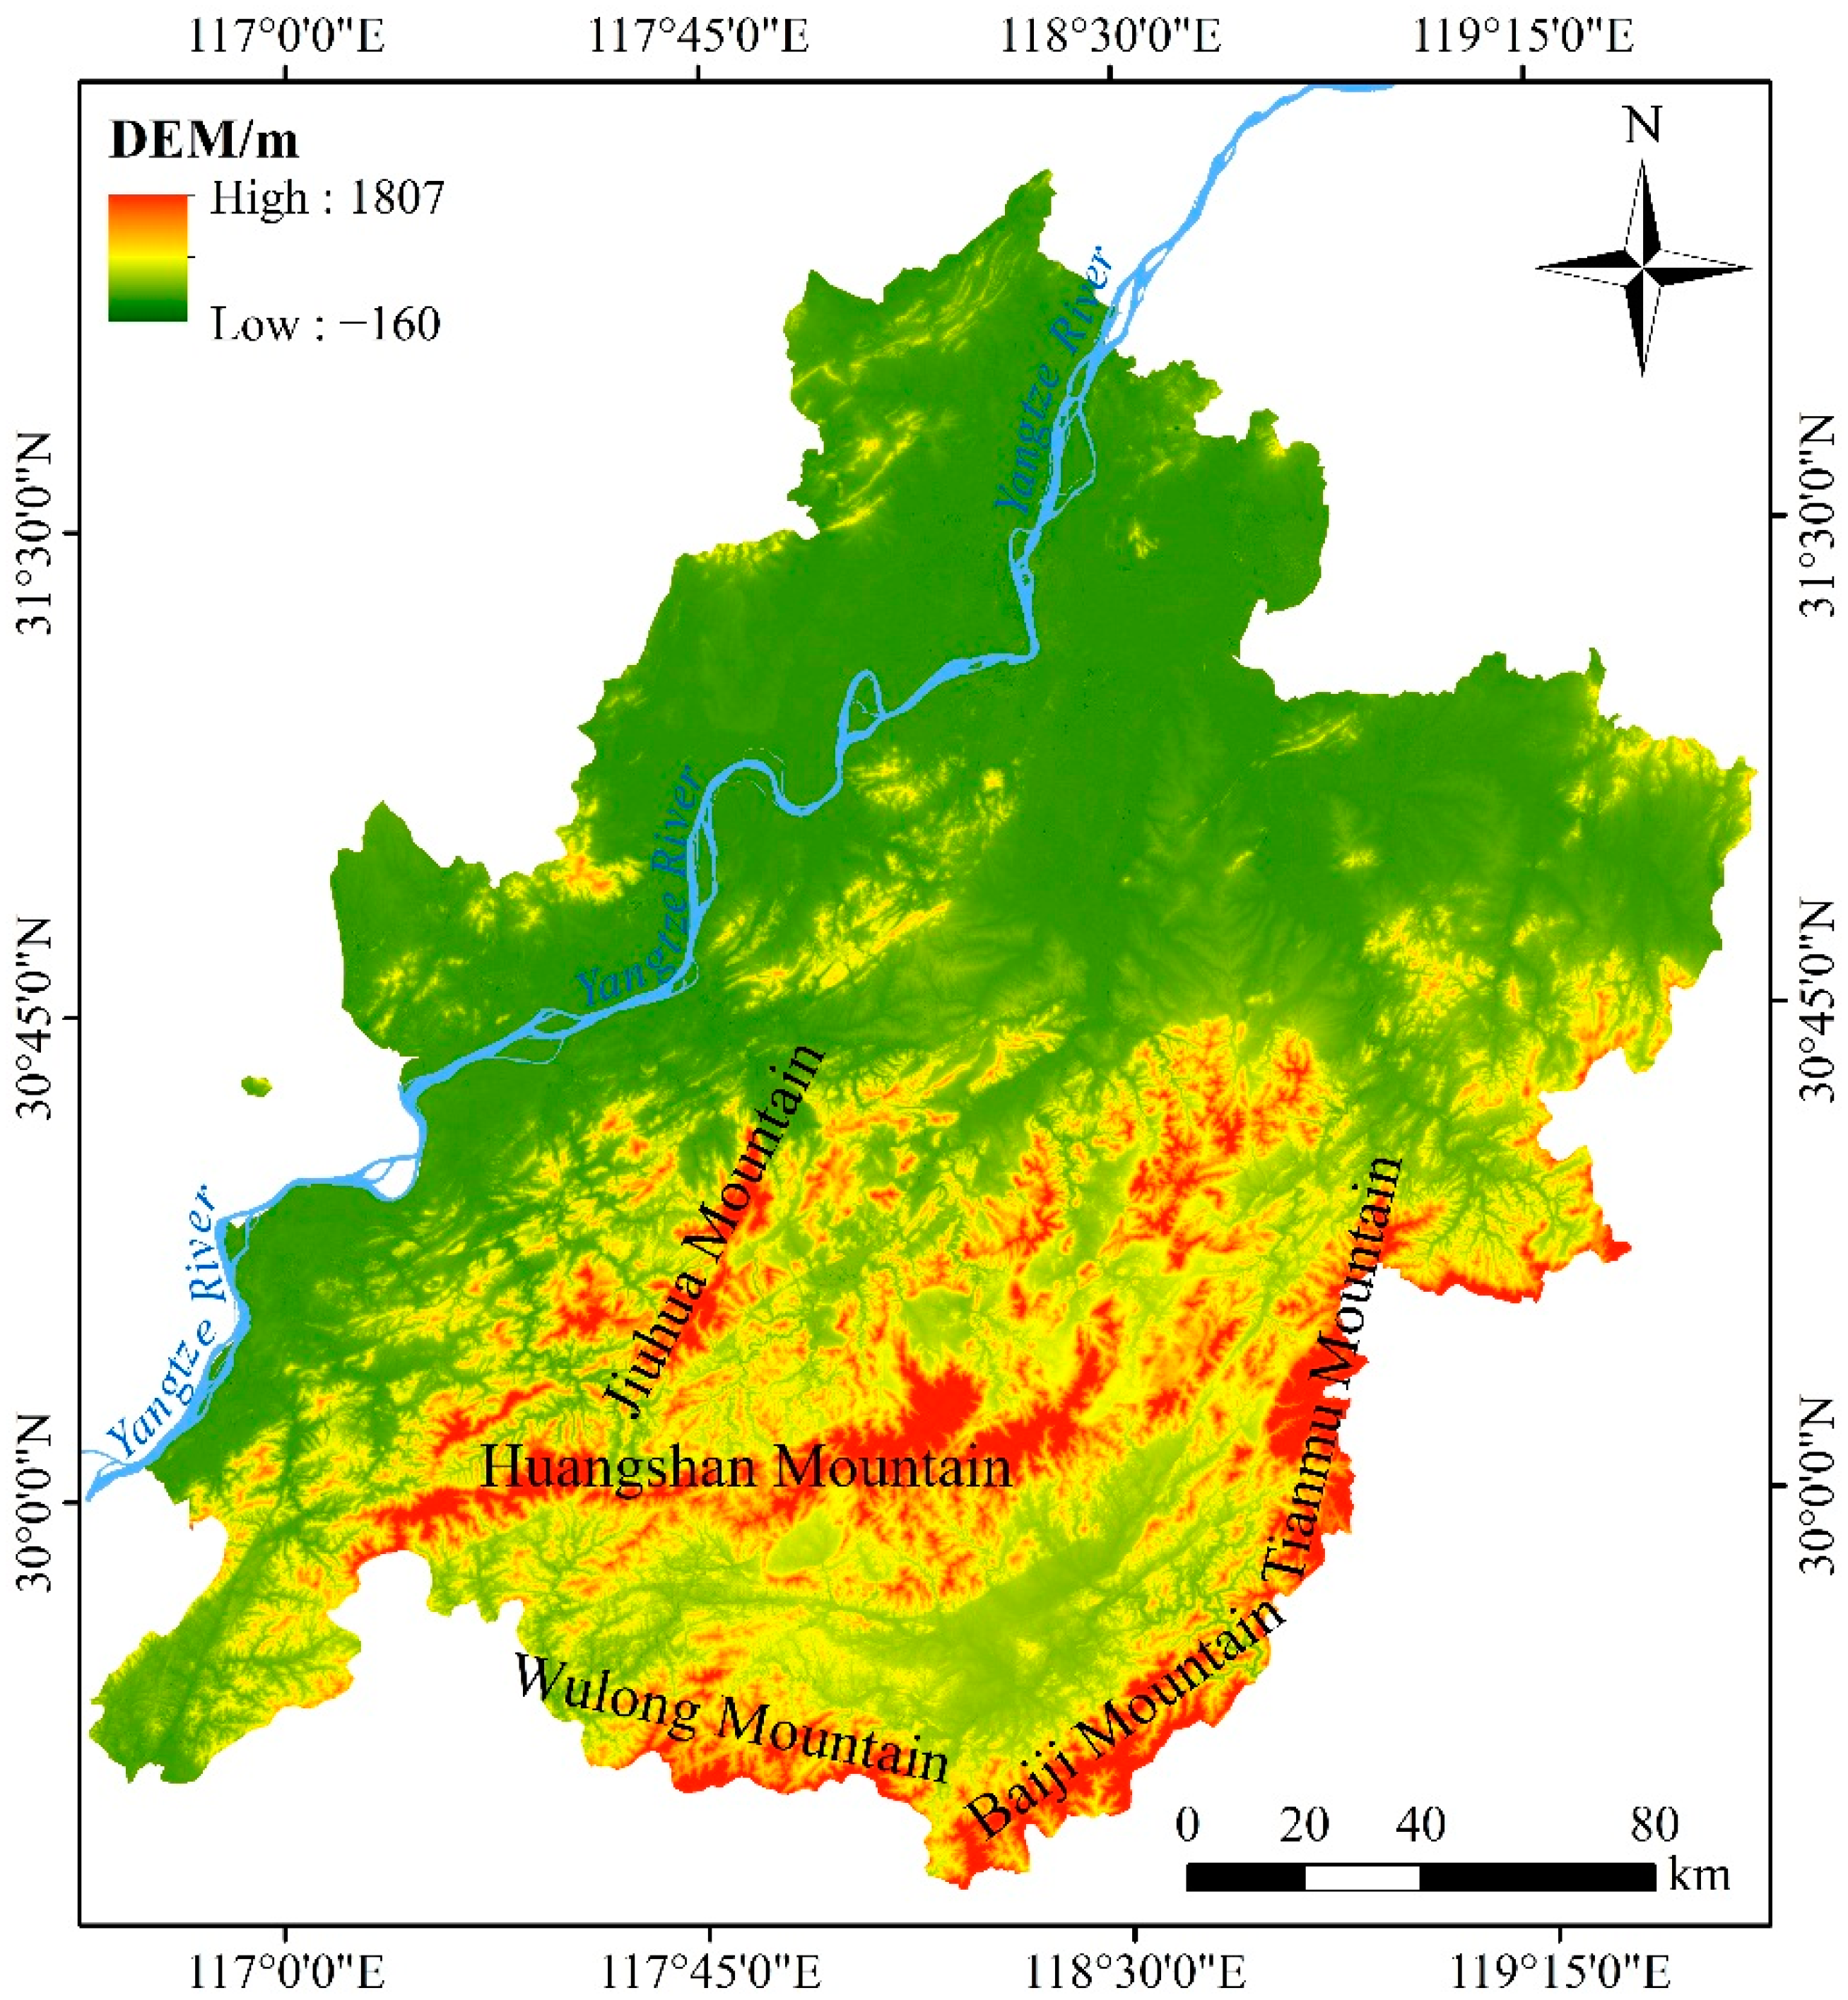
The study area was elevated in the south and low in the north, with an elevation of −160 m to 1807 m, and an average elevation of 188 m (Figure 2). It has a complex and diverse topography, with the Jiuhua Mountain ranges along the NE–SW direction and the Huangshan Mountain ranges along the E–W direction in the middle. The Tianmu Mountain and Baiji Mountain ranges extend in the NE–SW direction along the border between the Anhui and Zhejiang Provinces in the east. The Wulong Mountain ranges extend in the E–W direction along the border between the Anhui and Jiangxi Provinces in the south. The middle and lower reaches of the Yangtze River plain in the north. Multiple basins and valleys are distributed among the mountains.

2.2. Data Sources and Processing

(1) The data related to the administrative boundaries of the study area were sourced from the National Catalogue Service for Geographic Information of China (http://www.webmap.cn/, accessed on 28 March 2022), and the basic scale is 1:250,000.
(2) Data for the 30 m resolution DEM were obtained from the Resource and Environment Science and Data Centre of the Chinese Academy of Sciences (http://www.resdc.cn/, accessed on 28 March 2022), from which the topographic relief, slope, and elevation were extracted.
(3) The socio-economic data of 2020 were obtained from the statistical yearbook of the Anhui Province (http://tjj.ah.gov.cn/, accessed on 2 April 2022), and statistical bulletins of each city or county in 2021. The population density data were obtained by dividing the permanent resident population of each county by the corresponding area. Similarly, the economic density was determined by dividing the GDP of each county by the corresponding area. The statistical data are provided in Appendix A.

2.3. Research Framework and Methods

2.3.1. Research Framework

Taking 35 county units in the southern Anhui mountainous area as the research target, this study investigated the impact of topographic relief on population distribution and economic development and compared the effects of slope and elevation. First, based on 30 m resolution DEM data, the ‘preliminary’ and ‘quadratic’ mean change-point analysis was used to calculate the optimal statistical unit, followed by the extraction of the topographic relief. Second, based on socio-economic data, the county population and economic density were calculated. Finally, the impact of topographic relief, slope, and elevation on population distribution and economic development was quantitatively analyzed. The general framework of this study is shown in Figure 3.

2.3.2. Preliminary Extraction of Topographic Relief

Topographic relief is the difference between the maximum and minimum elevation in a given area [31,44]. It can be expressed as:
R F = H m a x H m i n
where RF, Hmax, and Hmin are topographic relief, maximum elevation value, and minimum elevation value within the analysis window, respectively.
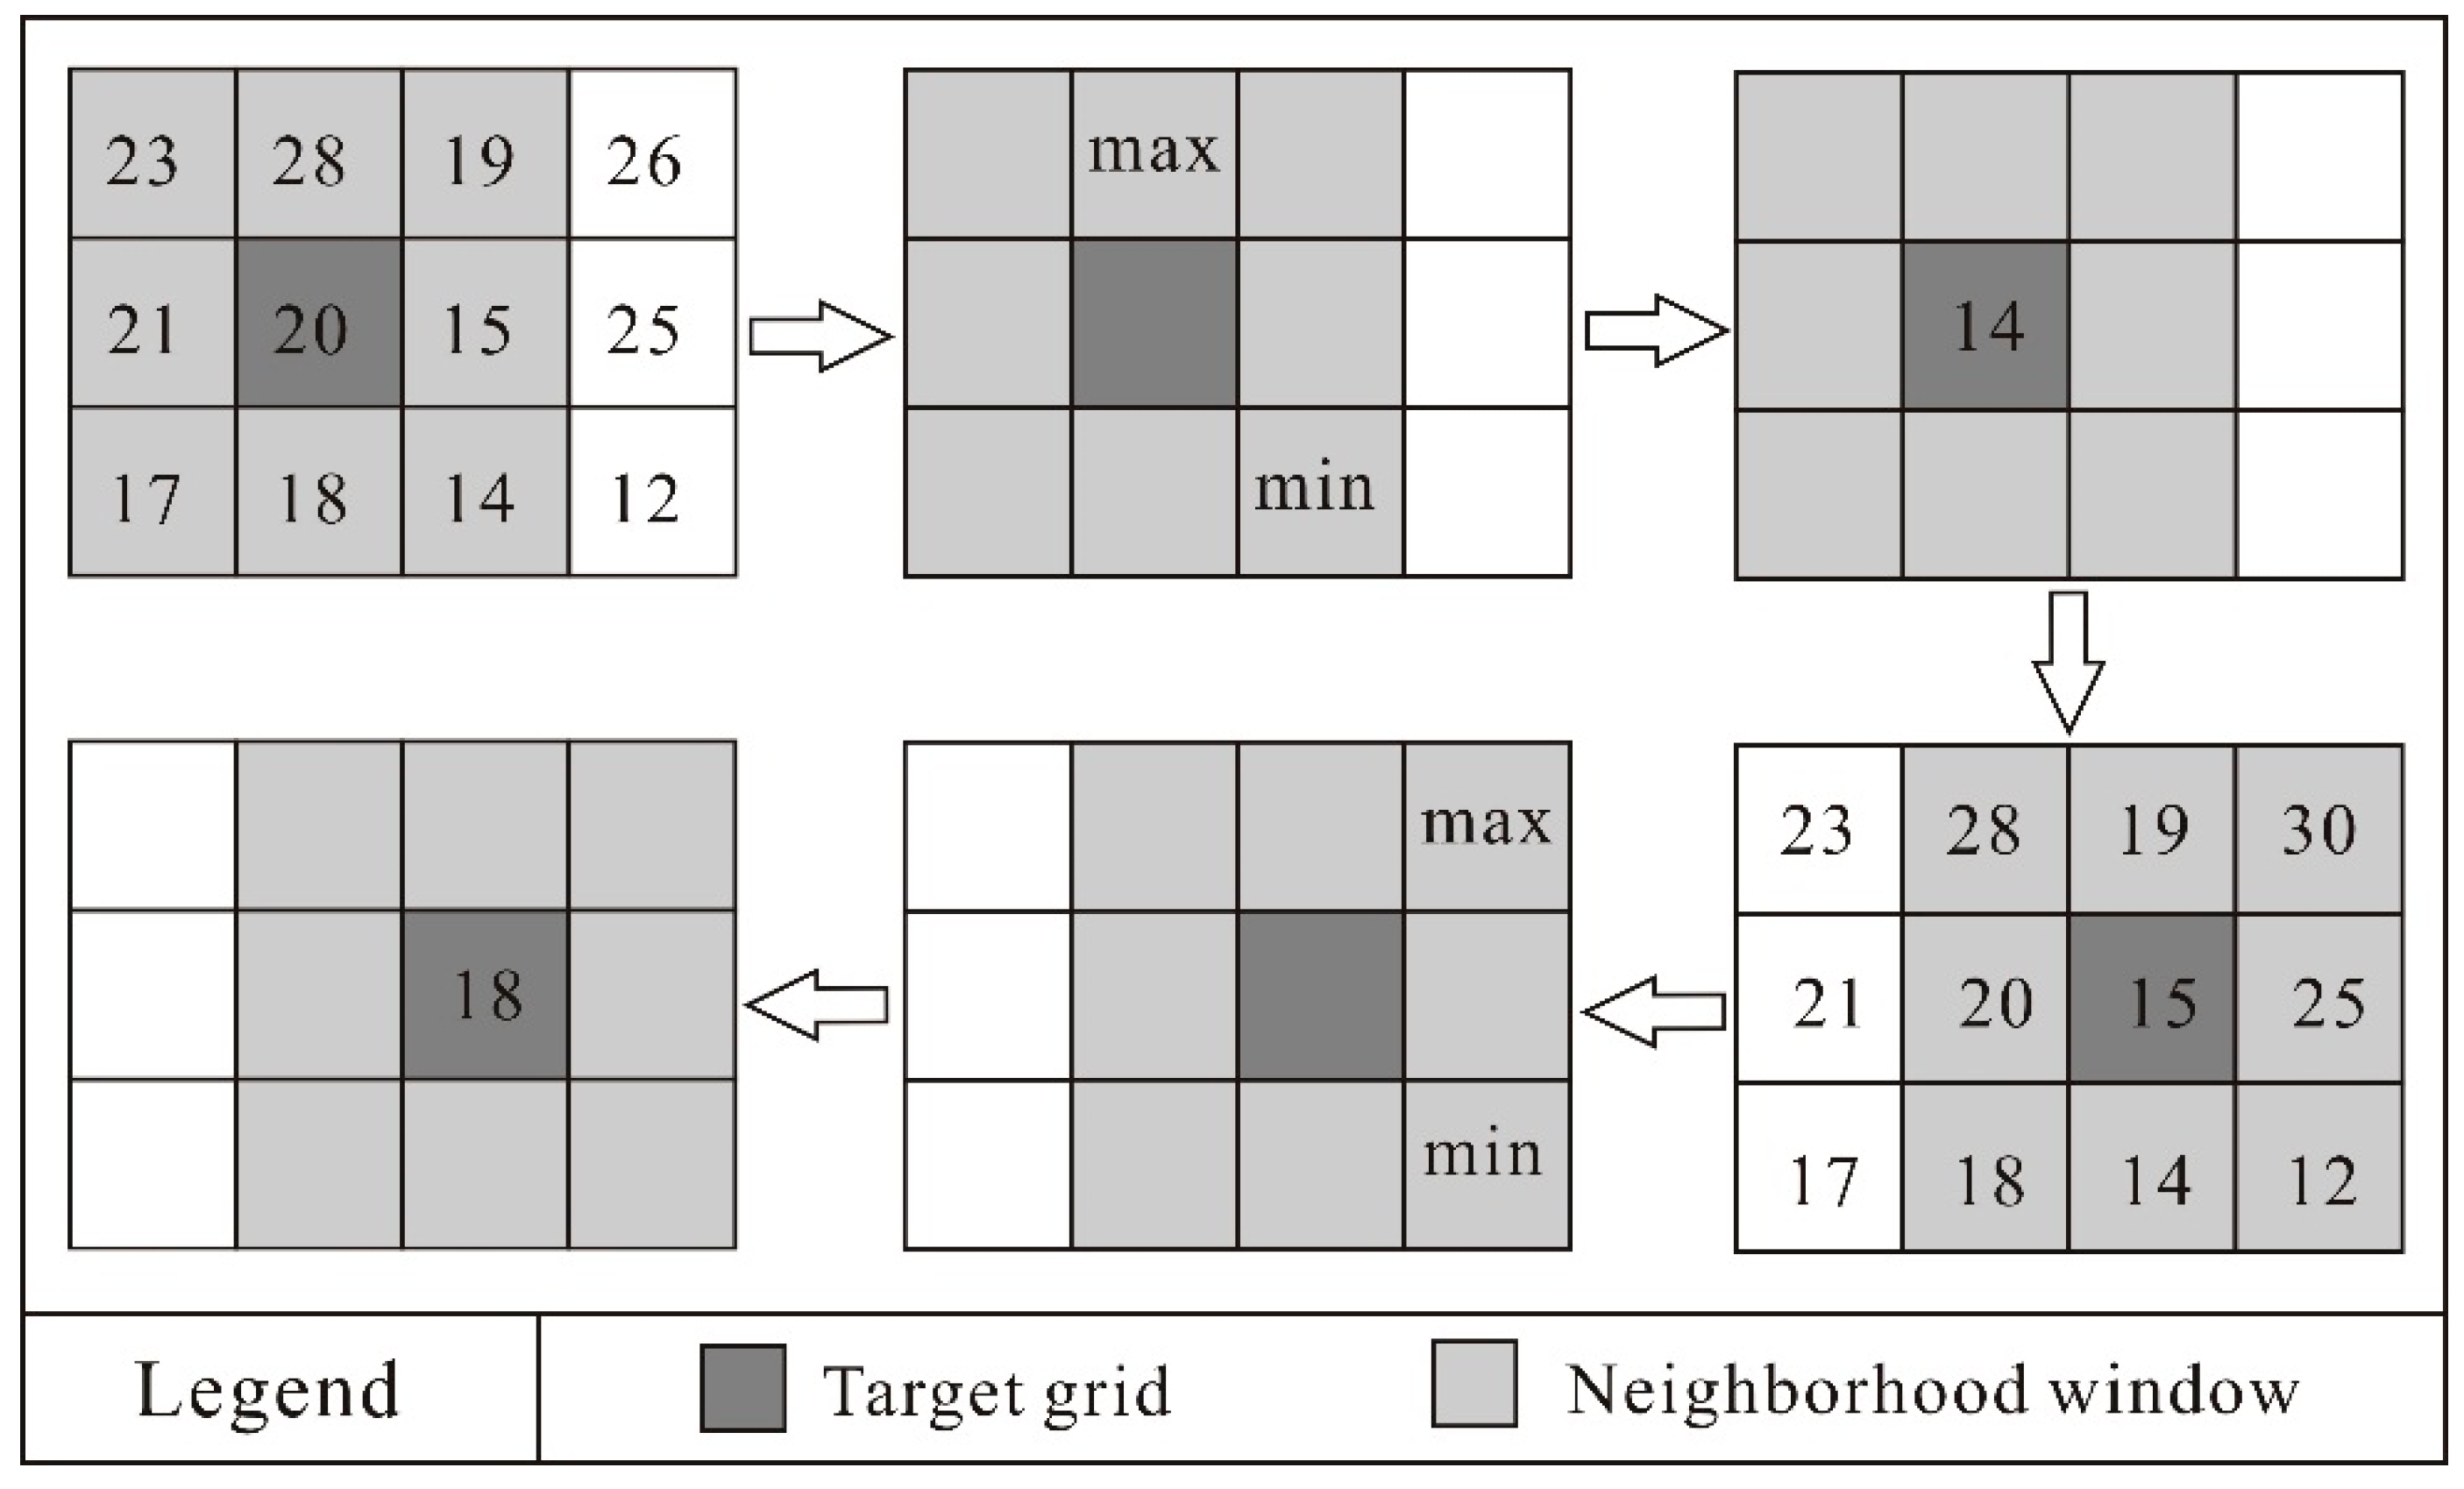
The topographic relief within the given area was extracted by moving window analysis. Analysis of window shapes included rectangle, circle, ring, and wedge. This study used the rectangular window. Figure 4 depicts the basic principle of the moving rectangular window analysis. Based on the DEM grid data, the window value with a fixed analytical size of n×n was determined. By setting the starting window value, moving step, and ending window value, the difference between the maximum and minimum values was calculated in each window as the topographic relief of target grid. Finally, by moving through the window step one by one, the topographic relief of the target grid was obtained under each window.
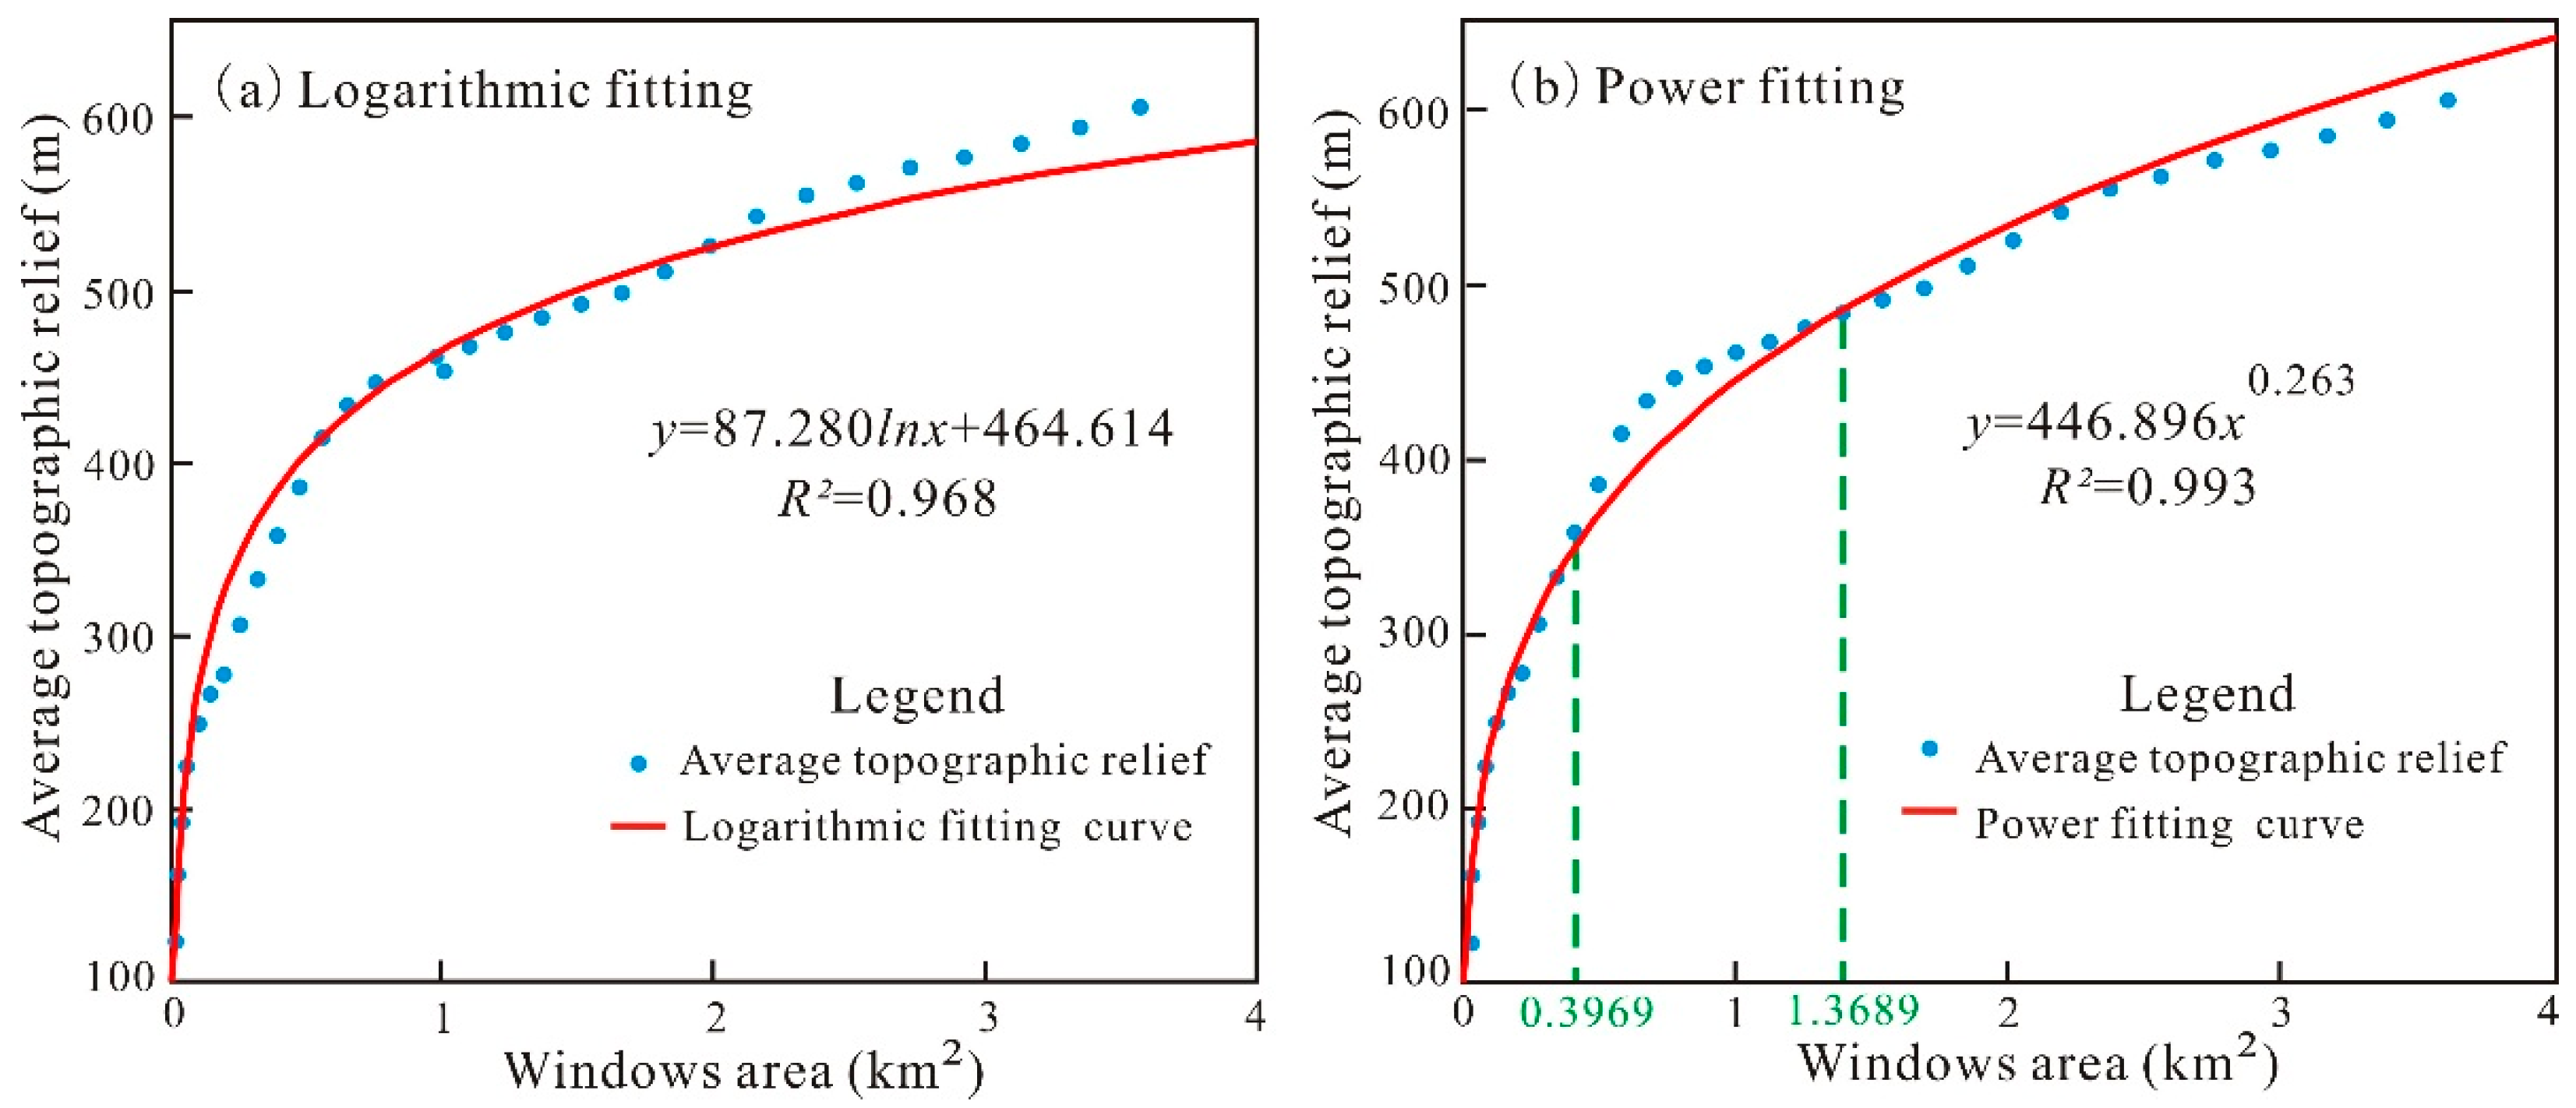
In this study, the starting window value was 2 × 2. In order to avoid the possible absence of inflection point in the change curve due to fewer windows, and data redundancy caused by too many windows, we selected the ending window value as 63 × 63 and set the moving step to 2. Thus, 31 moving windows of different sizes were obtained. Based on the spatial analysis function of ArcGIS software, the average topographic relief within the window was determined and a variation curve was obtained depending on the window size. The curve was fitted using logarithmic or power functions. The results are shown in Table 1 and Figure 5. The larger the R2, the better the fitting effect. Therefore, the logarithmic function fitting was better than the power function. As the window size increased, the average topographic relief gradually increased, reflecting the scale dependence of the topographic relief calculation. Based on the magnitude of the increase, the curve can be roughly divided into 3 stages: steep, steeper, and slow levels.
The mean change-point analysis is used to determine the change-point location on the fitting curve. This method is a mathematical and statistical method used to determine the anomalies or mutations in a series of non-linear data and is most effective in testing a single change point accurately [36]. The steps are as follows:
(1) The average topographic relief within the different analytical windows is divided by the corresponding window area to obtain the unit topography relief Tt, and then the logarithm is taken to obtain the sequence {Xt}:
X t = l n T t
The symbol t in the above equation refers to the number of analytical windows and the values of t are 1, 2, 3, ⋯, 31.
(2) The statistic S of sequence {Xt} is calculated using by Formula (3) and the result is 40.01.
X ¯ = ( i = 1 31 X i ) / 31 , S = i = 1 31 ( X i X ¯ ) 2
(3) When i = 1, 2, 3, ⋯, 29, the sequence {Xt} is divided by each i into 2 components, namely {X1, X2, X3, ⋯, Xt−1} and {Xt, Xt+1, Xt+3, ⋯, X30}. The arithmetic mean of each component of Xt1 and Xt2 is obtained using Equation (4). The statistic Si is calculated using Formula (5).
X t 1 ¯ = ( t = 1 i X t ) / i ,   X t 2 ¯ = ( t = i + 1 31 X t ) / ( 31 i )
S i = t = 1 i ( X t X t 1 ¯ ) 2 + t = i + 1 31 ( X t X t 2 ¯ ) 2
(4) The expected value E is determined using Equation (6), and the window size corresponding to the maximum value of E is the optimal statistical unit of topographic relief. As can be seen from Figure 6a, the difference reaches its maximum value (27.79) at point 9, where the window size is 21 × 21. This results in an optimal statistical cell size of 0.3969 km2 for the preliminary extraction of topographic relief in the study area based on the 30 m resolution DEM.
E = S S i

2.3.3. Quadratic Extraction of Topographic Relief

As can be seen in Figure 5b, the increase in mean undulation on the curve after the preliminary mean change-point analysis is still steeper and faster compared with the end of the curve. By definition, the size of the window area corresponding to the change point on the curve where the increase in mean undulation changes from steep to slow is the optimal unit of analysis. It is clear that the optimal statistical unit determined via preliminary mean change-point analysis does not correspond to the definition. The 0.3969 km2 spatial scale is too small to truly describe the macro-geography of the entire region, in combination with the mountainous and hilly landscape and the depth of terrain in the mountains of southern Anhui. The optimal window used to represent the topographic relief of the study area is found over a larger area beyond the 0.3969 km2.
Accordingly, the remaining data were subjected to another mean change-point analysis to calculate the change points and obtain the curve representing the difference between S and Si (Figure 6b). The curve reached its maximum difference at serial number 18, and the window size corresponding to this point was 39 × 39, with a window area of 1.3689 km2. It can be seen from Figure 5b that the change point calculated from the quadratic mean change-point analysis was exactly at the transition from a steeper increase to a slower increase, after which the topographic relief stabilized and the rate of increase eventually slowed down. The overall topographic characteristics of the region are more accurate and reasonable when expressed within a window of stable topographic relief. Cheng et al. suggested that the topographic relief within 4 km2 should be used as the basis for geomorphological zoning in the Anhui Province [45]. The area of the study area accounts for 31.0% of the Anhui Province. Based on the calculation of 4 km2 × 31.0%, the window area is 1.24 km2. The two results are similar, which demonstrates the reliability of the results of the quadratic mean change-point analysis. Therefore, we adopted 1.3689 km2 as the optimal statistical unit to extract the topographic relief in the southern Anhui mountainous area.

3. Results

3.1. Spatial Distribution of Topographic Relief

The topographic relief was calculated according to the size of the optimal statistical unit (1.3689 km2) obtained via mean change-point analysis. The results show that the topographic relief in the study area ranged between zero and 1183 m, with an average value of 215 m. According to the division standard specified for landform types in the Anhui Province [45], the topographic relief is divided into five grades (Figure 7 and Table 2). The southern Anhui mountainous area is dominated by medium relief, accounting for 34.54%. It is distributed in various mountain ranges such as Huangshan Mountain, Jiuhua Mountain, Tianmu Mountain, Baiji Mountain, and Wulong Mountain. Small relief accounted for 23.81% and was distributed in the periphery of medium relief. Slight relief accounted for 17.99%, mainly distributed in the intermountain basin in the southern region of the study area and the periphery of small relief. Flat areas account for 20.69%, concentrated in the middle and lower reaches of the Yangtze River plain in the north of the study area. Large relief accounted for a relatively small proportion (2.97%) and was distributed on the main ridges of each mountain range, forming a complete mountain body with the medium relief.
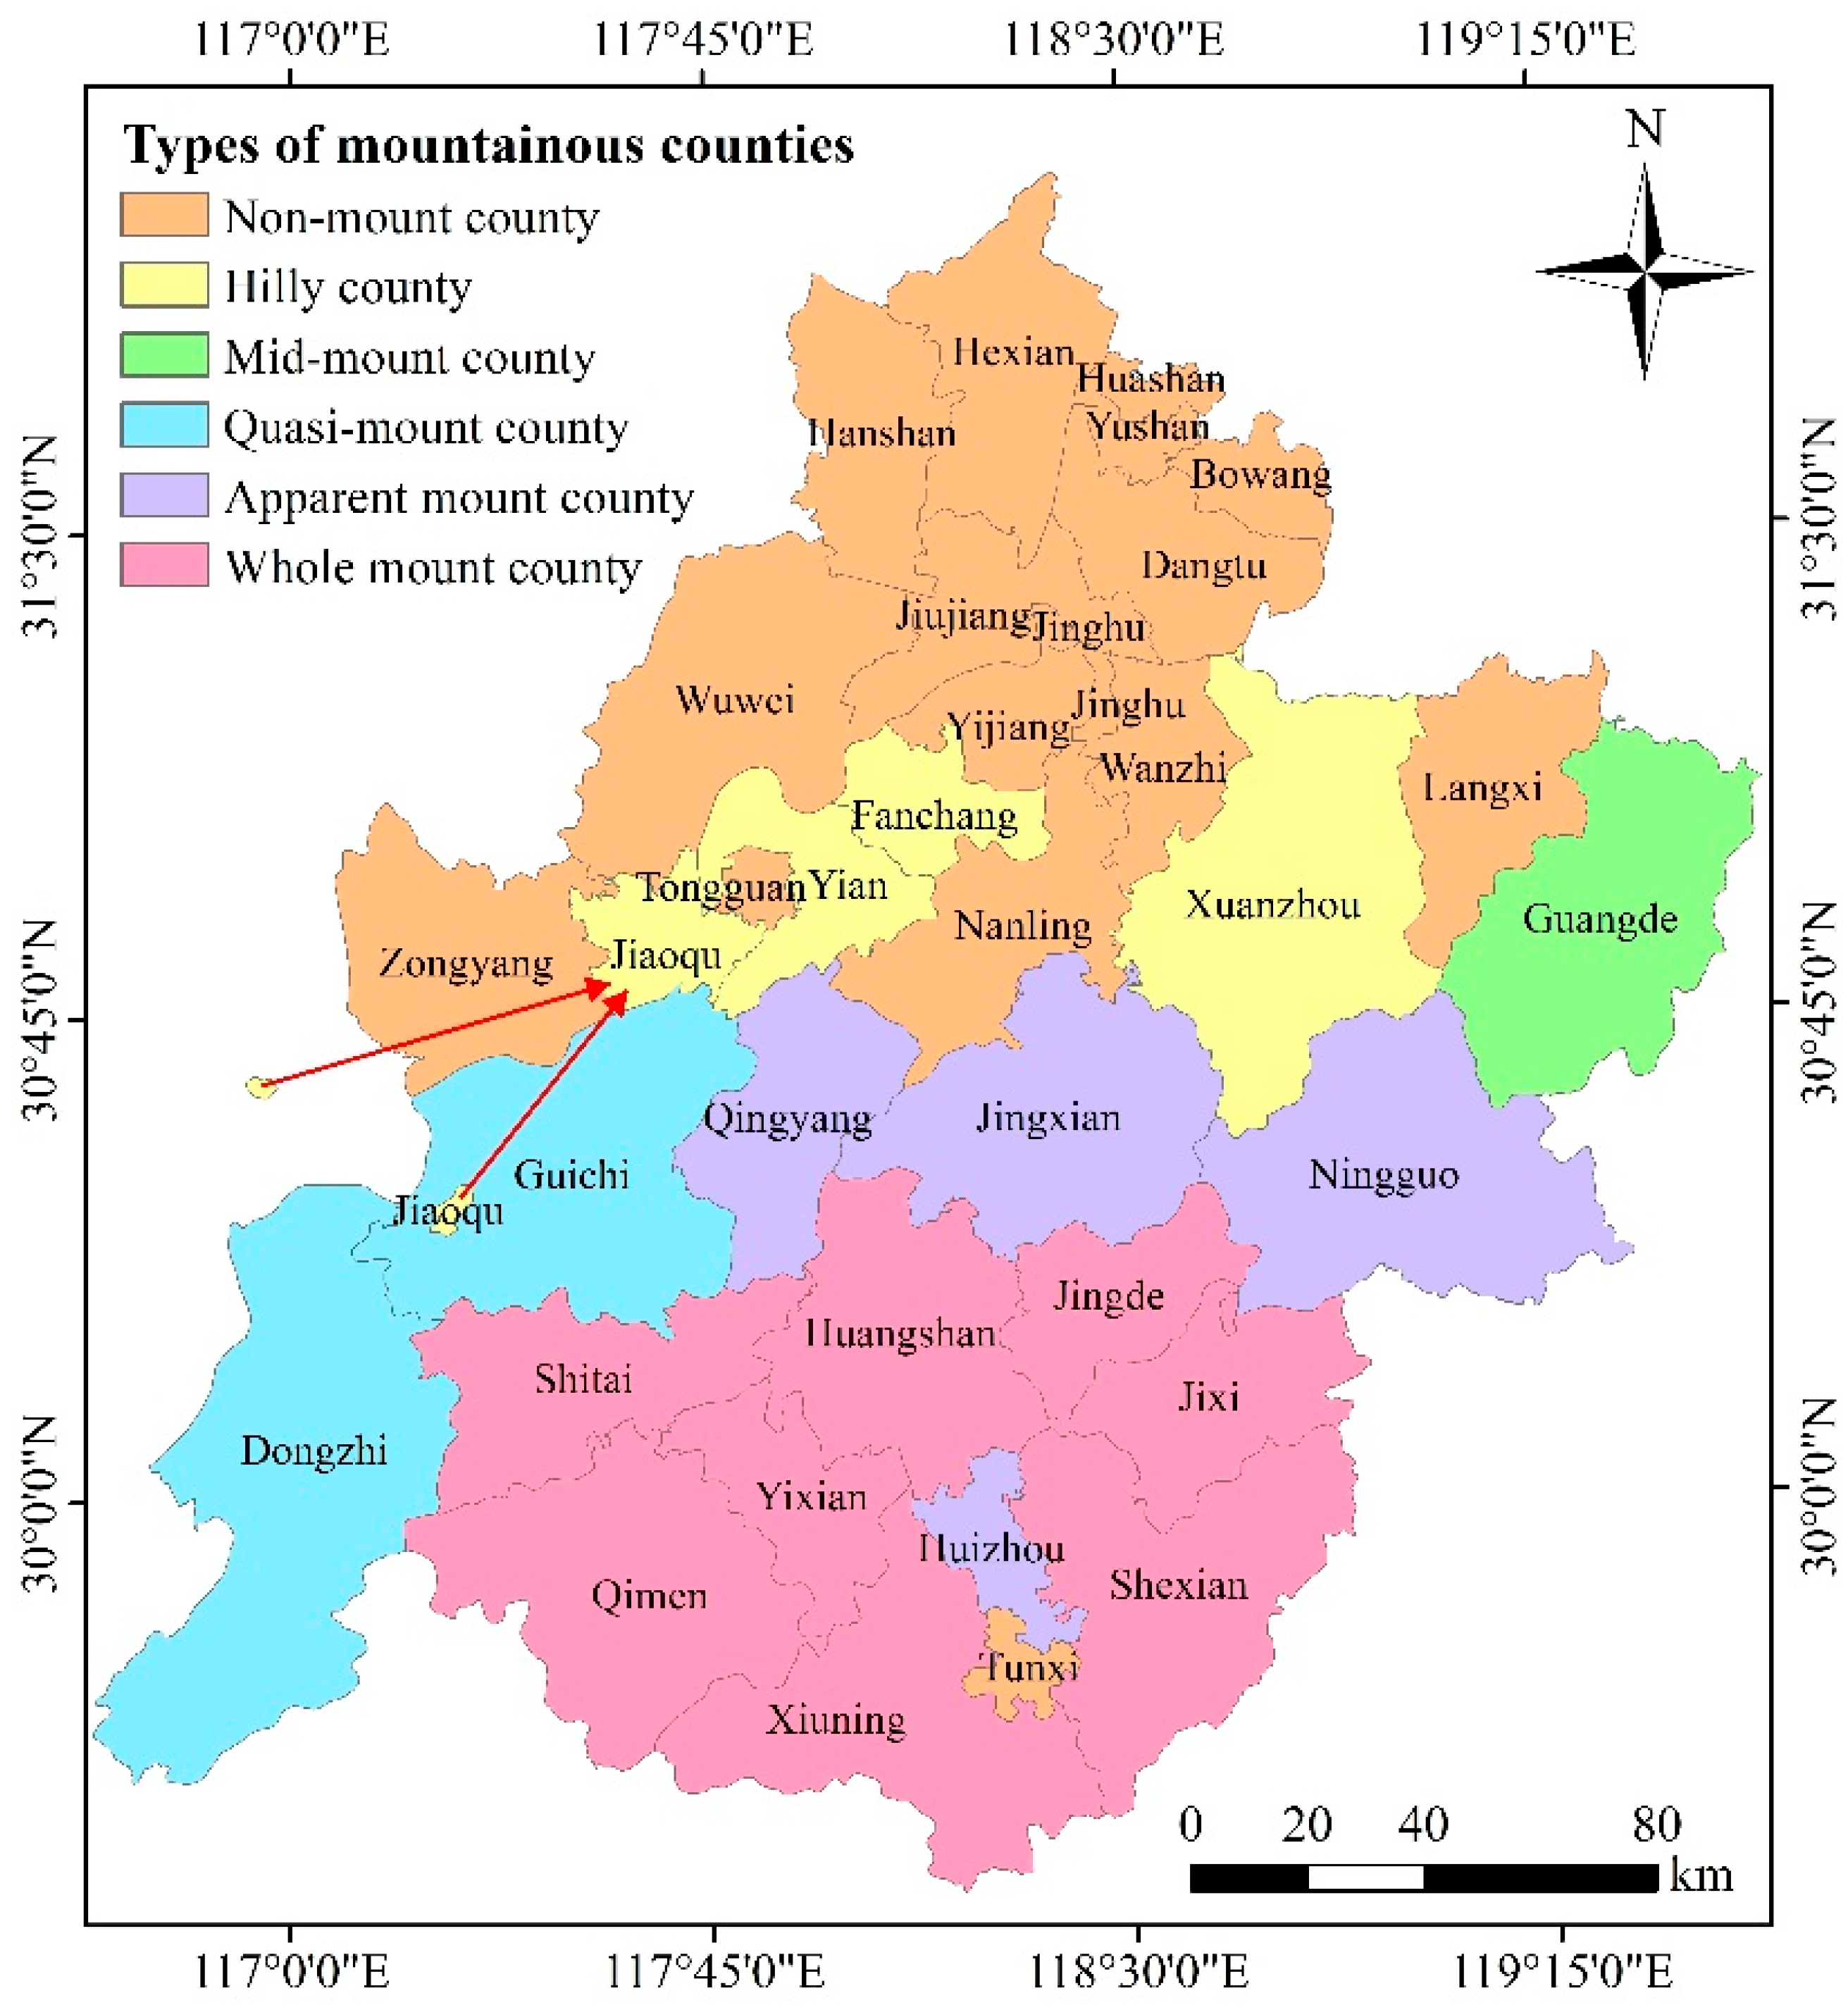
Based on classification criteria for mountainous counties in the Sichuan Province proposed by Fan et al. [20], the mountainous counties in the study area were divided into six categories depending on the average topographic relief (Figure 8): non-mountainous counties (≤80 m), hilly counties (80–115 m), semi-mountainous counties (115–155 m), quasi-mountainous counties (155–195 m), apparent mountainous counties (195–245 m), and whole mountainous counties (≥245 m). The 16 non-mountainous counties are distributed in the middle and lower reaches of the Yangtze River plain in the northern region of the study area, with flat terrain and the smallest topographic relief. The whole mountainous area comprised of eight counties, most of which are distributed in the central and southern regions of the study area, and the topographic relief is the largest. The apparent mountainous area includes four counties. Excluding the Huizhou district, the other three counties are distributed linearly in the north of the whole mountainous counties. The two, one, and four quasi-mountainous counties, semi-mountainous counties, and hilly counties, respectively, are distributed in an arc in the northern area of the whole mountains and the apparent mountainous counties, which are also transitional zones from mountainous areas to plains.

3.2. Impact of Topographic Relief on the Spatial Pattern of Population and Economy

3.2.1. Comparative Analysis of the Impact of Slope and Elevation on Population and Economy

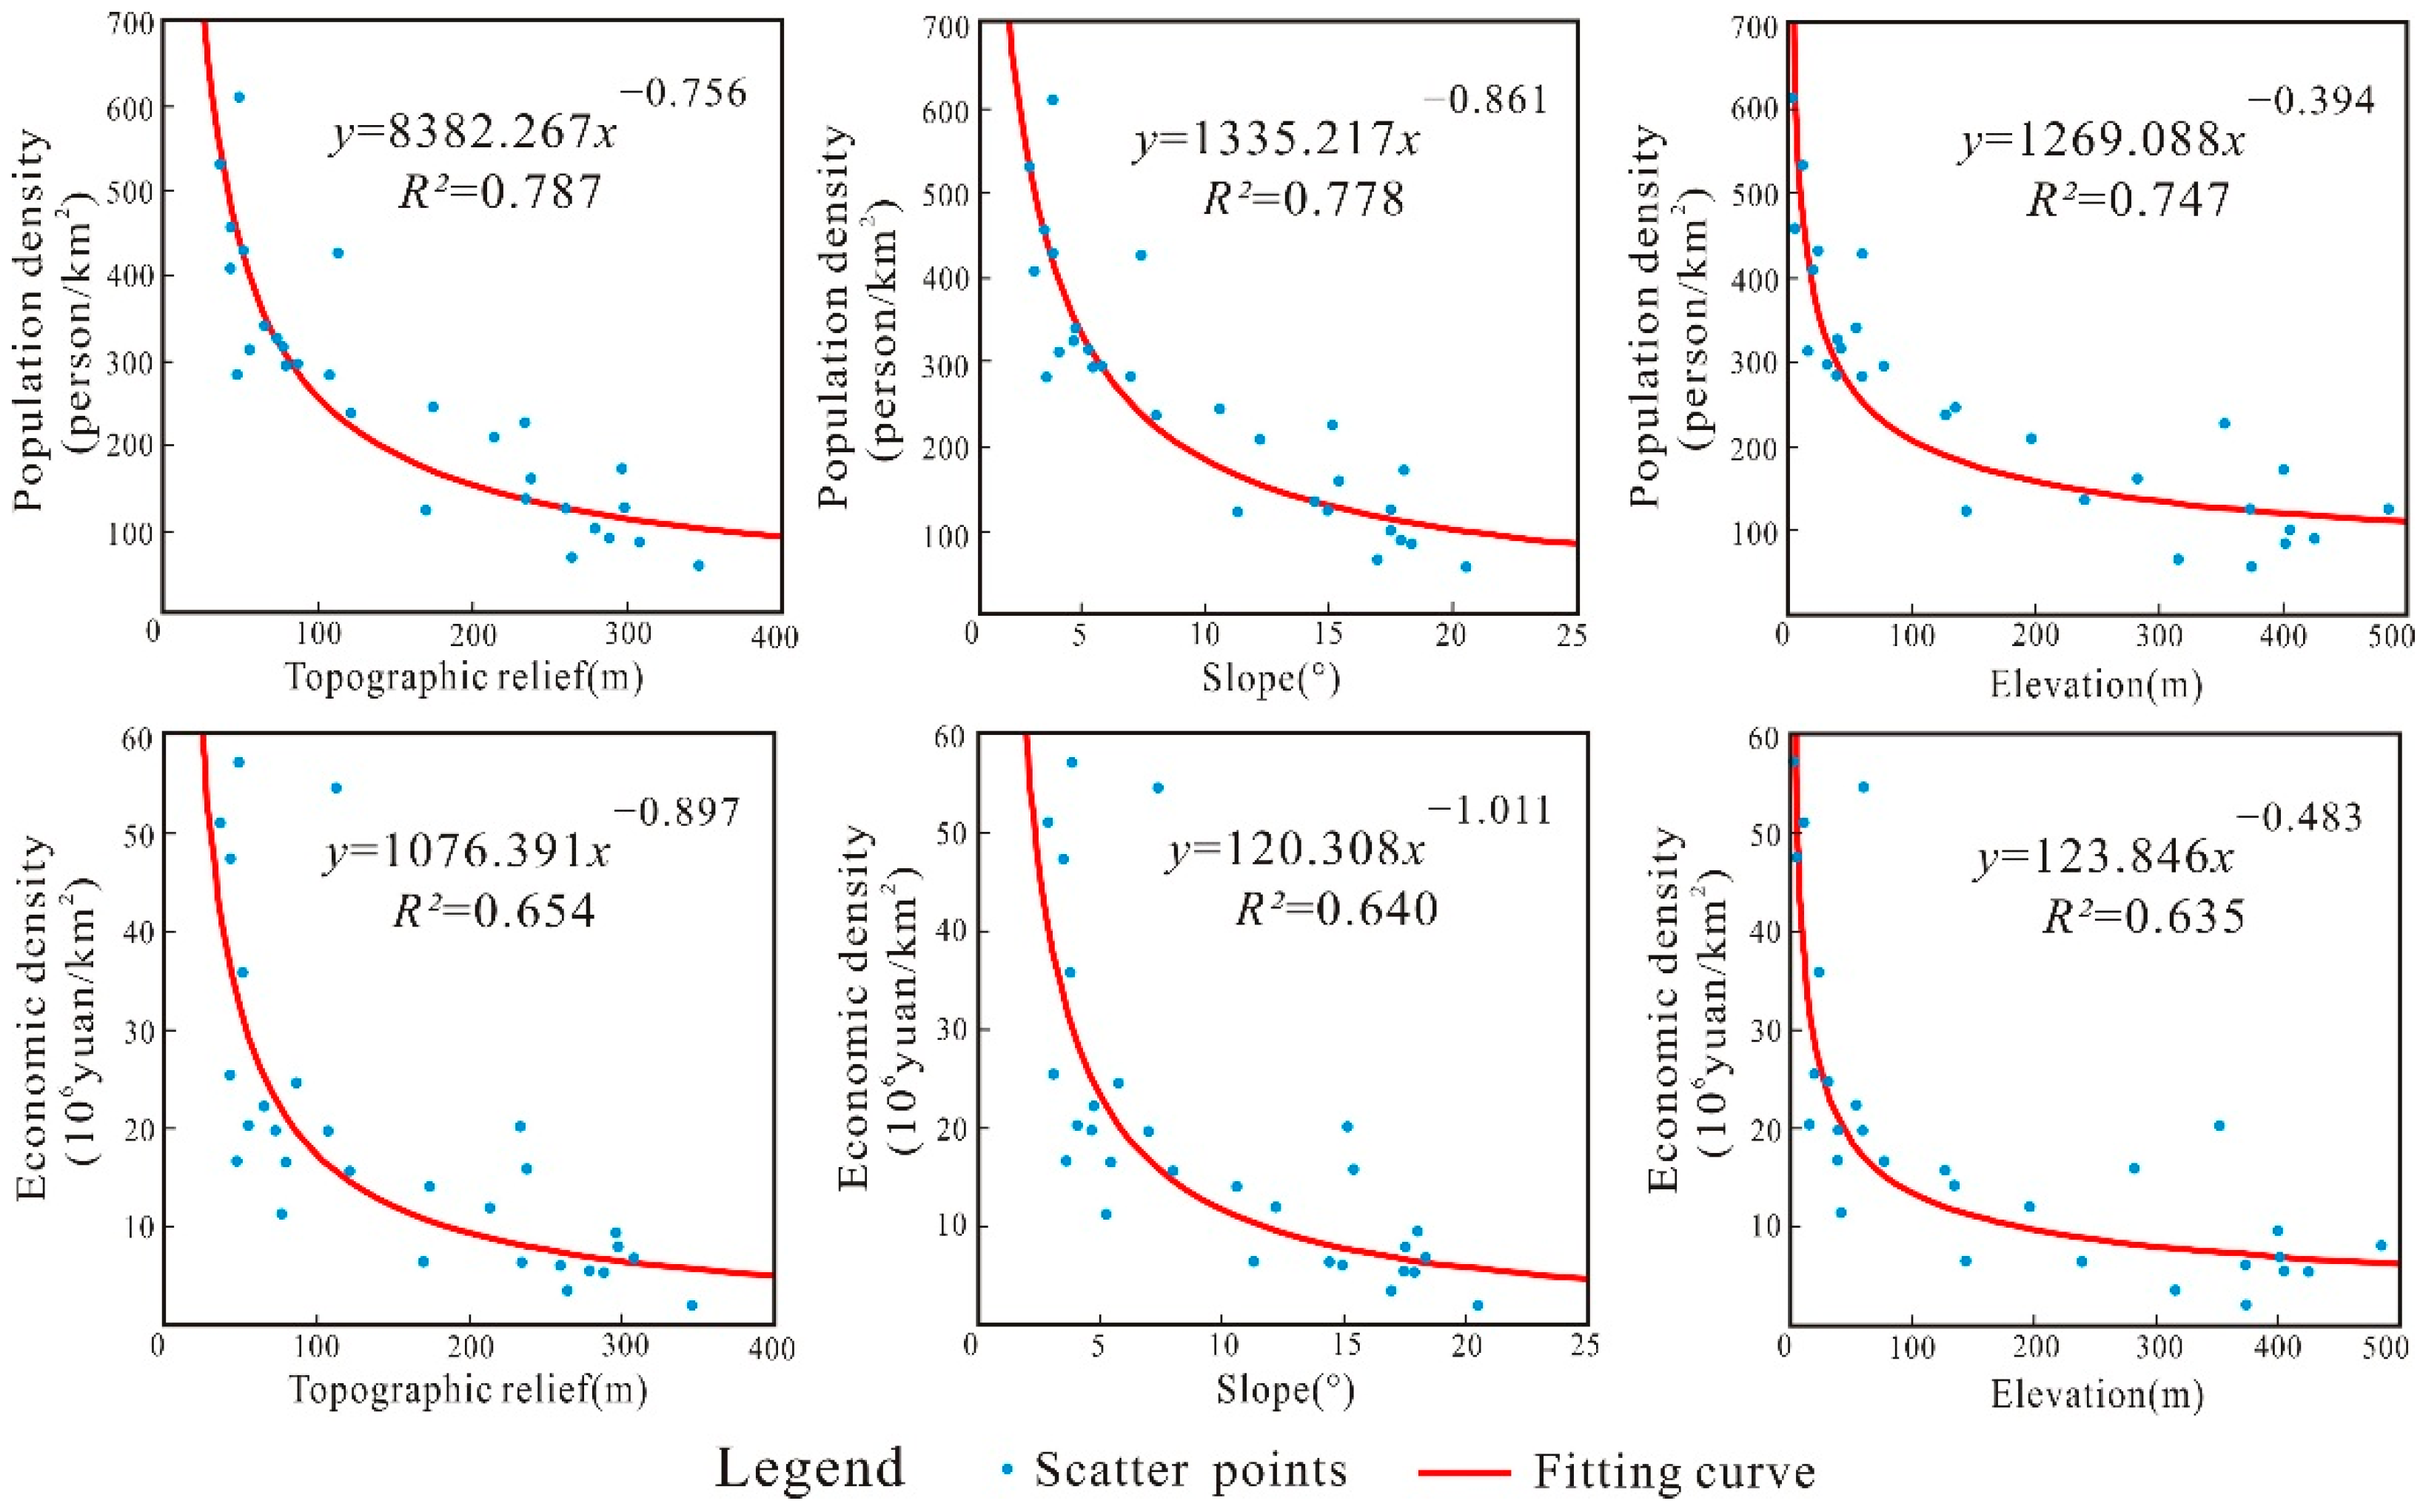
In order to compare the impact of topographic relief and other factors on population and economy, 30 m resolution DEM data were used to extract slope and elevation, respectively. A regional statistical analysis model was used to determine the average value of slope and elevation in each county. Population density and economic density of each county were then preprocessed, and the iterative elimination method was used to sequentially delete abnormal data outside the range of [X3S, X + 3S] until no outliers were detected. A total of six municipal districts with abnormal population and economic data were excluded, and the population density and economic density of the remaining 29 counties were fitted with power function curves with the topographic relief, slope, and elevation. The fitting results passed the p < 0.01 significance test. As shown in Figure 9, each topographic factor exhibited a significant negative correlation with population density and economic density. The fitting degree of topographic relief with population density and economic density reached 0.787 and 0.654, respectively, slightly higher than that of slope and elevation, indicating a significant restrictive effect of topographic relief. The correlation between each topographic factor and population density was significantly higher than that of economic density, indicating that topography has a stronger impact on population distribution than economic development.

3.2.2. Impact of Topographic Relief on Spatial Distribution of Population and Economy

Data on land, population, and economic conditions under different topographic reliefs in the southern Anhui mountainous area are presented (Table 3). With the increase in topographic relief, the population density shrunk continuously and sharply, and the economic density also showed a rapid decline in general except for a slight increase in the apparent mountainous counties (195–245 m). The population density and economic density of non-mountainous counties (≤80 m) were as high as 541.64 (person/km2) and 4311.44 (104 yuan/km2), respectively. The high density of population (54.34%) on 28.56% of the land, generating 61.04% of GDP, suggests the high potential for development of this area. Compared with non-mountainous counties, the population density and economic density of the hilly counties (80–115 m) decreased by 42.98% and 46.95%, respectively. The land area, population, and economic levels of these areas were 10.51%, 11.82%, and 11.92%, respectively. The population density and economic density of semi-mountainous counties (115–155 m) decreased by 23.44% and 31.73%, respectively. The land area, population, and economic proportion were 4.86%, 4.19%, and 3.76%, respectively. Thus, the land in hilly and semi-mountainous counties was in a saturated state, with a relatively high potential for development. The population density and economic density of quasi-mountainous counties (155–195 m) further decreased by 25.78% and 37.31%, respectively. The land area accounted for 13.30%, while the population and economy only accounted for 8.50% and 6.45%, respectively. The population density of apparent mountainous counties (195–245 m) continues to decline, while the economic density has increased. Only 8.46% of the population lives on 14.00% of the land, contributing to 8.48% of GDP. Therefore, the land in the quasi-mountainous counties and the apparent counties is in an unsaturated state, with potential for development. The population and economic density of the whole mountainous counties was the lowest, accounting for only 1/5th and 1/8th of the population and economic density of non-mountainous counties. The land area accounted for 28.76%, but only 10.69% of population contributed to only 8.34% of GDP, suggesting an unsaturated state of the land in the whole mountainous counties with the worst possible conditions for development.
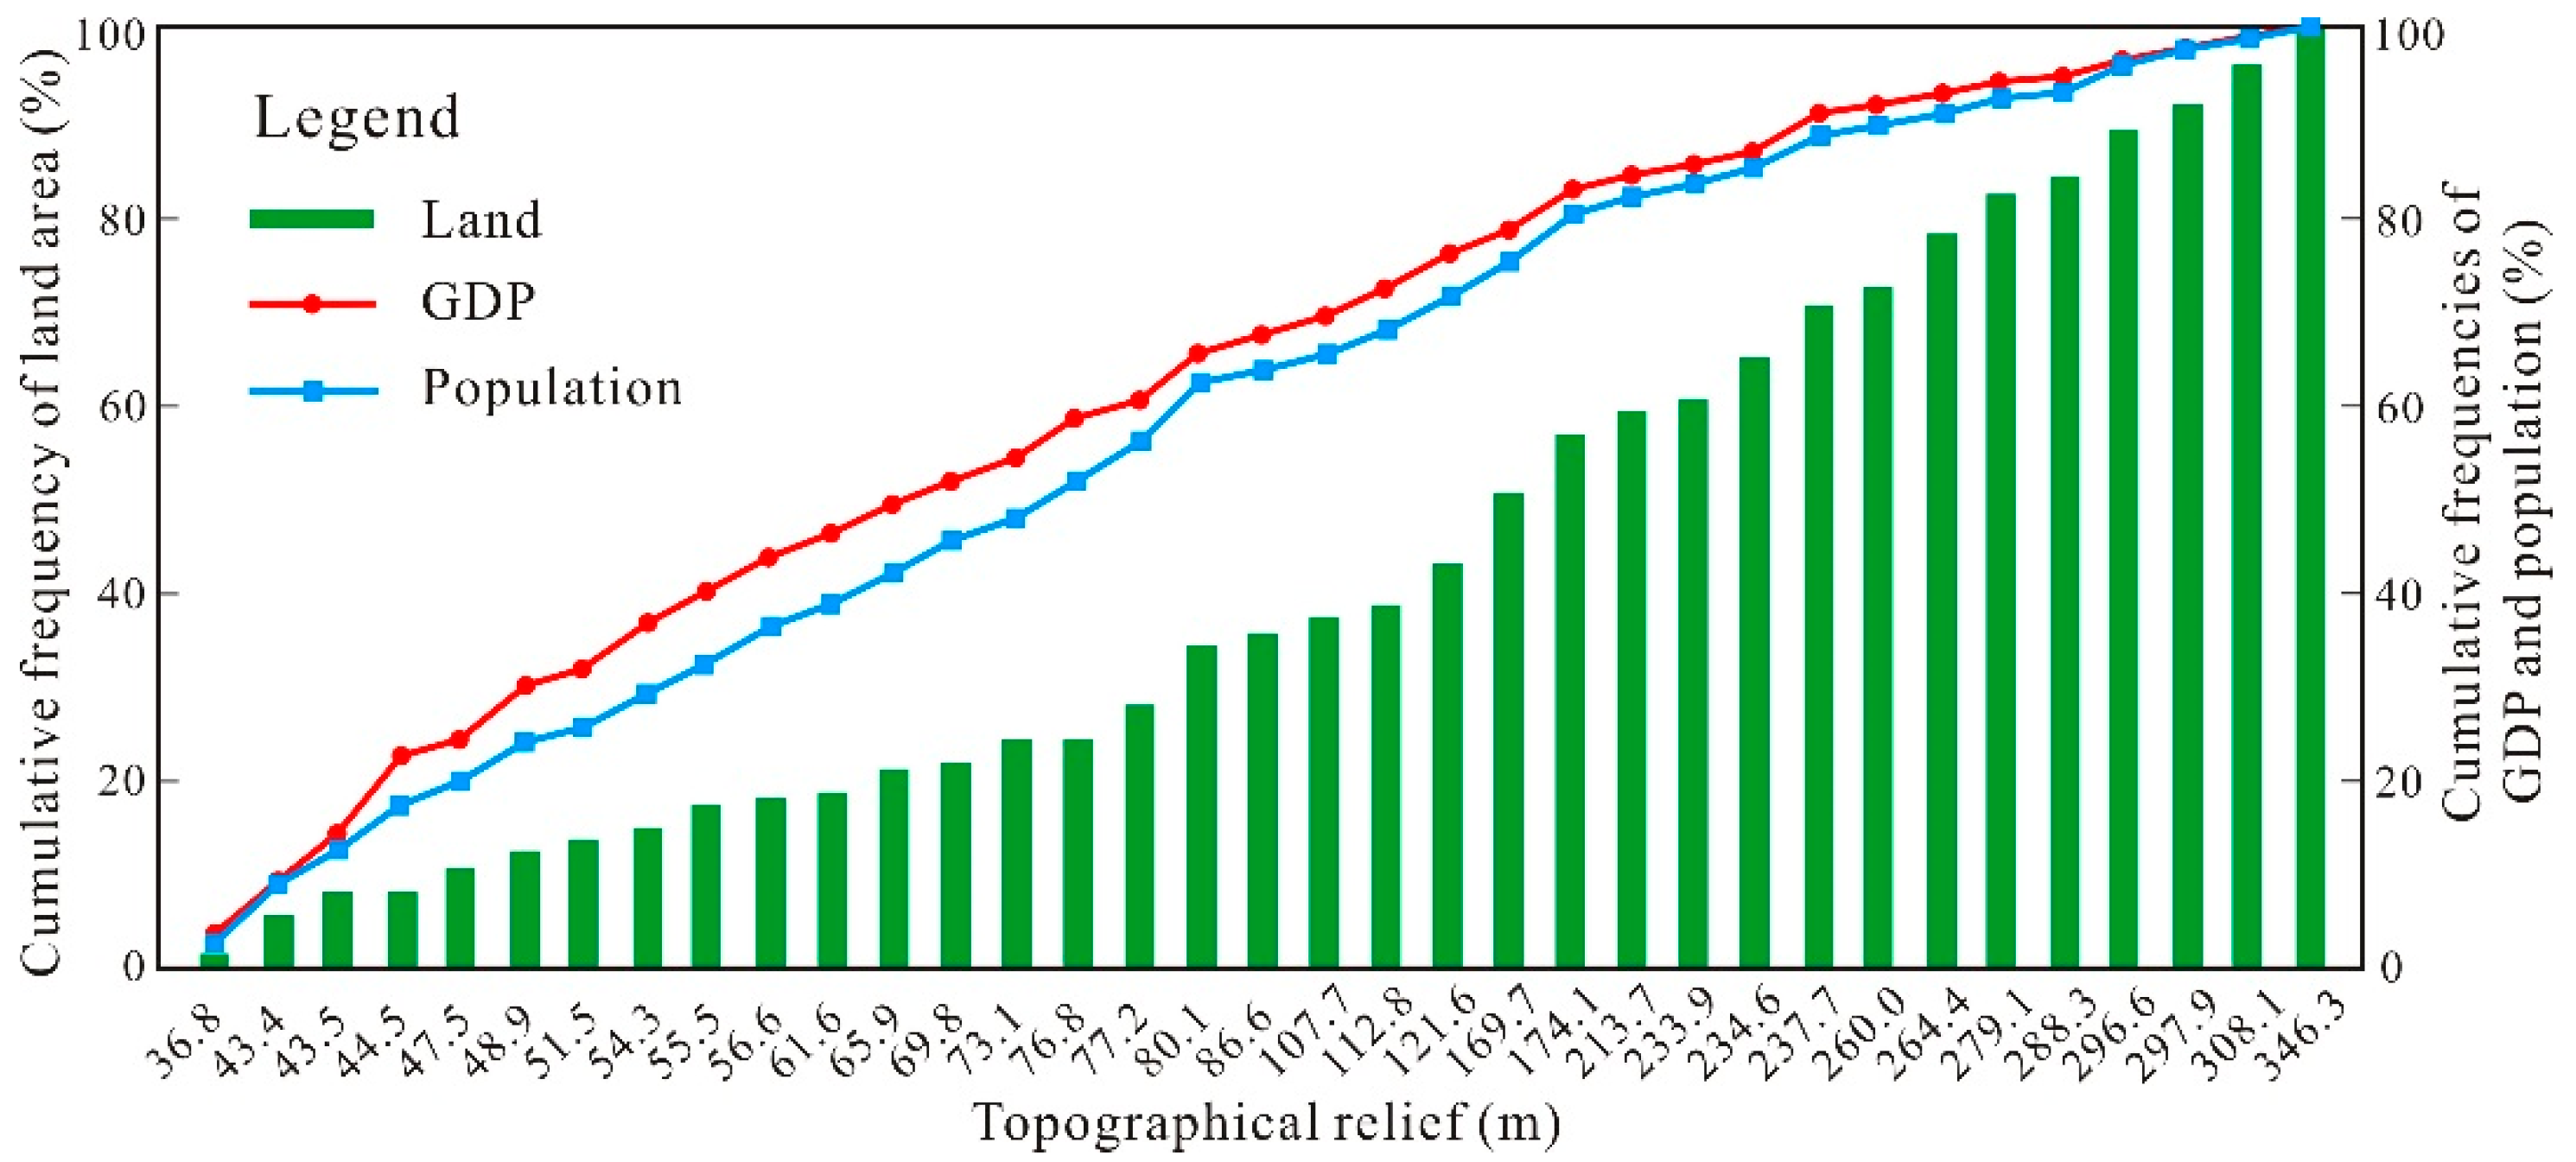
The cumulative frequency of land area, population, and GDP of each county unit in the southern Anhui mountainous area was analyzed as a function of topographic relief (Figure 10). The cumulative frequency of economy and population changed similarly. However, under the same topographic relief, the economic development preceded population distribution. With increased topographic relief, the cumulative frequency curve of land area always lagged behind the cumulative frequency curve of population and economy. In the county unit with topographic relief less than 80 m, the cumulative proportion of population and economy was 56.34% and 61.04%, respectively, whereas the cumulative proportion of land area was only 28.56%. When the topographic relief reached 195 m, the cumulative proportion of population and economy was as high as 80.85% and 83.17%, whereas the cumulative proportion of land area was only 57.23%. The above analysis reveals a strong correlation between population distribution and economic development of the county unit in the southern Anhui mountainous area, whereas the correlation between the two and the land area was poor.
In brief, population distribution and economic development in the southern Anhui mountainous area are spatially unbalanced, and the two tend to congregate in areas with low topographic relief. The land area of non-mountainous, hilly, and semi-mountainous counties was 43.93%, while the proportion of population and economy was as high as 72.35% and 76.72%, respectively. The natural conditions and economic foundation of this area are good, and highly suitable for development. The land area of quasi-mountainous and apparent mountainous counties together account for 27.30% of the study area, with 16.96% of the population, and contribute to 14.93% of GDP. They represent key areas for promoting rural revitalization, agriculture, afforestation, and infrastructure for water conservation. The abundance of resources and industries should be nurtured. Appropriate policies should be implemented to attract talents, so as to promote rapid economic development. The land area of whole mountainous counties is widely distributed, while the topographic conditions are complex, and the population is sparse. The poor economic development suggests low potential for land development. The whole mountainous counties require developmental support for the characteristic ecological agriculture and tourism. The areas with a harsh natural environment require a relocation model to improve the living standards of the population, and also to effectively avoid natural disasters.

4. Discussion

4.1. Impacts of Topographic Relief on Population and Economy

The topographic relief of each county has a stronger impact on population distribution than on economic development (Figure 9). Further correlation analysis revealed that topographic relief was negatively correlated with population and economy (p < 0.01), with correlation coefficients of −0.866 and −0.692, respectively. These results are consistent with the findings of Yu et al., who showed that the correlation between topographic relief and population (−0.821) was stronger than the correlation with economy (−0.663) in the Three Gorges Reservoir area [1]. It is also consistent with a study by Zhang et al., who reported that the correlation between topographic relief and population (−0.784) was stronger than the correlation with economy (−0.687) in the western Henan area [12]. This may be due to the advantages of local finance, infrastructure, and investment attraction of regions with gentle topographic relief. Under the impact of topographic factors, the economic agglomeration effect was stronger than the population agglomeration effect, resulting in high GDP of the regions with gentle topographic relief and unbalanced economic development.

4.2. Relationship between Topographic Relief and GDP of Three Industries

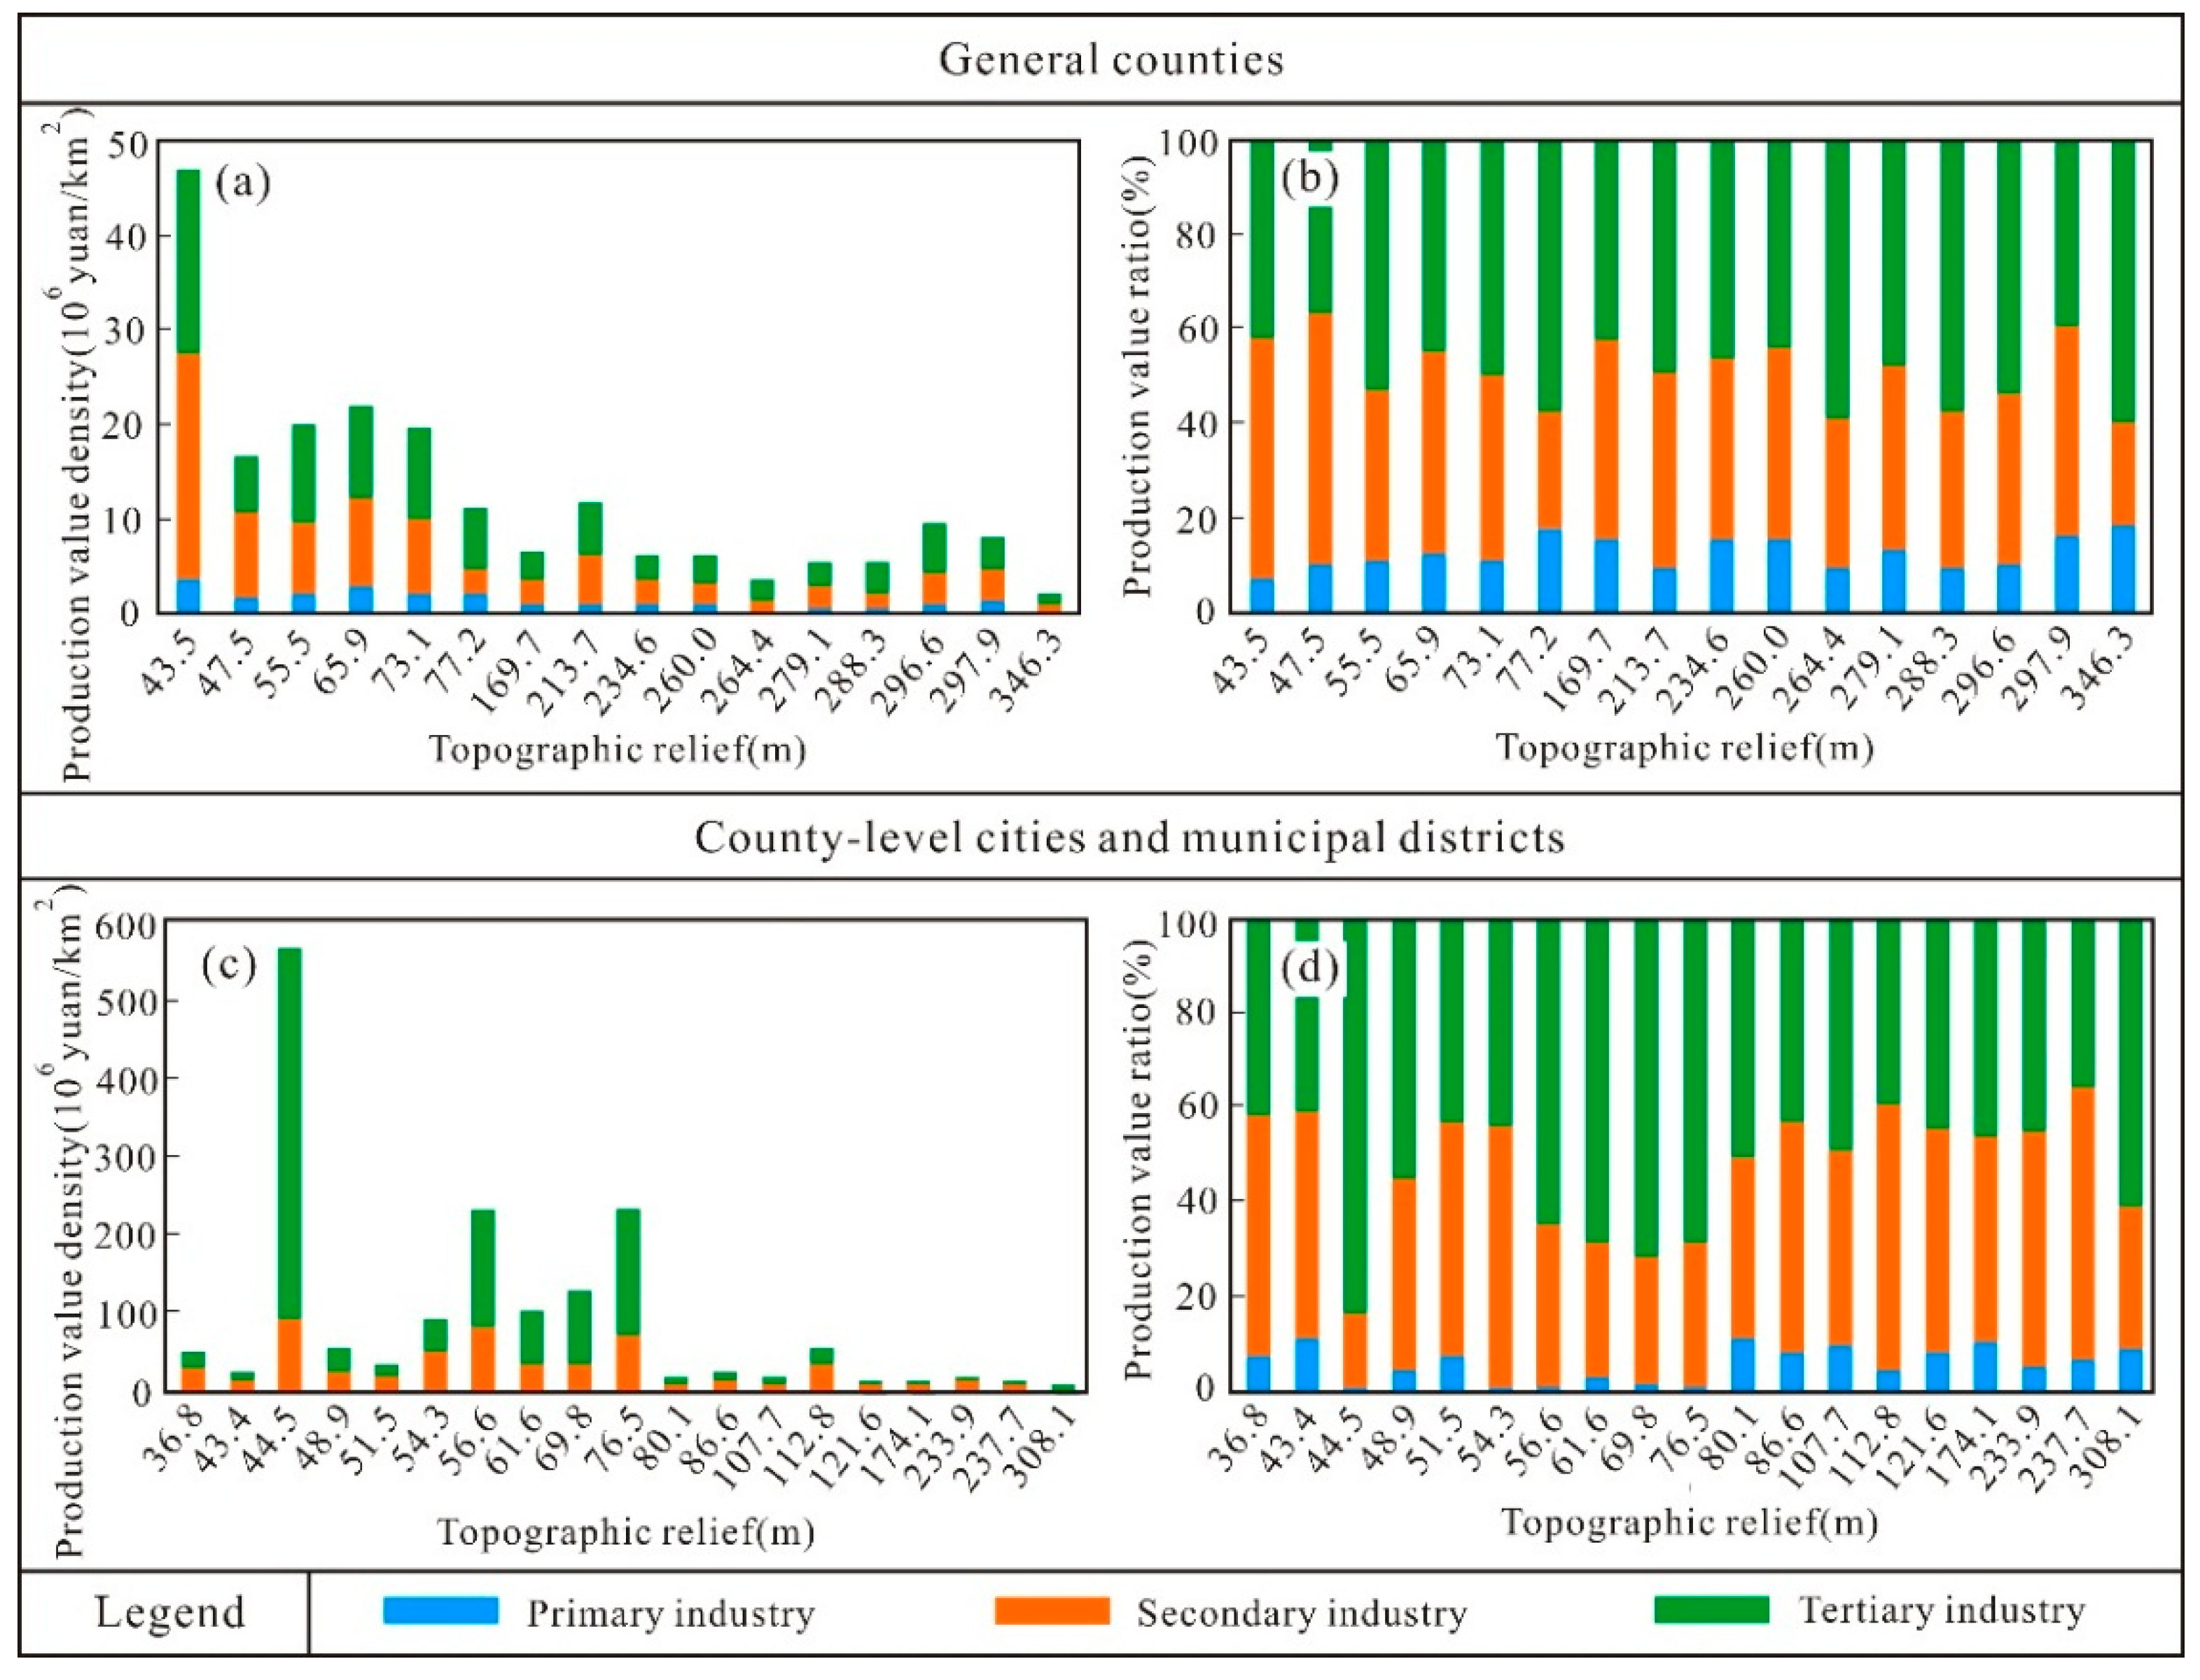
GDP includes the production value of primary industries, including agriculture, forestry, and animal husbandry; secondary industries, such as mining, manufacturing, and construction; and tertiary industries, including services [46]. In order to study the impact of topographic relief on the production value of different types of industries, we divided GDP based on primary, secondary, and tertiary industrial sectors. At the same time, considering the difference in county administration, there may be large differences in production value. Therefore, we divided the 35 counties into 16 general counties and 19 county-level cities and municipal districts, followed by quantitative analysis of the relationship between topographic relief and production value of the three industries from two aspects. The results are shown in Figure 11.
As shown in Figure 11a,c, the production value density of primary industries in general counties is comparable to that of county-level cities and municipal districts, with average levels of 1.42 (106 yuan/km2) and 1.73 (106 yuan/km2), respectively. However, the production value density of secondary and tertiary industries in general counties was significantly less than that of county-level cities and municipal districts. It may be due to the location of most general counties in areas with large undulating topographies, which restricts the development of secondary and tertiary industries. In general counties, with an increase in topographic relief, the production value density of the three industries generally showed a downward trend. Further correlation analysis revealed that the production value density of the three industries and topographic relief were significantly negatively correlated (p < 0.01), and the correlation coefficients were −0.867, −0.682, and −0.766, respectively. However, in county-level cities and municipal districts, the impact of topographic relief on the production value density of three industries was not obvious, and the correlation coefficients were −0.527, −0.489, and −0.329, respectively, and the correlation was not high. In addition, in general counties or county-level cities and municipal districts, topographic relief showed the strongest correlation with primary industries and had the greatest impact, mainly because primary industries were more easily constrained by topographic factors. Although the development of secondary and tertiary industries was also affected by topographic factors, technological innovation was the biggest driving force.
The production values of the three industries in each county are shown in Figure 11b,d. The proportion of the tertiary industry was the largest, followed by secondary industry. The share of primary industries was the smallest. The average proportions of three industries in general counties were 11.24%, 42.17%, and 46.59%, respectively, while those of county-level cities and municipal districts were 1.90%, 30.79%, and 67.31%, respectively. The average proportion of primary industries in general counties was significantly higher than in county-level cities and municipal districts. However, county-level cities and municipal districts carry a larger proportion of the tertiary industry than general counties, which is in line with China’s county administrative unit division principle. Thus, the division of general counties is mainly based on the relatively high degree of economic development of the primary industry (mainly agriculture), while the tertiary economy (service industry) of county-level cities and municipal districts is relatively developed.
As far as the 35 county units in the study area are concerned, the average proportions of three industries were 2.88%, 41.1%, and 51.7%, respectively. This result is consistent with the proportion of China’s three industries in 2020 (7.7%, 37.8%, and 54.5%, respectively) released by the National Bureau of Statistics [47]. In the southern Anhui mountainous area, the abundant natural resources facilitate the development of tourism and related industries, thereby promoting rapid development of secondary and tertiary industries. However, the development of primary industries is relatively slow. In the future, the development of secondary and tertiary industries requires a focus on agriculture and development of primary industries, to ensure a reasonable structure of the three industries and promote coordinated and sustained economic development.

4.3. Correlation between Topographic Factors

As can be seen from Figure 9, topographic relief has the greatest impact on population and economy, slope has less impact, and elevation has the least impact. This is consistent with the study of Zhang et al., who demonstrated that topographic relief and slope were the key factors influencing the spatial distribution pattern of population and economy in Hanzhong City [48]. A similar conclusion was reached by Zhang et al. [12]. It can be seen from Figure 12a that with the increased topographic relief, the slope exhibited a continuous increase, suggesting a strong correlation between the two parameters. The elevation showed an increasing trend in general, but in the four counties of Tunxi, Huizhou, Jingde, and Jixi, the elevation curve was abnormally convex, because these counties are distributed in the basin between Huangshan Mountain, Tianmu Mountain, and Baiji Mountain. The topography is relatively flat, but the relative elevation is higher.
Figure 12b,c presents the results of the correlation analysis. The topographic relief is positively correlated with slope and elevation (p < 0.01), with correlation coefficients of 0.995 and 0.923, respectively. The calculation of topographic relief and slope is similar and is based on the neighborhood analysis. Topographic relief is the calculated difference in elevation within the neighborhood, and slope is the ratio of the calculated difference in elevation compared with the horizontal distance within the neighborhood.

4.4. Selection of Statistical Units

Currently, most studies analyzing the impact of topographic factors on population and economy at the medium- and small-scale level are based on county administrative units [13,14,15,41,48,49], which often conceal the spatial differences in internal population distribution and economic development, resulting in distortion of research results. Meanwhile, it is difficult to conduct spatial analysis based on topographic data at the grid scale [38]. In recent years, with the development of geographic information system (GIS), remote sensing (RS), and spatial modeling technologies, the spatial reconstruction of geographic data has become the developmental trend. Data reconstruction using relevant parameters and factors can be used to build appropriate models to transfer data from one geometry to another [50]. It has been widely used in the spatial representation of geographic data such as population [51,52], economy [53,54], land use [55], meteorology [56], crops, and other types (such as PM2.5 [57]). Commonly used data reconstruction methods include multi-distance data fusion [58], ‘3S’ data spatial analysis [59], spectral analysis [60], and spatial interpolation [61,62].
The spatial reconstruction of geographic data provides technical support for studies investigating the impact of topography on population distribution and economic development at the grid scale. Although the spatial representation of population and economic data can be achieved using the existing spatial reconstruction methods, the results are limited by the accuracy and resolution of the basic data, and even the reconstruction accuracy is not high. For example, Zhang et al. reported the spatialization of population and economy in the mountainous area of western Henan with relative errors of population and primary industry spatialization of 0.66% and 1.39%, respectively. However, the relative error of secondary and tertiary industry spatialization was 5.75%, and the simulation accuracy was low [12]. Therefore, the current study on the impact of topographic factors on population and economy is mostly based on county units.

5. Conclusions

Based on 30 m DEM data, this study used ‘preliminary’ and ‘quadratic’ mean change-point analysis to determine the optimal statistical unit, followed by extraction of topographic relief and analysis of spatial distribution. Combined with population and economic data, our study also quantified the impact of topographic relief on population distribution and economic development at the county scale, compared with the impact of slope and elevation. The conclusions are as follows:
(1) The topographic relief in the southern Anhui mountainous area generally presents a high spatial pattern in the south and a low spatial pattern in the north. The landforms are dominated by medium relief (200–500 m), followed by small relief (70–200 m), flat (0–30 m), and slight relief (30–70 m), with large relief (≥500 m) contributing the least. The flat areas are mainly distributed in the middle and lower reaches of the Yangtze River plain in the northern region of the study area, while the medium and large reliefs are mainly distributed in the southern region, which together form a complete mountain.
(2) The impact of topographic relief on population and economy is slightly stronger than that of slope and elevation. The fitting degrees of 0.787 and 0.657 with population density and economic density indicate that topographic relief has a stronger impact on population distribution than on economic development. The impact of topographic relief on primary industries is stronger than on secondary and tertiary industries. At the same time, topographic relief shows a strong positive correlation with slope and elevation and has a greater correlation with slope.
(3) In the southern Anhui mountainous area, 72.35% of the population and 76.72% of the GDP are distributed in the area with a topographic relief of 155 m or less, while the land area only accounts for 43.93%. The area with topographic relief of more than 245 m constitutes 28.76%, but is inhabited by only 10.69% of population which contributes to only 8.34% of the GDP. Population distribution and economic development are obviously concentrated in the area with low topographic relief. However, the basic conditions of industrial development in high topographic relief areas are poor, and the economic and population carrying capacity per unit land area is limited. Compared with counties with better geographical conditions, it is difficult to attract investment or generate economic activities, resulting in slow regional economic development. In the future, the government should formulate targeted poverty alleviation policies according to regional characteristics, focus on increasing labor skills training, comprehensively stimulating the inherent strengths of the working population under the program ‘supporting both fight and wisdom’, take multiple measures to increase the income, and improve the regional economic level.
Based on county units, this study analyzed the spatial distribution of topographic relief and its impact on population and economy in the southern Anhui mountainous area. It compared and analyzed the impact of other topographic factors, which highlighted the significant role of topographic relief. It reveals the specificity and complexity of the spatial pattern of population and economy in the transitional zone from mountain to plains. However, statistical data based on county units often masks the spatial differences within administrative units, resulting in uncertainty. Meanwhile, the extraction of topographic relief is scale dependent, and this study only used DEM data with a resolution of 30 m, which resulted in differences and variability in the results of topographic relief extracted. Studies investigating the effect of DEM data under different resolutions on topographic relief are needed, in order to extract DEM data with the best resolution. In addition, a spatial reconstruction model should be used for spatialization of population and economy based on multiple sources data to explore the impact of topographic relief on population and economy at the grid and county scales, for accurate analysis of the relationship between topographic relief and socio-economic data.

Author Contributions

Z.Y. designed this study. Y.H. collected and processed the data and drafted the manuscript under Z.Y.’s supervision and guidance. Z.Y. and Q.G. revised the manuscript. X.Y. and M.Z. directed the manuscript. All authors have read and agreed to the published version of the manuscript.

Funding

This research was funded by Anhui University of Science and Technology Doctoral Talent Introduction Foundation, grant number 201711936; National Natural Science Foundation of China, grant number 52274164; Anhui Province Science and Technology Major Science and Technology Project, grant number 202103a05020026; Anhui Provincial Key Research and Development Program, grant number 202104a07020014; Anhui Provincial Natural Science Foundation, grant number 2208085MD88.

Institutional Review Board Statement

Not applicable.

Informed Consent Statement

Not applicable.

Data Availability Statement

Not applicable.

Conflicts of Interest

The authors declare no conflict of interest.

Appendix A

Table A1. Population and economic statistics of county units in 2020.
No.County NameArea Population Density Economic Density Primary Industry Density Secondary Industry Density Tertiary Industry Density
km2Person/km2106 Yuan/km2
1Tunxi194.13 1500.03 105.52 2.76 30.22 72.54
2Huangshan1750.70 83.91 6.83 0.58 2.06 4.19
3Huizhou425.98 225.83 20.19 1.06 10.01 9.13
4Guichi2512.93 244.85 14.09 1.45 6.12 6.52
5Fanchang571.96 426.43 54.62 2.16 30.95 21.50
6Xuanzhou2632.08 294.18 16.57 1.81 6.40 8.37
7Ningguo2427.52 159.88 15.84 1.06 9.18 5.60
8Guangde2110.95 236.43 15.62 1.26 7.44 6.92
9Huashan178.55 2525.93 235.41 0.94 71.96 162.51
10Yushan173.55 2051.32 130.03 1.41 35.51 93.12
11Bowang368.72 429.86 35.77 2.54 17.86 15.38
12Tongguan133.33 3381.94 235.81 0.38 82.28 153.23
13Jiaoqu555.46 295.61 24.63 2.05 12.04 10.53
14Yi’an805.83 282.32 19.71 1.80 8.26 9.65
15Jinghu115.99 4126.97 574.70 2.29 89.67 482.74
16Yijiang516.80 817.72 90.86 0.68 50.52 39.66
17 Jiujiang883.33 611.89 57.19 2.36 23.28 31.55
18 Wanzhi646.40 532.17 51.05 3.49 26.53 21.04
19Wuwei2005.86 407.81 25.48 2.80 12.37 10.31
20Shexian *2117.49 171.43 9.45 0.94 3.42 5.09
21Xiuning *2113.23 100.08 5.50 0.72 2.17 2.62
22Yixian *855.72 89.05 5.33 0.52 1.76 3.05
23Qimen *2211.52 65.84 3.51 0.34 1.10 2.07
24Dongzhi *3263.23 122.09 6.48 1.01 2.73 2.74
25Shitai *1428.48 56.42 1.98 0.36 0.44 1.18
26Qingyang *1193.43 208.22 11.93 1.12 4.97 5.84
27Nanling *1266.66 340.34 22.22 2.84 9.45 9.92
28Jingxian *2035.24 135.51 6.40 0.98 2.48 2.94
29Jixi *1111.74 124.85 7.94 1.29 3.56 3.10
30Jingde *903.25 124.44 6.08 0.94 2.48 2.67
31Langxi *1101.90 282.69 16.66 1.75 8.87 6.05
32Dangtu *977.79 457.15 47.40 3.52 24.05 19.84
33Hexian *1316.76 312.05 20.26 2.15 7.37 10.74
34Hanshan *1034.21 325.47 19.75 2.23 7.65 9.87
35Zongyang *1488.38 315.17 11.30 2.02 2.78 6.50
Note: * Represents general counties.

References

  1. Yu, H.; Luo, Y.; Liu, S.Q.; Wang, Y.; Yang, Y. The influences of topographic relief on spatial distribution of mountain settlements in Three Gorges Area. Environ. Earth Sci. 2015, 74, 4335–4344. [Google Scholar]
  2. Fang, Y.P.; Ying, B. Spatial distribution of mountainous regions and classification of economic development in China. J. Mt. Sci. 2016, 13, 1120–1138. [Google Scholar] [CrossRef]
  3. Li, Y.J.; Yang, X.H.; Cai, H.Y.; Xiao, L.L.; Xu, X.L.; Liu, L. Topographical characteristics of agricultural potential productivity during cropland transformation in China. Sustainability 2015, 7, 96–110. [Google Scholar] [CrossRef] [Green Version]
  4. Dai, E.F.; Wang, Y.H.; Ma, L.; Yin, L.; Wu, Z. ‘Urban-Rural’ Gradient Analysis of Landscape Changes around Cities in Mountainous Regions: A Case Study of the Hengduan Mountain Region in Southwest China. Sustainability 2018, 10, 1019. [Google Scholar] [CrossRef] [Green Version]
  5. Adam, A.; Roksana, Z.; Grzegorz, W. Changes in the topography of Krakow city centre, Poland, during the last millennium. J. Maps 2021, 17, 186–193. [Google Scholar]
  6. Ajczak, A.; Zarychta, R.; Waek, G. Quantitative assessment of changes in topography of town caused by human impact, Krakow city centre, southern Poland. Remote Sens. 2021, 13, 2286. [Google Scholar] [CrossRef]
  7. Ma, X.L.; Jin, Y.L. The characteristics and mechanism of land selection under Zhangjiajie tourism development. Areal Res. Dev. 2016, 35, 127–131, 180. [Google Scholar]
  8. Zhang, S.; Zhao, K.; Ji, S.; Guo, Y.; Wu, F.; Liu, J.; Xie, F. Evolution characteristics, eco-environmental response and influencing factors of production-living-ecological space in the Qinghai–Tibet Plateau. Land 2022, 11, 1020. [Google Scholar] [CrossRef]
  9. Meybeck, M.; Green, P.; Vörösmarty, C. A new typology for mountains and other relief classes. Mt. Res. Dev. 2001, 21, 34–45. [Google Scholar] [CrossRef] [Green Version]
  10. Feng, Z.M.; Zhang, D.; Yang, Y.Z. Relief degree of land surface in China at county level based on GIS and its correlation between population density and economic development. Jilin Univ. J. Soc. Sci. Edit. 2011, 51, 146–151. [Google Scholar]
  11. Feng, Z.M.; Tang, Y.; Yang, Y.Z.; Zhang, D. The relief degree of land surface in China and its correlation with population distribution. Acta Geogr. Sin. 2007, 62, 1073–1082. [Google Scholar]
  12. Zhang, J.J.; Zhu, W.B.; Zhu, L.Q.; Cui, Y.P.; He, S.S.; Ren, H. Topographical relief characteristics and its impact on population and economy: A case study of the mountainous area in western Henan, China. J. Geogr. Sci. 2019, 29, 598–612. [Google Scholar] [CrossRef] [Green Version]
  13. Zhang, J.J.; Li, Y.H.; Zhu, L.Q. Relief amplitude based on county units in west Henan mountain area and its correlation with distribution of population and economic activities. Areal Res. Dev. 2019, 38, 55–60. [Google Scholar]
  14. Zhang, J.C.; Zhou, W.Z. Spatial autocorrelation between topographic relief and population/economy in Sichuan Province. Bull. Soil Water Conserv. 2019, 39, 250–257. [Google Scholar]
  15. Chen, T.T.; Peng, L.; Liu, S.Q.; Wang, X.X.; Xu, D.D. Relationships of relief degree of topography with population and economy in Hengduan mountain area based on GIS. J. Univ. Chin. Acad. Sci. 2016, 33, 505–512. [Google Scholar]
  16. Xu, X.; Genovese, P.V.; Zhao, Y.; Liu, Y.; Woldesemayat, E.M.; Zoure, A.N. Geographical distribution characteristics of Ethnic-Minority Villages in Fujian and their relationship with topographic factors. Sustainability 2022, 14, 7727. [Google Scholar] [CrossRef]
  17. Liu, Y.S.; Li, J.T. Geographic detection and optimizing decision of the differentiation mechanism of rural poverty in China. Acta Geogr. Sin. 2017, 72, 161–173. [Google Scholar]
  18. Cheng, W.M.; Zhou, C.H. Methodology on hierarchical classification of multi-scale digital geomorphology. Prog. Geogr. 2014, 33, 23–33. [Google Scholar]
  19. Feng, Z.M.; Li, W.J.; Li, P.; Xiao, C.W. Relief degree of land surface and its geographical meanings in the Qinghai-Tibet Plateau, China. Acta Geogr. Sin. 2020, 75, 1359–1372. [Google Scholar]
  20. Fan, J.R.; Zhang, Z.Y.; Li, L.H. Mountain demarcation and mountainous area divisions of Sichuan Province. Geogr. Res. 2015, 34, 65–73. [Google Scholar]
  21. Prima, O.D.A.; Echigo, A.; Yokoyama, R.; Yoshida, T. Supervised landform classification of Northeast Honshu from DEM-derived thematic maps. Geomorphology 2006, 78, 373–386. [Google Scholar] [CrossRef]
  22. Liu, C.; Sun, W.W.; Wu, H.B. Determination of complexity factor and its relationship with accuracy of representation for DEM terrain. Geo-Spat. Inf. Sci. 2010, 13, 249–256. [Google Scholar] [CrossRef]
  23. Zevenbergen, L.W.; Thorne, C.R. Quantitative-analysis of land surface-topography. Earth Surf. Proc. Land. 1987, 12, 47–56. [Google Scholar] [CrossRef]
  24. Jiang, X.B. Preliminary study on computing the area of mountain regions in China based on geographic information system. J. Mt. Sci. 2008, 26, 129–136. [Google Scholar]
  25. Lang, L.L.; Cheng, W.M.; Zhu, Q.J.; Long, E. A comparative analysis of the multi-criteria DEM extracted relief—Taking Fujian low mountainous region as an example. Geo-Inf. Sci. 2007, 9, 1–6. [Google Scholar]
  26. Tang, G.A. Progress of DEM and digital terrain analysis in China. Acta Geogr. Sin. 2014, 69, 1305–1325. [Google Scholar]
  27. Zhong, J.; Lu, T. Optimal statistical unit for relief amplitude in Southwestern China. Bull. Soil Water Conserv. 2018, 38, 175–181, 186. [Google Scholar]
  28. Zhao, B.B.; Cheng, Y.F.; Ding, S.J.; Liu, H.Q. Statistical unit of relief amplitude in China based on SRTM-DEM. J. Hydraul. Eng. 2015, 46, 284–290. [Google Scholar]
  29. Chen, X.X.; Chang, Q.R.; Bi, R.T.; Liu, Z.C.; Zhang, X.J. Comparison study on the best statistical unit algorithms of relief amplitude. Res. Soil Water Conserv. 2018, 25, 52–56. [Google Scholar]
  30. Tu, H.; Liu, Z.D. Demonstrating on optimum statistic unit of relief amplitude in China. J. Hubei Univ. (Nat. Sci.) 1990, 12, 266–271. [Google Scholar]
  31. Liu, Z.D.; Tu, H.M. Study on statistical unit of relief amplitude in China. Trop. Geo. 1989, 9, 31–38. [Google Scholar]
  32. Wang, Z.H.; Hu, Z.W.; Zhao, W.J.; Gong, H.L.; Deng, J.X.; Guo, Q.Z. Extracting optimum statistical unit for relief degree of land surface with CUSUM algorithm. Sci. Surv. Mapp. 2014, 39, 59–64. [Google Scholar]
  33. Ning, T.; Cui, W.; Ma, X.Y. Analysis of factors affecting the extraction of relief amplitude by mean change-point method: Taking the Yellow River Basin in Shanxi as an example. Bull. Surv. Mapp. 2022, 2, 159–163. [Google Scholar]
  34. Liu, Y.; Zhao, T.; University, D.P. Method for extraction of relief amplitude of abandoned quarry based on change point method. Res. Soil Water Conserv. 2016, 23, 269–273. [Google Scholar]
  35. Han, H.H.; Gao, T.; Huan, Y.I.; Yang, M.; Yan, X.J.; Ren, G.L.; Yang, J.L. Extraction of relief amplitude based on change point method: A case study on the Tibetan Plateau. Sci. Geogr. Sin. 2012, 32, 101–104. [Google Scholar]
  36. Wang, L.; Tong, X.J. Analysis on relief amplitude based on change point method. Geogr. Geo-Inf. Sci. 2007, 23, 65–67. [Google Scholar]
  37. Zhang, X.R.; Dong, K. Neighborhood analysis-based calculation and analysis of multi-scales relief amplitude. Adv. Mater. Res. 2012, 468–471, 2086–2089. [Google Scholar] [CrossRef]
  38. Ma, Y.; Li, D.P.; Zhou, L.; Zhou, M.J.; Zhang, D.; Zhang, D.Q. Analysis on relationship between spatial distribution of population and relief degree of land surface in Changsha city. J. Nat. Sci. Hunan Normal. Univ. 2022. accepted. Available online: https://kns.cnki.net/kcms/detail/43.1542.n.20220324.1632.002.html (accessed on 23 September 2022).
  39. Chen, X.X.; Chang, Q.R.; Guo, B.Y.; Zhang, X.J. Analytical study of the relief amplitude in China based on SRTM DEM data. J. Basic Sci. Eng. 2013, 21, 670–678. [Google Scholar]
  40. Nan, X.; Li, A.N.; Jing, J.C. Calculation and verification of topography adaptive slide windows for the relief amplitude solution in mountain areas of China. Geogr. Geo-Inf. Sci. 2017, 33, 34–39. [Google Scholar]
  41. Cai, D.M.; Li, B.; Xu, W.S.; Zhang, P.C.; Hui, B. Relief degree of land surface in Hubei Province studied based on ASTERGDEM data and its correlations with population density and economic development. Bull. Soil Water Conserv. 2017, 37, 231–234, 240. [Google Scholar]
  42. Yu, H.Y.; Yang, X.Z.; Yang, Z.; Zhou, Y. Spatial characteristics and influencing factors of population shrinkage and growth of counties in southern Anhui Province. J. Anhui Normal Univ. (Nat. Sci.) 2020, 43, 159–167. [Google Scholar]
  43. Rong, H.F.; Tao, Z.M.; Liu, Q.; Xu, Y.; Cheng, H.F. Temporal and spatial evolution of the coupling coordination among tourism industry, urbanization, ecological environment in southern Anhui Province. Res. Soil Water Conserv. 2019, 26, 280–285. [Google Scholar]
  44. Deffontaines, B.; Lee, J.C.; Angelier, J.; Carvalho, J.; Rudant, J. New geomorphic data on the active Taiwan orogeny-a multisource approach. J. Geophys. Res. Sol. Ea. 1994, 99, 20243–20266. [Google Scholar] [CrossRef]
  45. Cheng, Y.X.; Zhang, F.S.; Wang, W.R.; Dong, B.L.; Cai, Y. Geomorphologic division and classification of Anhui Province. Geol. Anhui 1996, 6, 63–69. [Google Scholar]
  46. Notice of the National Bureau of Statistics on Amending the “Three Industries Division Regulations (2012)”. Available online: http://www.stats.gov.cn/tjgz/tzgb/201803/t20180327_1590432.html (accessed on 27 March 2022).
  47. National Bureau of Statistics. China’s Annual Statistical Bulletin for 2020. Available online: http://www.stats.gov.cn/tjsj/zxfb/202102/t20210227_1814154.html (accessed on 28 February 2022).
  48. Zhang, S.; Zha, X.C.; Liu, K.Y. Research on the influence of topographic relief on the spatial distribution pattern of population and economy in Hanzhong city. J. Southwest Univ. (Nat. Sci. Ed.) 2020, 42, 138–148. [Google Scholar]
  49. Xiao, C.W.; Liu, Y.; Li, P. Analysis of pattern changes of population distribution and economic development in Jiangxi Province based on relief degree of land surface. Bull. Soil. Water. Conserv. 2016, 36, 222–227. [Google Scholar]
  50. Xia, T.; Wu, W.J.; Wu, W.B.; Zhou, Q.B.; Yang, P. Research progress of geographic data by space reconstruction. Econ. Geogr. 2020, 40, 47–55, 94. [Google Scholar]
  51. Fang, Z.D.; Liang, L.M.; Deng, X.Z. Spatialization model of population based on dataset of land use and land cover change in China. Chin. Geogr. Sci. 2002, 12, 114–119. [Google Scholar]
  52. Qi, W.; Liu, S.H.; Gao, X.L.; Zhao, M.F. Modeling the spatial distribution of urban population during the daytime and at night based on land use: A case study in Beijing, China. J. Geogr. Sci. 2015, 25, 756–768. [Google Scholar] [CrossRef]
  53. Li, Y.L.; Cheng, G.; Yang, J.; Yuan, D.F. Refined spatial simulation of regional economy based on nighttime lighting data from remote sensing: A case study of Henan Province. Areal Res. Dev. 2020, 39, 41–47. [Google Scholar]
  54. Wu, J.S.; Wang, Z.; Li, W.F.; Peng, J. Exploring factors affecting the relationship between light consumption and GDP based on DMSP/OLS nighttime satellite image. Remote Sens. Environ. 2013, 134, 111–119. [Google Scholar] [CrossRef]
  55. Zhang, X.R.; Zhou, J.; Li, M.M. Analysis on spatial and temporal changes of regional habitat quality based on the spatial pattern reconstruction of land use. Acta Geogr. Sin. 2020, 75, 160–178. [Google Scholar]
  56. Dowsett, H.J.; Robinson, M.M.; Foley, K.M. Pliocene three-dimensional global ocean temperature reconstruction. Clim. Past 2009, 5, 769–783. [Google Scholar] [CrossRef] [Green Version]
  57. Gao, F.; Wang, Y.; Chen, Q.X.; Wang, Y.Q. PM2.5’s distribution simulation in Suzhou-Wuxi-Changzhou area based on GIS. Geospat. Inf. 2015, 13, 103–107. [Google Scholar]
  58. Guo, Y.C.; Huang, J.C.; Lin, H.X. Spatialization of China’s population data based on multisource data. Remote Sens. Technol. Appl. 2020, 35, 219–232. [Google Scholar]
  59. Long, X.J.; Li, X.J. Mountain attitude classification indexes adjustment based on multi-source data in China. Sci. Geogr. Sin. 2017, 37, 1577–1584. [Google Scholar]
  60. Geng, L.Y.; Ma, M.G.; Wang, X.F.; Yu, W.P.; Jia, S.Z.; Wang, H.B. Comparison of eight techniques for reconstructing multi-satellite sensor time-series NDVI data sets in the Heihe River Basin, China. Remote Sens. 2014, 6, 2024–2049. [Google Scholar] [CrossRef] [Green Version]
  61. Wu, C.Y.; Mossa, J.; Mao, L.; Almulla, M. Comparison of different spatial interpolation methods for historical hydrographic data of the lowermost Mississippi River. Ann. GIS 2019, 25, 133–151. [Google Scholar] [CrossRef]
  62. Romaric, E.O.; Abimbola, Y.S.; Mary, B.O. Assessment of ordinary Kriging and inverse distance weighting methods for modeling chromium and cadmium soil pollution in E-Waste sites in Douala, Cameroon. J. Health Pollut. 2020, 10, 200605. [Google Scholar]
Figure 1. Location and administrative division of the study area.
Sustainability 14 14332 g001
Figure 2. DEM of the study area.
Sustainability 14 14332 g002
Figure 3. Study framework diagram.
Sustainability 14 14332 g003
Figure 4. Schematic diagram of the moving window analysis (3 × 3).
Sustainability 14 14332 g004
Figure 5. Comparison of logarithmic and power function fittings for average topographic relief.
Sustainability 14 14332 g005
Figure 6. S − Si calculated by the preliminary (a) and quadratic (b) mean change-point analysis method.
Sustainability 14 14332 g006
Figure 7. Types of landforms.
Sustainability 14 14332 g007
Figure 8. Types of mountainous counties.
Sustainability 14 14332 g008
Figure 9. Relationship between topographic relief, slope, and elevation, and population density and economic density.
Sustainability 14 14332 g009
Figure 10. Curve of cumulative frequency of land area, population, and GDP with topographic relief.
Sustainability 14 14332 g010
Figure 11. Relationship between production value density and ratio of three industries in general counties, showing (a,b) county-level cities and municipal districts and (c,d) topographic relief.
Sustainability 14 14332 g011
Figure 12. Variations in topographic relief along with slope and elevation showing (a) correlation analysis between topographic relief, (b) slope, and (c) elevation.
Sustainability 14 14332 g012
Table 1. Relationship between window size and topographic relief.
Window SizeWindow Area
(km2)
Average Topographic
Relief (m)
Window SizeWindow Area
(km2)
Average Topographic
Relief (m)
3 × 30.0081123.18 35 × 351.1025467.57
5 × 50.0225161.87 37 × 371.2321475.55
7 × 70.0441192.52 39 × 391.3689484.03
9 × 90.0729224.68 41 × 411.5129491.50
11 × 110.1089249.51 43 × 431.6641498.01
13 × 130.1521266.50 45 × 451.8225510.58
15 × 150.2025278.03 47 × 471.9881525.27
17 × 170.2601306.05 49 × 492.1609542.43
19 × 190.3249332.58 51 × 512.3409554.88
21 × 210.3969358.07 53 × 532.5281561.88
23 × 230.4761386.07 55 × 552.7225571.34
25 × 250.5625415.04 57 × 572.9241576.77
27 × 270.6561433.59 59 × 593.1329585.09
29 × 290.7569446.51 61 × 613.3489594.11
31 × 310.8649453.05 63 × 633.5721605.52
33 × 330.9801461.53
Table 2. Various landform types.
Landform TypesNumber of Pixels (Piece)Partition Area (km2)Partition Area Ratio (%)
Flat (0–30 m)9,985,3158986.78 20.69
Slight relief (30–70 m)8,681,6647813.5017.99
Small relief (70–200 m)11,487,74810,338.9723.81
Medium relief (200–500 m)16,667,26215,000.54 34.54
Large relief (≥500 m)1,432,5511289.302.97
Total48,254,540 43,429.09100.00
Table 3. Population, economy, and land area in different mountainous counties.
Topographic Relief (m)PopulationEconomyLandPopulation Density (Person/km2)Economic Density (104 Yuan/km2)
Total
(104 Person)
Proportion
(%)
Total
(108 Yuan)
Proportion (%)Area (km2)Proportion (%)
≤80671.7656.345347.2061.0412,402.3628.56541.644311.44
80–115140.9911.821044.2111.924565.3310.51308.832287.26
115–15549.914.19329.643.762110.954.86236.431561.57
155–195101.378.50565.466.455776.1613.30175.50978.95
195–245100.868.46743.258.486082.1714.00165.831222.01
≥245127.5010.69730.928.3412,492.1328.76102.06585.10
Publisher’s Note: MDPI stays neutral with regard to jurisdictional claims in published maps and institutional affiliations.