Article

Requirements for the Preliminary Design of Innovative Temporary Edge Protection Systems (TEPS) for Construction Works

by
Félix Yamuza-González
,
Andrés Pastor-Fernández
,
Alberto Cerezo-Narváez
* and
Manuel Otero-Mateo
School of Engineering, University of Cadiz, 11519 Puerto Real, Spain
*
Author to whom correspondence should be addressed.
Sustainability 2022, 14(21), 14285; https://doi.org/10.3390/su142114285
Submission received: 26 September 2022 / Revised: 23 October 2022 / Accepted: 28 October 2022 / Published: 1 November 2022

Abstract

:
At present, it is striking that a large percentage of occupational accidents in the construction sector are still caused by falls from height. Therefore, curbing the severe personal, social and economic consequences of these events is not only a commitment but an obligation for all stakeholders in the construction sector. After a review of current fall protection systems on construction sites, the purpose of this study is to establish the preliminary requirements for the design, development and prototyping of a new system which can be used as an auxiliary means to prevent occupational accidents in the construction sector caused by fall hazards at height. Based on the design science research (DSR) methodology, this paper tests the capability of alternative materials (metals, plastics and composites) to withstand the loads required by the regulatory standard UNE-EN 13374:2013+A1:2019 and looks at the improvements they can offer. The results obtained enable new metals and composite materials to be put forward, based on their suitability to the parameters of the risks of falling from height, ensuring that the greatest number of potential situations are addressed. Then, the needs to be satisfied and requirements to be met are listed, prioritised and considered for new temporary edge protection systems (TEPS). Next, the attributes that increase user satisfaction and/or reduce user dissatisfaction are filtered by means of a Kano model, which is applied thanks to the responses of construction designers, coordinators and supervisors. Once these questions are solved, an analytic hierarchy process (AHP) is performed by a focus group, weighing the Kano contributions and ranking the materials to be selected for the preliminary design of innovative TEPS for construction works. After considering safety, ergonomics, adaptability, sustainability, efficiency, manufacturability and flexibility criteria, the basis for the design of a new temporary edge protection system is established.

1. Introduction

Construction has been essential for human survival throughout history. The archaeological, architectural and civil remains that exist all over the world give rise to the unsettling question of the working conditions that the labourers endured. We must ask ourselves, from what moment did humanity opt for the defence of life in the workplace [1]? Some renowned authors have ventured to formulate their own theories, fixing that moment to the publication of a text by Strabo [2]. However, even when taking into account the evolution of technical means and the specialisation of today’s workforce, safety conditions may not differ very much from those that existed in the past [3]. Any theory about the evolution of work and its conditions points to the fact that the concept of “safety” must have had different meanings throughout history. However, despite these changing conditions and the context of each era, construction has not slowed down.
Among the most popular topics in construction safety, accidents resulting from falls from height have garnered the attention of researchers over recent years [4], with numerous studies reflecting concern in this field [5,6,7]. Falls from height are the most frequent cause of injuries and deaths. The most common sources are: scaffolding or platforms without railings, workers not wearing safety harnesses correctly, unsound roofs, deficiencies in maintenance, the placement and securing of ladders, etc. These accidents have enormous consequences for people, business owners and society. Priority should, therefore, be given to measures that eliminate or reduce the risk at source and provide collective protection [8] over individual protection [9].
Domino theory [10], pioneering in the study of the causes of accidents (context, human error, unsafe conditions, accident, injury), indicates that 88% of accidents are caused by unsafe acts or behaviours, 10% are due to unsafe working conditions and the remaining 2% stem from unforeseeable causes. In this regard, several authors have pointed out that 90% of work accidents occur as a result of unsafe acts on the part of workers [11,12,13], confirming hypotheses put forward 60 years ago. However, other authors added that unsafe behaviours carried out by workers persist because they are often naturally reinforced [14]. For example, it may be difficult to properly use collective protection equipment with the auxiliary means available for carrying out tasks, as in the case of the outer railings on scaffolding trestles (sawhorses) [15].
Many unsafe behaviours of workers are reinforced positively (increased productivity) or negatively (reduced time and effort), which contributes to the increased likelihood that they will perform these same behaviours again in similar circumstances. In this sense, it is clear why operators engage in unsafe work behaviours [16], and the issue is simultaneously tackled by means of accident causality theories and human error theories [17]. Although workers are aware of the dangers associated with not wearing a safety harness or not having protective equipment, many forget or purposely do not use them when working at heights [18], so falls from height remain the main contributors to injuries and deaths on construction sites.
When analysing the time involved in assembling a security system for very small or one-off jobs, the arguments are the same, since there are no protection elements on the market that adapt to the specific circumstances of these small jobs, which, in many cases, only last a few hours or even minutes. Likewise, there are frequent complaints from operators that protective equipment, specifically, personal protective equipment (PPE), tends to hinder their movements, restricting their freedom and preventing or complicating the performance of specific tasks that take up very little time. This context shows that, despite having collective and/or individual protections, these complaints are not handled adequately. Therefore, to avoid this type of accident, and regardless of the behaviour related to the human factor, it is necessary to look for new methods that contribute to improving safety and health and reducing or eliminating subjectivity in production processes [19].
One of the most important measures to prevent falls from height on construction sites is the use of temporary edge protection systems (TEPS) [20,21]. Although studies of TEPS have been carried out from the point of view of the legal regulatory framework, based on compliance with a series of structural requirements [22], on the identification and evaluation of new needs, on innovation [23] or on the incorporation of new solutions and/or materials [24], no studies have been found that bring together all these considerations to address the innovative design, development and prototyping of new TEPS.
The rest of this paper is structured as follows. Section 2 presents the purpose of the research. Section 3 describes the methods selected to be followed based on the design science research (DSR) methodology (analysis of the current scenario by literature review, study of the behaviour of current collective protections by finite-element calculation, ranking of the attributes to be considered using the Kano model and proposal for the requirements of a preliminary design by means of an analytic hierarchy process (AHP)). Section 4 presents the results obtained. Section 5 discusses the findings. Finally, in Section 6, the main conclusions are presented.

2. Objectives

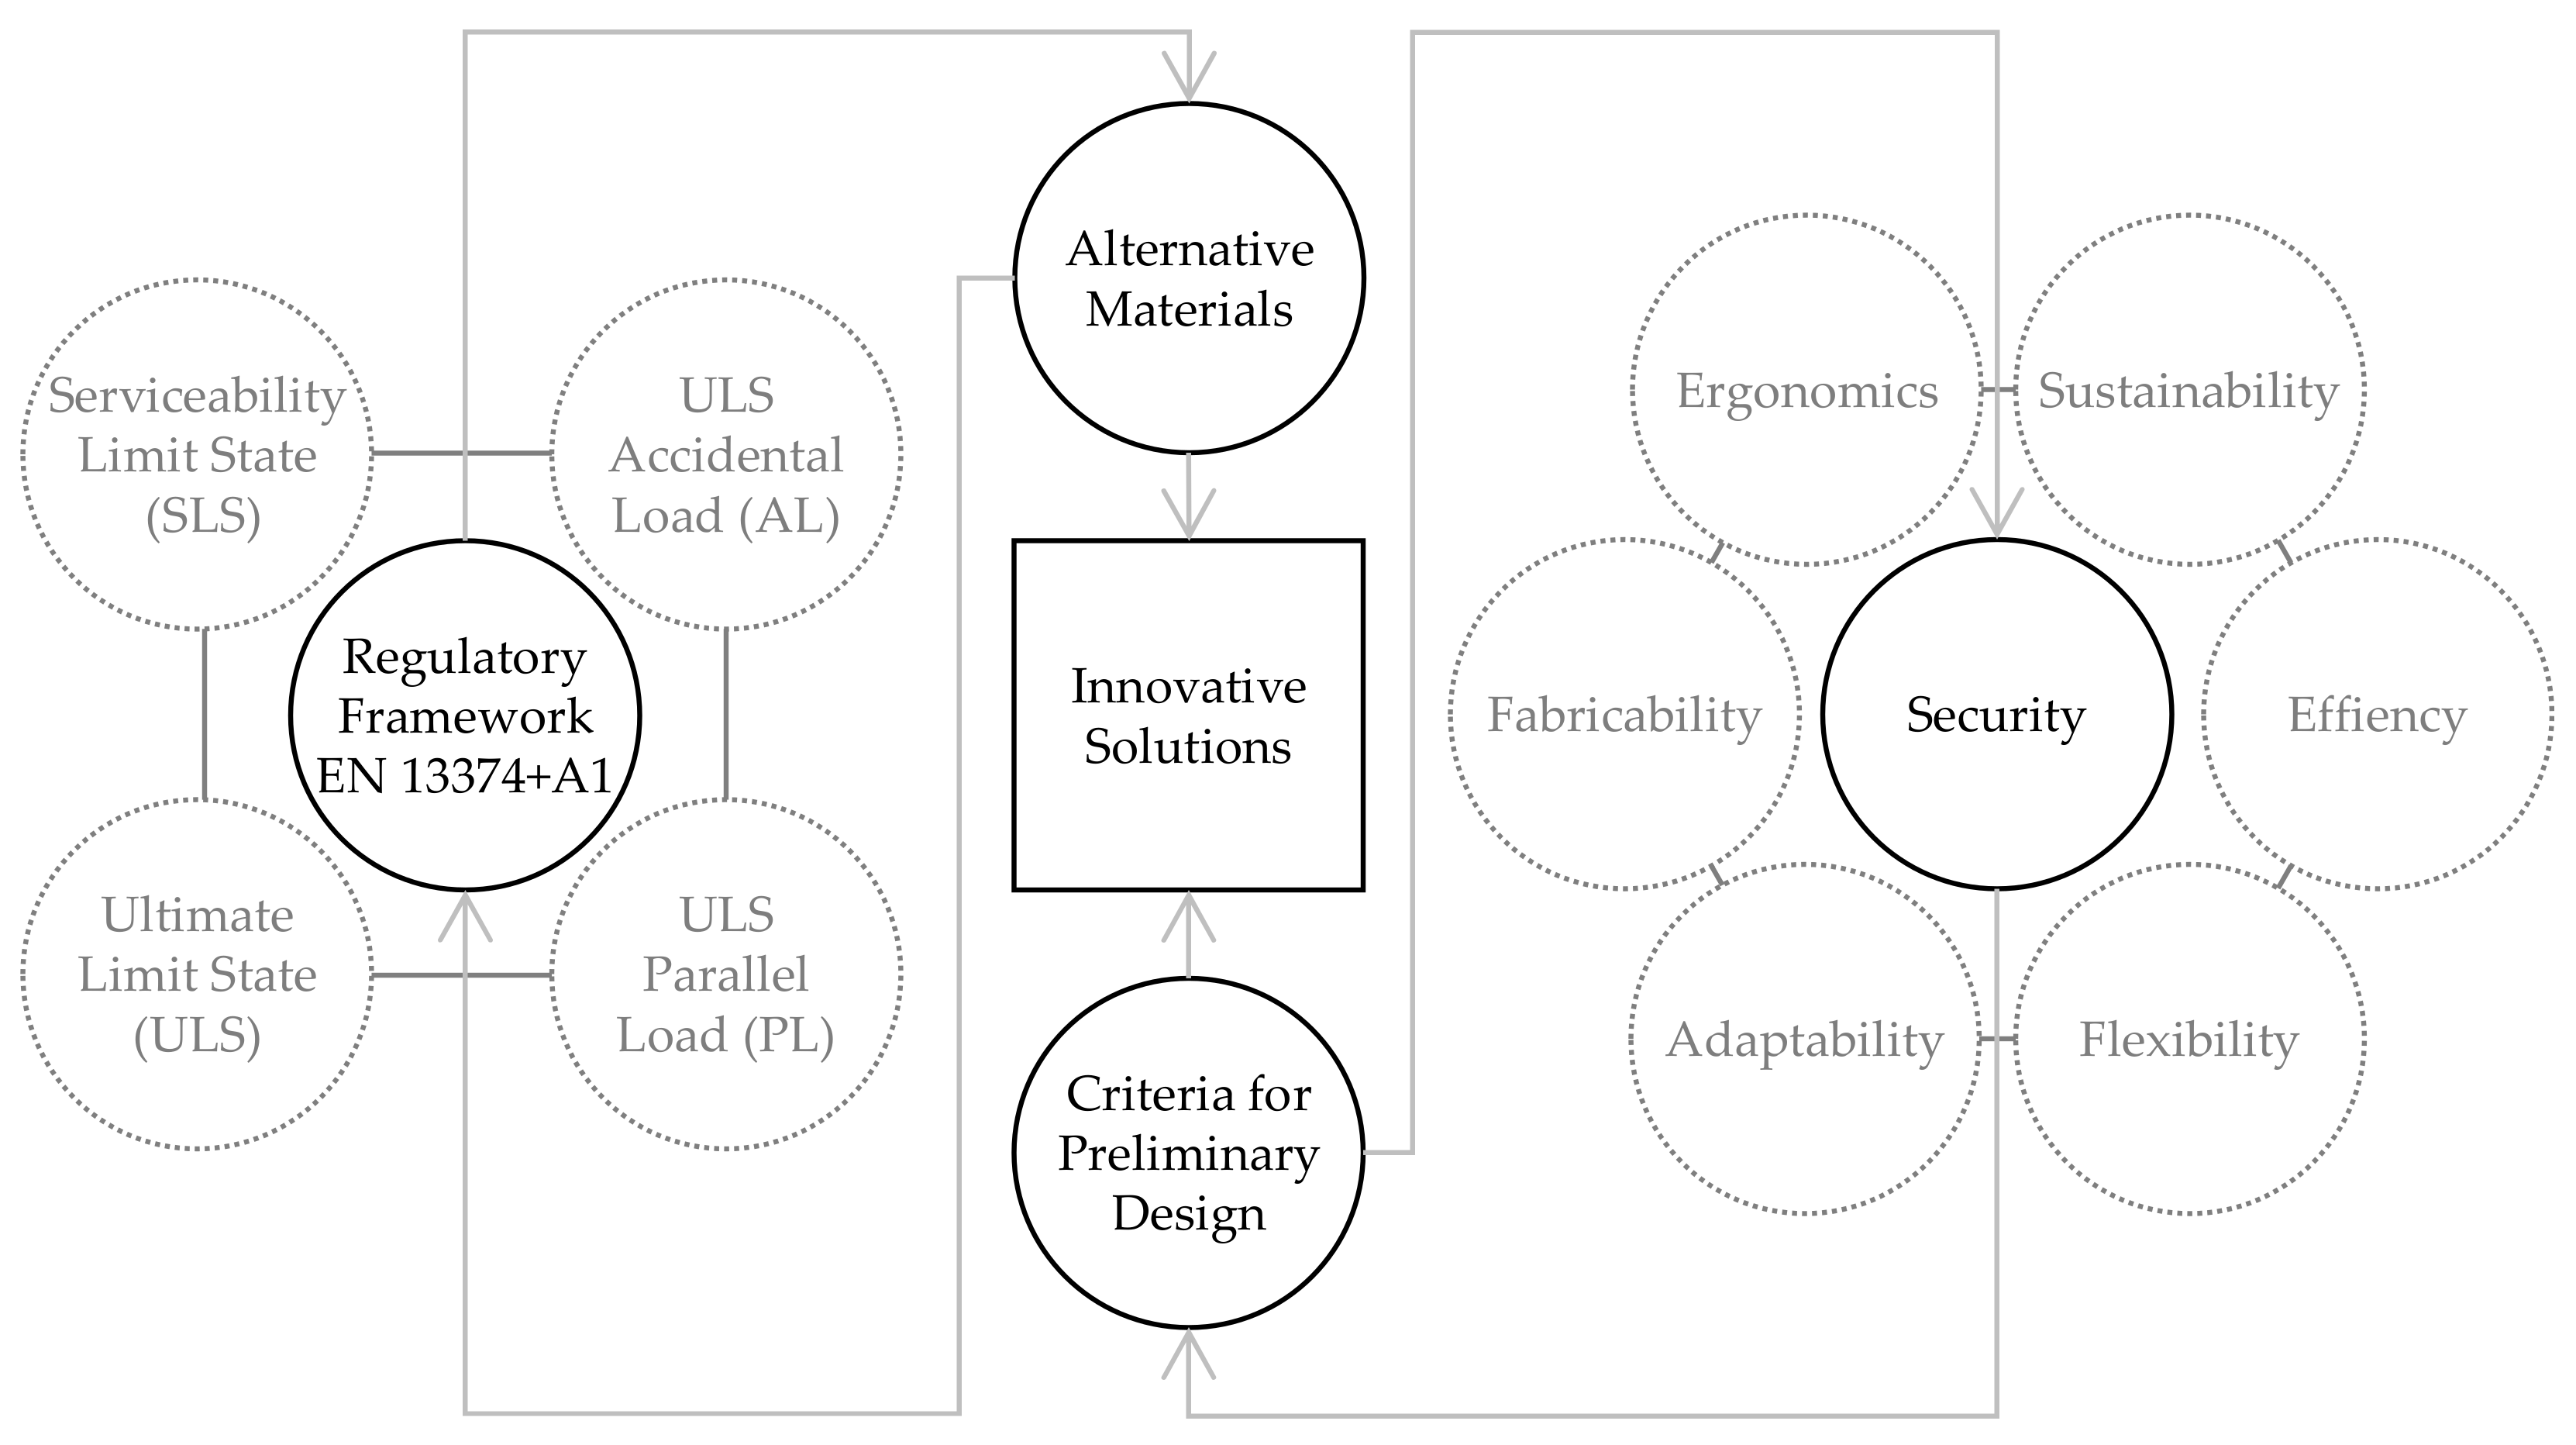
The objective of this study is to provide the basis of the preliminary design for the subsequent development and prototyping of new collective protection systems, focusing on adapting them to the parameters of the risk of falling from height and securing the greatest number of situations possible. As summarised in Figure 1, the new TEPS must be manufactured at a reasonable cost, ergonomic so that they are easy to assemble/disassemble, adaptable so that they can be used as auxiliary means in conjunction with other systems, flexible so that they can be used in unique situations, sustainable so that they have an extended service life, efficient to lighten the systems and safe to avoid occupational accidents due to the risk of falls from height, among other things. For this reason, the choice of materials used for their manufacture is crucial in order to incorporate all these characteristics. Therefore, this study aims to analyse the technical characteristics of the current systems manufactured with the current materials compared to a series of alternative materials and to subsequently propose the preliminary design of a new collective protection system capable of satisfying the set of needs detected and requirements listed, including safety as a key factor for their use. These objectives are aligned with Sustainable Development Goals 8 (Decent Work and Economic Growth) and 9 (Industry, Innovation and Infrastructure).

3. Methodology

The methodology followed is the DSR methodology, the objective of which is to develop innovative solutions to solve real problems while aiming to advance theoretical knowledge [25] by generating knowledge through the development of an innovative tool that solves a practical problem [26]. DSR starts with a descriptive phase for a deep understanding of the problem, and this gives way to a prescriptive phase [27]. DSR is a systematic yet flexible methodology aimed at improving engineering practices through iterative analysis, design, development and implementation based on collaboration between researchers and practitioners in real-world environments and leading to context-sensitive design theories and principles [28].
The practical problem addressed by this study is the selection of a series of alternative materials that can be used to lay the foundations for an innovative design of TEPS. It also considers the needs to be satisfied and the requirements to be met, listed, prioritised and hierarchised. This methodology has been successfully tested in the field [29,30]. This study, based on a review of the literature published on the subject and information obtained in the field (thanks to the authors’ professional experience in this field), analyses the needs and requirements that TEPS must meet through the Kano model [31], successfully tested in this field [32,33], in order to understand the reasons why workers in the construction sector fall from heights. Different materials are studied for the preliminary design of TEPS in relation to safety, efficiency and flexibility during their design and use as a minimum. The AHP tool [34,35] is used to hierarchise these alternative materials and recommend possible changes to accommodate aspects of sustainability, ergonomics, adaptability and manufacturability, among others. This combination of the Kano model with the AHP tool has been successfully tested both in product design in general [36,37] and specifically in terms of safety [38,39].
The Kano model is used to measure the effectiveness of products based on the identification of their requirements. The method classifies design preferences into five categories using a questionnaire that includes functional and dysfunctional questions. On the one hand, it considers the level of performance of the product and, on the other hand, the level of satisfaction of customers and/or users, which makes it possible to evaluate requirements by classifying them into 5 groups: mandatory, attractive, one dimensional, indifferent and reverse [40]. In this context, a requirement is considered mandatory if its absence causes dissatisfaction, even if its presence is taken for granted, and, therefore, its inclusion is not especially valued, while it is called attractive if customers and/or users value it when it is present, even if they do not notice its absence. Likewise, a requirement is called one dimensional if it increases satisfaction in proportion to the increase in its functionality and indifferent if customers and/or users are not interested or, secondly, if it has neutral and/or low impact. Finally, if the requirement undermines the functionality of the product and/or causes dissatisfaction, it is called reverse [41].
The AHP tool responds to the general approach of multi-criteria analysis for decision making. It is a discrete, multi-criteria decision-making method in which the problem to be solved is modelled from a set of alternatives and a series of decision criteria that, at times, can be conflicting [42]. The AHP is applied by building hierarchical structures in which the first hierarchical level consists of establishing an objective, the next hierarchical level, the decision criteria and, finally, the alternatives. For hierarchical levels, pairwise comparisons are made, either by assigning an absolute scale numerical value from 1 to 9 or by assigning a natural measurement scale value [43]. These comparisons result in dominance matrices. To apply AHP, it is necessary to analyse the alternatives that respond to the previously defined objectives. Next, the decision criteria must be selected. Then, those criteria are considered. Subsequently, the alternatives must be evaluated (after the level of satisfaction of each criterion). Once these steps have been taken, we proceed to the analytical resolution of the problem. Finally, the sensitivity of the decision is checked to measure the robustness of the proposal. This communication, which covers the first two phases, is part of the following framework:
  • Phase 1. The first phase consists of the following stages:
    1.
    Analysis of the problem of occupational accidents in the construction sector, underlining the need to prevent falls from height;
    2.
    Description of current collective protection equipment, indicating dimensions, materials used, versatility and approximate assembly/disassembly time;
  • Phase 2. The second phase consists of the following stages:
    3.
    Study of the behaviour of the collective protection equipment available on the market made with different materials;
    4.
    Analysis of the attributes that must be added into the new collective protection equipment to be designed, valuing basic, desired and motivating qualities;
  • Phase 3. The third phase consists of the following stages:
    5.
    Hierarchisation of the attributes that must be incorporated into the new collective protection equipment to be designed;
    6.
    Proposal of alternative materials according to the requirements considered;
  • Phase 4. The fourth phase consists of the following stages:
    7.
    Preliminary design of TEPS, taking into account their geometric and dimensional definition in order to study their patentability or usefulness;
    8.
    Detailed design and development of TEPS, considering all the previous steps;
  • Phase 5. The fifth phase consists of the following stages:
    9.
    Prototyping TEPS, carrying out the corresponding laboratory tests to certify their technical suitability;
    10.
    Validation of solutions for their potential commercialisation, conducting market research surveys of users.

3.1. Analysis of the Problem of Occupational Accidents in the Construction Sector

The construction sector has a direct impact on a country’s economy and, therefore, plays an important role in its growth. However, on the other hand, it is a dangerous activity due to the high accident and death rates, as shown by alarming statistics [44]. On an international level, numerous research studies have reflected the high occupational accident rate caused by falls from height in the construction sector, exposing alarming rates of accidents and deaths, their costs and their causes [45,46,47,48]. In addition, fatal accidents frequently occur in building construction activities due to their inherently dangerous nature [49]. However, most accidents caused by falls from height happen because the risk of falling from relatively low heights is often underestimated. Therefore, a common factor in these accidents comes from the construction operators’ perception of the risk of falling since most fall accidents occur at elevations of less than 30 feet [20].
The Occupational Safety and Health Administration (OSHA) analysed 3496 deaths between 1985 and 1989 [50], showing that 33% of deaths were due to accidents caused by falls from height. Furthermore, OSHA concluded that deficiencies in protection equipment against falls from height also represent the highest number of claims, with injuries costing more than USD 5 trillion annually. These findings were confirmed by Cattledge et al. [51]. After that, Halabi et al. [52] listed 23,057 accidents recorded in the OSHA database in the years 2000–2020, stating that the proportion of accidents due to falls increased considerably and that the use of fall protection equipment had not improved. In Canada, the Canadian Centre for Occupational Health and Safety (CCOHS) also published that, of the 24,999 injuries caused in the construction sector between 1995 and 1998, 4676 were due to falling from height [53]. In addition, Winge and Albrechsen studied 176 accidents in the construction sector [54], which were investigated by the Norwegian Labour Inspection Authority in 2015, showing that many accidents could be explained by the lack of physical barrier elements, such as TEPS.
On the other hand, Zlatar et al. [55] analysed 114 cases of accidents due to falls from height from other research works, showing that, in 98% of the cases analysed, these were the result of inadequate or absent protection systems in the work procedures. Finally, the company XSPlatforms analysed the official information published in different countries on accidents caused by falls from height [56]:
  • In the United States and Canada, falls from height amount to 36.9% of total accidents in the construction sector, being the number 1 cause in this sector. In addition, 3 out of 5 cases occur from a distance equal to or less than 20 feet;
  • In France, accidents due to falls from height are the second leading cause of death at work, occupying the first position of occupational accidents in the construction sector (16%). In addition, within this sector they account for 30% of fatal accidents;
  • In the UK, accidents due to falls from height within the construction sector account for 45% of fatal accidents. In addition, these are the most common cause of death and account for 3 out of 10 serious injuries;
  • In Spain, falls from height are the most common cause of death in work accidents. Statistically, 1 in 20 accidents occurs as a result of a fall from height, half of these due to a fall from less than 3 m.
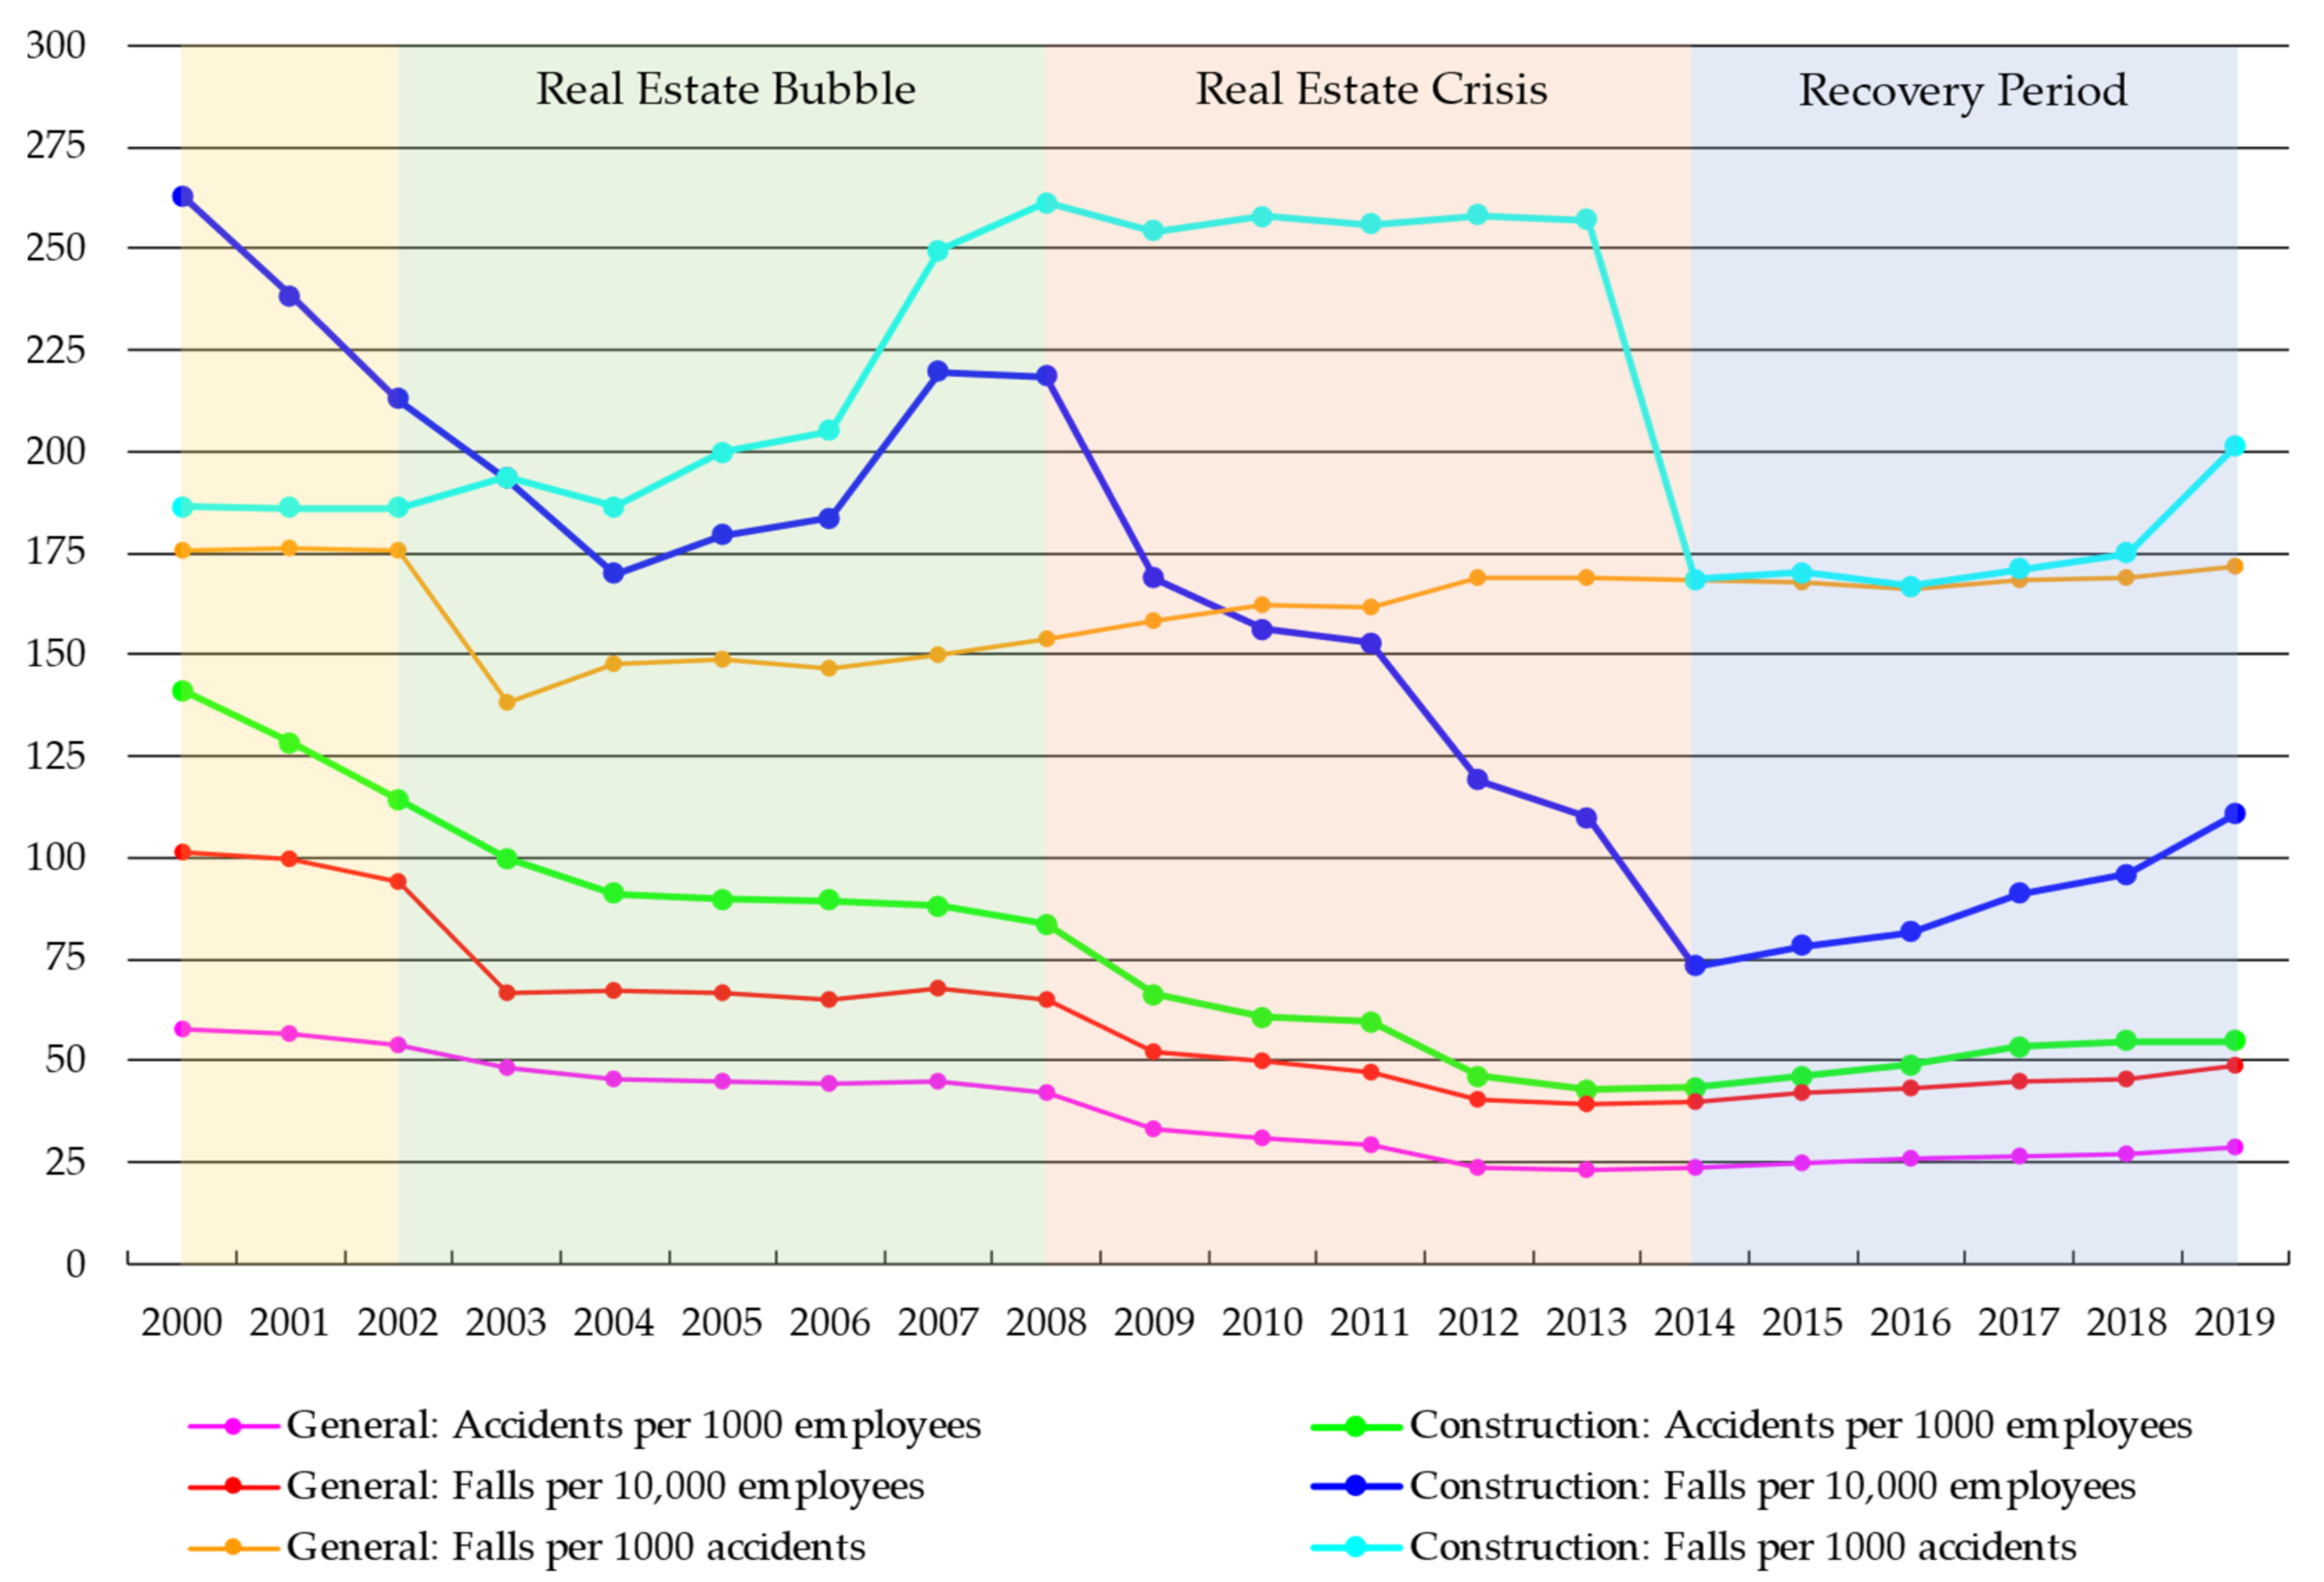
Table 1 shows data from 2000 to 2019 from the Spanish National Institute of Statistics (INE) on occupational accidents in Spain caused by accidents occurring at height put into the context of both the construction sector and all economic sectors (in general).
In absolute terms, if the data from the last 20 years are analysed, it can be deduced that, in relation to the employed population, which has risen by 22%, the number of accidents has fallen by 40% and the number of falls by 41%. However, in the construction sector, the number of building permits has fallen by 58%, while the number of people employed in the sector has fallen by 22%. Nevertheless, the number of accidents has fallen by 69% and the number of falls by 67%. In relative terms, as Figure 2 shows, a number of interesting conclusions can be drawn:
  • The number of accidents per thousand people employed has fallen by 51%, while, in the construction sector, it has fallen by 61%. However, this number per thousand in the construction sector is still double the number of accidents per thousand overall;
  • The number of falls per ten thousand people employed has fallen by 52%, while, in the construction sector, it has fallen by 58%. However, in the construction sector, this number is currently almost two and a half times that of the number per thousand overall. Note, also, that, over the last years of the real-estate bubble and subsequent crisis (2006–2012), this ratio tripled, confirming that, during those years, works were significantly less safe;
  • The number of falls per thousand accidents has fallen by barely 2%, while, in the construction sector, it has risen by 8%. In addition, in the construction sector, this number is the same as the number per thousand overall, although, over the last years of the real-estate bubble and subsequent crisis (2006–2012), this ratio doubled.
Figure 2. Accidents caused by falls from height in the construction sector and in all economic sectors (in general). Source: INE.
Sustainability 14 14285 g002
Advances in the field of occupational safety and health stem mainly from legislative progress [57]. In Spain, the minimum requirements for safety and health on construction sites are regulated by Royal Decree 1627/1997 [58], the implementation decree of the general law on the Prevention of Occupational Risks 31/1995 and the transposition of European Directive 92/57/EEC on minimum safety and health requirements for construction sites. However, the existence of this regulatory framework has not brought about a proportional decrease in occupational accidents, as can be seen in Figure 2. This is due to the increase in construction works during the years of the real-estate bubble, as well as the reduction in investment in safety and health in the subsequent years of crisis. In addition, there has also not been adequate technical contributions to enable the correct application of the standards.

3.2. Description of Temporary Edge Protection Systems (TEPS)

This section describes the characteristics, manufacturing materials used, dimensions, versatility and approximate assembly times of the most common TEPS in the construction sector in Spain.
  • Systems: There is a wide variety of collective protection systems available on the market for the construction sector, such as systems embedded in the concrete in plastic cartridges inserted into slabs, jaw-type posts tightened in concrete structures or fixed to metal profiles, clamp-type posts that can be fixed onto a wide range of slab edges, integrated safety systems used in the execution of formwork, telescopic vertical struts, V-type safety nets, etc. Likewise, within these systems, there are railings, nets, plinths and wire mesh which cover the gaps through which falls can occur, as well as anchoring systems, including flanges and uprights, with specific designs for their coupling;
  • Materials: The most commonly used material for the manufacture of railings and uprights is galvanised steel [59], although other types of material such as aluminium [60], wood [61] or high-density polyethylene (HDPE) [62] can also be found, among others.
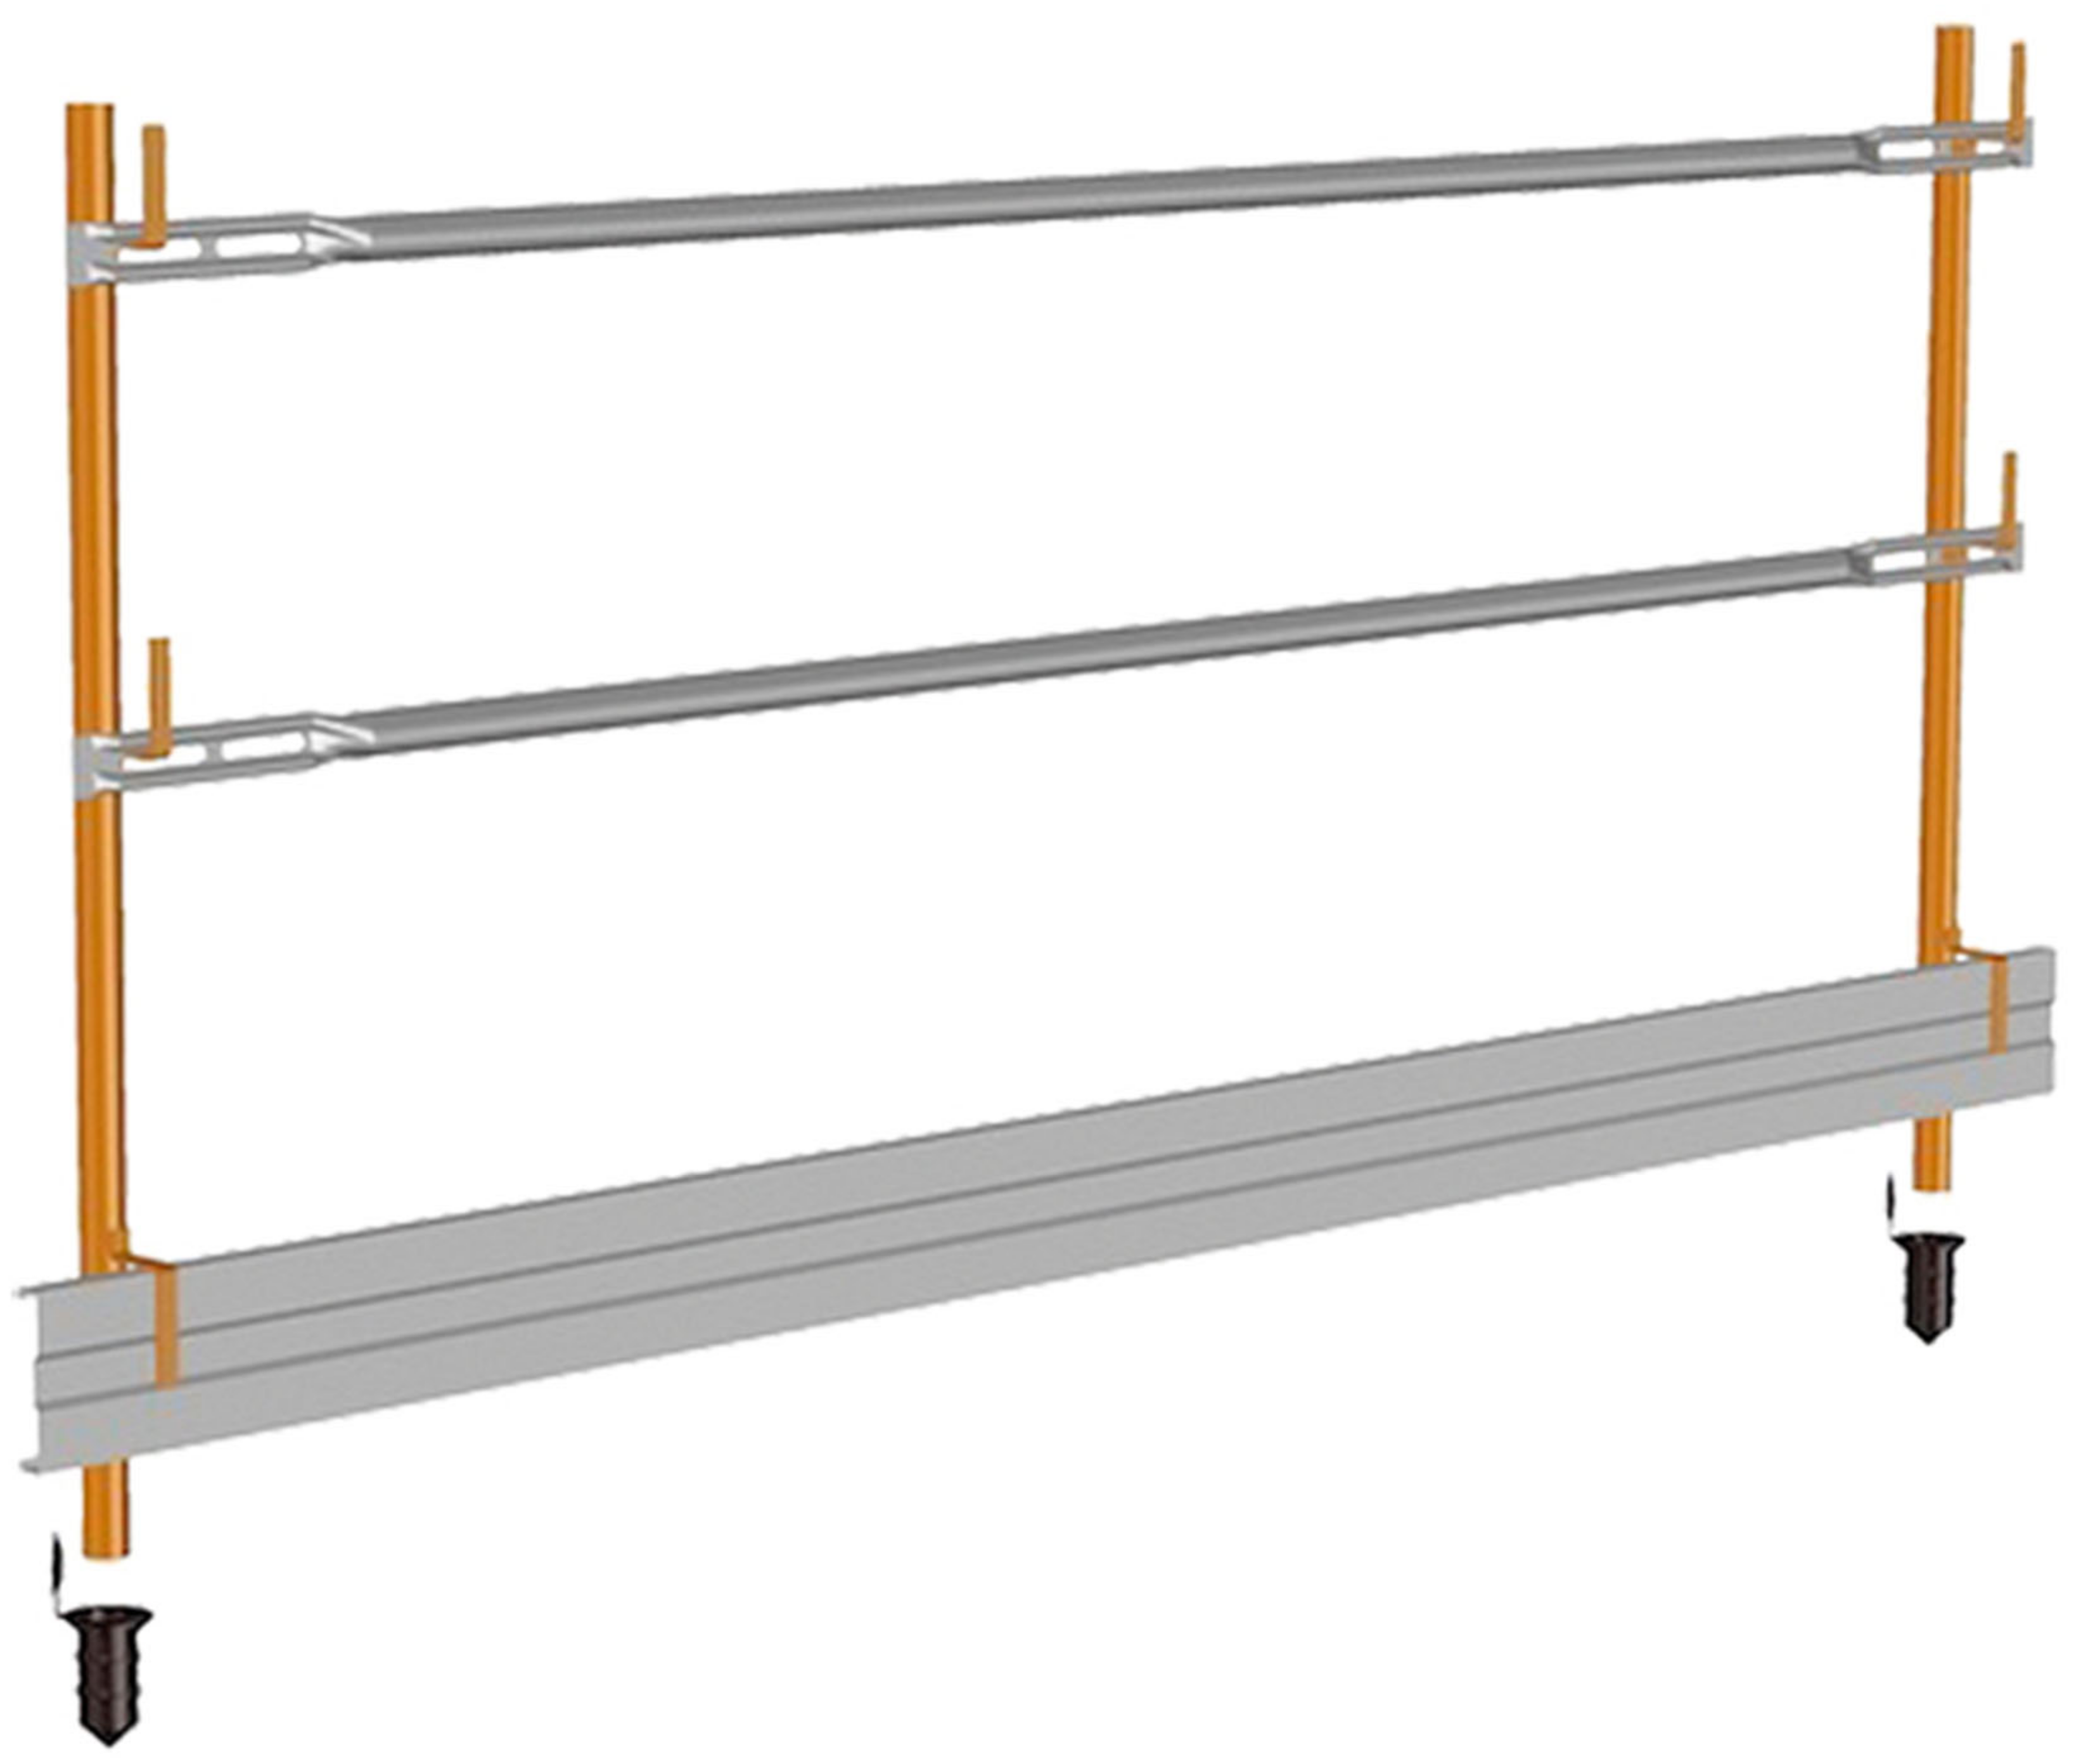
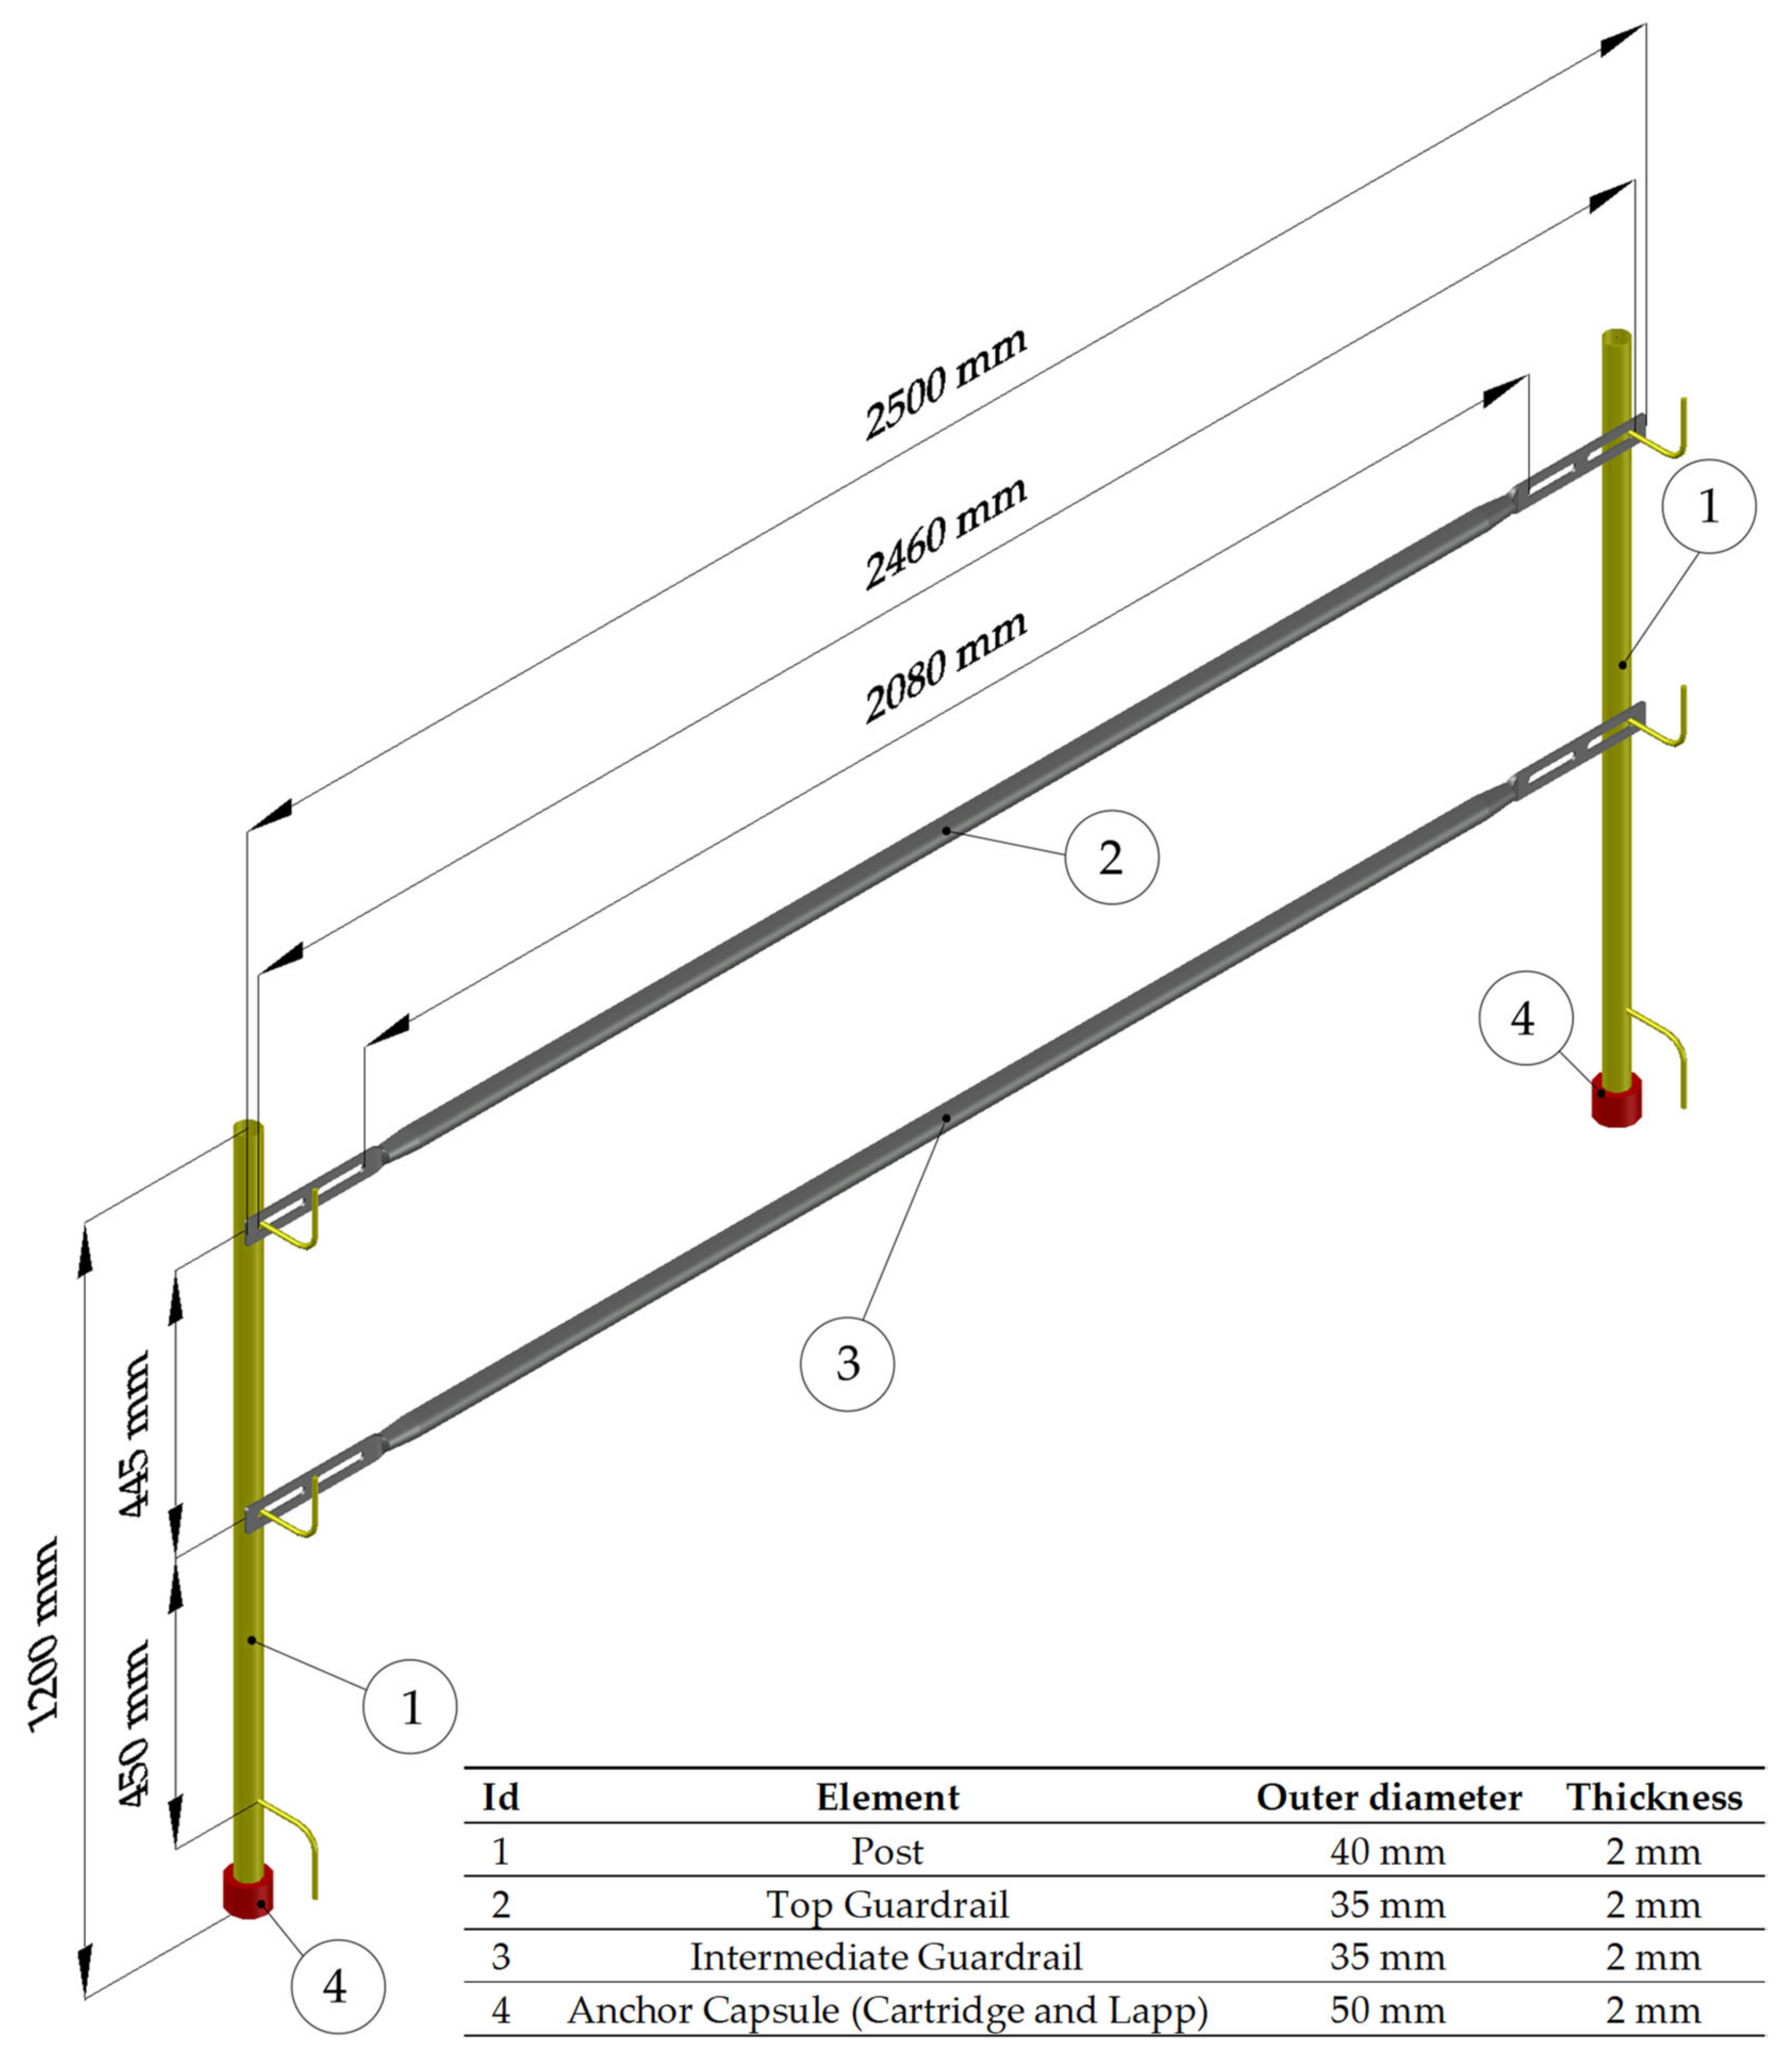
Of all the systems mentioned, this study focuses on the TEPS [63] most commonly used in construction, shown in Figure 3, since the elements they include (railings and uprights) are the most versatile and easy to find on the market and are also easier to assemble and disassemble than other systems.
If assembly times are taken into account, the selected TEPS are quick to install. First, prior to the concrete pour, the cartridge is inserted into the slab where the upright will be installed. Next, the upper and intermediate horizontal railings are coupled to the existing plates in the upright. However, due to their static geometry, often horizontal railings are bent to make a corner and, on other occasions, anchored with cables to the lengthwise limitation. On those occasions, assembly time is increased due to the lack of adaptability, which requires improvisation. On this last point, it must be noted that guard rails should not be used here as not only do they not prevent the fall of people from different levels but, sometimes, due to their poor construction and lack of strength, are the cause of the accident. A railing that is not strong enough is a real trap [65].
Based on the commercial solution mentioned above, Figure 4 shows the modelling of the elements of the selected TEPS:

3.3. Behaviour of the TEPS When Subjected to Different Loads and Materials

This section focuses on the response shown by a series of selected materials to the static load tests that must be met by the selected TEPS, classified as Class A by the UNE-EN 13374:2013+A1:2019 standard, as they are a means of collective protection used in construction works to prevent the fall of people and materials from horizontal surfaces or those with a slight inclination (up to 10 degrees) to a lower level, providing resistance to static loads, such as the weight of a worker leaning on the protection or resting his hand on it while walking alongside, as well as stopping a worker walking or falling in the direction of the protection. For this study, the materials of the two main elements that constitute the TEPS are selected (posts and railings), leaving the baseboards outside of the scope).
  • Metals:
    Galvanised steel (GS DX51D S280GD Z200), taken as a reference material;
    Aluminium alloy 2024 (Al 2024 T3);
    Cast iron (CI A536 80-55-06);
  • Plastics:
    Polyethylene terephthalate (PET);
    Polyvinyl chloride (PVC);
  • Composite materials:
    Glass-fibre-reinforced polyester (GFRP);
    Carbon-fibre-reinforced polymer (CFRP).
The characteristics of the chosen materials for this research are listed in Table 2.
In order to observe the behaviour of the different materials applied to the traditional Class A TEPS as a whole, the relevant calculations are carried out using the analytical method [66]. The tests carried out are the following, as summarised in Figure 5:
  • Serviceability limit state (SLS):
    1.
    Elastic deflection requirement: The purpose is to evaluate the deformation capacity of the system (the system must be deformed but without exceeding a maximum limit) under a serviceability limit state criterion based on a horizontal characteristic point load perpendicular to the system of 300 N (FT1) applied to the centre of the railing not exceeding 55 mm of deflection. Analytically, this condition is reflected in Equation (1):
    δ ST = 55     F T 1 × L G 3 48 × E × I G + F T 1 2 × L P 3 3 × E × I P = δ RT
  • Ultimate limit state (ULS):
    2.
    Flexural strength requirement: The purpose is to evaluate the bending capacity of the TEPS under the criterion of ultimate limit state (with increased loads) and determine the ultimate strength of the system from a horizontal point load perpendicular to the system of 300 N plus 50% (FH1,d) applied to the centre of the railing. Analytically, this condition is reflected in Equation (2):
    M SD = F H 1 , d × L G 4 W G × f y γ M = M RD
    3.
    Shear strength requirement: The purpose is to evaluate the shear capacity of the TEPS under the criterion of ultimate limit state (with increased loads) and determine the ultimate strength of the system from a horizontal point load perpendicular to the system of 300 N plus 50% (FH1,d) applied to the centre of the railing. Analytically, this condition is reflected in Equation (3):
    V SD = F H 1 , d 2 A VG ×   f y / 3 γ M = V RD
  • Ultimate limit state with parallel load (PL ULS):
    4.
    Parallel load bend resistance requirement: The purpose is to verify the bending behaviour of the system against parallel horizontal actions from a horizontal point load parallel to the system of 200 N plus 50% (FH3,d) applied at the end of the post. Analytically, this condition is reflected in Equation (4):
    M SD = F H 3 , d × L P W P × f y γ M = M RD
    5.
    Parallel load shear resistance requirement: The purpose is to verify the shear behaviour of the system against parallel horizontal actions from a horizontal point load parallel to the system of 200 N plus 50% (FH3,d) applied at the end of the post. Analytically, this condition is reflected in Equation (5):
    V SD = F H 3 , d A VP ×   f y / 3 γ M = V RD
  • Ultimate limit state with accidental loads (AL ULS):
    6.
    Accidental load on elastic deflection requirement: The purpose is to evaluate the deformation (sag) of the system in front of a vertically descending point load of 1.25 kN (FD) applied to the centre of the railing not exceeding 300 mm of deflection. Analytically, this condition is reflected in Equation (6):
    δ SD = 300     F D × L G 3 48 × f u × I G = δ RD
    7.
    Accidental load bending requirement: The purpose is to evaluate the bending resistance to a vertically descending point load of 1.25 kN (FD) applied to the centre of the railing. Analytically, this condition is reflected in Equation (7):
    M SD = F D × L G 4 W G × f u = M RD
    8.
    Accidental load shear requirement: The purpose is to evaluate the shear resistance of the system against a vertically descending point load of 1.25 kN (FD) applied to the centre of the railing. Analytically, this condition is reflected in Equation (8):
    V SD = F D 2 A VG ×   f u 3 = V RD
These analytical results are verified by finite-element analysis (FEA) [67] carried out with Autodesk Inventor software, with which the preliminary design is undertaken at a later stage. In the case of deflection tests, the results are direct. However, for the rest of the tests, the equivalent von Mises stress is provided by the software, which is expressed as shown in Equation (9):
σ VM = σ x 2 + 3 × τ xz 2   ( M y W y ) 2 + 3 × ( V y A y ) 2
where My is the bending moment (in N·m), Wy is the moment of resistance (in m3), Vy is the shear strength (in N) and Ay is the section area (in m2).

3.4. Classification of Attributes for the Preliminary Design of New TEPS

This section is responsible for analysing the attributes that must be incorporated into the new collective protection systems being designed, assessing basic, desired and motivating qualities through the application of the Kano model and its variants. Once the questionnaire is fully developed, it is distributed through the official colleges of technical experts with professional authority for the projection, direction, supervision and coordination of construction works in Spain (architects, technical architects, industrial engineers, industrial technical engineers, civil engineers, technical engineers of public works and civil engineers). Next, it is necessary to encode the answers given for each requirement according to the classification possibilities provided by the methodology, assigning the values of R (reverse requirement), Q (questionable requirement), A (attractive requirement), M (mandatory requirement), O (one dimensional) and I (indifferent), as shown in double entry Table 3. In functional questions, the scale goes from 1 (I dislike it a lot) to 5 (I like it a lot). Conversely, in dysfunctional questions, the scale goes from 1 (I like it a lot) to 5 (I dislike it a lot).
Based on the literature review [23,29,30,68,69,70,71,72,73,74] and information obtained in the field by the authors (in the design, supervision and coordination of their own works), an initial list of 42 requirements is elaborated and classified into 7 categories, as listed in Table 4.
Since the Kano model is used in a context where an eminently qualitative approach takes precedence, there is a statistical test that evaluates the significance of the classification carried out. To do this, the statistic E is used, obtained according to Equation (10) for the number of responses received (n), which is compared with the absolute difference (F) of the two frequencies (a and b) most voted of the alternatives (R, Q, A, M, O and I), as indicated in Equation 11, verifying that this difference is greater than this statistic [75].
E = ( a + b ) × ( 2 n a b ) 2 n
F = a b
Next, the requirements are classified by the increase or decrease in the satisfaction of potential users due to the inclusion or not of the requirement in the product, for which two other statistics are used, according to Equations (12) and (13). On the one hand, S is the perception of being better with its inclusion than without it and satisfying attractive and one-dimensional requirements. On the other hand, D is the perception of being worse without its inclusion than with it and not satisfying mandatory or one-dimensional requirements. Neither equation includes the reverse or questionable requirements precisely due to their confusing nature. S represents the ability of that attribute (potential requirement) to increase user satisfaction, while D represents the ability to reduce user dissatisfaction. High values of S and D give one-dimensional requirements (requirements that are wanted and must be incorporated). High values of S and low values of D give attractive requirements (requirements we wish to incorporate: exciting attributes). Low values of S and high values of D give mandatory requirements (requirements that must be incorporated: basic attributes). Low values of S and D result in indifferent requirements.
S = ( A + O ) ( A + O + M + I )
D = ( U + M )   ( A + O + M + I )
Nevertheless, some aspects of analysing the needs of potential users are not completely resolved. If the Kano model asks about very general functions, interviewees have a concrete opinion. However, if the questionnaire asks about very specific functions, the responses of most respondents lead to an indifferent requirement. Consequently, extremely detailed questions can increase the noise level to a point where the requirements are indifferent. One way to modify the statistics is to calculate the vector (X, Y) for each requirement (i) according to the scores referred to in Table 5 and Equations (14) and (15). Therefore, dimension X indicates dissatisfaction if a requirement is not included and Y satisfaction if it is [76].
X i = 1 n   j = 1 n x ij
Y i = 1 n   j = 1 n y ij
The classification of the revised Kano model shows how a potential user classifies a possible requirement of a product by comparing the satisfaction or dissatisfaction of its inclusion against the better or worse performance of that product [77]. However, if the questionnaire additionally asks about the normalised importance (G) given by potential users to that requirement, then the weighted vector (C1, C2) [78] can be determined, taking into account the intrinsic importance of each attribute. This provides a quantifiable statistical result which can be fed and integrated into an analytical model, such as a quality function deployment (QFD) model [79], that can be used in more advanced stages [39].

3.5. Hierarchisation of Alternative Materials for the Preliminary Design of New TEPS

This section is responsible for hierarchising the alternative materials that can be used for the new collective protection equipment to be designed after carrying out the appropriate tests according to the attributes considered as potential requirements (mandatory, attractive and one dimensional) resulting from the Kano models. To do this, the AHP method is used, taking as decision makers a panel of independent research experts thanks to the collaboration of the professional associations whose associate members have explicit legal authority in the construction process and to the Labour and Social Security Inspectorate (ITSS). The panel of experts is established following stakeholder theory [80], taking into account business owners, architecture and engineering firms, contractor corporations, public inspection bodies and occupational mutual insurance companies (OMIC) [81]. This panel needs to have the necessary knowledge and experience to validate (or add and/or delete) the proposed scheme of criteria (dimensions), sub-criteria (attributes) and alternatives (materials) and prioritise each of these categories in pairs, as well as decide the comparison scales, either the Saaty scale [80], compiled in Table 6, or a natural scale. Valuations are made by taking a consensus value.
To check the consistency of the valuations, the consistency ratio (CR) is used, according to Equation (16), which, for each matrix obtained, must be less than 5% for matrices of order 3, 8% for matrices of order 4 and 10% for matrices of order 5 or higher [82].
CR = ( λ max n ) / n 1 RI
where λmax is the primary eigenvalue of each comparison matrix, n is the order of each matrix and RI is the random index [83], the values of which are listed in Table 7.
The pairwise comparisons of dimensions, attributes and alternative materials are generated and organised into square matrices, as shown in Equation (17):
A w = a 11 a 1 i a 1 n a j 1 a ji a jn a n 1 a ni a nn
where aij is the comparison between item i and j considering that a11 = ann because of homogeneity, aij × aji = 1 because of reciprocity and aik × rkj = rij because of transitivity. The criteria weights of each item to be considered are normalised by mathematically solving for a non-zero eigenvalue, as described in Equation (18):
j = 1 n a ij w j = λ max w i
where w is the criteria weights (eigenvectors), and λmax is the maximum eigenvalue of the model. On the other hand, the eigenvector illustrates the relative weights of each criterion under every level of the model. Then, the priority weights of each level can be aggregated using the geometric mean method. Answers from each respondent are agreed and then synthesised into a single priority vector in order to obtain an overall computation of the priorities for each factor in the model according to Equation (19):
G = ( 1 × × a 1 i × × a 1 n ) 1 n ( a j 1 × × a ji × × a jn ) 1 n ( a n 1 × × a ni × × 1 ) 1 n
where G is the geometric mean of each factor in the hierarchy, a is the weight provided by the experts panel and n is the order of each pairwise comparison matrix. Finally, the global priority weight of each parameter is computed using Equation (20):
G   W pi = W fi × W ci
where i is the hierarchy level, Wf is the factor local priority weightage and WC is the category local priority weightage.

4. Results

4.1. Results Compared with Static Load SLS Requirements

Table 8 shows the results of this test. From the results obtained after the static structural analysis, applying a horizontal point load to the midpoint of the upper horizontal railing, the metals show optimal behaviour, obtaining a deflection lower than the maximum allowed by the UNE-EN 13374:2013+A1:2019 standard [64], except for the AL, which requires a new sizing. In the case of the composite materials, the CFRP amply fulfils requirements, but the GFRP requires new sizing. In the case of plastics, the requirement is not met.
Likewise, Figure 6 shows the deformation of the reference material (GS) obtained in the FEA in test 1 compared to the static load SLS requirements. The rest of the materials (alternative materials) are shown in Figure A1 of Appendix A.

4.2. Results Compared with Static Load ULS Requirements

Table 9 shows the flexural results of this test. From the results obtained after the static structural analysis, applying a horizontal point load to the midpoint of the upper horizontal railing, both composite materials and metals show optimal behaviour, obtaining a bending resistance higher than the minimum required by the UNE-EN 13374:2013+A1:2019 standard. In the case of plastics, the requirement is not met.
On the other hand, Table 10 shows the shearing results of this test. From the results obtained after the static structural analysis, applying a horizontal point load to the midpoint of the upper horizontal railing, all materials show optimal behaviour, since, in all cases, a shear resistance higher than the minimum required by the UNE-EN 13374:2013+A1:2019 standard is obtained. However, according to the FEA analysis, a detailed study of the railing–post coupling element is required, as in the previous test.
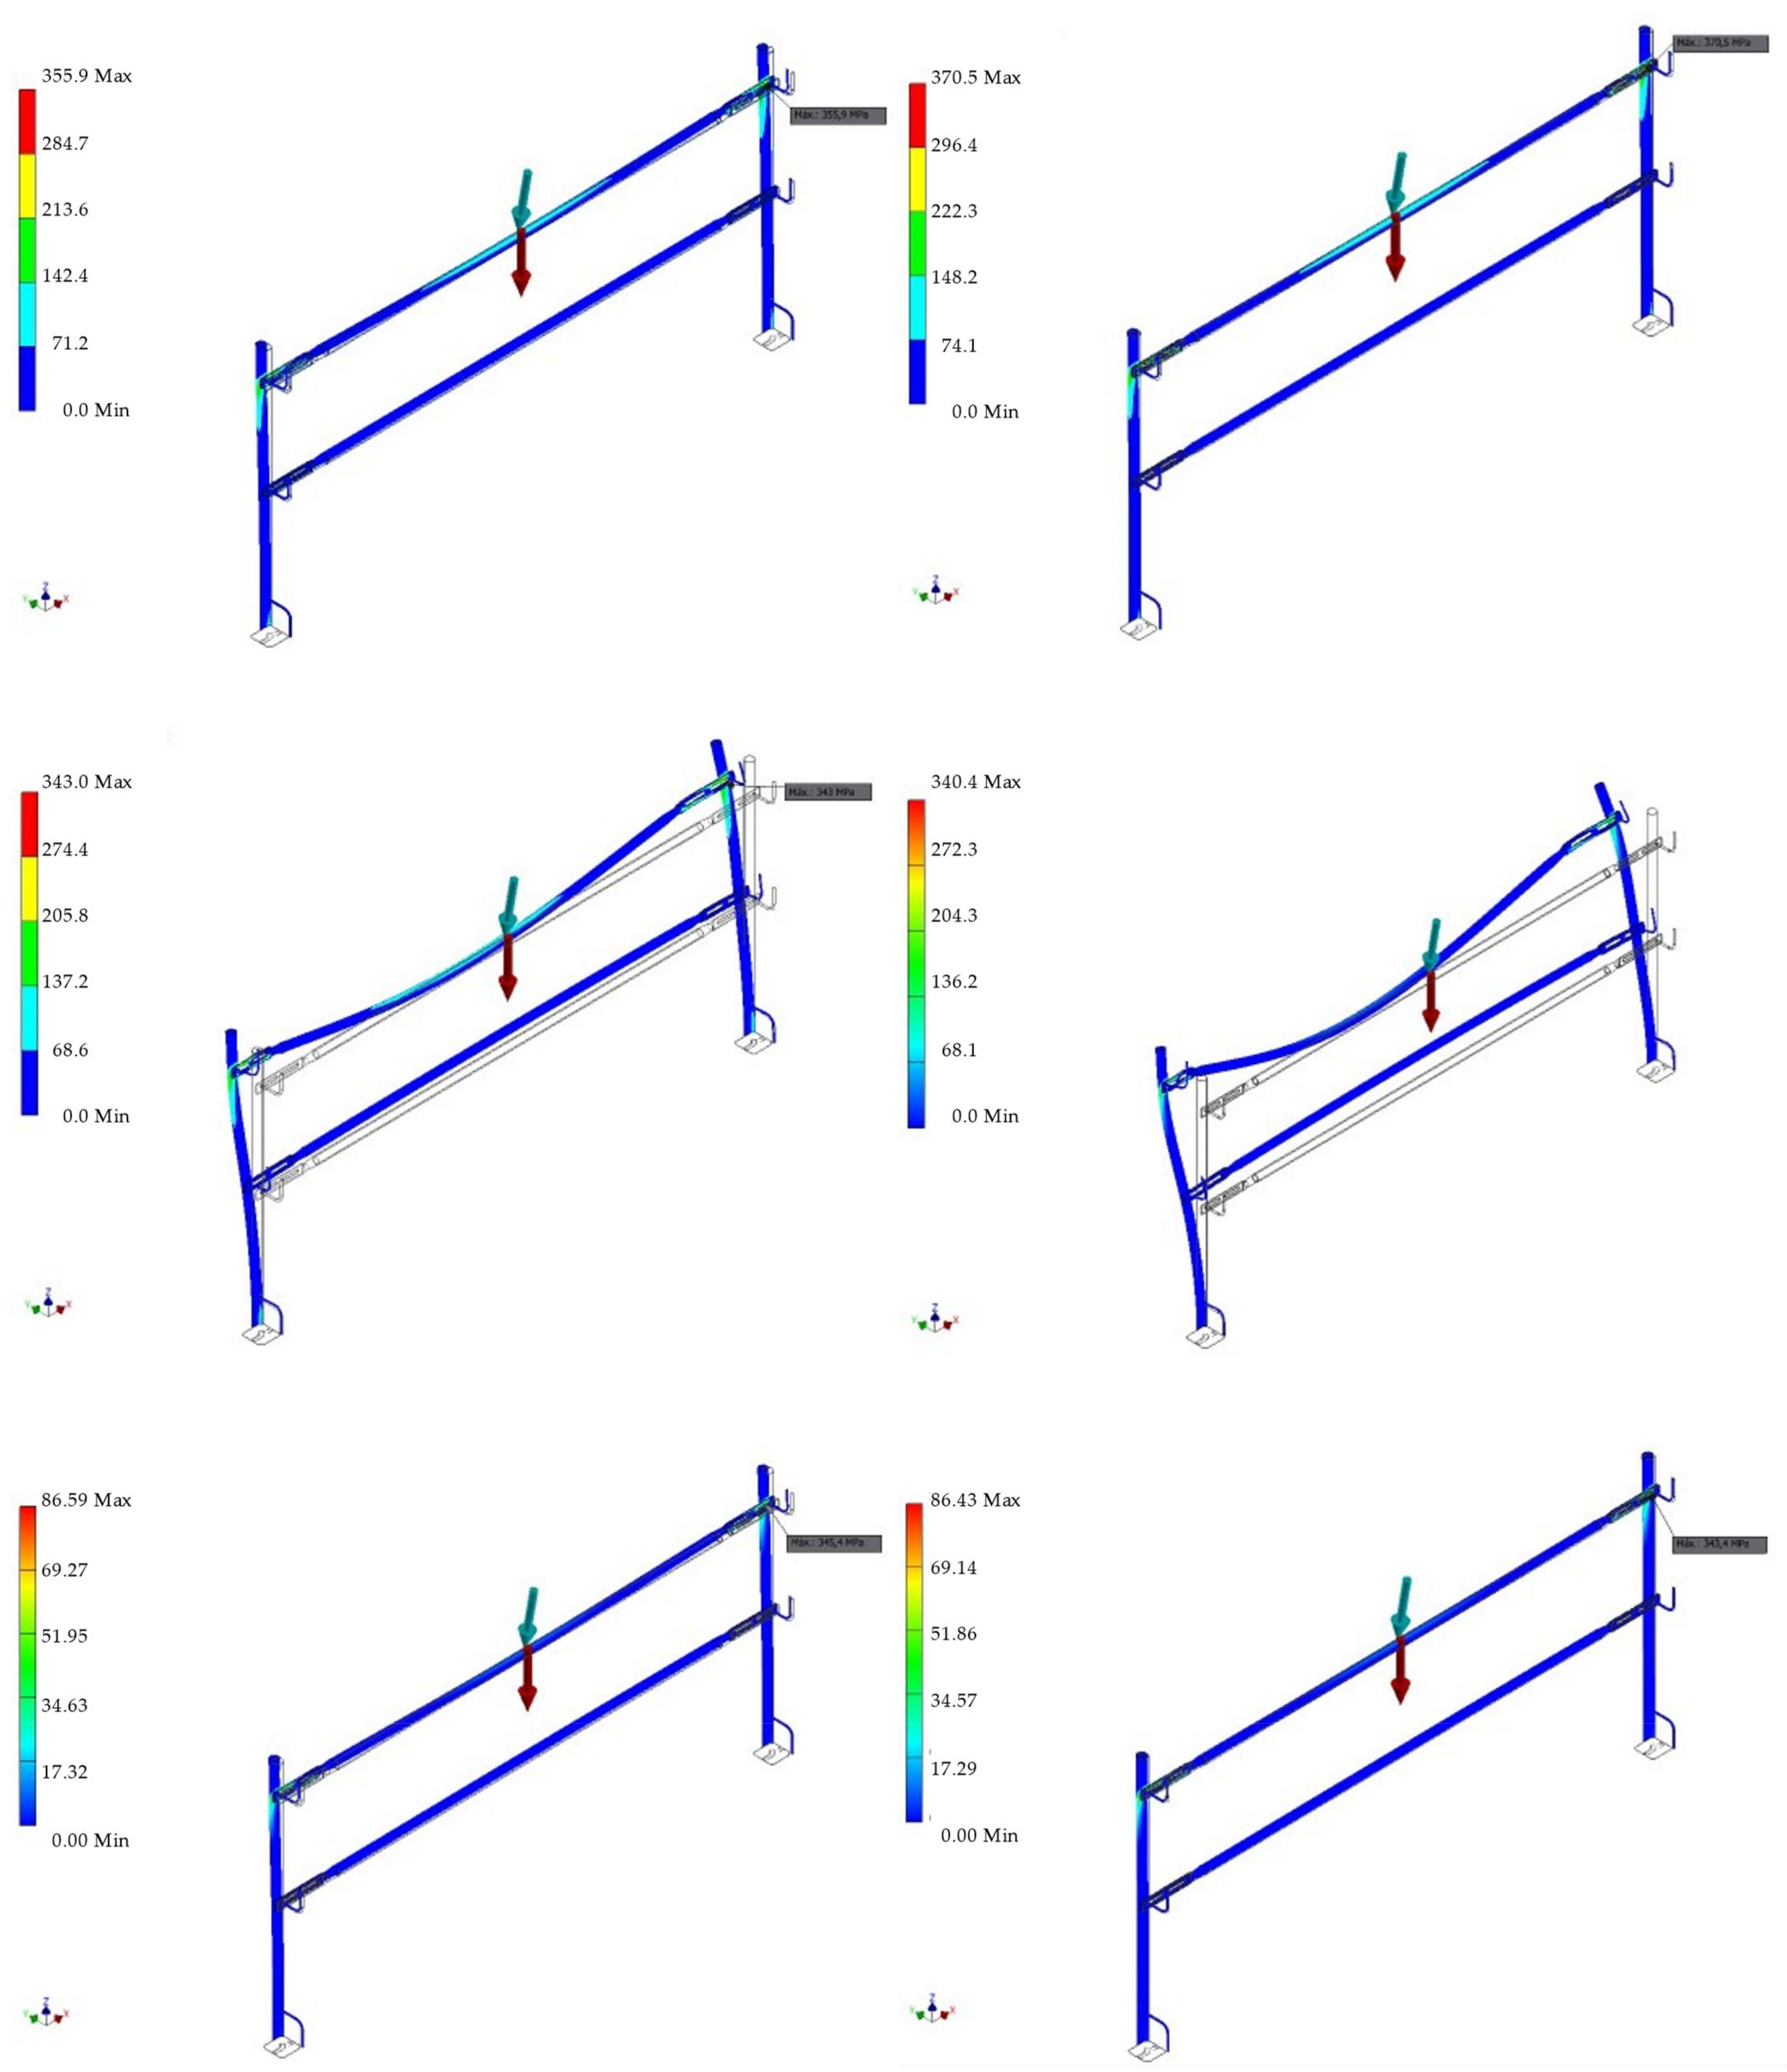
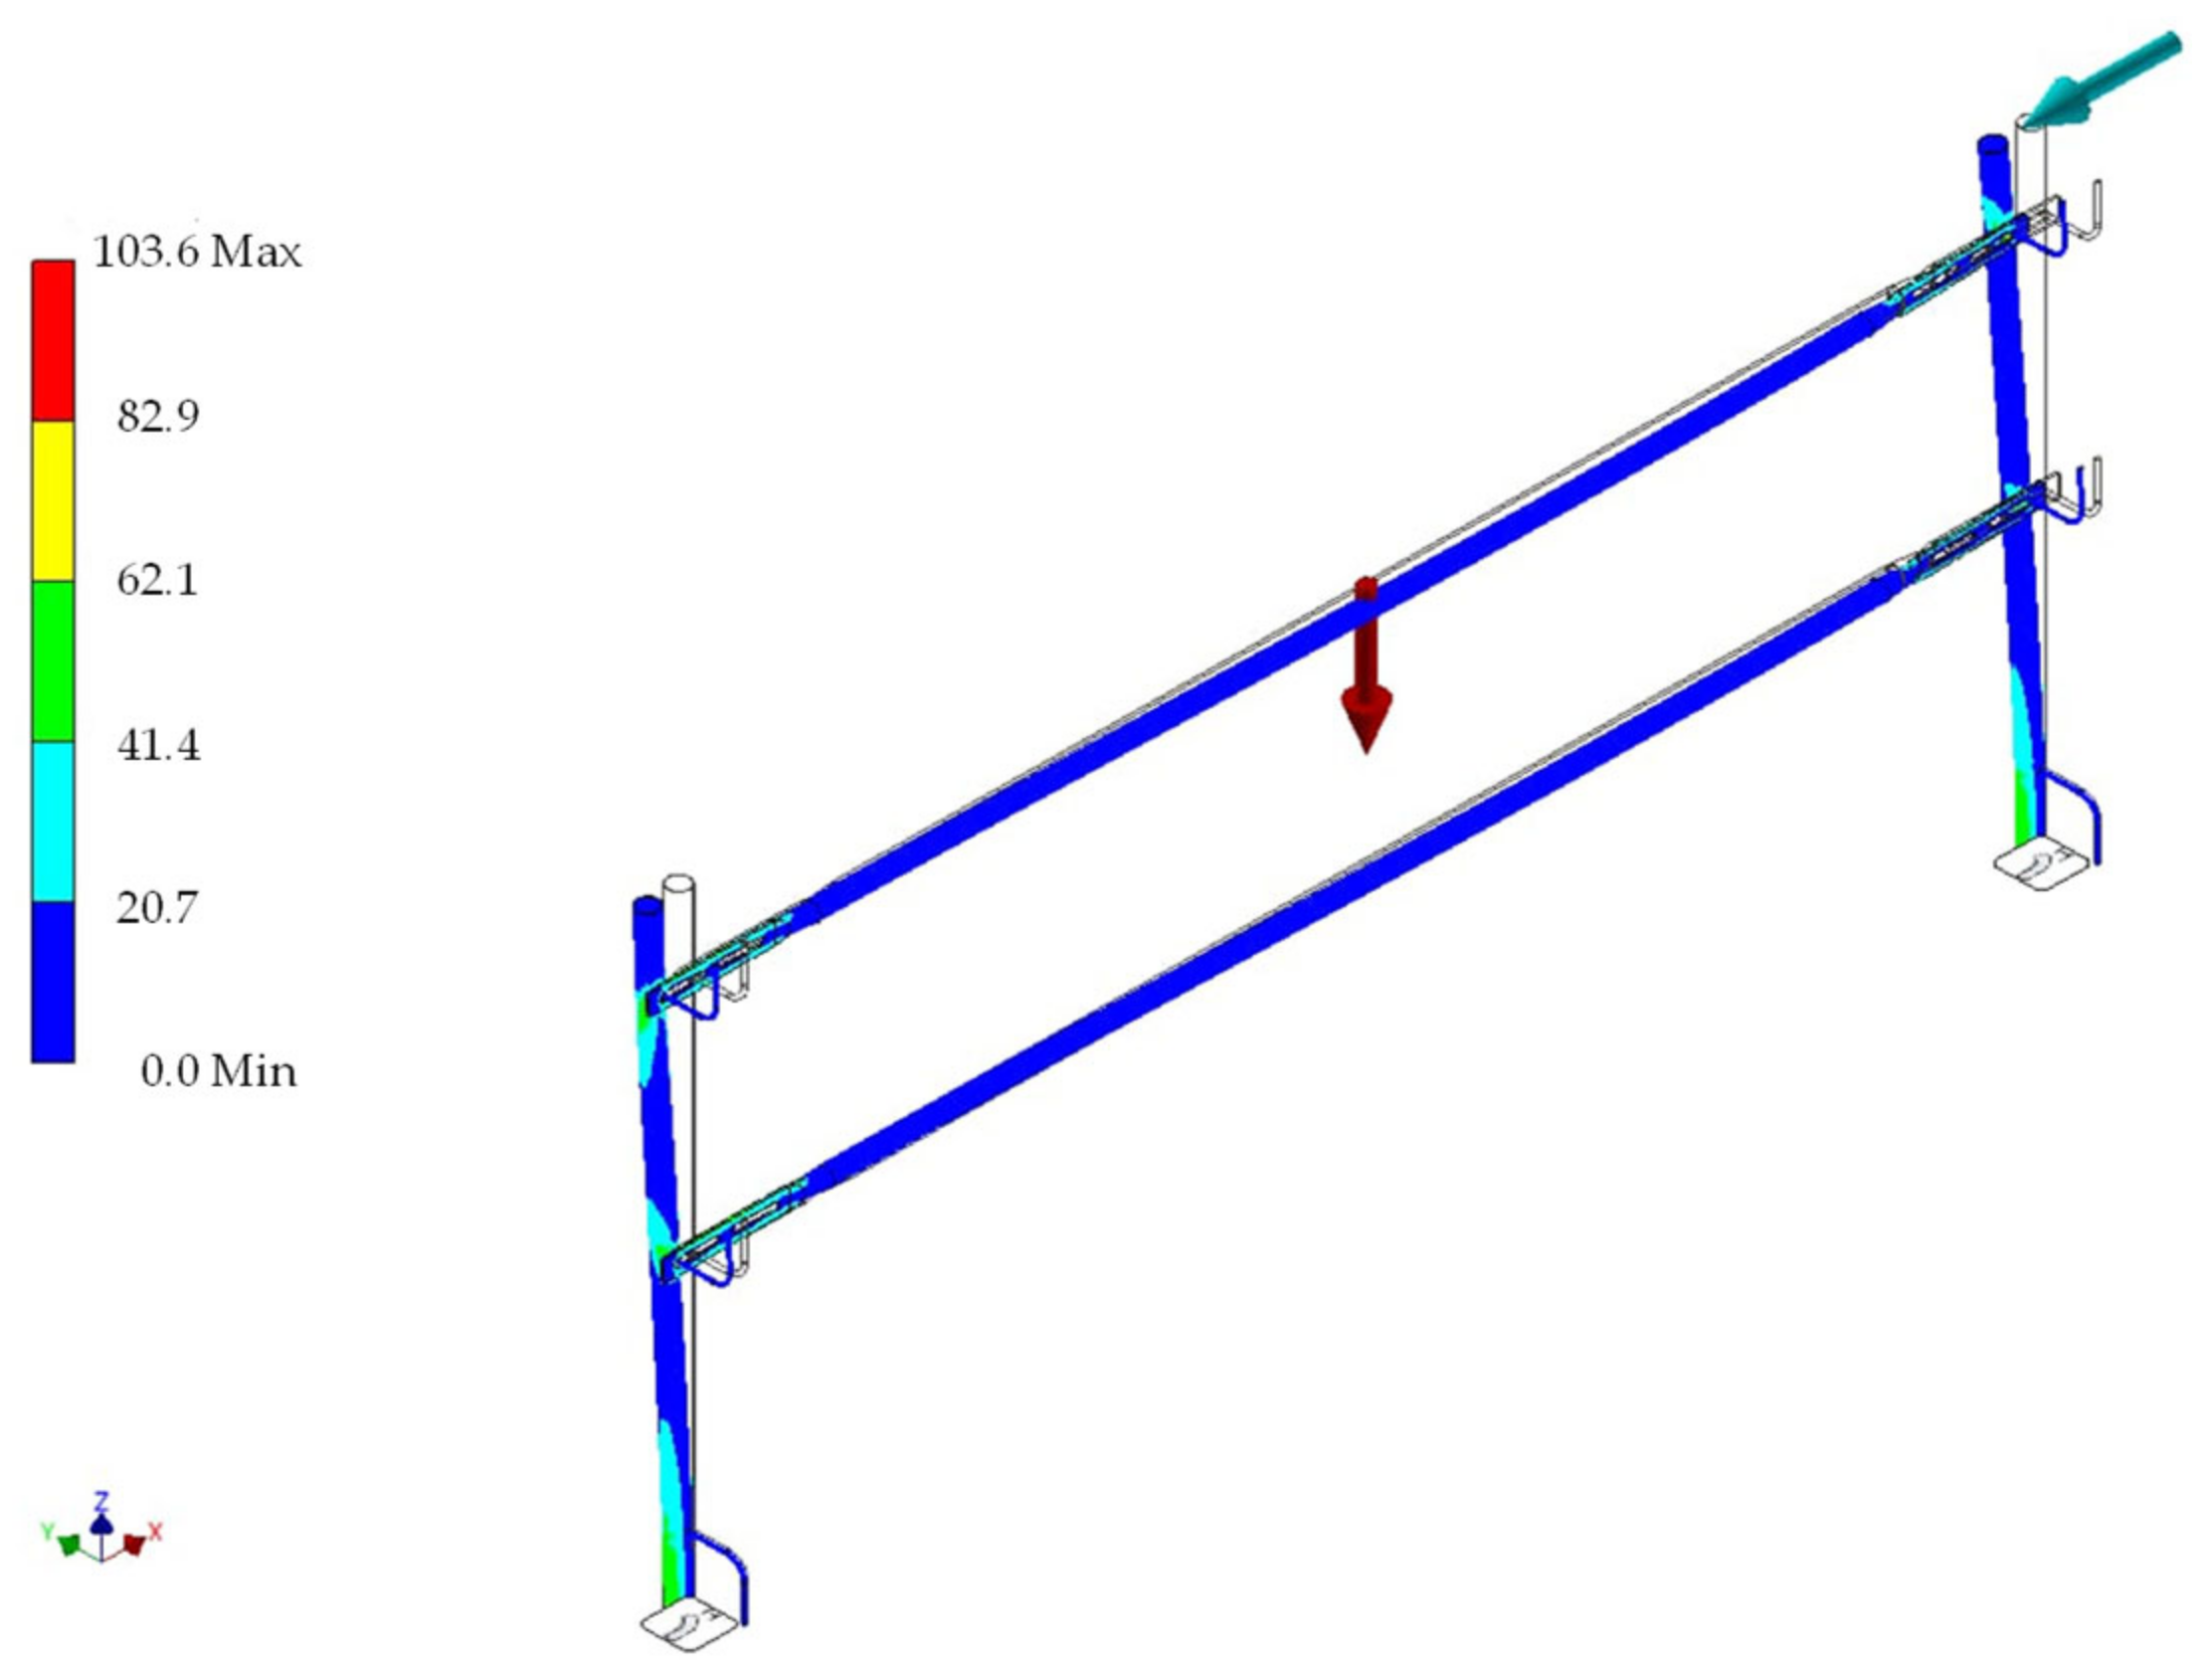
Likewise, Figure 7 shows the von Mises stresses of the reference material (GS) obtained in the FEA in tests 2 and 3 compared to the ULS requirements of static load. The remaining materials (alternative materials) are shown in Figure A2 of Appendix A.

4.3. Results Compared with Parallel Load ULS Requirements

On the one hand, Table 11 shows the bending results of this test. From the results obtained after the static structural analysis, applying a parallel point load to the upper end of the upright, both composite materials and metals show optimal behaviour, obtaining a bending resistance at the base of the upright higher than the minimum required by the UNE-EN 13374:2013+A1:2019 standard. On the contrary, in the case of plastics, the requirement is not met.
On the other hand, Table 12 shows the results of this test. From the results obtained after the static structural analysis, applying a parallel point load to the upper end of the upright, all materials show optimal behaviour, since, in all cases, a shear resistance higher than the minimum required by the UNE-EN 13374:2013+A1:2019 standard is obtained. However, according to the FEA analysis, a detailed study of the railing–post coupling element is required, as in the previous test.
Likewise, Figure 8 shows the von Mises stresses of the reference material (GS) obtained in the FEA in tests 4 and 5 compared to the ULS parallel load requirements. The rest of the materials (alternative materials) are shown in Figure A3 of Appendix A.

4.4. Results Compared with Accidental Static Load ULS Requirements

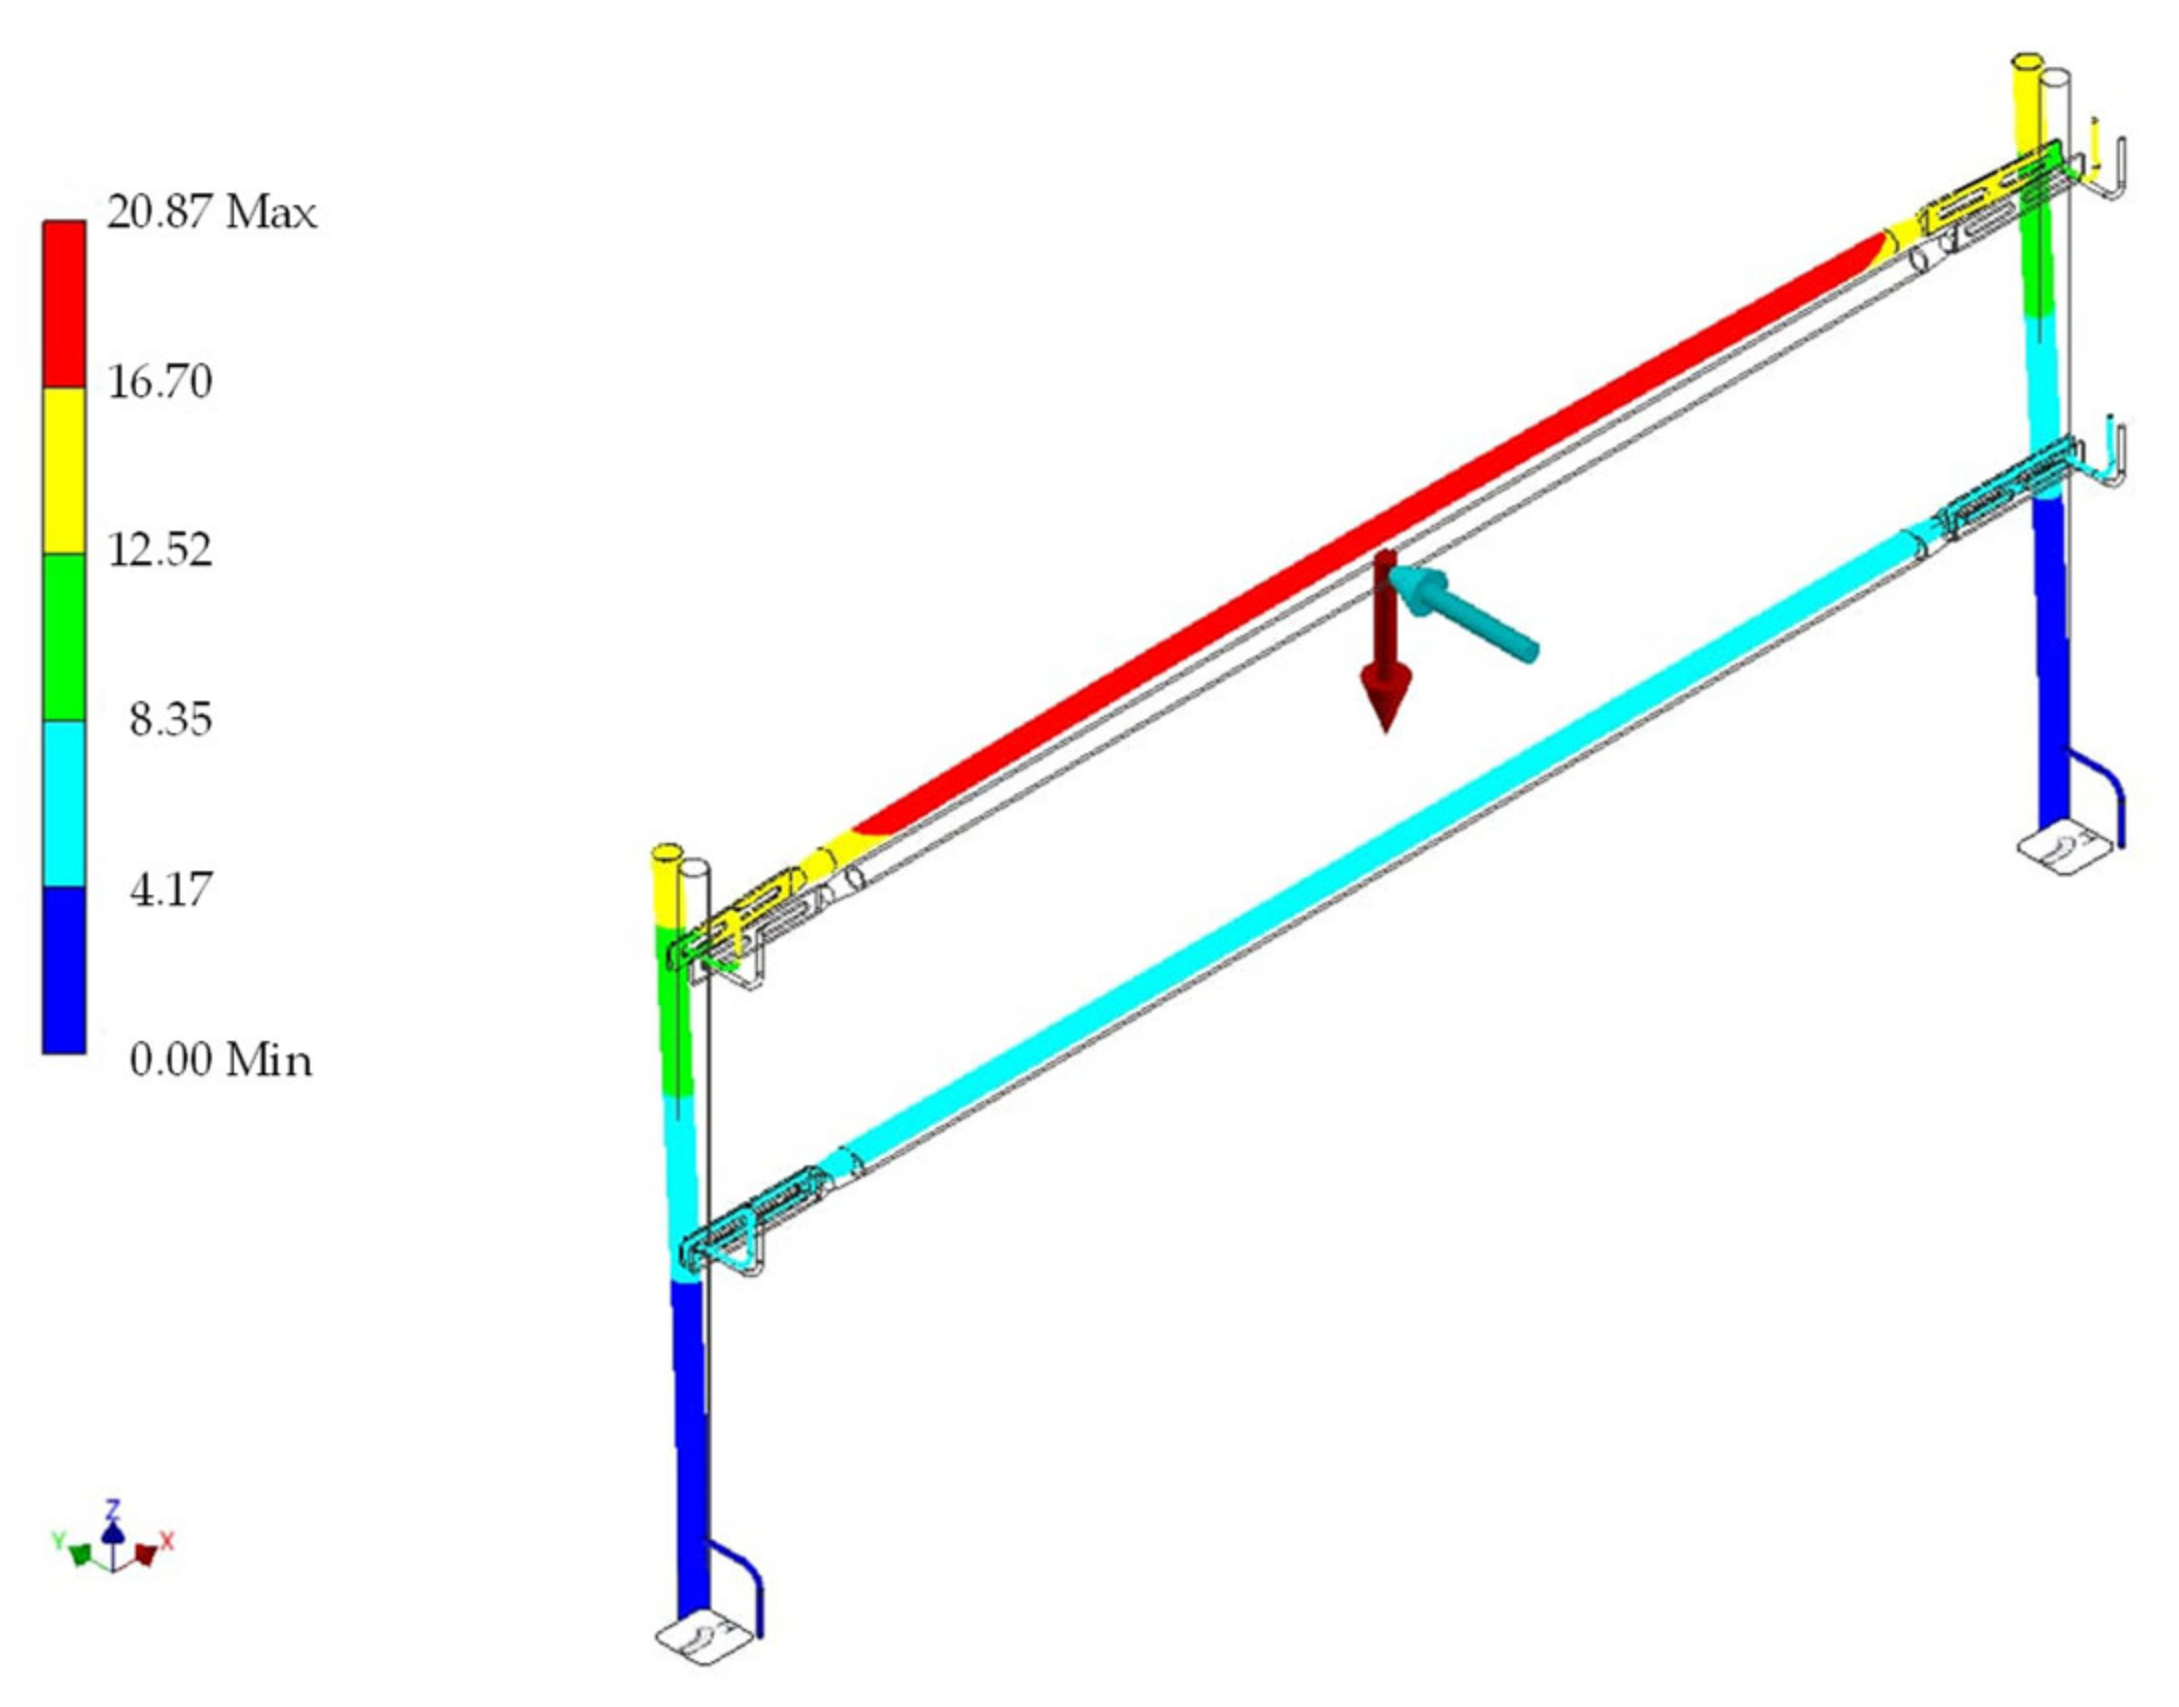
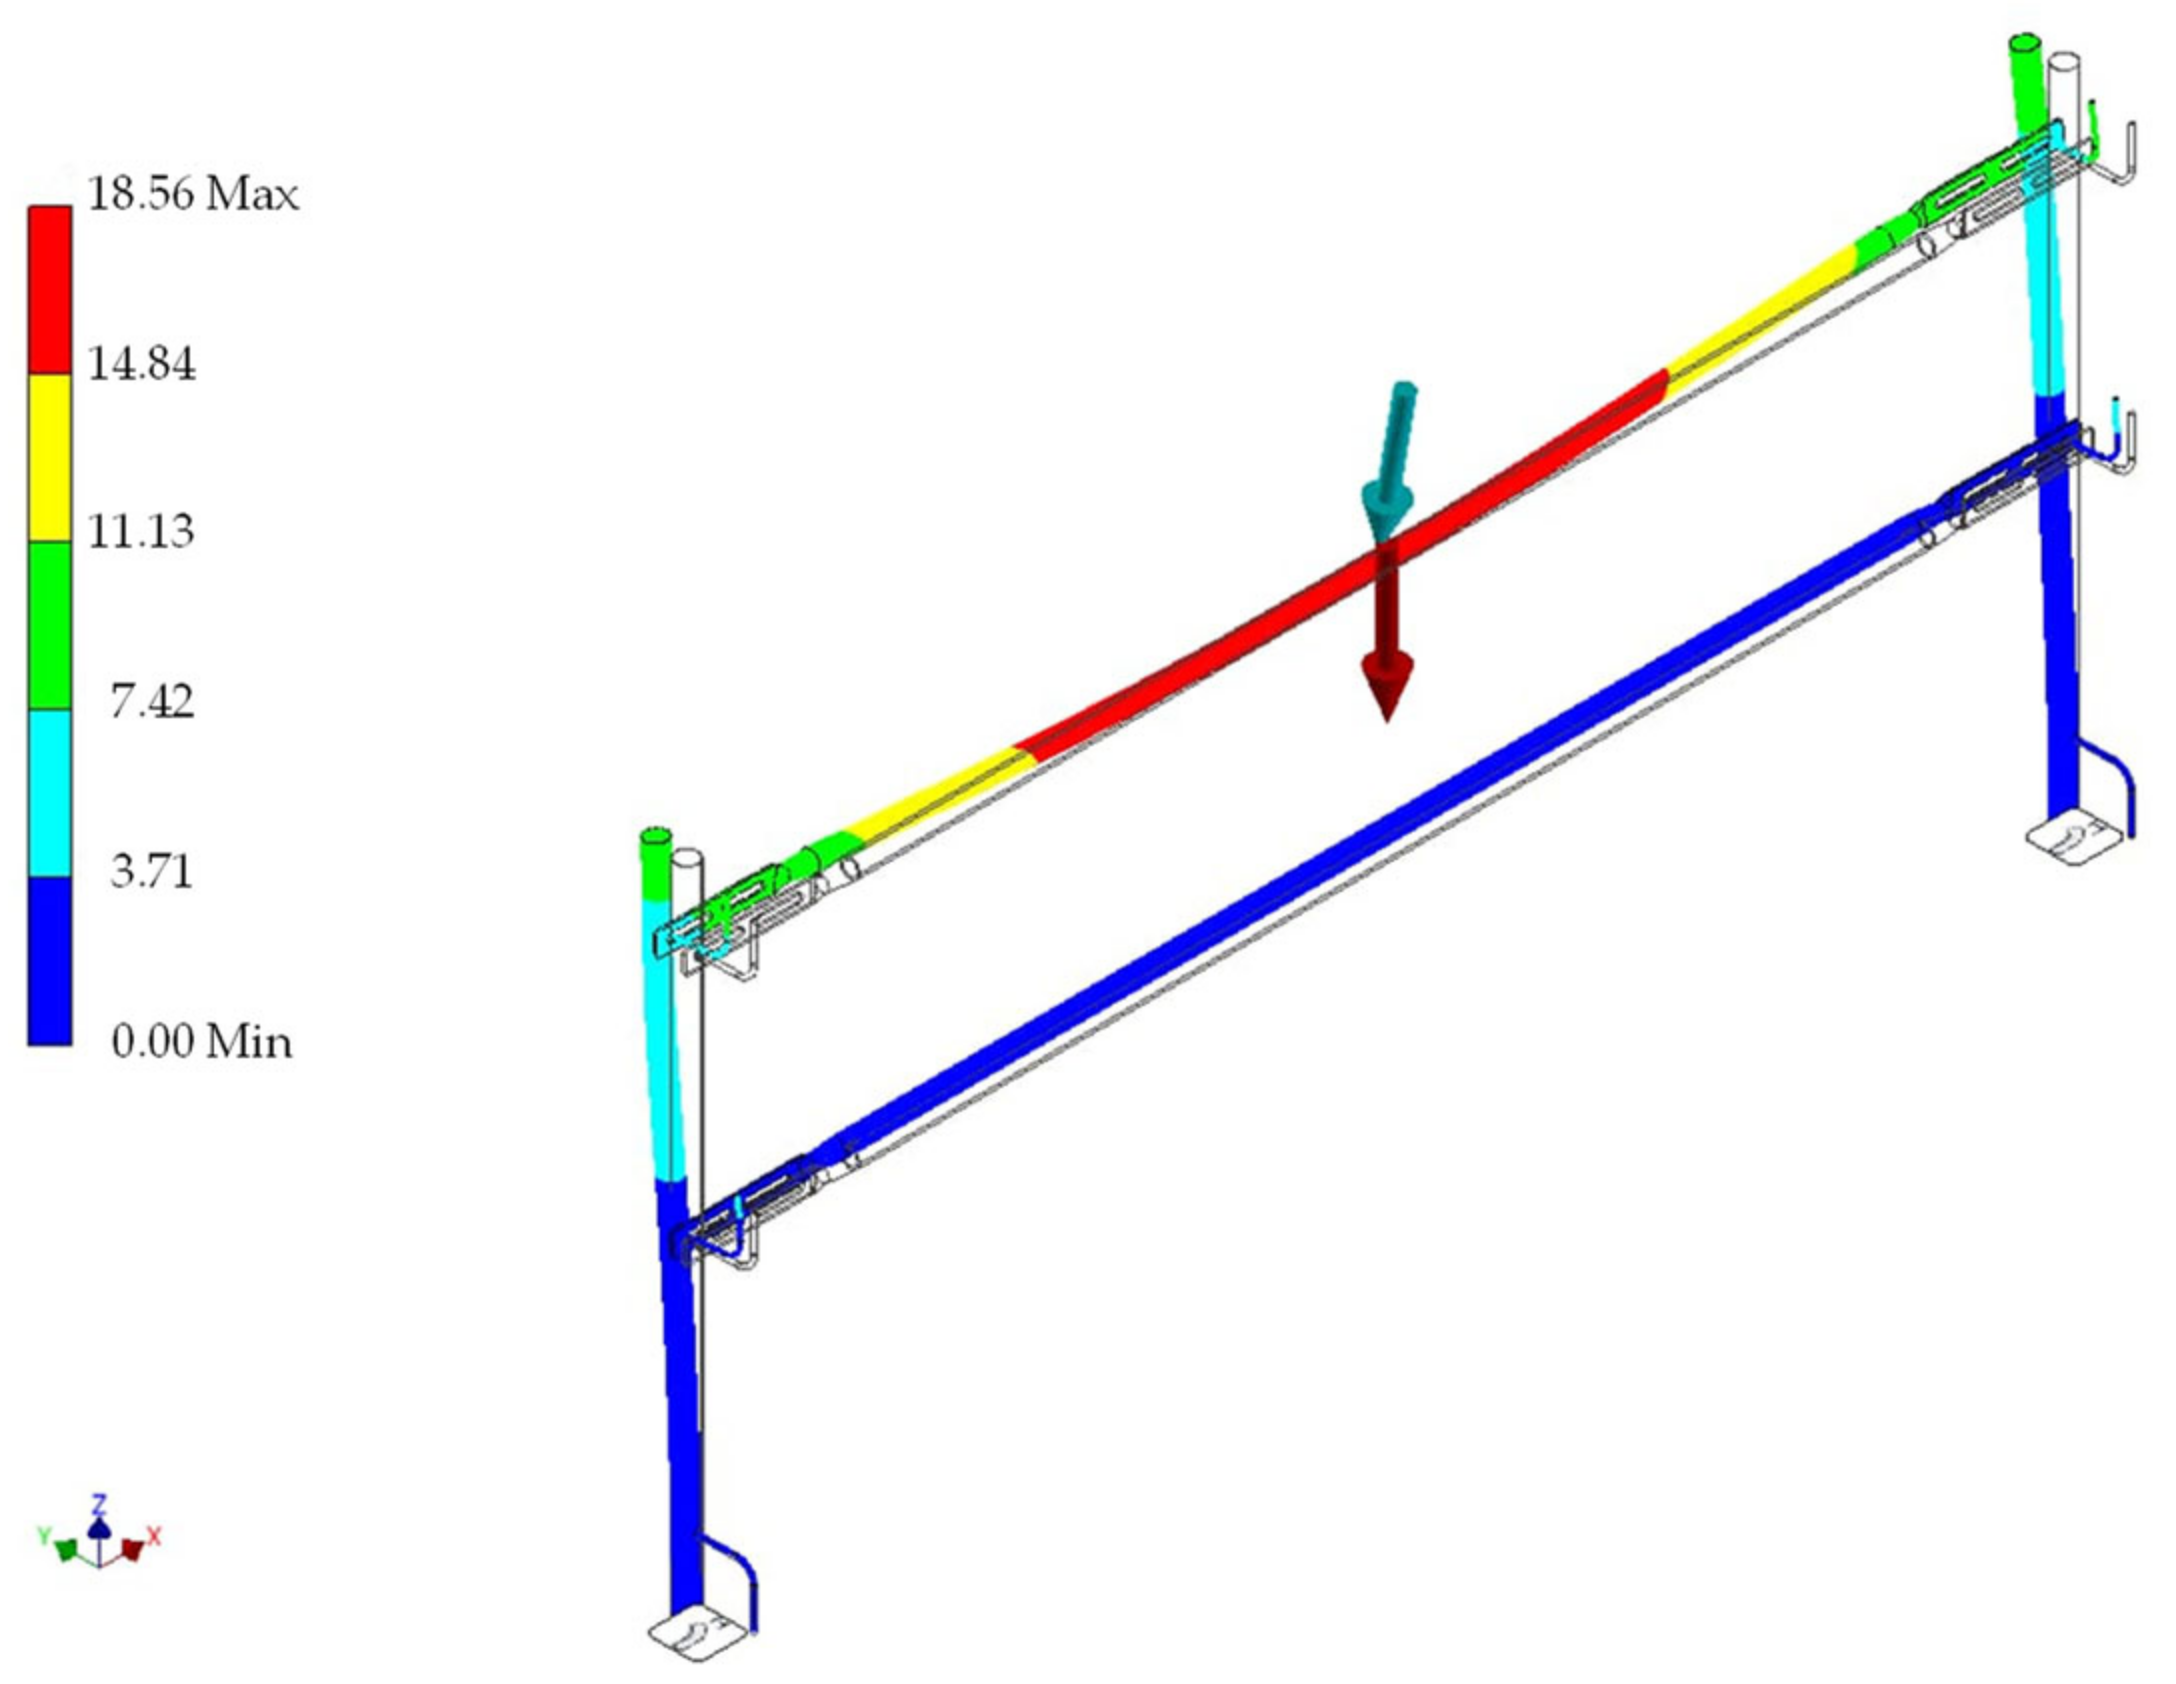
Table 13 shows the bending results of this test. From the results obtained after the static structural analysis, applying an accidental point load to the midpoint of the upper horizontal railing, both composite materials, including GFRP and metals, show optimal behaviour, obtaining a deflection lower than the maximum allowed by the UNE-EN 13374:2013+A1:2019 standard [64]. In the case of plastics, the requirement is not met.
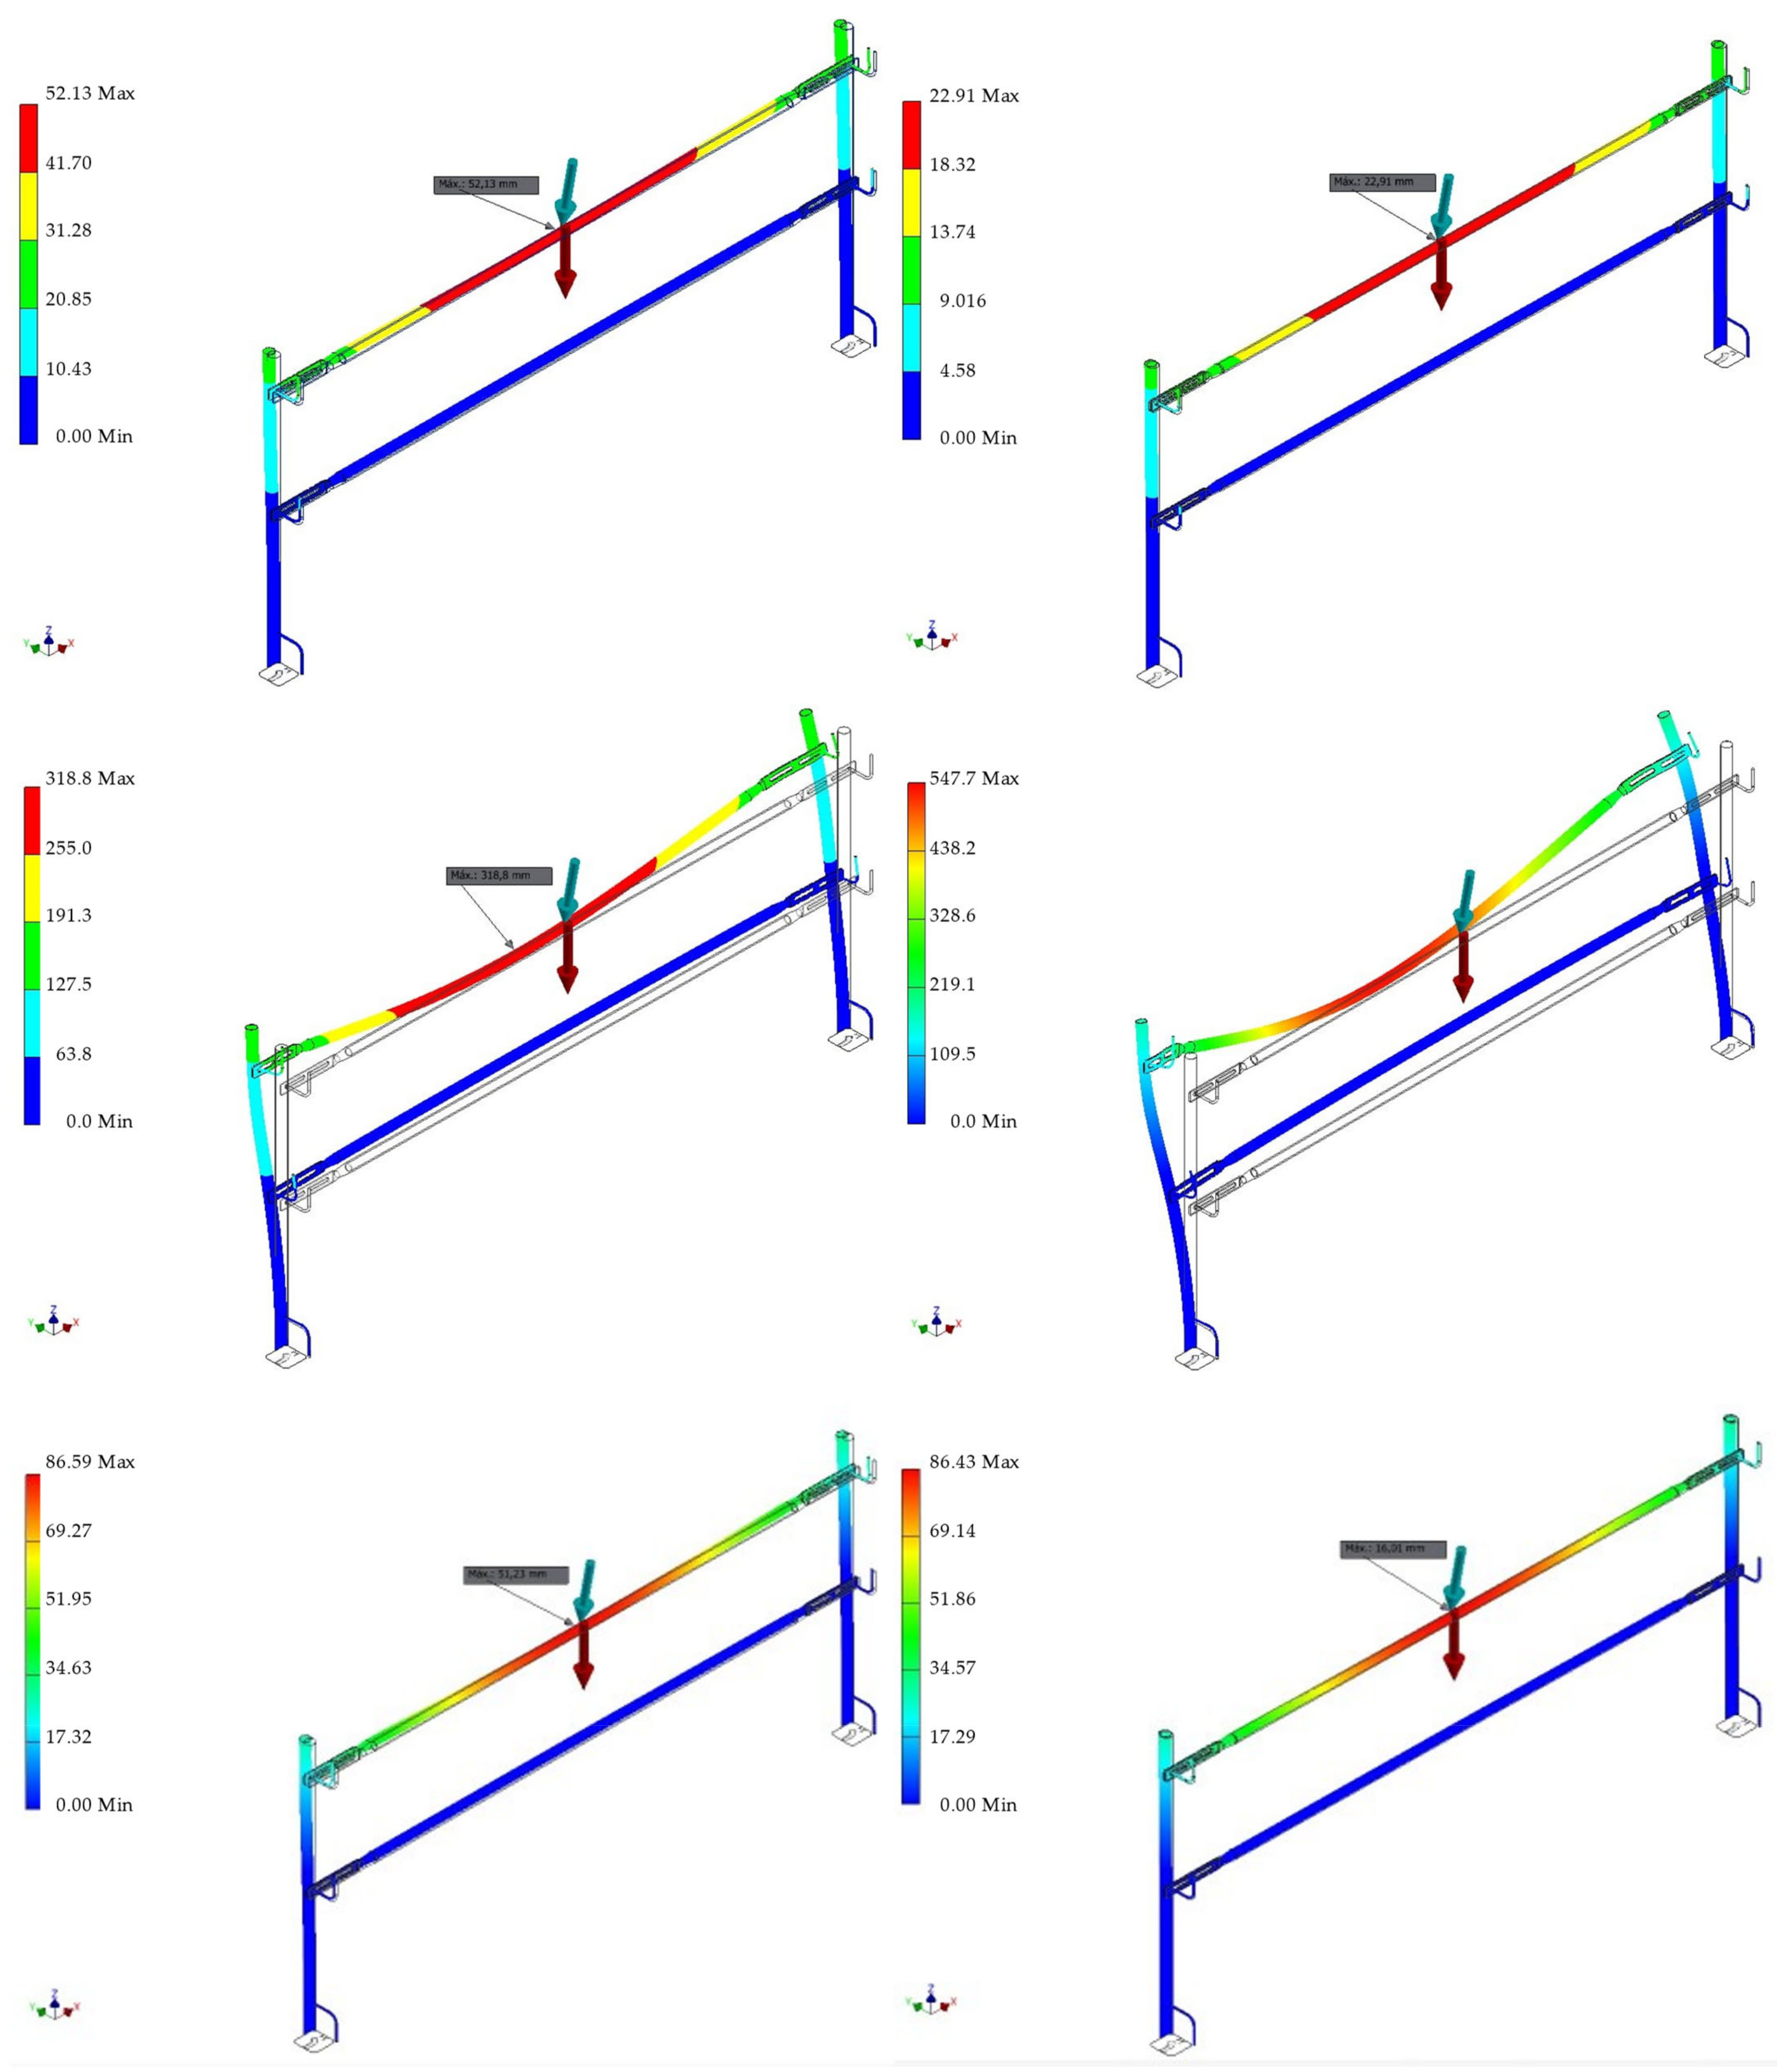
Likewise, Figure 9 shows the deformation of the reference material obtained in the FEA in test 6 compared with the ELU requirements for accidental static load. The remaining materials (alternative materials) are shown in Figure A4 of Appendix A. It should be noted that there is a difference in results according to the analytical method compared to the FEA (almost four times lower). This is due to the design of the coupling between the railing and the post of the commercial model. The analytical method only takes into account the circular section of the elements. However, when a horizontal load is applied to the railing, it has a lower inertia than when a vertical load is applied, so the deflection is reduced.
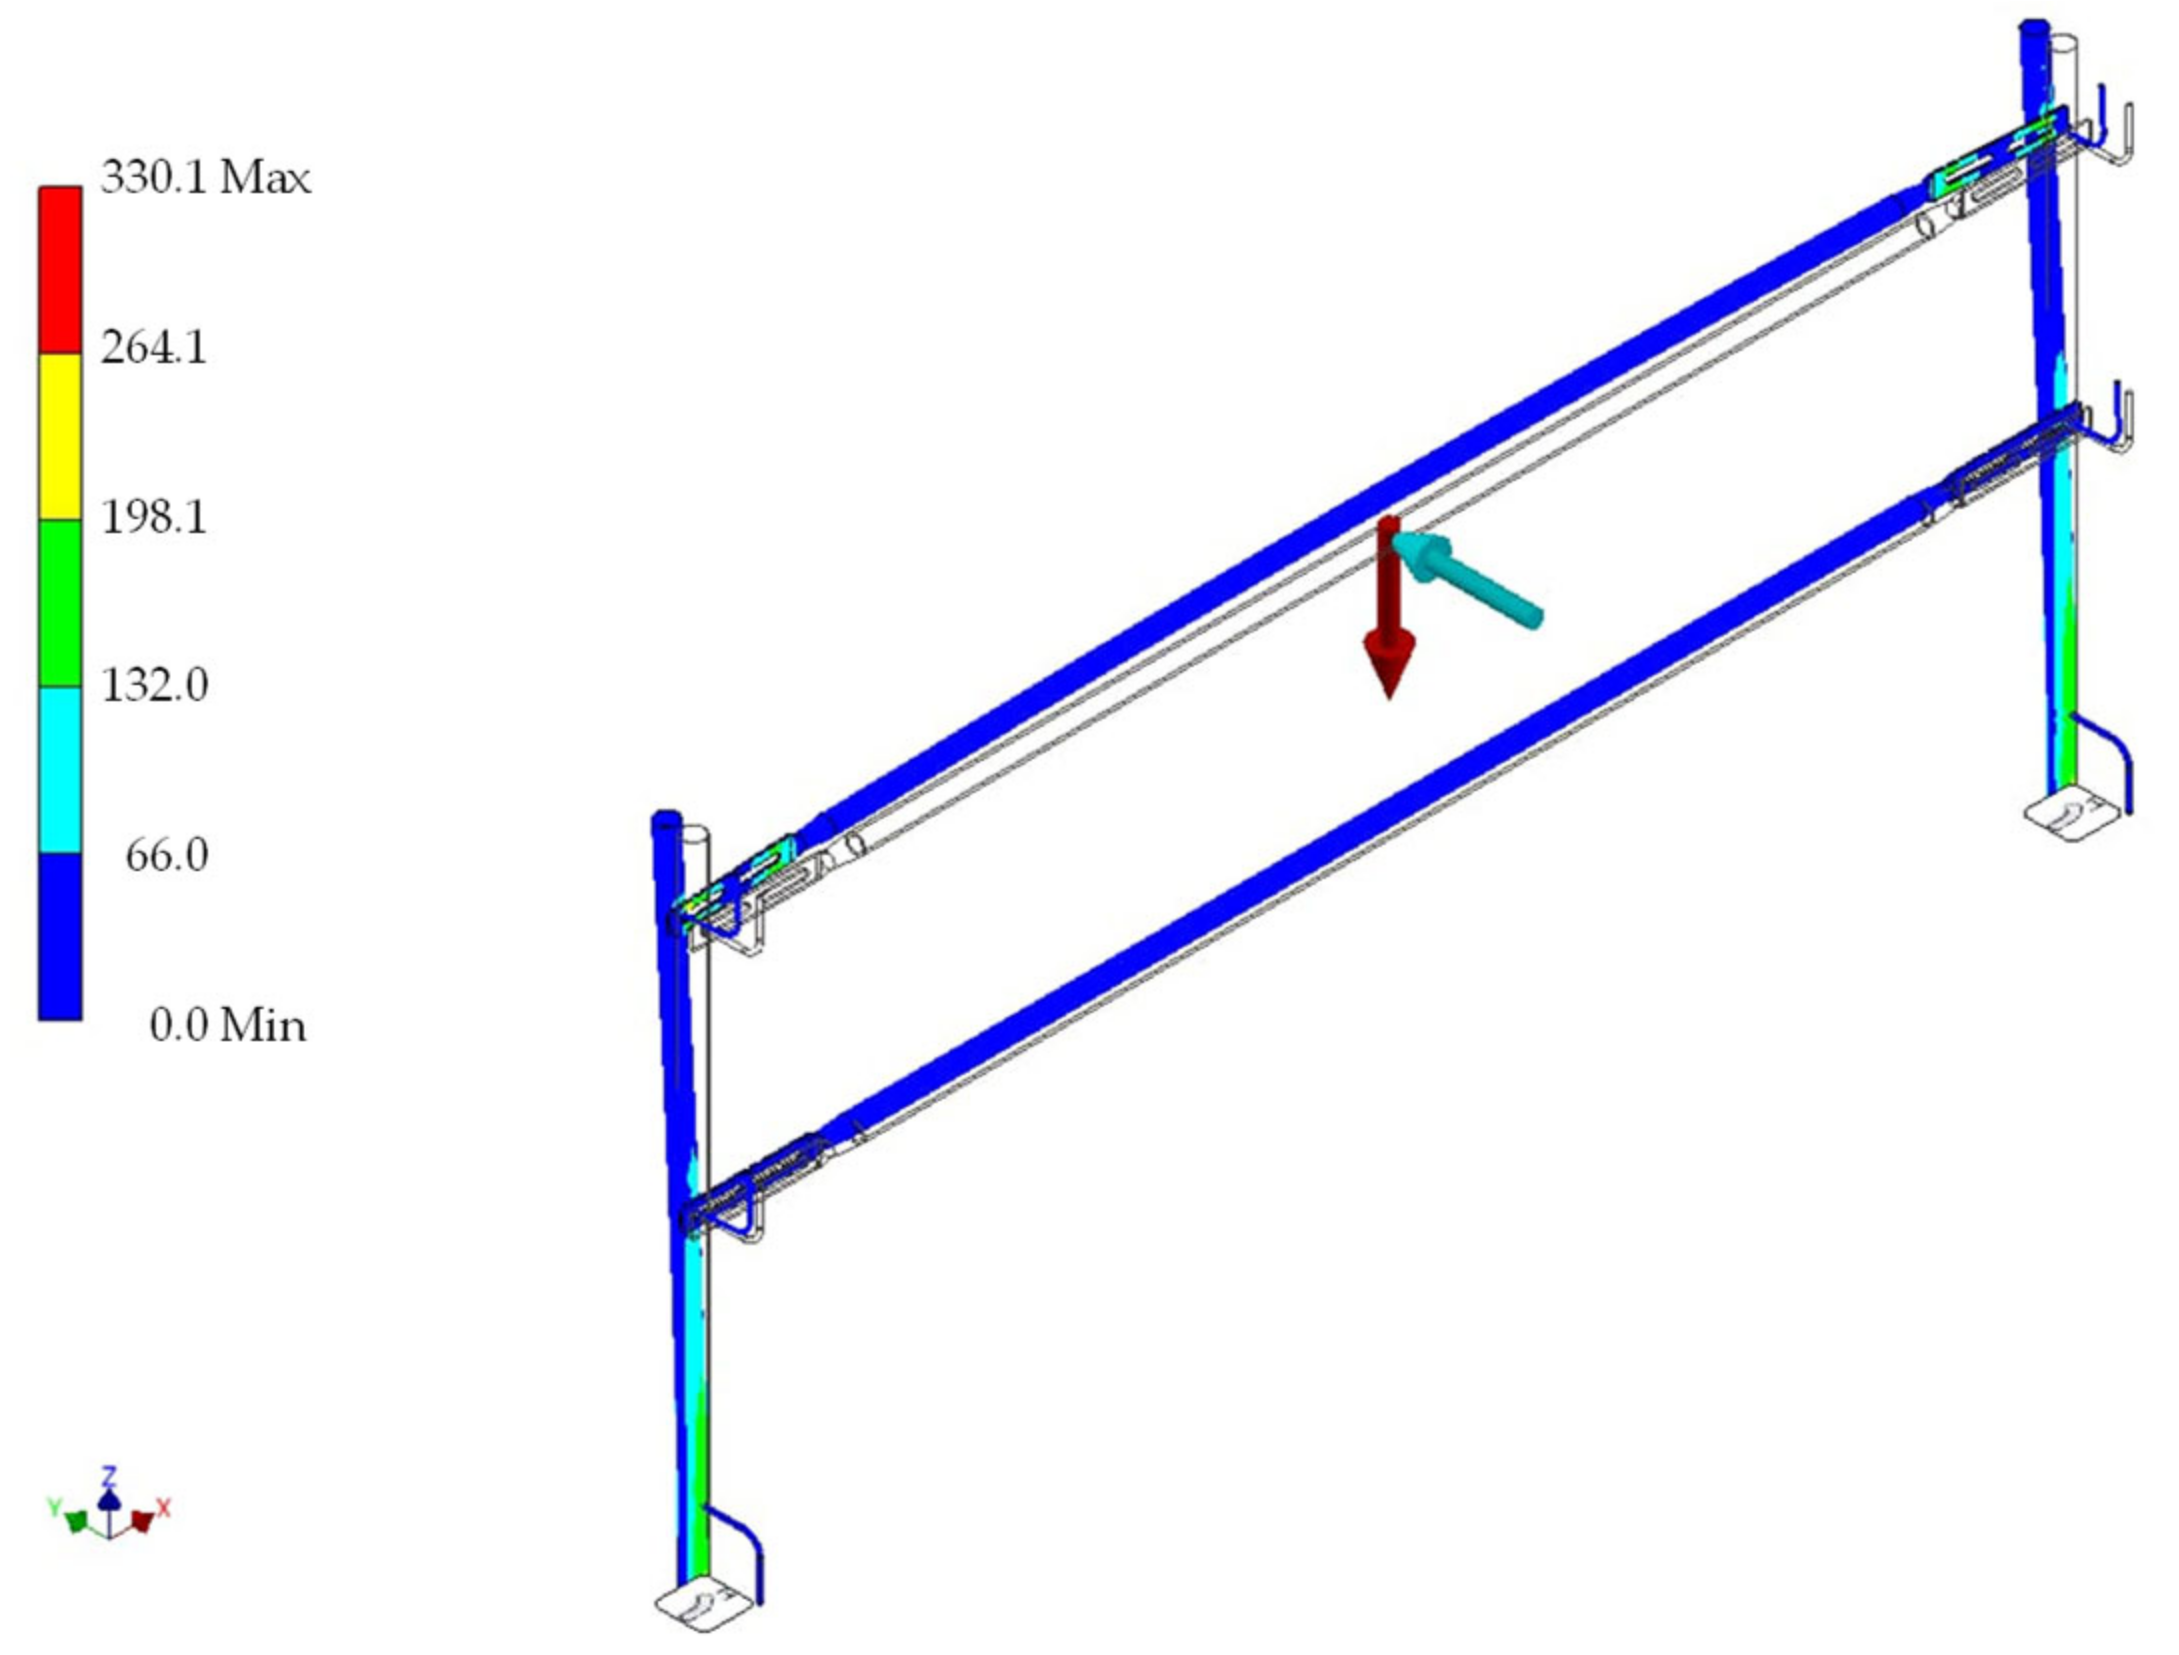
On the other hand, Table 14 shows the flexion results of this test. In this test, the UNE-EN 13374:2013+A1:2019 standard allows compliance with this requirement to be achieved until its breaking capacity is exhausted. From the results obtained after the static structural analysis, applying an accidental point load to the midpoint of the upper horizontal railing, on the part of the metals, both the reference material and the cast iron manage to meet the requirement. However, aluminium requires a new sizing. On the contrary, composite materials more than meet the requirement. In the case of plastics, the requirement is not met. It should also be noted that the stresses obtained for the reference material in the FEA analysis also exceed the established limit (by 2%), so this detail should be studied in the detail design if the reference material is selected and this connection is used.
In addition, Table 15 shows the results of this test. From the results obtained after the static structural analysis, applying an accidental point load to the midpoint of the upper horizontal railing, all materials show optimal behaviour, since, in all cases, a shear resistance higher than the minimum required by the UNE-EN 13374:2013+A1:2019 standard is obtained. However, in accordance with the FEA analysis, a detailed study of the railing–post coupling element is required, as in the previous test, for both the plastics and the reference material.
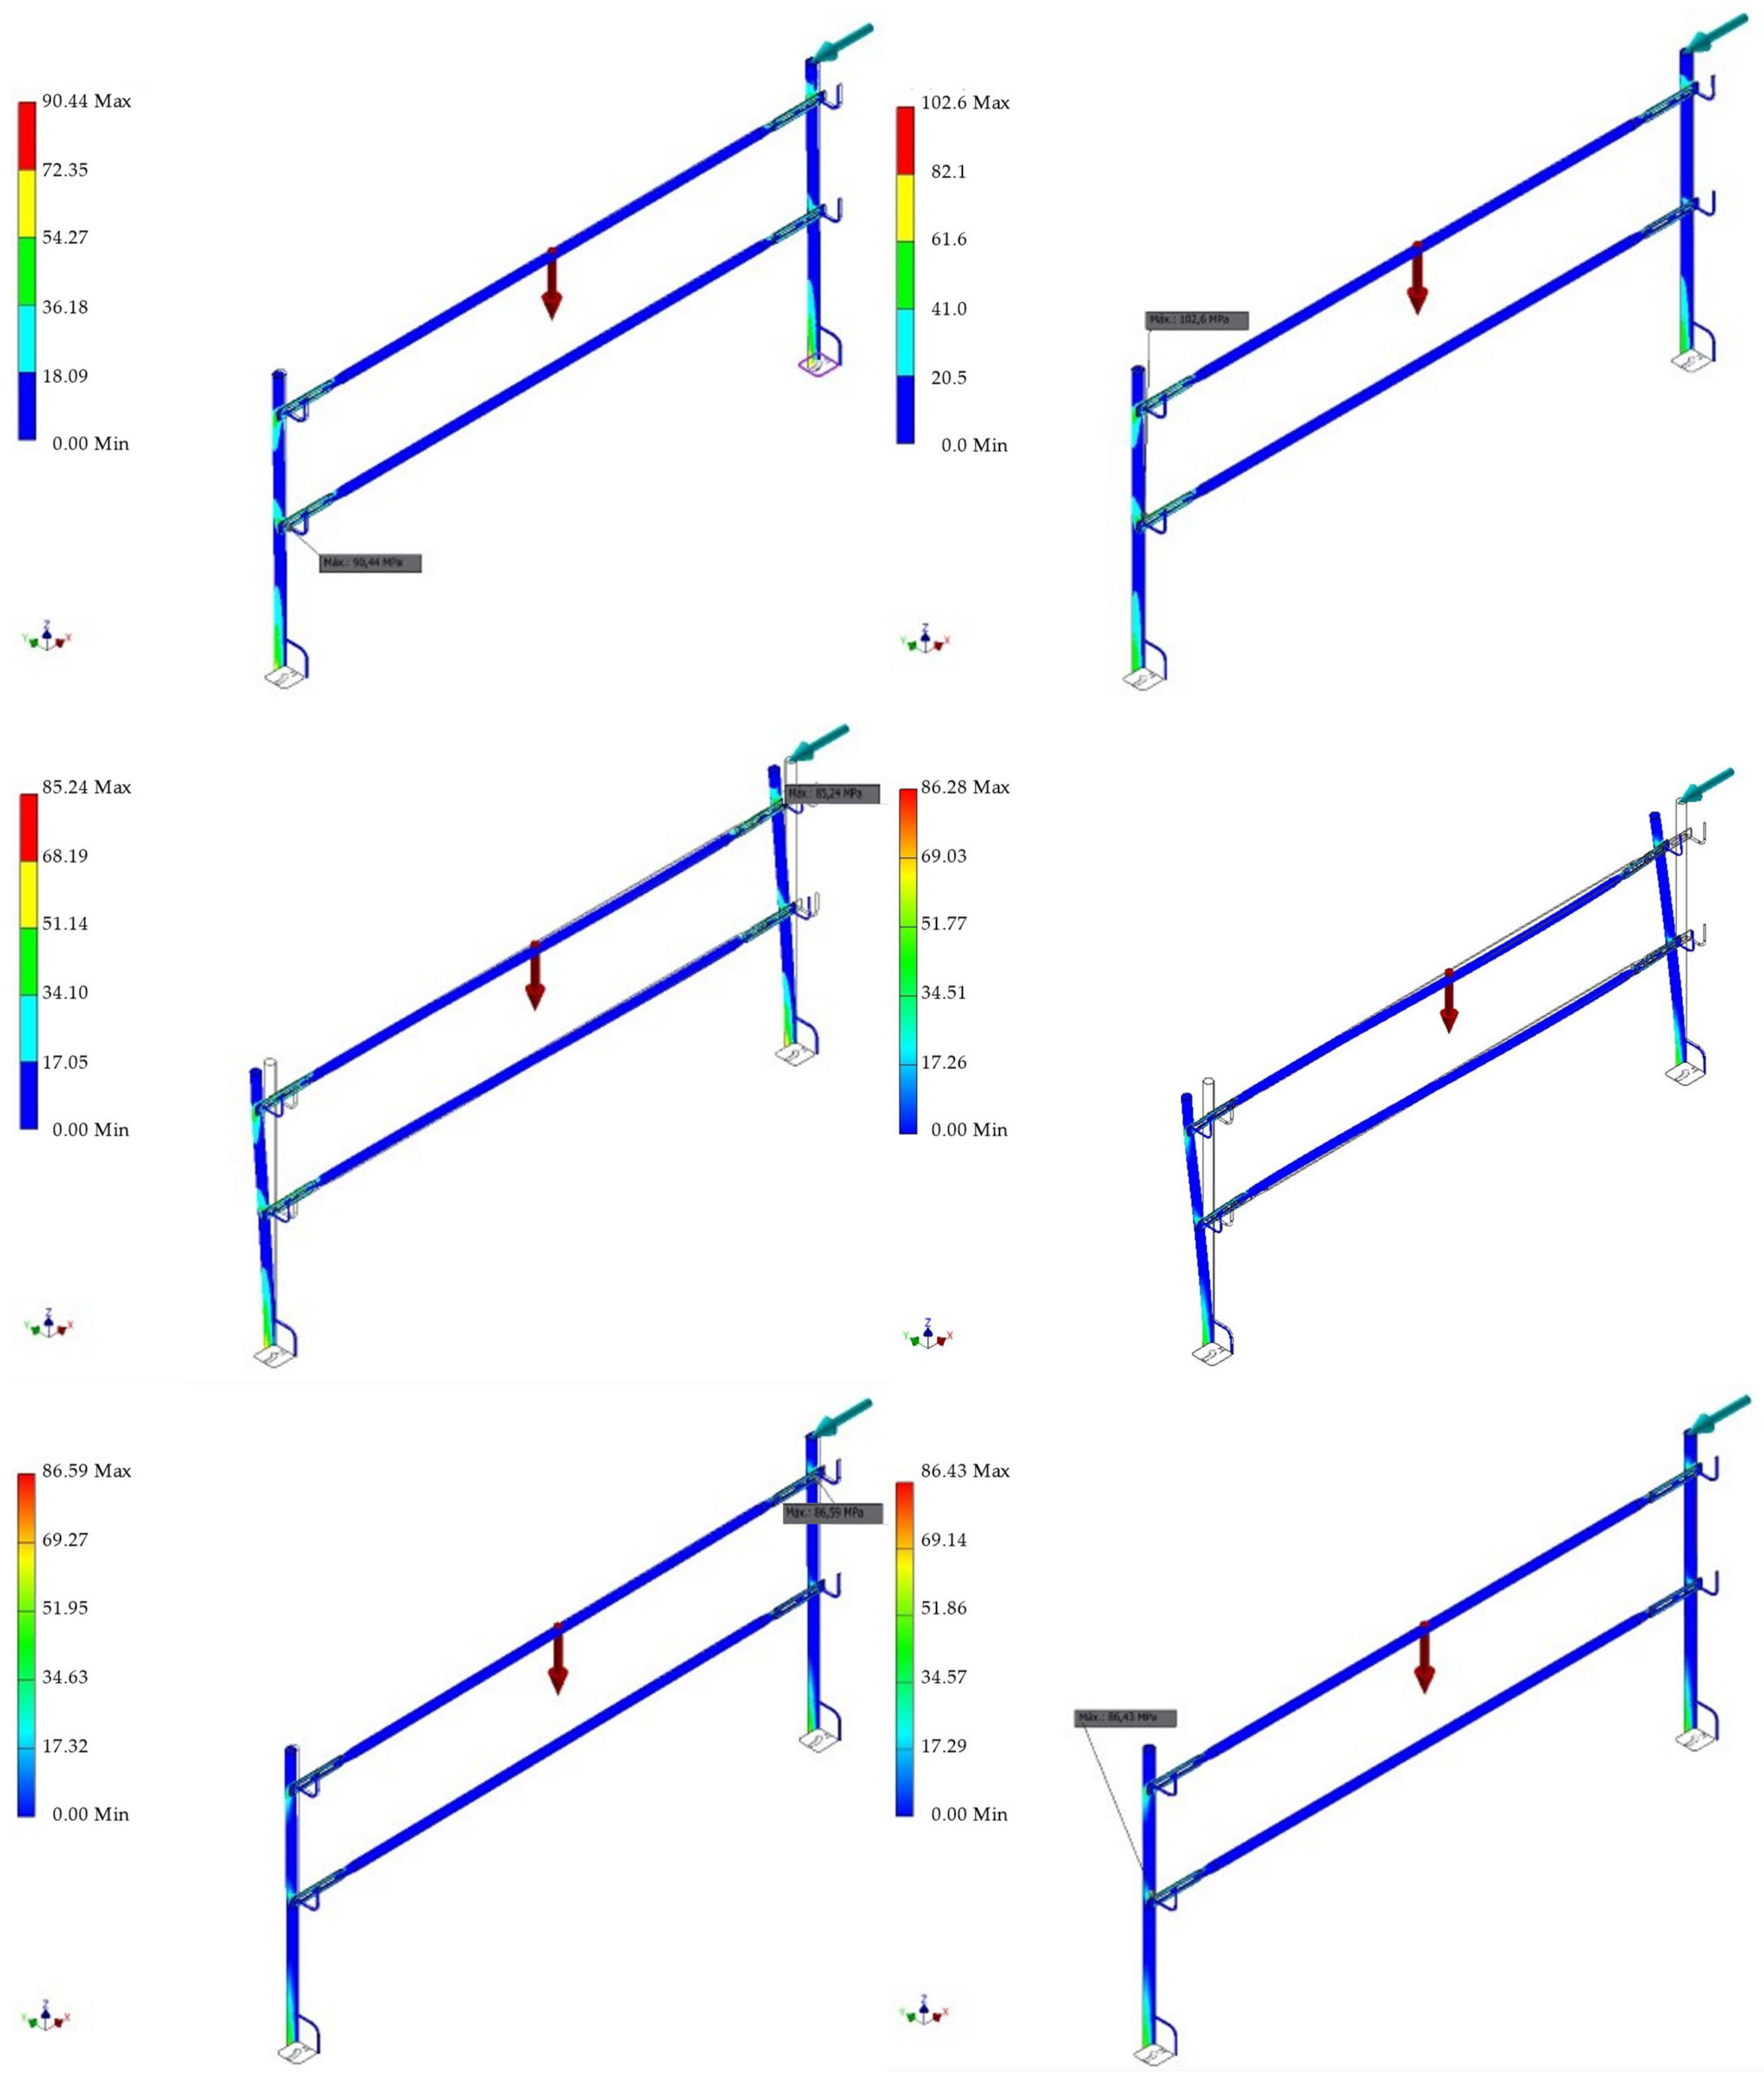
Finally, Figure 10 shows the von Mises stresses of the reference material obtained in the FEA in tests 7 and 8 compared to the ULS requirements of accidental static load. The remaining materials (alternative materials) are shown in Figure A5 of Appendix A.

4.5. Requirement Classification Results

After the end of the questionnaire submission period, 190 replies are received. In order to describe the sample set, a series of control questions is asked related to personal issues (gender, age and level of education), to the company people work for (size and position) and to project management (specific training, professional certification and experience). Table 16 summarises the characteristics of the population sample. Most of the sample is in the middle part of their professional life, working in SME-type companies or self-employed in works of medium-to-large complexity.
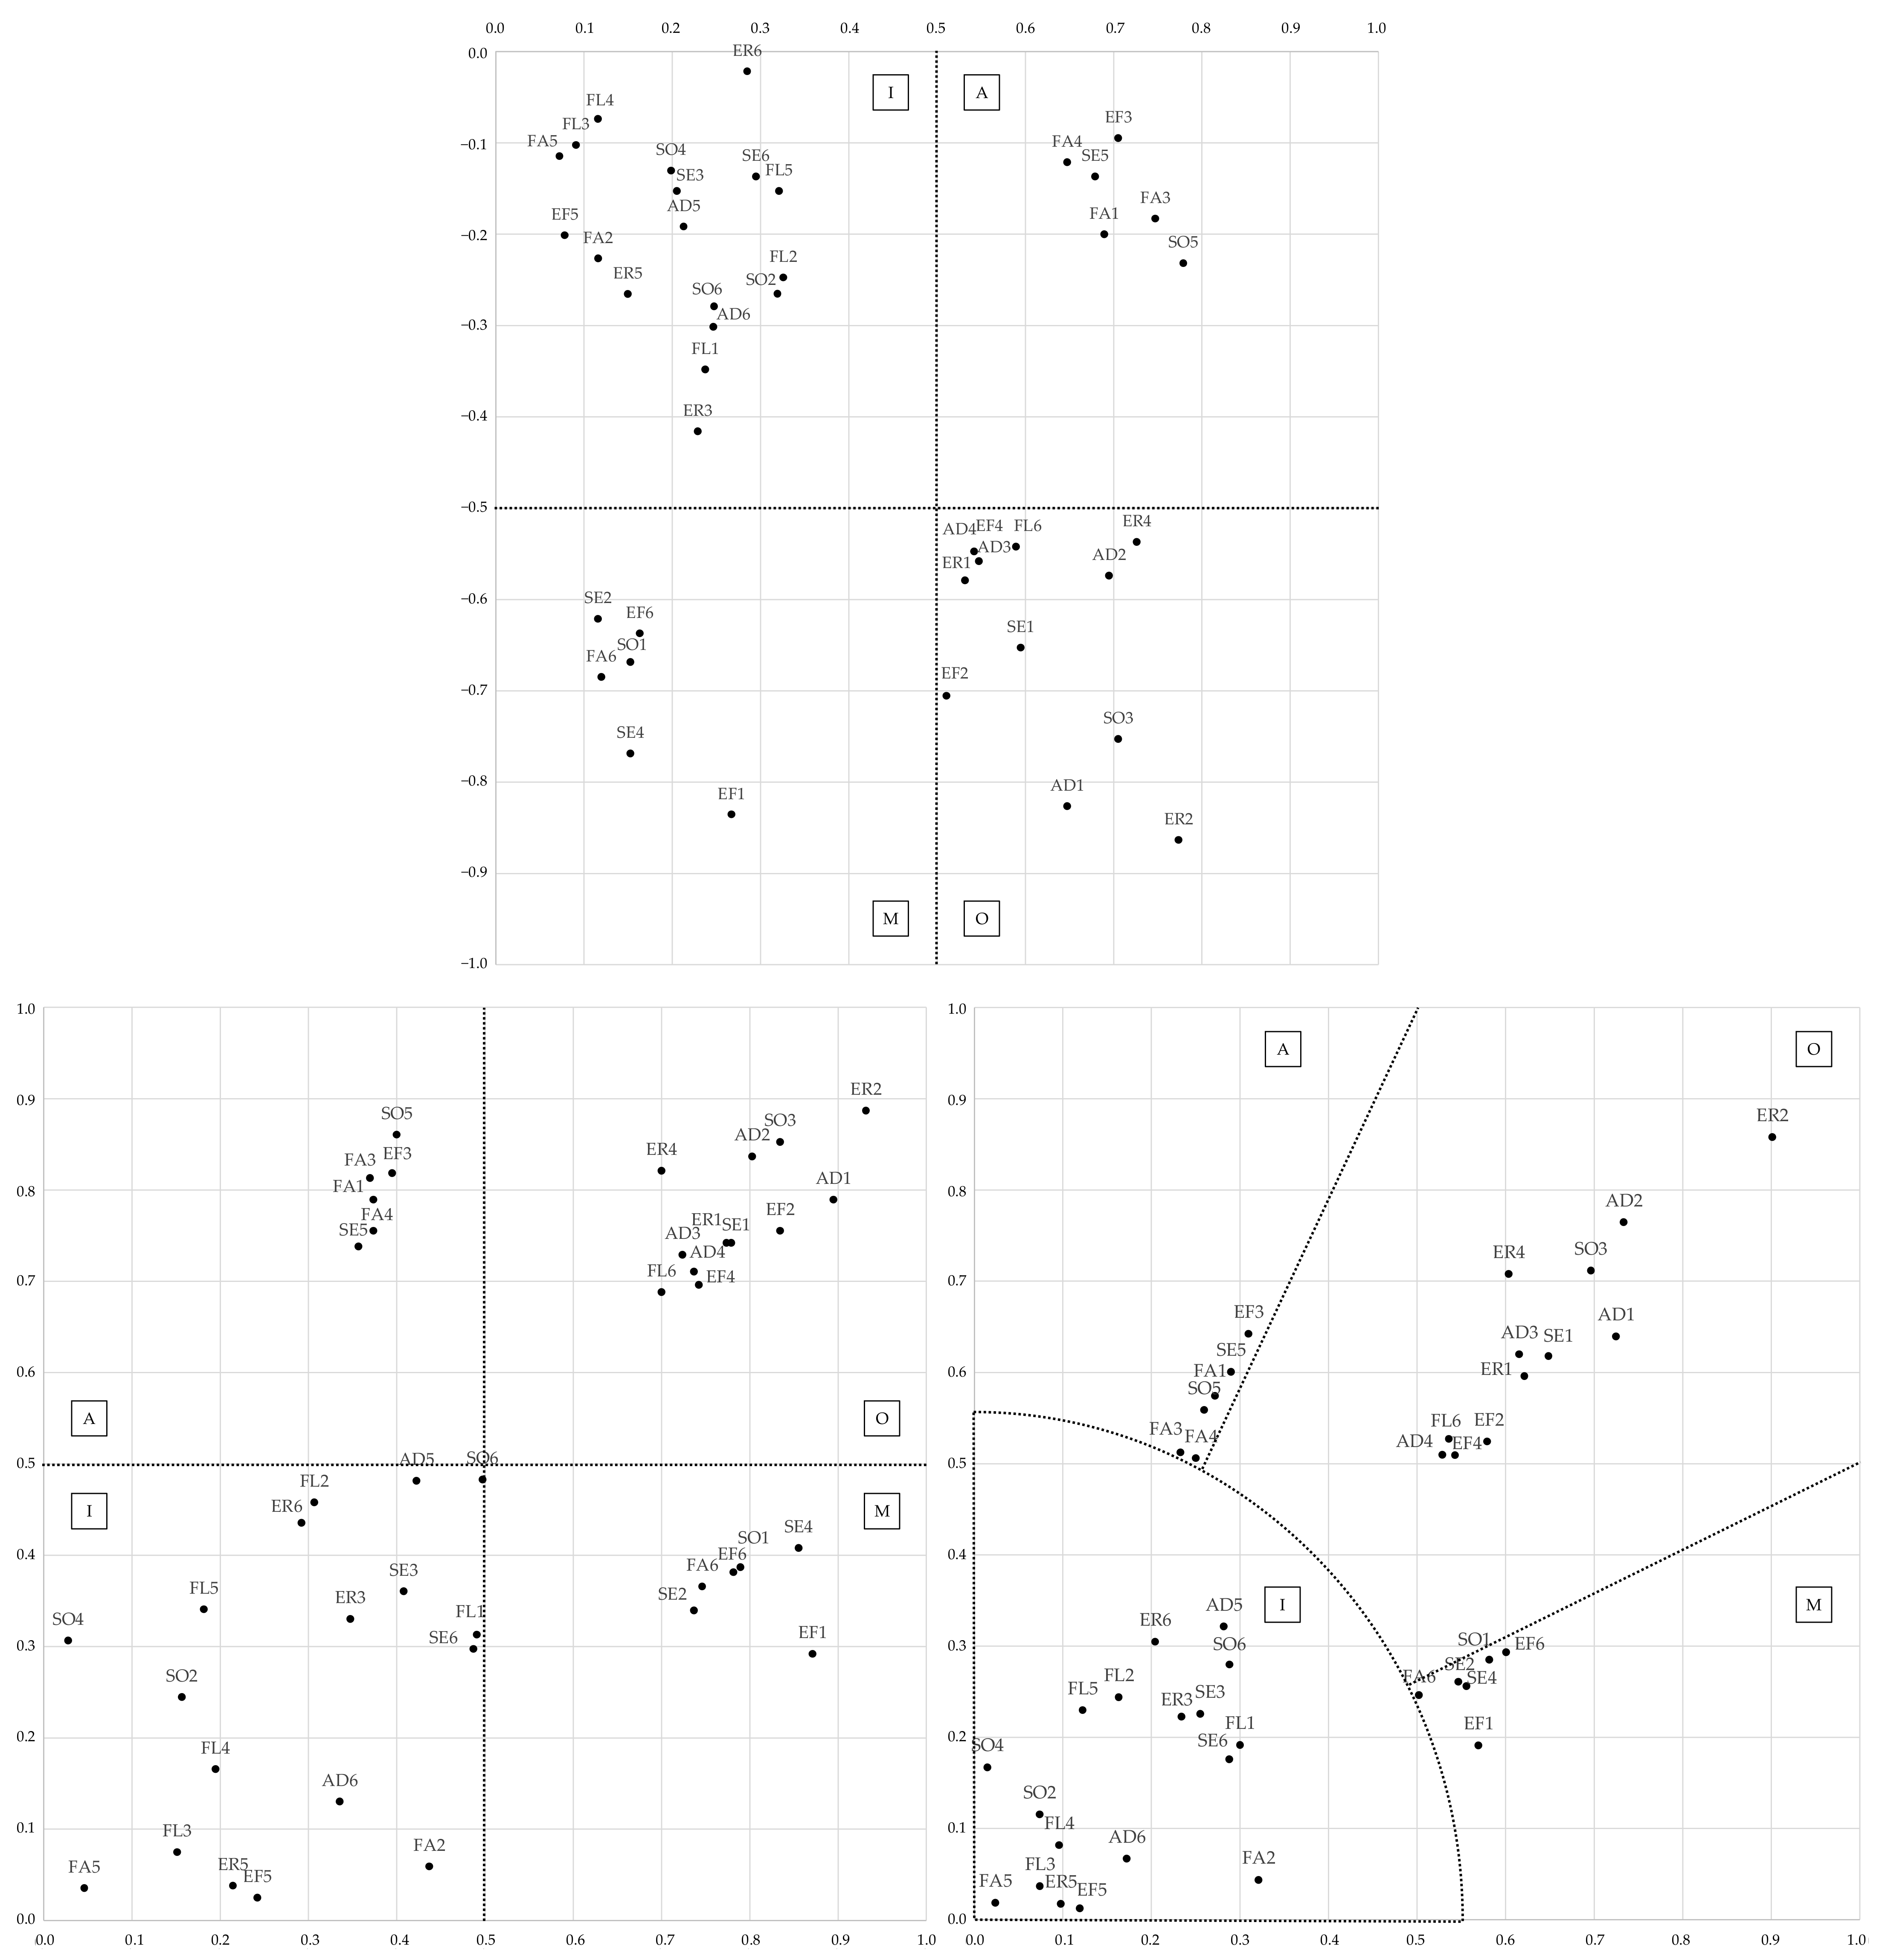
The second part of the survey is shown in Table A1 of Appendix B, which shows the scores of 1−5 for functional and dysfunctional questions, as well as the degree of importance given to each attribute. Using this information, Table A2 of Appendix B is elaborated, using the Kano method to establish the classification of the requirements into indifferent, mandatory, one dimensional and attractive. A summary of this can be seen in Table 17. First, the number of respondents that classifies each requirement as reverse (R), questionable (C), mandatory (O), attractive (A) and one dimensional (U) is counted. Next, the significance of the answers is checked, for which the difference F must be greater than the Q statistic. Once this check is performed, the vector (S, D) is represented in a graph as the requirements help to increase satisfaction and/or decrease dissatisfaction (Figure 11, above). Next, the vector (X, Y) is calculated, which weighs dissatisfaction for potential users if a requirement is not included and satisfaction if it is (Figure 11, bottom left). Subsequently, the normalised importance G given by potential users to that requirement is measured to determine the weighted vector (C1, C2), including its polar coordinates (r, α) (Figure 11, bottom right). According to the data obtained, and ignoring indifferent requirements (I), the remaining requirements are classified into:
  • Mandatory (M):
    SE2, SE4, SO1, FA6, EF1, EF6;
  • Attractive (A):
    SE5, SO5, FA1, FA3, FA4, EF3;
  • One dimensional (O):
    SE1, ER1, ER2, ER4, SO3, EF2, EF4, FL6, AD1, AD2, AD3, AD4.
Table 17. Classification of mandatory, attractive and one-dimensional requirements.
IDAttributeSiDiTypeXiYiTypeGiC1iC2iType
SESecurity:
SE1Resistance to mechanical stress0.59−0.65U0.740.78U8.330.620.65U
SE2Resistance to extreme temperatures0.12−0.62O0.340.74O7.540.260.56O
SE4Resistance to bad weather0.15−0.77O0.410.86O6.390.260.55O
SE5Safety through locking parts0.68−0.14A0.740.36A8.140.600.29A
ERErgonomics:
ER1Decomposition into low-weight elements0.53−0.58U0.740.77U8.030.600.62U
ER2Assembly/disassembly with ease0.77−0.86U0.890.93U9.670.860.90U
ER4Functionality in different lengths and heights0.73−0.54U0.820.70U8.620.710.60U
SUSustainability:
SU1Use of fire-resistant materials0.15−0.67O0.390.79O7.370.290.58O
SU3Use of durable materials0.71−0.75U0.850.83U8.350.710.70U
SU5Availability of spare parts0.78−0.23A0.860.40A6.490.560.26A
FAFabricability:
FA1Manufacturing with light materials0.69−0.20A0.790.37A7.270.570.27A
FA3Manufacturing with composite materials0.75−0.18A0.810.37A6.300.510.23A
FA4Manufacturing with recycled materials0.65−0.12A0.760.37A6.700.510.25A
FA6Manufacturing with industrial/standardised materials0.12−0.68O0.370.75O6.730.250.50O
EFEfficiency:
EF1Transport by truck0.27−0.84O0.290.87O6.540.190.57O
EF2Transport by van0.51−0.71U0.760.83U6.940.520.58U
EF3Transport by car0.71−0.09A0.820.39A7.850.640.31A
EF4Storage in racks0.54−0.55U0.700.74U7.320.510.54U
EF6Procurement at low cost0.16−0.64O0.380.78O7.680.290.60O
FLFlexibility:
FL6Use of existing elements in the market0.59−0.54U0.690.70U7.660.530.54U
ADAdaptability:
AD1Manoeuvrability in different workplaces0.65−0.83U0.790.89U8.100.640.72U
AD2Compatibility with existing systems0.69−0.57U0.840.80U9.140.760.73U
AD3Versatility for use on different types of work sites0.55−0.56U0.730.72U8.510.620.62U
AD4Procurement of customised system elements0.54−0.55U0.710.74U7.170.510.53U
Figure 11. Requirements according to increase in satisfaction/reduction in dissatisfaction.
Sustainability 14 14285 g011

4.6. Results of Hierarchisation of Materials According to the List of Requirements

The first step is to form the panel of experts, following the indications established in the methodology. The panel is made up of six experts with no less than 15 years of relevant experience, representing development and a construction companies, engineering and architecture studios, a collaborating mutual society and the body of labour inspectors. Although the sample size is small, several studies have pointed out that panel size is not a limitation, as AHP can be conducted with a small number of participants to achieve sound and statistically robust results [84,85,86]. These experts act as decision makers, making their consensual value judgments on the pairwise comparisons of the modelled AHP problem.
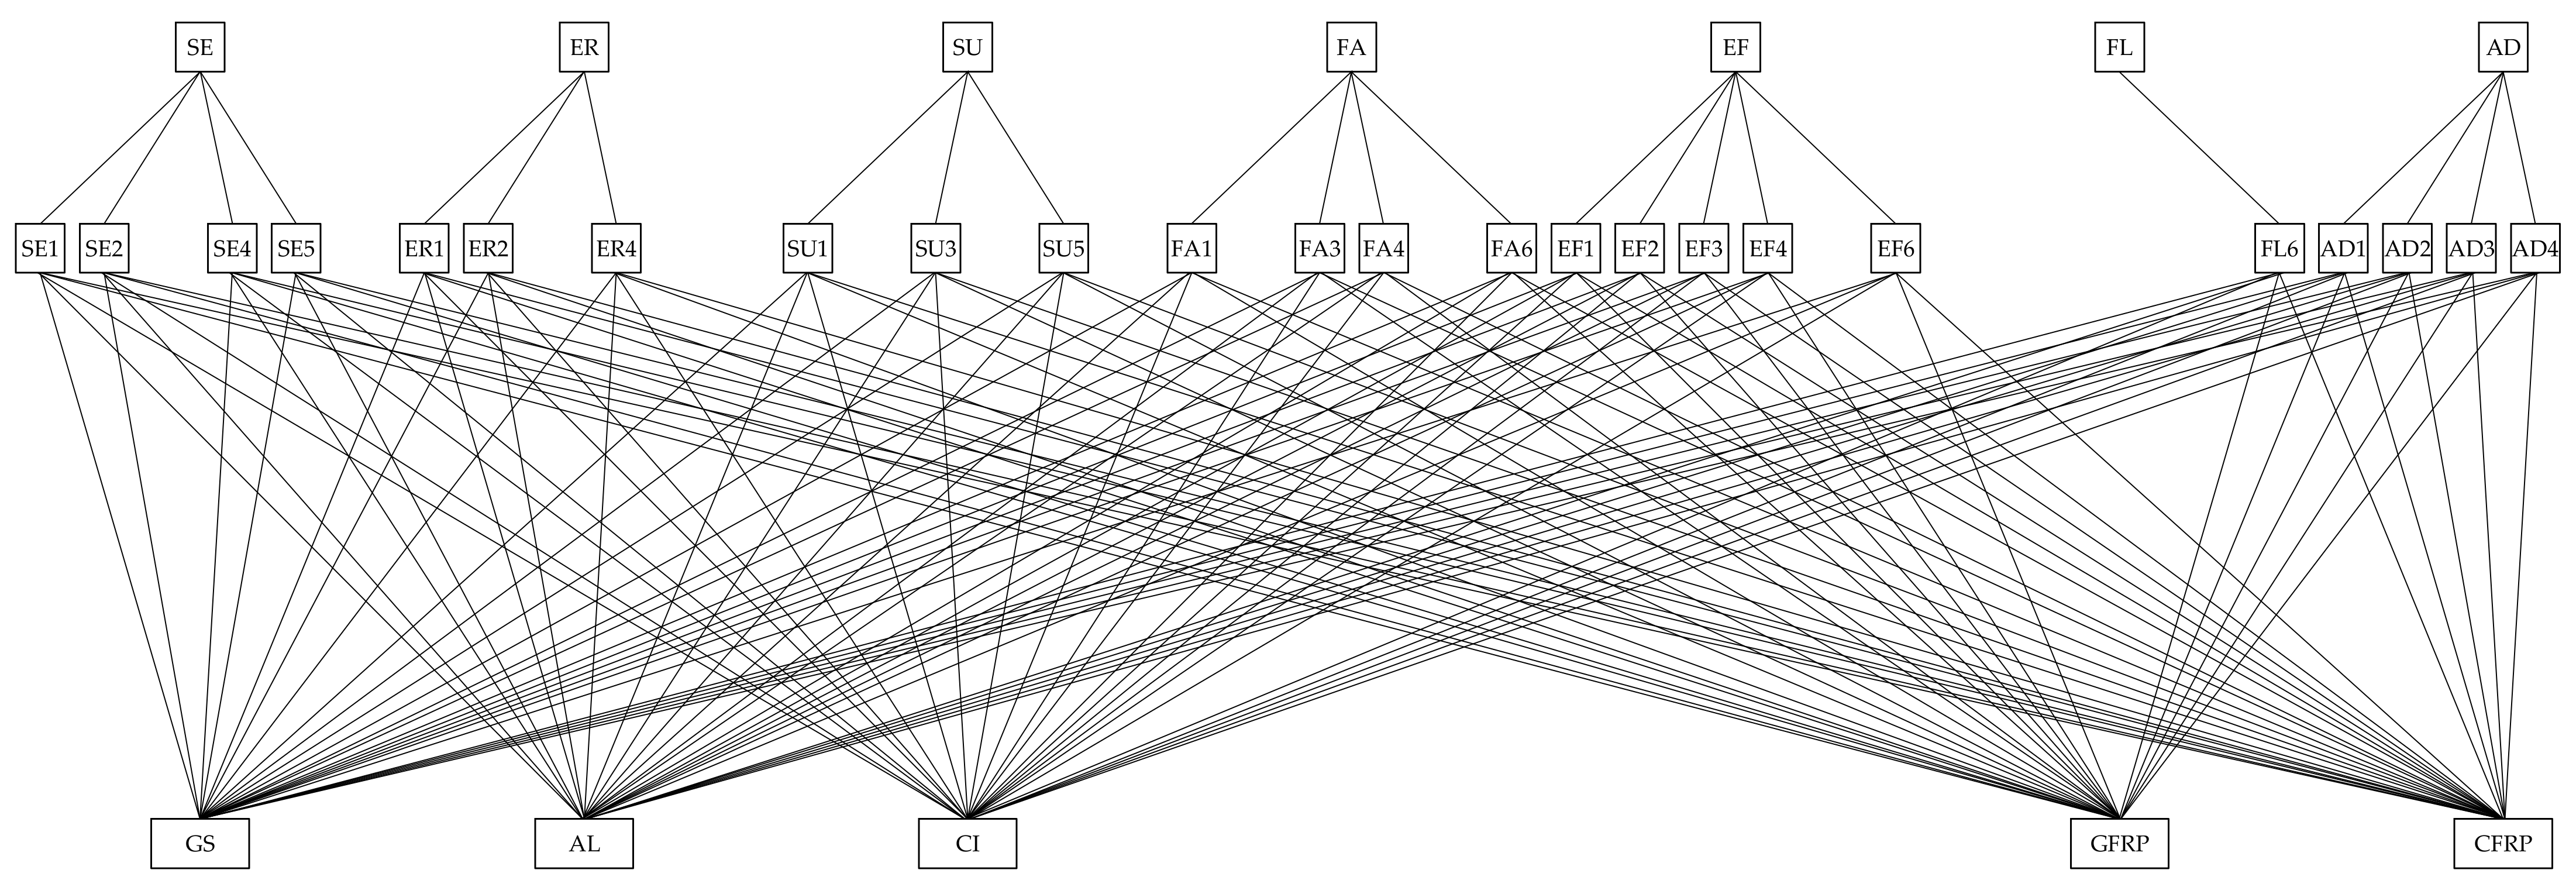
Figure 12 shows the AHP problem presented to the expert panel once the plastic materials and indifferent requirements are discarded.
The second step is to compare the criteria in pairs. Table A3 of Appendix C.1 shows the results (by consensus) of this comparison, as well as the chosen scale and the consistency of the weighting. Next, in Table A4, Table A5, Table A6, Table A7, Table A8, Table A9 and Table A10 of Appendix C.2, the sub-criteria (attributes that make up the set of potential requirements) are compared, returning to decide the scale of the comparison and checking the consistency of each matrix. Table 18 summarises the weights of the criteria and sub-criteria weighted by the panel of experts.
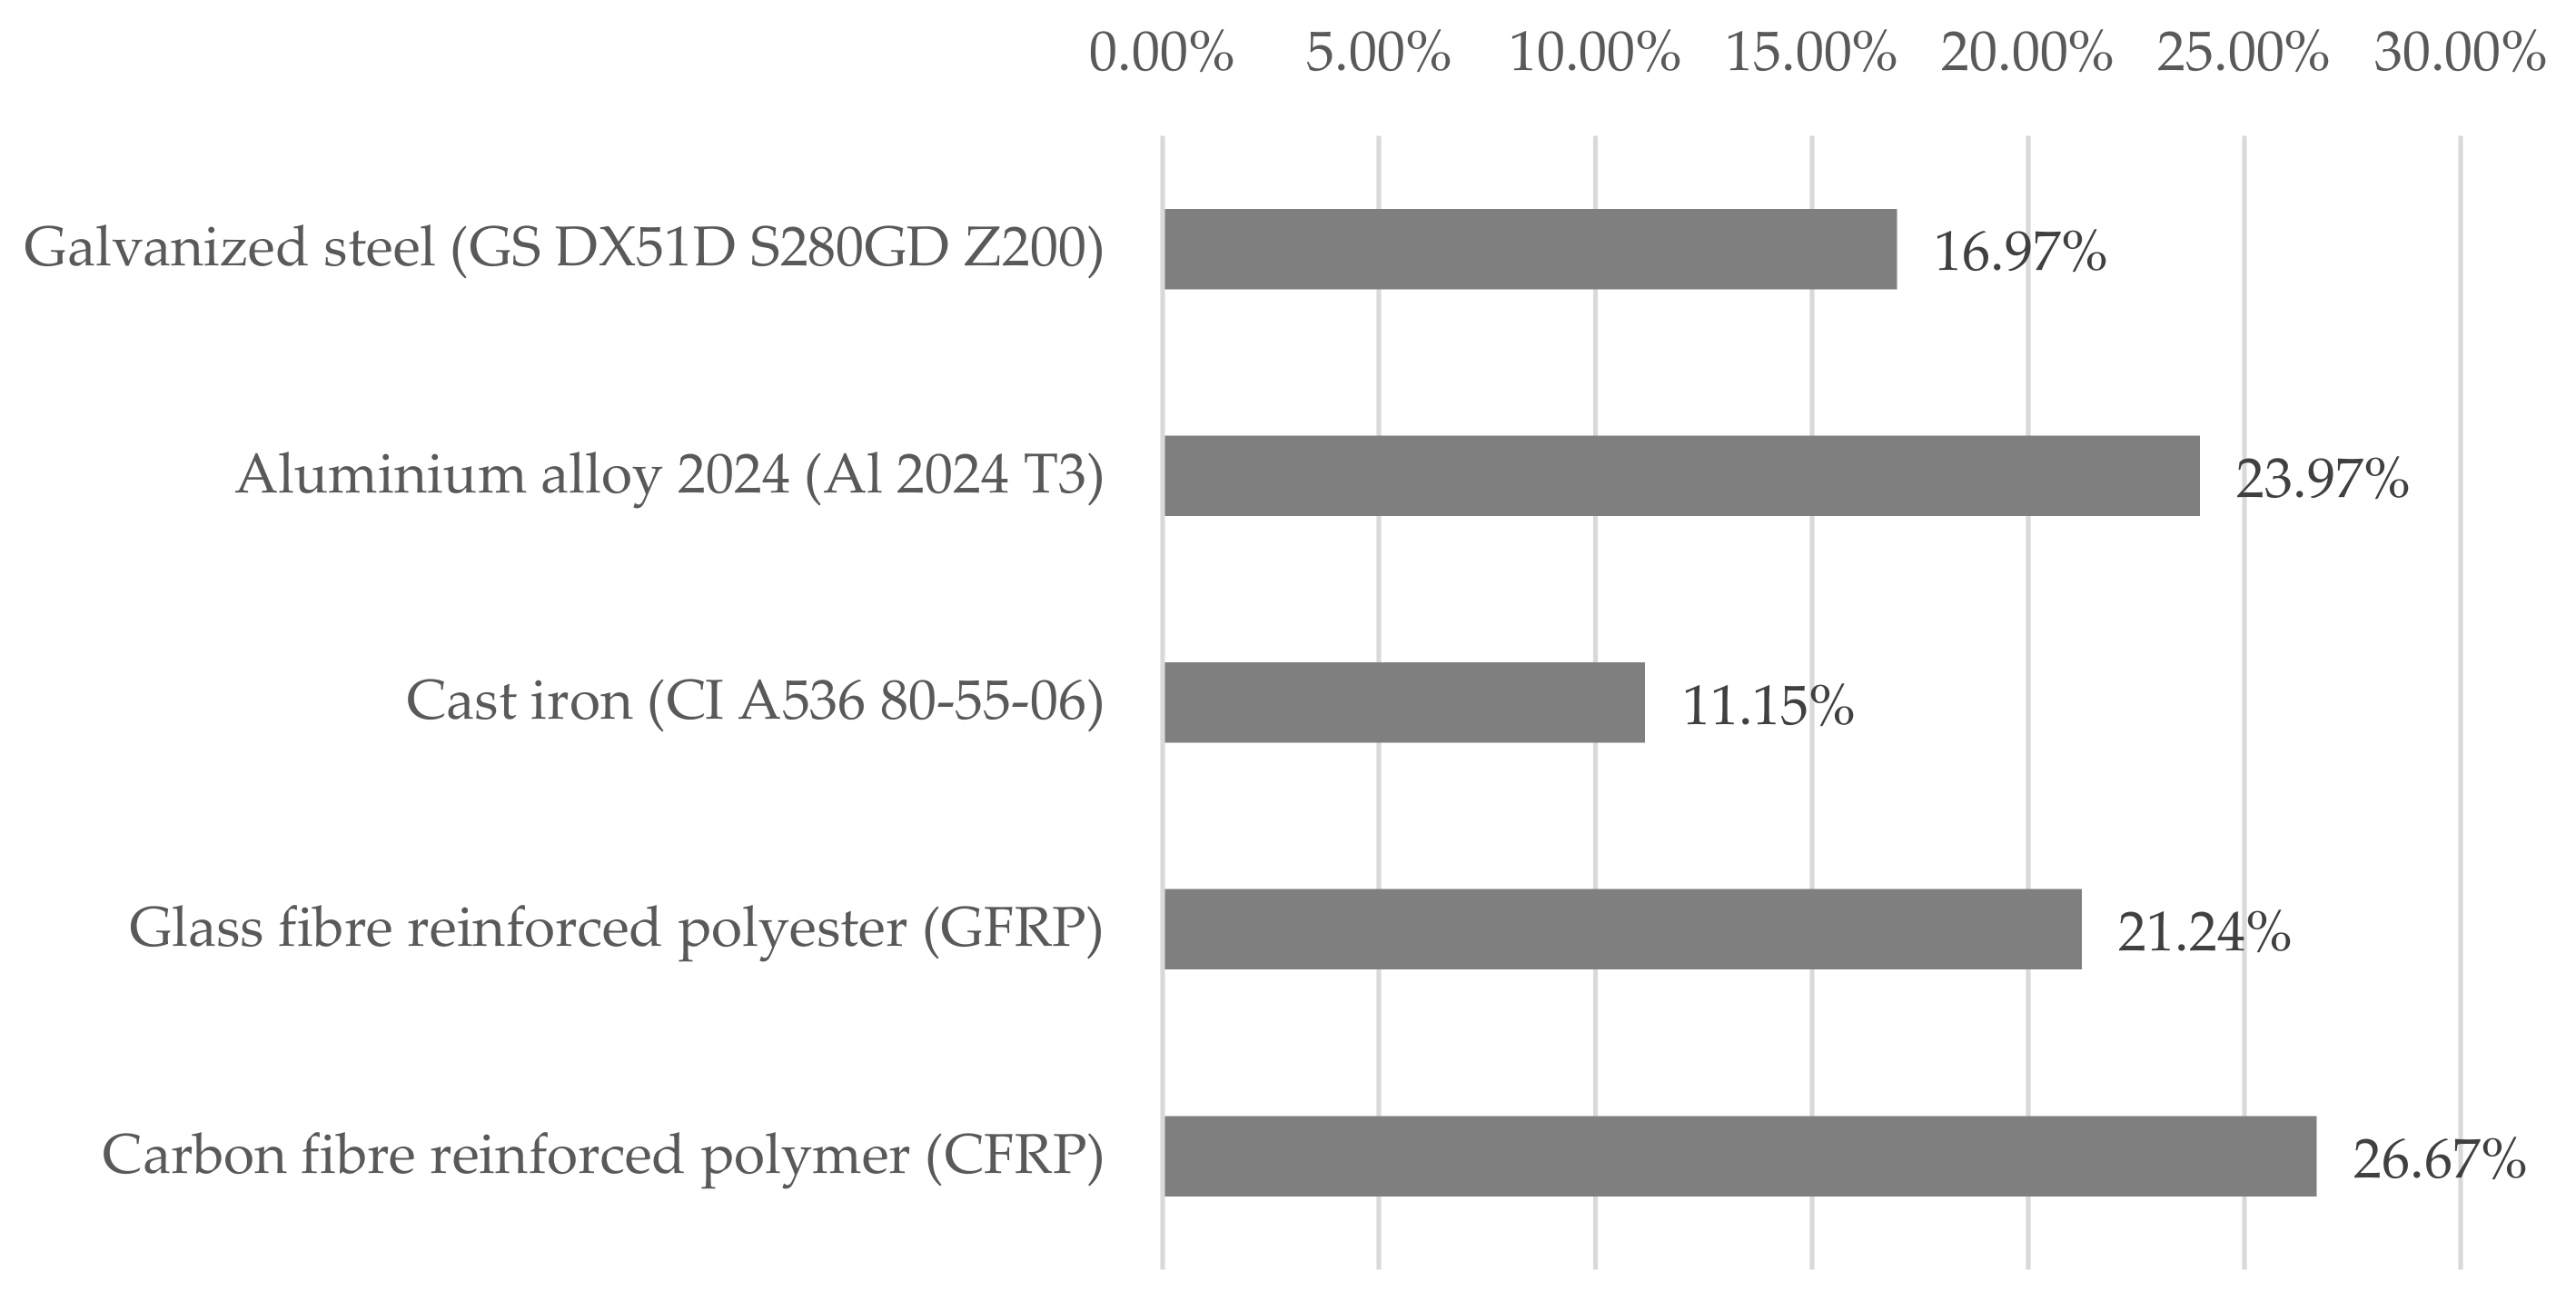
Finally, the panel of experts weighs the adequacy of each alternative for each potential requirement, as reflected in Table A11, Table A12, Table A13, Table A14, Table A15, Table A16, Table A17, Table A18, Table A19, Table A20, Table A21, Table A22, Table A23, Table A24, Table A25 and Table A26 of Appendix C.3. Figure 13 summarises the results obtained, verifying the adequacy of three alternative materials to the galvanised steel normally used for this type of system: aluminium, glass-fibre-reinforced plastic and carbon-fibre-reinforced polymer. Furthermore, cast iron can be discarded due to its inadequacy in satisfying the requirements contemplated.

5. Discussion of Results

Table 19 summarises the results obtained in the tests according to the UNE-EN 13374:2013+A1:2019 standard for the selected materials (metals, plastics and composites) and original dimensions (in yellow if the non-compliance is less than 30%, in orange if the non-compliance is higher). Based on these results, plastic materials are discarded due to their low performance in bending tests. On the contrary, previous studies analysed the high-density polyethylene (HDPE) materials to be applied but in surface (non-linear) elements [62]. Likewise, both the reference material and cast iron and carbon-fibre-reinforced polymer are postulated as good candidates for the next stage of the study. However, aluminium and glass-fibre-reinforced polyester require a more detailed study in terms of sizing (outer diameter and/or thickness). If the elements are resized to obtain compliance with the tests, as shown in Table 20 (outer diameter thickness in mm), then the degree of compliance reveals that only plastics have to be discarded, with aluminium and glass-fibre-reinforced plastic becoming suitable, as shown in Table 21. The use of aluminium alloys in temporary demountable structures has been previously analysed [87]. However, to the best of our knowledge, the use of composite materials such as GFRP or CFRP is a novelty in the field of collective safety protection on construction sites.
As for the requirements to be considered, the Kano method and its variants allow the requirements from the literature review to be classified, with the indifferent ones being discarded. Table 22 shows the mandatory, attractive and one-dimensional requirements according to the results obtained through a survey of 190 potential users. In this way, of the 42 initial requirements, 24 stand out from the rest. It should be noted that all defined dimensions (safety, ergonomics, sustainability, fabricability, efficiency, flexibility and adaptability) are represented.
The capacities of the system to withstand extreme temperatures (including fire) and inclement weather, to be manufactured in an industrialised way so that it can be transported by lorry and to be of low cost are postulated as mandatory requirements capable of reducing dissatisfaction. Likewise, for the system to have high mechanical capacity and durability, to be made up of lightweight elements, to be easy to assemble and disassemble in different lengths and heights and to be transportable by van and storable on shelves, as well as the possibility of acquiring these elements independently, are postulated as one-dimensional requirements capable of both reducing dissatisfaction and increasing user satisfaction. In addition, the system being able to use elements that already exist on the market and being compatible with other current systems, as well as its manoeuvrability in different workplaces and its versatility for different types of work, are also postulated as one-dimensional requirements. Finally, the attractive requirements that stand out are the incorporation of safety measures such as using locking parts, the availability of spare parts, the use of lightweight composite, recycled and/or recyclable manufacturing materials, the ability to be transported in a private passenger car, and all are capable of increasing the satisfaction of potential users. These findings are aligned with previous studies on scaffolding standardisation [88].
Once the requirements are classified, they are hierarchised using the AHP method without differentiating their ability to increase satisfaction and/or reduce user dissatisfaction on incorporation, establishing a pairwise comparison system at two levels: criteria and sub-criteria. This process is summarised in Figure 14.
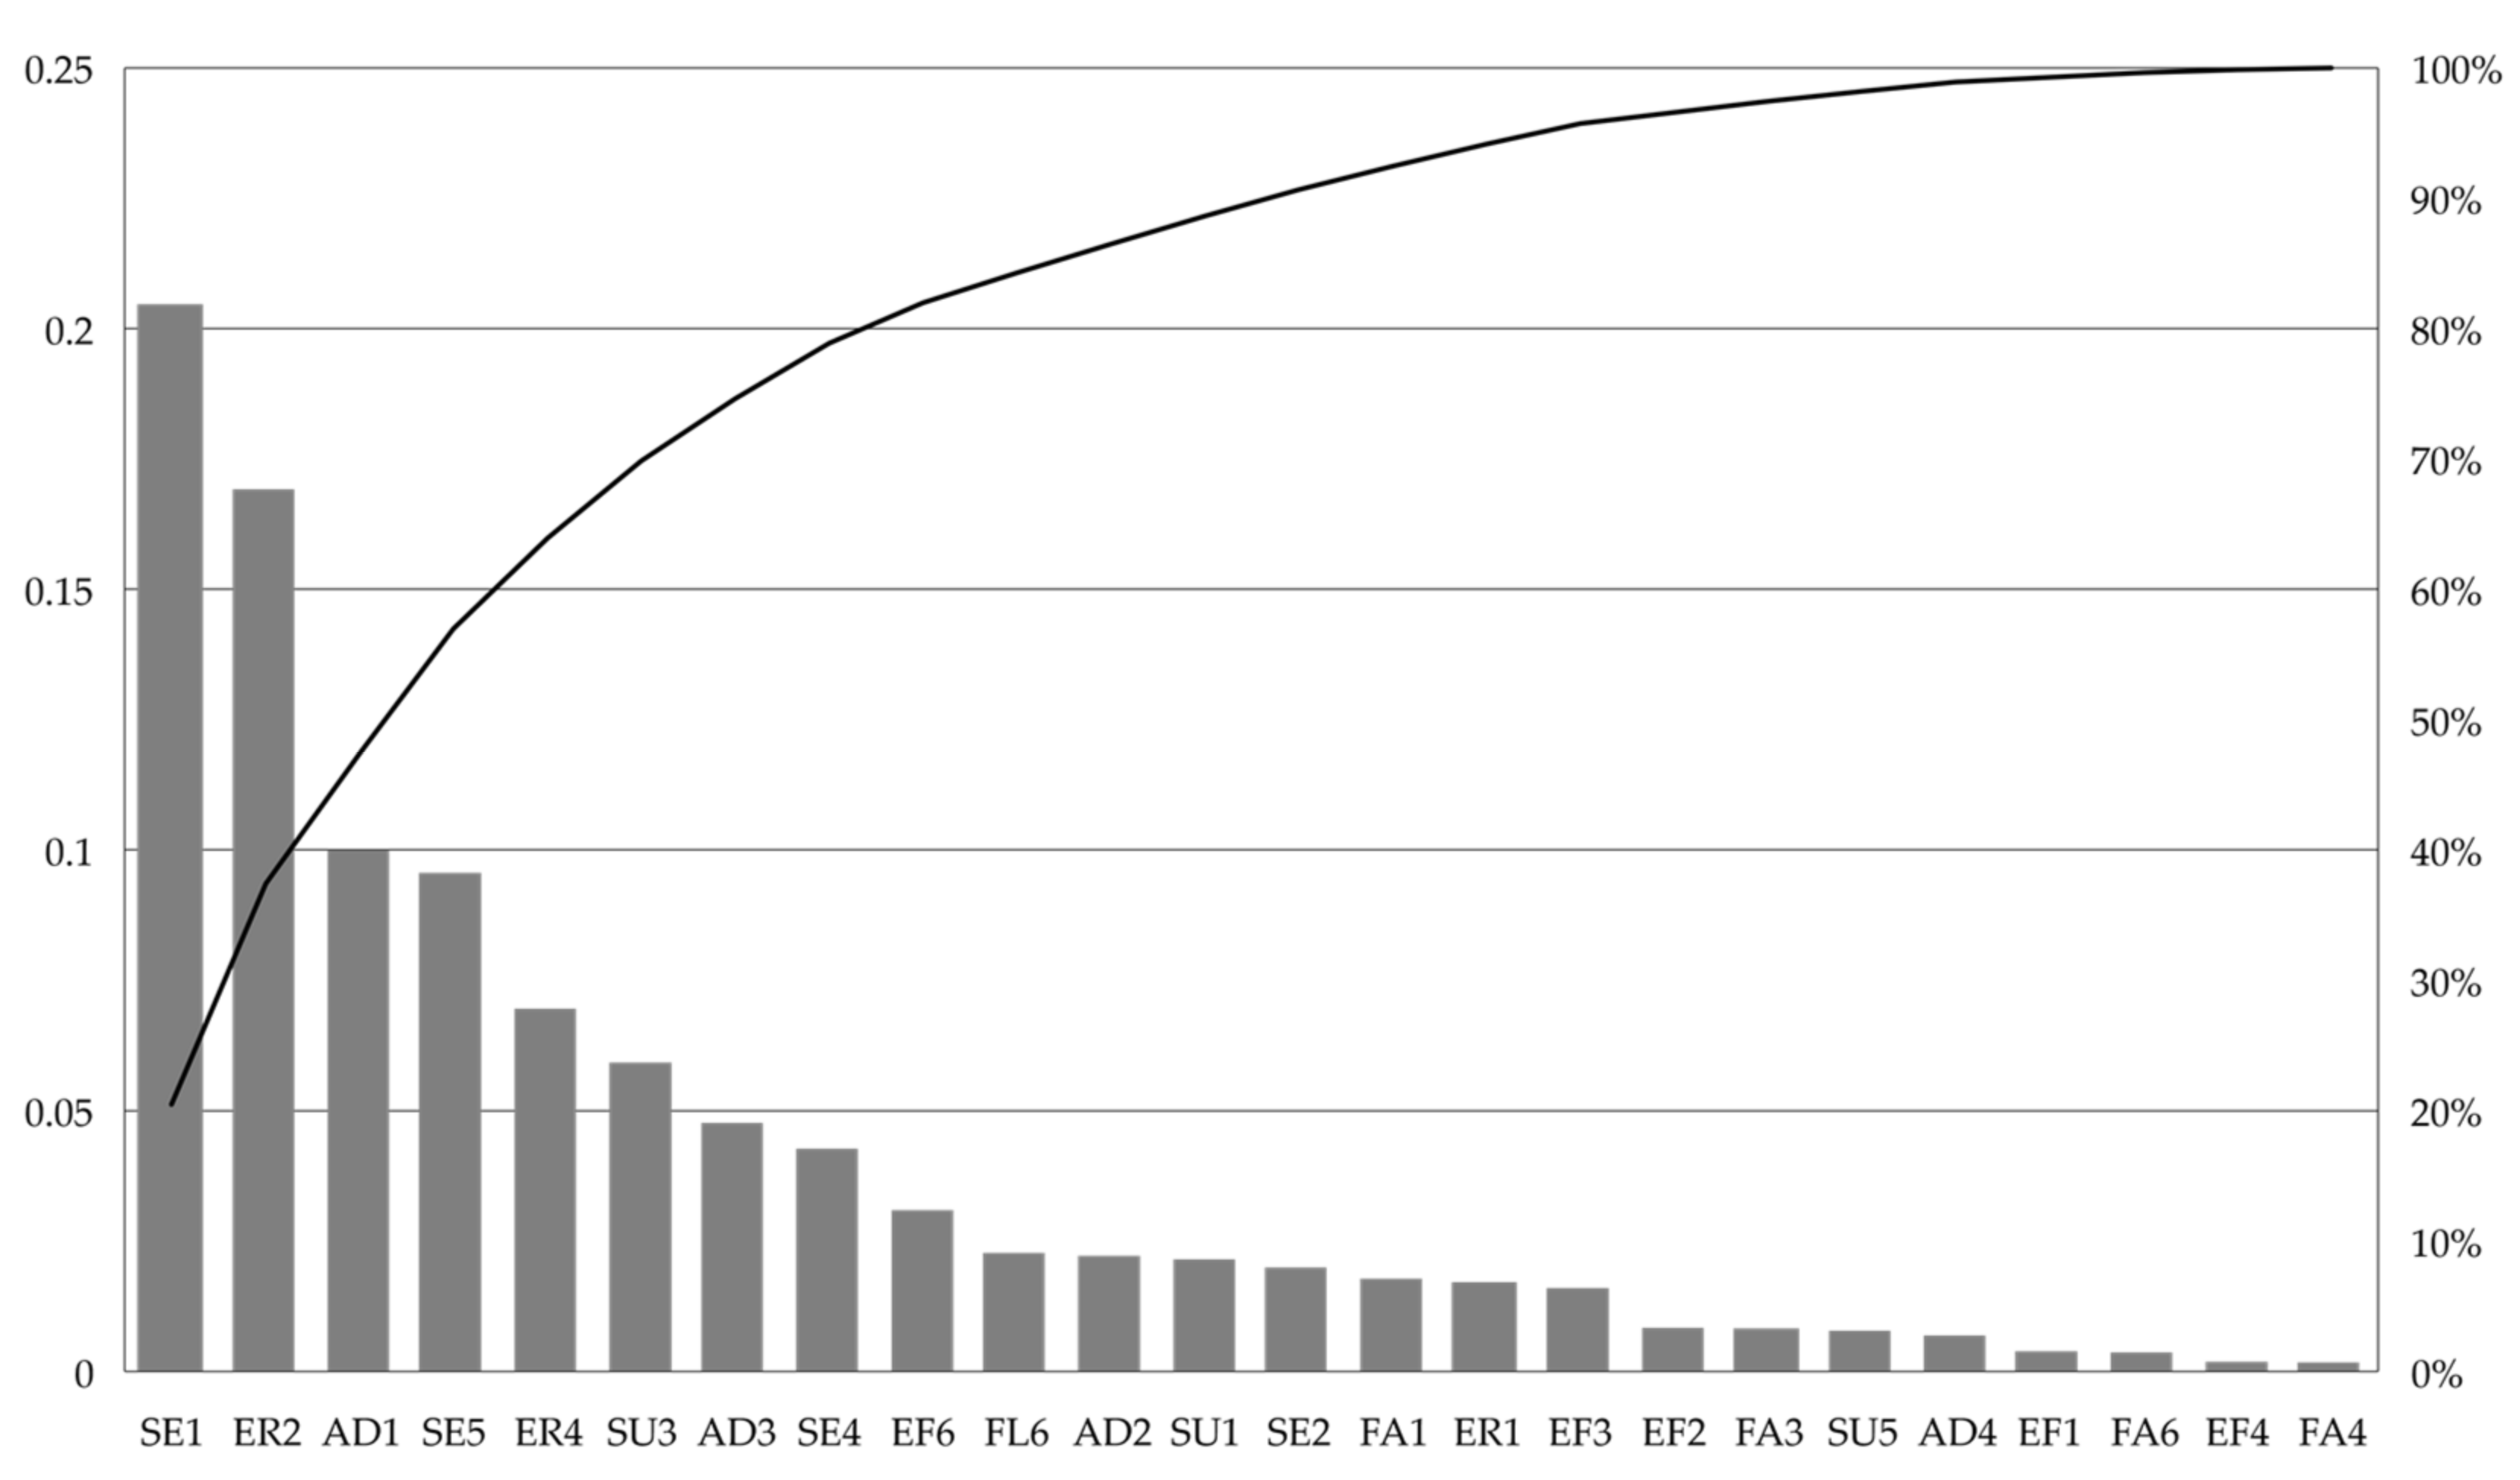
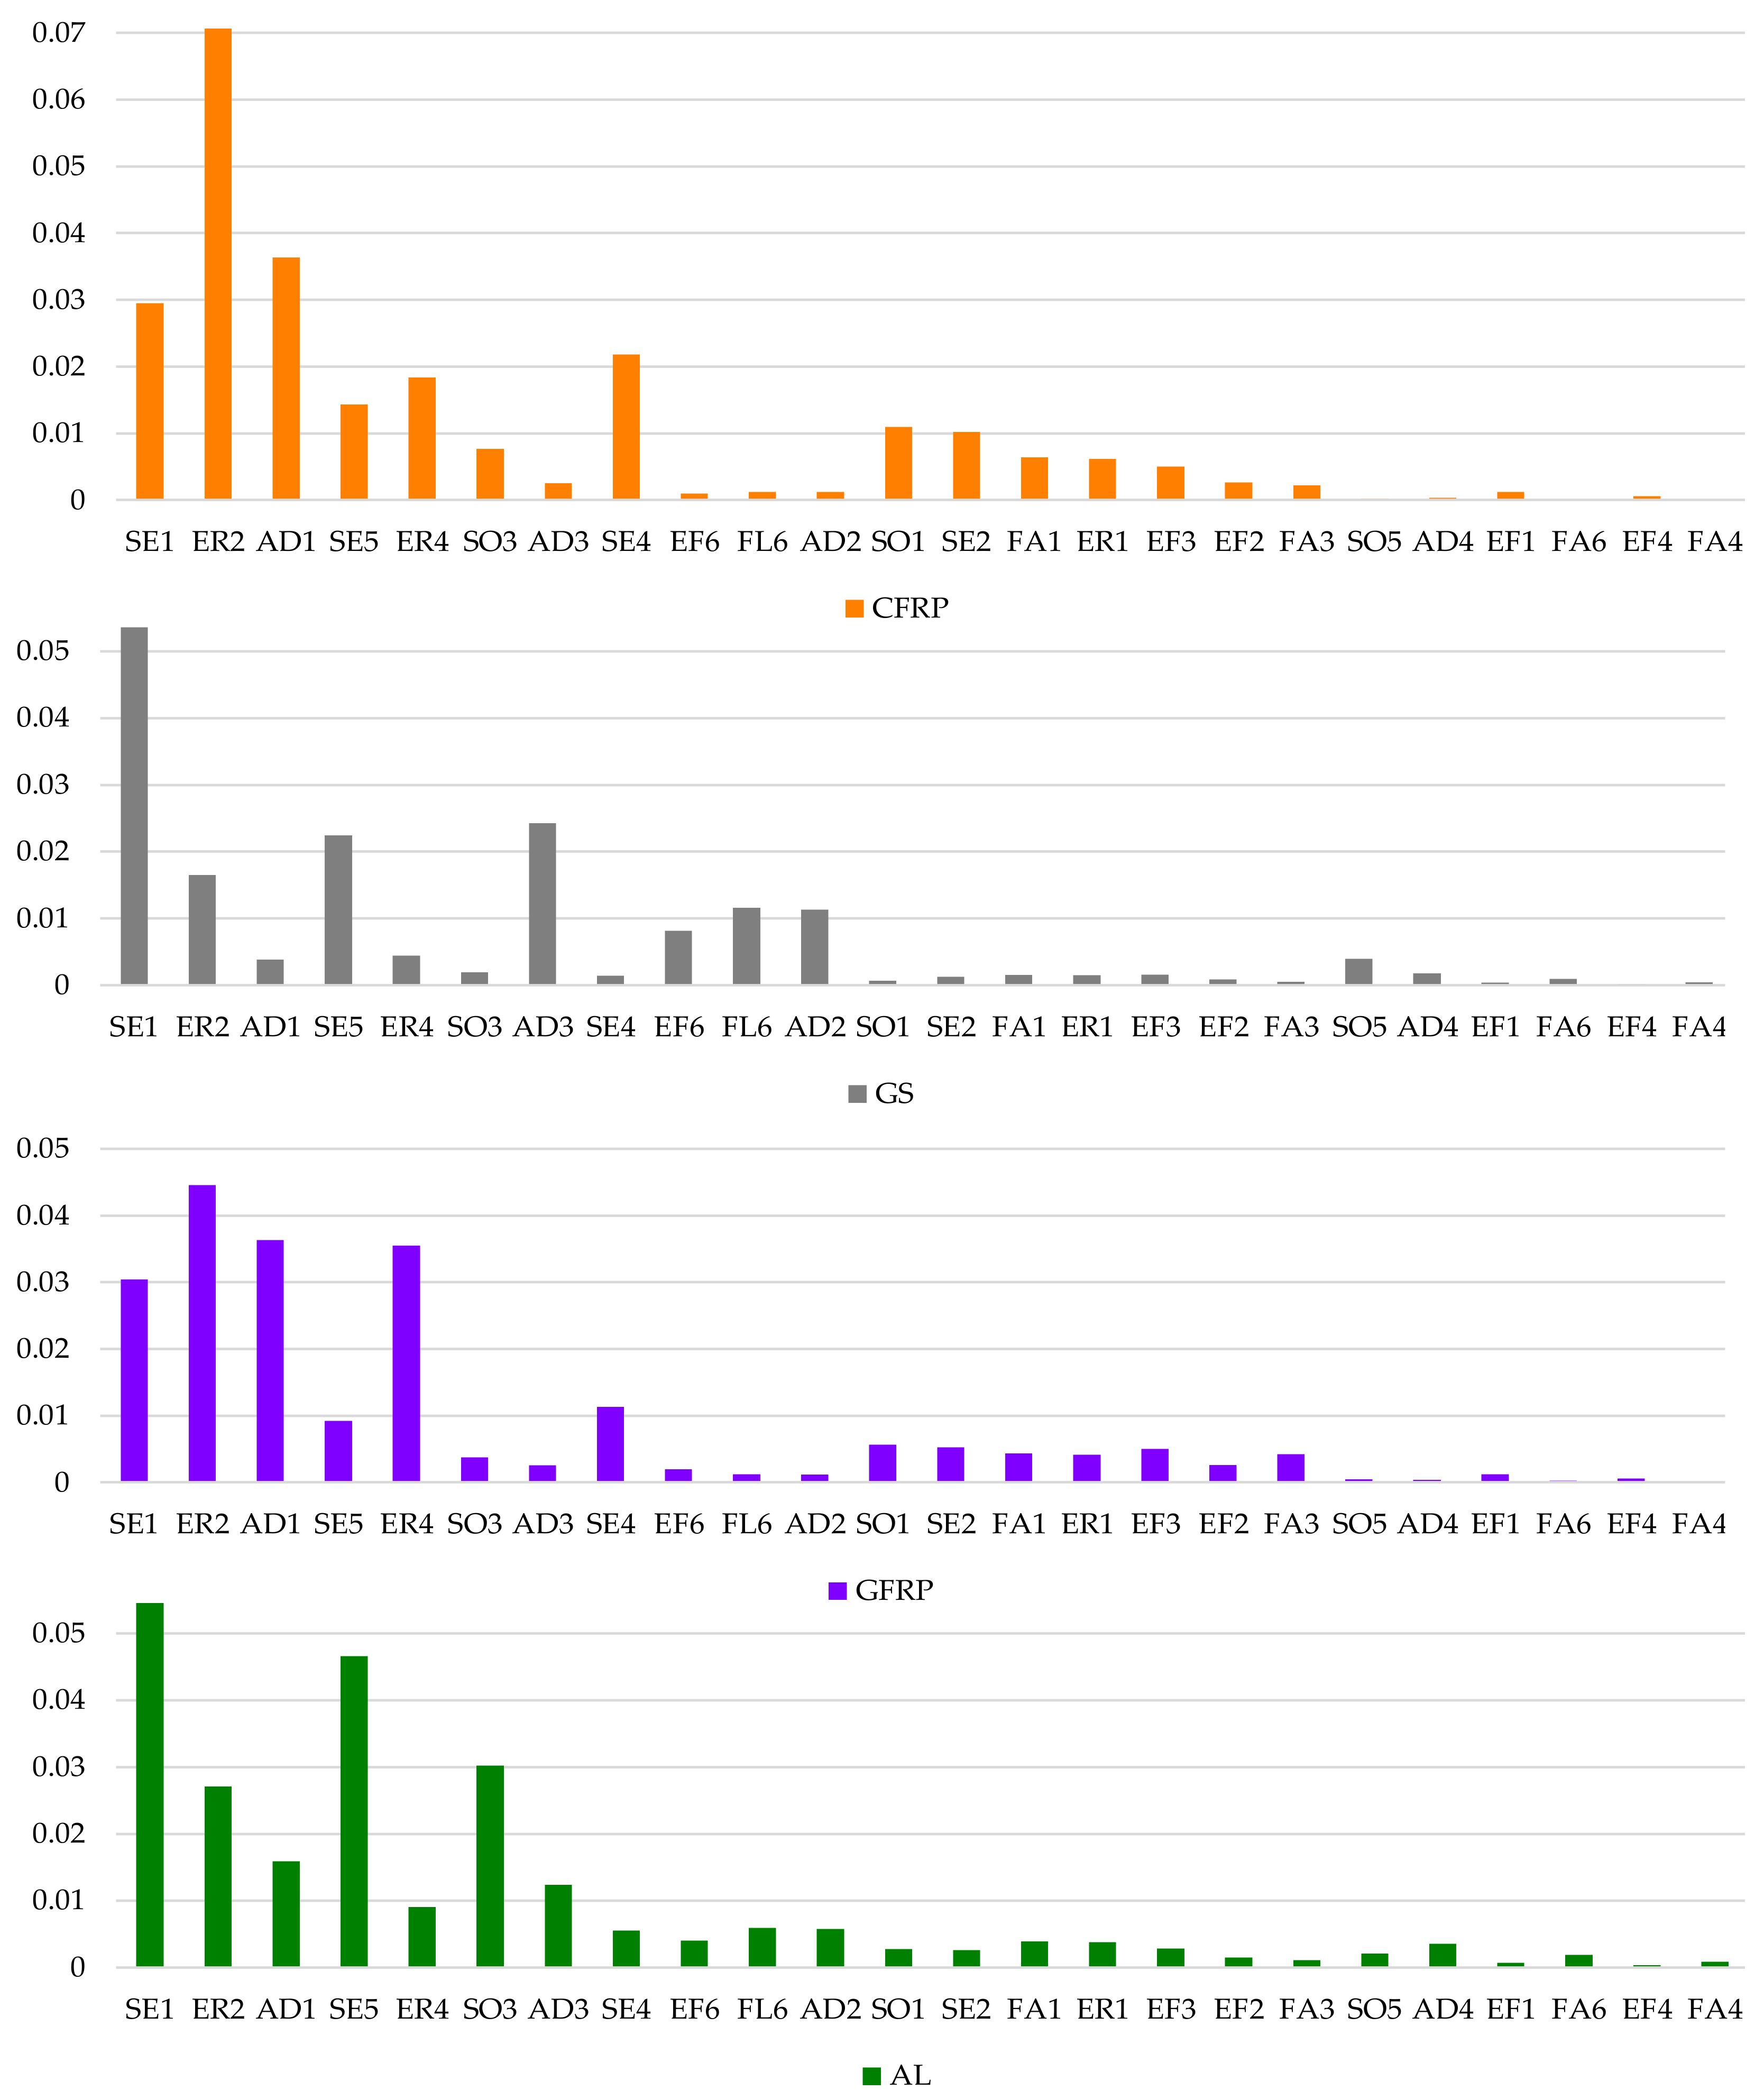
With the first eight requirements, 79% of the decision is made (mechanical strength, ease of assembly/disassembly, manoeuvrability in different workplaces, safety through locking parts, functionality in different lengths and heights, use of durable materials, versatility to be used in different types of work and resistance against inclement weather). Furthermore, with the following eight requirements, 95% of the decision is reached (low-cost acquisition, incorporation of existing elements on the market, compatibility with current systems, use of fire-resistant materials, resistance to extreme temperatures, manufacture with lightweight materials, breakdown into lightweight elements and transport by private car). The remaining eight requirements complete the decision (transport by van, manufacturing with composite materials, availability of spare parts, personalised acquisition of system elements, transport by lorry, industrial/standardised manufacturing, shelf storage and manufacturing with recycled and/or recyclable materials). The assessment, in weighted terms, of each alternative to align with each attribute is summarised in Figure 15, where the reference material and the three most outstanding alternative materials are shown.
Whereas the purpose of the Kano model is to distinguish the needs of users through different processes, helping to find the point for improving satisfaction and mitigating dissatisfaction, the AHP method stresses the most relevant basic, functional and excitement needs that have been previously underlined. In summary, the Kano model compiles needs in three basic, functional and motivational categories; the AHP method provides a hierarchical classification, highlighting the most appropriate alternatives. This integration is aligned with previous studies that combined both methodologies [36,37,38,39].

6. Conclusions

Advances in the legislative field related to occupational health and safety in the construction sector have not caused a proportional decrease in occupational accidents. This has been due, in part, to the failure to bring about the appropriate technical changes to allow for the correct application of the standards. This can be explained by the increase in the amount of building work over the years of the real-estate bubble in Spain and the decrease in investment during the years of subsequent crisis but also by a stagnation in the development of new and better systems in terms of collective protection, especially in the field of falls from height, so that these systems cease to be defective and/or misused and their use is encouraged.
A series of needs to be satisfied and requirements to be met was provided, duly compiled, prioritised and hierarchised. At this point of the study, four alternative materials to galvanised steel were proposed to be used to lay the foundations for an innovative preliminary design of TEPS. From the materials with potential as an alternative material for new TEPS, aluminium alloy 2024 and cast iron (as metals) and glass-fibre-reinforced polyester and carbon-fibre-reinforced polymer (as composite materials) were selected. In addition, the Kano model enabled requirements (those considered as one dimensional and mandatory) and needs (those considered as one dimensional and attractive) to be filtered. Through the AHP multi-criteria decision-making process to be developed from this study, alternative materials can be hierarchised in relation to the criteria that the Kano model has provided.
It can be noted that the proposed approach faces each requirement individually, so it does not consider the different interrelations among customer needs. In addition, although this research provides several inputs to design and develop innovative solutions, future research faces several challenges and constraints. Therefore, future research must involve the preliminary design of TEPS, taking into account their geometric and dimensional definition in order to study their patentability and/or usefulness. After that, the detailed design, development and prototyping of TEPS can be performed. Finally, the validation of solutions for their potential commercialisation should be addressed by conducting market research surveys of users.
Author Contributions

Conceptualisation, F.Y.-G. and A.C.-N.; methodology, A.P.-F. and A.C.-N.; validation, M.O.-M.; formal analysis, A.P.-F. and A.C.-N.; investigation, F.Y.-G., A.P.-F. and A.C.-N.; resources, A.P.-F., A.C.-N. and M.O.-M.; data curation, A.C.-N.; writing F.Y.-G., A.P.-F. and A.C.-N.; original draft preparation, F.Y.-G.; writing—review and editing, A.P.-F. and A.C.-N.; supervision, M.O.-M.; funding acquisition, M.O.-M. All authors have read and agreed to the published version of the manuscript.

Funding

This research received no external funding.

Institutional Review Board Statement

Not applicable.

Informed Consent Statement

Not applicable.

Data Availability Statement

Not applicable.

Acknowledgments

All authors acknowledge the help received by the research group TEP-955 from the PAIDI (Junta de Andalucía, Spain).

Conflicts of Interest

The authors declare no conflict of interest.

Appendix A. FEA Results for Alternative Materials

Figure A1. FEA deflection in test 1 for alternative materials: AL (top left), CI (top right), PET (centre left), PVC (centre right), GRFP (bottom left) and CRFP (bottom right).
Sustainability 14 14285 g0a1
Figure A2. FEA von Mises stress in tests 2 and 3 for alternative materials: AL (top left), CI (top right), PET (centre left), PVC (centre right), GRFP (bottom left) and CRFP (bottom right).
Sustainability 14 14285 g0a2
Figure A3. FEA von Mises stress in tests 4 and 5 for alternative materials: AL (top left), CI (top right), PET (centre left), PVC (centre right), GRFP (bottom left) and CRFP (bottom right).
Sustainability 14 14285 g0a3
Figure A4. FEA deflection in test 6 for alternative materials: AL (top left), CI (top right), PET (centre left), PVC (centre right), GRFP (bottom left) and CRFP (bottom right).
Sustainability 14 14285 g0a4
Figure A5. FEA von Mises stress in tests 7 and 8 for alternative materials: AL (top left), CI (top right), PET (centre left), PVC (centre right), GRFP (bottom left) and CRFP (bottom right).
Sustainability 14 14285 g0a5

Appendix B. Kano Data

Table A1. Functional scores, dysfunctional scores and importance of requirements collection.
Functional ScoresDysfunctional ScoresGrade of Importance
1234512345012345678910
2156113 6951124 461124367633
838522 2844118 7333684246
925939 649729 1432566721
649729 1133146 3416446324
112228129 21499426 61134566617
44672356 3113326 6914266751134
980101 674110 5777497
43147 26164 944137
8176166382432313469 142134644611
1636138 2662102 728446249
43572642223339235639 3371462713
417447253 16591114 6818325144229
728929 1746127 26797411
21365426532457412444 1123446923146
56134 1631143 2431365346
276272294441493719 24718114
1131148 24467644 41984571412
17289847 548353 116376346
2138131 866638 14465156196
983463121 6568741 933576427
61134139411598234 11337441229
2641123 719623 147951424
13774741122461523419 827875117
6124310722 111637126 1631334936196
1436444947 637147 267651343
9397 749134 14243644411912
1343134 5811418 172641542927
71862103 1274104 633725326
817322141124764336 421495634224
668331 1455121 41679443116
826595443913297663 6244936312618
11143176581223595244 21294761248
64310124161421914618 24447134116
241133122 61214914 8333841362311
43572961 56663929 73139613121
132144112 42162103 39224261467
1354123 726157 23626414738
454132 1487109 4299463
1769104 2163106 41322318436
2364103 1472104 42128496127
471034027419436 21189462913
44255134361321496344 845665615
Table A2. Functional/dysfunctional classification of requirements.
IDRiCiAiOiUiIiQiFiFi ≥ QiSiDiTypeXiYiTypeGiC1iC2iriαiType
SE1 111136616.0647Ok0.59−0.65U0.740.78U8.330.620.651.080.81 (46°)U
SE2 96227215.9724Ok0.12−0.62O0.340.74O7.540.260.560.811.14 (65°)O
SE3 10 2915116.06122Ok0.21−0.15I0.360.41I6.260.230.260.540.85 (49°)I
SE4 0117294415.8973Ok0.15−0.77O0.410.86O6.390.260.550.951.13 (65°)O
SE5 103 266115.9342Ok0.68−0.14A0.740.36A8.140.600.290.820.45 (26°)A
SE6 30 2613415.93104Ok0.29−0.14I0.300.49I5.920.180.290.571.02 (59°)I
ER1 91018016.0621Ok0.53−0.58U0.740.77U8.030.600.621.070.81 (46°)U
ER2 171472616.02121Ok0.77−0.86U0.890.93U9.670.860.901.290.81 (46°)U
ER324 31389715.3959Ok0.23−0.42I0.330.35I6.740.220.230.480.81 (46°)I
ER4 36 1025215.7950Ok0.73−0.54U0.820.70U8.620.710.601.080.71 (40°)U
ER543 172210815.7465Ok0.15−0.27I0.040.21I4.560.020.100.221.39 (80°)I
ER64 49 413316.0784Ok0.28−0.02I0.440.29I6.990.300.200.520.59 (34°)I
SU1 98296315.8935Ok0.15−0.67O0.390.79O7.370.290.580.881.12 (64°)O
SU224 9 4411315.8469Ok0.32−0.27I0.240.16I4.720.120.070.290.57 (33°)I
SU30 91344716.0687Ok0.71−0.75U0.850.83U8.350.710.701.190.77 (44°)U
SU444 10 1911715.8973Ok0.20−0.13I0.310.03I5.450.170.020.310.09 (5°)I
SU5 104 444215.6860Ok0.78−0.23A0.860.40A6.490.560.260.950.44 (25°)A
SU6 64713716.0790Ok0.25−0.28I0.480.50I5.790.280.290.690.80 (46°)I
FA1 93 385915.7634Ok0.69−0.20A0.790.37A7.270.570.270.870.44 (25°)A
FA29 202114015.89119Ok0.12−0.23I0.060.44I7.350.040.320.441.44 (82°)I
FA34 105 344715.7658Ok0.75−0.18A0.810.37A6.300.510.230.890.43 (24°)A
FA4 100 236715.9633Ok0.65−0.12A0.760.37A6.700.510.250.840.46 (26°)A
FA524 71214716.00123Ok0.07−0.11I0.040.05I5.220.020.020.060.91 (52°)I
FA66 104225815.9146Ok0.12−0.68O0.370.75O6.730.250.500.831.11 (64°)O
EF114 100472915.6653Ok0.27−0.84O0.290.87O6.540.190.570.921.25 (71°)O
EF2 37975615.7741Ok0.51−0.71U0.760.83U6.940.520.581.130.84 (48°)U
EF3 116 185616.0160Ok0.71−0.09A0.820.39A7.850.640.310.910.45 (26°)A
EF40 11038616.0817Ok0.54−0.55U0.700.74U7.320.510.541.020.82 (47°)U
EF511 221414315.94121Ok0.08−0.20I0.030.24I4.930.010.120.241.47 (84°)I
EF6 90316915.8721Ok0.16−0.64O0.380.78O7.680.290.600.871.12 (64°)O
FL19 204311815.8975Ok0.24−0.35I0.310.49I6.120.190.300.581.00 (57°)I
FL212 14 4412015.9376Ok0.33−0.25I0.460.31I5.330.240.160.550.59 (34°)I
FL314 21615816.03142Ok0.09−0.10I0.080.15I4.910.040.070.171.11 (64°)I
FL4 8 1416816.07154Ok0.12−0.07I0.170.19I4.930.080.100.260.87 (50°)I
FL5 32 2912915.8997Ok0.32−0.15I0.340.18I6.740.230.120.390.49 (28°)I
FL6 9 1037816.0625Ok0.59−0.54U0.690.70U7.660.530.540.980.79 (45°)U
AD1 341233315.8489Ok0.65−0.83U0.790.89U8.100.640.721.190.85 (49°)U
AD2 2301095815.9651Ok0.69−0.57U0.840.80U9.140.760.731.160.76 (44°)U
AD3 21048416.0820Ok0.55−0.56U0.730.72U8.510.620.621.030.78 (45°)U
AD4 11038616.0817Ok0.54−0.55U0.710.74U7.170.510.531.020.8 (46°)U
AD52 4 3614816.07112Ok0.21−0.19I0.480.42I6.670.320.280.640.72 (41°)I
AD644 83610215.6558Ok0.25−0.30I0.130.34I5.130.070.170.361.20 (69°)I

Appendix C. AHP Data

Appendix C.1. Comparison of Criteria

Table A3. Criteria comparison matrix (dimensions).
CriteriaSEERSOFAEFFLADEigenvectorWeight (Wt)
SE12586933.8680.363
ER1/21475822.7260.256
SO1/51/414251/30.9440.089
FA1/81/71/411/321/60.3370.032
EF1/61/51/23141/40.6520.061
FL1/91/81/51/21/411/70.2430.023
AD1/31/2364711.8830.177
Scale: Saaty 1–9; Order: SE ≥ ER ≥ AD > SO ≥ EF > FA ≥ FL; CR = 0.0397 < 0.1.

Appendix C.2. Comparison of Sub-Criteria

Table A4. Security dimension sub-criteria comparison matrix.
Sub-CriteriaSE1SE2SE4SE5EigenvectorLocal WtGlobal Wt
SE117533.2010.5640.208
SE21/711/31/50.3120.0550.020
SE41/5311/30.6690.1180.043
SE51/35311.4950.2630.096
Scale: Saaty; Order: SE1 > SE5 > SE4 > SE2; CR = 0.0442 < 0.08.
Table A5. Ergonomics dimension sub-criteria comparison matrix.
Sub-CriteriaER1ER2ER4EigenvectorLocal WtGlobal Wt
ER111/81/50.2920.0670.017
ER28132.8840.6610.169
ER451/311.1860.2720.070
Scale: Saaty; Order ER2 > ER4 >> ER1; CR = 0.0420 < 0.05.
Table A6. Sustainability dimension sub-criteria comparison matrix.
Sub-CriteriaSU1SU3SU5EigenvectorLocal WtGlobal Wt
SU111/330.2920.0670.017
SU33172.8840.6610.169
SU51/31/711.1860.2720.070
Scale: Saaty; Order SU3 > SU1 > SU5; CR = 0.0067 < 0.05.
Table A7. Fabricability dimension sub-criteria comparison matrix.
Sub-CriteriaFA1FA3FA4FA6EigenvectorLocal WtGlobal Wt
FA113753.2010.5640.018
FA31/31531.4950.2630.008
FA41/71/511/30.3120.0550.002
FA61/51/3310.6690.1180.004
Scale: Saaty; Order: FA1 > FA3 > FA6 > FA4; CR = 0.0442 < 0.08.
Table A8. Efficiency dimension sub-criteria comparison matrix.
Sub-CriteriaEF1EF2EF3EF4EF6EigenvectorLocal WtGlobal Wt
EF111/31/531/70.4910.0630.004
EF2311/371/51.0700.1380.008
EF353171/32.0360.2620.016
EF41/31/71/711/90.2380.0310.002
EF6753913.9360.5070.031
Scale: Saaty; Order: EF6 > EF3 > EF2 > EF1 > EF4; CR = 0.0614 < 0.1.
Table A9. Flexibility dimension sub-criteria comparison matrix.
Sub-CriteriaFL1EigenvectorLocal WtGlobal Wt
FL61110.023
Scale: Saaty; Order: FL6; CR = 0.0000 < 0.05.
Table A10. Adaptability dimension sub-criteria comparison matrix.
Sub-CriteriaAD1AD2AD3AD4EigenvectorLocal WtGlobal Wt
AD115393.4090.5650.100
AD21/511/350.7600.1260.022
AD31/33171.6270.2700.048
AD41/91/51/710.2370.0390.007
Scale: Saaty; Order: AD1 > AD3 > AD2 >> AD4; CR = 0.0644 < 0.08.

Appendix C.3. Comparison of Alternatives

Table A11. Comparison of alternatives matrix for sub-criterion SE1.
AlternativesGSALCIGFRPCFRPEigenvectorLocal WtGlobal Wt
GS1280/275280/410280/465280/5401.3570.2620.054
AL275/2801275/410275/465275/5401.3820.2670.055
CI410/280410/2751410/465410/5400.9270.1790.037
GFRP465/280465/275465/4101465/5400.7700.1490.030
CFRP540/280540/275540/410540/46510.7470.1440.030
Scale: Nature (yield strength); Order: CFRP (540 N/mm2) > GFRP (465 N/mm2) > CI (410 N/mm2) > GS (280 N/mm2) > AL (275 N/mm2); CR = 0.0018 < 0.1.
Table A12. Comparison of alternatives matrix for sub-criterion SE2.
AlternativesGSALCIGFRPCFRPEigenvectorLocal WtGlobal Wt
GS11/331/51/70.4910.0640.001
AL3151/31/51.0000.1300.003
CI1/31/511/71/90.2540.0330.001
GFRP53710.332.0360.2640.005
CFRP759313.9360.5100.010
Scale: Saaty; Order: CFRP > GFRP > AL > GS > CI; CR = 0.0510 < 0.1.
Table A13. Comparison of alternatives matrix for sub-criterion SE4.
AlternativesGSALCIGFRPCFRPEigenvectorLocal WtGlobal Wt
GS11/51/31/71/90.2540.0330.001
AL5131/31/51.0000.1300.006
CI31/311/51/70.4910.0640.003
GFRP73511/32.0360.2640.011
CFRP957313.9360.5100.022
Scale: Saaty; Order: CFRP > GFRP > AL > CI > GS; CR = 0.0510 < 0.1.
Table A14. Comparison of alternatives matrix for sub-criterion SE5.
AlternativesGSALCIGFRPCFRPEigenvectorLocal WtGlobal Wt
GS11/37321.6950.2350.022
AL319543.5190.4880.047
CI1/71/911/51/60.2210.0310.003
GFRP1/31/5511/20.6990.0970.009
CFRP1/21/46211.0840.1500.014
Scale: Saaty; Order: AL > GS > CFRP ≥ GFRP > CI; CR = 0.0473 < 0.1.
Table A15. Comparison of alternatives matrix for sub-criterion ER1.
AlternativesGSALCIGFRPCFRPEigenvectorLocal WtGlobal Wt
GS14.993/12.55612.073/12.5564.537/12.5563.059/12.5560.5070.0880.002
AL12.556/4.993112.073/4.9934.537/4.9933.059/4.9931.2760.2200.004
CI12.556/12.0734.993/12.07314.537/12.0733.059/12.0730.5280.0910.002
GFRP12.556/4.5374.993/4.53712.073/4.53713.059/4.5371.4040.2420.004
CFRP12.556/3.0594.993/3.05912.073/3.0594.537/3.05912.0830.3590.006
Scale: Nature (system weight); Order: CFRP (3.059 kg) ≥ GFRP (4.537 kg) > AL (4.993 kg) > CI (12.073 kg) > GS (12.556 kg); CR = 0.0000 < 0.1.
Table A16. Comparison of alternatives matrix for sub-criterion ER2.
AlternativesGSALCIGFRPCFRPEigenvectorLocal WtGlobal Wt
GS11/331/51/70.4910.0640.011
AL3151/31/51.0000.1300.022
CI1/31/511/71/90.2540.0330.006
GFRP53711/32.0360.2640.045
CFRP759313.9360.5100.086
Scale: Saaty; Order: CFRP > GFRP > AL > GS > CI; CR = 0.0510 < 0.1.
Table A17. Comparison of alternatives matrix for sub-criterion ER4.
AlternativesGSALCIGFRPCFRPEigenvectorLocal WtGlobal Wt
GS11/331/71/50.4910.0640.004
AL3151/51/31.0000.1300.009
CI1/31/511/91/70.2540.0330.002
GFRP759133.9360.5100.035
CFRP5371/312.0360.2640.018
Scale: Saaty; Order: GFRP > CFRP > AL > GS > CI; CR = 0.0554 < 0.1.
Table A18. Comparison of alternatives matrix for sub-criterion SU1.
AlternativesGSALCIGFRPCFRPEigenvectorLocal WtGlobal Wt
GS11/51/31/71/90.2540.0330.001
AL5131/31/51.0000.1300.003
CI31/311/51/70.4910.0640.001
GFRP73511/32.0360.2640.006
CFRP957313.9360.5100.011
Scale: Saaty; Order: CFRP > GFRP > AL > CI > GS; CR = 0.0510 < 0.1.
Table A19. Comparison of alternatives matrix for sub-criterion SU3.
AlternativesGSALCIGFRPCFRPEigenvectorLocal WtGlobal Wt
GS11/91/71/31/50.2540.0330.002
AL913753.9360.5100.030
CI71/31532.0360.2640.016
GFRP31/71/511/30.4910.0640.004
CFRP51/51/3311.0000.1300.008
Scale: Saaty; Order: AL > GS > CFRP > GFRP > CI; CR = 0.0547 < 0.1.
Table A20. Comparison of alternatives matrix for sub-criterion SU5.
AlternativesGSALCIGFRPCFRPEigenvectorLocal WtGlobal Wt
GS135793.9360.5100.004
AL1/313572.0360.2640.002
CI1/51/31351.0000.1300.001
GFRP1/71/51/3130.4910.0640.000
CFRP1/91/71/517310.2540.0330.000
Scale: Saaty; Order: GS > AL > CI > GFRP > CFRP; CR = 0.0498 < 0.1.
Table A21. Comparison of alternatives matrix for sub-criterion FA1.
AlternativesGSALCIGFRPCFRPEigenvectorLocal WtGlobal Wt
GS14.993/12.55612.073/12.5564.537/12.5563.059/12.5560.5070.0880.002
AL12.556/4.993112.073/4.9934.537/4.9933.059/4.9931.2760.2200.004
CI12.556/12.0734.993/12.07314.537/12.0733.059/12.0730.5280.0910.002
GFRP12.556/4.5374.993/4.53712.073/4.53713.059/4.5371.4040.2420.004
CFRP12.556/3.0594.993/3.05912.073/3.0594.537/3.05912.0830.3590.006
Scale: Nature (system weight); Order: CFRP (3.059 kg) > GFRP (4.537 kg) > AL (4.993 kg) > CI (12.073 kg) > GS (12.556 kg); CR = 0.0000 < 0.1.
Table A22. Comparison of alternatives matrix for sub-criterion FA3.
AlternativesGSALCIGFRPCFRPEigenvectorLocal WtGlobal Wt
GS11/331/71/50.4910.0640.001
AL3151/51/31.0000.1300.001
CI1/31/511/91/70.2540.0330.000
GFRP759133.9360.5100.004
CFRP5371/312.0360.2640.002
Scale: Saaty; Order: GFRP > CFRP > AL > GS > CI; CR = 0.0554 < 0.1.
Table A23. Comparison of alternatives matrix for sub-criterion FA4.
AlternativesGSALCIGFRPCFRPEigenvectorLocal WtGlobal Wt
GS11/33752.0360.2640.000
AL315973.9360.5100.001
CI1/31/51531.0000.1300.000
GFRP1/71/91/511/30.2540.0330.000
CFRP1/51/71/3310.4910.0640.000
Scale: Saaty; Order: AL > GS > CI > CFRP > GFRP; CR = 0.0550 < 0.1.
Table A24. Comparison of alternatives matrix for sub-criterion FA6.
AlternativesGSALCIGFRPCFRPEigenvectorLocal WtGlobal Wt
GS11/33572.0360.2640.001
AL315793.9360.5100.002
CI1/31/51351.0000.1300.000
GFRP1/51/71/3130.4910.0640.000
CFRP1/71/91/51/310.2540.0330.000
Scale: Saaty; Order: AL > GS > CI > GFRP > CFRP; CR = 0.0498 < 0.1.
Table A25. Comparison of alternatives matrix for sub-criterion EF1.
AlternativesGSALCIGFRPCFRPEigenvectorLocal WtGlobal Wt
GS11/211/31/30.5610.0990.000
AL2121/21/21.0000.1760.001
CI11/211/31/30.5610.0990.000
GFRP323111.7830.3130.001
CFRP323111.7830.3130.001
Scale: Saaty; Order: GFRP ≈ CFEP > AL > GS ≈ HF; CR = 0.0031 < 0.1.
Table A26. Comparison of alternatives matrix for sub-criterion EF2.
AlternativesGSALCIGFRPCFRPEigenvectorLocal WtGlobal Wt
GS11/211/31/30.5610.0990.001
AL2121/21/21.0000.1760.001
CI11/211/31/30.5610.0990.001
GFRP323111.7830.3130.003
CFRP323111.7830.3130.003
Scale: Saaty; Order: GFRP ≈ CFEP > AL > GS ≈ HF; CR = 0.0031 < 0.1.
Table A27. Comparison of alternatives matrix for sub-criterion EF3.
AlternativesGSALCIGFRPCFRPEigenvectorLocal WtGlobal Wt
GS11/211/31/30.5610.0990.002
AL2121/21/21.0000.1760.003
CI11/211/31/30.5610.0990.002
GFRP323111.7830.3130.005
CFRP323111.7830.3130.005
Scale: Saaty; Order: GFRP ≈ CFEP > AL > GS ≈ HF; CR = 0.0031 < 0.1.
Table A28. Comparison of alternatives matrix for sub-criterion EF4.
AlternativesGSALCIGFRPCFRPEigenvectorLocal WtGlobal Wt
GS11/211/31/30.5610.0990.000
AL2121/21/21.0000.1760.000
CI11/211/31/30.5610.0990.000
GFRP323111.7830.3130.001
CFRP323111.7830.3130.001
Scale: Saaty; Order: GFRP ≈ CFEP > AL > GS ≈ HF; CR = 0.0031 < 0.1.
Table A29. Comparison of alternatives matrix for sub-criterion EF6.
AlternativesGSALCIGFRPCFRPEigenvectorLocal WtGlobal Wt
GS131/3572.0360.2640.008
AL1/311/5351.0000.1300.004
CI351793.9360.5100.016
GFRP1/51/31/7130.4910.0640.002
CFRP1/71/51/91/310.2540.0330.001
Scale: Saaty; Order: CI > GS > AL > GFRP > CFRP; CR = 0.0498 < 0.1.
Table A30. Comparison of alternatives matrix for sub-criterion FL6.
AlternativesGSALCIGFRPCFRPEigenvectorLocal WtGlobal Wt
GS135773.7430.5100.012
AL1/313551.9040.2590.006
CI1/51/31330.9030.1230.003
GFRP1/71/51/3110.3940.0540.001
CFRP1/71/51/3110.3940.0540.001
Scale: Saaty; Order: GS > AL > CI > GFRP ≈ CFRP; CR = 0.0332 < 0.1.
Table A31. Comparison of alternatives matrix for sub-criterion AD1.
AlternativesGSALCIGFRPCFRPEigenvectorLocal WtGlobal Wt
GS11/51/31/71/70.2670.0380.004
AL5131/31/31.1080.1590.016
CI31/311/51/50.5250.0750.008
GFRP735112.5370.3640.036
CFRP735112.5370.3640.036
Scale: Saaty; Order: GFRP ≈ CFRP > AL > CI > GS; CR = 0.0334 < 0.1.
Table A32. Comparison of alternatives matrix for sub-criterion AD2.
AlternativesGSALCIGFRPCFRPEigenvectorLocal WtGlobal Wt
GS135773.7430.5100.011
AL1/313551.9040.2590.006
CI1/51731330.9030.1230.003
GFRP1/71/51/3110.3940.0540.001
CFRP1/71/51/3110.3940.0540.001
Scale: Saaty; Order: GS > AL > CI > GFRP ≈ CFRP; CR = 0.0332 < 0.1.
Table A33. Comparison of alternatives matrix for sub-criterion AD3.
AlternativesGSALCIGFRPCFRPEigenvectorLocal WtGlobal Wt
GS135773.7430.5100.024
AL1/313551.9040.2590.012
CI1/51/31330.9030.1230.006
GFRP1/71/51/3110.3940.0540.003
CFRP1/71/51/3110.3940.0540.003
Scale: Saaty; Order: GS > AL > CI > GFRP ≈ CFRP; CR = 0.0332 < 0.1.
Table A34. Comparison of alternatives matrix for sub-criterion AD4.
AlternativesGSALCIGFRPCFRPEigenvectorLocal WtGlobal Wt
GS11/33551.9040.2590.002
AL315773.7430.5100.004
CI1/31/51330.9030.1230.001
GFRP1/51/71/3110.3940.0540.000
CFRP1/51/71/3110.3940.0540.000
Scale: Saaty; Order: AL > GS > CI > GFRP ≈ CFRP; CR = 0.0332 < 0.1.

References

  1. Gómez Ferreira, R. Condiciones de Trabajo y Salud en el Sector de La Construcción, ¿Cuestión de Jerarquías? Universidad Pública de Navarra: Pamplona, Spain, 2015. [Google Scholar]
  2. Pérez-Prendes y Muñoz de Arraco, J.M. El Mito de Tartessos. Rev. Occident. 1974, 134, 183–204. [Google Scholar]
  3. Molina Benito, A. Historia de la Seguridad en el Trabajo en España; Dirección General de Trabajo y Prevención de Riesgos de la Junta de Castilla y León: Valladolid, Spain, 2006; ISBN 978-8468984773. [Google Scholar]
  4. Vigneshkumar, C.; Salve, U.R. A Scientometric Analysis and Review of Fall from Height Research in Construction. Constr. Econ. Build. 2020, 20, 17–35. [Google Scholar] [CrossRef]
  5. Jahangiri, M.; Solukloei, H.R.J.; Kamalinia, M. A Neuro-Fuzzy Risk Prediction Methodology for Falling from Scaffold. Saf. Sci. 2019, 117, 88–99. [Google Scholar] [CrossRef]
  6. Del Cerman Rey-Merchán, M.; Gómez-de-Gabriel, J.M.; López-Arquillos, A. Improving the Prevention of Fall from Height in Construction Sites through the Combination of Technologies Improving the Prevention of Fall from Height in Construction Sites through the Combination of Technologies. Int. J. Occup. Saf. Ergon. 2022, 28, 590–599. [Google Scholar] [CrossRef] [PubMed]
  7. Guo, B.H.W.; Goh, Y.M. Ontology for Design of Active Fall Protection Systems. Autom. Constr. 2017, 82, 138–153. [Google Scholar] [CrossRef]
  8. Zhang, S.; Sulankivi, K.; Kiviniemi, M.; Romo, I.; Eastman, C.M.; Teizer, J. BIM-Based Fall Hazard Identification and Prevention in Construction Safety Planning. Saf. Sci. 2015, 72, 31–45. [Google Scholar] [CrossRef]
  9. Silva Pessoa Melo de Souza, C.; da Silva Souza, J.A. Security Management Benefits at Work in Monitoring Individual Protection Equipment (IPE) and Collective Security Systems (CSS), Procedures and Methods in Industry Construction. Bus. Manag. Dyn. 2017, 6, 19–26. [Google Scholar]
  10. Heindrich, H.W. Industrial Accident Prevention: A Scientific Approach; McGraw-Hill: New York, NY, USA, 1931. [Google Scholar]
  11. Krause, T.R. Employee-Driven Systems for Safe Behavior: Integrating Behavioral and Statistical Methodologies; Van Nostrand Reinhold: Florence, Italy, 1995; ISBN 978-0442016715. [Google Scholar]
  12. Salminen, S.; Tallberg, T. Human Errors in Fatal and Serious Occupational Accidents in Finland. Ergonomics 1996, 39, 980–988. [Google Scholar] [CrossRef]
  13. Willamson, A.; Feyer, A.-M. Behavioural Epidemiology as a Tool for Accident Research. J. Occup. Accid. 1990, 12, 207–222. [Google Scholar] [CrossRef]
  14. Sulzer Azaroff, B. Behavioral Ecology and Accident Prevention. J. Organ. Behav. Manag. 1980, 2, 11–44. [Google Scholar] [CrossRef]
  15. Aizcorbe, J.M. Manual de Seguridad En La Construccion. Rev. Edif. 1989, 6, 26–39. [Google Scholar]
  16. Choudhry, R.M.; Fang, D. Why Operatives Engage in Unsafe Work Behavior: Investigating Factors on Construction Sites. Saf. Sci. 2008, 46, 566–584. [Google Scholar] [CrossRef]
  17. Abdelhamid, T.S.; Everett, J.G. Identifying Root Causes of Construction Accidents. J. Constr. Eng. Manag. 2000, 126, 52–60. [Google Scholar] [CrossRef]
  18. Fang, W.; Ding, L.; Luo, H.; Love, P.E.D. Falls from Heights: A Computer Vision-Based Approach for Safety Harness Detection. Autom. Constr. 2018, 91, 53–61. [Google Scholar] [CrossRef]
  19. Leveson, N. A New Accident Model for Engineering Safer Systems. Saf. Sci. 2004, 42, 237–270. [Google Scholar] [CrossRef] [Green Version]
  20. Huang, X.; Hinze, J. Analysis of Construction Worker Fall Accidents. J. Constr. Eng. Manag. 2003, 129, 262–271. [Google Scholar] [CrossRef]
  21. Hollnagel, E. FRAM: The Functional Resonance Analysis Method Modelling Complex Socio-Technical Systems; CRC Press: Boca Ratón, FL, USA, 2012; ISBN 978-1409445517. [Google Scholar]
  22. Bobick, T.G.; McKenzie, E.A.; Kau, T.-Y. Evaluation of Guardrail Systems for Preventing Falls through Roof and Floor Holes. J. Safety Res. 2010, 41, 203–211. [Google Scholar] [CrossRef]
  23. Nonnenmacher, L.; Costella, M.F.; de Medeiros Costella, M.; Saurin, T.A. A Framework to Select Innovations in Patents to Improve Temporary Edge Protection Systems in Buildings. Ambient. Construído 2017, 17, 137–151. [Google Scholar] [CrossRef] [Green Version]
  24. Manalo, A.; Pac, M. Structural Behaviour of Pultruded Fibre Composites Guardrail System under Horizontal Loading. Proc. Inst. Mech. Eng. Part L J. Mater. Des. Appl. 2018, 232, 273–286. [Google Scholar] [CrossRef]
  25. Lukka, K. The Constructive Research Approach. In Case Study Research in Logistics; Ojala, L., Hilmola, O.-P., Eds.; Publications of the Turku School of Economics and Business Administration: Turku, Finland, 2003; pp. 83–101. ISBN 978-9515641021. [Google Scholar]
  26. Holmström, J.; Ketokivi, M.; Hameri, A.-P. Bridging Practice and Theory: A Design Science Approach. Decis. Sci. 2009, 40, 65–87. [Google Scholar] [CrossRef]
  27. Van Aken, J.; Chandrasekaran, A.; Halman, J. Conducting and Publishing Design Science Research. J. Oper. Manag. 2016, 47–48, 1–8. [Google Scholar] [CrossRef]
  28. March, S.T.; Smith, G.F. Design and Natural Science Research on Information Technology. Decis. Support Syst. 1995, 15, 251–266. [Google Scholar] [CrossRef]
  29. Tonetto, M.S.; Saurin, T.A. Choosing Fall Protection Systems in Construction Sites: Coping with Complex Rather than Complicated Systems. Saf. Sci. 2021, 143, 105412. [Google Scholar] [CrossRef]
  30. Penaloza, G.A.; Saurin, T.A.; Formoso, C.T. Identification and Assessment of Requirements of Temporary Edge Protection Systems for Buildings. Int. J. Ind. Ergon. 2017, 58, 90–108. [Google Scholar] [CrossRef]
  31. Kano, N.; Seraku, N.; Takahashi, F.; Tsuji, S. Attractive Quality and Must-Be Quality. J. Jpn. Soc. Qual. Control 1984, 14, 147–156. [Google Scholar] [CrossRef]
  32. Uzun, I.M.; Cebi, S. A Novel Approach for Classification of Occupational Health and Safety Measures Based on Their Effectiveness by Using Fuzzy Kano Model. J. Intell. Fuzzy Syst. 2020, 38, 589–600. [Google Scholar] [CrossRef]
  33. Cho, J.; Kim, B.-S. Estimation of Key Risk Management Factors for Construction Projects Based on Kano Model. KSCE J. Civ. Environ. Eng. Res. 2022, 42, 239–248. [Google Scholar] [CrossRef]
  34. Saaty, T.L. Making and Validating Complex Decisions with the AHP/ANP. J. Syst. Sci. Syst. Eng. 2005, 14, 1–36. [Google Scholar] [CrossRef]
  35. Saaty, T.L. Decision Making with the Analytic Hierarchy Process. Int. J. Serv. Sci. 2008, 1, 83–98. [Google Scholar] [CrossRef] [Green Version]
  36. Wang, Z.; Wang, F.; Lan, X.; Zhang, X. Studies on Oil-Immersed Distribution Transformer Product Service System Based on Kano Model and Analytic Hierarchy Process. In Proceedings of the 2016 China International Conference on Electricity Distribution (CICED), Xi’an, China, 10–13 August 2016; pp. 1–3. [Google Scholar]
  37. Neira-Rodado, D.; Ortíz-Barrios, M.; De la Hoz-Escorcia, S.; Paggetti, C.; Noffrini, L.; Fratea, N. Smart Product Design Process through the Implementation of a Fuzzy Kano-AHP-DEMATEL-QFD Approach. Appl. Sci. 2020, 10, 1792. [Google Scholar] [CrossRef] [Green Version]
  38. Bajare, S.R.; Bewoor, A.K.; Jagtap, H.P. Use of Analytic Hierarchy Process Methodology for Analyzing Existing Motorcycle Helmet Design Concepts. In Recent Advances in Manufacturing Modelling and Optimization; Springer: Singapore, 2022; pp. 313–327. [Google Scholar]
  39. Li, F.; Li, X.; Xie, H. Modular Design Research of Computer Numerical Control Machine Tools Oriented to Customer Requirements. Adv. Mech. Eng. 2020, 12, 168781402091657. [Google Scholar] [CrossRef] [Green Version]
  40. Matzler, K.; Hinterhuber, H.H. How to Make Product Development Projects More Successful by Integrating Kano’s Model of Customer Satisfaction into Quality Function Deployment. Technovation 1998, 18, 25–38. [Google Scholar] [CrossRef]
  41. Shen, X.X.; Tan, K.C.; Xie, M. An Integrated Approach to Innovative Product Development Using Kano’s Model and QFD. Eur. J. Innov. Manag. 2000, 3, 91–99. [Google Scholar] [CrossRef]
  42. Fellir, F.; Nafil, K.; Touahni, R. System Requirements Prioritization Based on AHP. In Proceedings of the 2014 Third IEEE International Colloquium in Information Science and Technology (CIST), Tetouan, Morocco, 20–22 October 2014; pp. 163–167. [Google Scholar]
  43. Parthasarathy, S.; Daneva, M. Customer Requirements Based ERP Customization Using AHP Technique. Bus. Process Manag. J. 2014, 20, 730–751. [Google Scholar] [CrossRef] [Green Version]
  44. Manzoor, B.; Othman, I.; Waheed, A. Accidental Safety Factors and Prevention Techniques for High-Rise Building Projects—A Review. Ain Shams Eng. J. 2022, 13, 101723. [Google Scholar] [CrossRef]
  45. Kang, Y.; Siddiqui, S.; Suk, S.J.; Chi, S.; Kim, C. Trends of Fall Accidents in the U.S. Construction Industry. J. Constr. Eng. Manag. 2017, 143, 04017043. [Google Scholar] [CrossRef]
  46. Kang, Y. Use of Fall Protection in the US Construction Industry. J. Manag. Eng. 2018, 34, 04018045. [Google Scholar] [CrossRef]
  47. Rafindadi, A.D.; Napiah, M.; Othman, I.; Mikić, M.; Haruna, A.; Alarifi, H.; Al-Ashmori, Y.Y. Analysis of the Causes and Preventive Measures of Fatal Fall-Related Accidents in the Construction Industry. Ain Shams Eng. J. 2022, 13, 101712. [Google Scholar] [CrossRef]
  48. Ibrahim, A.; Nnaji, C.; Shakouri, M. Influence of Sociodemographic Factors on Construction Fieldworkers’ Safety Risk Assessments. Sustainability 2021, 14, 111. [Google Scholar] [CrossRef]
  49. Shao, B.; Hu, Z.; Liu, Q.; Chen, S.; He, W. Fatal Accident Patterns of Building Construction Activities in China. Saf. Sci. 2019, 111, 253–263. [Google Scholar] [CrossRef]
  50. Occupational Safety and Health Administration. Analysis of Construction Fatalities—The OSHA Data Base 1985–1989; U.S. Dept. of Labor, Occupational Safety and Health Administration: Washington, DC, USA, 1990.
  51. Cattledge, G.H.; Hendricks, S.; Stanevich, R. Fatal Occupational Falls in the U.S. Construction Industry, 1980–1989. Accid. Anal. Prev 1996, 28, 647–654. [Google Scholar] [CrossRef]
  52. Halabi, Y.; Xu, H.; Long, D.; Chen, Y.; Yu, Z.; Alhaek, F.; Alhaddad, W. Causal Factors and Risk Assessment of Fall Accidents in the U.S. Construction Industry: A Comprehensive Data Analysis (2000–2020). Saf. Sci. 2022, 146, 105537. [Google Scholar] [CrossRef]
  53. Service d’Expertise et Soutien Statistique. IRSST-Sources: Base de Données de l’INFOCENTRE.; Service d’Expertise et Soutien Statistique: Quebec, QC, Canada, 1999. [Google Scholar]
  54. Winge, S.; Albrechtsen, E. Accident Types and Barrier Failures in the Construction Industry. Saf. Sci. 2018, 105, 158–166. [Google Scholar] [CrossRef]
  55. Zlatar, T.; Lago, E.M.G.; de Albuquerque Soares, W.; dos Santos Baptista, J.; Barkokébas Junior, B. Falls from Height: Analysis of 114 Cases. Production 2019, 29, 1–24. [Google Scholar] [CrossRef] [Green Version]
  56. XSPlatforms Fall Accidents Research. Available online: https://fallprotectionxs.com/es/infografias-2/ (accessed on 20 May 2022).
  57. Carreño Ortega, Á. Reducción de la Siniestralidad Laboral en la Construcción de Invernaderos Tipo Multitúnel Mediante la Implementación de un Nuevo Procedimiento Constructivo; Universidad de Almería: Almeria, Spain, 2005. [Google Scholar]
  58. Spanish Government Royal Decree 1627/1997 on Minimum Requirements for Health and Safety at Construction Sites. Spanish Off. Gaz. 1997, 256, 30875–30886.
  59. González, M.N.; Cobo, A.; Castaño, A.; Prieto, M.I. A Comparison of the Resistance of Temporary Edge Protection Systems to Static and Dynamic Loads. Inf. la Construcción 2015, 67, e085. [Google Scholar] [CrossRef] [Green Version]
  60. Lan, A.; Galy, B. Evaluation of a Horizontal Lifeline System Used during Installation of Residential Roofs. J. Constr. Eng. Manag. 2017, 143, 06016008. [Google Scholar] [CrossRef]
  61. Cobo, A.; de las Nieves González, M.; Castaño, Á.; Prieto, M.I. Calibration of Calculation Models of Wooden Guardrails with Operational Modal Analysis. Int. J. Eng. Sci. Innov. Technol. 2014, 3, 618–630. [Google Scholar]
  62. González, M.N.; Cobo, A.; Lozano, C.; Bresó, S. Behaviour of Temporary Edge Protection Systems of High Density Polyethylene Tested to Static and Impact Load. Mater. Construcción 2013, 63, 283–296. [Google Scholar] [CrossRef] [Green Version]
  63. MEPLASJAR Nuevo Sistema SPPB Clase A UNE EN 13374:2013+A1:2019. Available online: http://www.meplasjar.com/es/noticias/nuevo-sistema-sppb-clase-a-une-en-133742013-a12019 (accessed on 20 May 2022).
  64. Normalización Española. UNE-EN 13374:2013+A1:2019 Sistemas Provisionales de Protección de Borde. Especificaciones del Producto. Métodos de Ensayo; AENOR: Madrid, Spain, 2019. [Google Scholar]
  65. Bestratén Belloví, M.; Guardino Solá, X.; Iranzo Garcia, Y.; Piqué Ardanuy, T.; Pujol Senovilla, L.; Solórzano Fábrega, M.; Tamborero del Pino, J.M.; Turmo Sierra, E.; Varela Iglesias, I. Seguridad en el Trabajo; Instituto Nacional de Seguridad e Higiene en el Trabajo: Madrid, Spain, 2011; ISBN 978-8474257908. [Google Scholar]
  66. Pinto, A.; Reis, L. Barrier for Buildings: Analysis of Mechanical Resistance Requirements. Procedia Struct. Integr. 2016, 1, 281–288. [Google Scholar] [CrossRef] [Green Version]
  67. Dogan, E.; Yurdusev, M.A.; Yildizel, S.A.; Calis, G. Investigation of Scaffolding Accident in a Construction Site: A Case Study Analysis. Eng. Fail. Anal. 2021, 120, 105108. [Google Scholar] [CrossRef]
  68. Gambatese, J.; Al Omari, K. Degrees of Connectivity: Systems Model for Upstream Risk Assessment and Mitigation. Accid. Anal. Prev. 2016, 93, 251–259. [Google Scholar] [CrossRef]
  69. Gangolells, M.; Casals, M.; Forcada, N.; Roca, X.; Fuertes, A. Mitigating Construction Safety Risks Using Prevention through Design. J. Safety Res. 2010, 41, 107–122. [Google Scholar] [CrossRef] [Green Version]
  70. Chan, A.P.C.; Wong, F.K.W.; Chan, D.W.M.; Yam, M.C.H.; Kwok, A.W.K.; Lam, E.W.M.; Cheung, E. Work at Height Fatalities in the Repair, Maintenance, Alteration, and Addition Works. J. Constr. Eng. Manag. 2008, 134, 527–535. [Google Scholar] [CrossRef]
  71. Rubio-Romero, J.C.; Rubio, M.C.; García-Hernández, C. Analysis of Construction Equipment Safety in Temporary Work at Height. J. Constr. Eng. Manag. 2013, 139, 9–14. [Google Scholar] [CrossRef]
  72. Peñaloza, G.A.; Formoso, C.T.; Saurin, T.A. Avaliação de Requisitos de Desempenho de Sistemas de Proteção Periférica (SPP). Ambient. Construído 2015, 15, 267–289. [Google Scholar] [CrossRef] [Green Version]
  73. Gogelescu, C.; Solomon, G.; Tudose, E.; Bulboacă, C.; Chivu, O. Improving Occupational Health at Work for Height Work in Temporary and Mobile Sites. J. Res. Innov. Sustain. Soc. 2021, 3, 17–26. [Google Scholar] [CrossRef]
  74. Kuzhin, M. Protective and Catching Safety Systems in Construction. MATEC Web Conf. 2017, 117, 00096. [Google Scholar] [CrossRef] [Green Version]
  75. Fong, D. Using the Self-Stated Importance Questionnaire to Interpret Kano Questionnaire Results. Cent. Qual. Manag. J. 1996, 5, 21–24. [Google Scholar]
  76. Berger, C.; Blauth, R.; Boger, D.; Bolster, C.; Burchill, G.; DuMouchel, W.; Pouliot, F.; Richter, R.; Rubinoff, A.; Shen, D.; et al. Kano’s Methods for Understanding Customer-Defined Quality. Cent. Qual. Manag. J. 1993, 2, 2–36. [Google Scholar]
  77. Mills, R.; Newnes, L.B.; Nassehi, A. Balancing Global Customer Needs and Profitability Using a Novel Business Model for New Model Programmes in the Automotive Industry. Procedia CIRP 2016, 52, 56–61. [Google Scholar] [CrossRef]
  78. Xu, Q.; Jiao, R.J.; Yang, X.; Helander, M.; Khalid, H.M.; Opperud, A. An Analytical Kano Model for Customer Need Analysis. Des. Stud. 2009, 30, 87–110. [Google Scholar] [CrossRef]
  79. Suef, M.; Suparno, S.; Singgih, M.L. Categorizing Product Attributes Efficiently in QFD-Kano: A Case Analysis in Telecommunication. TQM J. 2017, 29, 512–527. [Google Scholar] [CrossRef]
  80. The Clarkson Centre for Business Ethics. Principles of Stakeholder Management; Joseph, L., Ed.; Rotman School of Management of the University of Toronto: Toronto, ON, Canada, 1999; ISBN 9780772786098. [Google Scholar]
  81. Cerezo-Narváez, A.; Pastor-Fernández, A.; Otero-Mateo, M.; Ballesteros-Pérez, P. The Relationship between Building Agents in the Context of Integrated Project Management: A Prospective Analysis. Buildings 2021, 11, 184. [Google Scholar] [CrossRef]
  82. Saaty, T.L. The Analytic Hierarchy Process: Decision Making in Complex Environments. In Quantitative Assessment in Arms Control; Springer US: Boston, MA, USA, 1984; pp. 285–308. [Google Scholar]
  83. Gogus, O.; Boucher, T.O. A Consistency Test for Rational Weights in Multi-Criterion Decision Analysis with Fuzzy Pairwise Comparisons. Fuzzy Sets Syst. 1997, 86, 129–138. [Google Scholar] [CrossRef]
  84. Lee, S.; Walsh, P. SWOT and AHP Hybrid Model for Sport Marketing Outsourcing Using a Case of Intercollegiate Sport. Sport Manag. Rev. 2011, 14, 361–369. [Google Scholar] [CrossRef]
  85. Doloi, H. Application of AHP in Improving Construction Productivity from a Management Perspective. Constr. Manag. Econ. 2008, 26, 841–854. [Google Scholar] [CrossRef]
  86. David, A.; Varghese, S. AHP Model for Performance Improvement in LSGD Projects. In SECON 2020, Structural Engineering and Construction Management, Proceedings of the 1st International Conference on Structural Engineering and Construction Management (SECON’20), Angamaly, Kerala, India, 14–15 May 2020; Lecture Notes in Civil Engineering; Springer: Cham, Switzerland, 2021; Volume 97, pp. 835–850. ISBN 978-3030551155. [Google Scholar]
  87. Crosti, C.; Bontempi, F.; Arangio, S. The Collapse of a Temporary Structure. Int. J. Forensic Eng. 2016, 3, 18. [Google Scholar] [CrossRef]
  88. Rubio-Romero, J.C.; Carmen Rubio Gámez, M.; Carrillo-Castrillo, J.A. Analysis of the Safety Conditions of Scaffolding on Construction Sites. Saf. Sci. 2013, 55, 160–164. [Google Scholar] [CrossRef]
Figure 1. Research framework.
Sustainability 14 14285 g001
Figure 3. Commercial solutions catalogue adapted to UNE-EN 13374:2013+A1:2019 [64].
Sustainability 14 14285 g003
Figure 4. Description of the set of traditional elements (upright and horizontal railing) used as TEPS.
Sustainability 14 14285 g004
Figure 5. Diagrams of forces and moments of the tests carried out.
Sustainability 14 14285 g005
Figure 6. FEA deflection in test 1 for reference material (galvanised steel).
Sustainability 14 14285 g006
Figure 7. FEA von Mises stress in tests 2 and 3 for reference material (GS).
Sustainability 14 14285 g007
Figure 8. FEA von Mises stress in tests 4 and 5 for reference material (GS).
Sustainability 14 14285 g008
Figure 9. FEA deflection in test 6 for reference material (GS).
Sustainability 14 14285 g009
Figure 10. FEA von Mises stress in tests 7 and 8 for reference material (GS).
Sustainability 14 14285 g010
Figure 12. AHP problem to be solved.
Sustainability 14 14285 g012
Figure 13. Hierarchisation of alternatives.
Sustainability 14 14285 g013
Figure 14. Hierarchisation of sub-criteria.
Sustainability 14 14285 g014
Figure 15. Evaluation of alternatives by weighted criteria.
Sustainability 14 14285 g015
Table 1. Employment rates, workplace accidents and falls in Spain, 2000–2019. Source: INE.
YearAll Economic Sectors (General)Construction Sector
OccupancyAccidentsFallsPermitsOccupancyAccidentsFalls
200016,146,275932,932163,758121,2461,695,900239,24444,591
200116,790,100946,600167,043112,8831,952,726250,27746,554
200217,475,600938,188164,806116,9032,189,274250,41446,618
200318,142,250874,724121,029130,4222,310,523230,73544,658
200419,207,000871,724128,829146,4082,455,722224,08341,751
200519,939,100890,872132,722153,7422,657,643238,49547,668
200620,579,925911,561133,443172,8442,797,500250,31351,355
200720,469,650924,981138,706145,5552,880,513253,48163,254
200819,106,850804,959123,949107,5832,232,238186,65548,767
200918,724,475617,44097,81581,2511,846,845122,61431,158
201018,421,425569,52392,32775,4881,659,525100,54225,941
201117,632,675512,58482,78370,7361,323,37178,96620,217
201217,139,000408,53768,98861,5781,112,23351,32713,249
201317,344,175404,28468,36851,726982,09541,99410,790
201417,866,050424,62571,41152,255991,20243,0437256
201518,341,550458,02376,94153,0991,059,44048,8138306
201618,824,825489,06581,21658,2071,095,71053,5798936
201719,327,725515,08286,59360,2591,150,63961,37510,500
201819,779,300532,97790,15160,3141,266,19769,42012,147
201919,773,600562,75696,77751,4451,340,18573,66614,828
Table 2. Mechanical and strength characteristics of the materials used.
MaterialGSALCIPETPVCGFRPCFRP
Shear Modulus (N/mm2)8.2 × 1042.8 × 1046.4 × 1041.3 × 1033.5 × 1033.1 × 1045.3 × 104
Young Modulus (N/mm2)2.1 × 1057.4 × 1041.7 × 1051.2 × 1047.0 × 1037.5 × 1042.4 × 105
Density (g/cm3)7.82.87.51.31.41.81.9
Shear Strength (N/mm2)50028050010030200260
Yield Strength (N/mm2)2802904105560465540
Tensile Strength (N/mm2)36044060015011017504170
Table 3. Encoding responses according to Kano model.
CodingDysfunctional Requirements (Negative Questions)
12345
Functional requirements
(positive questions)
5CAAAO
4RIIIM
3RIIIM
2RIIIM
1RRRRC
Table 4. Initial list of requirements.
DimensionIDPotential Requirement
SecuritySE1Resistance to mechanical stress
SE2Resistance to extreme temperatures
SE3Resistance to humidity
SE4Resistance to bad weather
SE5Safety through locking parts
SE6Technical support service
ErgonomicsER1Decomposition into low-weight elements
ER2Assembly/disassembly with ease
ER3Handling individually
ER4Functionality in different lengths and heights
ER5Configuration of a folding system
ER6Configuration of an extendable system
SustainabilitySO1Use of fire-resistant materials
SO2Use of degradable materials
SO3Use of durable materials
SO4Use of coating materials
SO5Availability of spare parts
SO6Availability of repair service
FabricabilityFA1Manufacturing with light materials
FA2Manufacturing with simple materials
FA3Manufacturing with composite materials
FA4Manufacturing with recycled materials
FA5Manufacturing with manual/artisanal materials
FA6Manufacturing with industrial/standardised materials
EfficiencyEF1Transport by truck
EF2Transport by van
EF3Transport by car
EF4Storage in racks
EF5Storage in piles
EF6Procurement at low cost
FlexibilityFL1Use of bright colours
FL2Use of neutral colours
FL3Use of luminescent materials
FL4Use of lighting elements
FL5Use of reflective elements
FL6Use of existing elements in the market
AdaptabilityAD1Manoeuvrability in different workplaces
AD2Compatibility with existing systems
AD3Versatility for use on different types of work sites
AD4Procurement of customised system elements
AD5Commercialisation free of charge
AD6Commercialisation through exclusive representation
Table 5. Scores of functional and dysfunctional responses.
ResponsesFunctional Form of QuestionDysfunctional Form of Question
ScaleScoreScaleScore
I like it that way5+1.001−0.50
It must be that way4+0.502−0.25
I am neutral3±0.003±0.00
I can live with it that way2−0.254+0.50
I dislike it that way1−0.505+1.00
Table 6. Saaty scale for AHP.
Intensity of ImportanceDefinitionExplanation
1Equal importanceEqual contribution to the objective
3Moderate importanceExperience and judgement slightly favour one over another
5Strong importanceExperience and judgement strongly favour one over another
7Very strong importanceOne is favoured very strongly over another
9Extreme importanceThe evidence favouring one over another is the highest
2, 4, 6, 8Intermediate valuesJudgements between defined prior intensities
1/2, 1/3, 1/4, 1/5, 1/6, 1/7, 1/8, 1/9Reciprocal valuesOpposite judgements concerning defined prior intensities
Table 7. Index ratio values based on the order of the comparison matrix.
n12345678910
RI000.5250.8821.1151.2521.3411.4041.4521.484
Table 8. SLS results of maximum deflection at the midpoint of the upper horizontal railing.
Test 1GSALCIPETPVCGFRPCFRP
Maximum Deflection (mm)55555555555555
Analytic Deflection (mm)2674334547797323
FEA Deflection (mm)2160263656285919
Compliance?OKKOOKKOKOKOOK
Table 9. ULS results of bending moment at the midpoint of the upper horizontal railing.
Test 2GSALCIPETPVCGFRPCFRP
Min. Bending Moment (N·m)281281281281281281281
Analytic Bending Moment (N·m)5555758131091199221071
Max. von Mises Stress (N/mm2)3423545006773568659
FEA von Mises Stress (N/mm2)331332330356345338341
Compliance?OKOKOKKOKOOKOK
Table 10. ULS results of shear stress at the midpoint of the upper horizontal railing.
Test 3GSALCIPETPVCGFRPCFRP
Min. Shear Strength (N)225225225225225225225
Analytic Shear Strength (N)30,47231,56044,6195986653050,60558,767
Max. von Mises Stress (N/mm2)3423545006773568659
FEA von Mises Stress (N/mm2)331332330356345338341
Compliance?OKOKOKKOKOOKOK
Table 11. PL ULS results of bending moment at the base of the upright.
Test 4GSALCIPETPVCGFRPCFRP
Min. Bending Moment (N·m)360360360360360360360
Analytic Bending Moment (N·m)736762107714515812221419
Max. von Mises Stress (N/mm2)3423545006773568659
FEA von Mises Stress (N/mm2)1049110386878787
Compliance?OKOKOKKOKOOKOK
Table 12. PL ULS results of shear stress at the base of the upright.
Test 5GSALCIPETPVCGFRPCFRP
Min. Shear Strength (N)300300300300300300300
Analytic Shear Strength (N)35,08936,34251,3806892751958,27267,671
Max. von Mises Stress (N/mm2)3423545006773568659
FEA von Mises Stress (N/mm2)1049110386878787
Compliance?OKOKOKKOKOOKOK
Table 13. AL ULS results of maximum deflection at the midpoint of the top horizontal railing.
Test 6GSALCIPETPVCGFRPCFRP
Maximum Deflection (mm)300300300300300300300
Analytic Deflection (mm)69195851197205219260
FEA Deflection (mm)1953233195485217
Compliance?OKOKOKKOKOOKOK
Table 14. AL ULS results of bending (breakage) at the midpoint of the upper horizontal railing.
Test 7GSALCIPETPVCGFRPCFRP
Min. Bending Moment (N·m)781781781781781781781
Analytic Bending Moment (N·m)785959130832724038169093
Max. von Mises Stress (N/mm2)36344360515111117664208
FEA von Mises Stress (N/mm2)371356371343341346344
Compliance?OKOKOKKOKOOKOK
Table 15. Results ULS accidental load to shear stress at the midpoint of the upper horizontal railing.
Test 8GSALCIPETPVCGFRPCFRP
Min. Shear Strength (N)625625625625625625625
Analytic Shear Strength (N)33,51933,51949,0816584359123,94231,125
Max. von Mises Stress (N/mm2)36344360515111117664208
FEA von Mises Stress (N/mm2)371356371343341346344
Compliance?KOOKOKKOKOOKOK
Table 16. Population control questions for sample classification.
Control QuestionsResponsesUnitsPercentage
Age<25 years21.05%
25–30 years136.84%
31–45 years12364.74%
46–60 years4423.16%
>60 years84.21%
Organisational sizeSelf-employed3920.53%
Micro enterprise5428.42%
Small enterprise3116.32%
Medium enterprise2312.11%
Large enterprise4322.63%
Works complexityVery simple178.95%
Simple2211.58%
Normal6333.16%
Complex4624.21%
Very complex4222.11%
Table 18. Weighting of criteria and sub-criteria using the AHP method.
IDCriteriaIDSub-CriteriaSub-Criteria WeightCriteria Weight
SESecuritySE1Resistance to mechanical stress20.46%36.29%
SE2Resistance to extreme temperatures2.00%
SE4Resistance to bad weather4.28%
SE5Safety through locking parts9.55%
ERErgonomicsER1Decomposition into low-weight elements1.72%25.58%
ER2Assembly/disassembly with ease16.91%
ER4Functionality in different lengths and heights6.95%
SUSustainabilitySU1Use of fire-resistant materials2.15%8.85%
SU3Use of durable materials5.92%
SU5Availability of spare parts0.78%
FAFabricabilityFA1Manufacturing with light materials1.78%3.15%
FA3Manufacturing with composite materials0.83%
FA4Manufacturing with recycled materials0.17%
FA6Manufacturing with industrial/standardised materials0.37%
EFEfficiencyEF1Transport by truck0.39%6.12%
EF2Transport by van0.84%
EF3Transport by car1.60%
EF4Storage in racks0.19%
EF6Procurement at low cost3.10%
FLFlexibilityFL6Use of existing elements in the market2.28%2.28%
ADAdaptabilityAD1Manoeuvrability in different workplaces9.98%17.73%
AD2Compatibility with existing systems2.28%
AD3Versatility for use on different types of work sites4.77%
AD4Procurement of customised system elements0.70%
Table 19. Compliance with the tests according to UNE-EN 13374:2013+A1:2019 (model dimensions).
TestMetalsPlasticsComposites
GSALCIPETPVCGFRPCFRP
SLS (deflection)212%74%167%12%7%75%239%
ULS (bending)197%204%289%39%42%328%381%
ULS (shear)13,543%14,027%19,831%2660%2902%22,491%26,119%
PL ULS (bending)204%212%299%40%44%339%394%
PL ULS (shear)11,696%12,114%17,127%2297%2506%19,424%22,557%
AL ULS (deflection)435%154%353%25%15%156%500%
AL ULS (bending)100%123%167%42%31%488%1164%
AL ULS (shear)5363%5363%7853%1053%575%3831%4980%
Table 20. Sizing of materials to optimise compliance with the tests.
ElementMetalsPlasticsComposites
GSALCIPETPVCGFRPCFRP
Guardrail35−235−335−240−740−735−435−2
Post40−240−240−240−240−740−240−2
Table 21. Compliance with the tests according to UNE-EN 13374:2013+A1:2019 (final dimensions).
TestMetalsPlasticsComposites
GSALCIPETPVCGFRPCFRP
SLS (deflection)≤55 mm2655331492555523
212%100%167%37%22%100%239%
ULS (bending)≥281 N·m555101981338742216341071
197%362%289%138%150%581%381%
ULS (shear)≥225 N30,47259,29544,61920,94922,85495,07658,767
13,543%26,353%19,831%9311%10,157%42,256%26,119%
PL ULS (bending)≥360 N·m736762107738742212221419
204%212%299%107%117%339%394%
PL ULS (shear)≥300 N35,08936,34251,38020,94922,85458,27267,671
11,696%12,114%17,127%6983%7618%19,424%22,557%
AL ULS (deflection)≤300 mm691168532956411560
435%259%353%91%53%261%500%
AL ULS (bending)≥781 N·m7ype8517011308116185167649093
100%218%167%149%109%866%1164%
AL ULS (shear)≥625 N33,51962,97549,08123,04412,57044,98231,125
5363%10,076%7853%3687%2011%7197%4980%
Table 22. List of attractive, mandatory and one-dimensional requirements.
IDRequirementType
SE2Resistance to extreme temperaturesMandatory
SE4Resistance to bad weather
SU1Use of fire-resistant materials
FA6Manufacturing with industrial/standardised materials
EF1Transport by truck
EF6Procurement at low cost
SE1Resistance to mechanical stressOne−dimensional
ER1Decomposition into low-weight elements
ER2Assembly/disassembly with ease
ER4Functionality in different lengths and heights
SU3Use of durable materials
EF2Transport by van
EF4Storage in racks
FL6Use of existing elements in the market
AD1Manoeuvrability in different workplaces
AD2Compatibility with existing systems
AD3Versatility for use on different types of work sites
AD4Procurement of customised system elements
SE5Safety through locking partsAttractive
SU5Availability of spare parts
FA1Manufacturing with light materials
FA3Manufacturing with composite materials
FA4Manufacturing with recycled materials
EF3Transport by car
Publisher’s Note: MDPI stays neutral with regard to jurisdictional claims in published maps and institutional affiliations.