Article

Stevia rebaudiana under a CO2 Enrichment Atmosphere: Can CO2 Enrichment Overcome Stomatic, Mesophilic and Biochemical Barriers That Limit Photosynthesis?

by
Marcelo F. Pompelli
1,*,†,
Carlos A. Espitia-Romero
2,†,
Juán de Diós Jaraba-Navas
1,†,
Luis Alfonso Rodriguez-Paez
1,† and
Alfredo Jarma-Orozco
1,†
1
Facultad de Ciencias Agrícolas, Universidad de Córdoba, Montería 230002, Colombia
2
Invepar Research Group, Department of Agricultural Sciences, University of Córdoba, Montería 230002, Córdoba, Colombia
*
Author to whom correspondence should be addressed.
These authors contributed equally to this work.
Sustainability 2022, 14(21), 14269; https://doi.org/10.3390/su142114269
Submission received: 5 October 2022 / Revised: 23 October 2022 / Accepted: 24 October 2022 / Published: 1 November 2022
(This article belongs to the Special Issue Global Climate Change: What Are We Doing to Mitigate Its Effects)

Abstract

:
Due to the desire to live a healthier lifestyle, the search for nonglycosidic sweeteners has increased stevioside production in recent years. The main goal of this study was to demonstrate that S. rebaudiana grown in a CO2-enriched environment can overcome stomatic, mesophilic and biochemical barriers that limit photosynthesis (AN). We show that in an environment with a CO2-enriched atmosphere (800 and 1200 µmol CO2 mol−1), the genotype 16 (G16) shows an increase of 17.5% in AN and 36.2% in stomatal conductance in plants grown in 800 µmol CO2 mol−1 when compared to non-enriched plants. In conjunction with this issue, the plants show an efficient mechanism of dissipating excess energy captured by the photosystems. Photosystem II efficiency was increased at 1200 µmol CO2 mol−1 when compared to non-enriched plants, both in genotype 4 (25.4%) and G16 (211%). In addition, a high activity of Calvin–Benson enzymes, a high production of sugars and an enhanced production of steviosides were combined with high horticultural yield. Both genotypes (G4 and G16) showed excellent physiological indicators, with high superiority in G16. Thus, our study has demonstrated that S. rebaudiana could adapt to global climate change scenarios with higher temperatures caused by higher atmospheric CO2.

1. Introduction

Predicting the effects of rising atmospheric CO2 concentration and temperature is very important for projecting the impact of global change on the biosphere [1]. In the Caribbean natural environment, plants are exposed to high photosynthetic active radiation (PAR) [2,3], and plants sometimes receive more photons (energy) than they can process. This excess energy may have to be safely dissipated, as excess energy can disrupt photosystem (PS) II and PSI, mainly the D1 protein and cytochrome b6f [4]. Through chlorophyll a fluorescence, plants are able to safely dissipate the excess energy that, if not dissipated, would cause severe damage to the structure of the PS [5,6,7,8] and significant formation of reactive oxygen species (ROS) [9,10,11,12].
Analyses of net photosynthesis (AN) versus intercellular CO2 concentration (Ci) (AN:Ci) have been very useful for testing mechanistic models of photosynthetic metabolism and for predicting photosynthetic responses to global climate change [13]. Internal CO2 concentration is considered the main primary environmental factor that determines, directly or indirectly, the photosynthetic capacity [14,15]. Changes in CO2 affect the photosynthetic capacity at both the biochemical and stomatal levels. However, the mesophilic conductance (gm) could positively or negatively impact net photosynthesis (AN), as CO2 undergoes long-term resistance until it reaches the Rubisco carboxylation sites [9,16,17,18].
Some studies have detailed the effects of elevated CO2 on photosynthesis, growth and dry matter of a range of cultivated crop species [19,20]. In these studies, high [CO2] was found to inhibit the oxygenase reaction of rubisco and the subsequent loss of CO2 through photorespiration [21,22]. However, high temperatures decrease the activation state of rubisco [19,23], decreasing the specificity for CO2 and the solubility of CO2 in relation to O2 [18,24]. However, the increase in [CO2] and the inhibition of oxygenase activity could modulate the adverse effects of the increase in temperature, thus leading to greater net photosynthesis and further dry biomass [25]. However, there is no sufficient evidence that an increase in [CO2] could directly positively influence AN [19]. Some scholars suggested that AN in light saturation under low CO2 concentrations is limited by rubisco activity [18,26,27,28,29]. In accordance with Atkinson et al. [30], AN acclimation is species-dependent because Prunus sp. grown in a CO2-enriched environment showed a 27% enhancement in dry mass production and 51% after 10 months, values that were not significantly different from those of plants grown and measured under ambient CO2, while the Quercus sp. dry mass increased more than 200% after 10 months.
The ideal technique with which to assess rubisco-limited, RuBP-limited, and maximum rate of triose phosphate use (TPU)-limited photosynthesis is the generation of AN:Ci curves, a technique that is useful for testing mechanistic models of photosynthetic metabolism and for predicting photosynthetic responses to global change [31,32]. The CO2-enriched environment allows for a greater AN and, consequently, a greater biomass production and greater efficiency of rubisco activity; since more substrates are being offered to the enzyme, the lower rubisco could be due to its activation or the expression of rubisco proteins [13,33].
The measurement of chlorophyll a fluorescence is an inexpensive and popular technique and a nondestructive assessment method that, if applied correctly, can provide a series of data that indicate the physiological stage of PSII detection or act as a stress-alert method [34,35]. This technique allows accurate and skillful measurement of plant health and provides valuable information on the photosynthetic electron transport rate and how it is used. It is captured as a reducing power to direct photosynthesis, extinguished in the form of heat and other mechanisms, making the technique a potent analyzer of stressors [36]. In addition, the measurement of chlorophyll a fluorescence allows us to perform measurements throughout an experiment. Even so, considering the number of studies focused on chlorophyll fluorescence, less than 1% studied chlorophyll a fluorescence by imaging. In long experiments, plants can acclimatize to a stressful situation and exhibit decreased fluorescence parameters, which occurs through three main processes: (1) chlorophyll photobleaching that decreases energy capture, resulting in less energy in the system that needs to be dissipated; (2) acclimatization of the photosystem, which minimizes the deleterious excess energy that reaches the system; and (3) genetic modifications with the activation of genes and the translation of proteins capable of extinguishing fluorescence in a safe manner for the plant, as occurs in the epoxidation and de-epoxidation system of xanthophylls in the violaxanthin–antheraxanthin–zeaxanthin (VAZ) cycle [37]. Thus, an in-depth analysis of the mechanisms of photon capture, electron transport, formation of reducing power in the form of ATP and NADPH and kinetics of the main enzymes of the Calvin–Benson cycle, to our knowledge, is rarely performed within a single study. If we consider only the studies with S. rebaudiana, we can infer it has never or rarely been studied to the depth that it was in the present study.
To date, most research on the photosynthetic responses in Stevia rebaudiana plants has concentrated on improving its crop production [38,39,40,41], salt content [42,43] and water tolerance [44] or retarding flowering to provide more time for leaf harvest [3,45,46]. Limited research has been undertaken on S. rebaudiana in relation to its performance under a CO2 enrichment atmosphere, and no studies have sought to identify variation in the Stevia genotype under this condition. Therefore, the main objective of this study was to evaluate the role of elevated and superelevated CO2-enriched atmospheres. For this purpose, our study proposes to analyze, from the capture of photons, the role of chlorophylls and the main carotenoids in the dissipation of excess energy through fluorescence and to allow a better assessment of the health of the plant, as the data from the light curves and CO2, biochemical and enzymatic data, as well as interactions between them, are presented in the present study.

2. Materials and Methods

2.1. Plant Material and Environmental Conditions

Two-month-old S. rebaudiana genotypes (G4 and G16) were studied; they were obtained by natural pollination in a controlled greenhouse after selection among 25 distinct started genotypes [47]. The study was carried out under biospace conditions [2] at the experimental farm of the Faculty of Agricultural Sciences at the University of Cordoba (Montería-Colombia), located at 8°47′37″ N; 75°51′51″ W, 15 m a.s.l., experiencing a mean annual rainfall of 1346 mm, relative humidity of 84% and mean annual temperature of 27.4 °C [48]. Montería is characterized as having a tropical wet climate according to the Köppen climate classification and a Martonne aridity index of 40.6 [48]. The experiment started on 18 November 2020 and finished on 17 February 2021. Cuttings of genotype 4 (G4) and genotype 16 (G16) of S. rebaudiana were grown in a greenhouse with a type I biospace (1000 m2) [2]. The cuttings were left to grow in 10 L pots filled with soil from the Montería region [49] and irrigated daily according to the evaporation measured by the weather station.
Two-month-old S. rebaudiana plants were transferred to a growth chamber (2 × 2 × 1 m; width, length and height, respectively) where they were allowed to acclimate for 20 days. During all timelines, the atmospheric temperature and relative humidity were recorded with a KR420 mini climatologic station coupled with an A150 temperature and humidity datalogger (Akrom Eclectronic Devises, São Leopoldo, RS, Brazil). The photosynthetically active radiation (PAR) was measured with PAR sensors (Li-Cor LI-190SA quantum sensor Li-Cor, NE, USA) connected to a datalogger (Li-1400 datalogger, Li-Cor, NE, USA). Air temperature, humidity and PAR data were obtained every 5 min. To register both maximum and minimum temperatures inside and outside the chambers, 5 mini climatological stations were installed at 30 cm above the ground in five different chambers, and 3 mini climatological stations were installed outside the chambers at 3 m above ground, with no exogenous light trapped above the sensors. The same process was used to measure PAR inside and outside the chambers. The daily accumulated PAR (PARaccumulated, measured in μmol photons m−2 day−1) was estimated from instantaneous data and expressed as mol photons m−2 day−1.
During the experiment, the outside PAR was a strong daily variable, with daily values ranging from 305 μmol photons m−2 s−1 to 2371 μmol photons m−2 s−1, while the inside PAR ranged from 169 μmol photons m−2 s−1 to 583 μmol photons m−2 s−1 (Figure 1A). From these data, the accumulated PAR (PARacumulated) was estimated during the entire period of daylight. Thus, inside the chambers, the PARacumulated was 23% of that outside the chambers (Figure 1B). The outside air temperature ranged from 15.6 °C to 33.4 °C; however, inside the chambers, the temperature ranged from 18.4 °C to 38.4 °C. The outside and inside relative humidities ranged from 54% to 88% and 60% to 98%, respectively (Figure 1C).

2.2. CO2-Enriched Atmosphere Chambers and Treatments

All plants were transferred to a growth chamber (2 × 2 × 1 m; width, length and height, respectively). The experimental setup with two-month-old S. rebaudiana plants under a randomized block design consisted of two genotypes (G4 and G16), three CO2 concentrations inside the chambers (400, 800 and 1200 μmol CO2 mol−1), 2 CO2 exposure times (1 h and 2 h long) and 3 timelines (0, 45 and 90 days after CO2 application started). To choose the carbon dioxide [CO2] inside the chambers, an actual [CO2] (400 μmol CO2 mol−1) [50] was elevated twice (800 μmol CO2 mol−1) and superelevated (1200 μmol CO2 mol−1). The CO2 treatment was applied between 9 a.m. and 11 a.m. for each treatment. The [CO2] inside the chambers was controlled by CO2 sensors (Sensor MG811, Prometec, Mexico City, Mexico) through C and C++ Arduino Integrated Development Environment software (Arduino Inc. https://www.arduino.cc/en/software (accessed on 4 October 2022)—Belmont, CA, USA). The CO2 source was a >99.5% 25 kg CO2 cylinder, plus a control valve (Linde—White Martins gases, Mexico City, Mexico).

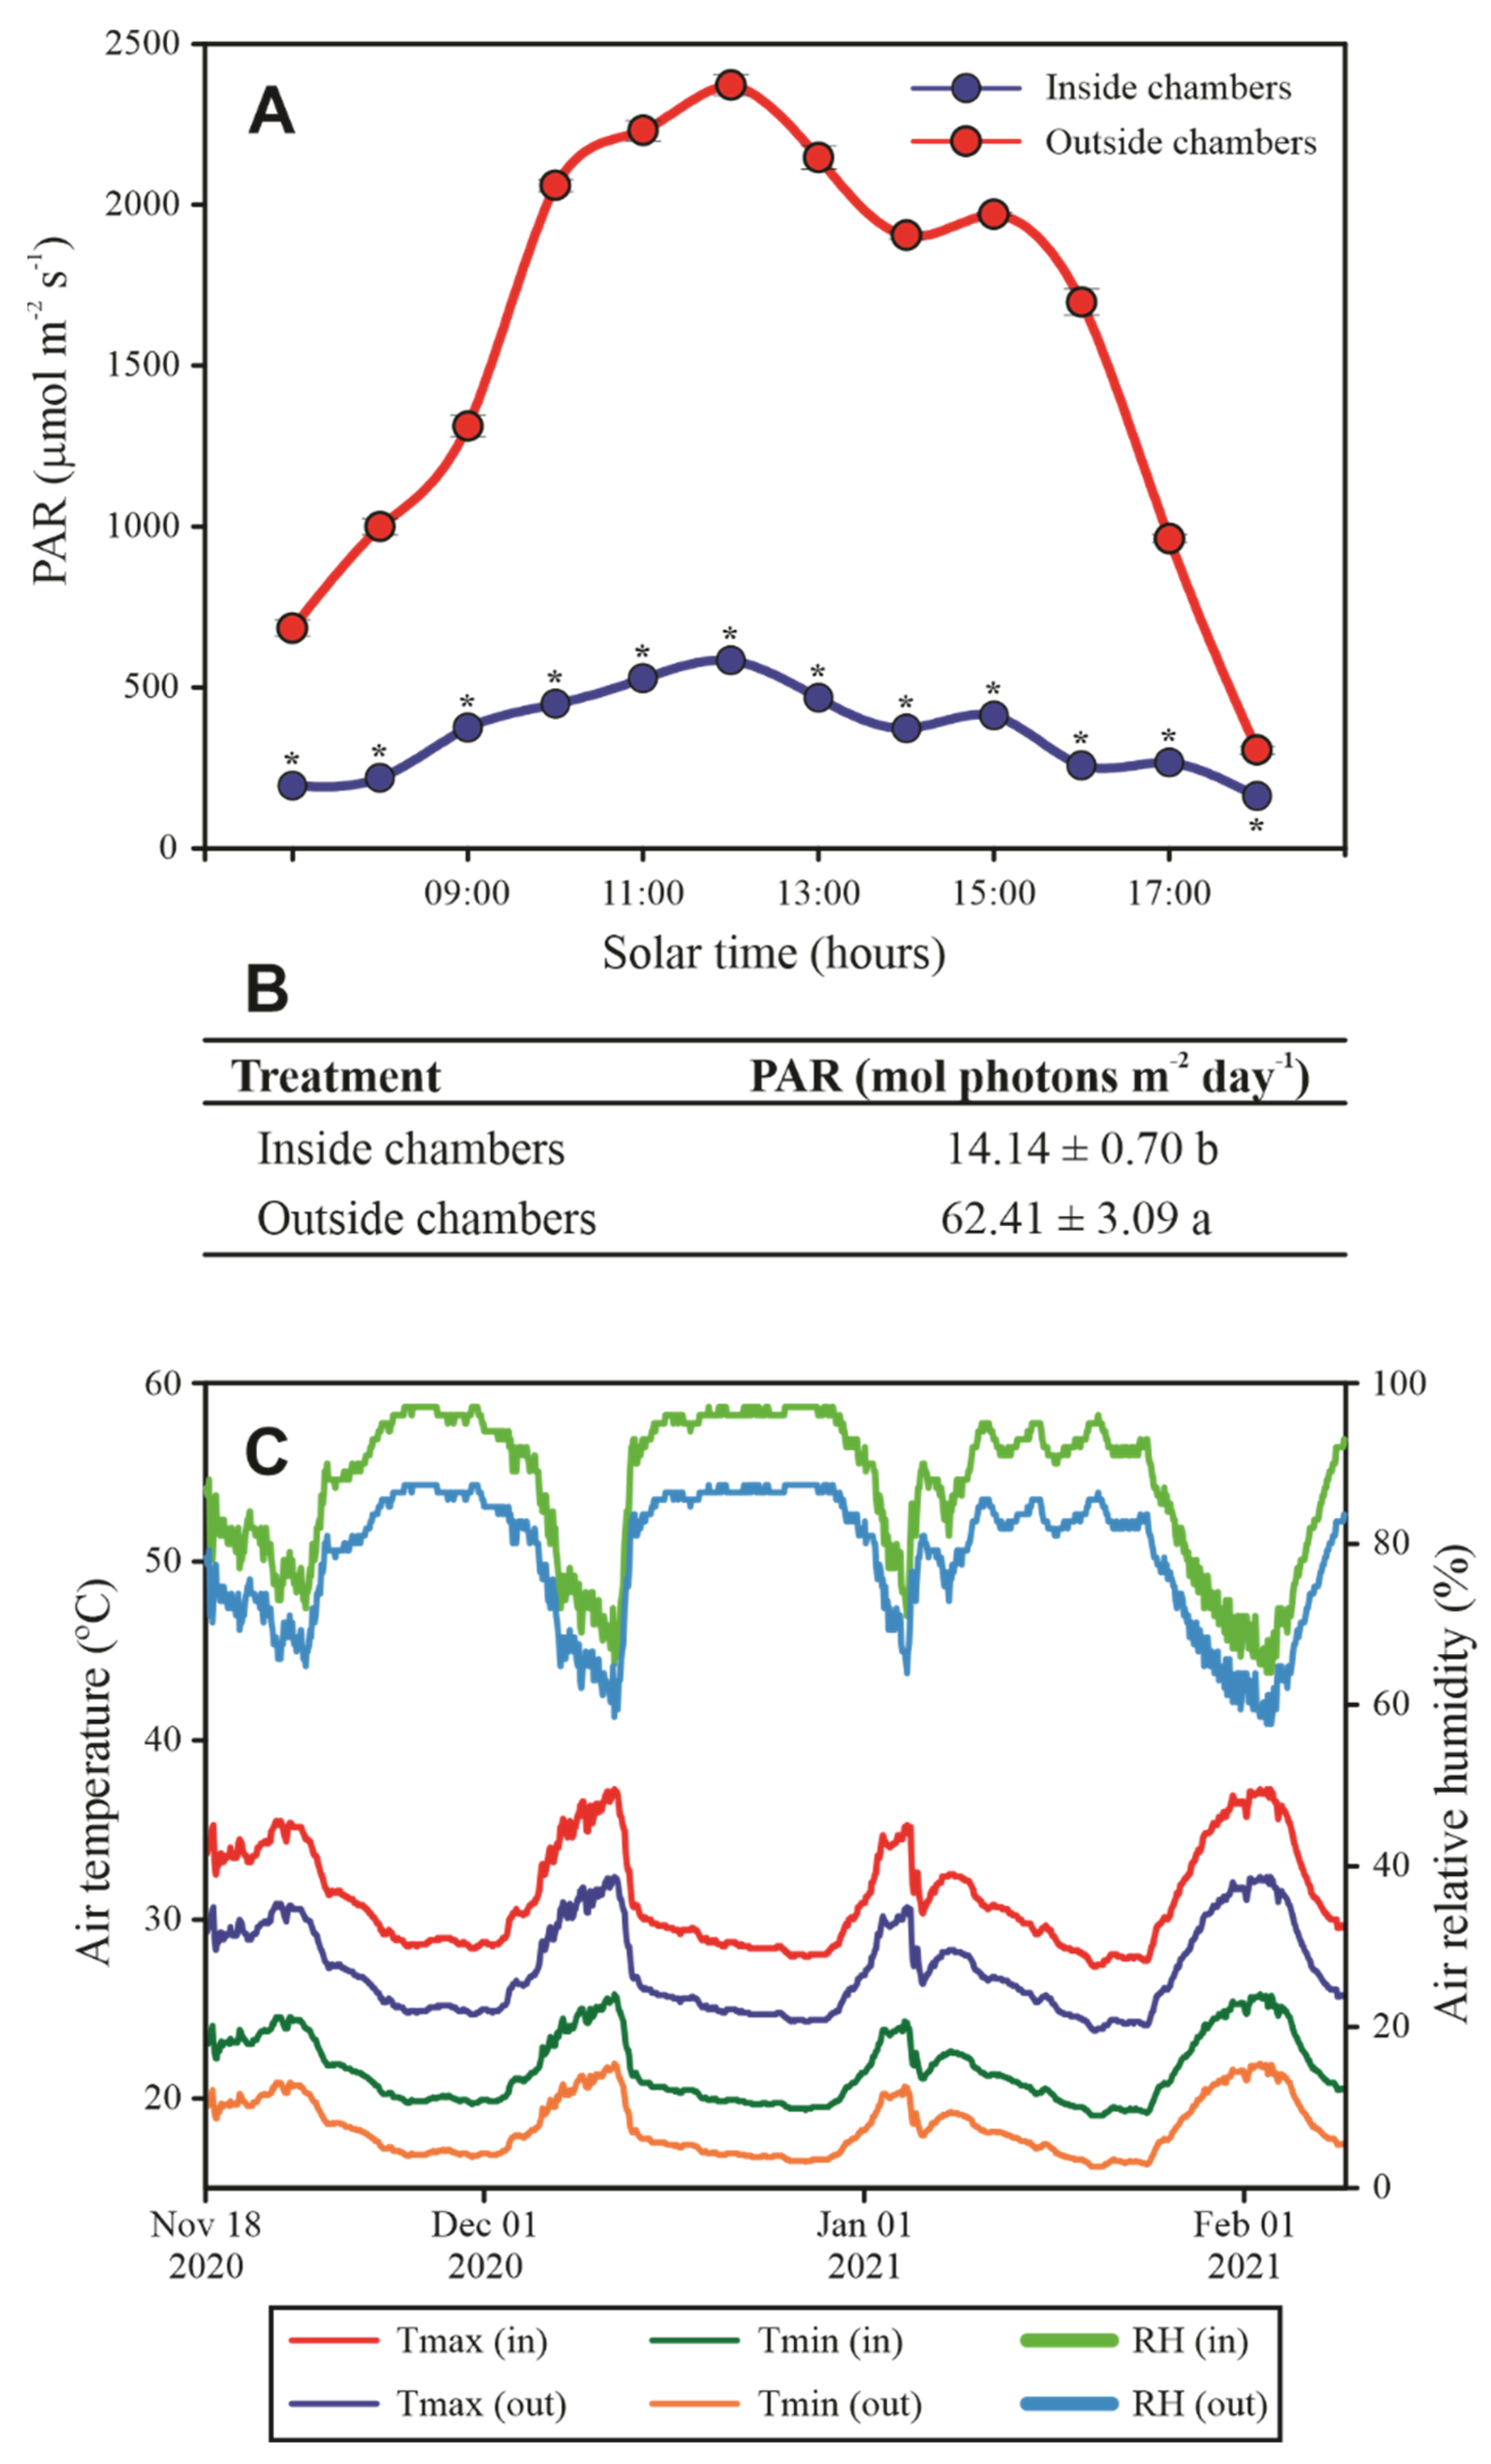
2.3. Estimation of CO2 Concentration and PAR Saturation

To determine the photosynthetically active radiation (PAR) to be used throughout the experiments, a curve of net photosynthesis (AN) in response to PAR intensity was constructed. For this purpose, a portable open-flow infrared gas analyzer (LI-6400XT; LI-COR Inc., Lincoln, NE, USA) with integrated fluorescence chamber heads (LI-6400-40; LI-COR Inc.) was used. The AN response to PAR was assembled as described by Sharkey [28] using a descending and continuous PAR (i.e., 2000, 1800, 1500, 1200, 1000, 800, 600, 500, 300, 150, 100, 50, 25 and 0 μmol photons m−2 s−1). The AN in response to PAR was registered in 5 different plants in both genotypes, and the mean value (±SD) was used to construct a nonrectangular hyperbolic model to obtain all data from the light response curves. An equation resembling P N = y 0 + ( a x b + x ) , where y0 denotes the y-axis intercept (or dark respiration), a is the theoretical ANMAX, b is a constant used to fit the curve slope and x denotes PAR intensity, was obtained in accordance with Bellasio et al. [29]. The ANMAX and light AN-Ci measurements were conducted with reference CO2 as recommended by Sharkey [28]. For that, AN was measured following the sequence 300, 200, 100, 50, 150, 250, 350, 600, 900, 1200 and 1500 μmol mol−1 [51] under saturating light conditions of 1200 μmol photons m2 s−1, determined after AN in response to PAR intensity. In accordance with Sharkey [28], saturation CO2 (Cisat), electron transport rate (J), maximum carboxylation rate of rubisco (VcMAX), maximum rate of triose phosphate use (TPU), day respiration (Rd*) and rubisco CO2 compensation point (Γ*) were estimated. Both light x AN and pCi x AN curves were constructed on 0-day plants to determine the AN limited by rubisco activity and AN limited by RuBP regeneration, as well as at 45 and 90 days, also for both genotypes.

2.4. Leaf Gas Exchange Parameters and Chlorophyll a Fluorescence

The parameters of gas exchange and chlorophyll a fluorescence were measured on the 1st day of CO2 enrichment in greenhouses (day zero) and after 45 and 90 days. The leaf gas exchange and chlorophyll a fluorescence were determined on the 3rd attached fully expanded leaf from the apex, using a portable open-flow infrared gas analyzer as described in detail by Pompelli, et al. [52]. To evaluate if the fall in AN in S. rebaudiana is limited by stomatic barriers or not, we applied the concept of stomatal threshold calculated according to the following formula: L S = 1 C i C a [53]. The imaging chlorophyll fluorescence kinetics (Qubit Systems Inc., Kingston, ON, Canada) was used to image the blue, green, red and far-red fluorescence bands. The imaging procedure was similar to that described for Coleus × hybridus [54] with some modifications. The chlorophyll fluorescence was measured in detached leaves after a dark incubation period (30 min). After F0 was measured, 6000 μmol photons m−2 s−1 were applied for 1 s to reach maximum fluorescence Fm, and then an actinic PAR (1200 μmol photons m−2 s−1) was applied for 300 s. Subsequently, a saturating white light pulse (6000 μmol photons m−2 s−1) was applied to achieve the light-adapted maximum fluorescence (Fm′); finally, a far-red illumination was applied to measure the light-adapted initial fluorescence (F0′). With these measured parameters all others were calculated in accordance with Pompelli, et al. [55].

2.5. Biochemical Measurements

2.5.1. Photosynthetic Pigments and Xanthophyll Pools

Chlorophyll a+b and total carotenoids were measured in the leaf samples at the same time as the gas exchange measurements were performed. In addition, leaves were sampled at approximately 5 a.m. (in predawn) to measure xanthophyll pool pigments. Chlorophyll was extracted with 80% (v/v) aqueous acetone and quantified spectrophotometrically according to Pompelli, et al. [56]. For violaxanthin (V), antheraxanthin (A) and zeaxanthin (Z) only 90-day plants were tested due to the complexity of this analysis and its high cost per sample. Total leaf pigments were extracted with ice-cold 90% acetone, and the homogenate was collected in 2 mL microvials. All samples were then bubbled with gaseous nitrogen, after which they were kept in the darkness for 30 min at 4 °C. Subsequently, the homogenate was centrifuged at 15,000× g for 10 min at 4 °C, and the supernatant was filtered through a 0.45 μm filter before injection into the HPLC instrument (series 1050, Hewlett Packard, CA, USA). The pigments were separated on an end-capped, C18, Spherisorb ODS-2 reversed-phase column (particle size 5 μm, 250 mm × 4.6 mm). The elution of carotenoids was performed at 25 °C, over 24 min, with a 0.52 mL min−1 flow rate, using a non-linear gradient of 25–100% ethylacetate in acetonitrile/water (9:1 (v/v), containing 0.1% triethylamine). Detection was carried out at 440 nm using a UV/VIS detector. For the identification and quantification of peaks, pure commercial standards (VKI, Denmark) were used.

2.5.2. Calvin Cycle Enzyme Activity

To measure the Calvin cycle enzyme activity, only 90-day plants were assayed, as previously reported due to the cost of each sample analysis. Leaf fragments (~100 mg of FW) were extracted in 1 mL of extraction buffer as reported by Geigenberger and Stitt [57], with some modifications. The extraction buffer was composed of 50 mM Hepes (Sigma-Aldrich Chemical Co, Darmstadt, Germany, part number H4034), pH 7.4, 5 mM MgCl2, 1 mM EDTA, 1 mM EGTA, 0.1% bovine serum albumin (BSA; Sigma, part number A2153), 10% glycerol, 0.1% triton X-100 (Sigma, part number X100), 10 mM 2-mercaptoethanol (Sigma, part number M3148), 2 mM benzamidine (Sigma, part number 12072), 2 mM 6-aminocaproic acid (Sigma, part number A250) and 0.5 mM phenylmethanesulfonyl fluoride (PMSF, Sigma, part number PMSF-RO). A PD Minitrap G-10 column (Sigma, part number GE28-9180-10) filled with gel filtration medium (Sephadex—G-50, Sigma, part number S5897) was used to desalinate the leaf extract. Then, the G-10 column was equilibrated with 10 mL of Geigenberger and Stitt [57] buffer, and 500 μL of leaf extract was eluted in 1000 μL of Geigenberger and Stitt [57] buffer. The desalinate extract was collected in 1.5 mL cryogenic tubes (Sigma, part number BR114840) and stored at −80 °C after use, here referred to as enzymatic extract.
To measure the ribulose-bisphosphate carboxylase/oxygenase (rubisco, EC 4.1.1.39) activity, 300 μL of the enzymatic extract was transferred to 1.5 mL microtubes which, after being mixed (30 s), were centrifuged at 12,000× g for 5 min at 4 °C. All supernatants were transferred to new microtubes in an icebox, and the rubisco activity was measured directly in a 96-well microplate as described in detail by Sulpice, et al. [58].
To measure the glyceraldehyde-3-phosphate dehydrogenase (GAPDH, EC 1.2.1.12) activity, the protocol of Vescovi, et al. [59] was used with some modifications. First, 300 μL of the enzymatic extract was transferred to 1.5 mL microtubes which, after being mixed (30 s), were centrifuged at 12,000× g for 5 min at 4 °C. The GAPDH activity was monitored spectrophotometrically at 340 nm and 25 °C in a reaction mixture containing 50 mM Tris-HCl (pH 7.5; Sigma, part number T1503), 5 mM MgCl2, 3 mM 1,3-bisphosphoglycerate (Sigma, part number P8877), 1 mM EDTA, 5 units mL−1 of 3-phosphoglycerate kinase (from rabbit muscle; Sigma, part number P7634-2KU), 2 mM ATP (Sigma, part number A1852) and 0.2 mM NADPH (Sigma, part number 10107824001). The reaction was started with 30 μL of enzymatic extract and read spectrophotometrically at 340 nm. For calculations, an extinction coefficient of 340 nm for NADPH of 6.23 mM−1 was used.
3-Phosphoglycerate kinase (PGK, EC 2.7.2.3) activity was determined spectrophotometrically at 366 nm in a test system coupled with GAPDH as described by Kulbe and Bojanovski [60] in 100 mM triethanolamine (Sigma, part number 90279) buffer pH 7.5, 100 mM MgSO4, 34 mM EDTA, 0.35 mM 3-phospho-D-glycerate (Sigma, part number P8877), 55 μM ATP, 10 μM NADPH and 4 units mL−1 D-glyceraldehyde-3-phosphate dehydrogenase (Sigma, part number G2267-500UN). The reaction was started with 10 μL of enzymatic extract and read spectrophotometrically at 340 nm. One unit of enzyme activity was defined as the amount of the enzyme required for the formation of 1 μM D-glyceraldehyde 3-phosphate. For calculations, an extinction coefficient of 340 nm for NADPH of 6.23 mM−1 was used.

2.5.3. Glucose, Fructose and Sucrose Measurements

For the sugar measurements, a protocol described by DaMatta, et al. [61] was used with some modifications. Ninety-day S. rebaudiana leaf fragments (~50 mg of FW) were collected in microvials with 10% polyvinylpolypyrrolidone (Sigma, part number 77627) plus 700 μL of methanol (Sigma, part number 322415). After 30 s of mixing, the microvials were incubated in a thermoshaker (Multitherm, Benchmark Scientific, Sayreville NJ, USA) at 80 °C for 5 min at 500 rpm. After centrifugation (10 min, 4 °C, 13,000× g) the supernatant was transferred to a new microvial together with 350 μL of chloroform (Sigma, part number C2432) and 750 μL of H2O. The mixture was centrifuged (10 min, 4 °C, 13,000× g) to form 3 phases in the vials. The uppermost portion was collected in a new microvial and then stored at −80 °C until use. For sugar measurement, the reaction buffer was prepared (Mix 1); it contained 100 mM Hepes pH 7.0, 30 mM MgCl2, 1 mM ATP, 50 mM NAD+ (Sigma, part number N0632) and G6PDH 0.56 U (Sigma, part number G6378). The fructose was measured directly in a 96-well microplate previously mixed with reaction buffer containing 30 μL of 100 mM potassium phosphate buffer pH 7.0, 160 μL of Mix 1 and 20 μL of sample. The kinetics started with 1.5 U of hexokinase (Roche Part Number 11426362001) and finished when all fructose was consumed, as measured by NADH formation. After a plateau was generated, 2 U of phosphoglucose isomerase (Roche Part Number 10127396001) was added, starting a new reaction consuming all glucose, measured by NADH formation. Finally, after a new plateau was generated, 3 U of invertase (Sigma, part number I4504) was added, initiating a 3rd step by consuming all sucrose measured by NADH formation at 340 nm.

2.5.4. Stevioside and Rebaudioside-A Measurements

To measure steviosides and rebaudioside-A, a protocol described in detail by Rivera-Avilez [3] was used. For this analysis, only 90-day plants were analyzed due to the difficulty of collecting this material at predawn and the elevated cost per sample.

2.6. Biomass Quantification

In 90-day S. rebaudiana plants, root, stem and leaf biomass was weighed after 72 h in an oven at 75 °C when the mass remained stable after cooling. The LA was measured by the nondestructive method as previously reported [62].

2.7. Experimental Design and Statistical Analyses

The experiments were conducted in a completely randomized block design in a four-way ANOVA composed of 2 genotypes (G4 and G16), 3 concentrations of CO2 inside the chambers (400, 800, and 1200 μmol mol1), 2 times of enriched-CO2-atmosphere exposure (1 and 2 h) and 3 timelines (0-, 45- and 90-day plants). All treatments were composed of 5 repetitions. All data were analyzed by three-way ANOVA (comparing CO2 concentrations inside the chamber, time of exposure in enriched-CO2-atmosphere, and timeline). The t-test was used to compare all media between both genotypes. The three-way ANOVA was performed to compare medians using an SNK test (p < 0.05) in SigmaPlot for Windows v. 14.0 (Systat Software, Inc., San Jose, CA, USA), and R v. 2022.07.2 [63] was used to conduct the t-test.

3. Results

3.1. Previous Test

Prior to this study, other CO2 exposure times were tested on a time response curve. We tested 15, 30, 60, 90, 120, 180 and 210 min. As the exposure time was increased, the chamber temperature significantly increased, which caused a sudden drop in net photosynthesis, a fact that in some plants led to death due to overheating of the greenhouses. The Caribbean climate, with atmospheric temperatures that in the dry season exceed 50 °C (Figure 1C), was also taken into account, since the plants lost a large amount of water through evapotranspiration, which did not happen in plants left outside the chambers for simple observation. So, from these data, the study only advanced with the best treatments, which were 1 and 2 h of CO2 exposure.

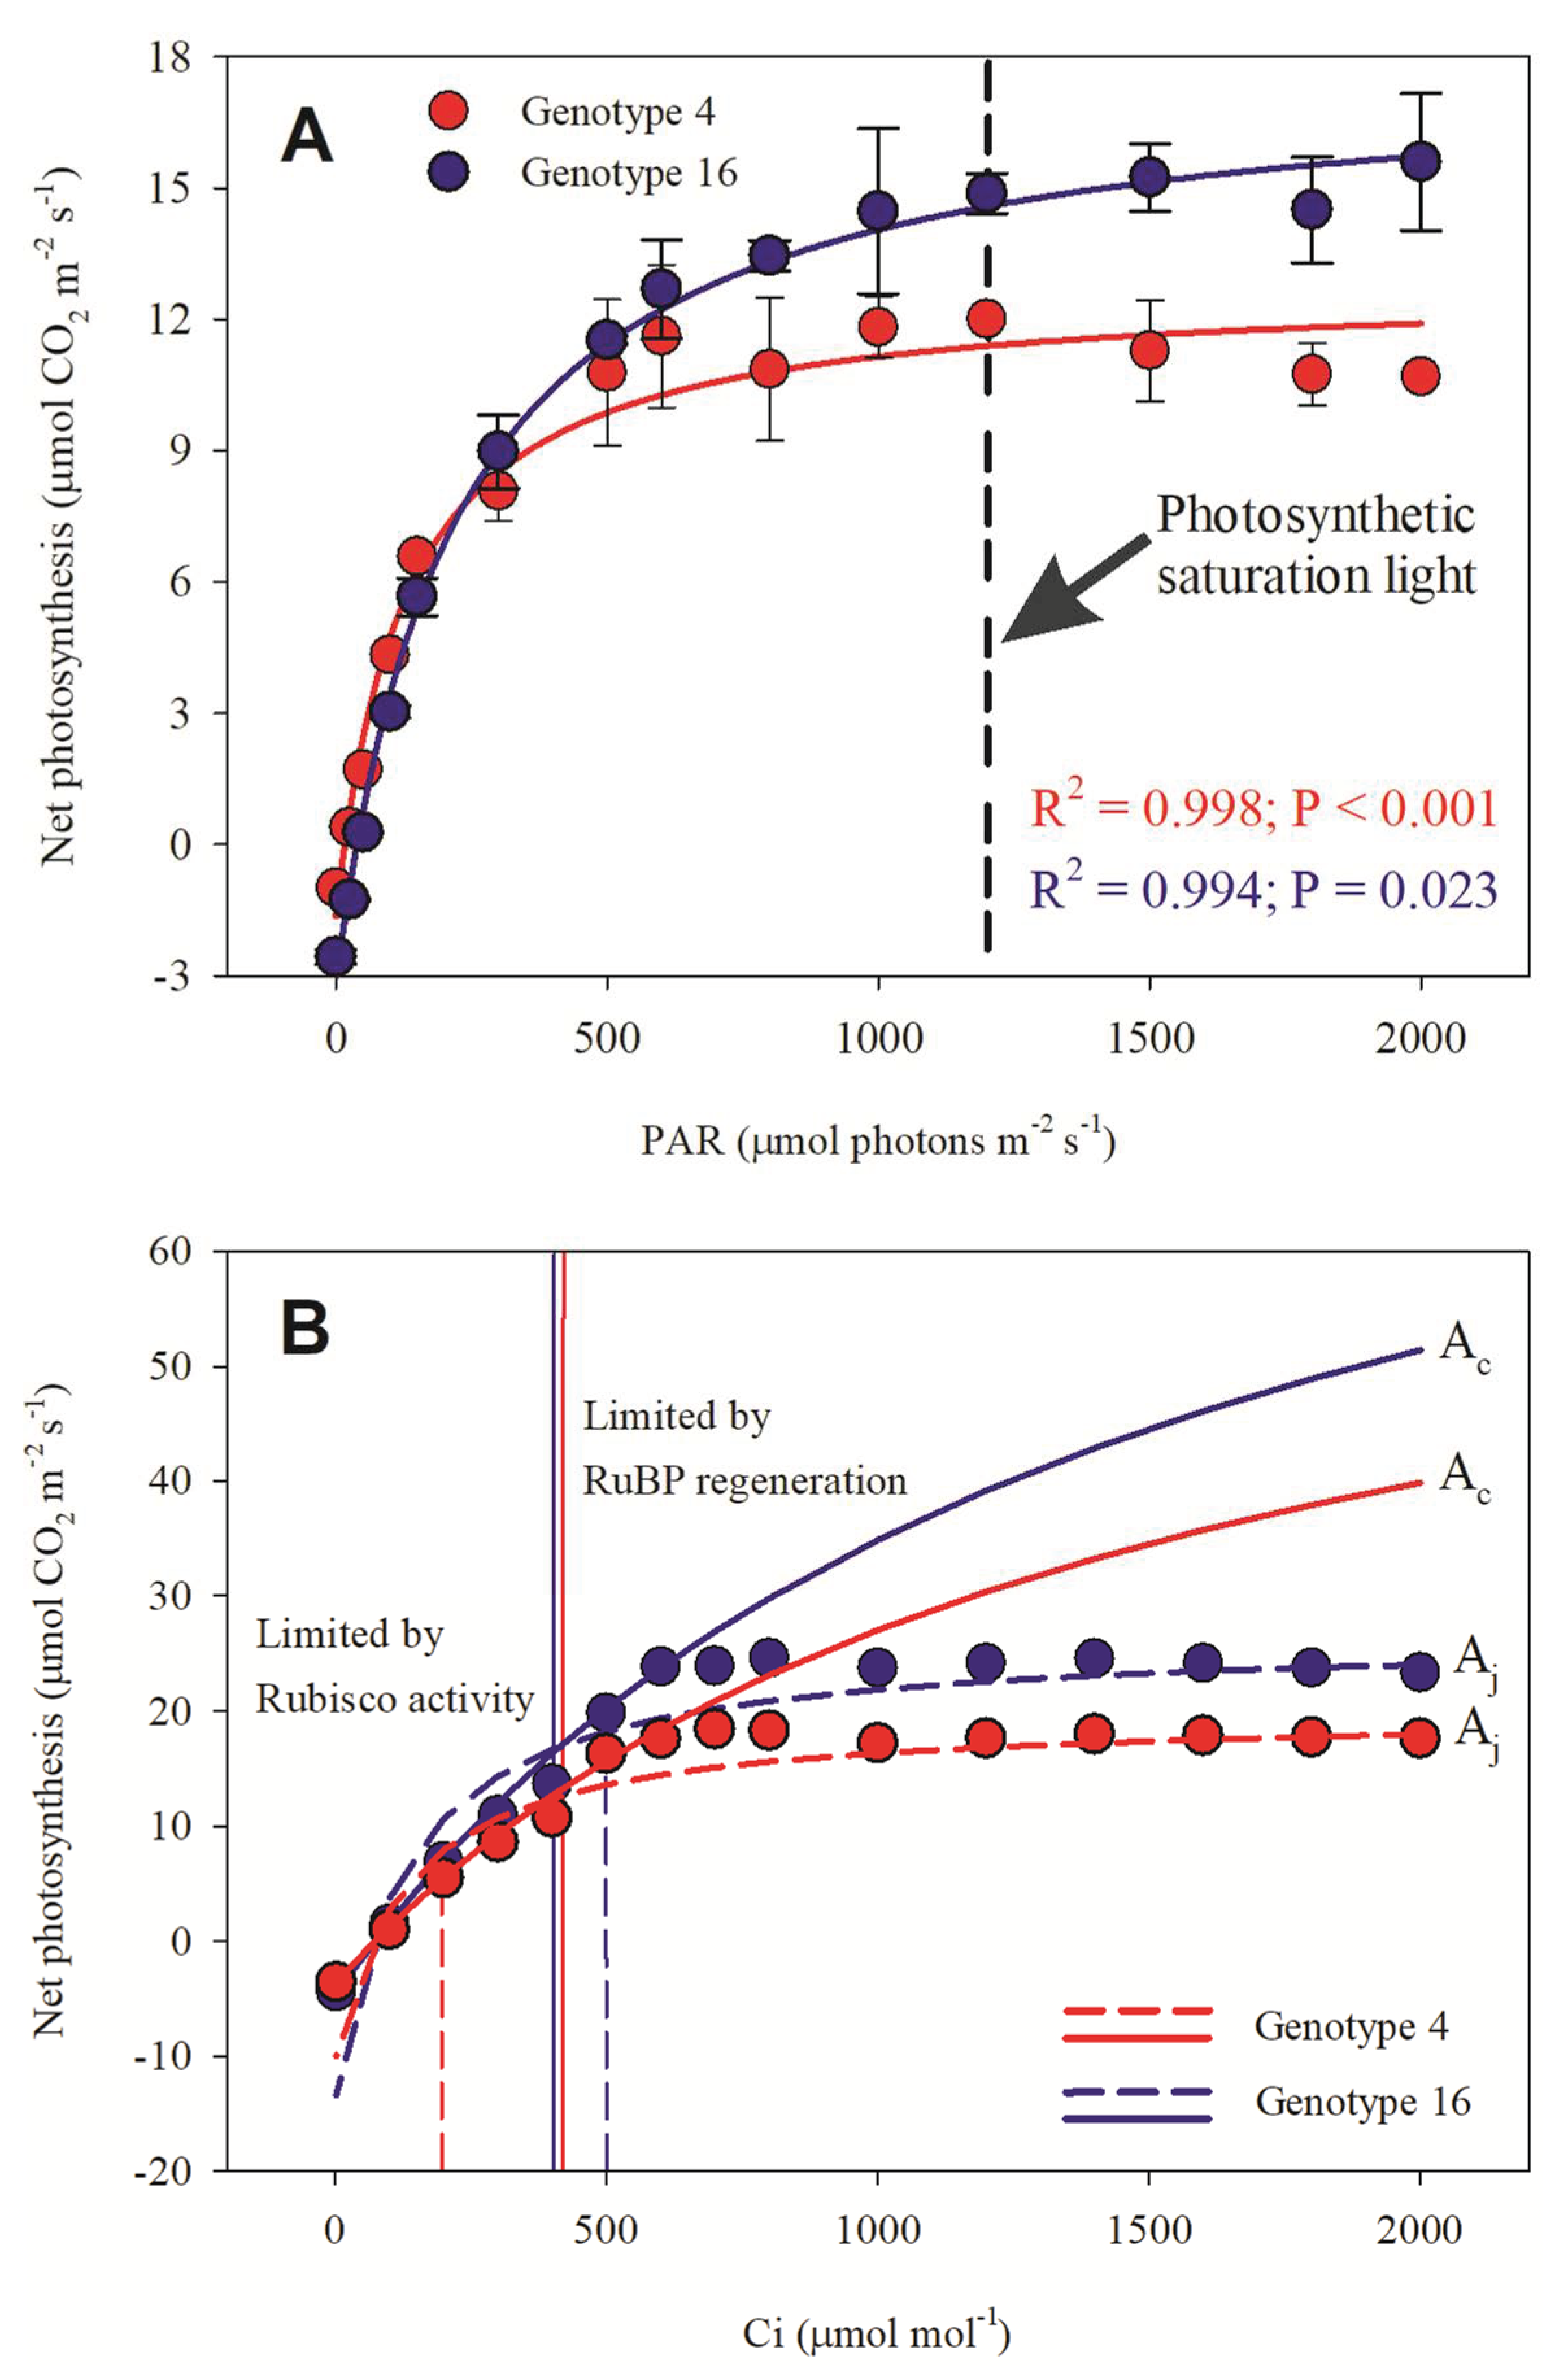
3.2. AN x PAR and AN x Ci Results

The increase in PAR caused an increase in AN in S. rebaudiana until a certain point where the increase in light was no longer reflected in a significant increase in AN. This point is called the inflection point of the curve and denotes AN saturation by light. Both genotypes showed AN saturated at 1200 μmol photons m2 s1 (Figure 2A), which was used in all gas exchange measurements. Additionally, the increase in Ci caused an increase in AN in S. rebaudiana to the point of limiting photosynthesis promoted by the electron transport rate (Aj). The intersection of the carboxylation rate (Ac) and electron transport rate (Aj) represents the equilibrium point at which photosynthesis is equally limited by both the carboxylation rate and electron transport. Thus, the Ci values of 403 μmol mol1 and 413 μmol mol1 correspond to G4 and G16, respectively; these values are indicated by the vertical lines (Figure 2), and both the rate of carboxylation and the rate of electron transport seem to be AN-limited. Figure 2B shows the exact point at which the observed values (spheres) coincide with the Ac, a point that indicates how much the genotype translates into rubisco protein. Thus, by extrapolating the data, it can be estimated that for G4, the intercept point was 498 μmol mol1, while for G16, this point was 198 μmol mol1, indicating that genotype 16 invests less in rubisco protein.
As expected, we demonstrated a strong linear relationship between VcMAX and JMAX (r = 0.767; p = 7.67 × 10⁸) as well as a moderate correlation between AN and VcMAX (r = −0.560; p = 6.43 × 10⁵) and between AN and JMAX (r = −0.366; p = 0.013) (Figure 3). However, this relationship was strongest when G4 and G16 were individually analyzed. For G4, the relationship between VcMAX and JMAX was 0.952 (p = 4.19 × 10⁹), while the correlations between AN and VcMAX and between AN and JMAX in this genotype were −0.908 (p = 4.87 × 10⁷) and −0.902 (p = 7.54 × 10⁷), respectively. These correlations were strongest in G16, where the correlation between VcMAX and JMAX was 0.929 (p = 1.02 × 10¹²) and the correlations between AN and VcMAX and between AN and JMAX were −0.949 (p = 1.55 × 10¹⁴) and −0.927 (p = 1.49 × 10¹²), respectively. The VcMAX and JMAX values correlated significantly (p < 0.001) with photosynthesis rates (Figure 3). The delta (Δ) between Ac and Aj was 28.0 μmol CO2 m2 s1 and 22.5 μmol CO2 m2 s1 in G16 and G4, respectively, indicating a greater efficiency of carboxylation in G16 in relation to G4. When we combined both genotypes, the correlation between Rd and Γ* was 0.678 (p = 1.11 × 10⁶); Rd and TPU, 0.887 (p = 1.13 × 10¹⁴); and Γ* and TPU, 0.613 (p = 2.08 × 10⁵).
In 0-day plants, the LCP was not significant in both genotypes (Table 1). However, for 45-day plants under a CO2-enriched atmosphere (Table 2), G4 presented a nonsignificant value (p = 0.685) of LCP; however, after 90 days of CO2-enriched atmosphere, the LCP was 50.1% of that registered in 0-day plants and 43.8% less than that registered in 45-day plants. At 45 and 90 days (Table 2), G16 showed an LCP that was 47.1% and 32.8% less than that registered in 0-day plants. In 0-day plants, G16 showed a theoretical LSP of 1977.05 ± 115.40, 53% higher than that in G4. However, in 45- and 90-day plants, this pattern was completely distinct from those registered in 0-day plants. In 45- and 90-day plants, G4 showed an increase in LSP of 24.2% and a decrease in LSP of 17.4% compared with values registered in 0-day plants. G16 showed a distinct profile, with decreases in LSP by 41.2% and 37.6% compared with 0-day plants.
Through PAR × AN curves, we estimated that ANpot was 14.41 ± 0.30, 21.77 ± 4.62 and 25.44 ± 2.33 μmol CO2 m−2 s−1 at 0, 45 and 90 days in a CO2-enriched atmosphere evaluated in genotype 4. For G16, the ANpot was 20.80 ± 0.90, 25.44 ± 0.88 and 15.35 ± 3.04 μmol CO2 m−2 s−1 at 0, 45 and 90 days in a CO2-enriched atmosphere (Table 1 and Table 2). Namely, in 0-day plants, ANpot of G16 was 44.3% higher than that of G4 (Table 1). However, this difference was similar at both 45 and 90 days (Table 2), indicating that CO2 enrichment promoted ANpot by 74.2% and 76.5% in G4 at 45 and 90 days, respectively (Table 2). In G16, CO2 enrichment promoted an increase of 22.3% in 45-day plants, but in 90-day plants, the increase in ANpot (17.7%) was not significant (p = 0.08). Thus, we can argue that CO2 enrichment promoted an increase in ANpot of G4, independent of timeline, but caused a decrease in ANpot in G16 after 90 days (Table 2).
At time zero, the saturation CO2 (Cisat) was 799.60 ± 9.38 μmol mol−1 and 701.51 ± 8.25 μmol mol−1, 14% higher in favor of G4 compared with G16. At 45 and 90 days, the Cisat of G4 was 1.22% (ns) and 38.2% higher than that of 0-day plants, while in G16, the Cisat of 45- and 90-day plants increased by 38% and 27.1%, respectively, compared with 0-day plants. The VcMAX of G4 was 27.6% higher than that registered in G16 in 0-day plants. In 45- and 90-day plants, the VcMAX of G4 was 34% and 1.2% less than that registered in 0-day plants, while in G16, the VcMAX of 45- and 90-day plants increased by 17.01% and 47.6%, respectively. This finding highlights that neither of these values (45- and 90-day plants) were significantly different from those registered in 0-day plants in both genotypes (Table 1 and Table 2). The electron transport rate (J; estimated from AN/Ci curves) showed that J was 33% higher in G4 than in G16 when both 0-day plants were compared. In 45- and 90-day plants, G4 showed J values that were 38% and 35% of the values recorded in 0-day plants, while in G16, 45- and 90-day plants exhibited J values that were 45.01% and 49.9% of those values registered in 0-day plants. Compared with the maximum rate of triose phosphate use (TPU) of G4 and G16 in 0-day plants, the TPU was 29.8% higher in G4 than in G16 (Table 1). Notwithstanding, in G4, the 45- and 90-day plants showed TPU values that were 57.3% and 62% of those in 0-day plants, respectively (Table 2). In G16, the 45- and 90-day plants exhibited 48.5% and 39.9% of the TPU found in 0-day plants. The rubisco CO2 compensation point (Γ*) of G4 was 10.5% higher (ns) than that in G16. In addition, G16 showed a decrease of 16% in Γ* compared with G4 in 45-day plants. However, in 90-day plants, G16 showed a decrease of 1.7% in Γ* compared with G4 in 90-day plants. Furthermore, neither difference was significant.

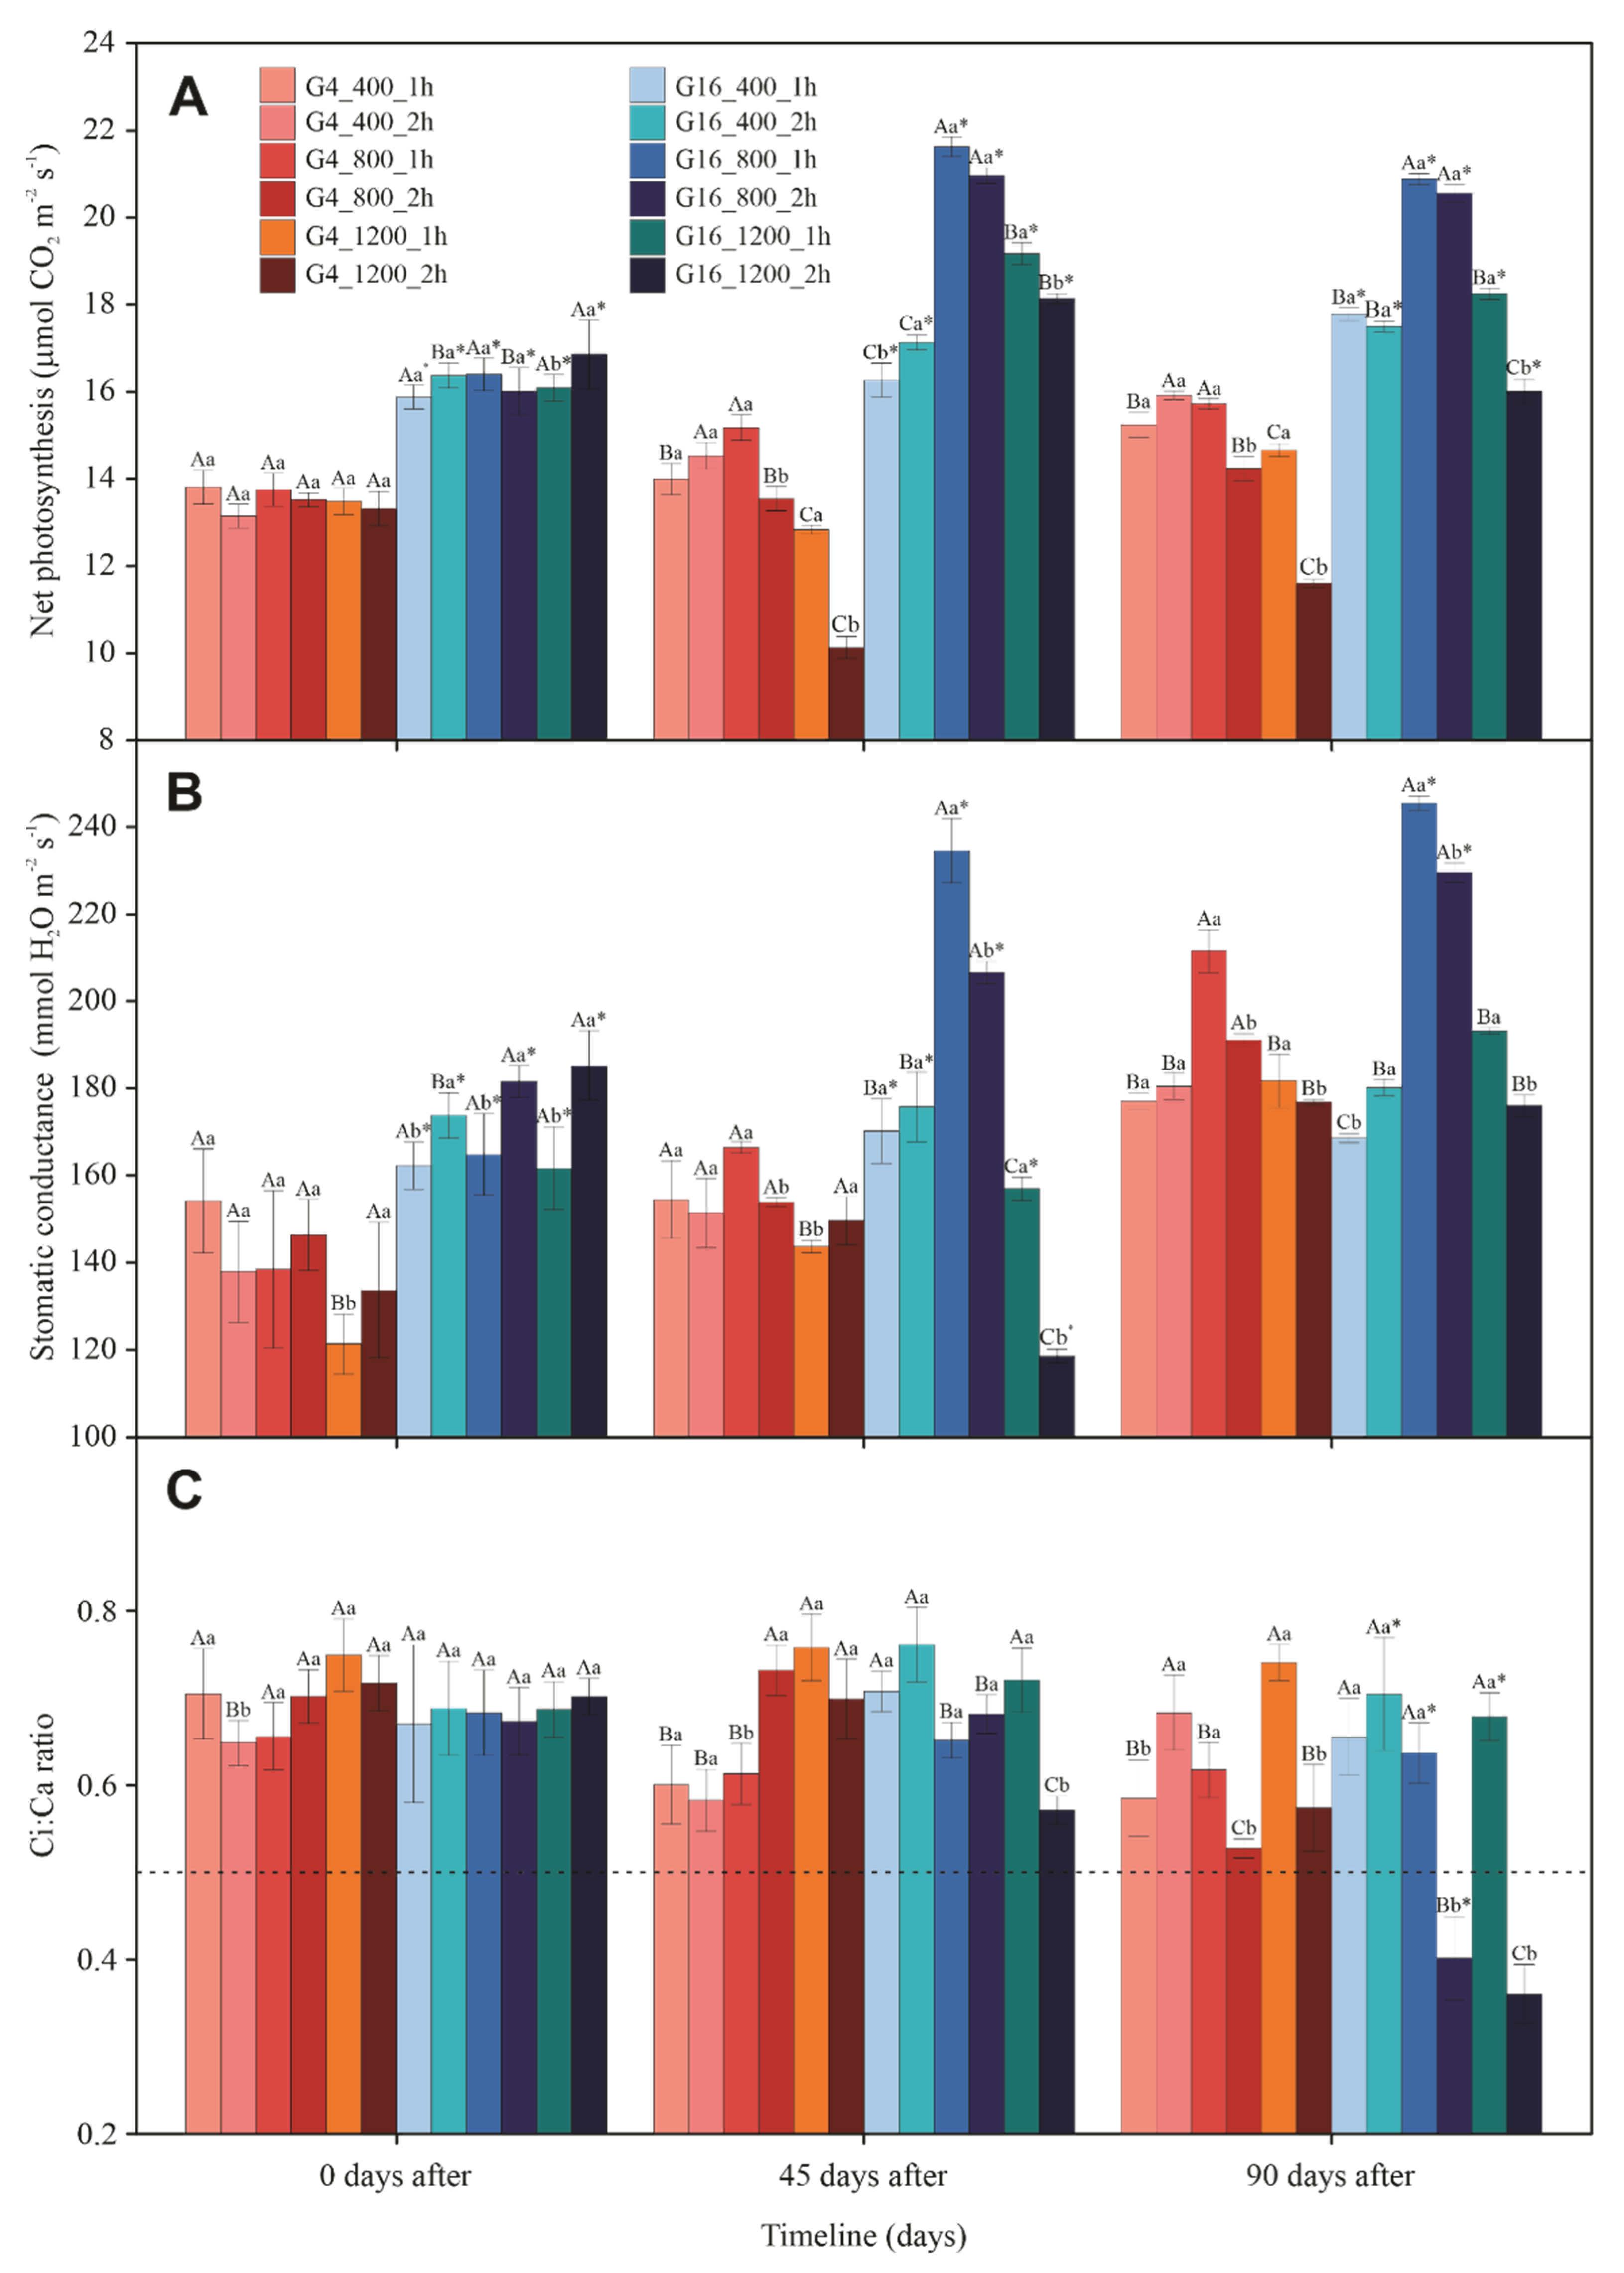
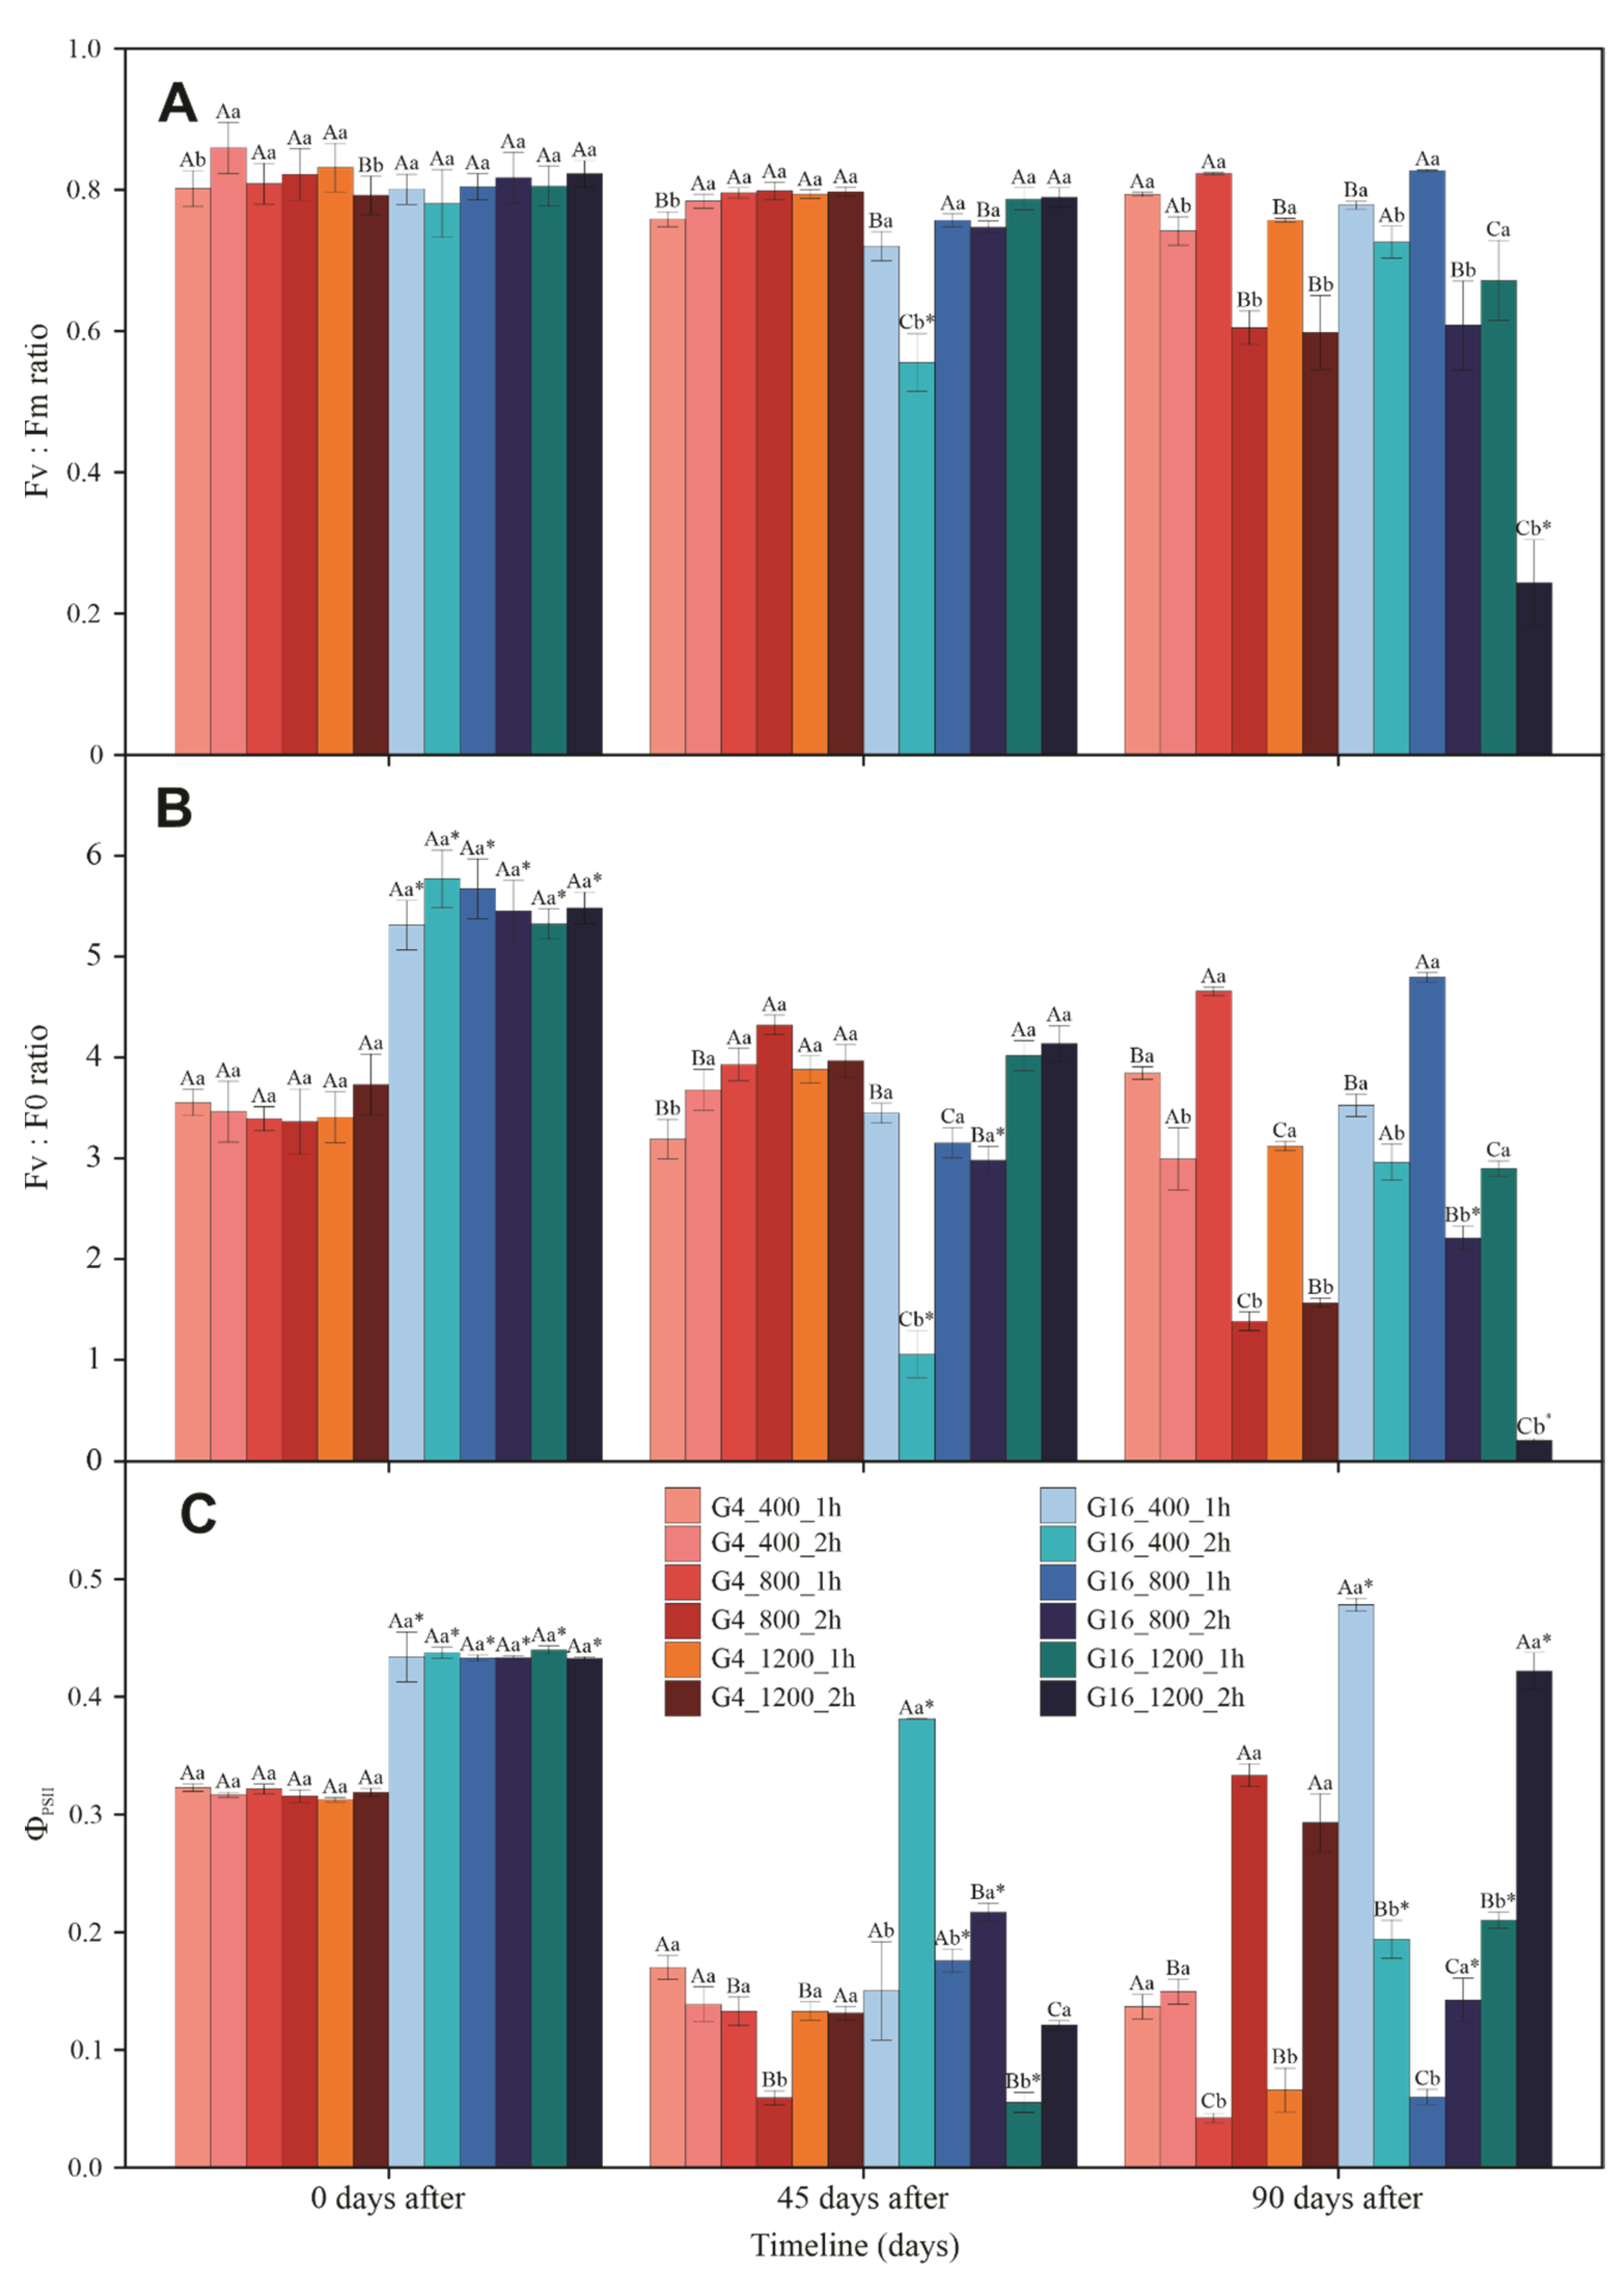
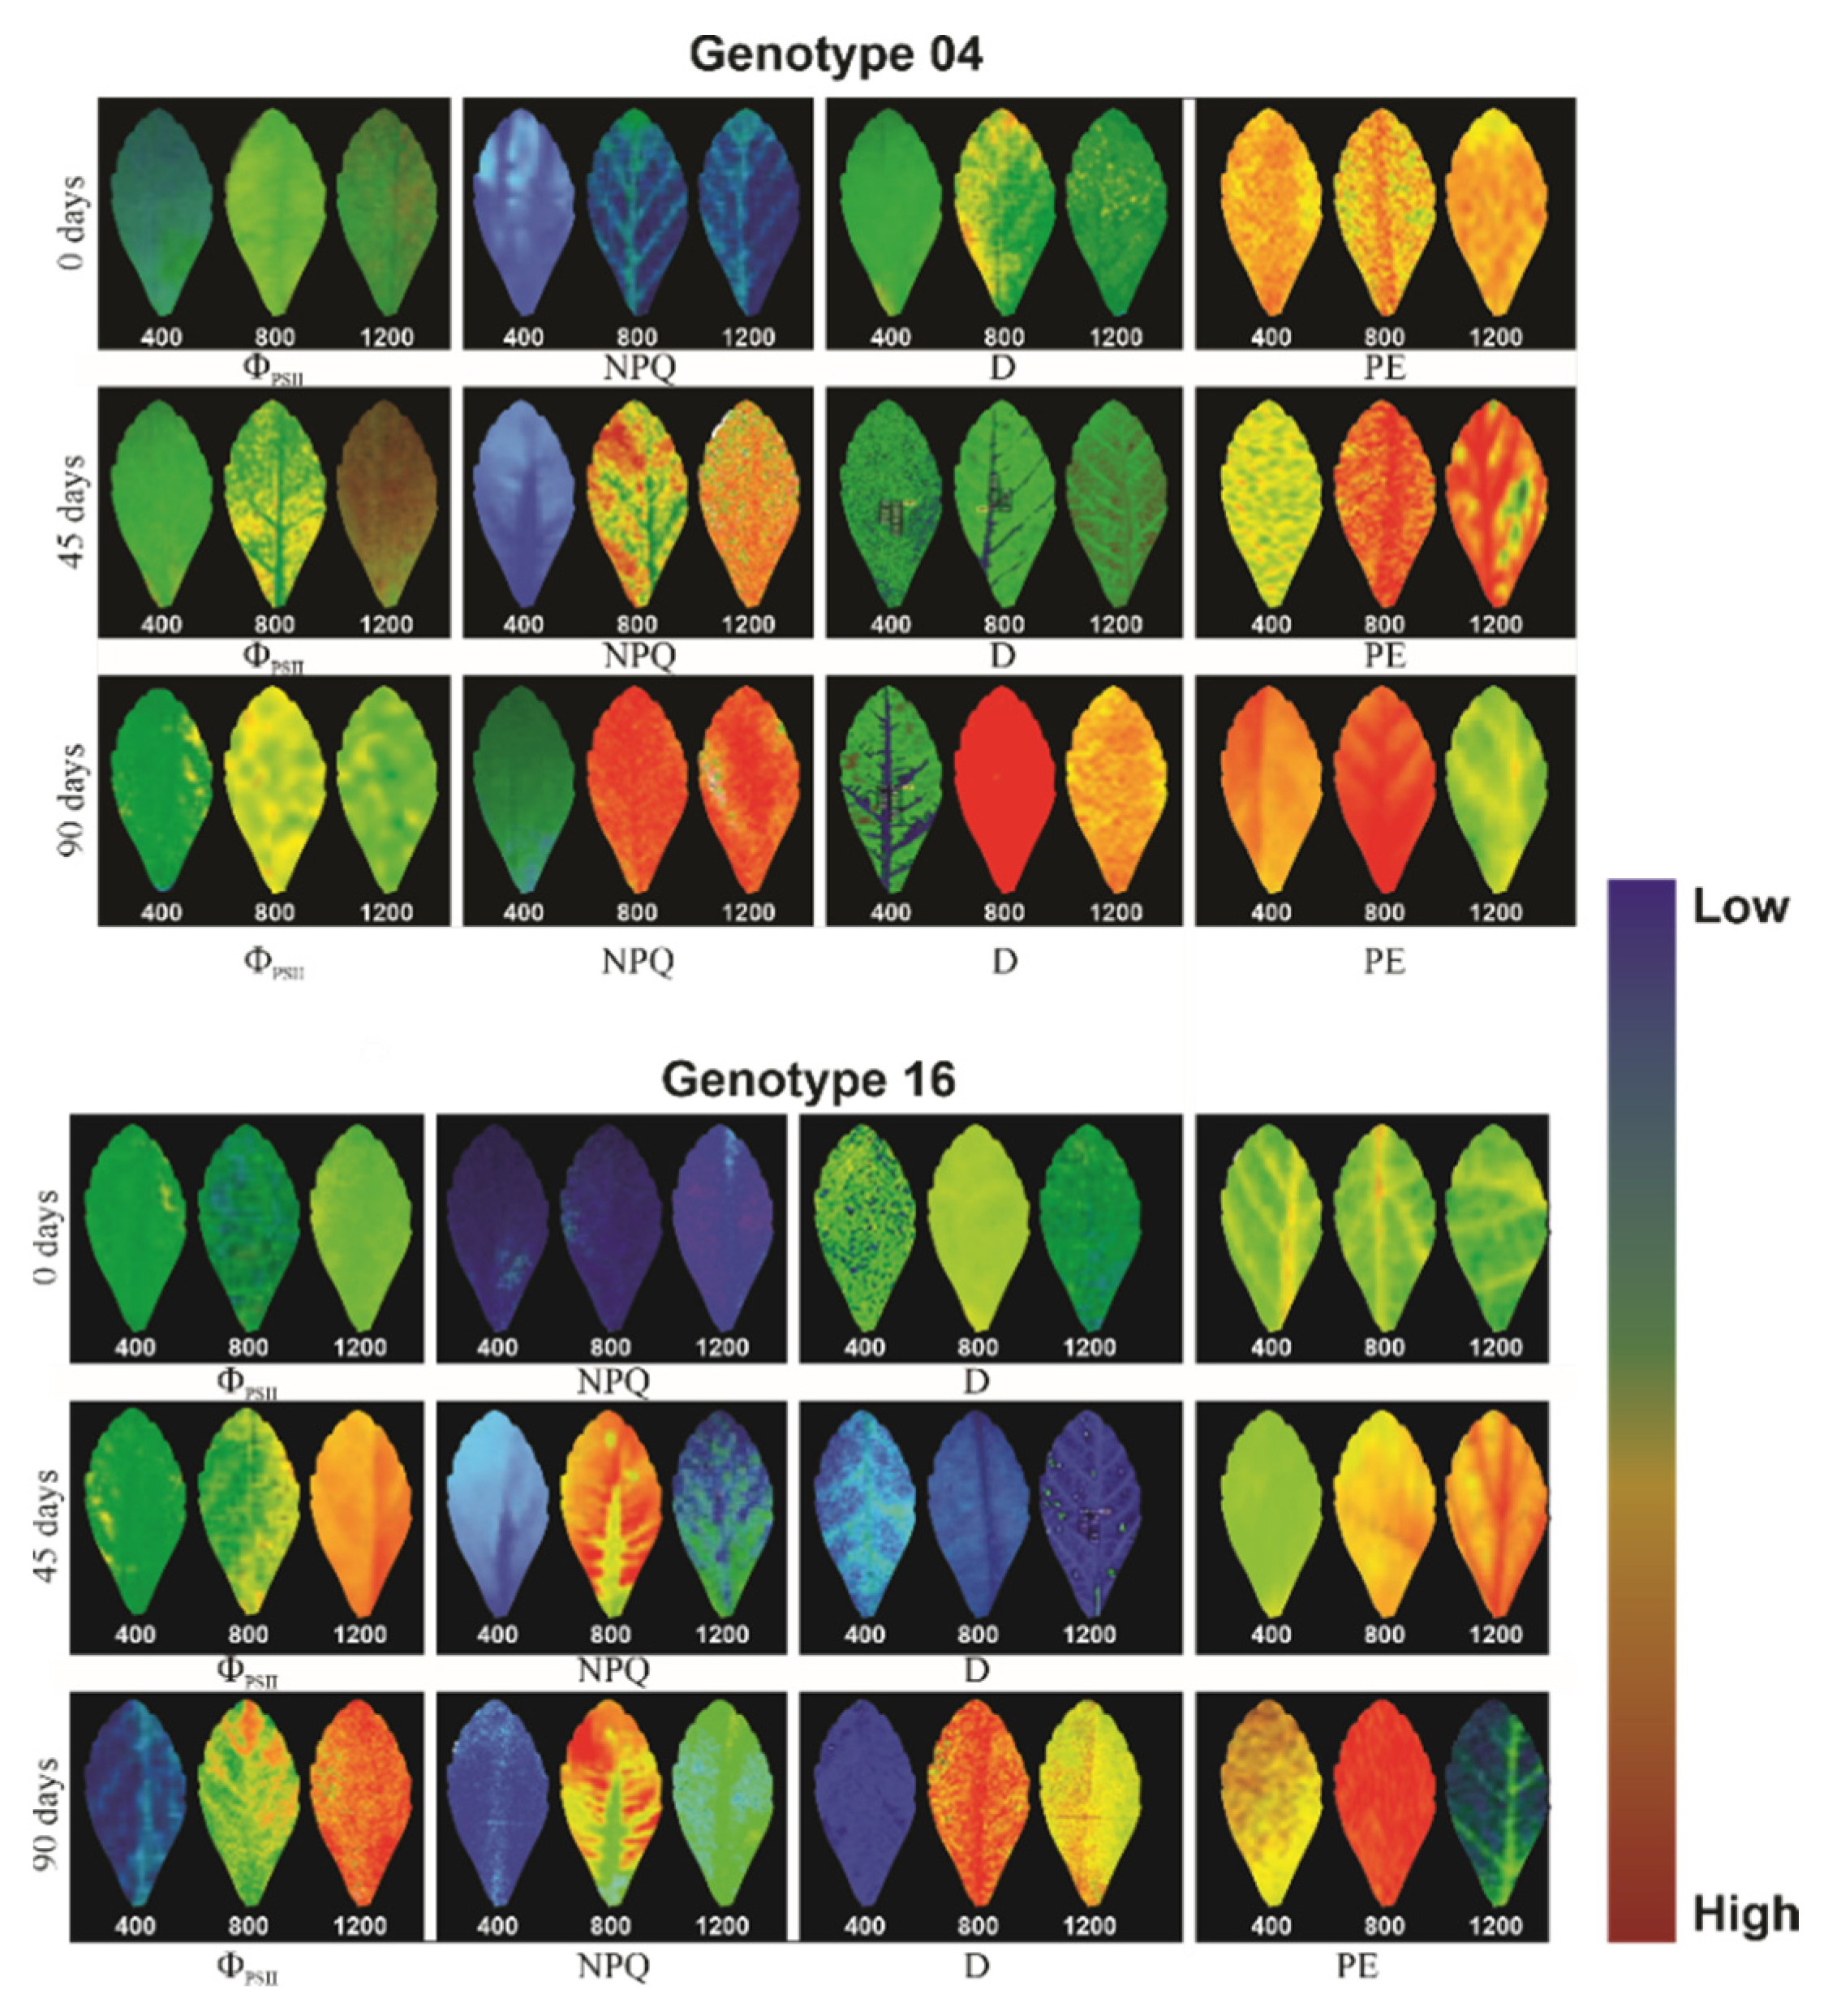
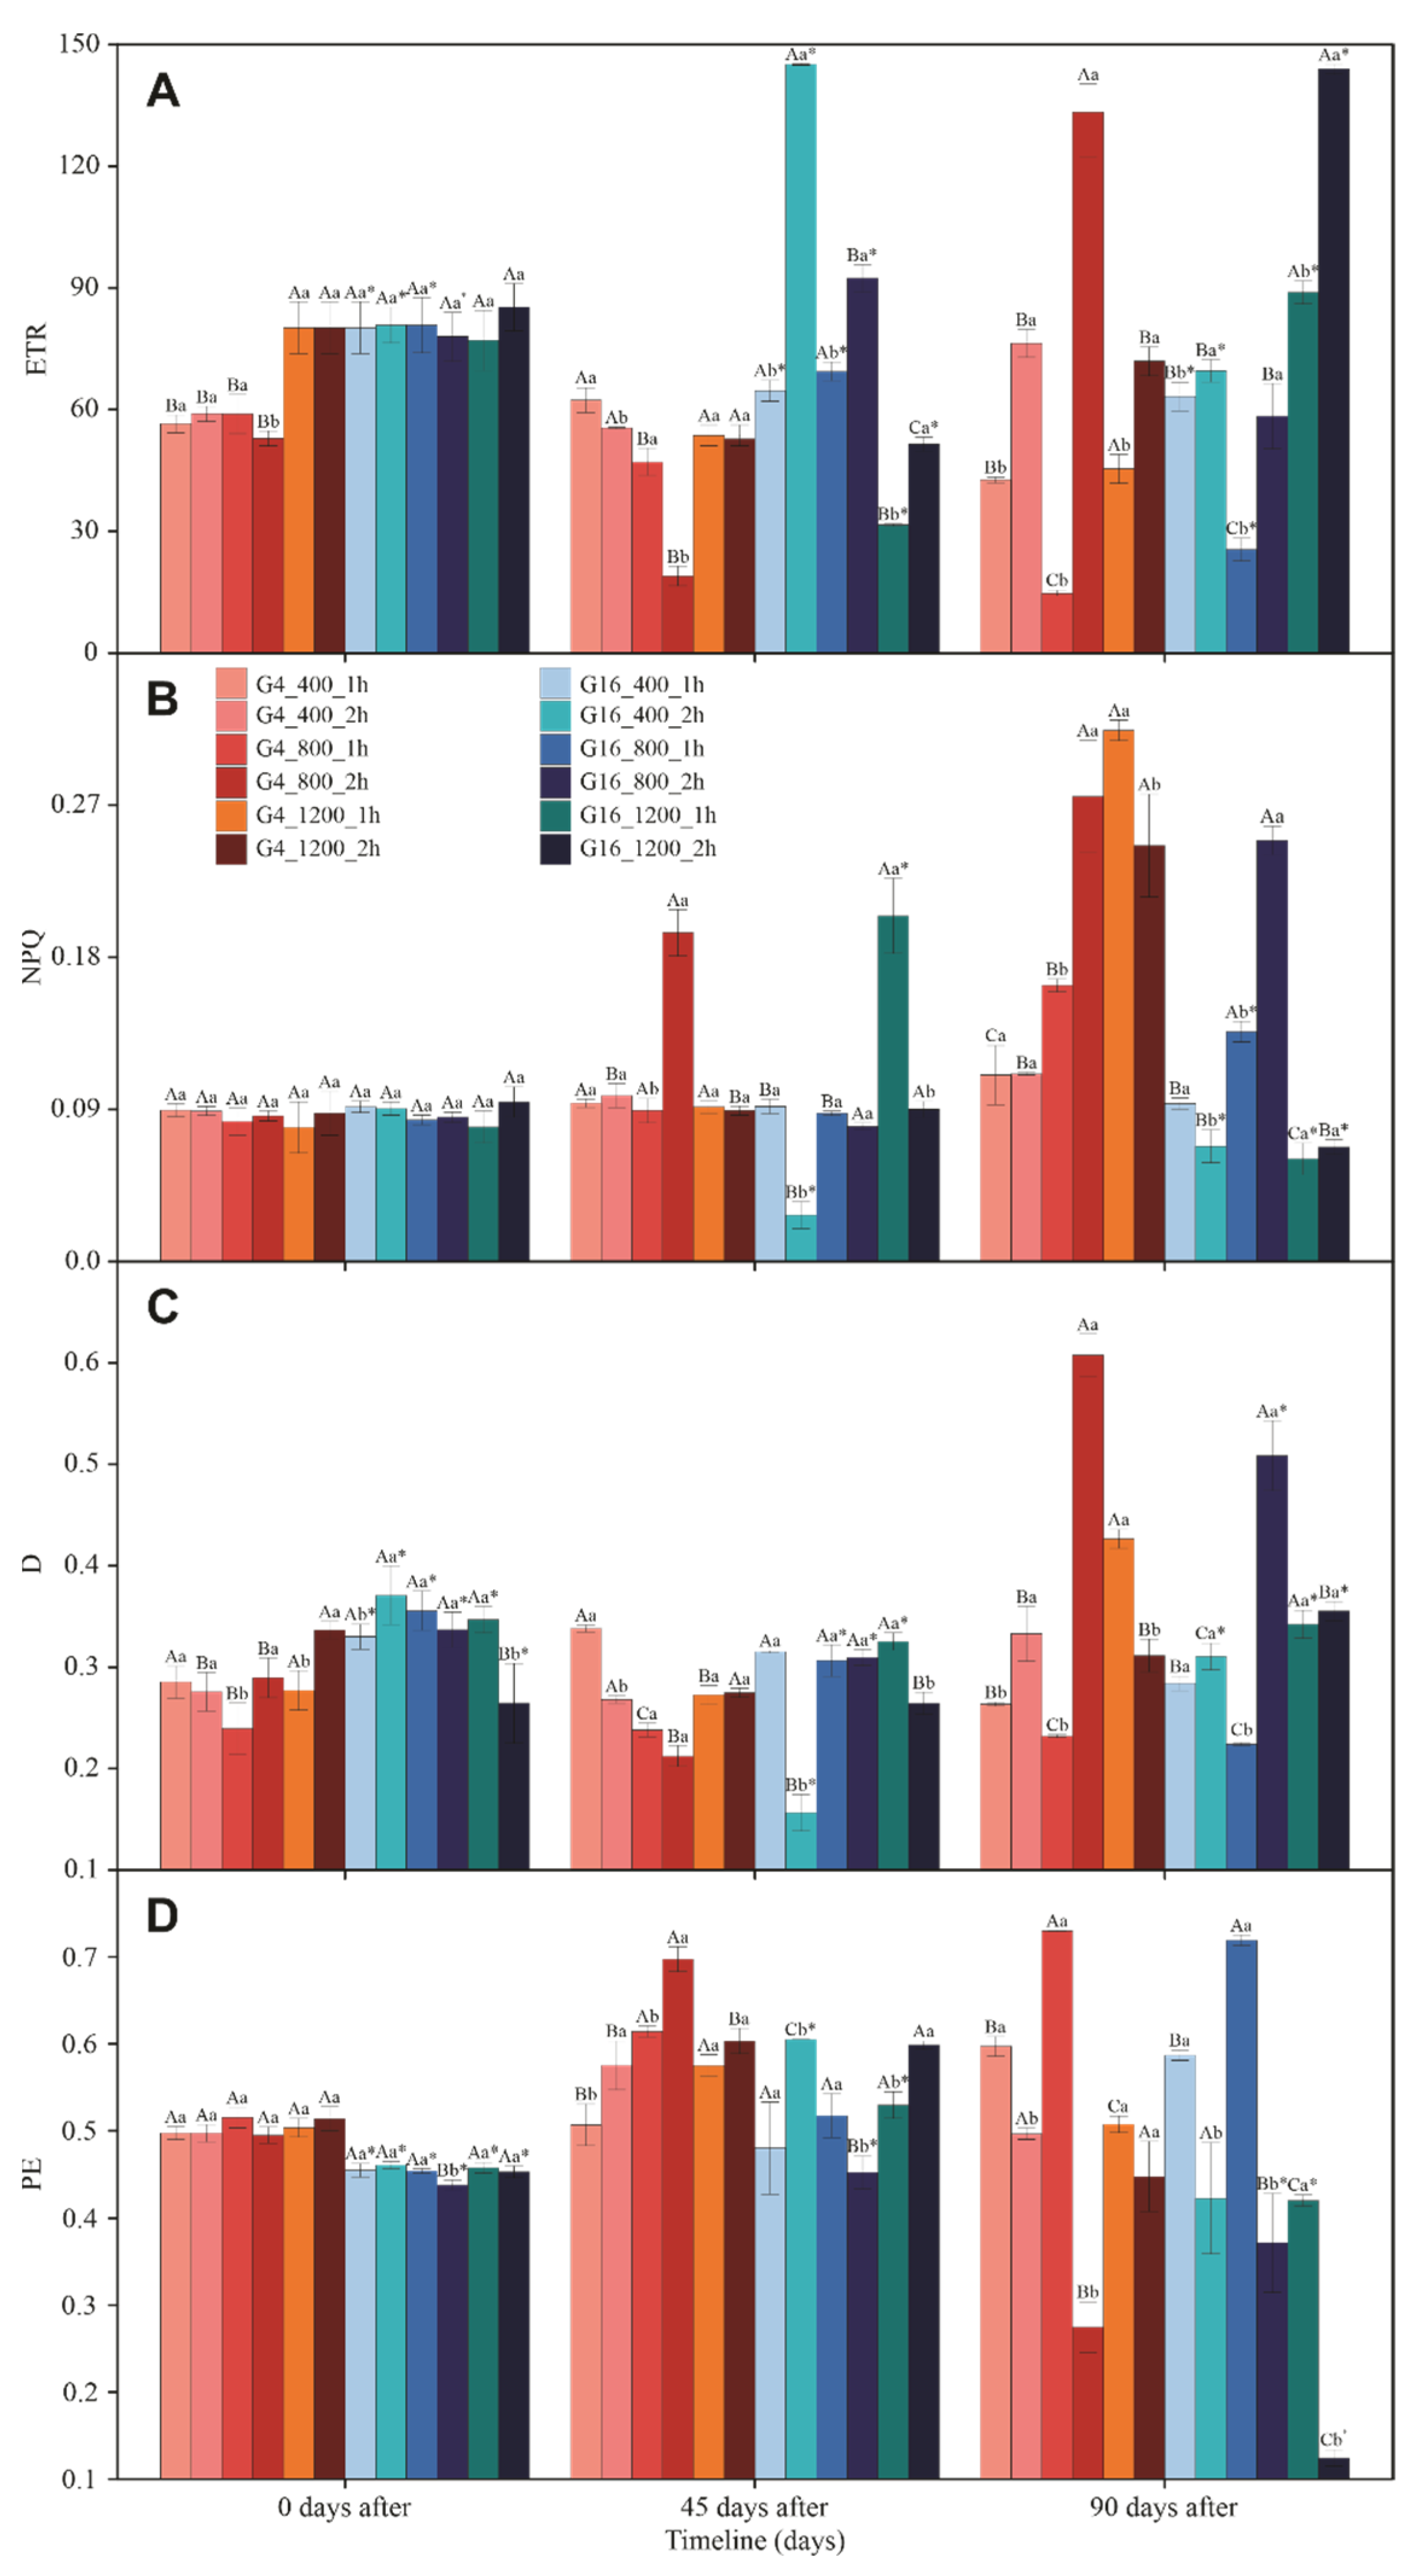
3.3. Gas Exchange and Chlorophyll a Fluorescence

AN was significantly increased in both genotypes of Stevia under 800 μmol CO2 mol−1, an increase that was not sustained at 1200 μmol CO2 mol−1 (Figure 4A). The CO2-enriched atmospheric environment did not distinctly affect gs in either genotype or [CO2] (Figure 4B). On average, gs measured at 400, 800 and 1200 μmol CO2 mol−1 was 178.71 ± 1.74, 201.33 ± 4.21 and 178.28 ± 3.01 for G4 and 174.36 ± 2.17, 237.50 ± 2.96 and 184.58 ± 3.12 for G16, respectively (Figure 4). Apart from 800 and 1200 μmol mol−1 under 2 h of exposure to a CO2-enriched atmosphere, all other treatments showed a Ci:Ca ratio greater than 0.5 (Figure 4C), demonstrating a good relationship between AN and gs (R = 0.763; p = 1.03 × 10⁻⁵) such that the incoming CO2 is quickly used in photosynthesis.
ETR:AN describes that the vast majority of plants under 800 and 1200 μmol CO2 mol−1 presented low or moderate ETR:AN, corresponding to high stomatal opening and demonstrating a strong relationship between both gs and AN and a high utilization of ETR to convert reducing power to achieve photosynthesis (Figure 5).
The Fv:Fm ratio does not seem to respond or responds very weakly to the imposed treatments, at least in 45-day plants (Figure 6A). However, in 90-day plants, a CO2-enriched atmosphere, under 1200 μmol CO2 mol−1, strongly decreased the Fv:Fm ratio. A good example is 800 and 1200 μmol CO2 mol−1, where G4 under 2 h of 800 and 1200 μmol CO2 mol−1 CO2-enriched atmospheres reduced its Fv:Fm ratio by 18.5% and 19.4%, respectively. Similar profiles were shown for G16 submitted to a CO2-enriched atmosphere for 2 h under 800 and 1200 μmol CO2 mol−1, reducing its Fv:Fm ratio by 16.2% and 66.5%, respectively (Figure 6A).
At first glance, G16 seems to have a higher Fv:F0 ratio, as recorded in 0-day plants, where this ratio was on average 57.8% higher in G16 than in G4 (Figure 6B). However, in 45-day plants, G4 showed an increase in its Fv:F0 ratio, in response to both an increase in [CO2] and an increase in the time of exposure to a CO2-enriched atmosphere. However, 45-day plants in G16 showed a strong decrease of 67.2% in their Fv:F0 in plants exposed to 2 h of 400 μmol CO2 mol1. However, G16 plants exposed to 1200 μmol CO2 mol1 exhibited a Fv:F0 ratio increased by 12.7% and 72.7% in plants exposed to a CO2-enriched atmosphere for 1 and 2 h, respectively. A very distinct profile was described in 90-day plants of both genotypes.
The quantum yield of photosystem II (ΦPSII) seems to be similar to the Fv:F0 ratio in 0-day plants. However, in 45-day G4 plants, ΦPSII was reduced in all treatments after 2 h of exposure. The reductions were 18.5%, 55.4% and 1.2% (ns) in plants under 400, 800 and 1200 μmol CO2 mol−1, respectively (Figure 6C). The opposite pattern was verified in 45-day G16 plants, where ΦPSII was increased by 71.8%, 19% and 54.2% in plants under 2 h of exposure at 400, 800 and 1200 μmol CO2 mol1. In 90-day plants, 2 h of exposure to 400, 800 and 1200 μmol CO2 mol1 increased ΦPSII by 8.6%, 87.3% and 77.5% and 28.7%, 57.8% and 74.4%, respectively, in G4 and G16 plants (Figure 6C).
In 0-day G4 plants, 1200 μmol CO2 mol1 promoted an increase of 27.5% in ETR compared with 400 μmol CO2 mol1. However, in G16, neither [CO2] nor exposure time changed the ETR (Figure 6A). At 45 days, G4 plants under 2 h of exposure exhibited a decreased ETR by 7.6%, 58% and 1.2% (ns) at 400, 800 and 1200 μmol CO2 mol1, respectively. In contrast, the 45-day G16 plants under 2 h of exposure exhibited an increased ETR by 55.8%, 24.9% and 38.6% compared with that of plants under 1 h of CO2 enrichment. In 90-day plants, all plants subjected to 2 h of exposure exhibited an increased ETR by 39.6%, 88.4% and 34.3% for G4 and by 9.1%, 56.3% and 39.9% for G16 under 400, 800 and 1200 μmol CO2 mol1 (Figure 7A).
Non-photochemical quenching (NPQ) measured in 0-day and 45-day plants did not show significant changes, with the exception of G4, under 2 h of exposure to 800 μmol CO2 mol−1, which showed an increase of 52.5% (Figure 7B). However, in 45-day G16 plants under 400, 800, and 1200 μmol CO2 mol−1 for 2 h, NPQ increased by 10.3%, 8.9% and 56%, respectively (Figure 7B). At 90 days, G4 plants under 2 h of exposure to 400 and 800 μmol CO2 mol−1, showed NPQ increases of 0.7% (ns) and 40.6%, respectively, while plants under 1200 μmol CO2 mol−1 showed an NPQ decrease of 21.7%. A distinct pattern was verified in 90-day G16 plants, where 2 h of CO2 enrichment led to a sharp decrease in NPQ of 27.1% and a nonsignificant increase in NPQ of 10.3% at 400 and 1200 μmol CO2 mol−1, respectively. The plants under 2 h of exposure to 800 μmol CO2 mol−1 showed a strong increase of 45.4% in NPQ (Figure 7B).
The fractions of absorbed PAR dissipated as heat (D) ranged from 0.24 to 0.46 in 0- and 45-day plants, independent of treatment (Figure 7C). In addition, the 90-day G4 plants showed increases of 20.8% and 61.8% at 400 and 800 μmol CO2 mol−1, respectively, compared with plants subjected to 2 h and 1 h of CO2 enrichment. In addition, all G16 plants exposed to 2 h of CO2 enrichment showed increases of 8.6% (ns), 54.5% and 21% (ns) in D compared with that resulting from plants subjected to 1 h of exposure.
The fraction neither used in photochemistry nor dissipated thermally (PE) estimated in 0-day G16 plants was on average 10% less than the values registered in G4 (Figure 7D). In 45-day G4 plants, exposure to 2 h of CO2 enrichment yielded increases of 13.5%, 13.6% and 4.9% (ns) compared with those at 1 h of exposure to 400, 800, and 1200 μmol CO2 mol−1, respectively. A similar pattern was found in 45-day G16 plants, demonstrating an increase of 27.7% and 13% in plants subjected to 2 h of exposure compared with 1 h of exposure at 400 and 1200 μmol CO2 mol−1. In 800 μmol CO2 mol−1 plants, exposure to 2 h of CO2 enrichment led to a decrease in PE of 14.3% (Figure 7D).
Chlorophyll a fluorescence images (Figure 8) revealed that the variation of all parameters described above under a CO2-enriched atmosphere was evident, and by comparison, lightness significantly increased under a relatively significant CO2 enrichment atmosphere, demonstrating that a CO2 enrichment atmosphere exerted a putative stress in plants showing higher values of NPQ and PE; however, an increase in this latter variable should not be considered to indicate stress (more details are provided in the discussion).

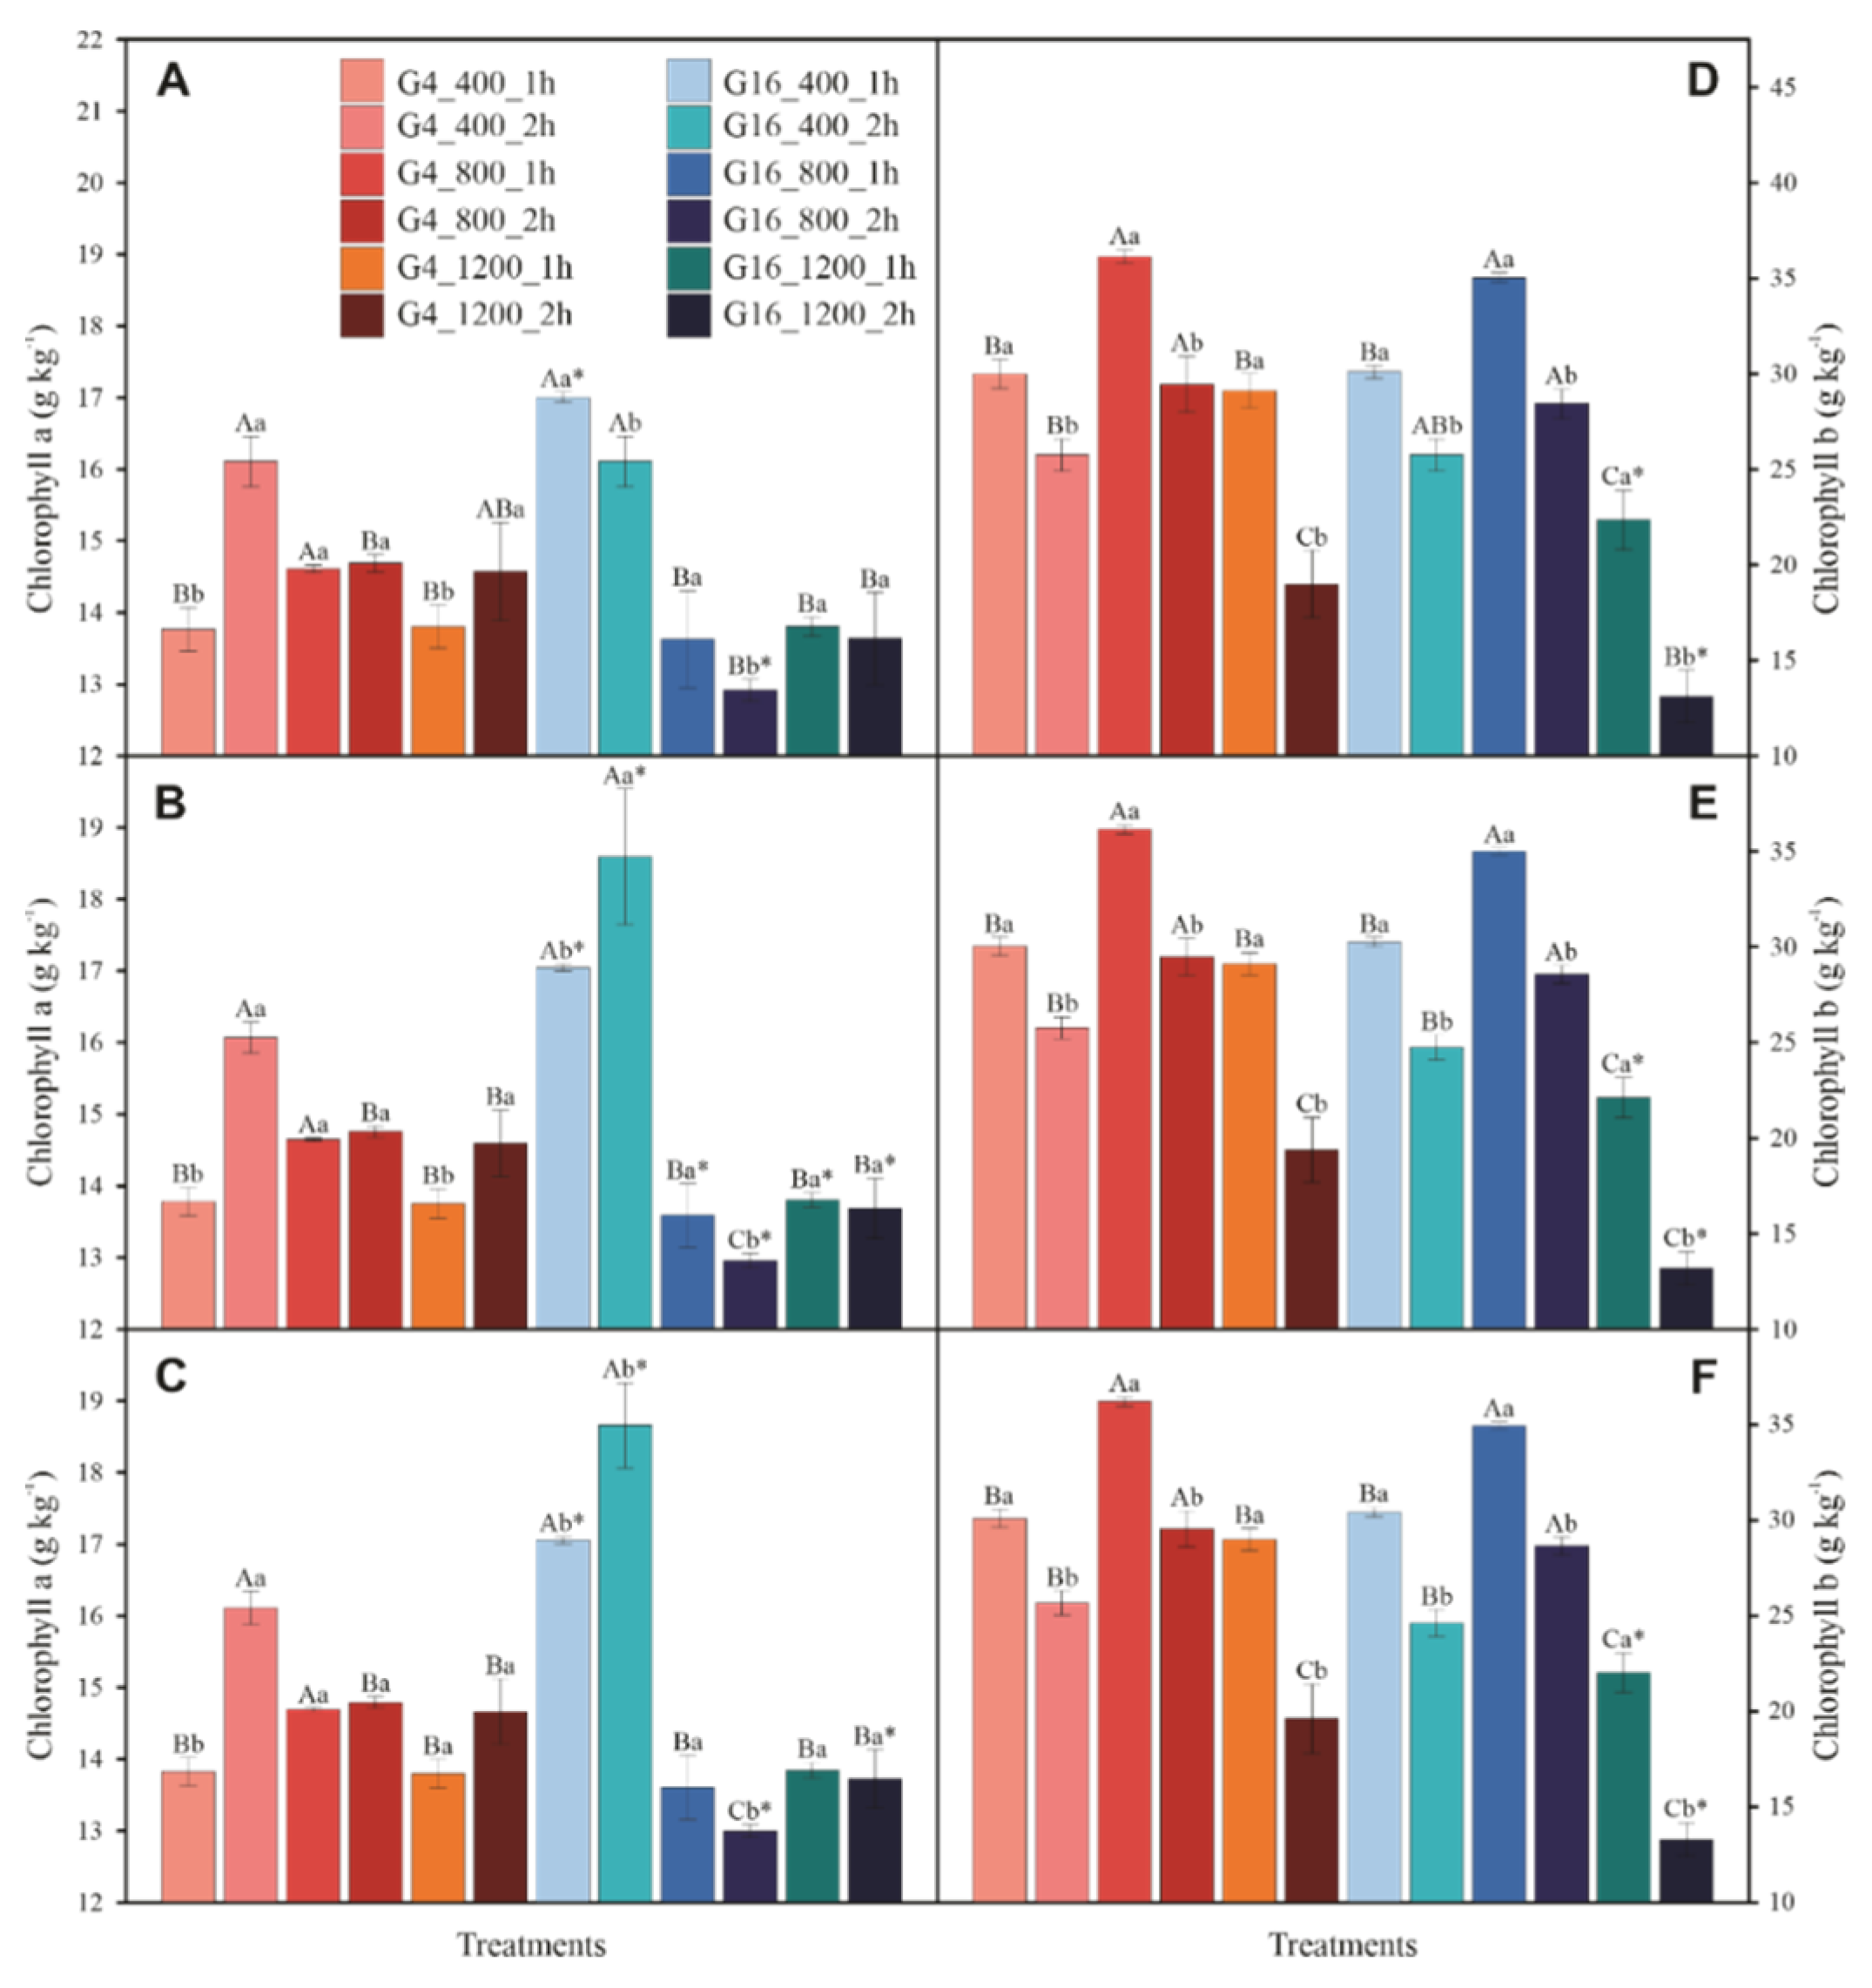
3.4. Photosynthetic Pigments and Violaxanthin Pool Cycle

In both genotype, regardless of timeline, the chlorophyll a and chlorophyll b tended to fall as increase the CO2-enriched atmosphere (Figure 9). This statement is very common in energy-saturated-ETR where plants experience a chlorophyll photobleaching to lower the energy input, which can saturated to photosystems leading ROS production in energy-saturated-ETR.
The violaxanthin–zeaxanthin cycle is very important in the protection of plants from an excess of captured photons, preventing excess energy from negatively affecting the photosystems, mainly protein D1 in PSII. Table 3 summarizes all the results. All pigments and the ratios between them were significantly increased with the increase in the [CO2]-enriched environment, as G16 always presents the highest averages in relation to G4. To simplify the large amount of data presented in Table 3, only the comparisons between 400 and 1200 μmol CO2 mol1 will be presented here.
Table 3 shows that V increased by 68% and 93.7% under 1200 μmol CO2 mol1, compared with 400 μmol CO2 mol1, after 1 h and 2 h, respectively. G16 showed a moderate increase (40.7%) when CO2 was applied for 1 h but strongly increased in plants under 2 h of CO2 (108.9%). With respect to A, G4 showed increases of 71.6% (1 h) and 56.3% (2 h) in plants that received 1200 compared with 400 μmol CO2 mol1. G16 plants behaved quite differently, with increases of 0.3% (ns) and 208.1% for plants subjected to 1 h and 2 h of CO2, respectively. Zeaxanthin accumulates as more photons are absorbed and not utilized in AN, decreasing at night.
Thus, dawn zeaxanthin levels were 54.5% and 37.4% in G4 plants under 1200 μmol CO2 mol−1 compared with 400 μmol CO2 mol−1. In G16 plants, 85.3% and 116.3% increases were found in plants subjected to 1200 μmol CO2 mol−1 when compared to 400 μmol CO2 mol−1. The A + Z pools translate the relative increase in these two pigments such that G4 plants under 1200 μmol CO2 mol−1 showed on average 59.4% more A + Z than plants under 400 μmol CO2 mol−1. Similar to the other xanthines presented, G16 showed increases of 63.9%. and 113.3% in plants at 1200 compared with 400 μmol CO2 mol1. The de-epoxidation state of the xanthophyll cycle (DEPS) did not vary significantly with increasing [CO2] in both genotypes, but G16 was shown to have a DEPS 32% and 65.4% higher than that of G4 plants under 1 h and 2 h of CO2 application, respectively. When comparing the pool of xanthines at the same molar ratio as the chlorophylls, it was verified that the plants that received 1 h of exposure to a CO2-enriched atmosphere showed an increase of 70.8%, regardless of the evaluated genotype, while plants under 2 h of 1200 μmol CO2 mol1 CO2-enriched atmosphere showed an increase of 100.5% and 320.4% compared with that at 2 h under 400 and 1200 μmol CO2 mol1, respectively, in G4 and G16 plants. VAZ, when correlated with chlorophyll a fluorescence variables, showed strong negative correlations with Fv:Fm, Fv:F0 and PE and positive correlations with FPSII (Figure 10).

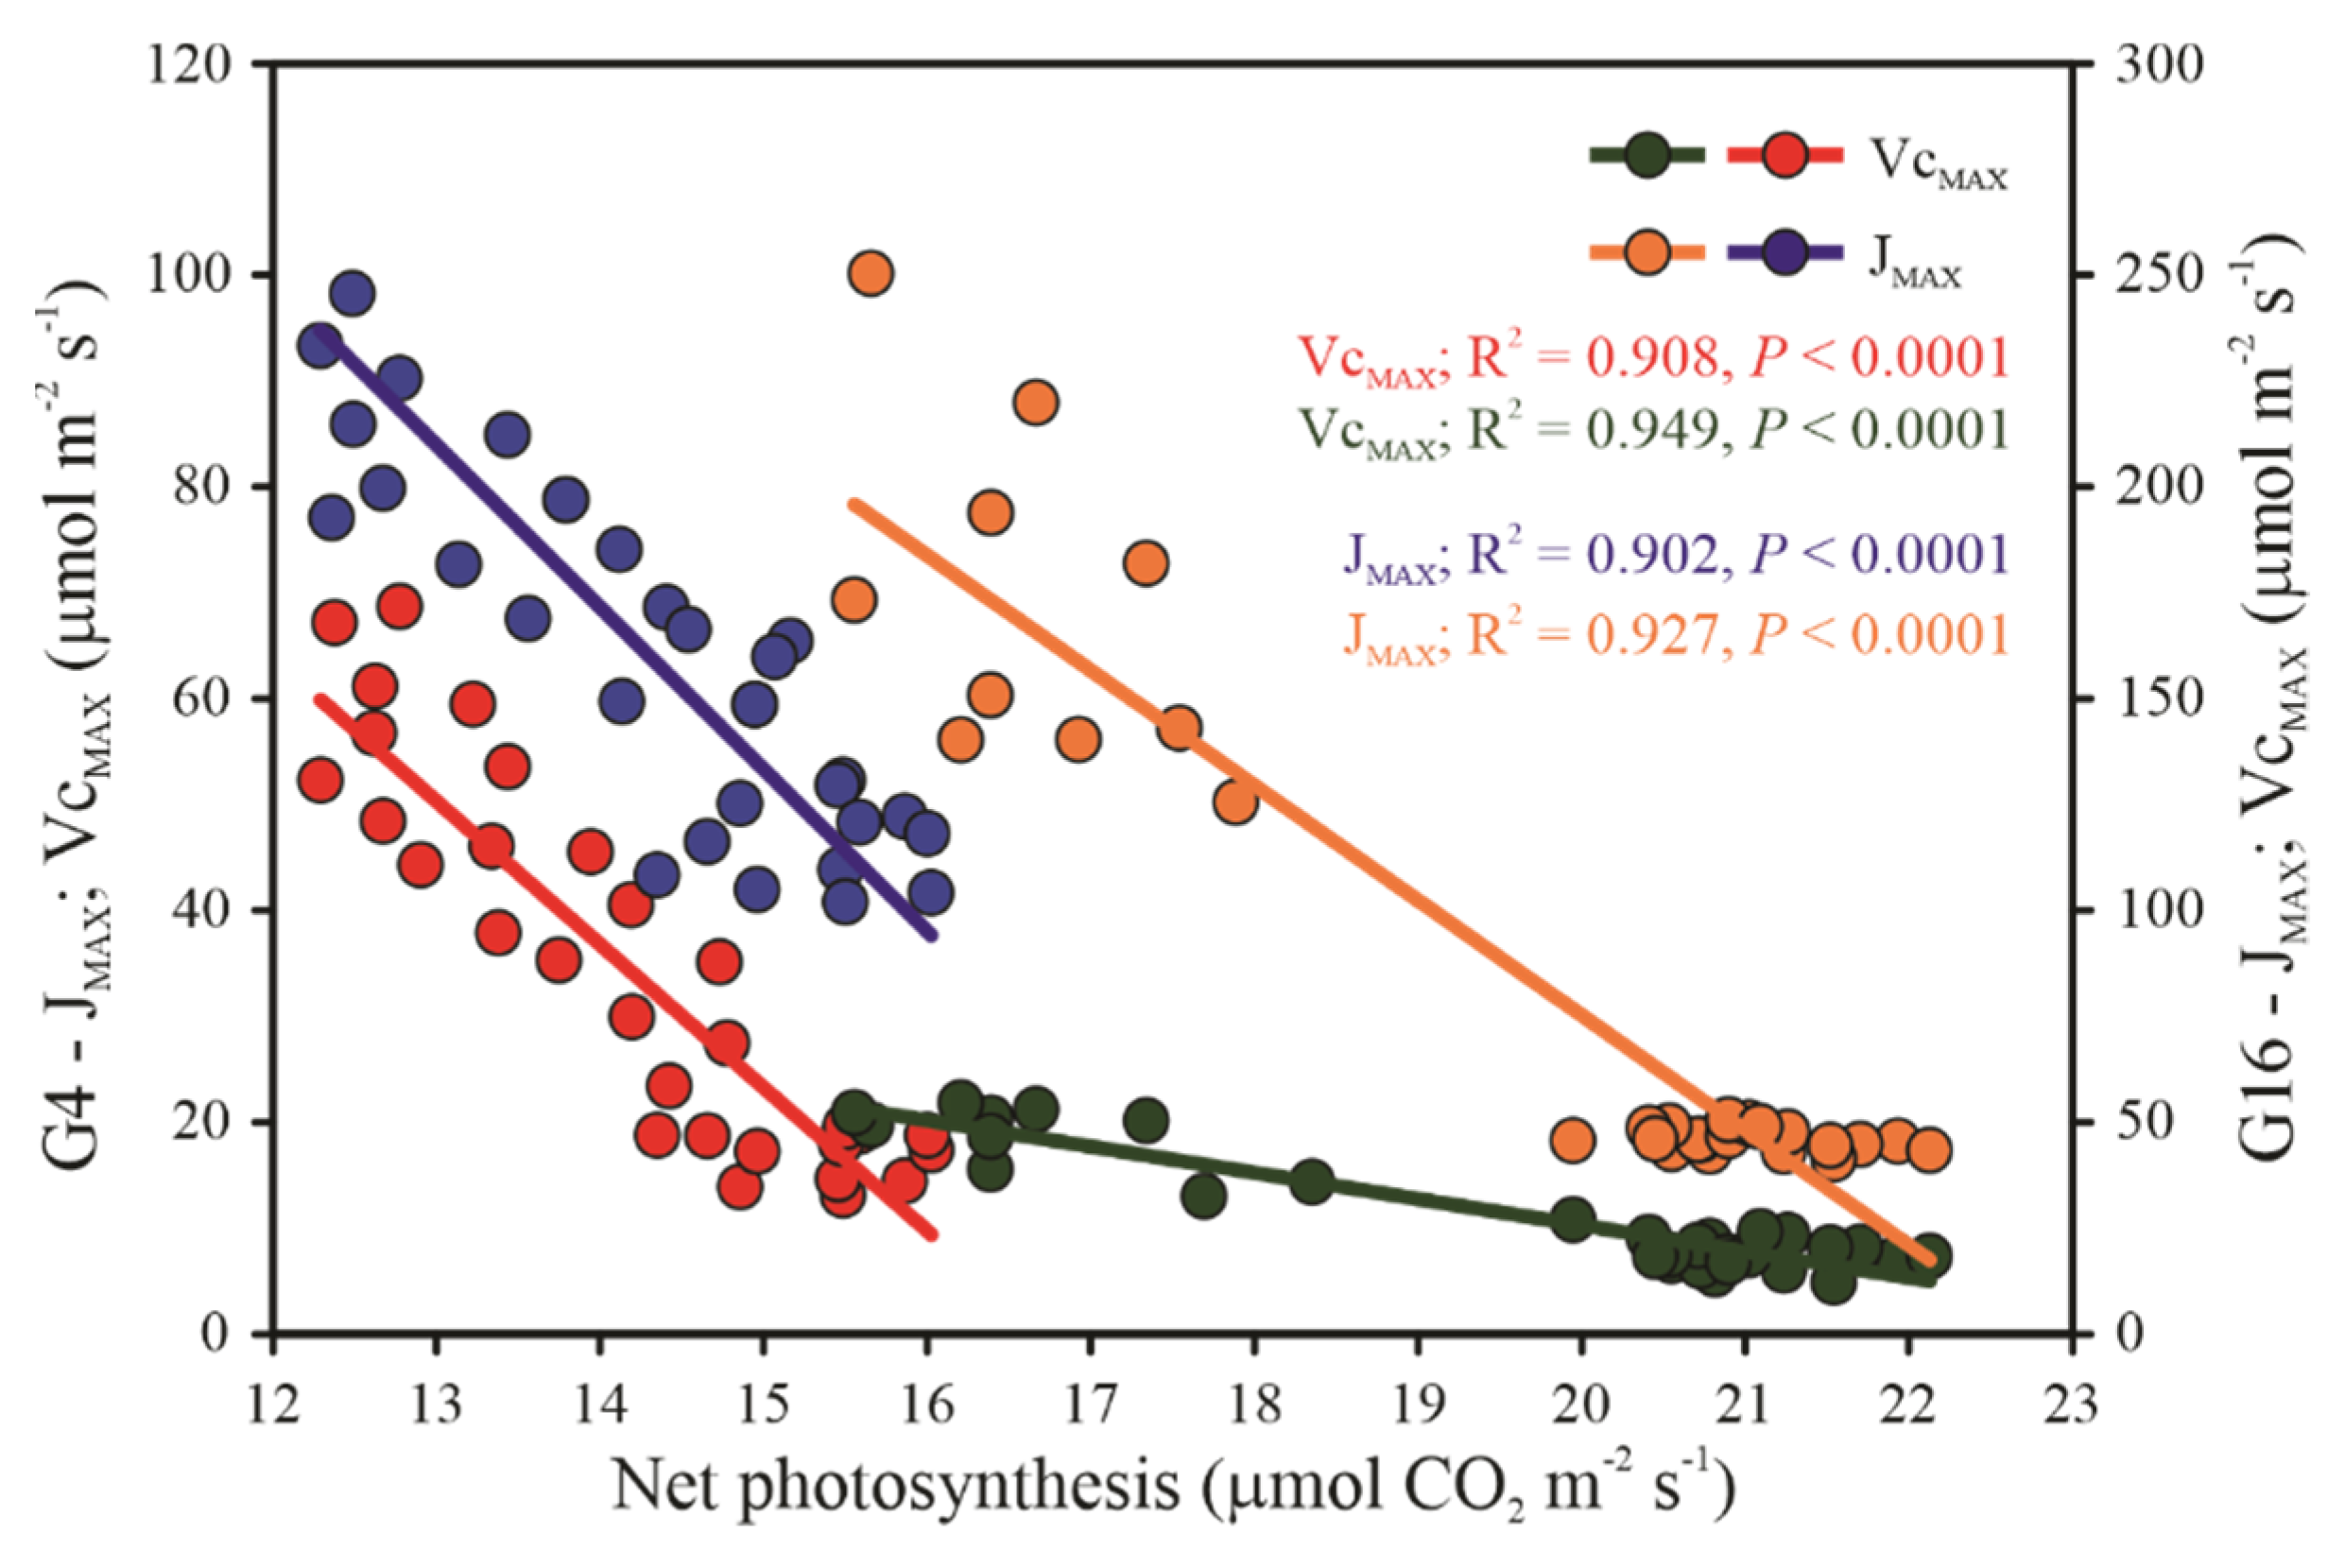
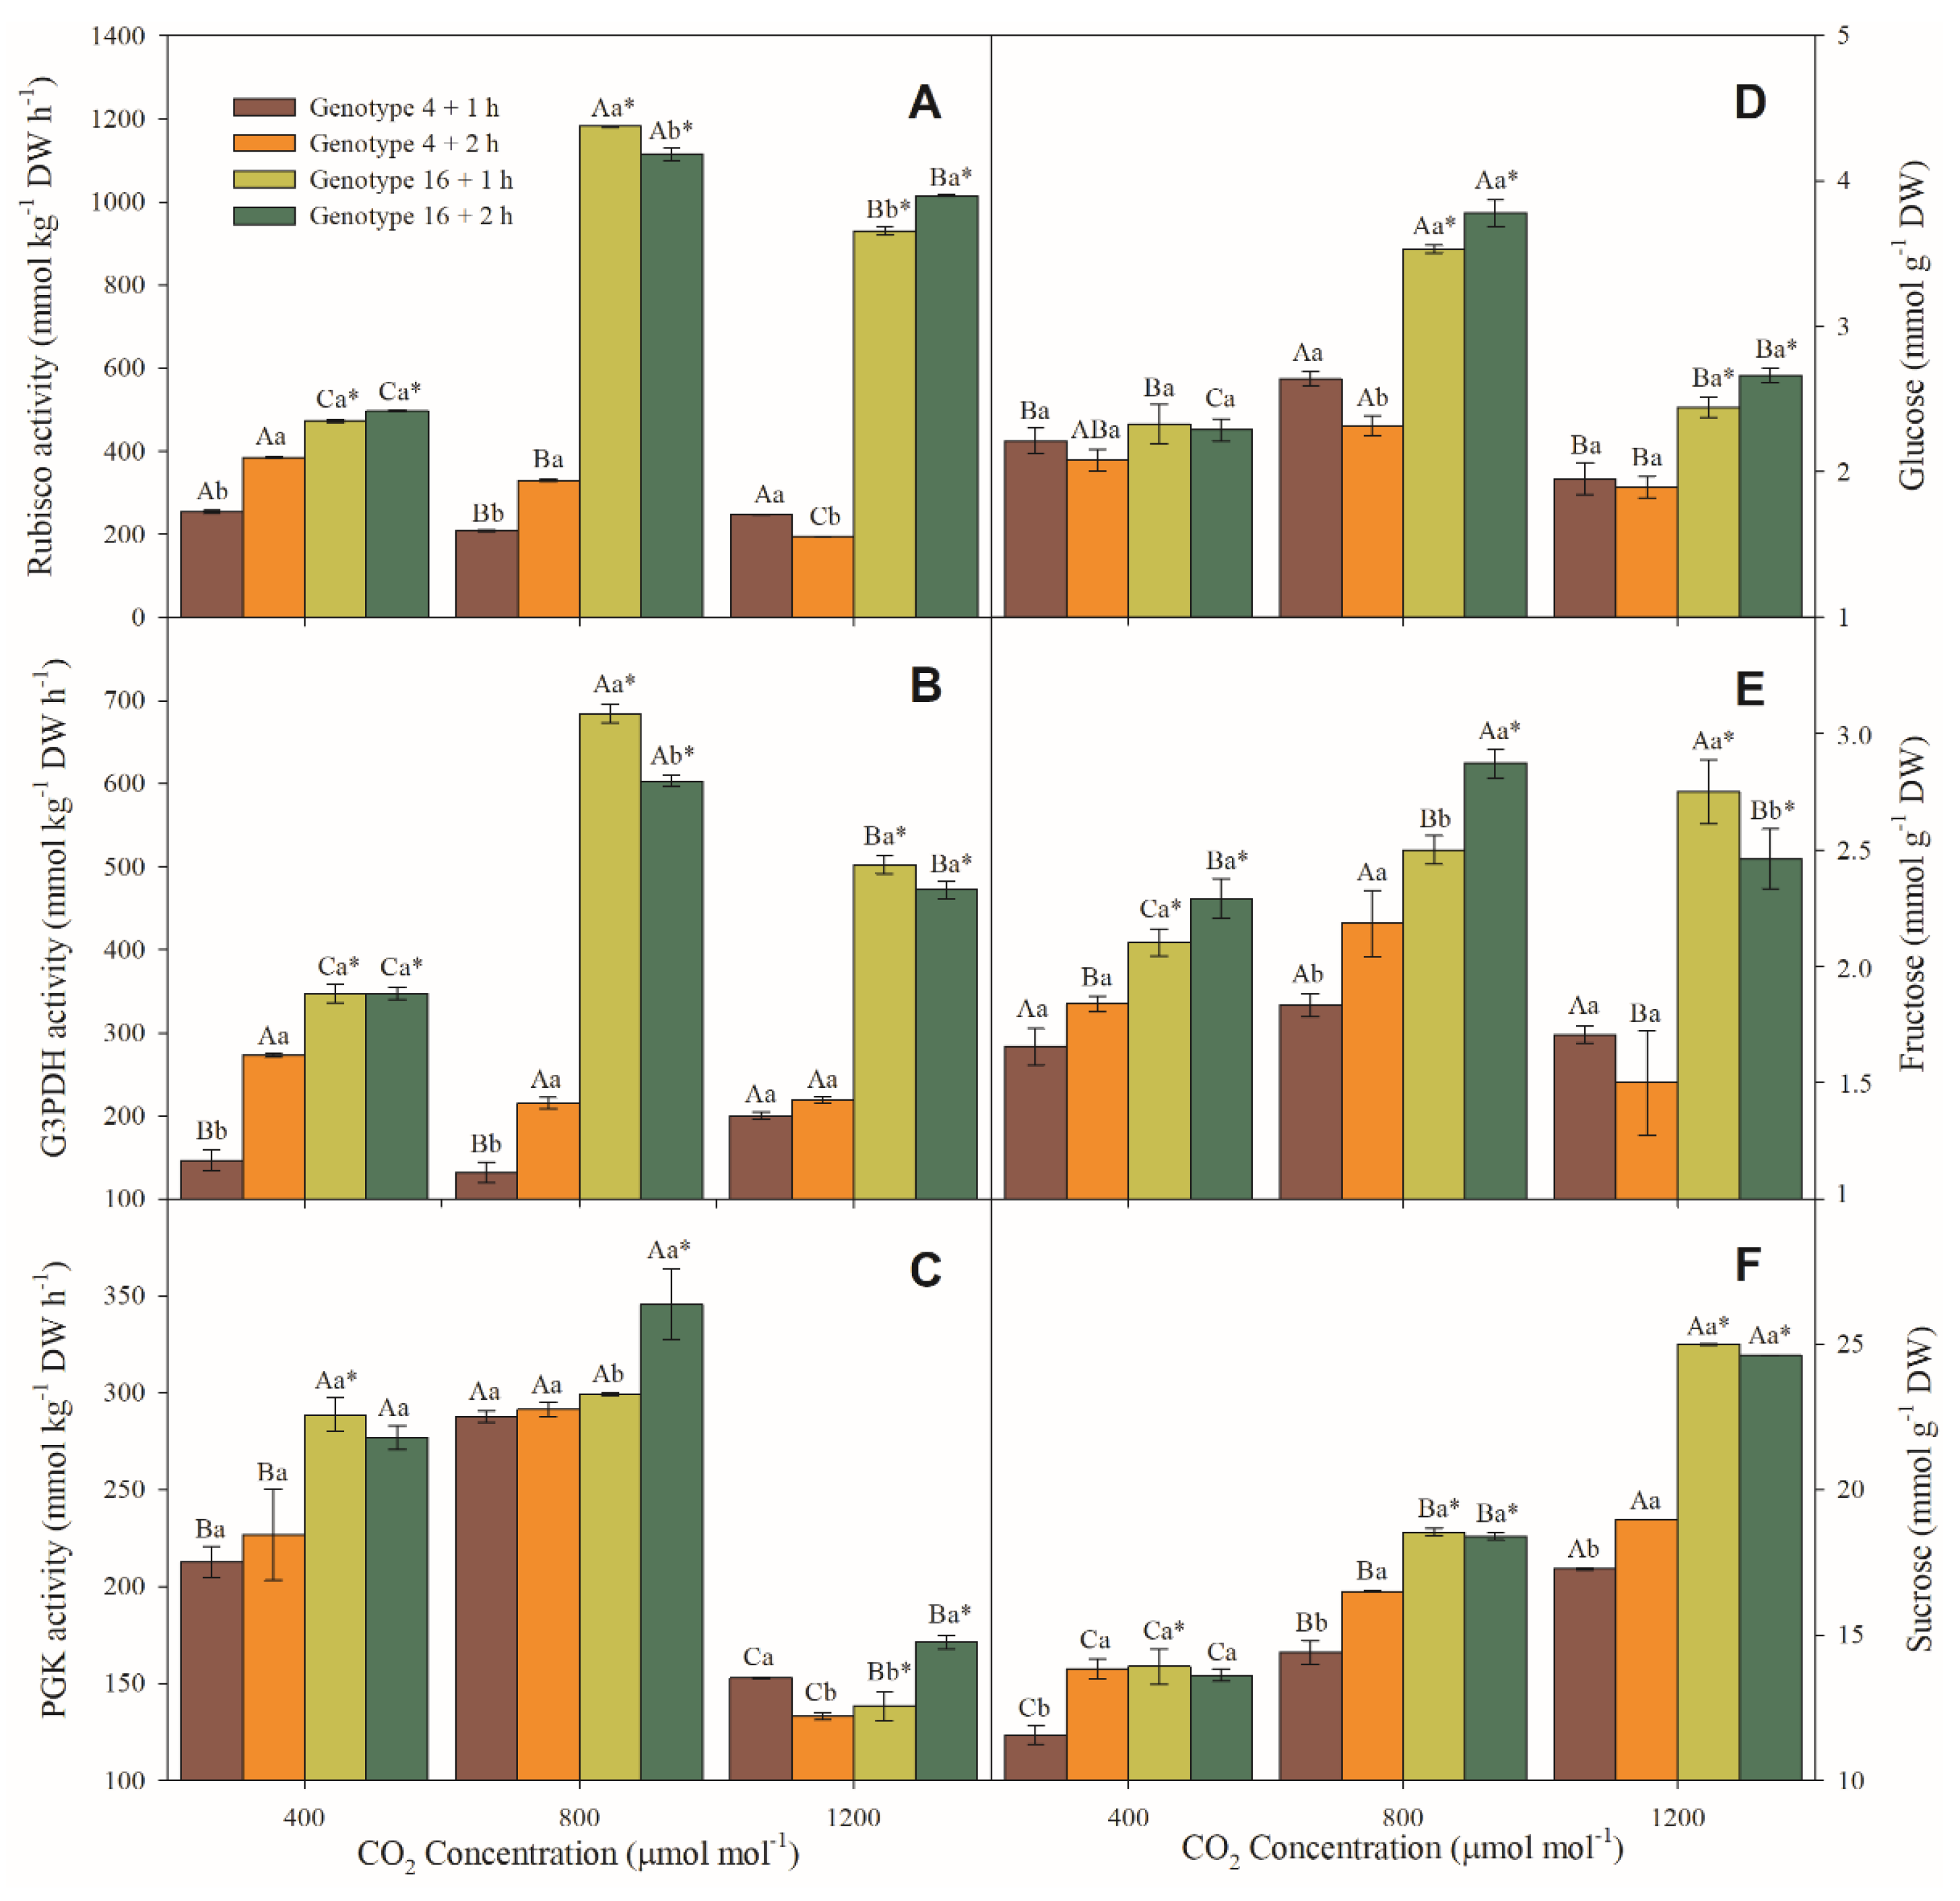
3.5. Enzymatic and Sugar Content Measurements
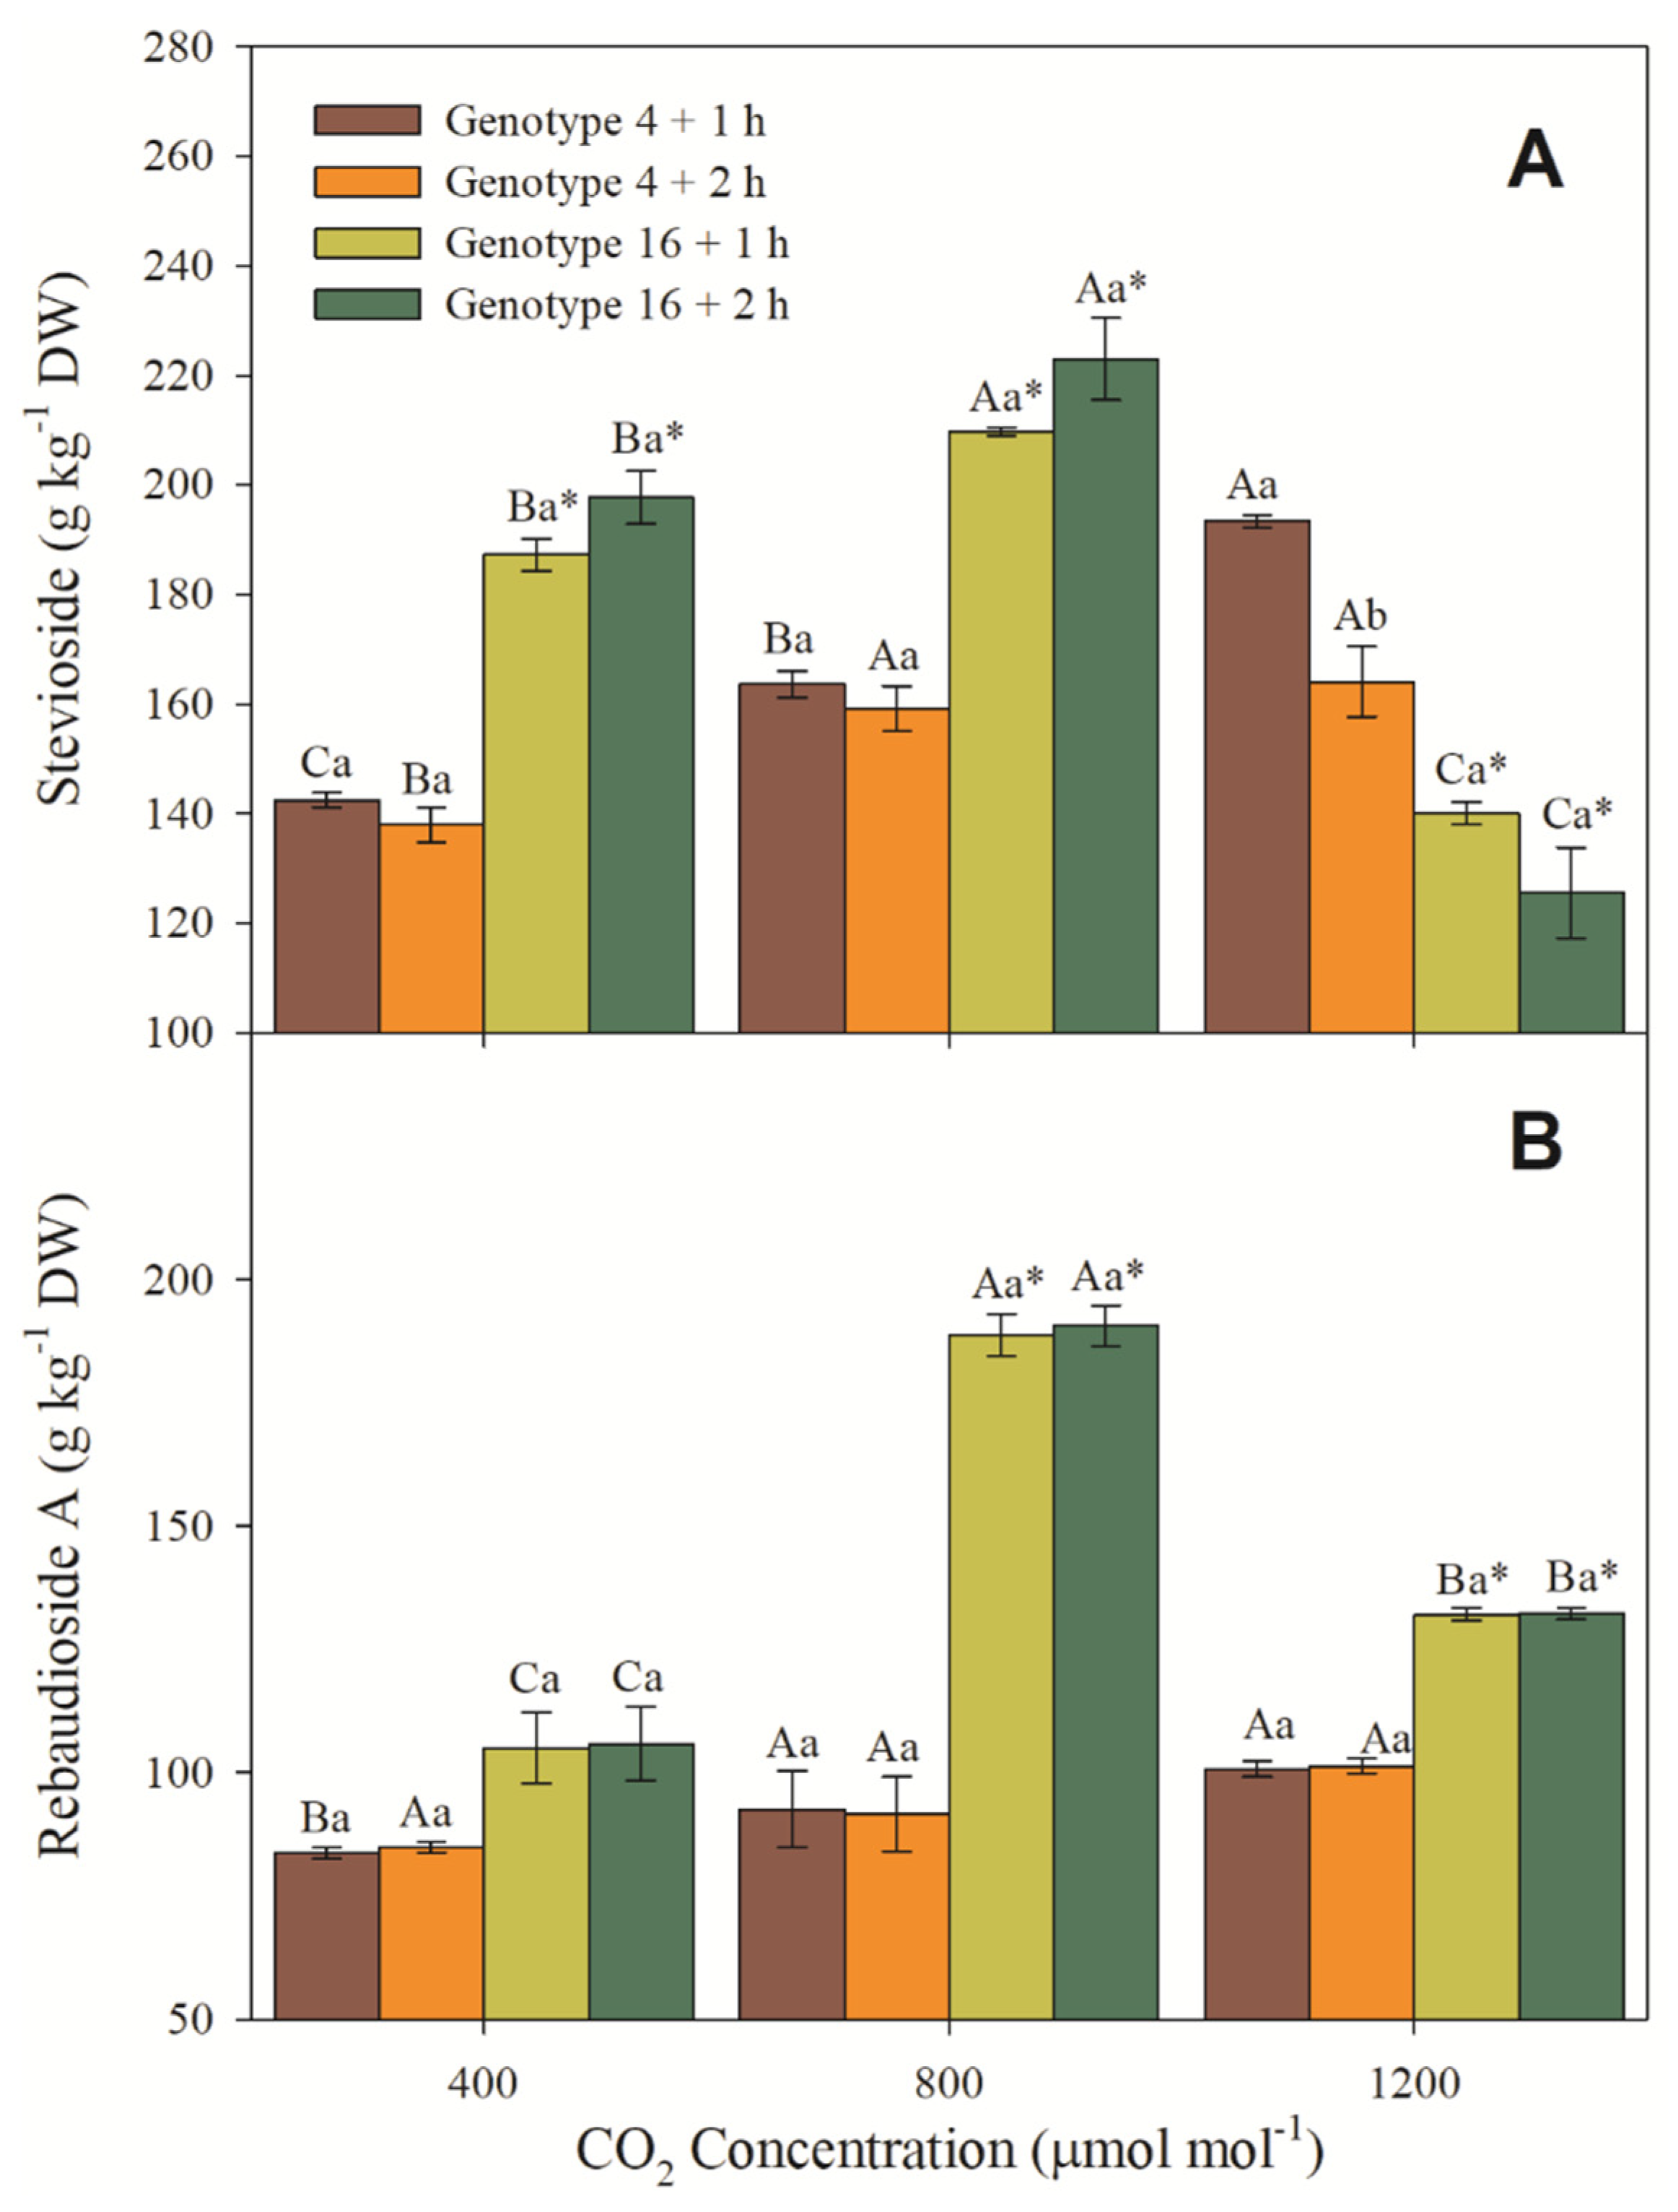
Rubisco activity was not significantly affected by CO2 exposure time, but all [CO2] in G16 plants showed higher activity, namely 52%, 327% and 341% higher at exposure to 400, 800 and 1200 μmol CO2 mol−1, respectively, in comparison to G4 plants (Figure 11A). G3PDH exhibited a greater increase in G4 plants under a 2 h exposure to a CO2-enriched atmosphere, with no significant change in G16 with respect to the time of exposure to the CO2-enriched atmosphere. However, G16 showed increases of 65.4%, 271.1% and 132.3 compared with G4 (Figure 11B). The PGK activity seems to be differentially modulated in G16, since in 400 μmol CO2 mol−1, G16 shows an increase in PGK activity of 28.7 compared with G4. At 800 μmol CO2 mol−1, G4 and G16 PGK activity increased by 35.4%, 28.8%, 3.6% (ns), and 24.9% compared with that at 400 μmol CO2 mol−1.
With respect to sugars, at 400 μmol CO2 mol−1, neither genotype nor time of exposure to the CO2-enriched atmosphere influenced the glucose concentration (Figure 11D). However, exposure to 800 and 1200 μmol CO2 mol−1 yielded increases in G16 of approximately 47.5%, compared with 32.8% in G4 (Figure 11D). Furthermore, the concentration of fructose increased with the increase in time of exposure to the CO2-enriched atmosphere. Thus, in G4 and G16 plants, a 2 h time of exposure to 400 μmol CO2 mol−1 promoted increases of 15.9% and 11.7%, respectively, compared with a 1 h exposure to the CO2-enriched atmosphere (Figure 1E). In a similar manner, a 2 h time of exposure to 800 μmol CO2 mol1 promoted increases of 26.4% and 18.6%, respectively, compared with that resulting from a 1 h exposure to the CO2-enriched atmosphere.
The concentration of sucrose was slightly affected in all treatments compared with that of plants under 400 μmol CO2 mol−1 (Figure 11F). Moreover, in G4 plants, 2 h of exposure time under 800 and 1200 μmol CO2 mol−1 promoted an increase of 14.6% and 9.8% in sucrose concentration compared with the values resulting from 1 h of exposure time (Figure 11F).

3.6. Steviosides

Under both 400 and 800 μmol CO2 mol1 for 1 and 2 h, G4 plants did not show significant changes in the concentration of total steviosides. G16 plants seemed to exhibit the same pattern as G4, although G16 increased its total steviosides by 37.2% and 34% compared with G4 (Figure 12A). At 1200 μmol CO2 mol−1, stevioside decreased compared with that at 1 h of exposure to 400 μmol CO2 mol−1. The decreases were 15.1%, 27.6% and 35.1% in the 2 h G4, 1 h G16 and 2 h G16 plants, respectively (Figure 12A). However, in rebaudioside-A (RebA), no significant difference was verified in G4 for any [CO2]. However, G16 exhibited a greater concentration of RebA in relation to G4, in the following order: 25.1%, 105.8% and 30.8% in G16 under 400, 800 and 1200 μmol CO2 mol−1 (Figure 12B).

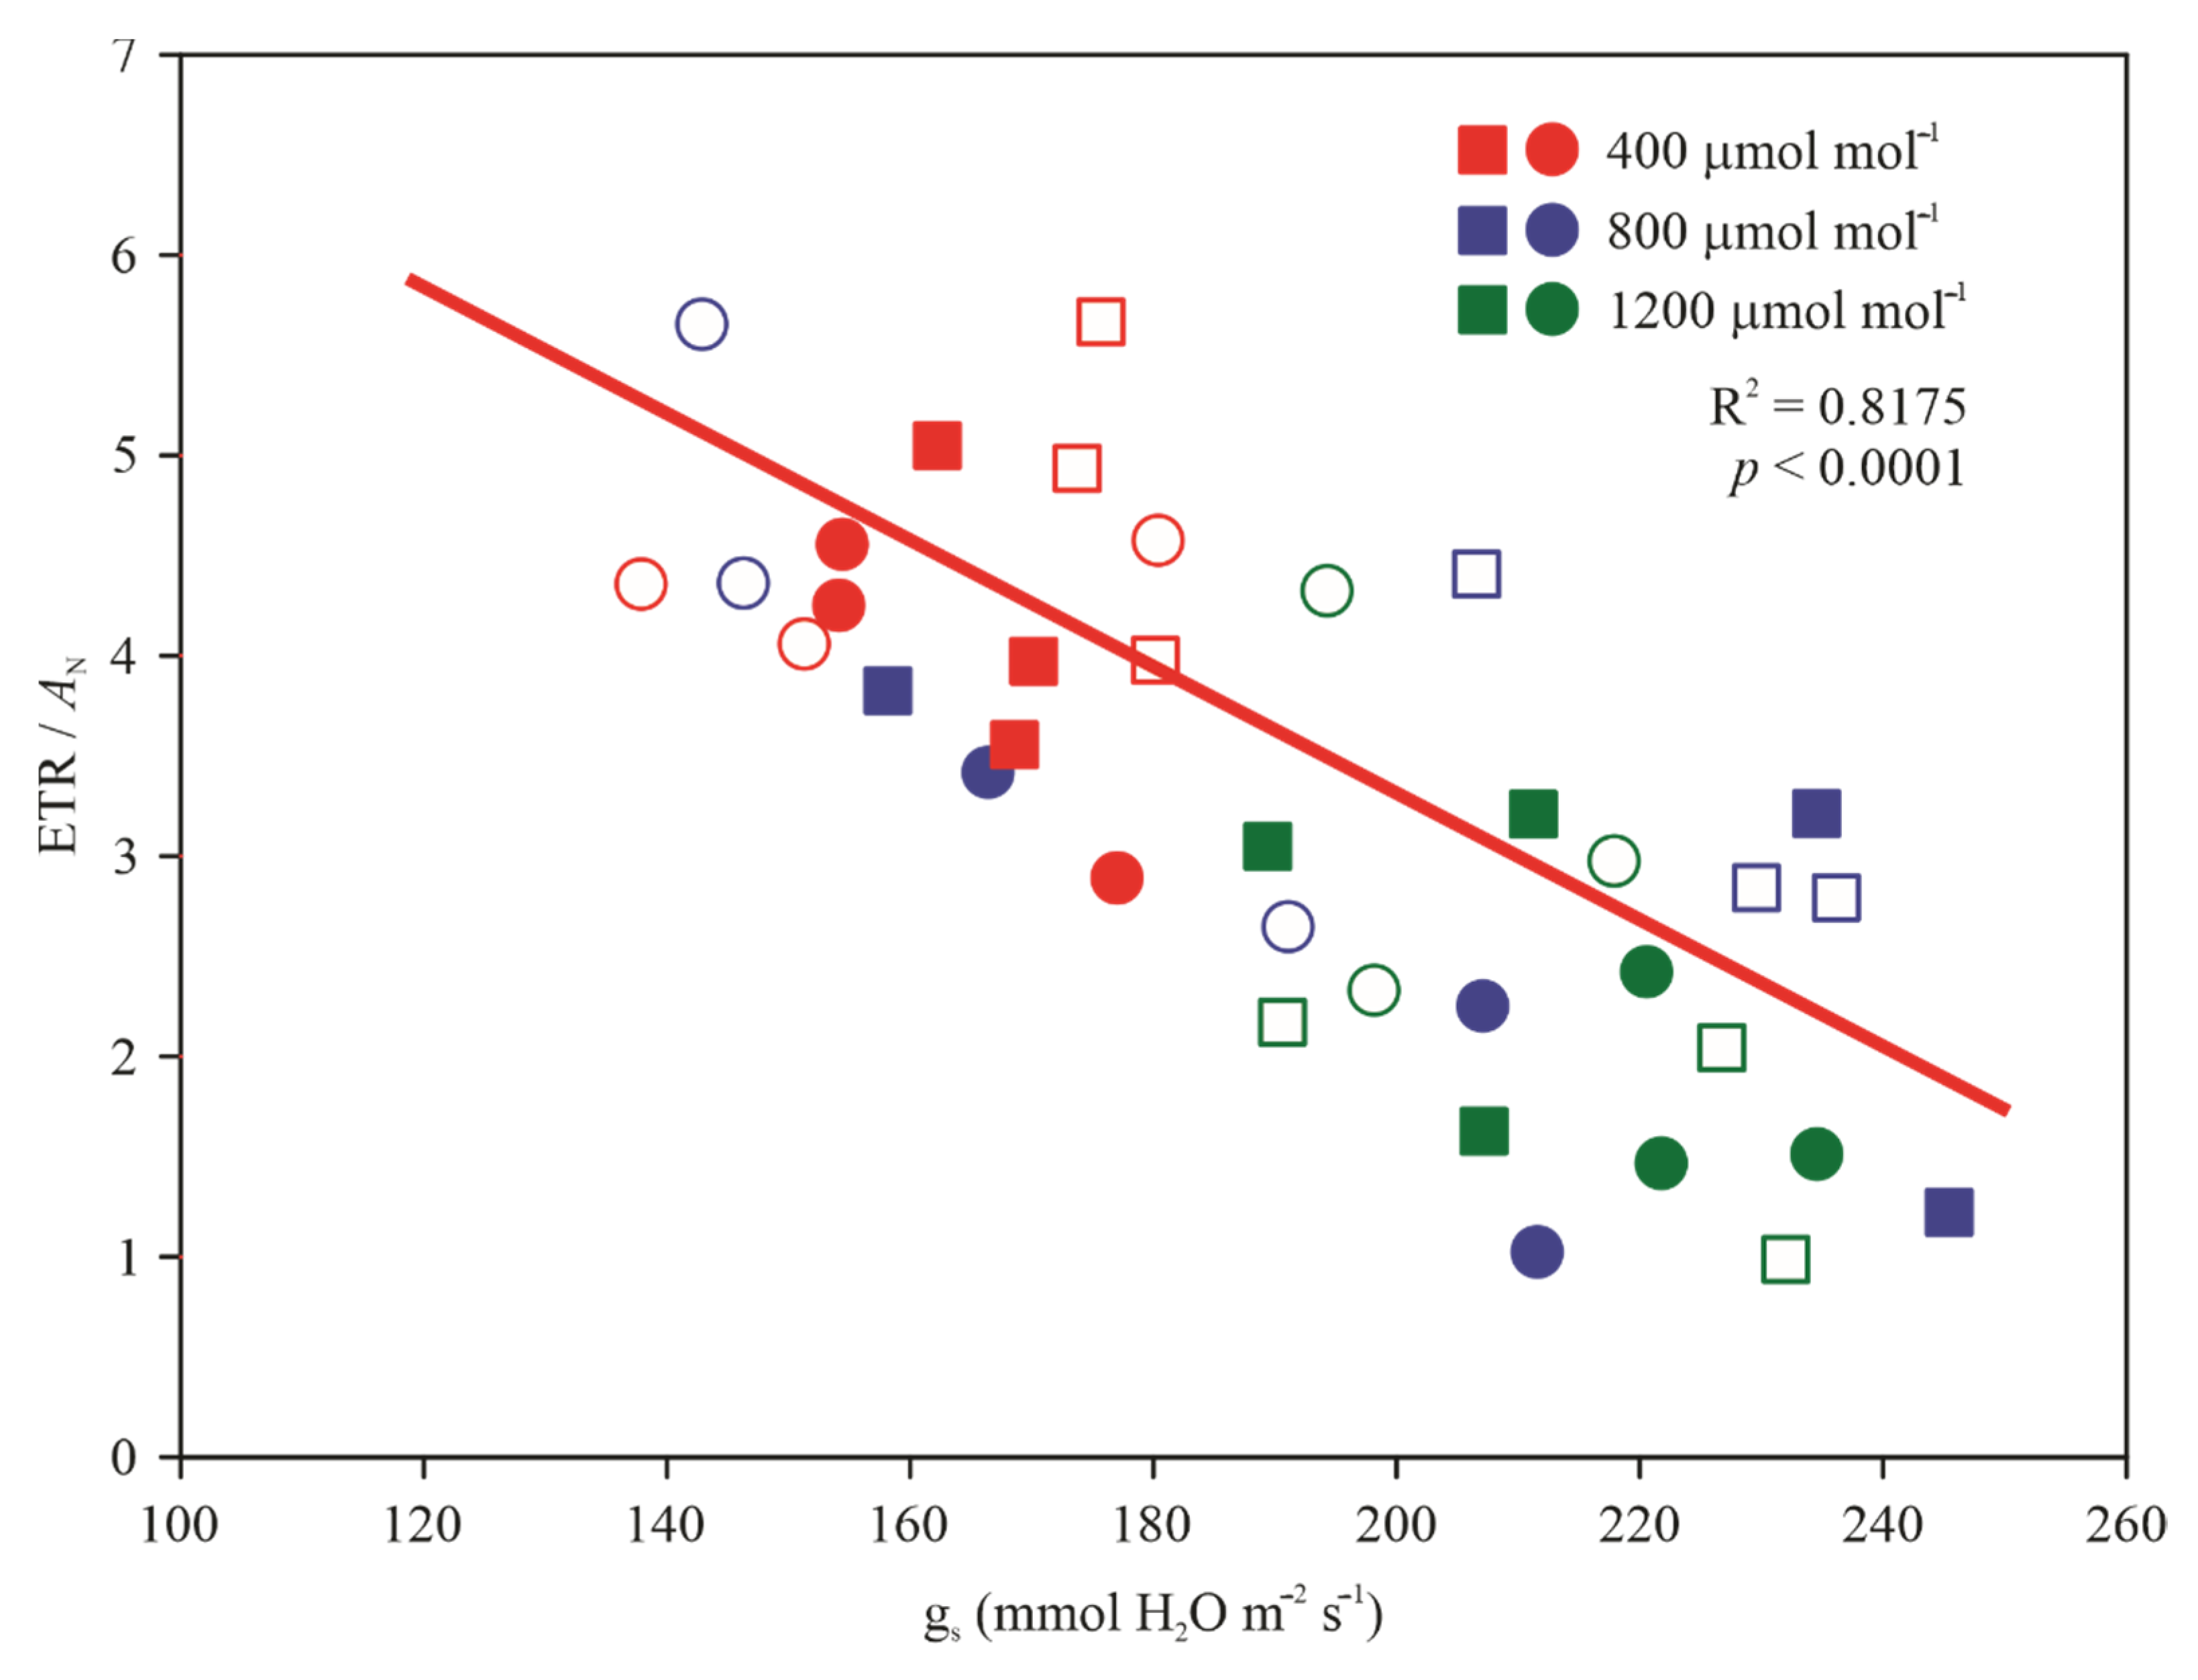
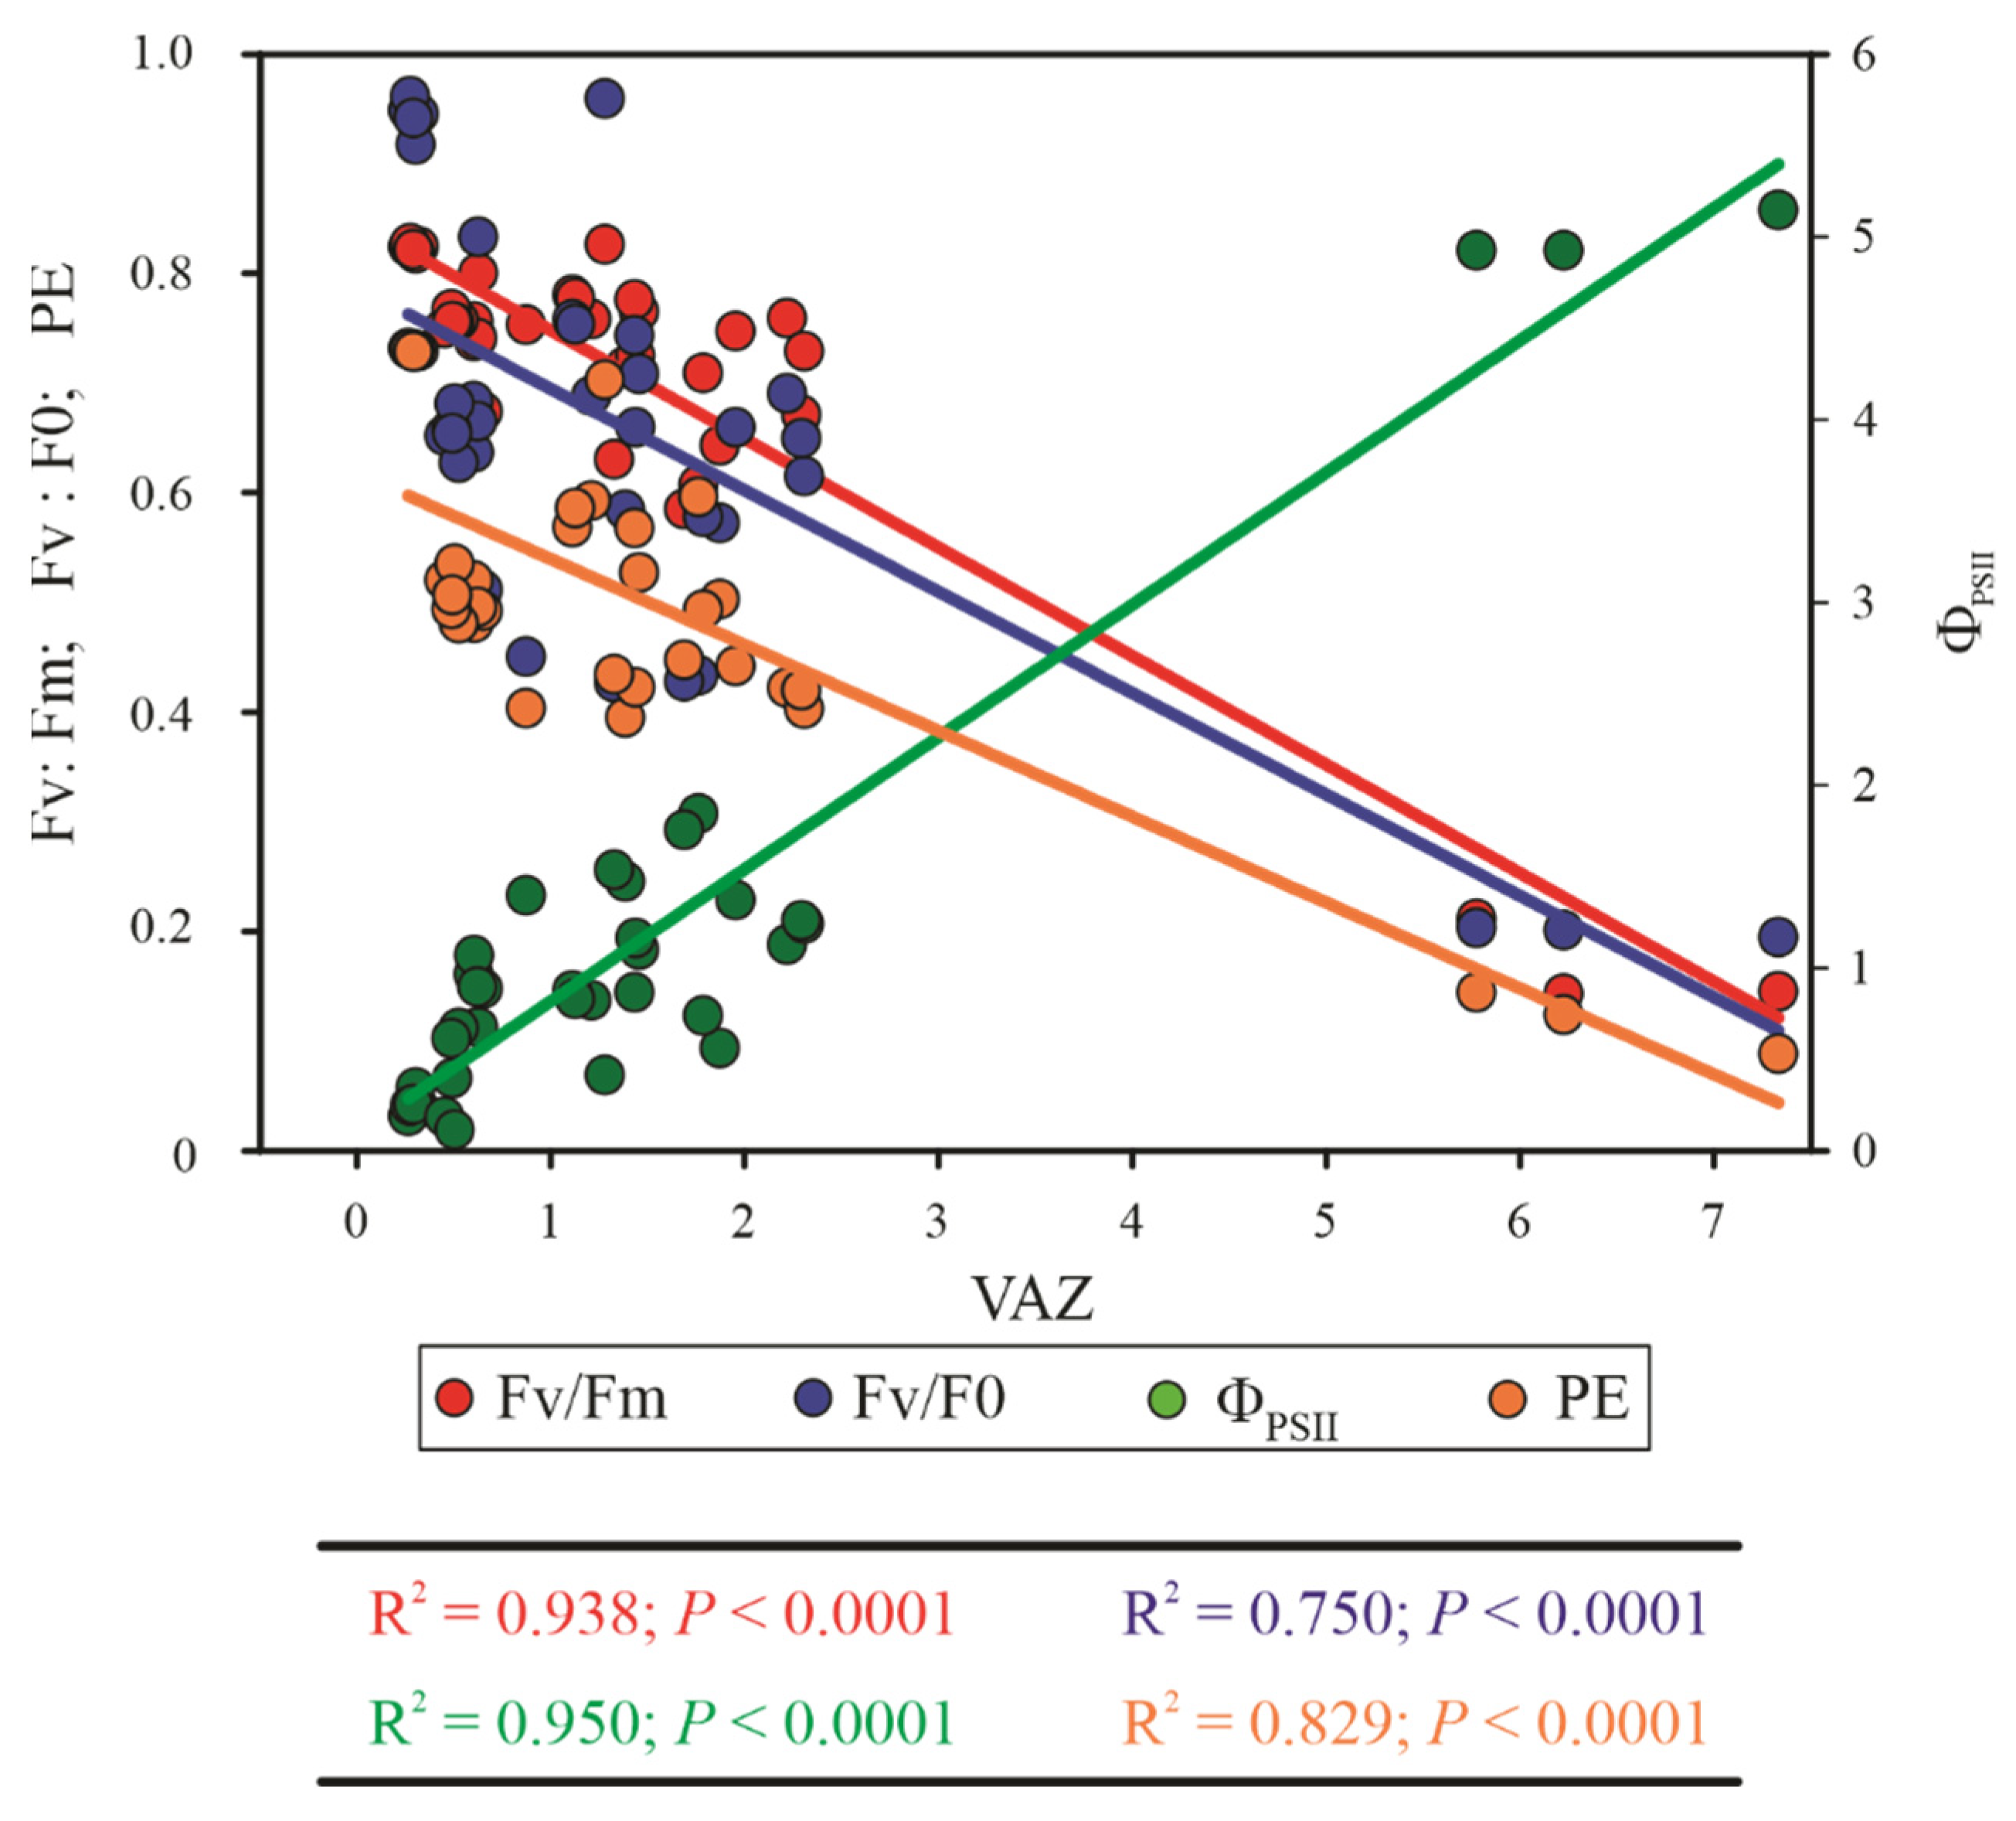
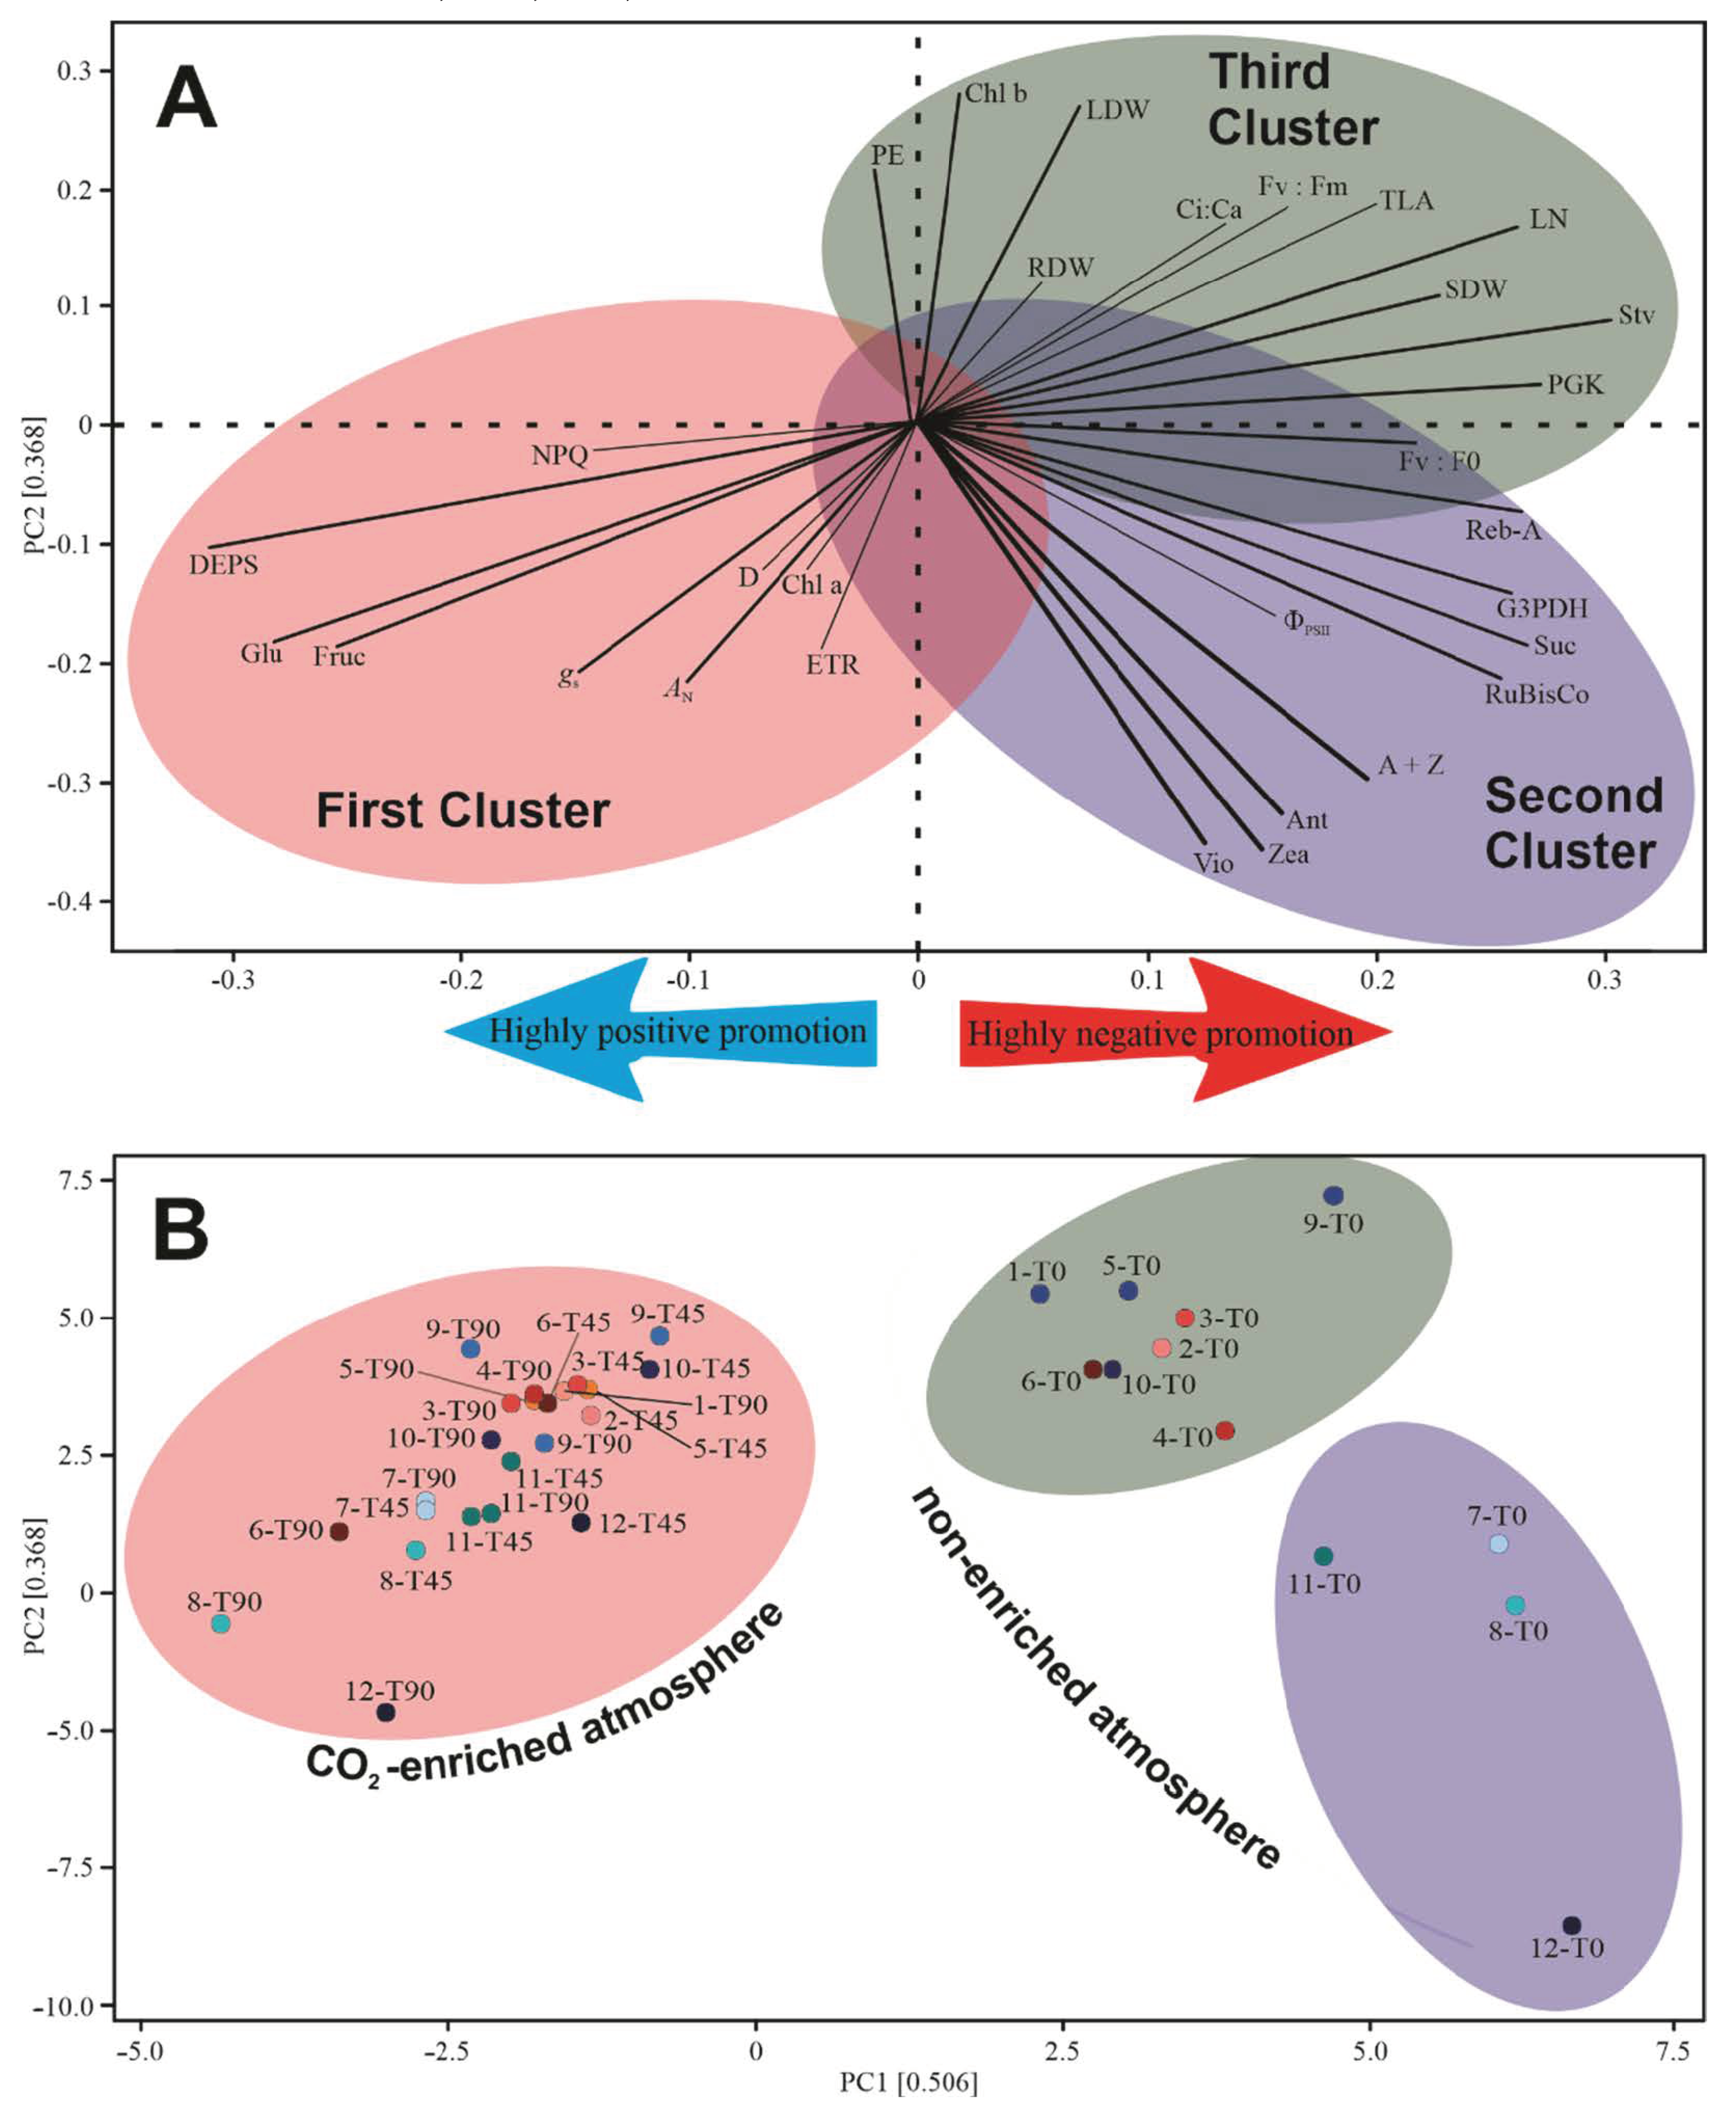
3.7. Multivariate Analysis

Multivariate analyses are very important for explaining the intensity and the vector with which other variables influence a given characteristic. Here, we will analyze two main branches and the associated variables. Thus, AN is strongly correlated with DEPS, Fru and Glu; moderately correlated with gs and NPQ; and, to a lesser extent, correlated with ETR, D and Chl a, which together form the first cluster (Figure 13A). However, strong shading can be verified between the first and second clusters, especially in correlation with the variables Vio, Ant, Zea, A + Z and rubisco.
The second main characteristics were the production of total steviosides and the production of RebA. Figure 13A shows that these characteristics were strongly correlated to PGK, LN, SDW and TLA; moderately correlated with the Fv:Fm ratio and Fv:F0 ratio; and less correlated with Ci:Ca, RDW, LDW, Chl b and PE. It is important to highlight the similar strength of AN (PC2 = 0.186) with rubisco (PC2 = 0.186), G3PDH (PC2 = 0.142) and PGK (PC1 = 0.254), as well as that of AN with Glu (PC2 = 0.152), Fru (PC2 = 0.166), Suc (PC2 = 0.165), Stv (PC1 = 0.285) and RebA (PC1 = 0.271).
Notably, the first cluster is composed of all values related to the 800 and 1200 μmol CO2 mol−1 conditions (Figure 13B), while the second cluster is basically formed by the treatments of 1 h 400 μmol CO2 mol−1 as well as 2 h under 800 and 1200 μmol CO2 mol−1 (Figure 13B). The third cluster grouped all non-enriched plants, such as those exposed to 400 μmol CO2 mol−1 and 1 h and 2 h under 800 μmol CO2 mol−1 (Figure 13B).

4. Discussion

Different plant species and cultivars can exhibit different adaptive responses to the same CO2-enriched atmosphere, but this event can be dependent on the severity and duration of the environmental stress. High temperature, drought and other effects of climate change seriously affect the production of crops such as tomato, rice, wheat, maize and barley; however, these abiotic stresses can be attenuated by a CO2-enriched atmosphere [4,64,65].
Under natural conditions, photosynthesis is commonly rubisco-limited [66]. However, the increase in AN in the CO2-enriched atmosphere could be limited by CO2 or due to a decrease in the activity of rubisco [67] or other proteins of the ETR system, such as cytochrome b6f. Moreover, in accordance with Vu et al. [19], predawn rubisco activity was 27% lower than that evaluated at 10:00 a.m., even in CO2-enriched atmosphere plants. Many scholars have described higher AN values under high [CO2] in soybean [19,25], rice [19,68,69], sorghum and peanut [70], wheat [32,69], A. thaliana [71] and S. rebaudiana. Additionally, the optimum temperature for achieving higher AN values was 25 °C and 32 °C in rice and soybean, respectively. Decreased photosynthesis under higher temperatures can be lowered by both protein content and decreased enzyme activation, playing a role in the downregulation of rubisco mediated by elevated [CO2] [67,72]. VcMAX essentially depends on the AN at low CO2 concentrations, while JMAX is based on AN at high [CO2] levels, well above those to which the leaf is normally exposed [73]. A lower VcMAX as a lower investment in rubisco protein was also reported in many species [73,74,75]. Theoretically, a lower VcMAX would represent a lower carboxylation activity and, therefore, lower AN. Based on this assumption, we demonstrated that CO2-enriched atmosphere S. rebaudiana plants did not downregulate photosynthesis, since, in both genotypes, VcMAX and AMAX increased as [CO2] increased. These results contradict studies with barley [20] and cassava [76], as they describe a decay in VcMAX and AMAX as [CO2] increased. This result supports the hypothesis that higher [CO2] [20] uncoordinated with ETR can lead to photoinhibition and additional generation of ROS.
As described by Pimentel [33], for soybean cultivation under current atmospheric [CO2], AN/Ci curves at VcMAX and JMAX were 95.5 μmol m−2 s−1 and 147.6 μmol m−2 s−1, respectively, which are 86% and 33.3% higher than the values estimated for S. rebaudiana at 400 μmol CO2 mol−1. If we consider the estimated values for 800 μmol CO2 mol−1, the values presented for S. rebaudiana are 63.1% and 220.3% higher than those presented for G4 for VcMAX and JMAX, respectively. Thus, it is believed that S. rebaudiana, even under an 800 μmol CO2-enriched atmosphere, still has the potential to increase its carboxylation rate. CO2-enriched atmosphere substantially decreases gs, increasing by analogy the WUEi as demonstrated in this study and previously reported in many cultivated species [22,32,64,65,76,77,78]. However, recent studies with tomato have shown that plants grown in CO2-enriched atmosphere delay stomatal closure [64] when compared to control plants, and by analogy more CO2 is captured and reduced, at the expense of reducing power. In this study, we describe a WUEi ranging from 45 to 270. With this ratio, we can infer that S. rebaudiana presents a high cooling capacity of mesophilic cells [32], which is very important for maintaining the leaf temperature close to the optimal temperature for plants, especially those acclimatized to the Colombian Caribbean, where the temperature commonly exceeds 40 °C [2,43,79,80].
At high CO2 concentration, AN is specifically limited by JMAX, which is reflected in less potential photosynthesis; therefore, the effect of increasing atmospheric [CO2] on photosynthesis can be constrained by JMAX. As demonstrated in Figure 1, the temperature inside the growth chambers was higher than the atmospheric temperature. Fan et al. [20] describe that when the temperature increased from 15 °C to 30 °C, VcMAX displayed continuous increases, but JMAX had visible decreases from 25 °C to 30 °C. This statement partially disagrees with our data because regardless of the increase or decrease in temperature (Figure 1), both VcMAX and JMAX decreased (Figure 6) in 45-day S. rebaudiana plants under 800 μmol CO2 mol−1. In addition, we demonstrated a strong linear relationship between VcMAX and JMAX and each with AN. In accordance with Fan et al. [20], the JMAX:VcMAX ratio ranged from 1.6 to 4.2 and was completely dependent on temperature. Our results showed ratios similar to those described by these authors, where in 0-day plants, JMAX:VcMAX ratio was 1.6 and 3.8 for G4 and G16, respectively. However, under 800 μmol CO2 mol−1, this ratio, regardless of the increase in temperature inside the chamber, changed to 3.4 and 2.8 in 45-day S. rebaudiana plants and to 2.4 and 2.3 in 90-day S. rebaudiana plants, respectively, for G4 and G16. Our values of VcMAX were 90.8% (G4) and 71.2% (G16) higher than those described in barley by Wullschleger [13]. However, our JMAX values were 27.3% (45-day plants) and 27.5% (90-day plants) higher than those described by Wullschleger [13]. Similarly, our VcMAX values were 24.4% (45-day plants) and 31.5% (90-day plants) higher than those described by Wullschleger [12]. Notably, our plants were developed at 30–35 °C, while barley and wheat were developed at 25 °C [13].
Long [24] describes that rice and soybean grown under CO2-enriched atmosphere conditions are often accompanied by increases in AN. However, in CO2-enriched atmospheric conditions, AN can exceed the capacity to utilize the products of photosynthesis (TPU), creating an imbalance between source and sink, which leads to modulation of chloroplast proteins, and downregulation of photosynthesis [13,35,81], as previously reported in tomato [82,83], rice [84], cassava [76], wheat and another cultivated species [32]. Our results partially are in accordance with those of these authors because for S. rebaudiana plants, the increase in [CO2] led to a significant increase in 800 μmol mol−1 CO2-treated plants but a decrease in 1200 μmol mol−1 CO2-treated plants. The lack of an AN response under superelevated [CO2] could be associated with an overall decrease in gs in the 800 μmol mol−1 CO2-treated plants, as previously described by de Gusman et al. [85] in S. rebaudiana and by Li et al. [64] for tomato. However, it cannot be ignored that the parameters obtained from the light curves were parameterized for a leaf temperature of 25 °C [18]; therefore, care must be taken in extrapolating these data to plants adapted to warmer climates, such as those recorded in the Caribbean region.
To assess whether the main cause of the decreased AN is stomatal limitation, we used the S L = 1 ( C i : C a   r a t i o ) , which is universally applicable to the method proposed by Hussin et al. [86], which describes that in S. rebaudiana, a decrease in AN is a consequence of stomatal limitation. In accordance with Hussin et al. [86], if Ci and gs present a positive correlation when AN decreases, the reason for the AN decrease is stomatal limitation; however, if the two variables show no correlation or opposite results, the cause is nonstomatal limitation. In our study, Ci x gs had a negative correlation (r = −0.346; p = 0.045), and AN x gs had a positive correlation (r = 0.663; p = 1.03 × 10⁻⁵); which leads us to infer that the decrease in AN of S. rebaudiana under a CO2-enriched atmosphere could be nonstomatic instead of stomatic, as previously reported in this species [43,86] and other cultivated species such as soybean [53]. To confirm this finding, the analysis of SL is able to lead us to speculate that nonstomatic limitation prevails in S. rebaudiana, since the SL amplitude was between 0.34 and 0.72, with a mean of 0.53 ± 0.01, values that corroborate the data described for Glycine max [53]. In the present study, we speculate that the high Ci:Ca ratio is due to a CO2 enrichment atmosphere because AN and gs were strongly increased with a 1200 μmol mol−1 CO2 enrichment atmosphere. In addition, JMAX and VcMAX decreased as AN increased (Figure 6). As the Ci:Ca ratio in CO2-enriched atmosphere plants was similarly modulated in G4 and G16, it is unlikely that the differences between genotypes can be attributed to any differential effects of temperature on stomatal conductance. Similar situations were described for rice and soybean [19].
The rubisco CO2 compensation point (Γ*) was frequently attributed to a low respiration rate [87], a pattern similar to those described in this study (r = 0.678; p = 1.11 × 10⁻⁶); however, Rd × TPU was higher (r = 0.887; p = 1.13 × 10⁻¹⁴). Nevertheless, the leaf respiration rates described in this study agreed with those presented by Marenco, Gonçalves and Vieira [87] and were higher than those reported in four tropical species from Mexico [88], and these variations could be due to irradiance and temperature difference in the plant development phase.
Figure 1 also shows that inside the chambers, PAR is approximately 23% of that registered outside. In this situation, AN can be limited by light, and this limitation is attributed to photosynthetic pigments, which in shade have a lower Chla:Chlb ratio. As Chl b is less efficient in capturing photons, photosynthesis is usually lower in plants under shade [87,89,90,91]. Perhaps due to the inside of the chamber, plants developed in a shade-like environment, which would explain the greater Chl b compared with Chl a. Regardless, the AN was higher in G16, with greater enzymatic activity and greater production of sugars; this is enough evidence to allow us to infer that G16 is more efficient than G4. However, rubisco, G3PDH and PGK activity increased in an 800 μmol CO2 mol−1 enriched atmosphere, and a small or major decrease in the activity of these enzymes was shown compared with 1200 μmol CO2 mol−1. The increase in gas exchange in G4 verified in 90-day S. rebaudiana plants may be due to the preparation required for flowering, which in this genotype usually takes between 95 and 110 days [3]. The decrease in AN in plants under 1200 μmol CO2 mol−1 could be correlated with increased starch accumulation and reduced grana formation in chloroplasts of leaves continuously exposed to high [CO2], as previously described in grapevines [81]. However, longer-term experiments are needed to evaluate whether photosynthetic downregulation will dampen the stimulation of photosynthesis under prolonged exposure to elevated CO2 [92]. In addition, a correlation between AN reduction and starch accumulation in the leaves of grapevines was found after prolonged exposure to elevated CO2, corroborating the idea that imbalance between source and sink promoted by high [CO2], temperature and drought is, in fact, is due to drought or elevated temperature instead of CO2-enriched atmosphere.
The maximum quantum efficiency (Fv:Fm) is a reliable indicator of plant adaptation to stress [35]. In accordance with the results of Hajihashemi et al. [35], the magnitude of the reduction was S. rebaudiana genotype-dependent, where only G16 exhibited a decrease in its Fv:Fm in physiological importance. However, the results of little or no modulation of the Fv:Fm ratio are in agreement with other studies [93], indicating that photosystem II activity is resistant to any stress and that there was no photoinhibition. This result is based on higher dissipated energy in D and PE forms, reduction of chlorophyll, increases in VAZ heat dissipation and the VAZ:Chl ratio, higher Calvin cycle enzyme activity and increases in the final products of photosynthesis (e.g., Glu, Fru and Sac) in plants under 800 and 1200 μmol CO2 mol−1. The modulation in PE under 800 and 1200 μmol CO2 mol−1 suggests the downregulation of PSII to prevent the over-reduction of QA, which would compensate for the decreased demand for electrons through NADP+ consumption, as reported in Arabidopsis thaliana [71]. This fact was also previously reported as an indication of dynamic, rather than chronic, PSII photoinhibition both in spinach [94] and S. rebaudiana [86]. Simulations show that this lower rate of CO2 fixation is estimated to range between 7.5% and 30% [95,96]. Definitely, this is not the case in S. rebaudiana, as even lower Fv:Fm ratios are accompanied by photoprotection, according to a hypothesis based on fluorescence analysis conducted in predawn that confirms that Fv:Fm is promptly recuperated at night. Then, by analogy, PSII is not chronically damaged.
As a CO2-enriched atmosphere enhances AN while simultaneously promoting the safe quenching of excess energy, S. rebaudiana will probably benefit from rising atmospheric [CO2] in the future in the same form as that concluded by Hussin et al. [86]. As expected, higher AN values of CO2-enriched plants were accompanied by a lower D, which differed from the results found in non-CO2-enriched plants, both in 1 h and 2 h and regardless of genotype. In addition, higher DEPS could safely dissipate excess excitation energy before it reaches the PSII reaction centers [94]. However, these authors described that in spinach the decreased AN was not entirely offset by the increase in D. Furthermore, the Fv:Fm, Fv:F0, NPQ, ETR, high ΦPSII and Fv’:Fm’ data can be interpreted as indicating better light energy utilization for photochemistry according to the decrease in the number of functioning PSII reaction centers [97]. Seemingly, under stress, ROS could be increased due to the impairment of photosynthetic function. In this case, the CO2-enriched environment could increase NPQ to compensate for energy sink reduction leading to an improved PSII photosystem, preventing photooxidative stress [23]. However, experiments using A. thaliana demonstrated that a CO2-enriched atmosphere had more benefit for PSI through promoting the reoxidation of NADP+ than ETR or ΦPSII [71]. These authors describe that the rapid oxidation of PSI in 800 ppm CO2 alleviated the over-reduction of PSI electron carriers. This rapid reoxidation of PSI seems to be more efficient in 800 ppm than in 400 ppm [71]. This pattern might explain the instability of the increase/decrease in ETR and ΦPSII measured in this study. The proportion of xanthophyll to chlorophyll (VAZ:Chl ratio) reflects the relative protection level that xanthophylls confer to the photosystem. We describe a VAZ:Chl ratio ranging from 0.29 to 1.76, with G16 showing higher values. This range is 6- to 35-fold higher than those described for grapevine [98] or Quercus ilex [99]. However, our values were 99% lower than those described for two Antarctic species [100]. Moreover, it should be noted that the simple expression of VAZ in the chlorophyll base is not a sufficient argument to support the greater or lesser VAZ:Chl ratio. This is because each pigment has a different molecular weight; thus, the ideal strategy would be to express VAZ:Chl considering the effective molecular weights of each of the pigments, as observed in this study. A higher VAZ:Chl ratio indicates how plants can defend themselves from any stressful condition. So, this ratio reflects the role of the xanthophyll cycle in releasing thermal energy and protecting PSII reaction centers [35]. Thus, this ratio can even be used as a stress index [99]. It highlights the importance of describing the distinct methodology, distinct species and distinct base in studies, which is difficult to achieve. In our study, the ratio between xanthophyll cycle pigments and total chlorophyll concentration was less than 1, which means that there were more chlorophylls than carotenoids when expressed on the same molar basis. However, G16 always showed a ratio between 1.22 and 6.05, which means that this genotype has the ability to produce specific carotenoids, promoting higher thermal dissipation. Therefore, this ratio demonstrates the superiority of the light capture system and the thermal energy dissipation in G16 in all treatments. In both genotypes, all plants treated with a CO2-enriched environment for 2 h showed a higher VAZ:Chl ratio (4). In summary, we demonstrated that the de-epoxidation state of xanthophyll cycle pigments was higher in G16 than in G4.
It is known that violaxanthin de-epoxidase (VDE) is inactive above pH 6.5 and operates at an optimum pH below 5.8 [101], which occurs when ETR is high and NADP+ turnover is low due to low CO2 mesophilic conductance or a low rate of carboxylation in the Calvin–Benson cycle. In fact, in a CO2-enriched atmosphere, the re-oxidation of NADP+ seems to be more evident than that in a non-enriched atmosphere [71]. This fact is consistent with the high Calvin–Benson cycle enzyme activity and high synthesis of Glu, Fru and Suc, leading us to speculate that high [CO2] was able to increase gm in CO2-enriched atmosphere S. rebaudiana leaves, leading to rubisco saturation and increased triose phosphate production. This hypothesis is corroborated by high TPU and increases in G3PDH and PGK activity. Plants should develop higher ETR and ΦPSII, higher concentrations of chlorophylls and a more efficient VAZ system to dissipate excess heat that may occur due to a lack of NADP+. In this manner, VDE can act by reducing ascorbate to release excess reducing power in the form of heat, thus avoiding PSII photoinhibition [102]. In accordance with Tan et al. [71], the photoinhibition is inversely proportional to the increase in the availability of CO2 in an enriched atmosphere influenced by the PSI redox state at the acceptor side rather than at the donor side. All descriptions described above matched better with genotype 16 (G16) than G4.
In the nine Stevia cultivars [35], the reduction in light absorption and increase in energy dissipation seemed to act concomitantly. This finding corroborates our data (Table 3, where an increase in VAZ:Chl was found. Our data also demonstrate a strong negative correlation between VAZ and the Fv:Fm ratio, Fv:F0 ratio and PE, corroborating the results of a previous study in S. rebaudiana [35]. In addition, the strong increase in the activity of rubisco, G3PDH and PGK or Glu, Fru and Suc in 800 and 1200 μmol CO2 mol−1 enriched atmospheres also confirms the idea that AN in S. rebaudiana does not have stomatal or mesophilic limitations as previously reported in this species [43,86]. However, even considering the stomatal or mesophilic limitations, this study describes that under elevated and superelevated [CO2], S. rebaudiana could overcome mesophilic and biochemical barriers that limit photosynthesis. Hussin et al. [86] describe that there must be an alternative pathway for sustaining electrons derived from PSII in nonassimilatory electron flow, such as photorespiration and Mahler peroxidase. Notwithstanding, Hussin et al. [86] disregard the role of the VAZ cycle in the dissipation of excess energy in PSII, a fact that this paper show in depth. In fact, the reduction in AN described by Hussin et al. [86] at high salinity may be caused by salinity, instead of stomatal limitation.
Tsai, et al. [103] demonstrated that the enzyme activity of G3PDH is inhibited in the absence of NAD(P)+ (oxidized). As shown in Figure 11B, G3PDH activity contradicts the description of Tsai et al. [103]; G3PDH was not inhibited but instead strongly increased, mainly in G16. Thus, we can argue that photosynthetic activity was promoted, even though AN showed a mild decrease in plants under 1200 μmol CO2 mol−1. The high activity of rubisco (Figure 11A) in these same plants is another indication that the photosynthetic activity was operating at a high level, even in plants with high [CO2].
In this study, we describe that G16 showed an increase in glucose of 5% and 16.4% in 1200 μmol CO2 mol−1 in CO2-enriched atmosphere plants at 1 h and 2 h, respectively, as well as G4 showing an increase of 35.7% and 18.9% in the synthesis of steviosides. In a similar manner, RebA synthesis was increased by 20%, 19.4%, 25.8% and 24.9% under 1200 CO2-enriched atmosphere plants at 1 h and 2 h in G4 and G16, respectively. Our data contradict those of previous studies in CO2-enriched S. rebaudiana plants [85], which did not verify an increase in the Stv and RebA concentrations in the 800 μmol mol−1 CO2-enriched plants. It is noteworthy that our 800 μmol mol−1 CO2-enriched S. rebaudiana plants exhibit a mean DW of 193.3 ± 1.92 g kg−1 in G4 for 1 h of CO2 enrichment and 164.1 ± 18.4 g kg−1 for 2 h of CO2-enrichment, which is 142% higher than the value presented by de Guzman [85]. With respect to RebA, our results were 630% higher than those presented by de Guzman [85]. However, the highest production of steviosides in the Caribbean region has been intensely reported by other studies [2,3,41,104,105]. In accordance with Giraldo et al. [106], the strong difference in Stv production may be strongly linked to the genotype used in the production of SvGly, explaining the search for genotypes with higher yield or genetic manipulation to increase the production of SvGly, particularly RebA. Thus, our study concluded that steviol glycosides could also act as a short-term carbon reserve within the plant, as previously reported in this species [85]. This carbon skeleton could be used to synthesize other carbon molecules, mainly gibberellins, or start other pathways via carbon skeleton metabolism. Based on this information, we can argue that the CO2-enriched atmosphere promotes both AN and the synthesis of glucose, steviosides and RebA, and we can infer that the CO2-enriched atmosphere was beneficial to S. rebaudiana.

5. Conclusions

First, we are unaware of any other study focusing on the cultivation of Stevia rebaudiana under CO2-enriched atmosphere conditions that has evaluated as many parameters as those assessed in this study. The high NPQ values and high concentrations of xanthophyll cycle carotenoids (VAZ) in Stevia rebaudiana are due to a robust mechanism capable of dissipating energy in heat form without damaging the photosystems and still providing reducing power in an efficient manner adequate for the proper functioning of the Calvin–Benson cycle. The results presented here form a robust and consistent thesis that under high pressures of Ci, Stevia rebaudiana can overcome mesophilic and biochemical barriers, increasing its net photosynthesis, its biomass (from which the active compounds are extracted) and the concentration of its main compounds. Under these conditions, Stevia rebaudiana is able to promote its gas exchange, and healthy plants are able to synthesize carbon skeletons as reserves for de novo synthesis of gibberellins and to promote flowering.

Author Contributions

All authors contributed equally. All authors have read and agreed to the published version of the manuscript.

Funding

This research received no external funding.

Institutional Review Board Statement

Not applicable.

Informed Consent Statement

Not applicable.

Data Availability Statement

Not applicable.

Acknowledgments

The authors thank the Facultad de Agronomía, Universidad de Córdoba, Montería, Colombia, for permitting the experiments and the anonymous reviewers that improved this paper. The first author extends special thanks to Jeffrey A Bradley who generously edited and proofread the manuscript for formal English spelling.

Conflicts of Interest

The authors declare no conflict of interest.

References

  1. Bernacchi, C.J.; Singsaas, E.L.; Pimentel, C.; Portis, A.R., Jr.; Long, S.P. Improved temperature response functions for models of Rubisco-limited photosynthesis. Plant Cell Environ. 2001, 24, 253–259. [Google Scholar] [CrossRef]
  2. Jarma-Orozco, A.; Combatt-Baballero, E.; Jaraba-Navas, J. Growth and development of Stevia rebaudiana Bert., in high and low levels of radiation. Curr. Plant Biol. 2020, 22, 100144. [Google Scholar] [CrossRef]
  3. Rivera-Avilez, J.A.; Jarma-Orozco, A.; Pompelli, M.F. Stevia rebaudiana Bertoni: The interaction of night interruption on gas exchange, flowering delay, and steviol glycosides synthesis. Horticulturae 2021, 7, 543. [Google Scholar] [CrossRef]
  4. Jagadish, K.S.V.; Kadam, N.N.; Xiao, G.; Melgar, R.J.; Bahuguna, R.N.; Quinones, C.; Tamilselvan, A.; Prasad, P.V.V. Agronomic and physiological responses to high temperature, drought, and elevated CO2 interactions in cereals. In Advances in Agronomy; Sparks, D., Ed.; Academic Press: London, UK, 2014; Volume 127, pp. 111–156. [Google Scholar]
  5. Carr, H.; Björk, M. Parallel changes in non-photochemical quenching properties, photosynthesis and D1 levels at sudden, prolonged irradiance exposures in Ulva fasciata Delile. J. Photoch. Photobio. B 2007, 87, 18–26. [Google Scholar] [CrossRef]
  6. Nishiyama, Y.; Allakhverdiev, S.I.; Murata, N. A new paradigm for the action of reactive oxygen species in the photoinhibition of photosystem II. Biochim. Biophys. Acta 2006, 1757, 742–749. [Google Scholar] [CrossRef] [Green Version]
  7. Pokorska, B.; Romanowska, E. Photoinhibition and D1 protein degradation in mesophyll and agranal bundle sheath thylakoids of maize. Funct. Plant Biol. 2007, 34, 844–852. [Google Scholar] [CrossRef]
  8. Rintamäki, E.; Salo, R.; Aro, E.-M. Rapid turnover of the D1 reaction-center protein of photosystem II as a protection mechanisms against photoinhibition in a moss Ceratodon purpureus (Hedw.) Brid. Planta 1994, 193, 520–529. [Google Scholar] [CrossRef]
  9. Bernacchi, C.J.; Portis, A.R.; Nakano, H.; von Caemmerer, S.; Long, S.P. Temperature response of mesophyll conductance. Implications for the determination of Rubisco enzyme kinetics and for limitation to photosynthesis in vivo. Plant Physiol. 2002, 130, 1992–1998. [Google Scholar] [CrossRef] [Green Version]
  10. DaMatta, F.M.; Maestri, M.; Mosquim, P.R.; Barros, R.S. Photosynthesis in coffee (Coffea arabica and C. canephora) as affected by winter and summer conditions. Plant Sci. 1997, 128, 43–50. [Google Scholar] [CrossRef]
  11. Niyogi, K.K.; Björkman, O.; Grossman, A.E. The roles of specific xanthophylls in photoprotection. Proc. Natl. Acad. Sci. USA 1997, 94, 14162–14167. [Google Scholar] [CrossRef]
  12. Pinto, A.M.F.; von Sperling, E.; Moreira, R.M. Chlorophyll-a determination via continuous measurement of plankton fluorescence: Methodology development. Water Res. 2001, 35, 3977–3981. [Google Scholar] [CrossRef]
  13. Wullschleger, S.D. Biochemical limitations to carbon assimilation in C3 plants—A retrospective analysis of the A/Ci curves from 109 species. J. Exp. Bot. 1993, 44, 907–920. [Google Scholar] [CrossRef]
  14. Levine, L.H.; Kasahara, H.; Kopka, J.; Erban, A.; Fehrl, I.; Kaplan, F.; Zhao, W.; Littelle, R.C.; Guy, C.; Wheeler, R.; et al. Physiologic and metabolic responses of wheat seedlings to elevated and super-elevated carbon dioxide. Adv. Space Res. 2008, 42, 1917–1928. [Google Scholar] [CrossRef]
  15. Possell, M.; Hewitt, C.N. Gas exchange and photosynthetic performance of the tropical tree Acacia nigrescens when grown in different CO2 concentrations. Planta 2009, 229, 837–846. [Google Scholar] [CrossRef] [PubMed]
  16. Flexas, J.; Díaz-Espejo, A.; Conesa, M.A.; Coopman, R.E.; Douthe, C.; Gago, J.; Gallé, A.; Galmés, J.; Medrano, H.; Ribas-Carbo, M.; et al. Mesophyll conductance to CO2 and Rubisco as targets for improving intrinsic water use efficiency in C3 plants. Plant Cell Environ. 2016, 39, 965–982. [Google Scholar] [CrossRef]
  17. Grassi, G.; Magnani, F. Stomatal, mesophyll conductance and biochemical limitations to photosynthesis as affected by drought and leaf ontogeny in ash and oak trees. Plant Cell Environ. 2005, 28, 834–849. [Google Scholar] [CrossRef]
  18. Farquhar, G.D.; von Caemmerer, S.; Berry, J.A. A biochemical model of photosynthetic CO2 assimilation in leaves of C3 species. Planta 1980, 149, 78–90. [Google Scholar] [CrossRef] [PubMed] [Green Version]
  19. Vu, J.C.V.; Allen, L.H., Jr.; Boote, K.J.; Bowes, G. Effects of elevated CO2 and temperature on photosynthesis and Rubisco in rice and soybean. Plant Cell Environ. 1997, 20, 68–76. [Google Scholar] [CrossRef]
  20. Fan, Y.; Zhong, Z.; Zhang, X. Determination of photosynthetic parameters Vcmax and Jmax for a C3 plant (spring hulless barley) at two altitudes on the Tibetan Plateau. Agric. For. Meteorol. 2011, 151, 1481–1487. [Google Scholar] [CrossRef]
  21. Bowes, G. Facing the inevitable: Plants and increasing atmospheric CO2. Annu. Rev. Plant Physiol. Plant Mol. Biol. 1993, 44, 309–332. [Google Scholar] [CrossRef]
  22. Gorthi, A.; Volenec, J.J.; Welp, L.R. Stomatal response in soybean during drought improves leaf-scale and field-scale water use efficiencies. Agric. For. Meteorol. 2019, 27, 107629. [Google Scholar] [CrossRef]
  23. Aranjuelo, I.; Erice, G.; Nogués, S.; Morales, F.; Irigoyen, J.J.; Sánchez-Díaz, M. The mechanism(s) involved in the photoprotection of PSII at elevated CO2 in nodulated alfalfa plants. Environ. Exp. Bot. 2008, 64, 295–306. [Google Scholar] [CrossRef] [Green Version]
  24. Long, S.P. Modification of the response of photosynthetic productivity to rising temperature by atmospheric CO2 concentrations: Has its importance been underestimated? Plant Cell Environ. 1991, 14, 729–739. [Google Scholar] [CrossRef]
  25. Alonso, A.; Perez, P.; Morcuende, R.; Martinez-Carrasco, R. Future CO2 concentrations, though not warmer temperatures, enhance wheat photosynthesis temperature responses. Physiol. Plant 2008, 132, 102–112. [Google Scholar] [CrossRef] [PubMed] [Green Version]
  26. von Caemmerer, S.; Lawson, T.; Oxborough, K.; Baker, N.R.; Andrews, T.J.; Raines, C.A. Stomatal conductance does not correlate with photosynthetic capacity in transgenic tobacco with reduced amounts of rubisco. J. Exp. Bot. 2004, 55, 1157–1166. [Google Scholar] [CrossRef] [PubMed]
  27. Medlyn, B.E.; Badeck, F.-H.; De Pury, D.G.G.; Barton, C.V.M.; Broadmeadow, M.; Ceulemans, R.; De Angelis, P.; Forstreuter, M.; Jach, M.E.; Kellomäki, S.; et al. Effects of elevated [CO2] on photosynthesis in European forest species: A meta-analysis of model parameters. Plant Cell Environ. 1999, 22, 1475–1495. [Google Scholar] [CrossRef]
  28. Sharkey, T.D. What gas exchange data can tell us about photosynthesis. Plant Cell Environ. 2015, 39, 1161–1163. [Google Scholar] [CrossRef]
  29. Bellasio, C.; Beerling, D.J.; Griffiths, H. An Excel tool for deriving key photosynthetic parameters from combined gas exchange and chlorophyll fluorescence: Theory and practice. Plant Cell Environ. 2016, 39, 1180–1197. [Google Scholar] [CrossRef]
  30. Atkinson, C.J.; Taylor, J.M.; Wilkins, D.; Besford, R.T. Effects of elevated CO2 on chloroplast components, gas exchange and growth of oak and cherry. Tree Physiol. 1997, 17, 319–325. [Google Scholar] [CrossRef] [Green Version]
  31. Sharkey, T.D. Photosynthesis in intact leaves of C3 plants: Physics, physiology and rate limitations. Bot. Rev. 1985, 51, 53–105. [Google Scholar] [CrossRef]
  32. Shaheen, H.; Mustafa, A.; Ulfat, A. Crop production in response to elevated CO2: Grain yield and quality. In Sustainable Crop Productivity and Quality Under Climate Change Responses of Crop Plants to Climate Change; Liu, F., li, X., Hogy, P., Jiang, D., Brestic, M., liu, B., Eds.; Academic Press: London, UK, 2022; pp. 21–42. [Google Scholar]
  33. Pimentel, C. Carbon metabolism of crops and the increase of atmospheric CO2 and O3: Situation and previsions. Bragantia 2011, 70, 1–12. [Google Scholar] [CrossRef] [Green Version]
  34. Babani, F.; Langsdorf, G.; Knapp, M.; Buschmann, C.; Lichtenthaler, H.K. UV-A induced fluorescence images in sun and shade leaves. BMC Plant Biol. 2005, 5, S3. [Google Scholar] [CrossRef] [Green Version]
  35. Hajihashemi, S.; Noedoost, F.; Geuns, J.M.C.; Djalovic, I.; Siddique, K.H.M. Effect of cold stress on photosynthetic traits, carbohydrates, morphology, and anatomy in nine cultivars of Stevia rebaudiana. Front. Plant Sci. 2018, 9, 1430. [Google Scholar] [CrossRef] [PubMed] [Green Version]
  36. Baker, N.R. Chlorophyll fluorescence: A probe of photosynthesis in vivo. Annu. Rev. Plant Biol. 2008, 59, 89–113. [Google Scholar] [CrossRef] [PubMed] [Green Version]
  37. Acosta-Motos, J.R.; Ortuño, M.F.; Bernal-Vicente, A.; Diaz-Vivancos, P.; Sanchez-Blanco, M.J.; Hernandez, J.A. Plant responses to salt stress: Adaptive mechanisms. Agronomy 2017, 7, 18. [Google Scholar] [CrossRef] [Green Version]
  38. Agronet. La Estevia en Colombia; Oferta y Cosumo. Available online: https://www.agronet.gov.co/Paginas/inicio.aspx (accessed on 23 October 2022).
  39. Basharat, S.; Huang, Z.; Gong, M.; Lv, X.; Ahmed, A.; Hussain, I.; Li, J.; Du, G.; Liu, L. A review on current conventional and biotechnical approaches to enhance biosynthesis of steviol glycosides in Stevia rebaudiana. Chin. J. Chem. Eng. 2021, 30, 92–104. [Google Scholar] [CrossRef]
  40. Benhmimou, A.; Ibriz, M.; Al Faïz, C.; Gaboun, F.; Douaik, A.; Amchra, F.Z.; Khiraoui, A.; Lage, M. Effects of planting density and harvesting time on productivity of natural sweetener plant (Stevia rebaudiana Bertoni.) in Larache Region, Morocco. Int. J. Plant Res. 2017, 7, 83–89. [Google Scholar] [CrossRef]
  41. Rodriguez-Paez, L.A.; Hernandez-Burgos, J.L.; Caballero, E.M.C.; Jarma-Orozco, A.; Santos, J.M.P. Rendimiento y calidad de hojas de Stevia rebaudiana Bert. bajo la oferta edafológica y dos niveles de radiación en cinco regiones de Colombia. Rev. UDCA Act. Div. Cient. 2016, 9, 77–85. [Google Scholar]
  42. Cantabella, D.; Piqueras, A.; Acosta-Motos, J.R.; Bernal-Vicente, A.; Hernández, J.A.; Díaz-Vivancos, P. Salt-tolerance mechanisms induced in Stevia rebaudiana Bertoni: Effects on mineral nutrition, antioxidative metabolism and steviol glycoside content. Plant Physiol. Biochem. 2017, 115, 484–496. [Google Scholar] [CrossRef]
  43. Castillejo-Morales, A.; Jarma-Orozco, A.; Pompelli, M.F. Physiological and morphological features denote that salt stress in Stevia rebaudiana is based on nonstomatic instead of stomatic limitation. Rev. Colombiana Cien Hortíc 2021, 15, e12928. [Google Scholar] [CrossRef]
  44. Hajihashemi, S.; Geuns, J.M.C. Gene transcription and steviol glycoside accumulation in Stevia rebaudiana under polyethylene glycol-induced drought stress in greenhouse cultivation. FEBS Open Bio 2016, 6, 937–944. [Google Scholar] [CrossRef] [PubMed]
  45. Yoneda, Y.; Shimizu, H.; Nakashima, H.; Miyasaka, J.; Ohdoi, K. Effects of light intensity and photoperiod on improving steviol glycosides content in Stevia rebaudiana (Bertoni) Bertoni while conserving light energy consumption. J. Appl. Res. Med. Aromat. Plants 2017, 7, 64–73. [Google Scholar] [CrossRef]
  46. Ceunen, S.; Werbrouck, S.; Geuns, J.M.C. Stimulation of steviol glycoside accumulation in Stevia rebaudiana by red LED light. J Plant Physiol. 2012, 169, 749–752. [Google Scholar] [CrossRef] [PubMed]
  47. Pico-González, A.I.; Aramendiz-Tatis, H.; Pérez-Polo, D.J. Caracterización morfoagronómica de 25 clones de estevia (Stevia rebaudiana Bertoni.), en condiciones del valle del Sinú medio. Temas Agrarios 2020, 25, 106–116. [Google Scholar] [CrossRef]
  48. Pompelli, M.F.; Mendes, K.R.; Ramos, M.V.; Santos, J.N.B.; Youssef, D.T.A.; Pereira, J.D.; Endres, L.; Jarma-Orozco, A.; Solano-Gomes, R.; Jarma-Arroyo, B.; et al. Mesophyll thickness and sclerophylly among Calotropis procera morphotypes reveal water-saved adaptation to environments. J. Arid Land 2019, 11, 795–810. [Google Scholar] [CrossRef] [Green Version]
  49. Caballero, E.M.C. Distribución espacial de la salinidad en suelos del área de influencia de la desembocadura del río Sinú (Córdoba, Colombia). Rev. UDCA Act. Div. Cient. 2014, 17, 433–443. [Google Scholar]
  50. Garten, M. Take urgent action to combat climate change and its impacts. In United Nations Statistics Division Development Data and Outreach Branch; United Nations: New York, NY, USA, 2020; Available online: https://unstats.un.org/sdgs/report/2021/goal-13/ (accessed on 10 September 2022).
  51. Moualeu-Ngangue, D.P.; Chen, T.-W.; Stützel, H. A new method to estimate photosynthetic parameters through net assimilation rate—Intercellular space CO2 concentration (A-Ci) curve and chlorophyll fluorescence measurements. New Phytol. 2017, 213, 1543–1554. [Google Scholar] [CrossRef]
  52. Pompelli, M.F.; Ferreira, P.P.B.; Chaves, A.R.M.; Figueiredo, R.C.Q.Q.; Martins, A.O.; Jarma-Orozco, A.; Batista-Silva, W.; Endres, L.; Araújo, W.L. Physiological, metabolic, and stomatal adjustments in response to salt stress in Jatropha curcas. Plant Physiol. Biochem. 2021, 168, 116–127. [Google Scholar] [CrossRef]
  53. Wang, W.; Wang, C.; Pan, D.; Zhang, Y.; Luo, B.; Ji, J. Effects of drought stress on photosynthesis and chlorophyll fluorescence images of soybean (Glycine max) seedlings. Int. J. Agric. Biol. Eng. 2018, 11, 196–201. [Google Scholar] [CrossRef] [Green Version]
  54. Borek, M.; Baczek-Kwinta, R.; Rapacz, M. Photosynthetic activity of variegated leaves of Coleus × hybridus hort. cultivars characterised by chlorophyll fluorescence techniques. Photosynthetica 2016, 54, 331–339. [Google Scholar] [CrossRef] [Green Version]
  55. Pompelli, M.F.; Martins, S.C.V.; Antunes, W.C.; Chaves, A.R.M.; DaMatta, F.M. Photosynthesis and photoprotection in coffee leaves is affected by nitrogen and light availabilities in winter conditions. J. Plant Physiol. 2010, 167, 1052–1060. [Google Scholar] [CrossRef] [PubMed]
  56. Pompelli, M.F.; França, S.C.S.; Tigre, R.C.; Oliveira, M.T.; Sacilot, M.; Pereira, E.C.G. Spectrophotometric determinations of chloroplastidic pigments in acetone, ethanol and dimethylsulphoxide. Rev. Bras. Biol. 2013, 11, 52–58. [Google Scholar]
  57. Geigenberger, P.; Stitt, M. Sucrose synthase catalyses a readily reversible reaction in vivo in developing potato tubers and other plant tissues. Planta 1993, 189, 329–339. [Google Scholar] [CrossRef] [PubMed]
  58. Sulpice, R.; Tschoep, H.; Von Korff, M.; Bussis, D.; Usadel, B.; Hohne, M.; Witucka-Wall, H.; Altmann, T.; Stitt, M.; Gibon, Y. Description and applications of a rapid and sensitive non-radioactive microplate-based assay for maximum and initial activity of D-Ribulose-1,5-bisphosphate carboxylase/oxygenase. Plant Cell Environ. 2007, 30, 1163–1175. [Google Scholar] [CrossRef] [PubMed]
  59. Vescovi, M.; Zaffagnini, M.; Festa, M.; Trost, P.; Lo Schiavo, F.; Costa, A. Nuclear accumulation of cytosolic glyceraldehyde-3-phosphate dehydrogenase in cadmium-stressed Arabidopsis roots. Plant Phvsiol. 2013, 162, 333–346. [Google Scholar] [CrossRef] [PubMed] [Green Version]
  60. Kulbe, K.D.; Bojanovski, M. 3-Phosphoglycerate kinase from bovine liver and yeast. Methods Enzymol. 1982, 90, 115–120. [Google Scholar] [CrossRef]
  61. DaMatta, F.M.; Cunha, R.L.; Antunes, W.C.; Martins, S.C.V.; Araujo, W.L.; Fernie, A.R.; Moraes, G.A.B.K. In field-grown coffee trees source-sink manipulation alters photosynthetic rates, independently of carbon metabolism, via alterations in stomatal function. New Phytol. 2008, 178, 348–357. [Google Scholar] [CrossRef] [Green Version]
  62. Hernández-Fernandéz, I.A.; Jarma-Orozco, A.; Pompelli, M.F. Allometric models for non-destructive leaf area measurement of stevia: An in depth and complete analysis. Hortic Bras. 2021, 39, 207–217. [Google Scholar] [CrossRef]
  63. CoreTeam. The R Project for Statistical Computing Version 2022.07. Available online: https://www.r-project.org/about.html (accessed on 15 April 2020).
  64. Li, S.; Wang, X.; Liu, X.; Thompson, A.J.; Liu, F. Elevated CO2 and high endogenous ABA level alleviate PEG-induced short-term osmotic stress in tomato plants. Environ. Exp. Bot. 2022, 194, 104763. [Google Scholar] [CrossRef]
  65. Abdelhakim, L.O.A.; Zhou, R.; Ottosen, C.-O. Physiological responses of plants to combined drought and heat under elevated CO2. Agronomy 2022, 12, 2526. [Google Scholar] [CrossRef]
  66. Rogers, A.; Humphries, S.W. A mechanistic evaluation of photosynthetic acclimation at elevated CO2. Glob. Chang. Biol. 2000, 6, 1005–1011. [Google Scholar] [CrossRef] [Green Version]
  67. Cen, Y.-P.; Sage, R.F. The regulation of rubisco activity in response to variation in temperature and atmospheric CO2 partial pressure in sweet potato. Plant Phvsiol. 2005, 139, 979–990. [Google Scholar] [CrossRef] [PubMed] [Green Version]
  68. Hasegawa, T.; Sakai, H.; Tokida, T.; Nakamura, H.; Zhu, C.; Usui, Y.; Yoshimoto, M.; Fukuoka, M.; Wakatsuki, H.; Katayanagi, N.; et al. Rice cultivar responses to elevated CO2 at two free-air CO2 enrichment (FACE) sites in Japan. Funct Plant Biol. 2013, 40, 148–159. [Google Scholar] [CrossRef]
  69. Kang, H.; Zhu, T.; Zhang, Y.; Ke, X.; Sun, W.; Hu, Z.; Zhu, X.; Shen, H.; Huang, Y.; Tang, Y. Elevated CO2 enhances dynamic photosynthesis in rice and wheat. Front. Plant Sci. 2021, 12, 727374. [Google Scholar] [CrossRef] [PubMed]
  70. Prasad, P.V.V.; Boote, K.J.; Allen, L.H. Longevity and temperature response of pollen as affected by elevated growth temperature and carbon dioxide in peanut and grain sorghum. Environ. Exp. Bot. 2011, 70, 51–57. [Google Scholar] [CrossRef]
  71. Tan, S.-L.; Huang, X.; Li, W.-Q.; Zhang, S.-B.; Huang, W. Elevated CO2 concentration alters photosynthetic performances under fluctuating light in Arabidopsis thaliana. Cells 2021, 10, 2329. [Google Scholar] [CrossRef] [PubMed]
  72. Kumar, A.; Li, C.; Portis, A.R. Arabidopsis thaliana expressing a thermostable chimeric Rubisco activase exhibits enhanced growth and higher rates of photosynthesis at moderately high temperatures. Photosynth Res. 2009, 100, 143–153. [Google Scholar] [CrossRef]
  73. Mendes, K.R.; Marenco, R.A.; Nascimento, H.C.S. Maximum carboxylation velocity of rubisco and maximum rate of electron transport in saplings in response to variations in environmental factors in central Amazonia. Cienc Florest 2017, 27, 947–959. [Google Scholar] [CrossRef] [Green Version]
  74. Ellsworth, D.S.; Reich, P.B.; Naumburg, E.S.; Koch, G.W.; Kubiske, M.E.; Smith, S.D. Photosynthesis, carboxylation and leaf nitrogen responses of 16 species to elevated pCO2 across four free-air CO2 enrichment experiments in forest, grassland and desert. Glob. Chang. Biol. 2004, 10, 2121–2138. [Google Scholar] [CrossRef] [Green Version]
  75. Onoda, Y.; Hikosaka, K.; Hirose, T. Seasonal change in the balance between capacities of RuBP carboxylation and RuBP regeneration affects CO2 response of photosynthesis in Polygonum cuspidatum. J. Exp. Bot. 2005, 56, 755–763. [Google Scholar] [CrossRef]
  76. Ruiz-Vera, U.M.; De Souza, A.P.; Ament, M.R.; Gleadow, R.M.; Ort, D.R. High sink strength prevents photosynthetic down-regulation in cassava grown at elevated CO2 concentration. J. Exp. Bot. 2021, 72, 542–560. [Google Scholar] [CrossRef] [PubMed]
  77. Li, F.; Kang, S.; Zhang, J. Interactive effects of elevated CO2, nitrogen and drought on leaf area, stomatal conductance, and evapotranspiration of wheat. Agric. Water Manag. 2004, 67, 221–233. [Google Scholar] [CrossRef]
  78. Ma, Y.; Xie, Y.; Ha, R.; Bing, C.; Lihua, S. Effects of elevated CO2 on photosynthetic accumulation, sucrose metabolism-related enzymes, and genes identification in goji berry (Lycium barbarum). Front. Plant Sci. 2021, 12, 643555. [Google Scholar] [CrossRef] [PubMed]
  79. Castaño, M.A.M.; Chica, R.H.A.; Obando, B.D.; Riaño, H.N.M. Gas exchange in Cordia alliodora, Alnus acuminata and Pachira quinata in Colombia. Cenicafe 2012, 63, 93–110. [Google Scholar]
  80. Madan, P.; Jagadish, S.V.K.; Craufurd, P.Q.; Fitzgerald, M.; Lafarge, T.; Wheeler, T.R. Effect of elevated CO2 and high temperature on seed-set and grain quality of rice. J. Exp. Bot. 2012, 63, 3843–3852. [Google Scholar] [CrossRef] [PubMed] [Green Version]
  81. Kizildeniz, T.; Pascual, I.; Irigoyen, J.J.; Morales, F. Future CO2, warming and water deficit impact white and red Tempranillo grapevine: Photosynthetic acclimation to elevated CO2 and biomass allocation. Physiol Plant 2021, 172, 1779–1794. [Google Scholar] [CrossRef]
  82. Van Oosten, J.-J.; Besford, R.T. Sugar feeding mimics effect of acclimation to high CO2-rapid down regulation of RuBisCo small subunit transcripts but not of the large subunit transcripts. J. Plant Physiol. 1994, 143, 306–312. [Google Scholar] [CrossRef]
  83. Rivero, R.M.; Mittler, R.; Blumwald, E.; Zandalinas, S.I. Developing climate-resilient crops: Improving plant tolerance to stress combination. Plant J. 2022, 109, 373–389. [Google Scholar] [CrossRef]
  84. Johnson, A.A.T. Enhancing the chelation capacity of rice to maximise iron and zinc concentrations under elevated atmospheric carbon dioxide. Funct. Plant Biol. 2013, 40, 101–108. [Google Scholar] [CrossRef]
  85. de Guzman, R.; Midmore, D.J.; Walsh, K.B. Do steviol glycosides act either as a carbon storage pool or in osmoregulation within leaves of Stevia rebaudiana? J. Nat. Prod. 2018, 81, 2357–2363. [Google Scholar] [CrossRef]
  86. Hussin, S.; Geissler, N.; El-Far, M.M.M.; Koyro, H.W. Effects of salinity and short-term elevated atmospheric CO2 on the chemical equilibrium between CO2 fixation and photosynthetic electron transport of Stevia rebaudiana Bertoni. Plant Physiol. Biochem. 2017, 118, 178–186. [Google Scholar] [CrossRef] [PubMed]
  87. Marenco, R.A.; Gonçalves, J.F.C.; Vieira, G. Leaf gas exchange and carbohydrates in tropical trees differing in successional status in two light environments in central Amazonia. Tree Physiol. 2001, 21, 1311–1318. [Google Scholar] [CrossRef] [PubMed] [Green Version]
  88. Ramos, J.; Grace, J. The effects of shade on the gas exchange of seedlings of four tropical trees from Mexico. Funct Ecol. 1990, 4, 667–677. [Google Scholar] [CrossRef]
  89. Terashima, I.; Hikosaka, K. Comparative ecophysiology of leaf and canopy photosynthesis. Plant Cell Environ. 1995, 18, 1111–1128. [Google Scholar] [CrossRef]
  90. Mendes, K.R.; Granja, J.A.A.; Ometto, J.P.; Antonino, A.C.D.; Menezes, R.S.C.; Pereira, E.C.; Pompelli, M.F. Croton blanchetianus modulates its morphophysiological responses to tolerate drought in a tropical dry forest. Funct. Plant Biol. 2017, 44, 1039–1051. [Google Scholar] [CrossRef] [PubMed]
  91. Mendes, K.R.; Batista-Silva, W.; Dias-Pereira, J.; Pereira, M.P.S.; Souza, E.V.; Serrão, J.E.; Granja, J.A.A.; Pereira, E.C.; Gallacher, D.J.; Mutti, P.R.; et al. Leaf plasticity across wet and dry seasons in Croton blanchetianus (Euphorbiaceae) at a tropical dry forest. Sci. Rep. 2022, 12, 954. [Google Scholar] [CrossRef]
  92. Albert, K.R.; Ro-Poulsen, H.; Mikkelsen, T.N.; Michelsen, A.; Van Der Linden, L.; Beier, C. Effects of elevated CO2, warming and drought episodes on plant carbon uptake in a temperate heath ecosystem are controlled by soil water status. Plant Cell Environ. 2011, 34, 1207–1222. [Google Scholar] [CrossRef]
  93. Lawlor, D.W.; Cornic, G. Photosynthetic carbon assimilation and associated metabolism in relation to water deficits in higher plants. Plant Cell Environ. 2002, 25, 275–294. [Google Scholar] [CrossRef] [Green Version]
  94. Demmig-Adams, B.; Adams III, W.W. Photoprotection in an ecological context: The remarkable complexity of thermal energy dissipation. New Phytol. 2006, 172, 11–21. [Google Scholar] [CrossRef]
  95. Werner, C.; Ryel, R.J.; Correia, O.; Beyschlag, W. Effects of photoinhibition on whole-plant carbon gain assessed with a photosynthesis model. Plant Cell Environ. 2001, 24, 27–40. [Google Scholar] [CrossRef]
  96. Zu, X.G.; Ort, D.R.; Whitmarsh, J.; Long, S.P. The slow reversibility of photosystem II thermal energy dissipation on transfer from high to low light may cause large losses in carbon gain by crop canopies: A theoretical analysis. J. Exp. Bot. 2004, 55, 1167–1175. [Google Scholar] [CrossRef]
  97. Miyata, K.; Noguchi, K.; Terashima, I. Cost and benefit of the repair of photodamaged photosystem II in spinach leaves: Roles of acclimation to growth light. Photosynth Res. 2012, 113, 165–180. [Google Scholar] [CrossRef] [PubMed]
  98. Bernardo, S.; Rodrigo, M.J.; Vives-Peris, V.; Gómez-Cadenas, A.; Zacarías, L.; Machado, N.; Moutinho-Pereira, J.; Dinis, L.-T. Fine-tuning of grapevine xanthophyll-cycle and energy dissipation under Mediterranean conditions by kaolin particle-film. Sci. Hortic. Amst. 2022, 291, 110584. [Google Scholar] [CrossRef]
  99. Filella, I.; Porcar-Castell, A.; Munné-Bosch, S.; Bäck, J.; Garbulsky, M.F.; Peñuelas, J. PRI assessment of long-term changes in carotenoids/chlorophyll ratio and short-term changes in de-epoxidation state of the xanthophyll cycle. Int. J. Remote Sens. 2009, 30, 4443–4455. [Google Scholar] [CrossRef]
  100. García-Plazaola, J.I.; López-Pozo, M.; Fernández-Marín, B. Xanthophyll cycles in the juniper haircap moss (Polytrichum juniperinum) and Antarctic hair grass (Deschampsia antarctica) on Livingston Island (South Shetland Islands, Maritime Antarctica). Polar Biol. 2022, 45, 1247–1256. [Google Scholar] [CrossRef]
  101. Rockholm, D.C.; Yamamoto, H.Y. Violaxanthin de-epoxidase (purification of a 43-kilodalton lumenal protein from lettuce by lipid-afinity precipitation with monogalactosyldiacylglyceride. Plant Physiol. 1996, 110, 697–703. [Google Scholar] [CrossRef] [Green Version]
  102. Kromdijk, J.; Głowacka, K.; Leonelli, L.; Gabilly, S.T.; Iwai, M.; Niyogi, K.K.; Long, S.P. Improving photosynthesis and crop productivity by accelerating recovery from photoprotection. Science 2016, 354, 857–861. [Google Scholar] [CrossRef] [Green Version]
  103. Tsai, I.-H.; Murthy, S.N.P.; Steck, T.L. Effect of red cell membrane binding on the catalytic activit of glyceraldehyde-3-phosphate dehydrogenase. J. Biol. Chem. 1982, 257, 1438–1442. [Google Scholar] [CrossRef]
  104. Putnik, P.; Bezuk, I.; Barba, F.J.; Lorenzo, J.M.; Polunić, I.; Bursać, D.K. Sugar reduction: Stevia rebaudiana Bertoni as a natural sweetener. In Agri-Food Industry Strategies for Healthy Diets and Sustainability; Barba, F.J., Putnik, P., Kovačević, D.B., Eds.; Academic Press: San Diego, CA, USA, 2020; pp. 123–152. [Google Scholar]
  105. Francisco, F.; Pereira, G.P.; Machado, M.P.; Kanis, L.A.; Deschamps, C. Characterization of Stevia rebaudiana Bertoni A accessions cultived in southern Brazil. J. Agric. Sci. 2018, 10, 353–363. [Google Scholar] [CrossRef]
  106. Giraldo, C.; Marín, L.; Habeych, D. Obtención de edulcorantes de Stevia rebaudiana Bertoni. Rev. CENIC Cienc Biol. 2005, 36, 3–10. [Google Scholar]
Figure 1. (A) Daily photosynthetically active radiation (PAR) registered from 07:00 h to 18:00 h solar time in inside chambers (blue symbols) and outside chambers (red symbols) during all experiments (90 days). (B) Daily integrated PAR registered from 07:00 h to 18:00 h solar time. (C) Maximum and minimum temperature registered inside (in) and outside (out) chambers plus relative humidity registered in (cyan) and out (light green). In (A), values followed by asterisks (*) denote statistically significant differences between PAR measured inside and outside of chambers, and in (B), values followed by different lowercase letters denote significance (p < 0.0001). Each value denotes mean (±SE).
Sustainability 14 14269 g001
Figure 2. Photosynthetically active radiation (PAR) x net photosynthesis curves (AN) (A) and intercellular CO2 concentration (Ci) x net photosynthesis curves (AN) (B) of 2 genotypes of Stevia rebaudiana before CO2 enrichment in greenhouses (0-day plants). In PAR x AN curves, the R2 and Pvalue are shown after single non-rectangular I, 3 hyperbola curves. In Ci x AN curves, spheres denote the measured values, filled lines show the photosynthetic limitation imposed by the carboxylation rate of rubisco (AN-Ci) and dashed lines indicate the photosynthetic limitation imposed by electron transport rate (AN-J). The vertical solid line shows the value of Ci at which the transition from photosynthesis imposed by the carboxylation rate of rubisco (AN-Ci) to photosynthesis imposed by electron transport rate (AN-J) occurs, and the dashed vertical line denotes the equilibrium point at which photosynthesis is equally limited by both carboxylation rate and electron transport. The light compensation point (LCP), light saturation point (LSP), dark respiration (Rd) and maximum rate of electron transport for the given light intensity (JMAX) were estimated.
Sustainability 14 14269 g002
Figure 3. Relationship between net photosynthesis and maximum rate of electron transport (JMAX) and maximum carboxylation rate of rubisco (VcMAX), measured in G4 (left y-axis; spheres red and blue) and G16 (right y-axis; spheres green and orange) of Stevia rebaudiana after 45 days in 800 μmol CO2 mol1 enriched greenhouses. Each sphere denotes one plant (n = 10). Both R2 and p value are shown.
Sustainability 14 14269 g003
Figure 4. Net photosynthesis (AN; (A)), stomatic conductance (gs; (B)) and internal-to-ambient CO2 concentration (Ci:Ca ratio; (C)) of 2 genotypes (G4 and G16) of Stevia rebaudiana after 0, 45 and 90 days in CO2 enrichment in greenhouses. Means followed by capital letters denote significance between CO2 enrichment in greenhouses in the same genotype and time of CO2 application; lowercase letters denote significance between time of applied CO2 in the same genotype and CO2 concentration, and asterisks (*) denote significance between genotypes in the same CO2 concentration and time of CO2. The values are the means of each of the features. n = 5.
Sustainability 14 14269 g004
Figure 5. Relationship between the ratio of electron transport rate (ETR) and net photosynthesis (AN) versus stomatal conductance (gs) evaluated in genotype 4 (spheres) and 16 (squares) of Stevia rebaudiana under 400 μmol CO2 mol−1 (red symbols), 800 μmol CO2 mol−1 (blue symbols) and 1200 μmol CO2 mol−1 (green symbols) applied for 1 h (filled symbols) or 2 h (open symbols). Each datum represents the mean of 5 true repetitions. Regression coefficient (R2) and p value are shown.
Sustainability 14 14269 g005
Figure 6. Variable-to-maximum (Fv:Fm ratio; (A)) and variable-to-initial (Fv:F0 ratio; (B)) chlorophyll fluorescence and quantum yield of photosystem II (ΦPSII; (C)) of 2 genotypes of Stevia rebaudiana after 0, 45 and 90 days in CO2 enrichment in greenhouses. Means followed by capital letters denote significance between CO2 enrichment in greenhouses in the same genotype and time of CO2 application; lowercase letters denote significance between time of applied CO2 in the same genotype and CO2 concentration, and asterisks (*) denote significance between genotypes in the same CO2 concentration and time of CO2. The values are the means of each of the features. n = 5.
Sustainability 14 14269 g006
Figure 7. Electron transport rate (ETR; (A)), non-photochemical quenching (NPQ; (B)), fractions of absorbed photosynthetic active radiation dissipated as heat (D; (C)) and the fraction neither used in photochemistry nor dissipated thermally (PE; (D)) of 2 genotypes of Stevia rebaudiana after 0, 45 and 90 days in CO2 enrichment in greenhouses. Means followed by capital letters denote significance between CO2 enrichment in greenhouses in the same genotype and time of CO2 application; lowercase letters denote significance between time of applied CO2 in the same genotype and CO2 concentration, and asterisks (*) denote significance between genotypes in the same CO2 concentration and time of CO2. The values are the means of each of the features. n = 05.
Sustainability 14 14269 g007
Figure 8. Chlorophyll fluorescence images of quantum yield of photosystem II (ΦPSII), non-photochemical quenching (NPQ), fractions of absorbed photosynthetic active radiation dissipated as heat (D) and the fraction neither used in photochemistry nor dissipated thermally (PE), measured in leaves of Stevia rebaudiana after 0, 45 and 90 days in CO2 enrichment in greenhouses under 400 μmol mol1, 800 μmol mol1 and 1200 μmol mol1.
Sustainability 14 14269 g008
Figure 9. Chlorophyll a (AC) and chlorophyll b (DF) measured in two genotypes of Stevia rebaudiana after 0 (A,D), 45 (B,E) and 90 (C,F) days in CO2 enrichment in greenhouses. Means followed by capital letters denote significance between CO2 enrichment in greenhouses in the same genotype and time of CO2 application; lowercase letters denote significance between time of applied CO2 in the same genotype and CO2 concentration, and asterisks (*) denote significance between genotypes in the same CO2 concentration and time of CO2. The values are the means of each of the features. n = 05.
Sustainability 14 14269 g009
Figure 10. Relationships between xanthophyll cycle carotenoids (VAZ) and Fv:Fm, Fv:F0, ΦPSII and PE evaluated in 90-day Stevia rebaudiana plants. Each point denotes the mean of 5 true repetitions. Regression coefficient (R2) and Pvalue are shown.
Sustainability 14 14269 g010
Figure 11. (AC) Calvin cycle enzyme activity: rubisco (A), NADPH-glyceraldehyde 3-P dehydrogenase (B), and 3-P phosphoglycerate kinase (C). (DF) Metabolites formed after photosynthesis: glucose (D), fructose (E) and sucrose (F) measured in two genotypes of Stevia rebaudiana after 90 days in CO2 enrichment in greenhouses. Means followed by capital letters denote significance between CO2 enrichment in greenhouses in the same genotype and time of CO2 application; lowercase letters denote significance between time of applied CO2 in the same genotype and CO2 concentration, and asterisks (*) denote significance between genotypes in the same CO2 concentration and time of CO2. The values are the means of each of the features. n = 05.
Sustainability 14 14269 g011
Figure 12. Total stevioside (A) and rebaudioside-A (B) measured in two genotypes of Stevia rebaudiana plants after 90 days in CO2 enrichment in greenhouses. Means followed by capital letters denote significance between CO2 enrichment in greenhouses in the same genotype and time of CO2 application; lowercase letters denote significance between time of applied CO2 in the same genotype and CO2 concentration, and asterisks (*) denote significance between genotypes in the same CO2 concentration and time of CO2. The values are the means of each of the features. n = 05.
Sustainability 14 14269 g012
Figure 13. Multivariate analysis to assess the CO2 enrichment features. (A) Spatial distribution of all analyzed features, showing the strength of each influencing the net photosynthesis (weak and strong lines). The first cluster has more influences on net photosynthesis; however, the second cluster also shares some features such as carotenoid pool and some Calvin–Benson cycle enzymes. In (B), all treatments are displayed in the PC1 and PC2 to show that non-enriched-atmosphere plants show a very distinct pattern compared to CO2-enriched atmosphere plants. All data were measured or estimated in two genotypes of Stevia rebaudiana plants after 90 days in CO2 enrichment in greenhouses. The number before the hyphen denotes the treatment as displayed in Figure 3, while the number after the T denotes the timeline (0 days, 45 days and 90 days). AN, net photosynthesis; Ant, antheraxanthin; Chl a, chlorophyll a; Chl b, chlorophyll b; Ci:Ca, internal-to-ambient CO2 concentration; D, fraction of absorbed photosynthetic active radiation dissipated as heat; DEPS, de-epoxidation state of the xanthophyll cycle; ETR, electron transport rate; ΦPSII, chlorophyll fluorescence and quantum yield of photosystem II; Fru, fructose; G3PDH, NADPH-glyceraldehyde 3-P dehydrogenase; Glu, glucose; gs, stomatal conductance; LDW, leaf dry weight; LN; leaf number plant1, Reb-A, rebaudioside-A; Fv/F0, variable-to-initial chlorophyll fluorescence; Fv/Fm, variable-to-maximum; NPQ, non-photochemical quenching; PC1-2, principal component axis 1 and axis 2; PGK, 3-P phosphoglycerate kinase; RuBisCo, ribulose-1,5-bisphosphate carboxylase/oxygenase; RDW, root dry weight; SDW, shoot dry weight; Stv, total stevioside; Suc, sucrose; TLA, total leaf area; Vio, violaxanthin; Zea, zeaxanthin.
Sustainability 14 14269 g013
Table 1. The values of photosynthetically active radiation and intercellular CO2 concentration curve data of two genotypes of Stevia rebaudiana before CO2 enrichment in greenhouses (time zero). All values were measured in five distinct light and CO2 concentration curves per genotype. The values highlighted with gray denote values in photosynthetically active radiation (PAR) response curves, while the values highlighted with white were extracted from intercellular CO2 concentration (Ci) curves. Different lowercase letters denote significance within genotype in each calculated parameter.
ParametersGenotype 4 (G4)Genotype 16 (G16)
Reference CO2 (mmol mol−1)400400
ANpot (μmol CO2 m−2 s−1)14.41 ± 0.30 b20.80 ± 0.90 a
gs(1200) (mol H2O m−2 s−1)0.54 ± 0.01 a0.39 ± 0.01 b
Light compensation point (LCP) (μmol photons m−2 s−1) 8.81 ± 0.63 a8.82 ± 0.28 a
Light saturation point (LSP) (μmol photons m−2 s−1) 1290.41 ± 106.67 b1977.05 ± 115.40 a
Maximum rate of electron transport (JMAX) (μmol m−2 s−1)92.62 ± 7.57 b167.99 ± 42.43 a
Saturation CO2 (Cisat) (μmol mol−1)799.60 ± 9.38 a701.51 ± 8.25 b
Maximum carboxylation rate of rubisco (VcMAX) (μmol m−2 s−1)57.67 ± 17.64 a45.18 ± 4.14 b
Electron transport rate (J) (μmol m−2 s−1)126.29 ± 2.79 a95.16 ± 5.20 b
Maximum rate of triose phosphate use (TPU) (μmol m−2 s−1)8.23 ± 0.79 a6.34 ± 0.40 b
Day respiration (Rd*) (μmol m−2 s−1)2.00 ± 0.01 a1.94 ± 0.10 a
Rubisco CO2 compensation point (Γ*) (Pa)3.88 ± 0.00 a3.64 ± 0.42 a
Table 2. Photosynthetically active radiation and intercellular CO2 concentration curve data of two genotypes of Stevia rebaudiana measured at 45 and 90 days of CO2 enrichment in greenhouses. All values were measured in five distinct light and CO2 concentration curves per genotype. The values highlighted with gray denote values in photosynthetically active radiation (PAR) response curves, while the values highlighted with white were extracted from intercellular CO2 concentration (Ci) curves. Different uppercase letters denote significance within timeline in the same genotype, and different lowercase letters denote significance within genotype in the same timeline. For more details on abbreviations, see Table 1.
ParametersGenotype 4 (G4)Genotype 16 (G16)
45 Days after90 Days after45 Days after90 Days after
ANpot25.10 ± 2.40 Aa25.44 ± 2.33 Aa25.44 ± 0.88 Aa24.49 ± 1.46 Bb
LCP 7.83 ± 2.22 Aa4.40 ± 0.54 Ab4.67 ± 0.16 Bb5.92 ± 1.02 Aa
LSP 1602.97 ± 106.67 Aa1068.45 ± 39.24 Bb1161.75 ± 60.84 Ab1234.20 ± 52.64 Aa
Cisat809.37 ± 43.20 Ba1105.45.28 Aa101.20 ± 74.41 Aa891.67 ± 16.67 Ab
VcMAX50.51 ± 3.90 Ba66.60 ± 12.02 Aa52.84 ± 7.29 Aa66.67 ± 10.76 Aa
J48.20 ± 2.60 Aa 43.97 ± 1.81 Ba43.14 ± 1.52 Ba47.50 ± 1.91 Aa
TPU3.51 ± 0.47 Aa3.12 ± 0.26 Aa3.27 ± 0.26 Aa3.81 ± 0.70 Aa
Rd*1.55 ± 0.30 Aa1.45 ± 0.29 Aa1.67 ± 0.33 Aa1.33 ± 0.33 Aa
Γ*3.34 ± 0.54 Aa2.11 ± 0.34 Aa2.80 ± 1.08 Aa2.08 ± 0.19 Aa
Table 3. Violaxanthin, antheraxanthin, zeaxanthin, violaxanthin plus zeaxanthin, de-epoxidation state of the xanthophyll cycle (DEPS), and the ratio between xanthophyll cycle pigments and total chlorophyll of two genotypes of Stevia rebaudiana measured at 90 days of CO2 enrichment in greenhouses. Different uppercase letters denote significance within CO2 concentration in the same CO2 time and genotype, lowercase letters denote significance within CO2 concentration in the same CO2 time and genotype and asterisks (*) denote significance within genotype in the same CO2 concentration and CO2 time. All values denote mean (±SD). n = 10.
CO2 timeViolaxanthin (mg kg−1 DW)
Genotype 4Genotype 16
400 μm CO2 mol−1800 μm CO2 mol−11200 μm CO2 mol−1400 μm CO2 mol−1800 μm CO2 mol−11200 μm CO2 mol−1
1 h4.1 ± 0.1 Ca4.9 ± 0.1 Bb6.6 ± 0.3 Ab8.3 ± 0.1 Cb*9.8 ± 0.1 Bb*11.7 ± 0.1 Ab*
2 h4.6 ± 0.3 Ca5.4 ± 0.4 Ba8.9 ± 0.6 Aa10.0 ± 0.4 Ca*11.7 ± 0.5 Ba*20.8 ± 0.6 Aa*
CO2 timeAntheraxanthin (mg kg−1 DW)
Genotype 4Genotype 16
400 μm CO2 mol−1800 μm CO2 mol−11200 μm CO2 mol−1400 μm CO2 mol−1800 μm CO2 mol−11200 μm CO2 mol−1
1 h2.9 ± 0.2 Cb3.4 ± 0.2 Bb5.0 ± 0.0 Ab20.2 ± 0.5 Ba*23.8 ± 0.6 Aa*20.3 ± 0.6 Bb*
2 h5.2 ± 0.1 Ca6.1 ± 0.1 Ba8.1 ± 0.1 Aa16.8 ± 0.6 Cb*19.8 ± 0.7 Bb*51.9 ± 1.4 Aa*
CO2 timeZeaxanthin (mg kg−1 DW)
Genotype 4Genotype 16
400 μm CO2 mol−1800 μm CO2 mol−11200 μm CO2 mol−1400 μm CO2 mol−1800 μm CO2 mol−11200 μm CO2 mol−1
1 h1.2 ± 0.0 Cb1.5 ± 0.0 Bb1.9 ± 0.1 Ab9.1 ± 0.5 Cb*10.6 ± 0.5 Bb*16.8 ± 0.2 Ab*
2 h7.1 ± 0.2 Ca8.3 ± 0.2 Ba9.7 ± 0.3 Aa14.2 ± 0.5 Ca*16.7 ± 0.6 Ba*30.8 ± 0.5 Aa*
CO2 timeViolaxanthin + Zeaxanthin (mg kg−1 DW)
Genotype 4Genotype 16
400 μm CO2 mol−1800 μm CO2 mol−11200 μm CO2 mol−1400 μm CO2 mol−1800 μm CO2 mol−11200 μm CO2 mol−1
1 h5.4 ± 0.1 Cb6.3 ± 0.1 Bb8.6 ± 0.3 Ab17.4 ± 0.5 Cb*20.4 ± 0.5 Bb*28.5 ± 0.2 Ab*
2 h11.7 ± 0.3 Ca13.8 ± 0.4 Ba18.7 ± 0.7 Aa24.2 ± 0.9 Ca*28.5 ± 1.0 Ba*51.6 ± 0.9 Aa*
CO2 timeDEPS
Genotype 4Genotype 16
400 μm CO2 mol−1800 μm CO2 mol−11200 μm CO2 mol−1400 μm CO2 mol−1800 μm CO2 mol−11200 μm CO2 mol−1
1 h0.3 ± 0.0 Ab0.3 ± 0.0 Ab0.3 ± 0.0 Ab0.4 ± 0.0 Aa0.5 ± 0.0 Aa*0.5 ± 0.1 Aa*
2 h0.5 ± 0.0 Aa0.6 ± 0.0 Aa0.5 ± 0.0 Aa0.5 ± 0.0 Aa0.5 ± 0.0 Aa0.5 ± 0.1 Aa
CO2 time(V + A + Z)/(Chl a + Chl b) (mmol mmol−1)
Genotype 4Genotype 16
400 μm CO2 mol−1800 μm CO2 mol−11200 μm CO2 mol−1400 μm CO2 mol−1800 μm CO2 mol−11200 μm CO2 mol−1
1 h0.29 ± 0.01 Bb0.29 ± 0.01 Bb0.49 ± 0.01 Ab1.22 ± 0.01 Cb*1.41 ± 0.03 Ba*2.09 ± 0.07 Ab*
2 h0.62 ± 0.01 Ba0.69 ± 0.02 Ba1.25 ± 0.10 Aa1.44 ± 0.02 Ca*1.76 ± 0.03 Ba*6.05 ± 0.31 Aa*
Publisher’s Note: MDPI stays neutral with regard to jurisdictional claims in published maps and institutional affiliations.

