Article

Industry Linkage and Spatial Co-Evolution Characteristics of Industrial Clusters Based on Natural Semantics—Taking the Electronic Information Industry Cluster in the Pearl River Delta as an Example

1
College of Architecture and Urban Planning, Shenzhen University, Shenzhen 518000, China
2
Shenzhen Leo Design & Development Co., Ltd., Shenzhen 518000, China
*
Authors to whom correspondence should be addressed.
Sustainability 2022, 14(21), 14047; https://doi.org/10.3390/su142114047
Submission received: 26 August 2022 / Revised: 19 October 2022 / Accepted: 22 October 2022 / Published: 28 October 2022

Abstract

:
Identifying industrial clusters and the changes in the spatial representation of these clusters is a basic but challenging issue for understanding and promoting urban and regional development. However, the current evolution characteristics of industrial clusters pay too much attention to the spatial perspective, and some studies analyze the evolution of industrial clusters from the perspective of industrial linkages. It is very important to combine industrial linkages and spatial agglomeration to observe the evolution of industrial clusters. To solve this problem, based on the enterprise big data from 1984 to 2019, this study uses the method based on natural semantics and spatial collaborative aggregation to identify industrial linkages and spatial aggregation of industrial clusters, and takes the electronic information industry cluster in the Pearl River Delta (PRD) region as an example for empirical research. It can be seen from the results that most of the industries in the PRD cluster remain stable, and the industrial linkages and spatial agglomeration within the cluster are increasing. From the overall type of change, fewer industries can maintain high linkage–high proximity, and most industries are mainly concentrated in low linkage–high proximity. Through the combination of semantic and spatial synergy analysis, this study helps urban planners and policymakers understand the changes in industrial linkages and spatial agglomeration of industrial clusters.

1. Introduction

Industrial clusters have long been regarded as the core engine of urban and regional development. New economic geographers have also put forward a series of theories that explain why interrelated firms co-locate in space, form networks, and promote knowledge spillovers and innovation (Van den Berg et al., 2001; Bresnahan & Gambardella, 2004) [1,2]. The famous economist Hirschman (1958) argues that although such aggregation will lead to unbalanced development, it can be conducive to government decision making and help mobilize resources. The key to this encouraged industries with many linkages to other firms (Hirschman, 1958) [3]. The empirical research also shows that the industrial cluster provides the impetus and the method of realization for urban economic aggregation. The aggregation of economic activities reduces the industrial cost, improves the competitive and cooperative relationship between enterprises (Sadik-Zada et al., 2021) [4], and then improves industrial production efficiency, which is very important for regional performance, including innovation and entrepreneurial opportunities (Henderson, 1997; Feldman & Audretsch, 1999; Porter, 2003; Delgado et al., 2014) [5,6,7,8].
Determining regional industrial clusters and understanding the changes in the representativeness of these clusters are of great significance for understanding urban and regional development, especially in areas with rapid development, which is a regional restructuring change brought about by the rapid development of cities and economies (Yang et al., 2012) [9]. The existing research on the evolution of industrial clusters mainly focuses on the spatial perspective, exploring why enterprises gather in space and the characteristics of spatial changes (Searle et al., 2018) [10]. The research objects of spatial evolution mainly focus on manufacturing (Carlino, 1982) [11], services (Amin & Thrift, 1992) [12], and high-tech industries (Arbia et al., 2012; Kowalski & Marcinkowski, 2014) [13,14]. For example, China’s manufacturing industry is increasingly gathering along the eastern coast (Wen, 2004; Long & Zhang, 2012) [15,16], 40–60% of Canada’s manufacturing industry tends to spatial agglomeration (Behrens & Bougna, 2015) [17], and 71% of Germany’s manufacturing industry tends to geographical concentration (Koh & Riedel, 2014) [18]. Empirical research shows that high-tech industries are affected by the knowledge spillover effect, so they tend to cluster in space (Jaffe et al., 1993; Dauth et al., 2018) [19,20].
Much of the early literature explains why the industrial cluster co-location advantage is successful (Henderson, 1997; He et al., 2007; Turkina et al., 2016) [7,21,22]. For example, to obtain knowledge spillover effects, knowledge-intensive industries tend to be more geographically concentrated; the empirical studies from the United States (Audretsch & Feldman, 1996) [23], France (Maurel & Sédillot, 1999b) [24], and Germany (Dauth et al., 2018) [25] prove this view. But the industrial cluster is different from the industrial aggregation; the geographical co-location is not the same as ensuring the establishment of links and knowledge spillovers (Maskell & Malmberg, 1999) [25]. Firms are not only establishing linkages with firms within the geographical boundaries of industry clusters but are increasingly establishing formal linkages with firms outside the boundaries to connect regional or global production and innovation networks (Bathelt et al., 2004; Owen-Smith & Powell, 2004) [26,27]. Therefore, the success of industrial clusters depends more on their local and cross-local network configuration (Wolfe & Gertler, 2004; Lorenzen & Mudambi, 2013) [28,29]. The existing research on the evolution of industrial clusters pays too much attention to the spatial perspective and ignores the industrial linkages. The success of industrial clusters depends not only on geographical proximity but also on industry ties.
Therefore, this paper considers the two perspectives of space and connection to jointly observe the evolution of industrial clusters. The research objectives were as follows: (1) determining the characteristics of the industry association and spatial co-evolution of an electronic information industry cluster in Pearl River Delta and (2) understanding the evolution types of the industrial cluster. For example, which industries will always maintain industry linkages and spatial synergy? Or there will be spatial agglomeration but cross-local linkages.
The data used in this study were from 3.57 million enterprises, including the business scope and industry codes that exist in Guangdong Province up to the end of 2019. The PRD region is taken as the research area to explore the industrial linkage and spatial collaborative evolution of the electronic information industry cluster. Semantic analysis and the colocation quotient (CLQ) are used to study the industry association and spatial proximity of industrial clusters. In the era of big data, based on data at the enterprise level, it is not only of theoretical significance to study the correlation and evolution process of industrial clusters on a more refined scale, but it can also provide decision support for regional industrial development policies and industrial spatial layout. At the same time, understanding the industrial linkages and spatial characteristics of industrial development not only helps the development of the local economy but also provides a reference for the development of industrial clusters in relevant regions.
The other sections of this article are as follows. The second part reviews the current definition of industrial clusters, industrial linkages, and spatial evolution. The third part introduces the research area, data sources, and methods; the fourth part presents the analysis results; and the fifth is the conclusion and discussion.

2. Literature Review

The existing literature has not reached a unified definition of industrial clusters. There are certain differences in the definition of industrial clusters in different disciplines, but it can be divided into the following three categories according to their different characteristics (Spencer et al., 2010) [30]: (1) Those that emphasize the geographical proximity of industrial clusters and define industrial clusters as the geographical concentration of enterprises and institutions in a certain region (Porter, 1990; Swann et al., 1998; Schmitz & Nadvi, 1999; Morosini, 2004) [31,32,33,34]. (2) Those that emphasize the industrial linkages of industrial clusters. This kind of definition claims that the enterprise connections within the industrial cluster are closer than those outside the cluster, forming an interdependent industrial connection network (Czamanski & Ablas, 1979; De Propris, 2005) [35,36]. (3) Those that emphasize both the industrial connection and the geographical proximity of enterprises. This kind of definition posits that the industrial cluster is the concentration of related enterprises in a geographical area (Rosenfeld, 1997; Swann et al., 1998) [32,37].
Having explained the definition of industrial clusters, the next problem is how to measure the relationship and proximity of industrial clusters (Guo et al., 2019) [38]. The research on the spatial proximity of industrial clusters can be divided into two stages. The first stage is based on the meso–macro unit scale, and the research methods are mainly location quotients (Liu, 2014) [39], the Theil index (Koech & Wynne, 2016) [40], the entropy index (Brülhart & Traeger, 2005) [41], etc., which are used to deal with the data of the official statistical unit, such as employment population, GDP, or other economic indicators of different geographical units (Isaksen, 1996; Hendry & Brown, 2006; Stejskal & Hajek, 2012) [42,43,44]. The indicators based on statistical units do not contain spatial dimensions, so the proximity between spaces cannot be considered. In the second stage, with the emergence of enterprise big data, the spatial evolution of industrial agglomeration and specialization can be studied based on the geographical location of enterprises (Ellison & Glaeser, 1997; Maurel & Sédillot, 1999a; Alonso-Villar * et al., 2004) [24,45,46]. The research methods include the EG index and MS index proposed by Ellison and Glaeser (1997) as well as Maurel and Sedillot (1999) (Duranton and Overman, 2005; Kerr and Kominers, 2015) [47,48] and the Moran index (Guimaraes et al., 2011) [49]. However, the research object of spatial proximity often focuses on the spatial distribution of a single industry, without considering the spatial proximity relationship within or outside the industry.
For the linkage measure of industrial clusters, the input–output (IO) method is used in the most advanced research. This type of research has been popular since the late 1960s and early 1970s. This kind of research is carried out mainly through the IO table to measure the relationship between industries, and representative methods include principal component analysis, multivariate cluster analysis, and network analysis (Brachert et al., 2011; Liu et al., 2012; Yang et al., 2014) [50,51,52]. This approach has an obvious flaw: Only mutually exclusive clusters can be obtained, that is, the industry can only belong to one cluster. However, an industry may belong to multiple clusters (Feser et al., 2005) [53]. At the same time, principal component analysis and cluster analysis need some experience to determine the number of industrial boundaries. Industries with a load value of more than 0.40 in each principal component are generally classified into corresponding clusters. Network analysis avoids this problem to some extent, but it has a problem. It does not consider the actual spatial boundaries of industrial clusters; in the empirical analysis, the geographical scope of the cluster is fixed in the administrative units. The geographical scope of industrial clusters is within the administrative unit, and network analysis ignores the influence of geographical boundaries.
The existing research mainly has the following shortcomings: (1) The research object is based on a single industry or a single industry as an industrial cluster, which ignores the internal links of the industrial cluster in a certain sense. The industrial cluster should be the geographical concentration of the relevant industries. (2) From a research perspective, many studies observe the evolution of industrial clusters by industrial linkages and spatial proximity, but there are relatively few studies that combine the two perspectives. (3) Regarding research methods, judging the industrial association changes in industrial clusters based on the IO table is limited by the time update (once every 5 years). There are problems such as the single division method, slow update speed, and cluster exclusion, which prevent the identification of the industrial clusters from being completed in real time and quickly (Arbia et al., 2014) [54]. The research object of spatial agglomeration on the evolution of industrial clusters is mainly based on a single industry, which makes it difficult to accurately measure the degree of co-agglomeration between industries (Arbia, 2001) [55].

3. Materials and Methods

3.1. Study Area

The PRD was the case area selected in this paper, including nine cities (Table 1). The PRD is one of the three urban agglomerations with the largest population agglomeration, the strongest innovation ability, and the strongest comprehensive strength in China. The Pearl River Delta region has become a world-renowned manufacturing and export base, forming an industrial cluster dominated by electronic information and household appliances. The electronic equipment manufacturing industries account for 32% and 30% of the total industrial output and value added, respectively, which are generated by 15% of the enterprises in these industries. Therefore, the electronic information industry cluster was selected as the case to be researched in this study. Although there are several case studies on the PRD region (Feng et al., 2022; Liu et al., 2022; Wang et al., 2022) [56,57,58], few have been conducted from the perspective of industrial clusters.

3.2. Data Source

The data used in this study were from 3.57 million enterprises in Guangdong Province until 2019. Enterprise data came from public utilities information and government construction information voluntarily filled out by enterprises on major B2B websites. Data included enterprise name, business scope, address, industry, establishment time, and whether there was import and export trade information. Since the original data only provide address information, it was necessary to convert the address into the required spatial coordinates through geographic coding.
The industry information provided by the original data contained the category information of ‘Industry Classification of National Economic Activities‘ (GB/T 4754-2017), but there was a lot of missing information in more detailed categories and medium categories, which needed to be completed according to the existing information. Therefore, this study used an MLP neural network model (Gardner & Dorling, 1998) [59] to classify and supplement various types of enterprises.

3.3. Methodology

3.3.1. Term Frequency–Inverse Document Frequency (TF-IDF)

The business scope of each enterprise represents its position in the industry, and the summary of the business scope of enterprises in each industry can represent the characteristics of the industry. The semantic similarity in natural language processing was used to measure the similarity in the business scope between industries and to determine the degree of correlation between industries. The sentence semantics of business scope was much simpler than the article, so the typical TF-IDF feature extraction method was used to represent the business scope text of various industries as a vector composed of feature words.
TF: The more frequently a word appears in an industry scope text, the more relevant it is to the industry; note that many specific words in a particular language environment do not have this feature and should be excluded.
IDF: The more frequently a word appears in multiple industry business scope texts in the set of industry business scope texts, the worse the ability to distinguish the word is.
TF - IDF ( w i ) =   tf (   w i ) ×   id   f (   w i ) = t f j   ( w i ) × log N d f (   w i )
Here, t f j   ( w i ) represents the frequency of the current word w i in the industry j, N represents the total number of all industries in the industry set, and d f (   w i ) represents how many industries in the industry set have the current word w i . Through the above analysis of each word in the industry set, the TF-IDF value of each word in each industry is obtained, and then the TF-IDF value is used to establish a vector model for each industry. The similarity between industry vectors is the semantic similarity between industries, which is the degree of association between industries.

3.3.2. The Colocation Quotient (CLQ)

The colocation quotient (CLQ) is a spatial correlation based on point elements analysis to measure the spatial association between all industry categories in the dataset (Liu et al., 2021) [60]. It can explore the spatial relationship between an industry and any other industry category in the dataset and then find a highly collaborative industry category in the study area. Therefore, we can use this method to explore the spatial synergy of industries in industrial clusters.
CLQ A i B = N A i B / N A N B / ( N 1 )  
N A i B = j = 1 ( j i ) N w i j · f i j j = 1 ( j i ) N w i j
Spatial association pattern of collaborative location quotient based on global collaborative location quotient (CLQ) and Monte Carlo permutation test. The p-value can divide this spatial correlation into four categories (Table 2):

4. Results

4.1. Changes in Industrial Cluster Industry Linkage Network

Industry classification was divided according to the category of national economic industry classification, and the semantic similarity between two medium-sized industries was calculated based on the PRD region. The calculation time was 1984–2004/2009/2014/2018. In C39, the average semantic similarity between four years was 0.58, so 0.58 was used as the division standard of the cluster industry. The PRD electronic information industry cluster includes the manufacturing industry; wholesale and retail; information transmission, software, and information technology services; scientific study and technological service enterprise; and residential services, repairs, and other services. The number of industries within the cluster increased from 18 to 33. The changes in the industry within the cluster can be divided into the following categories (Table 3): (1) most of the industries remain stable in the cluster, including C347, C358, C385, etc.; (2) industries that emerged after 2009, including C241, C399, C402, etc.; (3) unstable industries in the cluster appear in some years but cannot remain stable, such as C359.
The industrial linkages of industrial clusters were calculated by semantic similarity. The size of nodes in the figure is the sum of semantic similarity with other industries, and the width of the edges is the semantic similarity between two nodes, which is regarded as the degree of association between nodes. From the changes in industrial linkages, it can be seen that the linkage network of the electronic information industry cluster in the Pearl River Delta is deepening, and the cluster network linkage is centered on C39 (Figure 1). In addition to the industry of C39, the network identifies manufacturing and services that are strongly associated with it (Table 4). Since the change of service industry, wholesale and retail trade in the cluster was only F517 in 2004, increased to F514 in 2009, but had weak links with other industries in the cluster. In 2014, the cluster entered F516 and F529 and remained stable, of which F517 maintained high links with most industries in the cluster. The technology service industry appeared and remained stable in 2009, including M751 and M759, and its related industries are mainly C39. From the perspective of changes in the manufacturing industry, most of the manufacturing industries had connections in the cluster in 2004. With the development of clusters, and new industries entering the cluster, the number of industries is increasing. It can be seen from the connection between the network diagram industries that the number of connections between the industries is rising, and the connection network between the cluster industries is constantly strengthening.

4.2. Change in Spatial Synergy Characteristics of Industrial Clusters

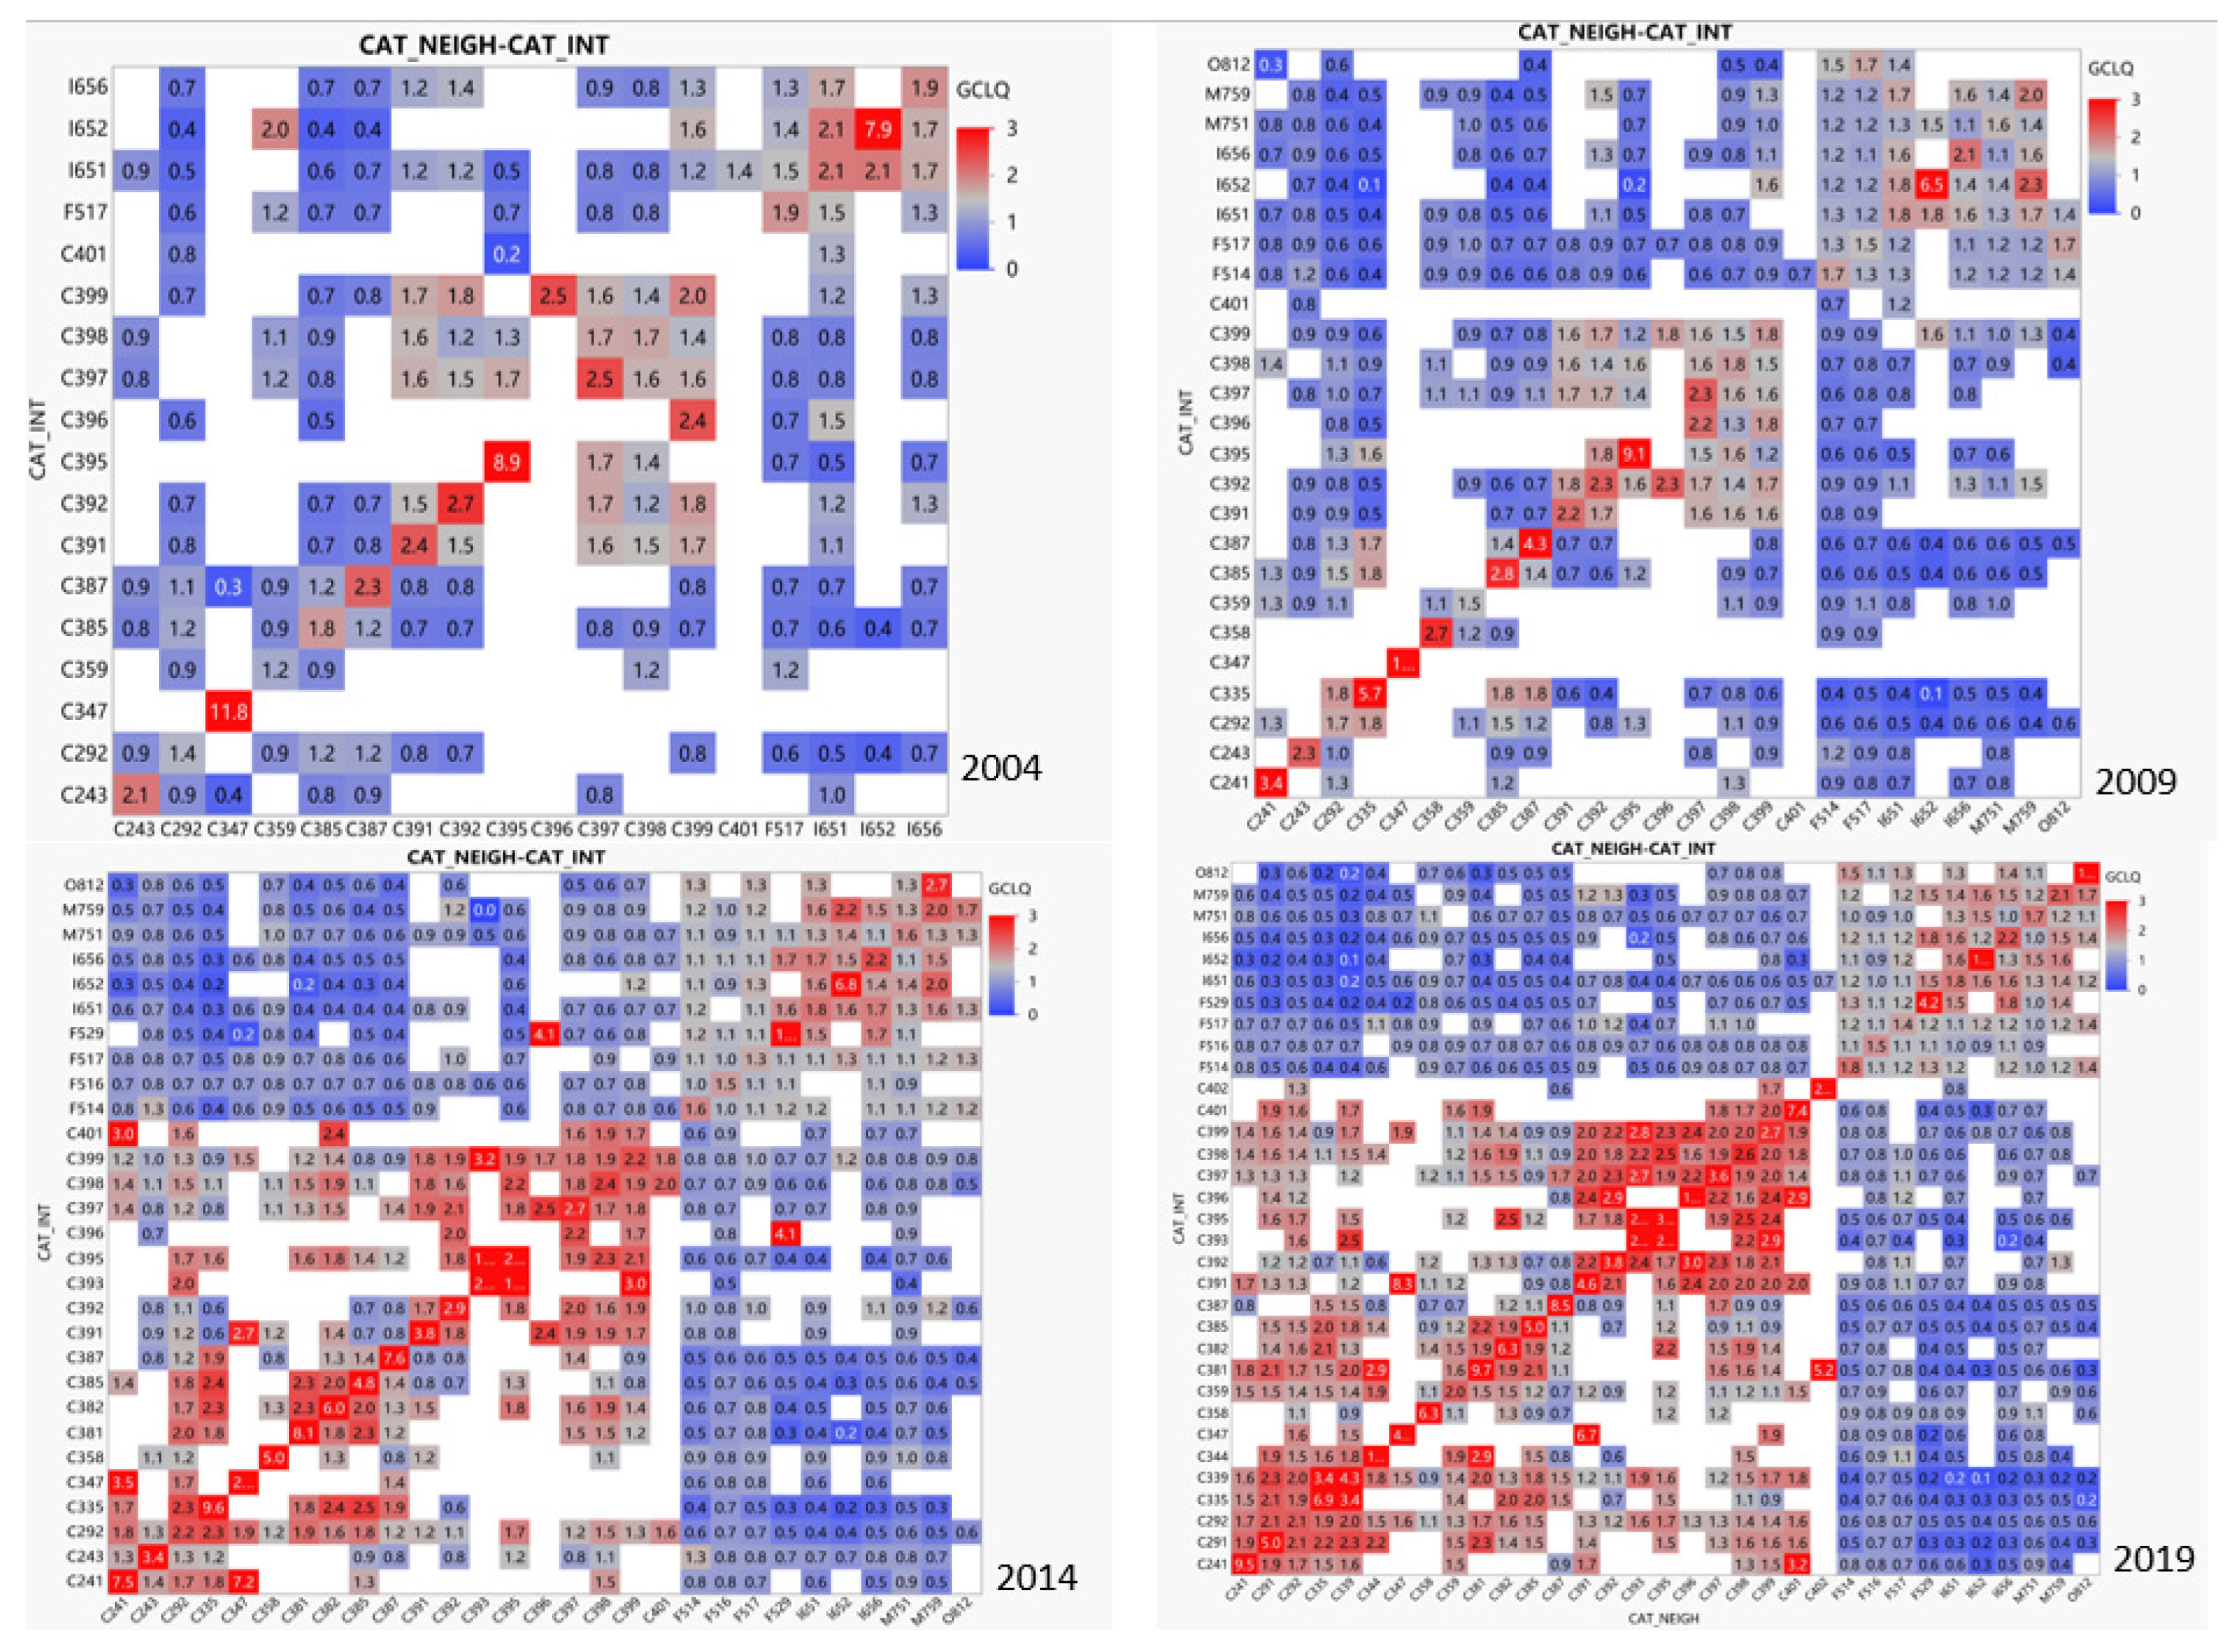
Screening the 2004–2019 Pearl River Delta electronic information industry cluster in the industry at 0.05 level of significant indigenous GCLQ (Figure 2), the higher GCLQ is the industry agglomeration in space. From the overall spatial collaborative change characteristics of the electronic information industry cluster in the PRD, the overall aggregation level between industries is continuously strengthened, and the number of collaborative aggregation industries has increased from 24.38% to 35.08%. From the perspective of the agglomeration level of the same industry, it can be mainly divided into three categories: (1) a small number of the same industries in the cluster have a high agglomeration level, such as C347/C344/C395; (2) most of the same industries gather at a certain level of steady growth; and (3) very few industries do not have aggregation, such as C393. From the perspective of the intensity of co-agglomeration between different industries, the co-agglomeration between most industries maintains a stable state, and a few industries have a slight downward trend (I651/I652 et al.). Among them, the industries with the highest degree of coordination and aggregation with other industries are C393 and C395. Overall, most enterprises in the same industry show stronger aggregation in space, which is increasing steadily; at the same time, the spatial aggregation degree between different industries is slightly weaker than that between the same industries.
From the number of collaborative aggregations between industries, the number of aggregations between industries generally shows an increasing trend (Figure 3 and Table 5). C39 in the manufacturing industry, I65 in the service industry, and other industries show the most obvious collaborative aggregation growth. On the whole, the distribution of manufacturing and service industries is scattered. Manufacturing is more inclined to maintain co-agglomeration with manufacturing. In terms of changes, the C39 industry mainly increases the co-agglomeration with other manufacturing industries, and the I65 industry mainly increases the co-agglomeration with other service industries, while the increase in industries with obvious indigenous agglomeration between manufacturing and service industries is less.

4.3. Spatial Link Change Types of Industrial Clusters

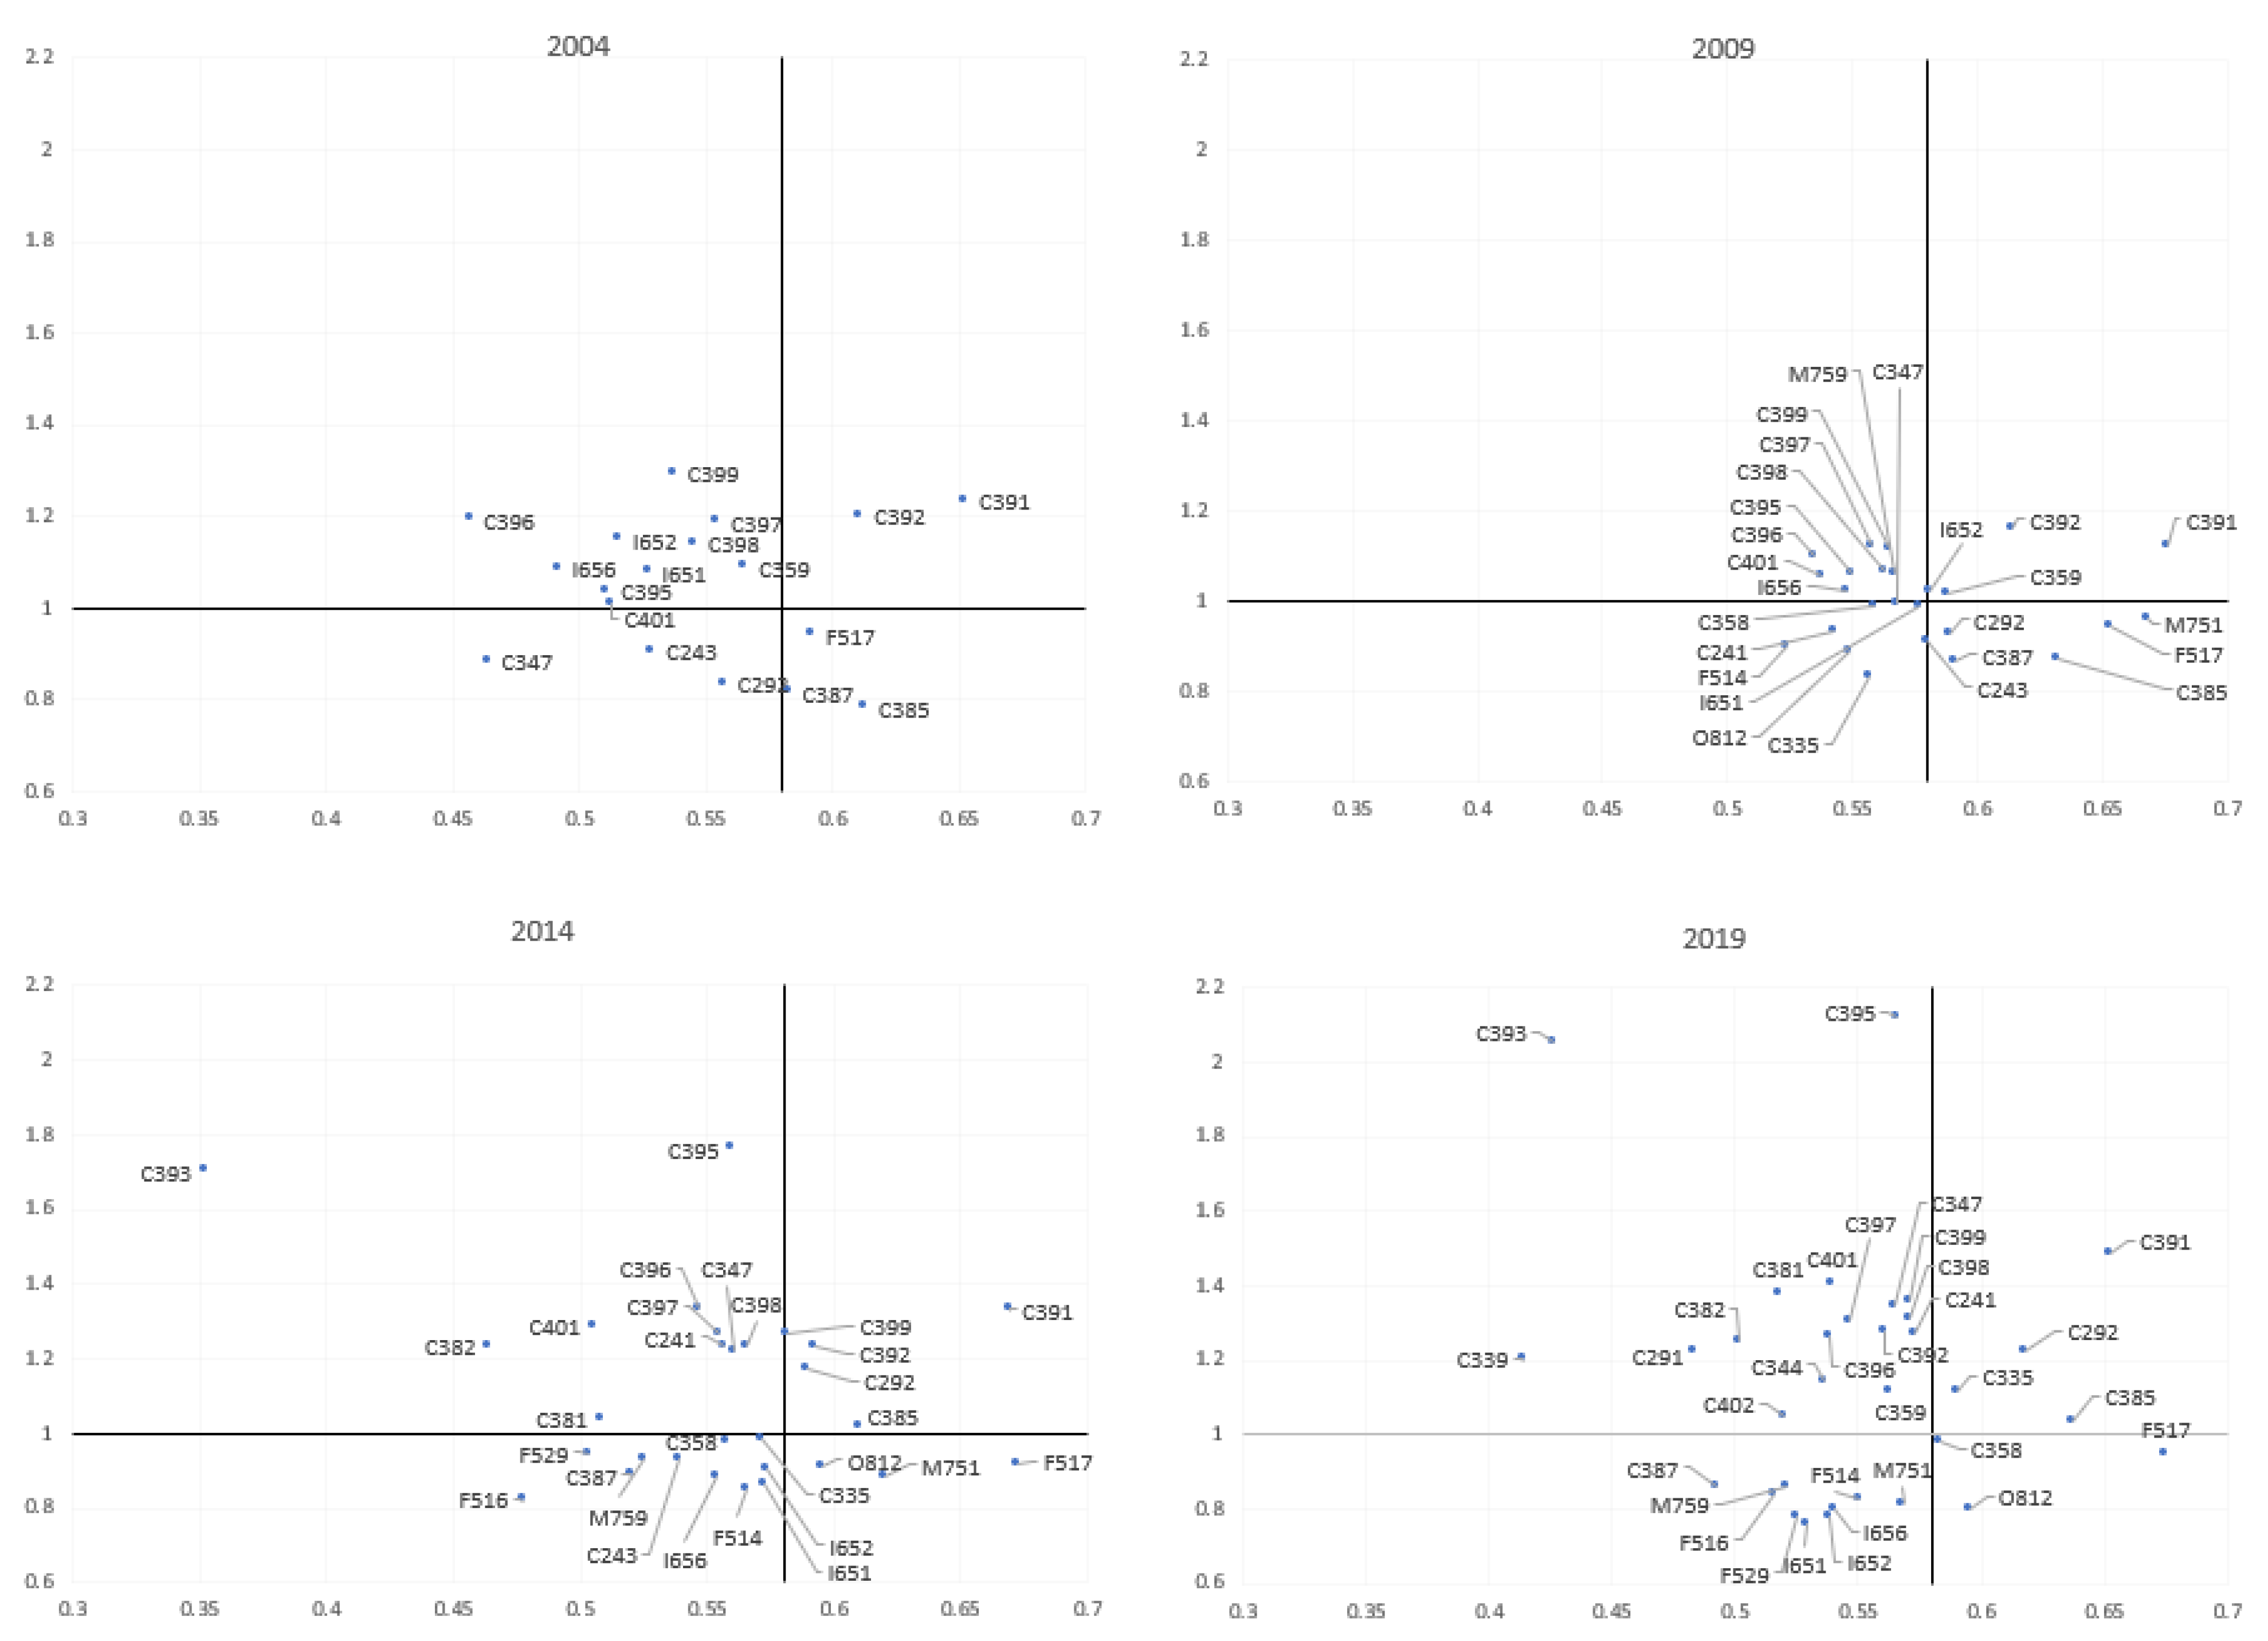
By calculating the average linkages and spatial synergy values of all industries in the cluster, the changes in industrial cluster types are divided into four categories (Figure 4): high proximity–high linkages; high proximity–low linkages; high proximity–low linkages; and low proximity–low linkages. From the overall change, the number of the first quadrant (high linkages/proximity) has been relatively small; most industries are concentrated in the second quadrant (high proximity, low linkages), mainly manufacturing; there are a few in the third quadrant (low linkages/proximity), and this part of the industry is mainly the service industry.
From the change in the first quadrant, the number of industries shows an increasing trend. C391/C392 remained stable from 2004 to 2014. After 2014, industries such as C292/C385/C335 increased. The number of the second quadrant increases greatly. In addition to industries such as C398/C399 that remain stable, many related manufacturing industries such as C401/C402/C339 are added in the follow-up. This quadrant is mainly dominated by manufacturing and has high spatial synergy with industries in the cluster, but the linkage with industries in the cluster remains to be strengthened. The third quadrant of the industry has been relatively stable since 2009, mainly in the service industry, indicating that the cluster service industry and manufacturing spatial aggregation degree and industry linkages are insufficient. The fourth quadrant trend is mainly reduced. By 2019, only two industries, O812 and F517, are left. These two industries have strong links with cluster industries, but the degree of spatial agglomeration is still insufficient.

5. Discussions and Conclusions

Compared with previous studies, the main contributions of this paper are as follows. First of all, from the perspective of research methods, the previous research objects are mainly single industry categories such as manufacturing, service industry, etc. In terms of industrial clusters, this paper understands the industry composition and industry synergy within the cluster, which is more conducive to the implementation of practical planning. Secondly, the previous research on industrial evolution pays more attention to the spatial perspective. Based on the semantic and spatial collaborative analysis, this study conducted research on the spatial contact evolution of industrial clusters. The proposed method is faster and more convenient to complete the research on the identification and evolution characteristics of industrial clusters. Understanding the development trend of industrial clusters, spatial evolution, and the characteristics of industrial linkage changes will help the implementation of industrial spatial planning. The common evolution of the two perspectives is more conducive to understanding the change in industrial clusters in space relations, thus helping policymakers and urban planners to formulate relevant industrial development and spatial layout policies.
In the industrial cluster identification of this paper, the identification results are highly consistent with the IO table. From the perspective of industrial connection and spatial aggregation, the manufacturing industry related to electronic information has a high degree of aggregation and connection in space, but the degree of aggregation is different; the producer services related to it are not highly agglomerated with the electronic information industry but maintain a certain degree of contact, indicating that these industries have produced cross-regional linkages, which supports the conclusions of previous studies that the service industry is more spatially dispersed than the manufacturing industry (Barlet et al., 2013; Koh & Riedel, 2014; Dauth et al., 2018) [18,20,61].
These findings have two main policy implications. First of all, the changes in the activity, connection, and spatial characteristics of the electronic information industry cluster in the PRD will help to provide a reference for the development of the electronic information industry in inland urban agglomerations. At the same time, it can enable policymakers and urban planners to evaluate the development and changes in industrial clusters more quickly in order to adjust the development policies of industrial clusters. Second, cooperation rather than competition should be considered among the governments in the development of regional industrial clusters. A complete industrial cluster requires a cross-city layout in the region. Therefore, when the government conducts the layout of industrial clusters, it should fully consider the coordinated development of urban industries in the region rather than increasing the homogenization of urban industries, which is very important for the industrial transfer and upgrading of urban agglomerations.
Although this study contributes to the linkage–spatial evolution characteristics of industrial clusters, there are still the following limitations. Firstly, the data used in this study are the data of urban agglomeration enterprises in the PRD region until 2019. However, due to the existence of enterprises, there are no closed enterprises. Second, since the division of industrial clusters based on semantic association is a novel technology, this study did not consider reality and only focuses on the industrial association characteristics of industrial clusters. In addition, this study did not focus on the relationship between universities, research institutions, and enterprises. An important direction for future research is to examine the relationship between semantic association, spatial association, and economic growth. Therefore, it is necessary to choose a more appropriate measurement model to explore and verify.
The spatial and temporal evolution of industrial clusters has been an important part of economic geography research. Understanding and identifying the changes in industrial clusters in space is a basic problem for understanding the development of urban and regional industries. This study first determined the evolution of the activity of the electronic information industry cluster in the PRD and its connected network. The number of industries in the cluster increased from 18 to 33, most of which remained stable in the process of evolution and were stable in the cluster from 1984 to 2019. A small number of industries appeared in the process of cluster evolution, and the years of emergence were also different. Regarding the changes in linkages, the linkages among industries within the cluster are deepening, with industry C39 as the core. Regarding the change in spatial co-agglomeration, the overall spatial co-agglomeration characteristics of the electronic information industry cluster in the PRD show that the overall agglomeration level among industries has been continuously strengthened, and the number of co-agglomeration industries has increased from 24.38% to 35.08%.
Regarding the type of change, few industries can maintain high contact–high proximity, and most are mainly concentrated on weak contact–high proximity. Regarding the change in cluster industry type, most of the manufacturing and electronic information industries maintain a high degree of aggregation, and a small part of them maintain a high degree of industrial connection; most of the related service industries maintain low proximity–low linkage level, and only a small part of them maintain low proximity–high linkage level. Theoretically, whether an industry tends to spatial agglomeration or dispersion is closely related to its industrial attributes. Scholars have different views on whether the manufacturing industry is more inclined to geographical concentration and whether the manufacturing industry has a higher degree of spatial agglomeration than the service industry. This paper finds that the spatial agglomeration degree of the manufacturing industry in the PRD is higher than that of the service industry.

Author Contributions

Y.T., Z.G. and Y.C. conceived and designed the study; J.L. performed data analysis; Y.T., Z.G. and J.L. analyzed the results. All authors have read and agreed to the published version of the manuscript.

Funding

Financial support from the National Natural Science Foundation of China, National Key R&D Program of China (2019YFB210310-3) is gratefully acknowledged.

Conflicts of Interest

The authors declare no conflict of interest.

References

  1. Van den Berg, L.; Braun, E.; Van Winden, W. Growth clusters in European cities: An integral approach. Urban Stud. 2001, 38, 185–205. [Google Scholar] [CrossRef]
  2. Bresnahan, T.; Gambardella, A. Building High-Tech Clusters: Silicon Valley and Beyond; Cambridge University Press: Cambridge, UK, 2004. [Google Scholar]
  3. Hirschman, A.O. The Strategy of Economic Development; Yale University Press: New Haven, CT, USA, 1958. [Google Scholar]
  4. Sadik-Zada, E.R.; Loewenstein, W.; Hasanli, Y. Production linkages and dynamic fiscal employment effects of the extractive industries: Input-output and nonlinear ARDL analyses of Azerbaijani economy. Miner. Econ. 2021, 34, 3–18. [Google Scholar] [CrossRef]
  5. Feldman, M.P.; Audretsch, D.B. Innovation in cities:: Science-based diversity, specialization and localized competition. Eur. Econ. Rev. 1999, 43, 409–429. [Google Scholar] [CrossRef]
  6. Porter, M. The economic performance of regions. Reg. Stud. 2003, 37, 549–578. [Google Scholar] [CrossRef]
  7. Henderson, V. Externalities and industrial development. J. Urban Econ. 1997, 42, 449–470. [Google Scholar] [CrossRef] [Green Version]
  8. Delgado, M.; Porter, M.E.; Stern, S. Clusters, convergence, and economic performance. Res. Policy 2014, 43, 1785–1799. [Google Scholar] [CrossRef] [Green Version]
  9. Yang, Z.; Sliuzas, R.; Cai, J.; Ottens, H.F. Exploring spatial evolution of economic clusters: A case study of Beijing. Int. J. Appl. Earth Obs. Geoinf. 2012, 19, 252–265. [Google Scholar] [CrossRef]
  10. Searle, G.; Sigler, T.; Martinus, K. Firm evolution and cluster specialization: A social network analysis of resource industry change in two Australian cities. Reg. Stud. Reg. Sci. 2018, 5, 369–387. [Google Scholar] [CrossRef] [Green Version]
  11. Carlino, G.A. Manufacturing agglomeration economies as returns to scale: A production function approach. Pap. Reg. Sci. Assoc. 1982, 50, 95–108. [Google Scholar] [CrossRef]
  12. Amin, A.; Thrift, N.J. Neo-Marshallian nodes in global networks. Int. J. Urban Reg. Res. 1992, 16, 571–587. [Google Scholar] [CrossRef]
  13. Kowalski, A.M.; Marcinkowski, A. Clusters versus cluster initiatives, with focus on the ICT sector in Poland. Eur. Plan. Stud. 2014, 22, 20–45. [Google Scholar] [CrossRef]
  14. Arbia, G.; Espa, G.; Giuliani, D.; Mazzitelli, A. Clusters of firms in an inhomogeneous space: The high-tech industries in Milan. Econ. Model. 2012, 29, 3–11. [Google Scholar] [CrossRef]
  15. Wen, M. Relocation and agglomeration of Chinese industry. J. Dev. Econ. 2004, 73, 329–347. [Google Scholar] [CrossRef] [Green Version]
  16. Long, C.; Zhang, X. Patterns of China’s industrialization: Concentration, specialization, and clustering. China Econ. Rev. 2012, 23, 593–612. [Google Scholar] [CrossRef]
  17. Behrens, K.; Bougna, T. An anatomy of the geographical concentration of Canadian manufacturing industries. Reg. Sci. Urban Econ. 2015, 51, 47–69. [Google Scholar] [CrossRef] [Green Version]
  18. Koh, H.-J.; Riedel, N. Assessing the localization pattern of German manufacturing and service industries: A distance-based approach. Reg. Stud. 2014, 48, 823–843. [Google Scholar] [CrossRef]
  19. Jaffe, A.B.; Trajtenberg, M.; Henderson, R. Geographic localization of knowledge spillovers as evidenced by patent citations. Q. J. Econ. 1993, 108, 577–598. [Google Scholar] [CrossRef]
  20. Dauth, W.; Fuchs, M.; Otto, A. Long-run processes of geographical concentration and dispersion: Evidence from Germany. Pap. Reg. Sci. 2018, 97, 569–593. [Google Scholar] [CrossRef] [Green Version]
  21. Turkina, E.; Van Assche, A.; Kali, R. Structure and evolution of global cluster networks: Evidence from the aerospace industry. J. Econ. Geogr. 2016, 16, 1211–1234. [Google Scholar] [CrossRef] [Green Version]
  22. He, C.; Wei, Y.D.; Pan, F. Geographical concentration of manufacturing industries in China: The importance of spatial and industrial scales. Eurasian Geogr. Econ. 2007, 48, 603–625. [Google Scholar] [CrossRef]
  23. Audretsch, D.B.; Feldman, M.P. R&D spillovers and the geography of innovation and production. Am. Econ. Rev. 1996, 86, 630–640. [Google Scholar]
  24. Maurel, F.; Sédillot, B. A measure of the geographic concentration in French manufacturing industries. Reg. Sci. Urban Econ. 1999, 29, 575–604. [Google Scholar] [CrossRef]
  25. Maskell, P.; Malmberg, A. Localised learning and industrial competitiveness. Camb. J. Econ. 1999, 23, 167–185. [Google Scholar] [CrossRef]
  26. Bathelt, H.; Malmberg, A.; Maskell, P. Clusters and knowledge: Local buzz, global pipelines and the process of knowledge creation. Prog. Hum. Geogr. 2004, 28, 31–56. [Google Scholar] [CrossRef]
  27. Owen-Smith, J.; Powell, W.W. Knowledge networks as channels and conduits: The effects of spillovers in the Boston biotechnology community. Organ. Sci. 2004, 15, 5–21. [Google Scholar] [CrossRef] [Green Version]
  28. Wolfe, D.A.; Gertler, M.S. Clusters from the inside and out: Local dynamics and global linkages. Urban Stud. 2004, 41, 1071–1093. [Google Scholar] [CrossRef]
  29. Lorenzen, M.; Mudambi, R. Clusters, connectivity and catch-up: Bollywood and Bangalore in the global economy. J. Econ. Geogr. 2013, 13, 501–534. [Google Scholar] [CrossRef]
  30. Spencer, G.M.; Vinodrai, T.; Gertler, M.S.; Wolfe, D.A. Do clusters make a difference? Defining and assessing their economic performance. Reg. Stud. 2010, 44, 697–715. [Google Scholar] [CrossRef]
  31. Porter, M.E. The competitive advonioge of notions. Harv. Bus. Rev. 1990, 73, 91. [Google Scholar]
  32. Swann, G.; Prevezer, M.; Stout, D. The Dynamics of Industrial Clustering: International Comparisons in Computing and Biotechnology; Oxford University Press: Oxford, UK, 1998. [Google Scholar]
  33. Schmitz, H.; Nadvi, K. Clustering and industrialization: Introduction. World Dev. 1999, 27, 1503–1514. [Google Scholar] [CrossRef]
  34. Morosini, P. Industrial clusters, knowledge integration and performance. World Dev. 2004, 32, 305–326. [Google Scholar] [CrossRef]
  35. Czamanski, S.; Ablas, L.A.d.Q. Identification of industrial clusters and complexes: A comparison of methods and findings. Urban Stud. 1979, 16, 61–80. [Google Scholar] [CrossRef]
  36. De Propris, L. Mapping local production systems in the UK: Methodology and application. Reg. Stud. 2005, 39, 197–211. [Google Scholar] [CrossRef]
  37. Rosenfeld, S.A. Bringing business clusters into the mainstream of economic development. Eur. Plan. Stud. 1997, 5, 3–23. [Google Scholar] [CrossRef]
  38. Guo, J.; Lao, X.; Shen, T. Location-based method to identify industrial clusters in Beijing-Tianjin-Hebei area in China. J. Urban Plan. Dev. 2019, 145, 04019001. [Google Scholar] [CrossRef]
  39. Liu, Z. Global and local: Measuring geographical concentration of China’s manufacturing industries. Prof. Geogr. 2014, 66, 284–297. [Google Scholar] [CrossRef]
  40. Koech, J.; Wynne, M.A. Diversification and specialization of US states. Glob. Monet. Policy Inst. Work. Pap. 2016. [Google Scholar] [CrossRef]
  41. Brülhart, M.; Traeger, R. An account of geographic concentration patterns in Europe. Reg. Sci. Urban Econ. 2005, 35, 597–624. [Google Scholar] [CrossRef] [Green Version]
  42. Isaksen, A. Towards increased regional specialization? The quantitative importance of new industrial spaces in Norway, 1970–1990. Nor. Geogr. Tidsskr. 1996, 50, 113–123. [Google Scholar] [CrossRef]
  43. Hendry, C.; Brown, J. Dynamics of clustering and performance in the UK opto-electronics industry. Reg. Stud. 2006, 40, 707–725. [Google Scholar] [CrossRef]
  44. Stejskal, J.; Hajek, P. Competitive advantage analysis: A novel method for industrial clusters identification. J. Bus. Econ. Manag. 2012, 13, 344–365. [Google Scholar] [CrossRef] [Green Version]
  45. Ellison, G.; Glaeser, E.L. Geographic concentration in US manufacturing industries: A dartboard approach. J. Political Econ. 1997, 105, 889–927. [Google Scholar] [CrossRef]
  46. Alonso-Villar*, O.; Chamorro-Rivas, J.-M.; González-Cerdeira, X. Agglomeration economies in manufacturing industries: The case of Spain. Appl. Econ. 2004, 36, 2103–2116. [Google Scholar] [CrossRef] [Green Version]
  47. Duranton, G.; Overman, H.G. Testing for localization using micro-geographic data. Rev. Econ. Stud. 2005, 72, 1077–1106. [Google Scholar] [CrossRef] [Green Version]
  48. Kerr, W.R.; Kominers, S.D. Agglomerative forces and cluster shapes. Rev. Econ. Stat. 2015, 97, 877–899. [Google Scholar] [CrossRef] [Green Version]
  49. Guimaraes, P.; Figueiredo, O.; Woodward, D. Accounting for neighboring effects in measures of spatial concentration. J. Reg. Sci. 2011, 51, 678–693. [Google Scholar] [CrossRef]
  50. Brachert, M.; Titze, M.; Kubis, A. Identifying industrial clusters from a multidimensional perspective: Methodical aspects with an application to Germany. Pap. Reg. Sci. 2011, 90, 419–439. [Google Scholar] [CrossRef]
  51. Liu, X.; Sun, T.; Li, G. Spatial analysis of industry clusters based on local spatial statistics: A case study of Beijing manufacturing industry clusters. Sci. Geogr. Sin. 2012, 32, 530–535. [Google Scholar]
  52. Yang, Z.; Liang, J.; Cai, J. Urban economic cluster template and its dynamics of Beijing, China. Chin. Geogr. Sci. 2014, 24, 740–750. [Google Scholar] [CrossRef] [Green Version]
  53. Feser, E.; Sweeney, S.; Renski, H. A descriptive analysis of discrete US industrial complexes. J. Reg. Sci. 2005, 45, 395–419. [Google Scholar] [CrossRef]
  54. Arbia, G.; Espa, G.; Giuliani, D.; Dickson, M.M. Spatio-temporal clustering in the pharmaceutical and medical device manufacturing industry: A geographical micro-level analysis. Reg. Sci. Urban Econ. 2014, 49, 298–304. [Google Scholar] [CrossRef]
  55. Arbia, G. The role of spatial effects in the empirical analysis of regional concentration. J. Geogr. Syst. 2001, 3, 271–281. [Google Scholar] [CrossRef]
  56. Liu, W.; Zhan, J.; Zhao, F.; Wang, C.; Zhang, F.; Teng, Y.; Chu, X.; Kumi, M.A. Spatio-temporal variations of ecosystem services and their drivers in the Pearl River Delta, China. J. Clean. Prod. 2022, 337, 130466. [Google Scholar] [CrossRef]
  57. Wang, S.; Cui, Z.; Lin, J.; Xie, J.; Su, K. The coupling relationship between urbanization and ecological resilience in the Pearl River Delta. J. Geogr. Sci. 2022, 32, 44–64. [Google Scholar] [CrossRef]
  58. Feng, P.; Growe, A.; Shen, Y. The Middle-aged and Knowledge Workers: Demographic and Economic Changes in the Pearl River Delta, China. Chin. Geogr. Sci. 2022, 32, 268–284. [Google Scholar] [CrossRef]
  59. Gardner, M.W.; Dorling, S. Artificial neural networks (the multilayer perceptron)—A review of applications in the atmospheric sciences. Atmos. Environ. 1998, 32, 2627–2636. [Google Scholar] [CrossRef]
  60. Liu, Z.; Chen, X.; Xu, W.; Chen, Y.; Li, X. Detecting industry clusters from the bottom up based on co-location patterns mining: A case study in Dongguan, China. Environ. Plan. B Urban Anal. City Sci. 2021, 48, 2827–2841. [Google Scholar] [CrossRef]
  61. Barlet, M.; Briant, A.; Crusson, L. Location patterns of service industries in France: A distance-based approach. Reg. Sci. Urban Econ. 2013, 43, 338–351. [Google Scholar] [CrossRef]
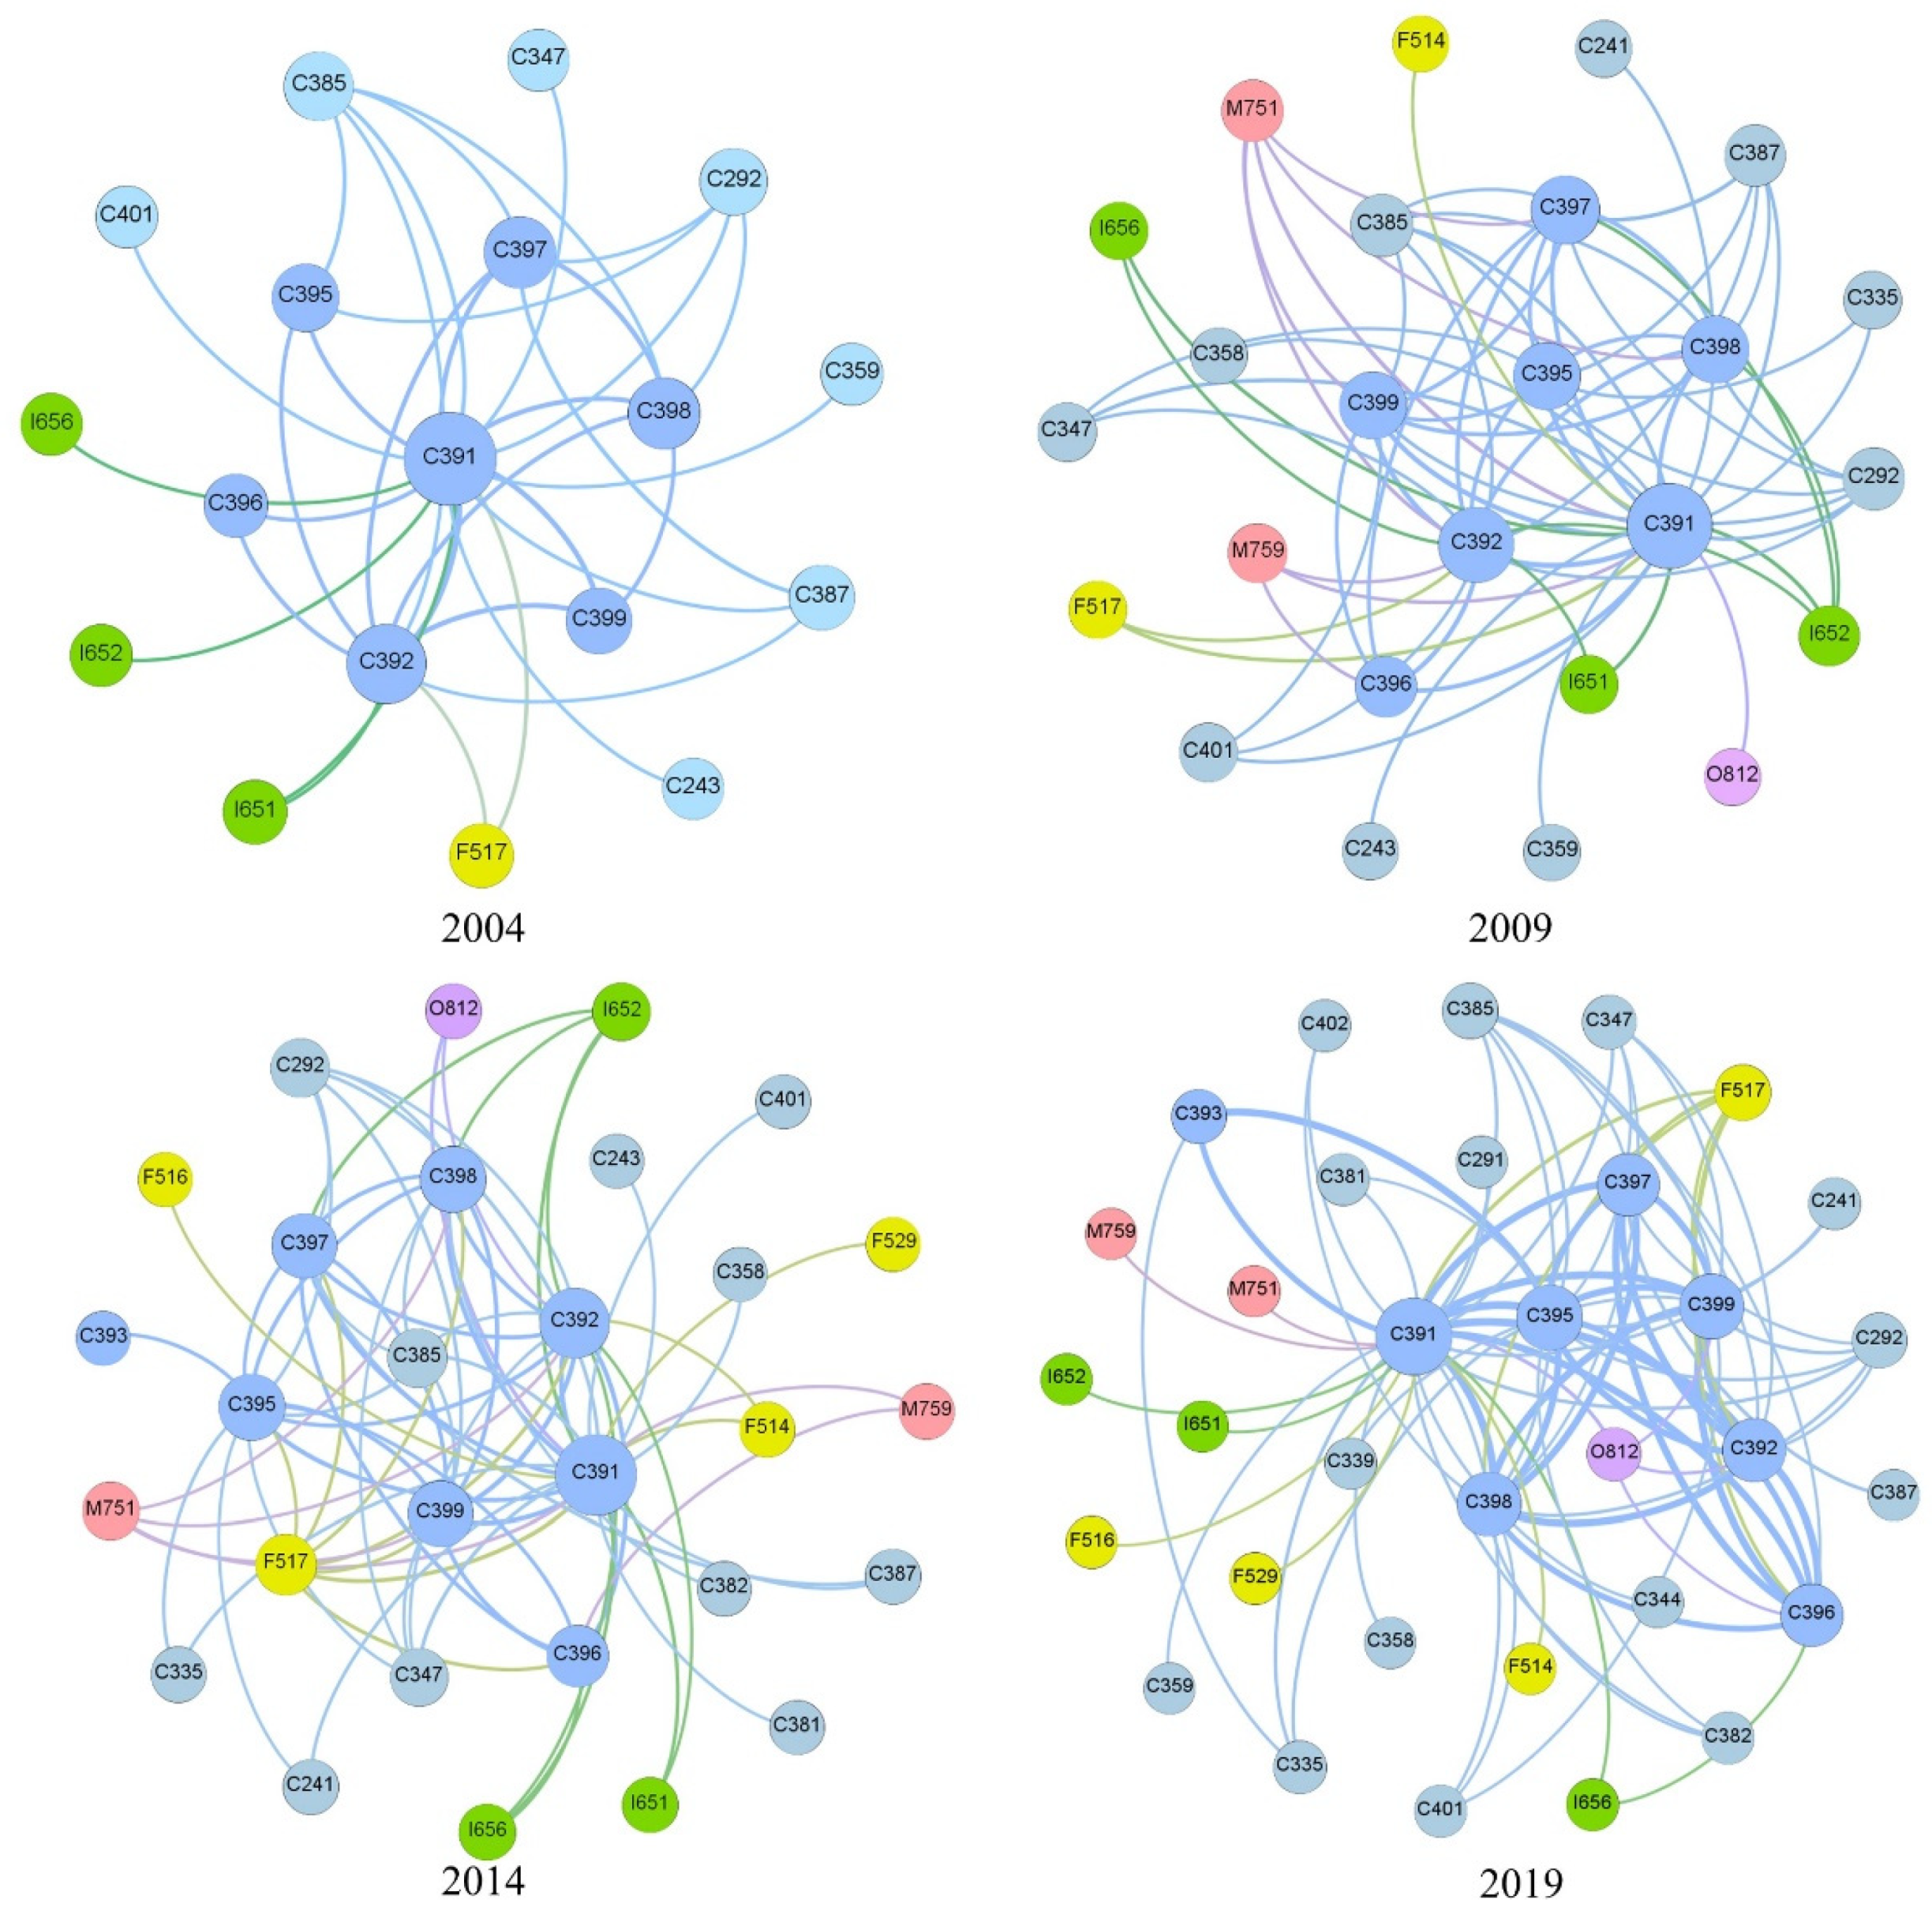
Figure 1. Characteristics of industrial linkage change in industrial clusters.
Sustainability 14 14047 g001
Figure 2. Spatial co-evolution characteristics of industrial clusters.
Sustainability 14 14047 g002
Figure 3. Spatial coordination quantity change characteristics of industrial clusters.
Sustainability 14 14047 g003
Figure 4. Industrial cluster linkage—classification of proximity change types.
Sustainability 14 14047 g004
Table 1. GDP and resident population of cities in the Pearl River Delta in 2021.
CityGDP (Billion Yuan)Population (Million People)
Guangzhou28,231.971881.06
Foshan12,156.54961.26
Zhaoqing2649.99412.97
Shenzhen30,664.851768.16
Dongguan10,855.351053.68
Huizhou4977.36604.29
Zhuhai3881.75243.96
Zhongshan3566.17446.69
Jiangmen3601.28444.89
Table 2. Spatial correlation classification of collaborative location analysis.
TypeCLQp Value
Cooperative localization—significant>1<0.05
Cooperative localization—non-significant>1>0.05
Isolate—significant≤1<0.05
Isolate—non-significant≤1>0.05
Table 3. The change in characteristics of industrial cluster industry activity.
Industry Type2004200920142019
C Manufacturing industryC24 Education, industry, sports, and entertainment supplies manufacturingC241 Cultural and educational office supplies manufacturing
C243 Manufacture of arts and crafts and etiquette supplies
C29 Rubber and plastic products industryC291 Rubber products industry
C292 Plastic products industry
C33 Metal products industryC335 Manufacturing of metal products for construction and safety
C339 Casting and other metal products manufacturing
C34 General equipment manufacturing industryC344 Pumps, valves, compressors, and similar machinery manufacturing
C347 Machinery manufacturing for culture and offices
C35 Special equipment manufacturingC358 Medical equipment and equipment manufacturing
C359 Manufacturing of environmental, postal, and public services, and other special equipment
C38 Electrical machinery and equipment manufacturing industryC381 Motor manufacturing
C382 Power transmission, distribution, and control equipment manufacturing
C385 Manufacture of household electrical appliances
C387 Lighting equipment manufacturing
C39 Computer, communications, and other electronic equipment manufacturingC391 Computer manufacturing
C392 Communication equipment manufacturing
C393 Radio and television equipment manufacturing
C395 Manufacture of non-professional audiovisual equipment
C396 Intelligent consumer equipment manufacturing
C397 Electronic device manufacturing
C398 Electronic components and electronic special materials manufacturing
C399 Other electronic equipment manufacturing
C40 Instrument manufacturingC401 General instrumentation manufacturing
C402 Special instrument manufacturing
F Wholesale and retailF51 Wholesale businessF514 Culture, sports goods, and equipment wholesale
F516 Wholesale of mineral products, building materials, and chemical products
F517 Wholesale of mechanical equipment, hardware, and electronic products
F52 Retail businessF529 Stores, non-stores, and other retail
I Information transmission, software, and information technology servicesI65 Software and information technology servicesI651 Software development
I652 Integrated circuit design
I656 Information technology consulting service
M the scientific study and technological service enterpriseM75 Technology extension and application servicesM751 Technology promotion services
M752 Other technology promotion and application services
O Residential services, repairs, and other servicesO81 Motor vehicles, electronic products, and daily products repair industryO812 Computer and office equipment maintenance
Table 4. Industrial cluster network centrality.
Degree Centrality2004200920142019
C240.06 0.08 0.11 0.06
C290.24 0.25 0.21 0.22
C330.08 0.07 0.13
C340.06 0.13 0.18 0.19
C350.06 0.08 0.04 0.06
C380.47 0.46 0.36 0.41
C392.82 3.63 3.50 3.28
C400.06 0.13 0.04 0.16
F510.12 0.13 0.04 0.28
F520.04 0.03
I650.24 0.33 0.32 0.13
M750.33 0.21 0.06
O810.04 0.07 0.13
Table 5. Spatial coordination quantity change of industrial clusters.
Number2004200920142019
Total3246258411089
Significant 164351564774
Significant synergies79155258382
Proportion24.38%24.8%30.68%35.08%
Publisher’s Note: MDPI stays neutral with regard to jurisdictional claims in published maps and institutional affiliations.