Article

Performance Assessment of Sewer Networks under Different Blockage Situations Using Internet-of-Things-Based Technologies

1
Department of Building and Real Estate, The Hong Kong Polytechnic University, Hong Kong
2
Department of Land Surveying and Gio Informatics, The Hong Kong Polytechnic University, Hong Kong
3
Department of Mechanical, Aerospace and Civil Engineering, School of Engineering, The University of Manchester, Manchester M13 9PL, UK
4
Department of Civil Engineering, College of Engineering in Al-Kharj, Prince Sattam Bin Abdulaziz University, Al-Kharj 11942, Saudi Arabia
5
College of Science and Computer Engineering, Taibah University, Yanbu 46411, Saudi Arabia
6
Construction and Building Engineering Department, College of Engineering and Technology, Arab Academy for Science, Technology and Maritime Transport (AASTMT), B 2401 Smart Village, Giza 12577, Egypt
*
Author to whom correspondence should be addressed.
Sustainability 2022, 14(21), 14036; https://doi.org/10.3390/su142114036
Submission received: 27 September 2022 / Revised: 18 October 2022 / Accepted: 20 October 2022 / Published: 28 October 2022

Abstract

:
This study aims to model the performance of sewage networks under diverse blockage situations in terms of overflow occurrence using internet-of-things-based technologies in Hong Kong. To this end, a multi-stage methodological approach is employed, starting from collecting required data using smart sensors, utilizing novel data mining techniques, and using a case study simulation. From the results obtained, the following conclusions are drawn: (1) several sites under investigation are imbued with partial blockages, (2) the overall performance of the sewer network has a nonlinear relationship with the blockages in terms of the remaining time to overflow, (3) in cases of complete blockages, the sewer only takes few minutes to reach the manhole cover level that causes the system to experience overflow, and (4) cleaning work significantly improve the performance of the sewage network by 86%. The outcomes of this study provide a solid foundation for the concerned environmental engineers and decision-makers towards reducing the magnitude of sewer overflow and improving different aspects of our environment.

1. Introduction

1.1. Background

Sewer networks are infrastructure that transport sewage and/or storm runoff to wastewater treatment plants (WWTP) and prevent flooding in urban areas. In general, there are two types of sewer networks: separated and combined. Regardless of the type of sewer network systems employed in a municipality, there is a need for continuous monitoring of the performance of such systems as part of urban infrastructure sustainability. The performance of a sewer network system is affected by defects, such as broken pipes and pipe blockage, rainwater runoff, lack of power or failure of pumps, corrosion, and deterioration of sewer materials [1,2,3,4]. In this regard, blockage situations are the most frequent form of operational failure in sewer systems [5], which can generally cause a major system problem ranging from sewer breakdown and plant failure, resulting in flooding, which will lead to other infrastructure failures, traffic disruption, and issues in health and safety [6]. Furthermore, the complex nature of randomly occurring sewage failures resulting from blockages significantly adds to the operation and maintenance cost [7]. Generally, there are two cases of blockage within sewer networks, partial and complete blockage; these two cases can differ in their effect based on the flow of wastewater within the network. In the worst case, it can lead to an overflow in a very short time. Therefore, sewage network management and continuous performance evaluation have become necessary to ensure the required service levels at an acceptable cost [7].
Much of the previous research focused on finding the causes of blockages in the sewage system. The result of Arthur et al.’s [6] research was the general factors that indicate that a single pipe is increasingly prone to blocking. The most important signs suggested indicating blockage situations include: (i) the case of extra charge, which occurs when the sewage inside the pipe becomes pressurized, often when the sewage depth is greater than the level of the outlet pipe. In most cases, this means that an overflow situation will occur here; (ii) if the sewage velocities in the pipes fail to meet the requirements for self-cleaning; (iii) if the pipe is placed with a slope less than 1: the tube diameter (mm) for self-cleaning purposes or not; (iv) if the output pipe receives a disproportionately large direct input; and (v) if the pipe size is less than 225 mm, as this will increase the possibility of a blockage in this pipe. It has been suggested that significant factors closely related to the increased incidence of sewer blockage include pipe age, diameter, material, length, gradient/slope, sag, intrusion of tree roots, human behavioral patterns, and construction quality [8]. It has also been found that increased amounts of fats, oils, and greases discharged into sewage systems can trap and accumulate sediment on sewer beds, leading to fatberg formations [9,10]. Additionally, Rodríguez et al. [11] demonstrate that hydraulic deterioration of sewage systems, among other factors, arises from sediment build-up. An indicator of this process is the presence of sediment-related blockages in sewage pipelines. Others concluded that many sewage pipes designed without self-cleaning (recleaning criteria) were observed to suffer more clogs compared to sewage pipes designed with minimum self-cleaning velocity requirements [12,13,14,15].
In another direction, some researchers focused on developing a blockages prediction model, such as using a Poisson process modeling framework modified by Markov chain to predict blockages in terms of pipe physical features and sewer condition [5], and using a polynomial regression model with six major pipe features (i.e., diameter, age, length, slope, material, and function) which would find the number of blockages per kilometer and per year [16].

1.2. The Internet of Things Applications in Drainage Systems

The Internet of Things (IoT) concept is mainly a network of devices connected or enabled with high-definition techs, software, sensors, or electronic chips connected directly to the internet network as a flow process of sending and collecting data Pingle et al. [17]. There is a minority of papers that focus on the implementation of the IoT concept for sewage network management specifically. Priyanka et al. [18] introduced a platform for controlling flow and pressure in fluid pipelines based on Integrated IoT holds SCADA with LQR-PID controller as a local control unit. Bhaskaran et al. [19] proposed a detailed methodology combining the previous system with IoT as monitoring using this concept is highly desirable regarding the emergence of internet applications and the new era of information digitalization, and by default, the IoT concepts generally apply to pipeline inspection by connecting the detecting sensors. Generally, the application of the IoT concept regarding pipeline inspection is by linking the readable data from the sensors with cloud storage scans that facilitate the process of transmitting and receiving data. In Ramadhin et al. [20], ultrasonic sensors were used to measure leakage levels and other sensors that measure gas leakage, pressure, and others. Direct indications are given by linking the results to a web page and performing the necessary data analysis. If there is any danger or impact on human health, the goal was to use the concept of the IoT to examine factors that affect the health of individuals. Still, they are not apparent to the bare eye, so the Internet of Things platform comes to facilitate this part and make the impact on public health clear, in addition to saving that effort and time. Chen and Dong [21] discussed a clear and practical application of the link between pipeline monitoring and the IoT, so they proposed a line monitoring system that is directly linked with the cloud, using the network transport layer, short-range communication technology, including Wi-Fi, NFC, Bluetooth, and others. They have implemented cloud computing to connect and control data. In our paper, all the data from the sensors was sent to cloud servers, which facilitated the process of receiving and analyzing the data as proposed by the others.

1.3. Point of Departure and Objectives of the Study

Despite the importance of predicting and preventing sewer failure due to blockages, few studies have focused on the effect of these blockages on the overall performance of the sewage network and the efficiency of cleaning work in solving this problem. Although sewage pipe blockages have been used as indicators at the strategic level to assess the performance of sewage pipe networks [7], the impact of these blockages on the overall performance of the network has not been investigated. Furthermore, as the impact of blockage is not shortlisted on making issues of pipeline streaming only, it leads after that for an overflow that accrued regarding the accumulating for blockages inside the pipeline, which increase the level inside the manhole then overflow will occur. Hence, it does not stop at this stage; as afterward, the negative impact of sewer overflow in the environment starts from this point. Therefore, starting with blockages in pipelines, we ended up with damages for construction, pollution for air and soil, pollution for water resources if a leakage for sewer overflow accrued to reach the surface or underground water supply resources, and even being a threat to public health who pass near to overflow location or just feeling uncomfortable for the passenger regarding the bad odor smell. With this in mind, this study aims to tackle the following research questions:
-
What is the impact of the blockage on the sewer network, and how could it be detected?
-
How will the sewage network performance vary and be affected in case of blockage occurrence?
-
What is the impact on the network performance occurring in the case of periodic cleaning?
To prudently find answers to the above-mentioned questions, the primary objectives of this paper are set out to be as follows:
  • To investigate the impact of blockage on the sewer network in terms of the residual time to overflow.
  • To compare the performance of the sewage network before and after the occurrence of the blockage.
  • To investigate the efficiency of cleaning works on solving different blockage situations by comparing the performance before and after cleaning.
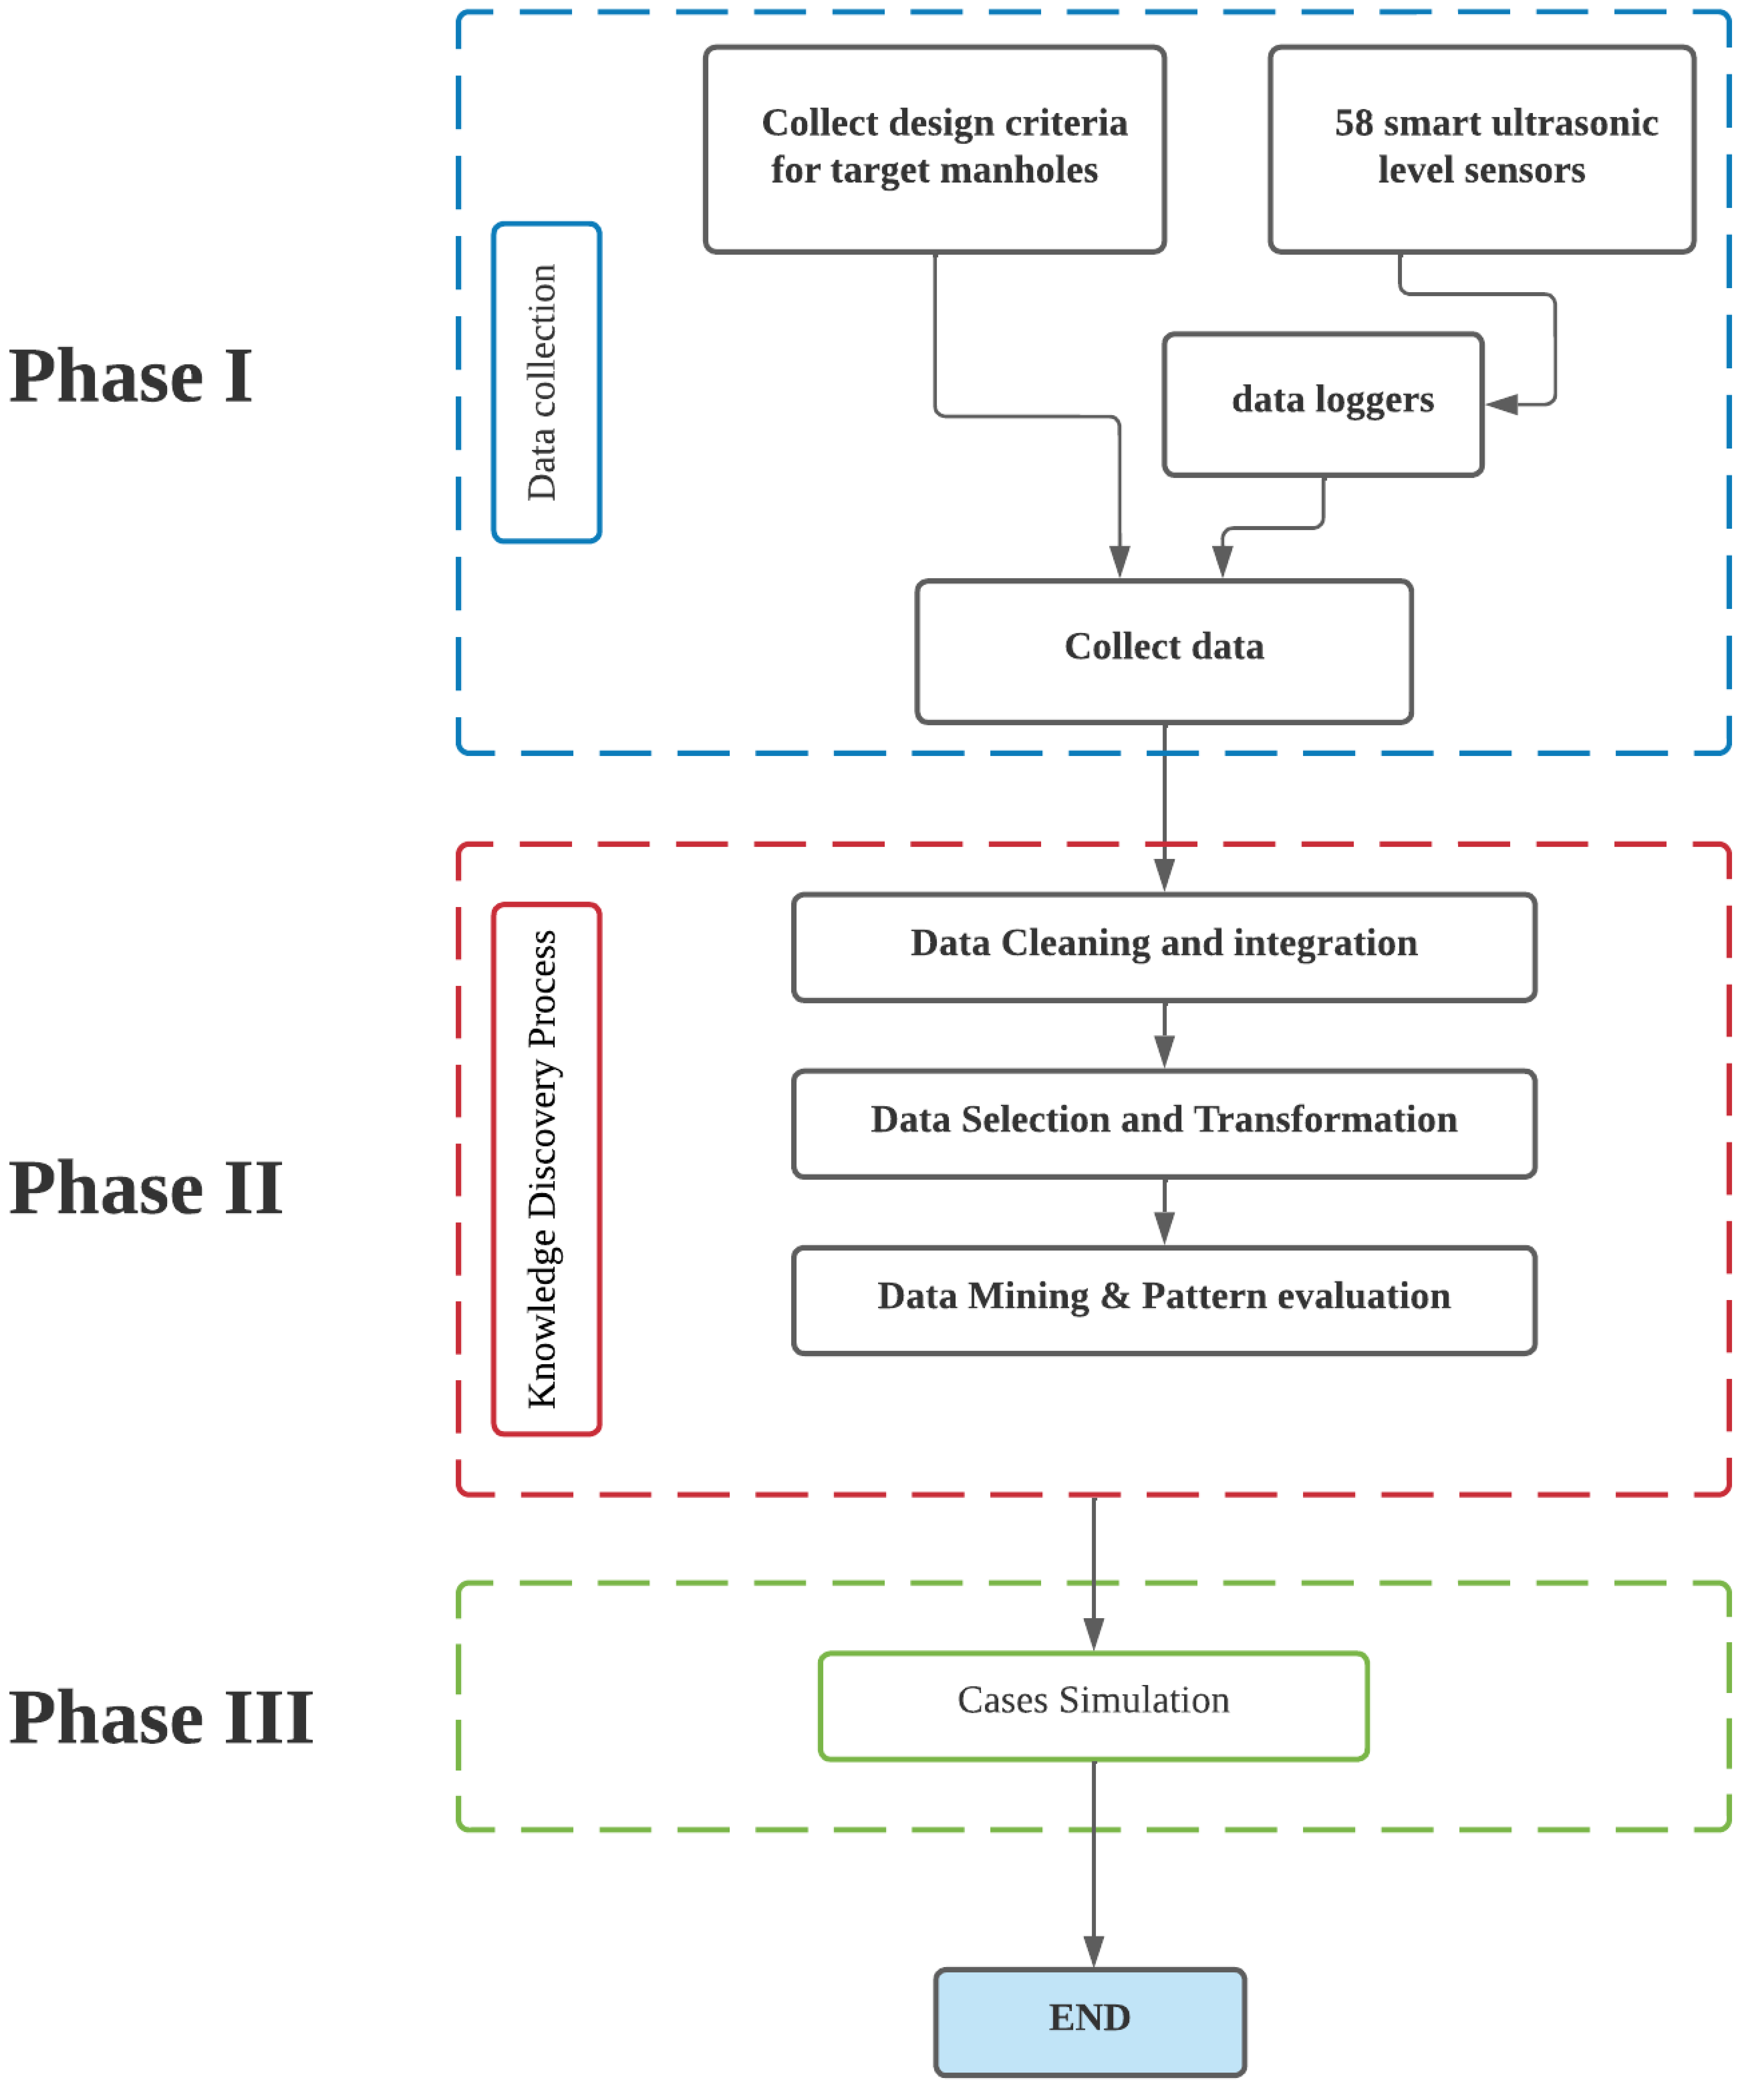
To achieve these objectives, various cases of the sewer network in Hong Kong have been studied in-depth, and various integrated methodological approaches using IoT-based technologies, big data analysis, and simulation have been adopted. This study is part of a general research project to develop an integrated and intelligent monitoring system for the sewage network. In addition to all of this, we emphasize the importance of this study regarding public health who interact directly or indirectly with sewer overflow, which leads to different diseases, as well as the impact on the environment, which is considered the most affected factor regarding direct interaction. The rest of this paper is organized as follows. Section 2 presents the basic materials and methods for our experiments, including data collection, data analysis, and case simulation. In Section 3, we present and discuss results focused on the performance of the Hong Kong sewage system in terms of residual time to flow in three cases, including normal (i.e., before blockage), blockage, and after-cleaning situations. Section 4 is concerned with the implications derived from this study. Finally, in turn, the limitations and conclusions are provided in Section 5 and Section 6.

2. Methodology

The research methodology process utilized in this research is displayed in Figure 1. As can be seen, the adopted methodology is comprised of three phases.

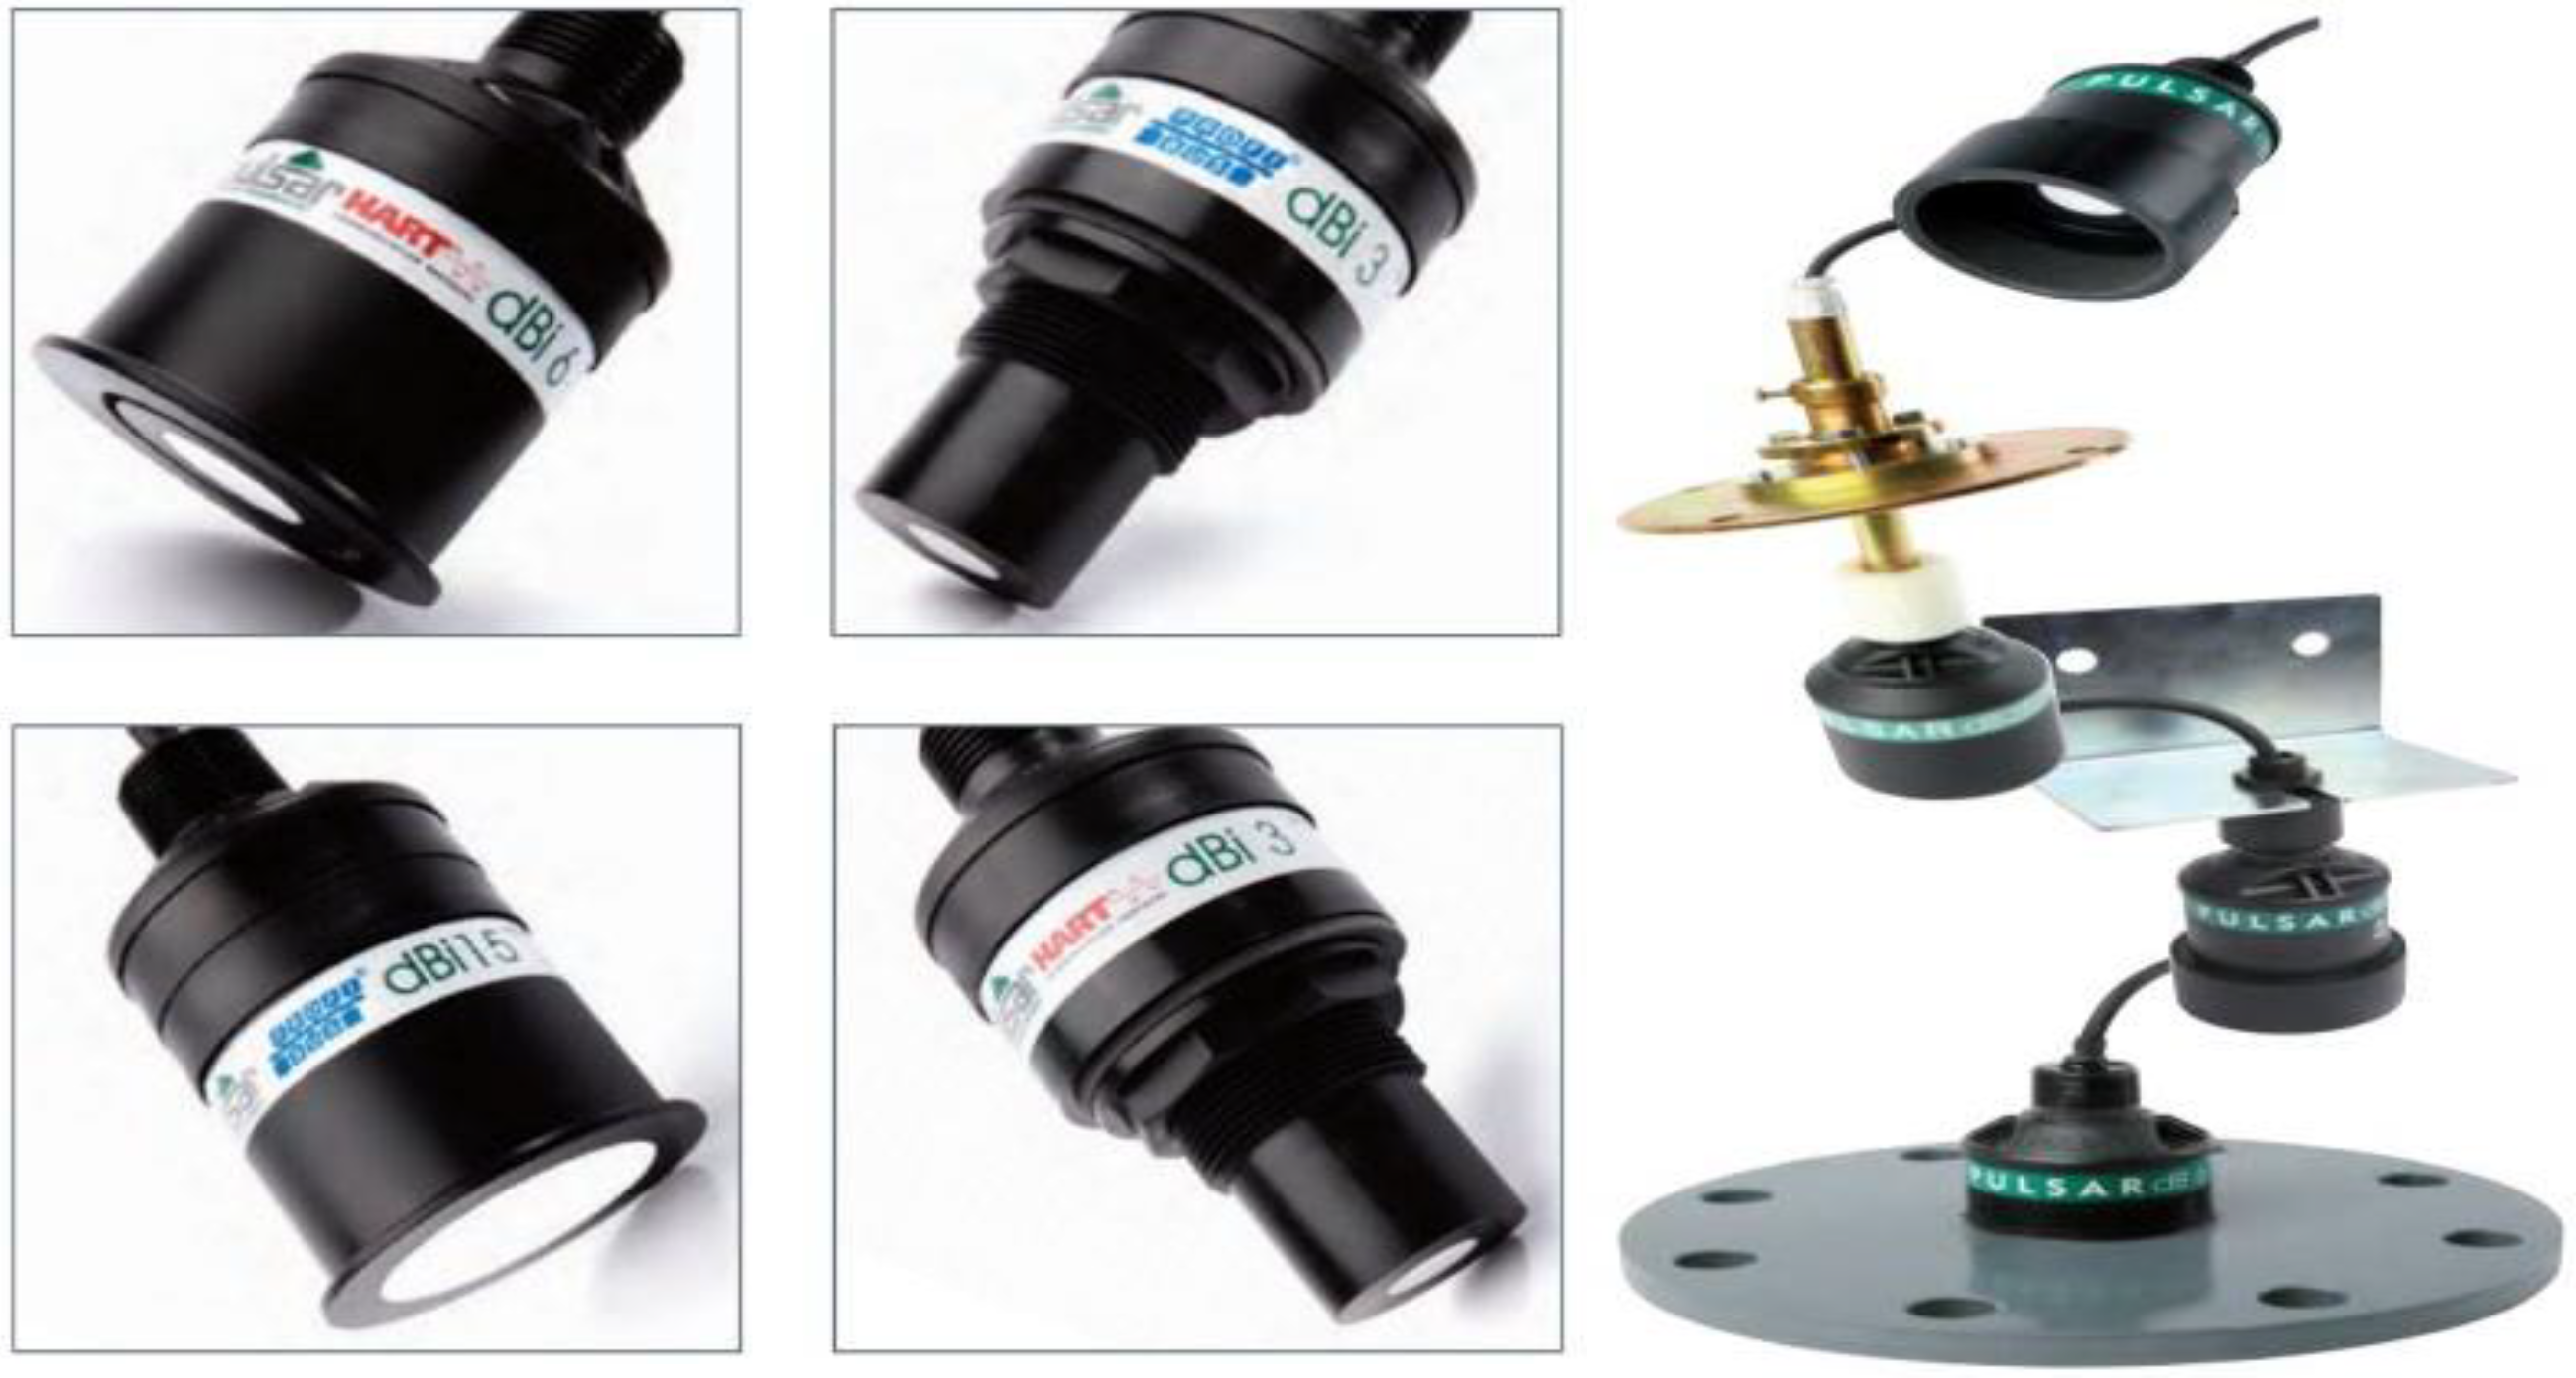
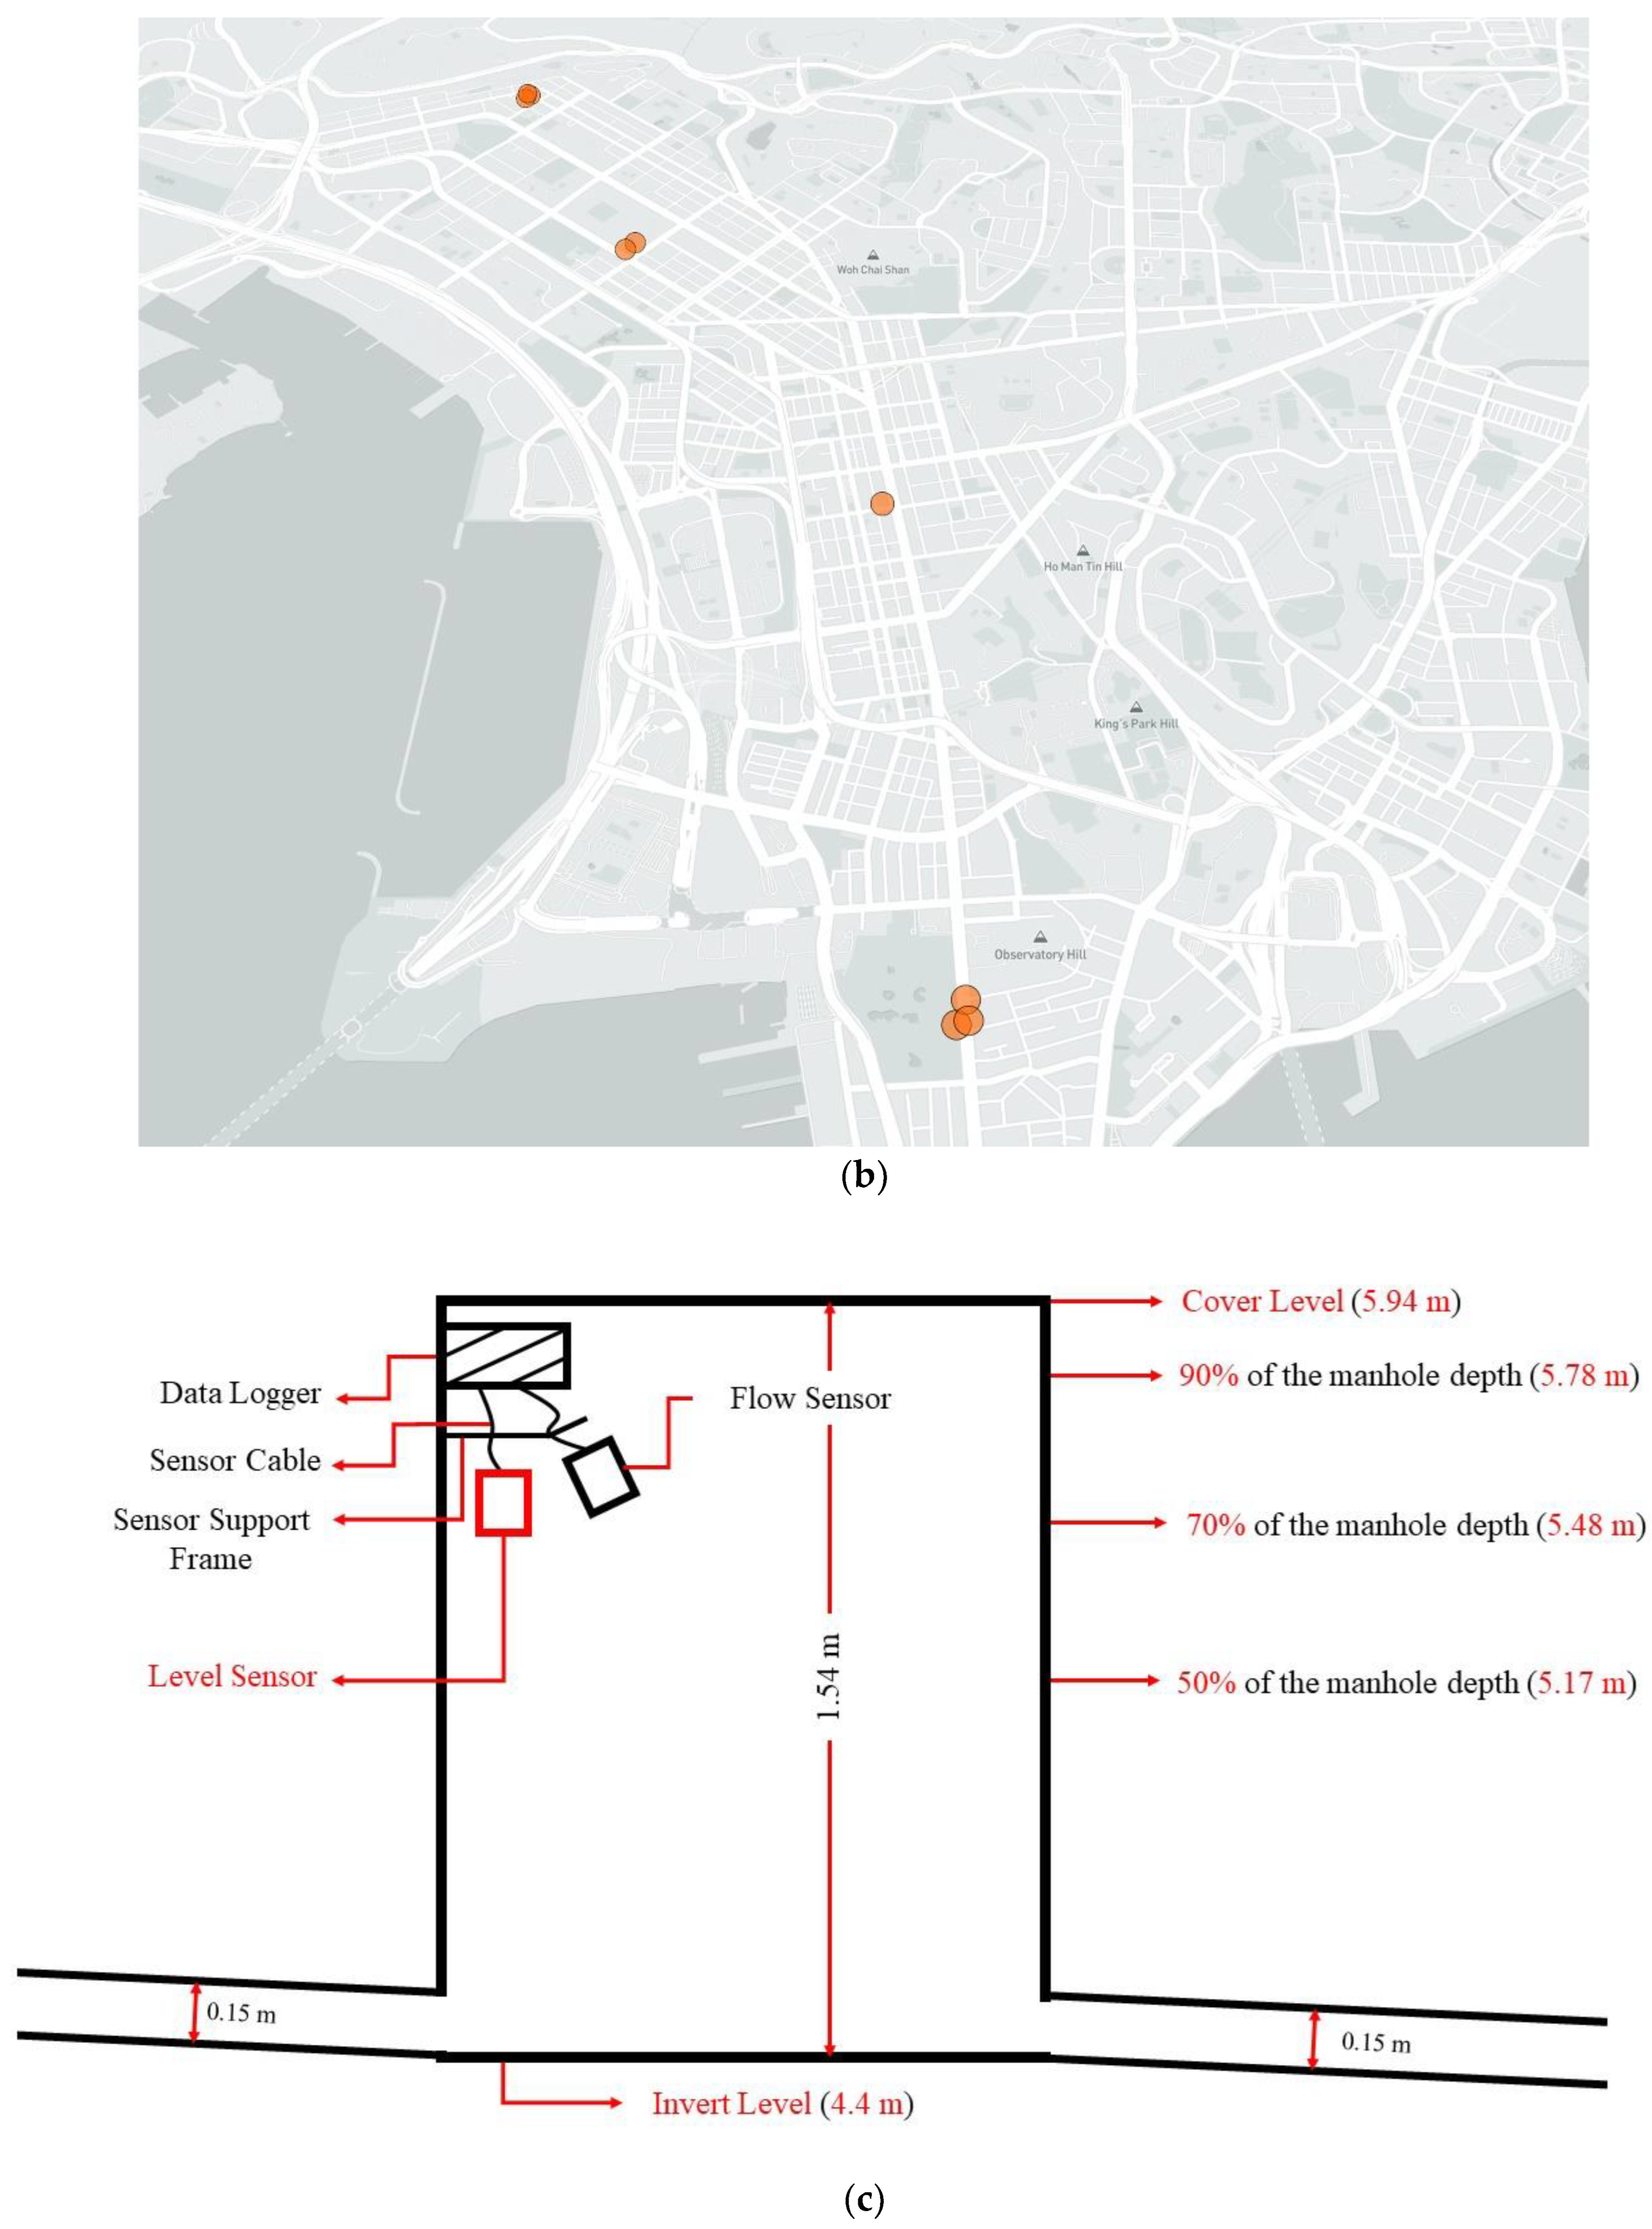
2.1. Phase I: Data Collection

This study is a part of a general research project that aims to develop a smart sewer monitoring system. This monitoring system will depend on the data collected from the sensing system connected to a cloud server. To do so, 58 smart ultrasonic level sensors and data loggers were installed in 58 manholes within four neighborhoods. These sensors are self-contained, contactless ultrasonic level sensors, and feature a choice of HART or Profibus PA communication protocols. They have set new communications and convenience standards to reliably measure the level of sewage in the field. They are low-power devices featuring Pulsar’s world-leading DATEM echo processing capability for robust, reliable measurement from 125 mm to 15 m (5 in to 49 ft), depending on the unit selected (Figure 2). The study areas were located in various locations within Kowloon, Hong Kong. All of the targeted manholes are shown in Figure 3a. These sites faced overflow complaints, so they were chosen as a preliminary sample for developing the monitoring system. The data collection process can be divided into two main stages. The first is to collect all design criteria for target manholes. The second stage was to collect the data from the sensors and combine it with the first stage’s data to comprehensively understand the performance of the network’s sewage system. Therefore, it was necessary to conduct a deep study of the sewage network in Hong Kong and find all the relevant parameters that may affect the performance of the network, which include manhole cover level, manhole invert level, output pipes diameter, invert level for output pipes, and the number of input and output sewer pipes. Some of these parameters are shown in Figure 3c, which displays an example of a sewer manhole with some important parameters that helped understand the network’s overall situation.
The second stage was the collection of level readings from the sensing system. This system provided us with a massive amount of readings from 58 sites, which include 56 sewage manholes and two stormwater manholes. It also provided us with data over the course of days, weeks, and months, which gave us an overall indication of the performance of the sewage network. The data collection process was done via HMW intelligent data logger, which has the ability to save all the collected data and send it to the server via the internet, then all the data is downloaded from there. The data was collected for one year between June 2019 and June 2020, although this varies from one sensor to another. The total number of collected readings was about three million readings from 58 manholes. However, only eight locations showed a potential partial blockage, and these locations are displayed in Figure 3b. In addition, a strong connection was ensured for each sensor, and the record data was monitored by randomly checking the connection stability at different stages of the monitoring process. Finally, based on the records that have been received from the sensors, accurate, and consistent streaming has been achieved, as all of the expected reading has been delivered by the sensors. Therefore, by having a record every 5 min for the whole duration, the IoT accuracy has been fulfilled for our sensor streaming.

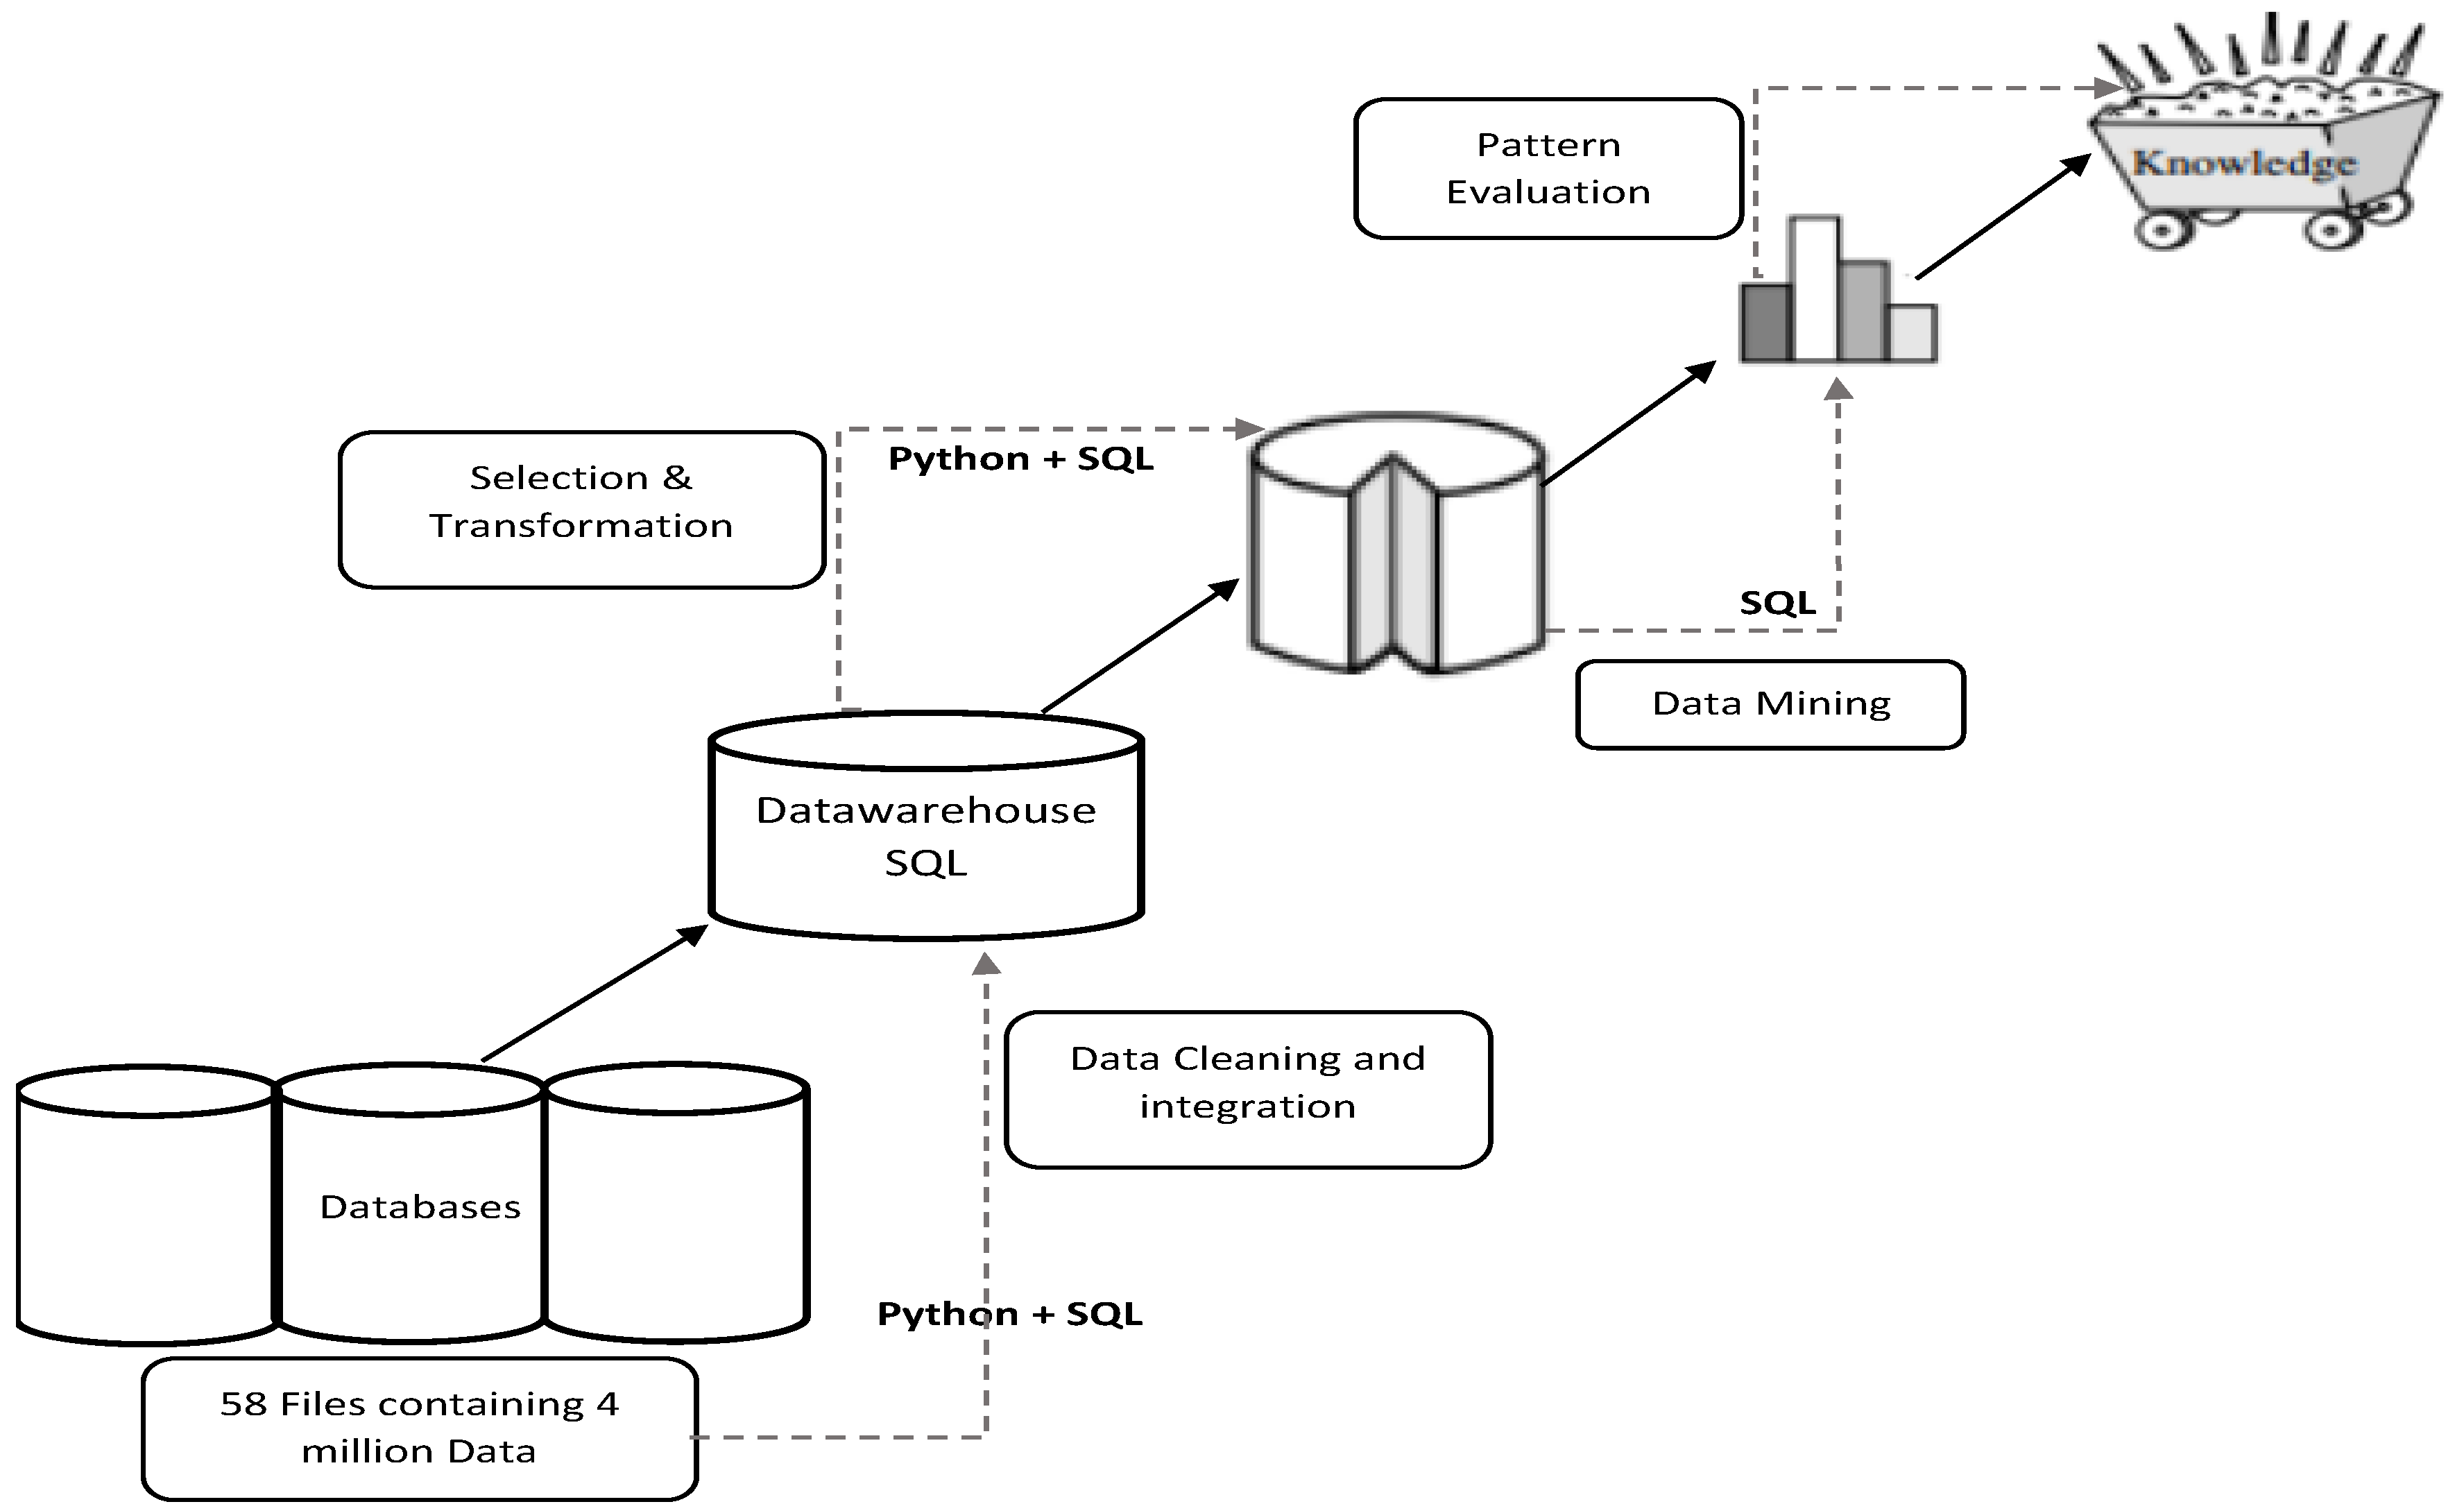
2.2. Phase II: Knowledge Discovery Process

Big data analytics is a methodology that has been enabled by recent advances in technologies that support high-speed data capture, storage, and analysis. Data sources extend beyond the traditional corporate database to include mobile device outputs, data generated by sensors, and emails as the data are no longer restricted to structured database records but rather unstructured data that does not have a standard format [22]. There is no standard definition of big data and analytics, as it is a relatively new and developing term; various researchers have provided different, sometimes contradictory, definitions. One of the first widely quoted definitions of big data resulted from the 2001 Gartner report. In this report, Gartner defined Big Data by three “v’s”, including variety, velocity, and volume. Gartner expanded his definition in 2012 to include veracity.
With a large number of data from 58 sites and 58 files, it was necessary to perform big data methods. The methods used and the knowledge discovery process are shown in Figure 4. A concise description of the main components of the flowchart is given below.

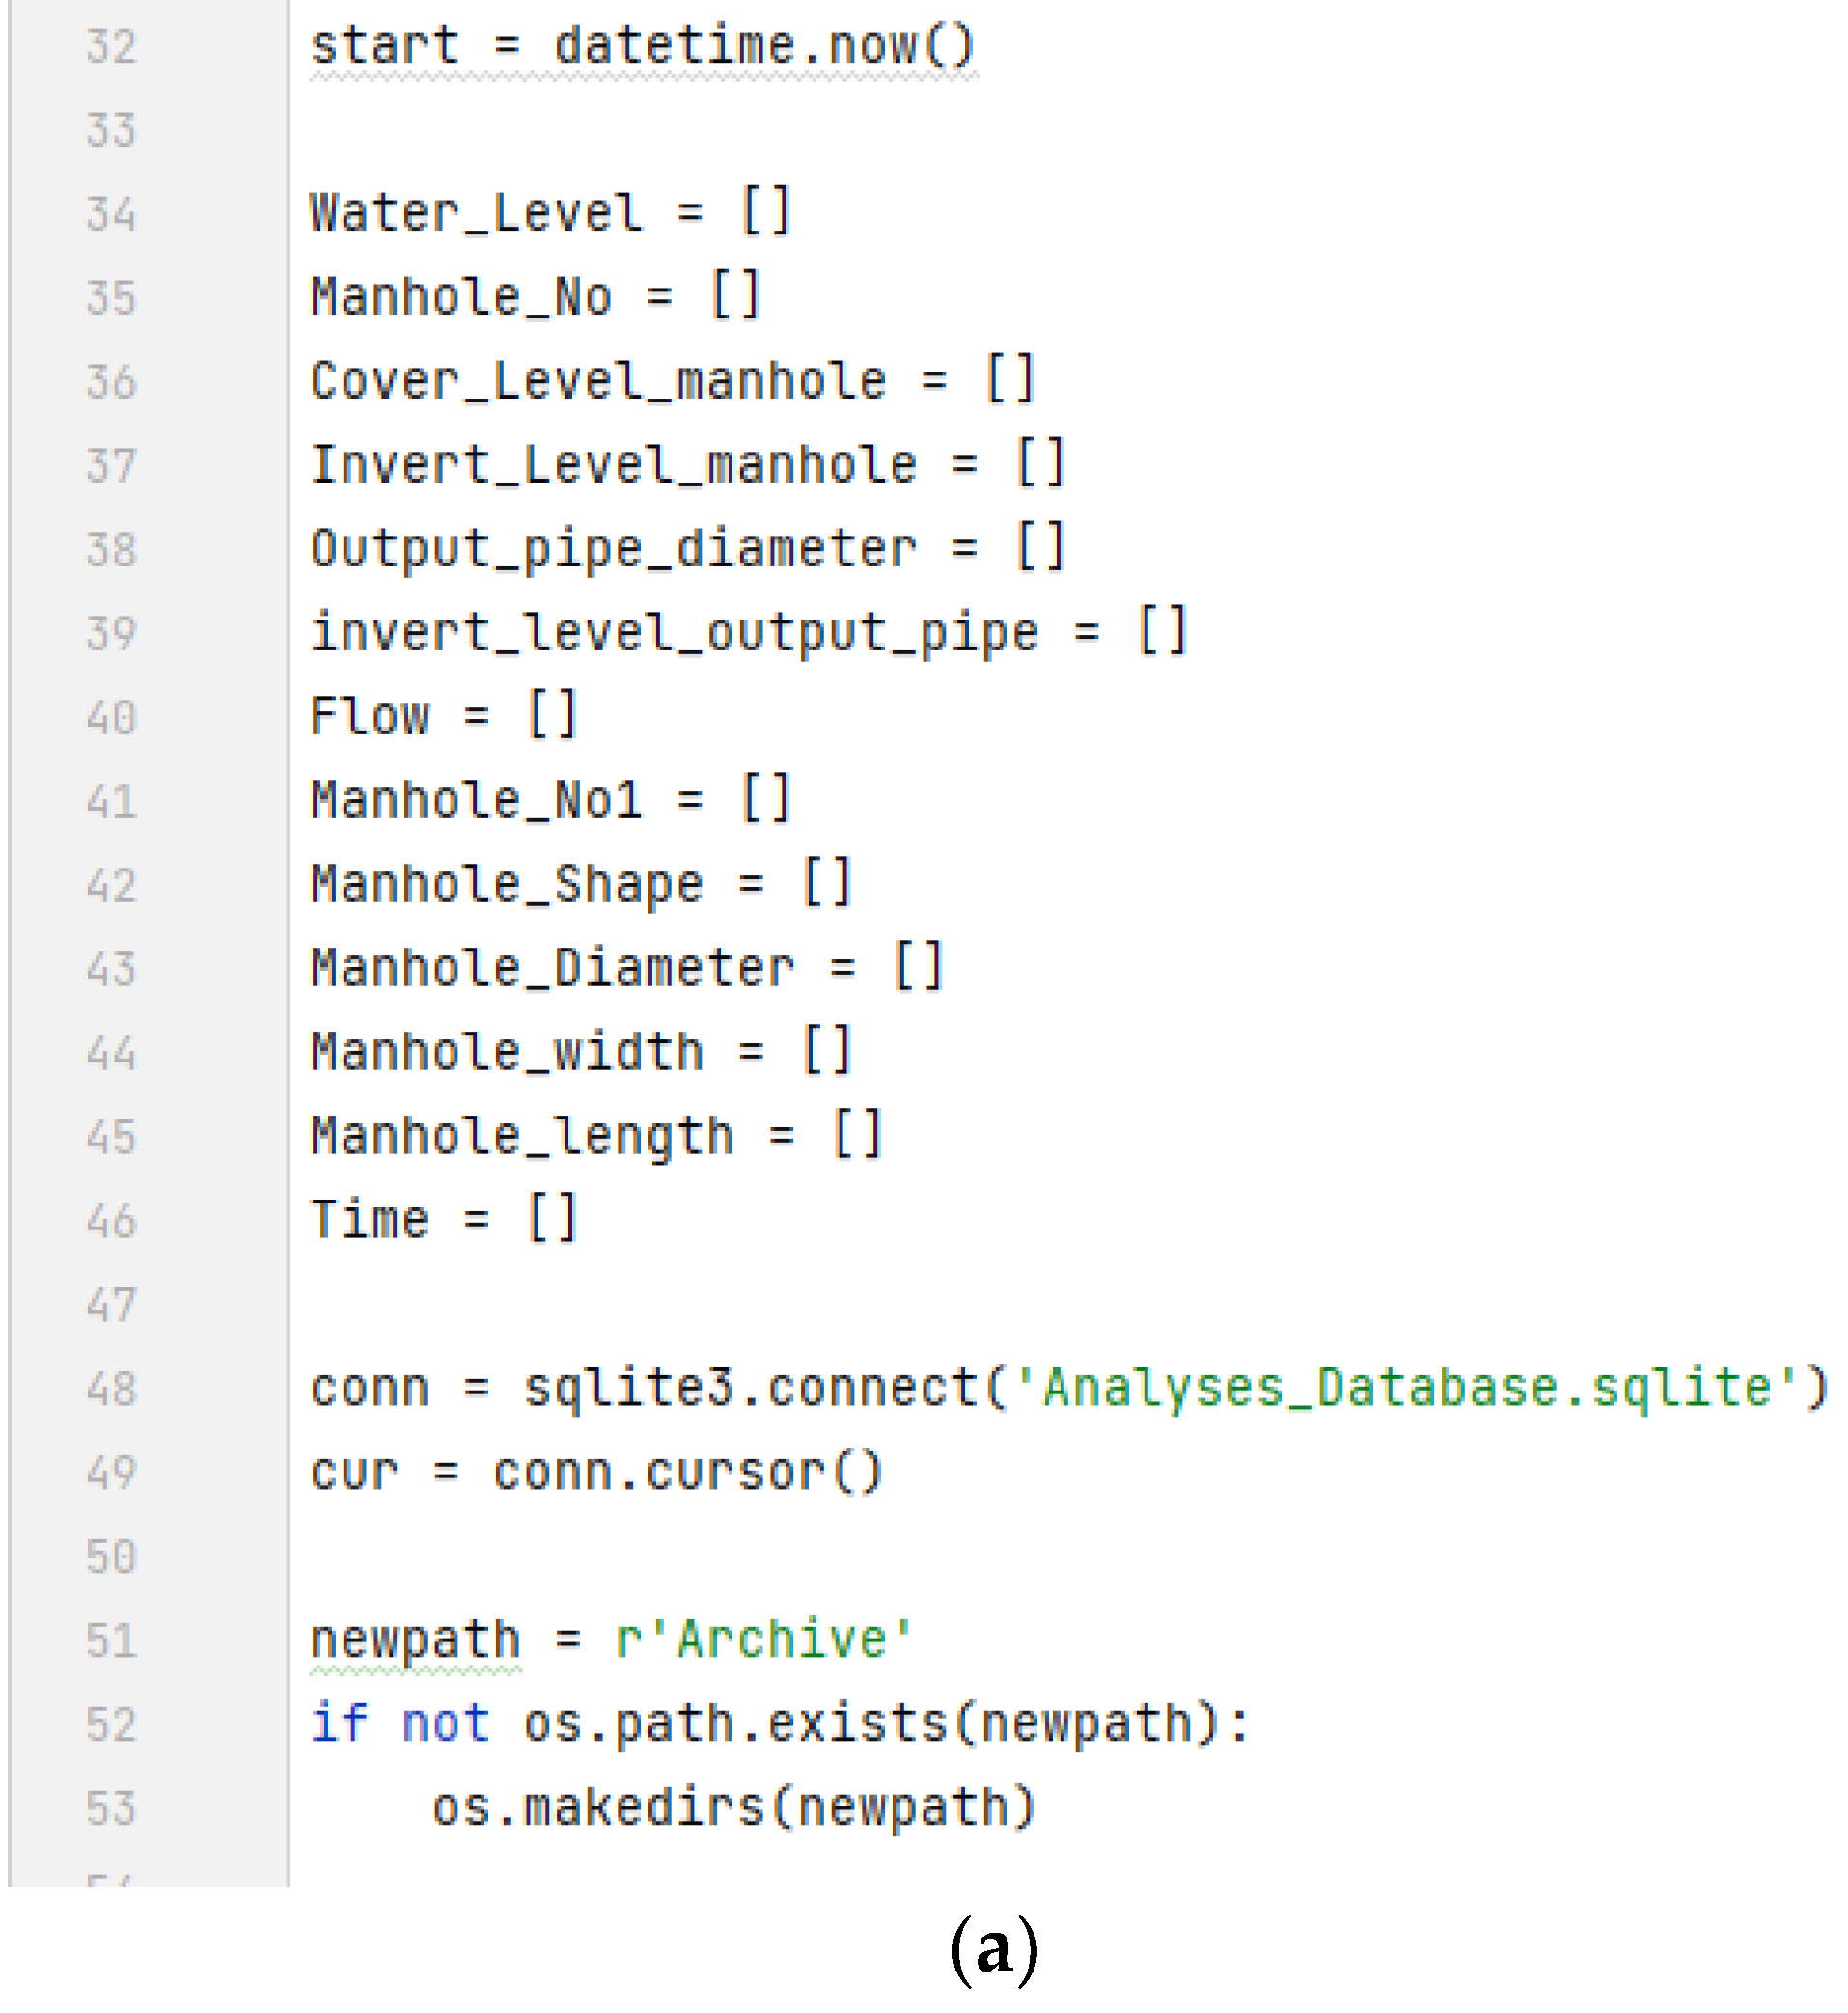
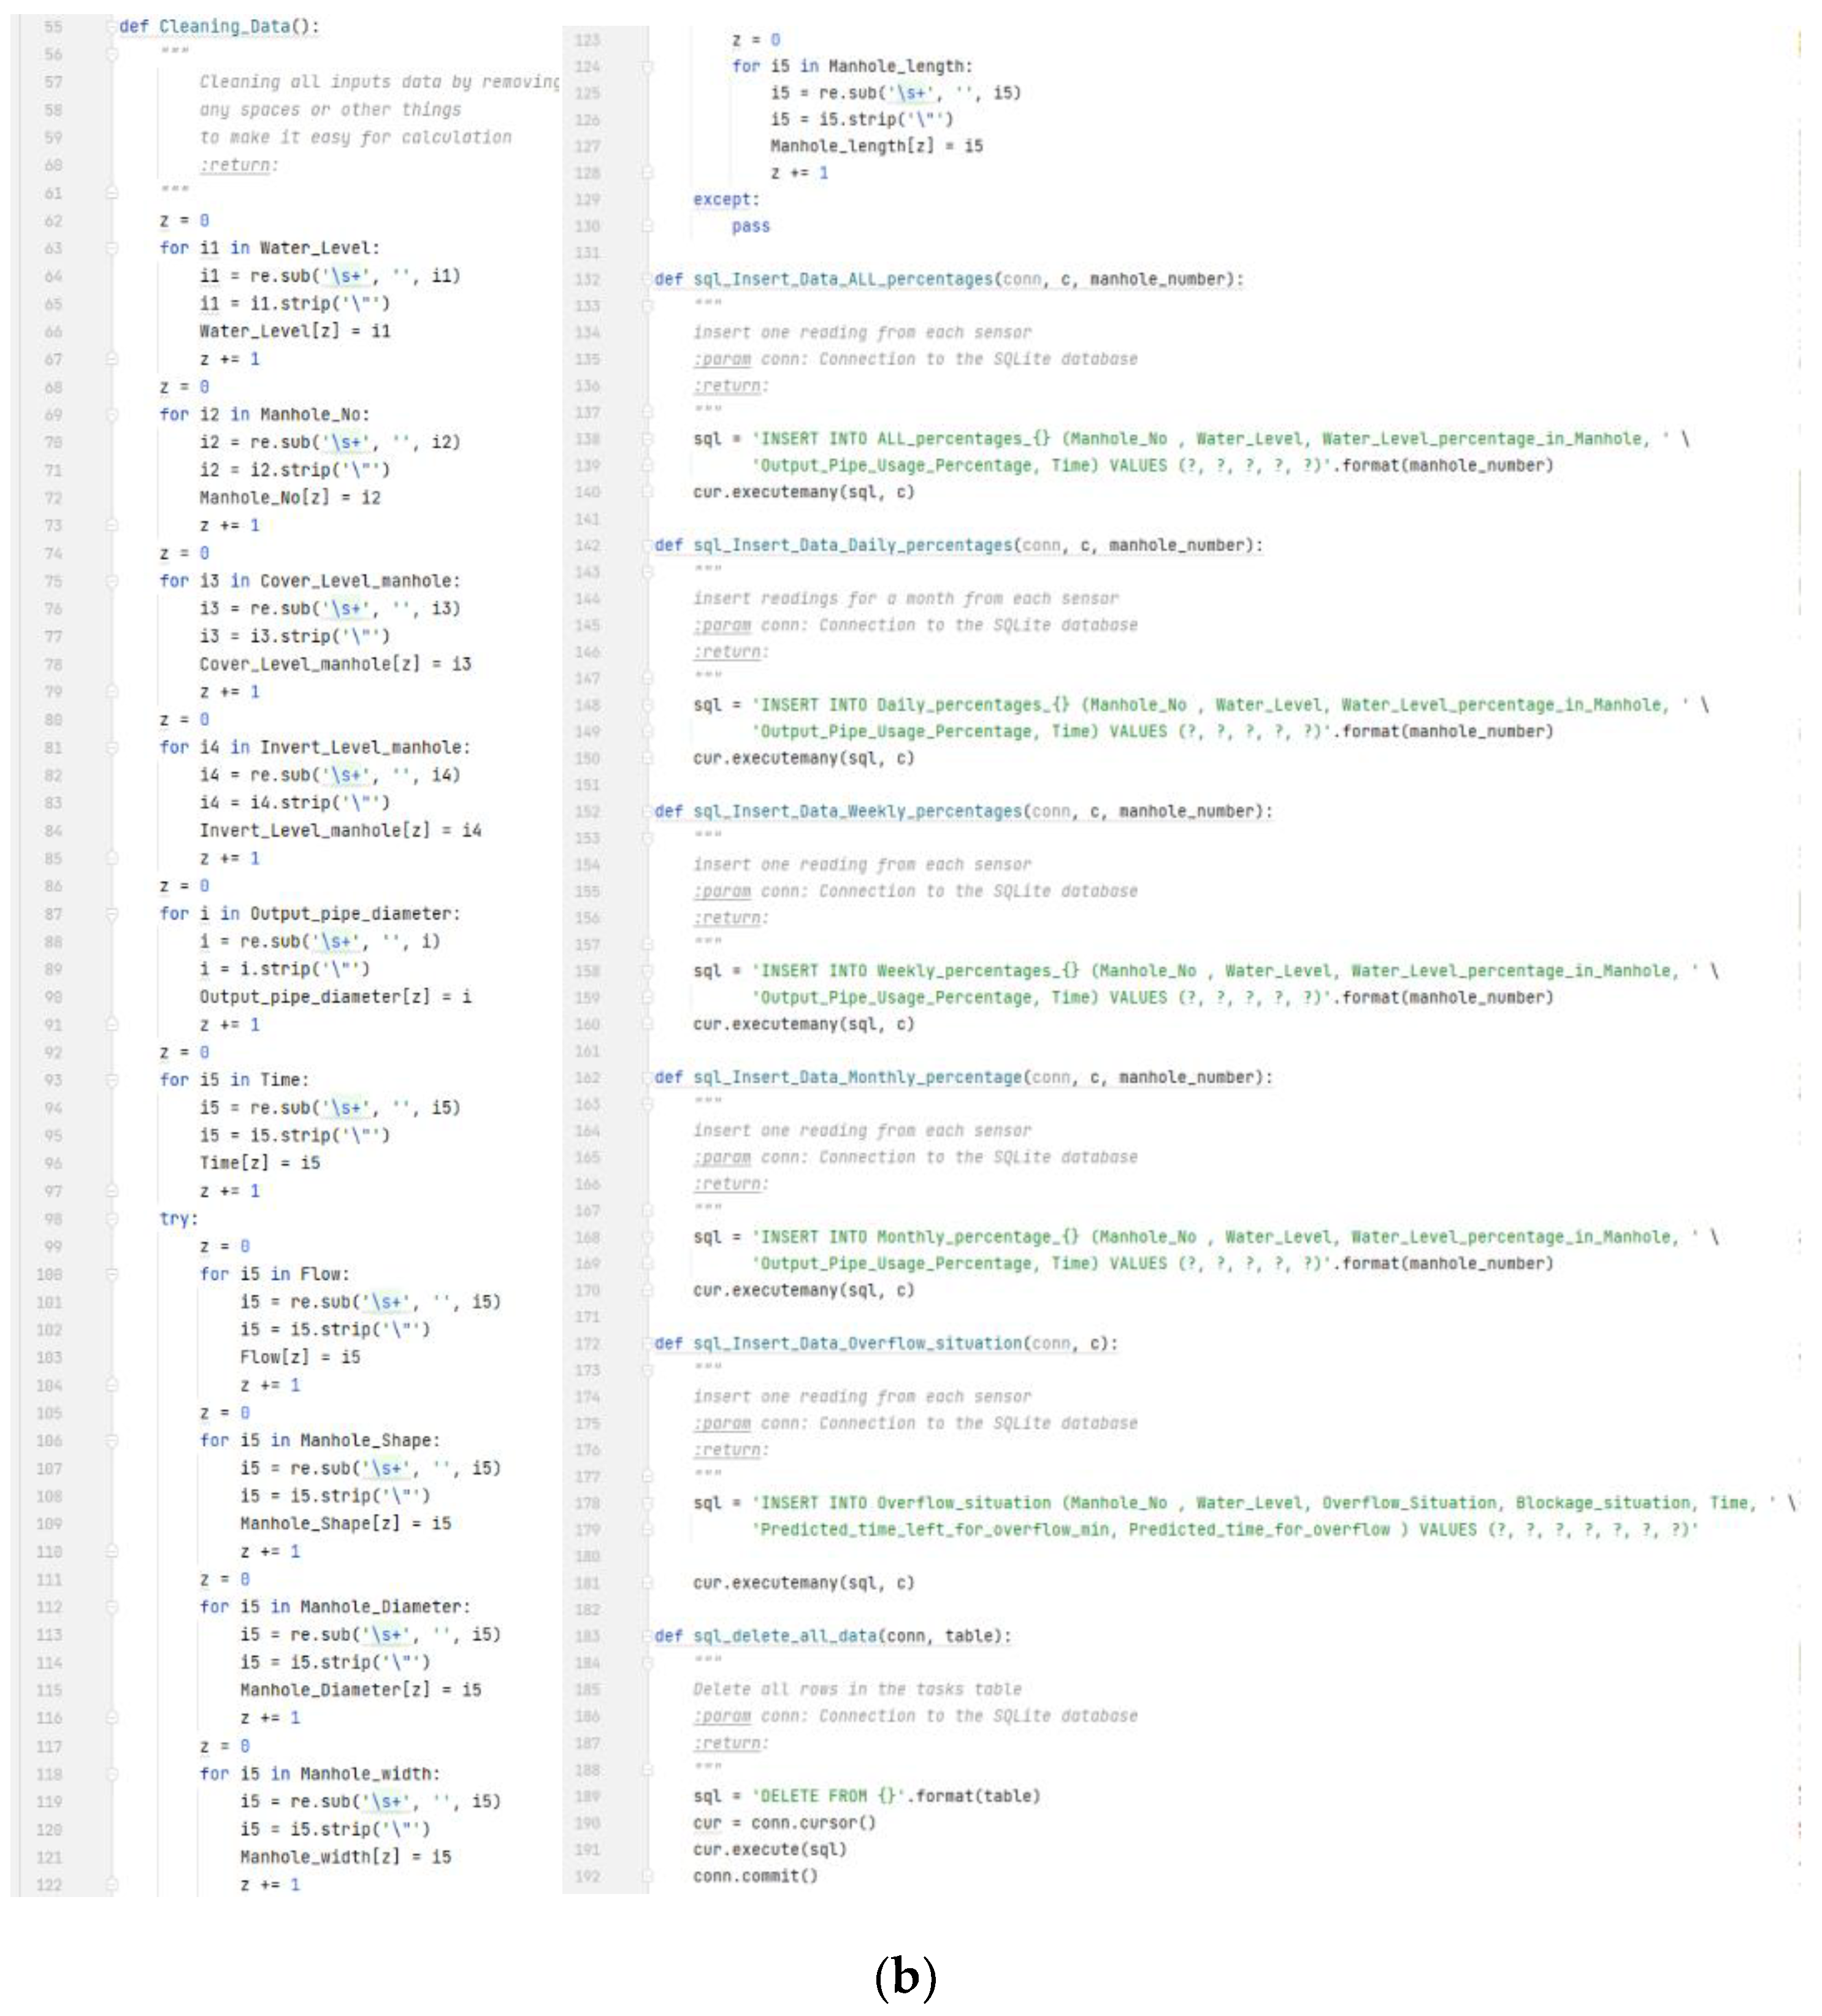
2.2.1. Data Cleaning and Integration

About 3 million wastewater level readings were collected from 58 sites. Many of these readings were inaccurate, having zero or the same value over the days. Thus, the first method applied is data cleaning, which is the process of discovering and modifying (or removing) inaccurate or irrelevant data portions from a data set [23]. The data sets we started with had nine columns; only five were found relevant to our research: water level, manhole number, manhole cover level, manhole invert level, and reading time. Excluding: sensor ID, type of sensor, flow, and water depth. Therefore, the data cleaning method was applied using both Python programming language and Structured Query Language (SQL) to remove all irrelevant columns and all rows containing missing data, zero values, and inaccurate data. The python code and the output cleaned data in the SQL database are shown in Figure 5a,b, respectively. Then, all of these readings from all level sensors were combined into one file, which would make analysis much easier. The implementation of this method significantly reduced the file size and gave us an indication of the accuracy of the data. The final number of readings after removing all inaccurate data was about 2 million. Notably, the SQL database for the cleaned data is shown in Figure A1.

2.2.2. Data Selection and Transformation

The second method applied to data sets was data selection and transformation. Data selection can be defined as the process in which data related to the analysis task are retrieved from the database for use as separate data. For example, to understand the performance of the sewage network based on hours, days, and months, algorithms must be applied to the data to extract specific data and investigate possible blockages; another algorithm will be applied to highlight the problem. On the other hand, data transformation means changing the type of data from one format to another; for instance, the times of each reading were given as a string and were not clear, which makes the analysis more difficult. Hence, a python algorithm was implemented to transform all these times to be expressed in the Unix time system. This method made the analysis faster and more accurate by allowing us to find the exact time of the problem.

2.2.3. Data Mining and Pattern Evaluation

Data mining has different definitions; some researchers argue that data mining includes all of the previously mentioned steps, while others will define it as a pattern extraction process. However, the most widely used definition of data mining is the process used to convert raw data into useful information using software to look for patterns in large data sets [24,25,26]. Getting more than two million readings can be problematic without the proper mechanism to extract all the relevant information and unique patterns. Therefore, various data mining techniques were used in our research after selecting the relevant data and converting it to other tables and formats. Such techniques included unsupervised anomaly detection to identify any unique pattern and observe any significant sewage level changes over time throughout all targeted manholes. Both Python and SQL algorithms were used to identify any unusual data records. In addition, a supervised clustering algorithm was used to determine two main groups: manholes with potential blockages and manholes without any blockage risks. The manholes included in the first group (i.e., manholes with potential blockage situations) were also categorized into two subgroups, including manholes with and without potential cleaning works. These supervised algorithms were mainly based on the change in sewage level over time for each manhole. Additionally, SQL algorithms have been applied to transform the resulted data into useful information, graphs have been developed to understand the level of sewage inside the targeted manholes during 2019/2020, and the data patterns were studied to find out the sites that encountered potential blockages in addition to studying these sites in-depth to understand the performance and risks of these cases on the sewage network.

2.3. Phase III: Cases Simulation

Initially, it is necessary to look at the overall performance to understand the general condition of all targeted manholes and find the locations with a blockage problem to focus on in this study. To do so, the selection and transformation method was implemented using both Python and SQL programming languages. The developed algorithms aim to convert the collected wastewater level readings of each manhole into ratios representing specific classes, where each class denotes the number of readings having a particular value compared to the outlet pipe or the manhole depth. The targeted class in this study refers to readings with a value greater than or equal to 100% of the diameter of the upper output pipe. The equation used to find these values is shown in Equation (1).
The   percentages   of   readings   that   had   ( specific   class ) = No .   of   readings   in   this   class Total   number   of   reading   for   a   specific   sensor
After analyzing the data, determining the locations with potential blockages, and studying these cases in-depth, it was time to study the impact of these blockages on the performance of the sewage network to determine the risks of blockages. In addition to clarifying the improvement of the network’s performance after cleaning work. Thus, to study the impact of these blockages in terms of residual time to overflow, Equation (2) was developed based on various factors such as the level of sewage inside the manhole, the cross-sectional area of the sewage manhole, the input flow, the space available in the outlet pipe and the flow velocity. Using all of these factors, the discharge of sewage inside the manhole will be calculated and based on that, the rising sewage rate will be determined; hence, the time to overflow will be calculated (Equation (2)). To cover all of the existing cases and then compare them in the three situations (i.e., normal, partial blockage, and after cleaning situations), ten inflow states were used depending on the percentage of the inflow cross-sectional area starting at 10% of the inlet pipe and ending with 100% usage. In addition, this simulation used ten cases of blockage, starting from 10% of the output pipe and ending with a complete blockage (i.e., 100% of the output pipe). Moreover, five flow velocity cases were used where we did not have the real values, and these values were estimated based on readings from the flow sensors used in the monitoring system. These five flow velocities include 0.5, 1, 2, 3, and 5 m/s. Thus, 500 cases were studied in the three situations for multiple locations.
T = ( h B )     A m ( A i A o )     v     60
where:
T is the time remaining to overflow.
h is the sewage manhole depth.
B is the initial sewage depth is the reading from which the calculation will begin.
A m is the cross-section area of the manhole (in our case 0.675 m2).
A i is the cross-section area of the input flow ( A i = percentage π r 2 ).
A o is the available cross-section area for the output pipe ( A o = ( 1 Blockage   percentage ) π r 2 ).
v is the flow velocity.

3. Results and Discussion

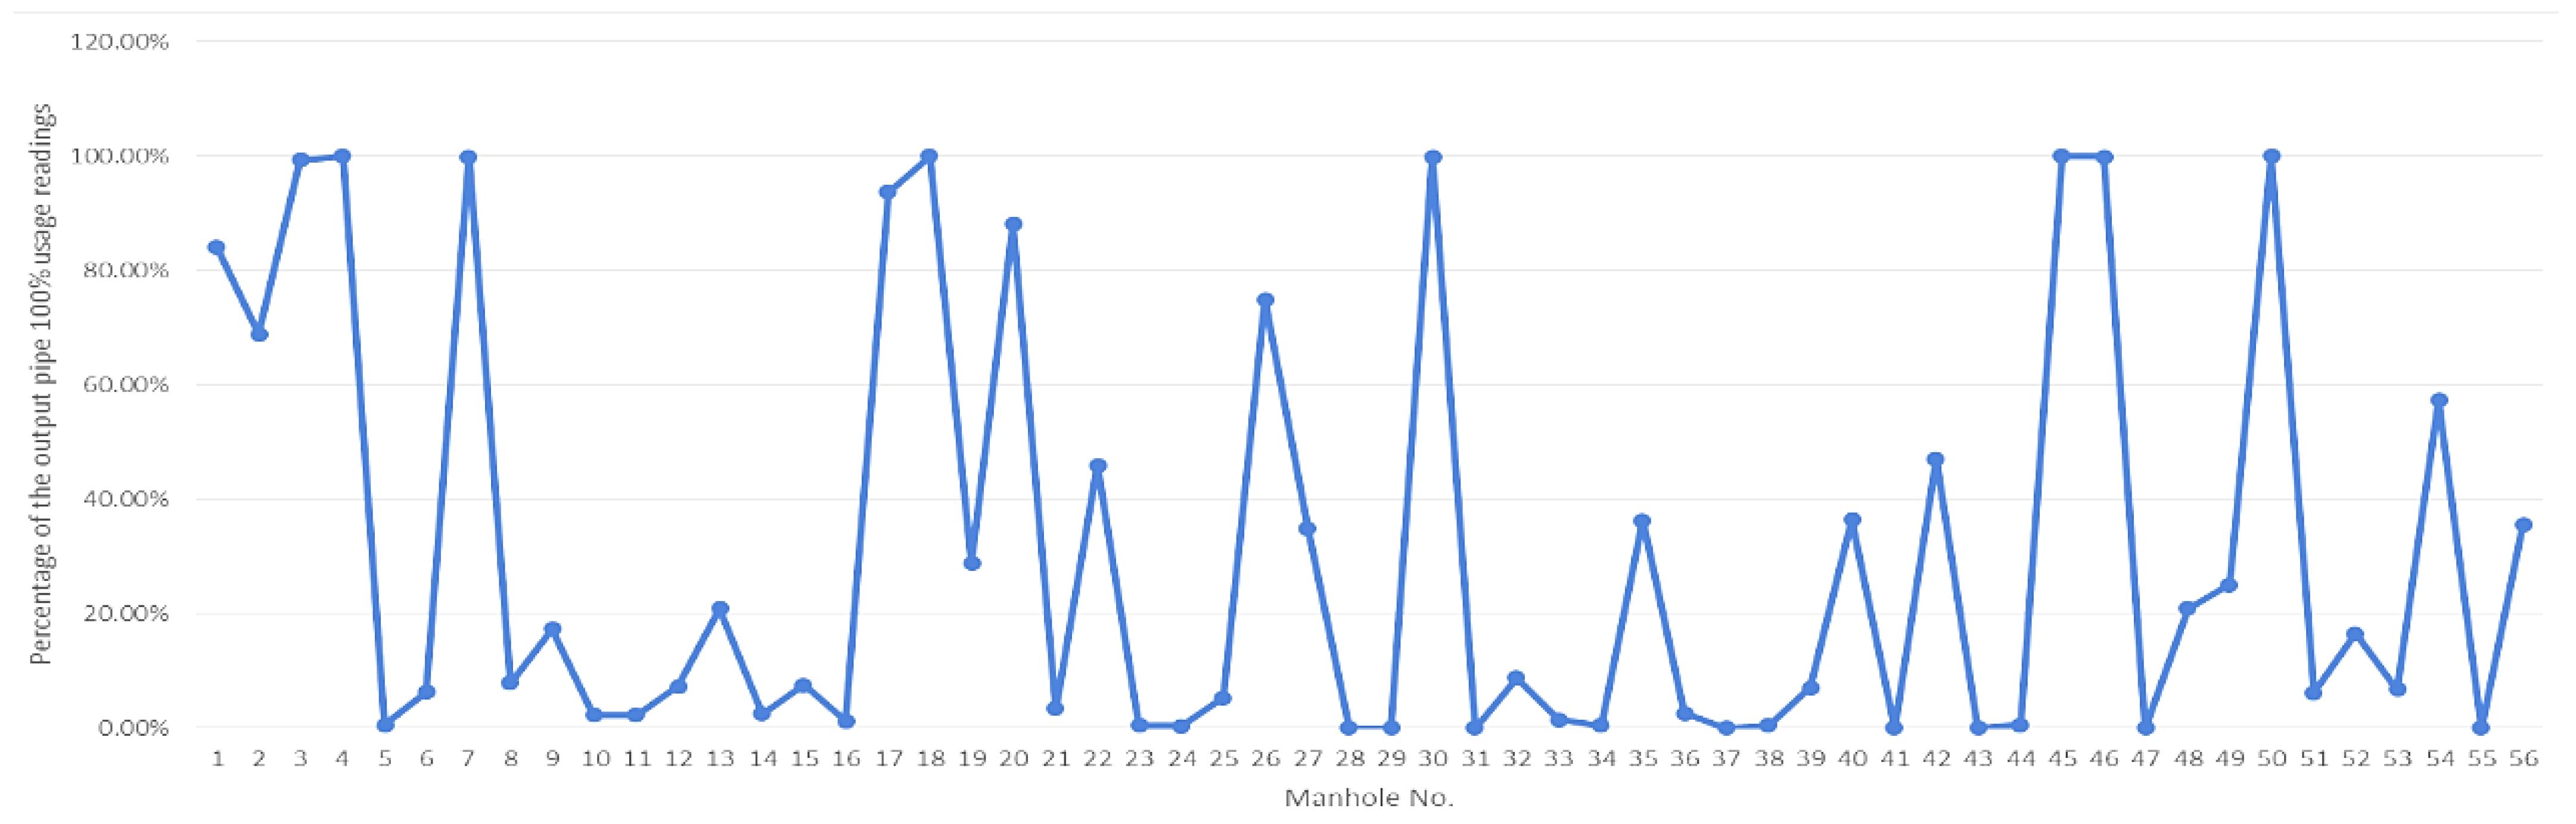
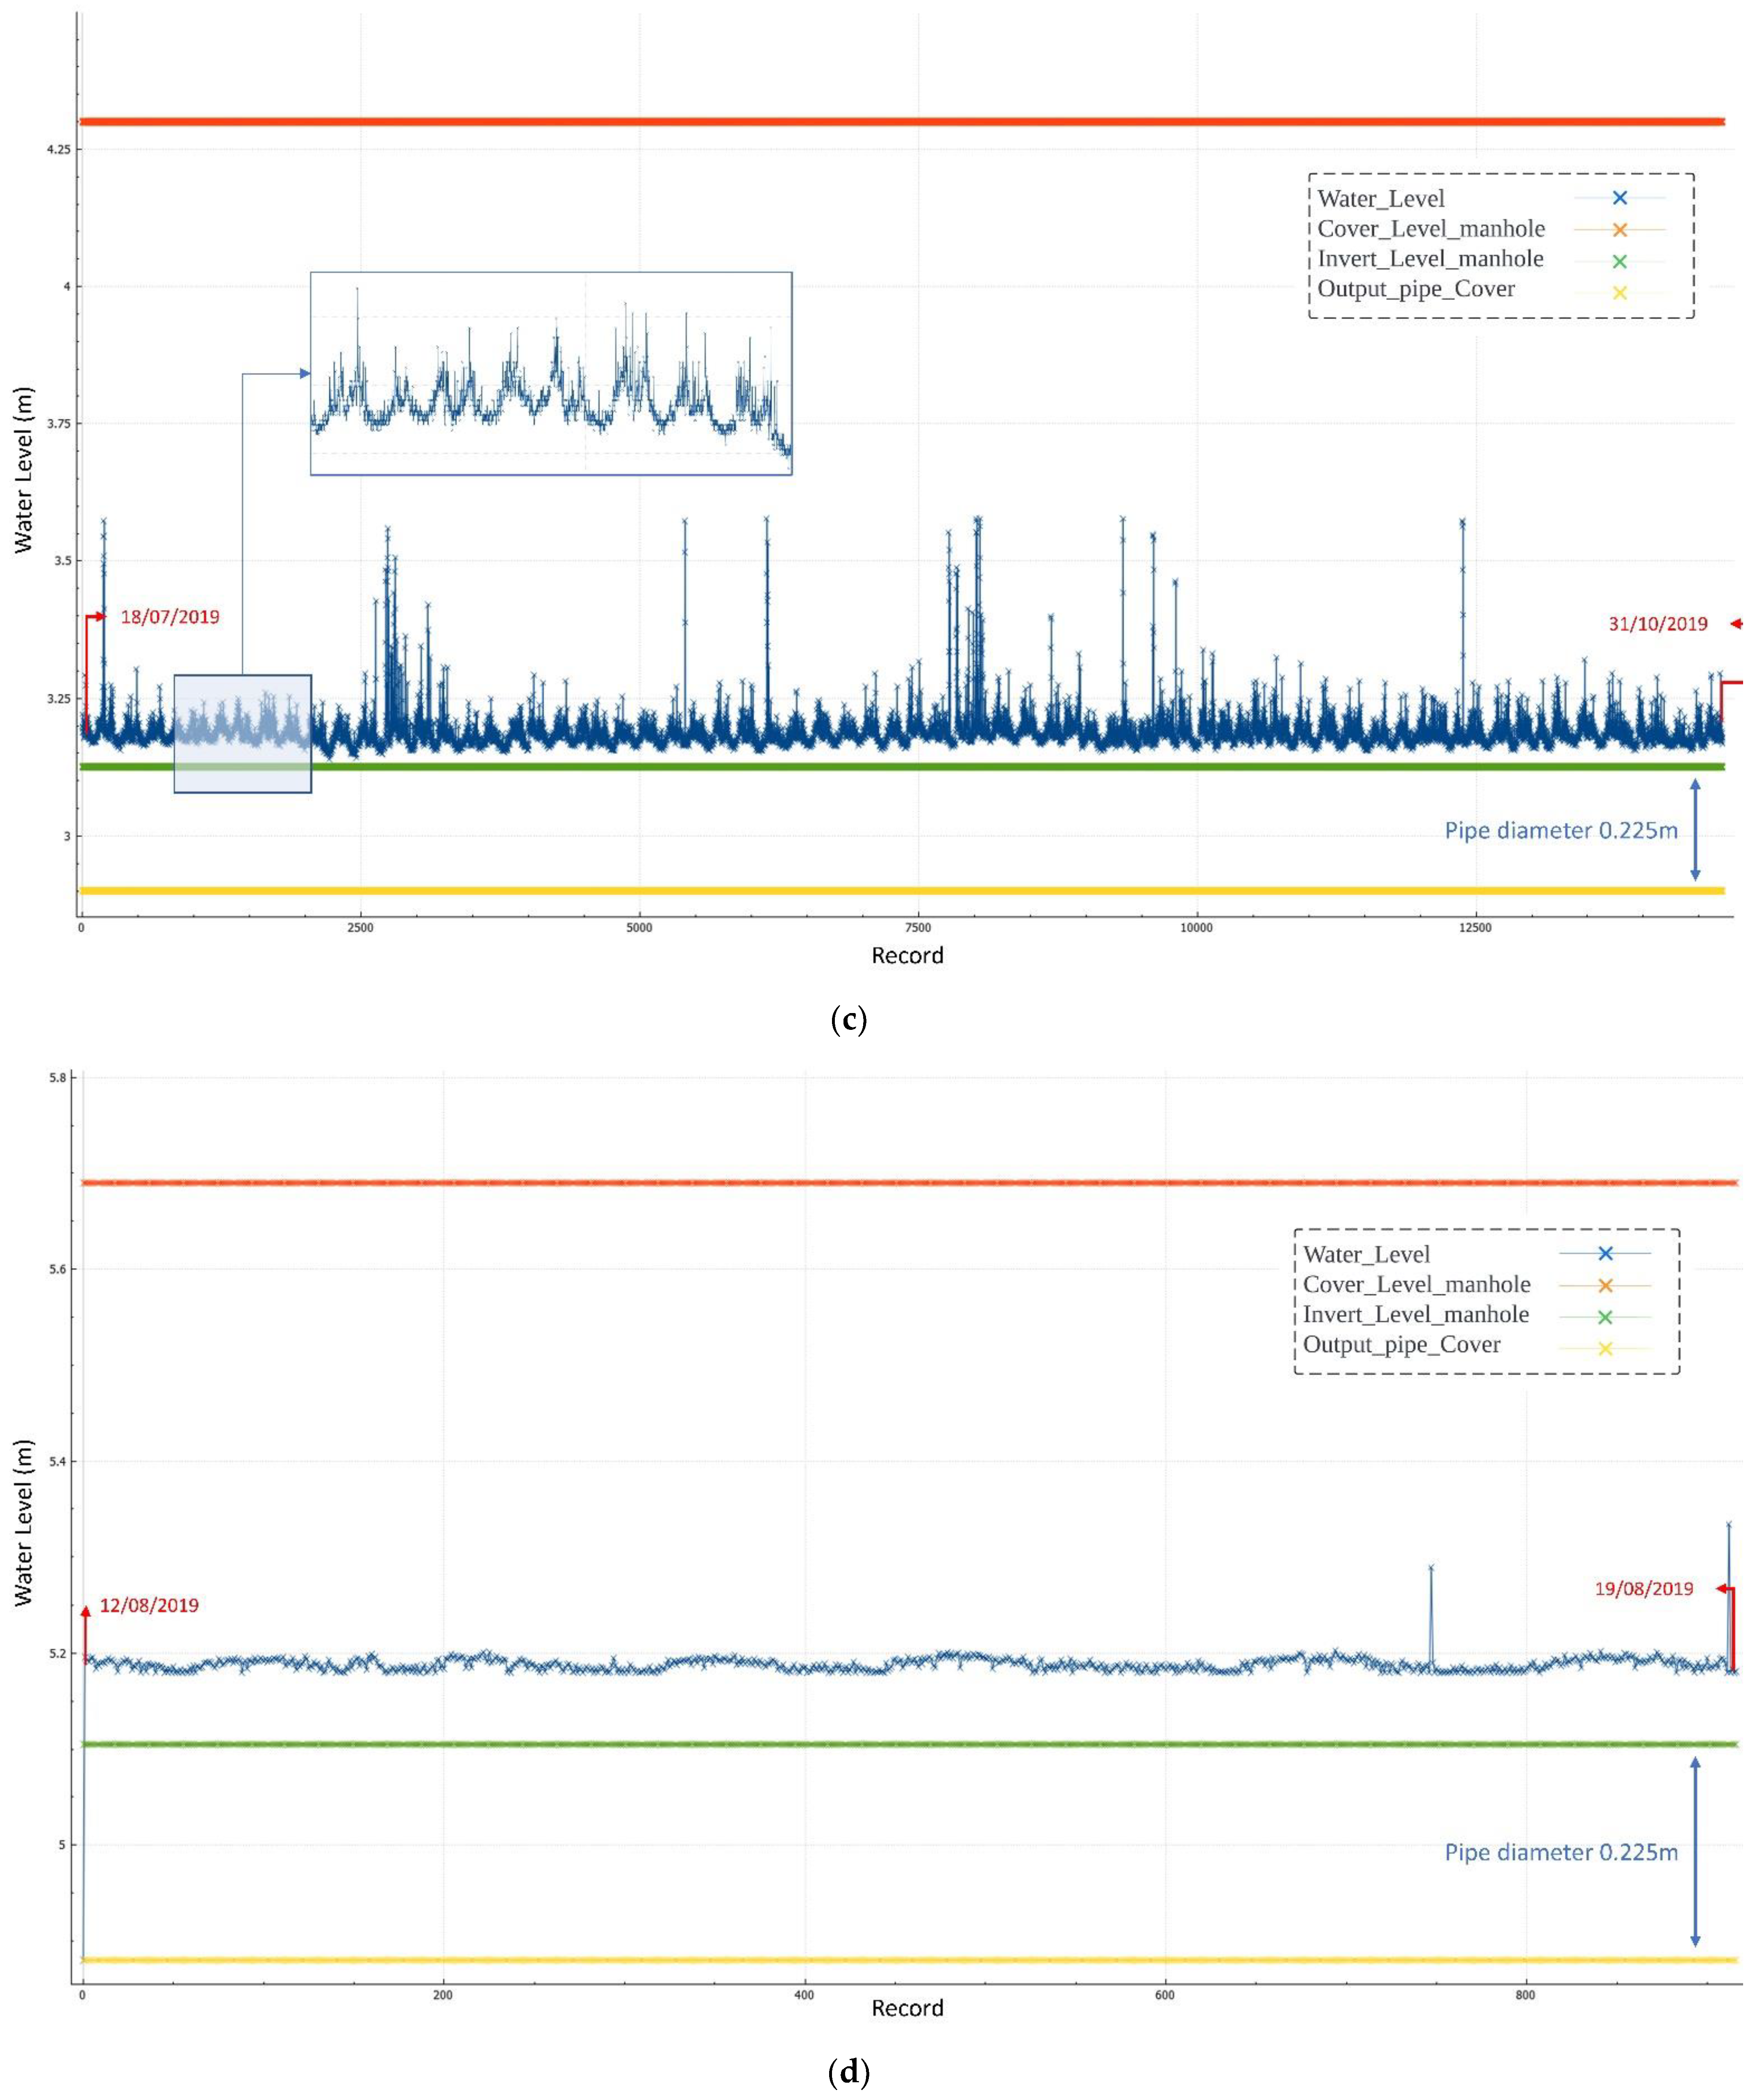
3.1. General Performance Assessment

The overall results show that most manholes have a good performance record without needing an immediate operation. However, based on Figure 6, more than 99% of the readings recorded were greater than the cover level of the outlet pipes in eight manholes. These results indicated where to begin our research and which manholes encountered clogging problems during the year studied. With a collaboration with the Drainage Service Department of Hong Kong (DSD), the manholes with a partial blockage were detected. This process was performed by comparing readings before and after cleaning work. Therefore, various cases have been studied in depth to compare the performance in different blockage situations.

3.2. Performance Assessment before and after Blockages Occurrence

After obtaining general information from the previous section about manholes that may have a problem or blockage, more analytical procedures were performed to understand how the level of sewage changed before and after blockages occurred compared to the manhole invert level, cover level, and output pipe cover level. It was observed that over 99% of the readings in eight manholes were greater than 100% of the outlet pipe level. However, the readings were within the same range (i.e., no overflow). An example of this situation is shown in Figure 7a for all data collected during a year from manhole No.17. This manhole contains an inlet and outlet pipes with a diameter of 150 mm. This figure reveals that the readings prior to 31 July 2019 showed normal variation within the pipe diameter without any excessive level increase. On the other hand, all readings between 2 August 2019 and 30 June 2020 were significantly greater than the cover level of the output pipe. The same situations were also observed for manholes No. 50, 45, 30, and 17, as shown in Figure 7b–d. Most of the collected readings from these manholes showed a sewage level greater than the outlet pipe cover level, yet with a normal fluctuation range over the study period and without any overflow situation (Figure 7c). Thus, further study on this topic was needed in two directions. First, a logical assumption and simulation will be developed based on the analysis results. Second, this assumption is validated by the cleaning work.
Our reasoning is based on the reading difference over the period of data collection. It can be seen from Figure 7a that there is a gap in the level of sewage that occurred on 1 August 2019, and then, the difference between one reading and another returned to the previous variance. This clearly shows that something happened that day, we hypothesized that, on this day, a partial blockage occurred here, and as shown in the study period, the partial blockage remained within the pipe. Additionally, the same change between readings means that the volume of the input flow was relatively equal to the output flow. Hence, this clearly means that in manhole No. 17 the inlet flow was less than 100% of the inlet pipe because with assuming a partial blockage inside the outlet tube, this manhole has one inlet and outlet pipe, and both pipes have the same diameter. The input and output flow have the same velocity; therefore, if the inflow is 100% of the inlet pipe, it means that the sewage level will continue to rise inside the manhole, and overflow will occur. However, we can notice that the variance remained the same, meaning that the inputs were relatively equal to the outputs.
The significant risks involved in these situations are when the inflow increases more than the available outlet pipe cross-sectional area (i.e., the output pipe cross-sectional area minus the blockage cross-sectional area). In this case, a flood will occur, and the level of sewage will gradually increase. However, the overflow time can vary based on the area covered by the blockage. To better understand these risks, a simulation of the time it would take for sewage to reach the cover level for manhole No. 17 was performed. This simulation started from two reading points: the first was chosen as the average of readings prior to 31 July 2019 (i.e., the sewage network is in the normal situation) and another point after 2 August 2019 (i.e., after the partial blockage has occurred). In addition, 10 blockages cases and 10 inflow cases ranging from 10% to 100% were implemented, and 5 cases were used for flow velocity. The simulation led to many situations and a comparison was made between the different cases. The general equation used to find the remaining flood time is shown in Equation (2), and Figure 7c presents the general parameters for manhole No. 17. The simulation results are presented in Table A1 in the Appendix A.
The simulation results show the differences between the normal situation (i.e., before 31 July 2019) and the partial blockage situation (i.e., after 2 August 2019) when the inflow is increased. It can be noticed from Table A1 that, in 50% of the blockage cases, there were no overflow situations with a −1 value, which means that Equation (2) did not work, as no overflow was expected. This can be clearly seen from the data collected, because most of the data had the same variation between one reading to another. On the other hand, various cases resulted in an overflow in a very short time, depending on the initial sewer condition (i.e., normal and partial lockage situations), the inflow volume and velocity, and the blockage-occupied area. For instance, in a normal situation at an inflow velocity of 0.5 m/s, sewage takes 18.65 min to overflow when the inflow is 100% of the inlet pipe area and the blockage covers 10% of the outlet pipe area. As well, in the case of partial blockage, the sewage takes 12.2 min to reach the cover level in the same situations. This observation and other situations showed that the network performance at this site was reduced by 35%, which will increase the risk of flooding, whether the sewage flow is increased or the available cross-sectional area is reduced. However, the risks of complete blockage are much higher, as shown in the simulated cases. For example, if there is a complete blockage within the outlet pipe in manhole No. 17 and the inlet flow is 100% of the pipe cross-sectional area, the sewage will reach the manhole cover level within 0.19 min if the velocity is 5 m/s. This clearly indicates the significant impact of the blockage on the sewage network. To illustrate these risks, cases of complete blockage with different flow velocities are depicted in Figure 8, as the inflow covers the inlet pipe cross-sectional area totally and the percentage reflects the blocked cross-sectional area of the outlet pipe. The results show a very fast overflow situation when the inflow velocity is high, the entire process between the 10% blockage situation and the overflow occurrence will take 1.8 min when the inflow velocity is 5 m/s. Figure 8b also shows the variance between the complete blockage case when it occurs within the normal situation and the partial blockage situation and with a different inflow when the flow velocity is 1 m/s. Based on these cases, it was clarified that the overall performance of the sewer network at this site was reduced by 35% due to partial blockage.

3.3. Performance Assessment before and after Cleaning Works

As mentioned earlier, pipe blockage has been studied in two directions. The first was to study the data and develop an assumption and simulation to understand all the expected situations. However, to confirm these assumptions and that Figure 7 presents a partial blockage situation, a collaboration was done with the DSD to understand these issues and how they resolved them. Hence, it was asserted that these cases were resolved by the cleaning works in these manholes and pipes, illustrating our assumptions. They also provided us with more data collected before and after these issues were resolved.
Drainage cleaning methods can vary from one place to another. Different methods can be used to clean sewer pipes, which include hydraulic methods (e.g., hydro jetting, flushing); mechanical methods (e.g., Rodding, Pigs, and Bucket machines); and chemical methods (e.g., chemicals and biological products). However, the method most used in our cases was the sewer rodding method. In this method, a flexible metal rod is inserted into the tube, and the motor rotates ahead with a blade, which allows it to break up grease deposits, cut roots and loosen debris. Drilling is generally used to clean lines 305 mm (12 inches) in diameter or smaller. It is a specialized method used by professional and skilled plumbers. Sometimes this is the only way to ensure that you loosen that pipe. Generally, if any cleaning method is carried out efficiently, it will achieve its purpose. Thus, we will focus more on the performance changes before and after the cleaning process.
To understand the importance of cleaning as a solution to partial blockages, two cases were studied in-depth based on data collected before and after cleaning works. The first case study was for manhole No. 17; it was observed that the sewage level readings before 31 July 2019 were within the outlet pipe diameter and were completely changed after 2 August 2019, with a 35% decrease in network performance (Figure 7a and Figure 8b). In addition, a general simulation was performed to understand the risks of leaving the outlet pipe with partial blockage. Now, to understand how cleaning works to enhance the overall performance of the sewer network, Figure 9 was developed to display the level of sewage before and after cleaning. The cleaning work by rodding was done in this manhole on 30 July 2020. A large discrepancy was found between the readings before and after the cleaning process, which proves our assumption that when the sewage level is greater than the diameter of the outlet pipe and remains within the same range without increasing, this indicates a partial blockage within the manholes and often the flow rate is the same as the outflow. A 32% increase in network performance was also observed. In addition, based on the simulated model shown in Table A1, if the inlet flow is 100% of the pipe cross-sectional area and the observed blockage is only 10% of the outlet pipe, the sewage will overflow within 12.5 min. However, nothing will happen after the cleaning is complete.
The second case study was conducted for manhole No. 54. Based on the specified threshold, this manhole encountered a lot of overflow situations. The data before and after cleaning work is displayed in Figure 9b. In this case, the difference between the blockage state (i.e., before 16 July 2019) and the normal state (i.e., after 18 July 2019) is clearly illustrated in Figure 9b. The results showed that most of the readings from this site were of a value greater than 80% of the manhole depth, and the average readings before cleaning work were 85% of the manhole depth. On the flip side, most level readings were within the output pipe diameter after cleaning. The percentage change was 93.5%, with average sewage depths (1.068 m, 0.07 m) before and after cleaning works, respectively (Figure 9b). Overall, the network performance was enhanced by 86%, which was calculated based on the time required for sewage overflow in the event of a complete blockage in both cases, indicating that the blockage was more than 80% of the cross-sectional area of the outlet sewage pipe. In addition, using Equation (2) and the simulation model, it was found that if a complete blockage occurs before cleaning work, an overflow will occur within 2 min even if the inflow is less than 10% of the inlet pipe. In the opposite direction, the sewage reaches the manhole cover level within 15 min, which means three readings to detect this increase. This increase may also create pressure that may help open the blocked pipe. These scenarios for all percentages of inflow with complete blockage of the outlet pipe are shown in Figure 10.
Nevertheless, other things besides cleaning work can be considered to enhance the general performance of the sewer network. It was observed from the collected data that sometimes self-cleaning can improve performance like manual cleaning. Effective self-cleaning sewers have sufficient sediment transfer capacity to maintain a balance between sedimentation and erosion amounts, with a time-averaged depth of sediment that reduces the combined costs of construction, operation, and maintenance. Generally, this cleaning will occur based on the flow velocity. A case of this self-cleaning was observed in manhole No. 30, where the normal flow velocity removed the partial blockage. The performance improvement was noticed based on the readings collected from this manhole; as shown in Figure 11, this change occurred within 5 min on 10 July 2020, clearly showing that this partial blockage was removed naturally by the sewage flow. After this change, the sensor readings showed that the sewage depth remained within the outlet pipe diameter, with the same variance between one reading and another (Figure 11). This can prove that a sewer network with an effective self-cleaning design can reduce the risk of partial blockage problems and thus improve the overall performance of the network.

4. Implications

4.1. Research Implications

This study offers several different theoretical and managerial implications. Concerning theoretical implications, this study sheds light on the collection of data required for recording water levels inside the manholes using IoT-based technologies. This will not only guide future researchers working on the concerned topic towards working with smart sensors but also on how to collect and process the data obtained from IoT-based technologies. In addition, a solid foundation for researchers interested in using data mining and pattern evaluation techniques is provided. Furthermore, several case study-based simulation scenarios are undertaken under diverse blockage situations, paving the way for researchers to analyze the records for either the same sensor type or newly updated ones.

4.2. Managerial Implications

The outcomes attained from this study are manifolds for the decision-makers concerned with sewer network management. First, the updated and real-time status quo of constructed sewer systems in terms of the blockage phenomenon are provided for the concerned engineers and decision-makers. This will give them a solid picture of the sewer networks under investigation, which will pave the way toward controlling the possible sewer overflow in the system.
Next, the impact of pipeline cleaning on the system’s blockage rate is elaborated for the concerned professionals, which will significantly curb the magnitude of potential sewer overflow.

5. Limitations and Future Works

Although this study provides unique findings on the sewer overflow situation for HK drainage network, the followings are the limitations and the corresponding future works:
  • There was a lack of the number of sensors coverage and distribution around HK, so one of our recommendations for concerned authorities was the need for sensors network expansion to reflect a more accurate situation for the drainage network there.
  • Although the finding of the impact of blockages on the sewer overflow occurrence was an identical point for this research, we emphasize the need to build a monitor system connected between the pipelines blockage situations and sewer overflow occurrence for our future work. Such a developed system should predict blockage occurrence by real-time analysis of streamed data provided by the sensor so that sewer overflow would be predicted and proactive decisions could be made.
  • Another limitation was the paucity of data on blockage locations inside the pipe, sewage level from different manholes around the blockage problem (i.e., readings from manholes in the same line), and physical properties such as age and materials that may provide more critical insights into blockage risks and occurrence percentage. Thus, it is recommended to collect the needed data from the different resources in future research to improve the proposed equation for estimating the remaining time to flood using other critical factors such as pipe inclination, roughness coefficient, and self-cleaning velocity.
  • While the sensors provide the decision-makers with raw data that can give an initial indication of the situation of the drainage network, the lack of connection between the sensors and an effective system depends on IoT and AI techniques to ensure accurate, smooth, and fast streaming of the network make the process less advanced, which will be the start point for our next system we intend to build. Hence, finding a stable and strong technic connection between the system and the sensors through clouding would be a foundation for that system.

6. Conclusions

This study aims to model the performance of sewage networks under diverse blockage situations in terms of overflow occurrence using IoT-based technologies. To this end, a multistage methodological approach is employed, using smart sensors installed in Hong Kong drainage networks, the utilization of novel data mining techniques, and case study simulation. Based on the results obtained, the following major conclusions are drawn:
  • Through comparisons between sewer performance and blockage situations in different cases, it was found that the general performance of the sewer was reduced by 35% due to the partial blockage situation.
  • According to the simulated cases, the risks of complete blockage are seen to be much higher, because the inside of the outlet pipe is completely blocked, causing the inlet flow to reach 100% of the pipe’s cross-sectional area. Accordingly, if the flow velocity is 0.5 m/s and 5 m/s, the sewer only takes 1.82 and 0.19 min to reach the manhole cover level.
  • It was found that the overall performance of the sewers that went through cleaning procedures was improved by 85%. In addition, different situations were simulated to study the impact of cleaning work, and it was found that if a complete blockage occurs before cleaning work, an overflow occurs within 2 min, even if the inflow is less than 10% of the inlet pipe. In the opposite direction, the sewage reaches the manhole cover level within 15 min, which means three readings to detect this increase.
Apart from the conclusions drawn from the investigation into the case study selected for this research, the following general conclusions can be drawn:
  • Sewer blockages significantly reduce the performance of the sewer pipelines, and accordingly, this will lead to the occurrence of overflow.
  • There is a strong relationship and correlation between the increased velocity and the occurrence of overflow.
  • The appropriate and prudent strategies for the cleaning of sewer pipelines lead to significant improvements in the sewer pipeline’s performance.

Author Contributions

Conceptualization, A.A. (Ahmad Alshami); methodology, A.A. (Ahmad Alshami) and M.E.; software, A.A. (Ahmad Alshami) and M.E.; validation, A.A. (Ahmad Alshami) and M.E.; formal analysis, A.A. (Ahmad Alshami); investigation, A.A. (Ahmad Alshami); resources, T.Z.; data curation, A.A. (Ahmad Alshami) and T.Z.; writing—original draft preparation, A.A. (Ahmad Alshami), M.E., S.R.M., A.F.K., T.Z., M.M.H. and A.A. (Ashraf Alyanbaawi); writing—review and editing, A.A. (Ahmad Alshami), M.M.H., M.E. and S.R.M.; supervision, S.R.M. and T.Z.; project administration, A.A. (Ahmad Alshami) and T.Z.; and funding acquisition, T.Z. All authors have read and agreed to the published version of the manuscript.

Funding

This research received funds from the Hong Kong Environment and Conservation Fund (ECF) under grant number ECF 58/2019.

Institutional Review Board Statement

Not applicable.

Informed Consent Statement

Not applicable.

Data Availability Statement

All the data derived from the study are presented in the paper. However, further inquiries could be directed to either the first or corresponding authors.

Acknowledgments

The authors acknowledge the support of the Drainage Services Department (DSD) of the HKSAR in providing data and support.

Conflicts of Interest

The authors declare no conflict of interest.

Appendix A

Table A1. In this table, considering various blockage and inflow situations, the predictions of overflow are provided.
Blockage Percentage In Output Pipe (SLPBC = 4.982m, SD = 0.582 m)Blockage Percentage In Output Pipe (SLPBC = 4.476 m, SD = 0.08 m)
I: Flow Velocity = 0.5 m/s
Input Flow Percentage0.10.20.30.40.50.60.70.80.910.10.20.30.40.50.60.70.80.91
0.1−1.00−1.00−1.00−1.00−1.00−1.00−1.00−1.00−1.0012.20−1.00−1.00−1.00−1.00−1.00−1.00−1.00−1.00−1.0018.65
0.2−1.00−1.00−1.00−1.00−1.00−1.00−1.00−1.0012.206.10−1.00−1.00−1.00−1.00−1.00−1.00−1.00−1.0018.659.32
0.3−1.00−1.00−1.00−1.00−1.00−1.00−1.0012.206.104.07−1.00−1.00−1.00−1.00−1.00−1.00−1.0018.659.326.22
0.4−1.00−1.00−1.00−1.00−1.00−1.0012.206.104.073.05−1.00−1.00−1.00−1.00−1.00−1.0018.659.326.224.66
0.5−1.00−1.00−1.00−1.00−1.0012.206.104.073.052.44−1.00−1.00−1.00−1.00−1.0018.659.326.224.663.73
0.6−1.00−1.00−1.00−1.0012.206.104.073.052.442.03−1.00−1.00−1.00−1.0018.659.326.224.663.733.11
0.7−1.00−1.00−1.0012.206.104.073.052.442.031.74−1.00−1.00−1.0018.659.326.224.663.733.112.66
0.8−1.00−1.0012.206.104.073.052.442.031.741.53−1.00−1.0018.659.326.224.663.733.112.662.33
0.9−1.0012.206.104.073.052.442.031.741.531.36−1.0018.659.326.224.663.733.112.662.332.07
112.206.104.073.052.442.031.741.531.361.2218.659.326.224.663.733.112.662.332.071.86
II: Flow Velocity = 1.0 m/s
Input Flow Percentage0.10.20.30.40.50.60.70.80.910.10.20.30.40.50.60.70.80.91
0.1−1.00−1.00−1.00−1.00−1.00−1.00−1.00−1.00−1.006.10−1.00−1.00−1.00−1.00−1.00−1.00−1.00−1.00−1.009.32
0.2−1.00−1.00−1.00−1.00−1.00−1.00−1.00−1.006.103.05−1.00−1.00−1.00−1.00−1.00−1.00−1.00−1.009.324.66
0.3−1.00−1.00−1.00−1.00−1.00−1.00−1.006.103.052.03−1.00−1.00−1.00−1.00−1.00−1.00−1.009.324.663.11
0.4−1.00−1.00−1.00−1.00−1.00−1.006.103.052.031.53−1.00−1.00−1.00−1.00−1.00−1.009.324.663.112.33
0.5−1.00−1.00−1.00−1.00−1.006.103.052.031.531.22−1.00−1.00−1.00−1.00−1.009.324.663.112.331.86
0.6−1.00−1.00−1.00−1.006.103.052.031.531.221.02−1.00−1.00−1.00−1.009.324.663.112.331.861.55
0.7−1.00−1.00−1.006.103.052.031.531.221.020.87−1.00−1.00−1.009.324.663.112.331.861.551.33
0.8−1.00−1.006.103.052.031.531.221.020.870.76−1.00−1.009.324.663.112.331.861.551.331.17
0.9−1.006.103.052.031.531.221.020.870.760.68−1.009.324.663.112.331.861.551.331.171.04
16.103.052.031.531.221.020.870.760.680.619.324.663.112.331.861.551.331.171.040.93
III: Flow Velocity = 2.0 m/s
Input Flow Percentage0.10.20.30.40.50.60.70.80.910.10.20.30.40.50.60.70.80.91
0.1−1.00−1.00−1.00−1.00−1.00−1.00−1.00−1.00−1.003.05−1.00−1.00−1.00−1.00−1.00−1.00−1.00−1.00−1.004.66
0.2−1.00−1.00−1.00−1.00−1.00−1.00−1.00−1.003.051.53−1.00−1.00−1.00−1.00−1.00−1.00−1.00−1.004.662.33
0.3−1.00−1.00−1.00−1.00−1.00−1.00−1.003.051.531.02−1.00−1.00−1.00−1.00−1.00−1.00−1.004.662.331.55
0.4−1.00−1.00−1.00−1.00−1.00−1.003.051.531.020.76−1.00−1.00−1.00−1.00−1.00−1.004.662.331.551.17
0.5−1.00−1.00−1.00−1.00−1.003.051.531.020.760.61−1.00−1.00−1.00−1.00−1.004.662.331.551.170.93
0.6−1.00−1.00−1.00−1.003.051.531.020.760.610.51−1.00−1.00−1.00−1.004.662.331.551.170.930.78
0.7−1.00−1.00−1.003.051.531.020.760.610.510.44−1.00−1.00−1.004.662.331.551.170.930.780.67
0.8−1.00−1.003.051.531.020.760.610.510.440.38−1.00−1.004.662.331.551.170.930.780.670.58
0.9−1.003.051.531.020.760.610.510.440.380.34−1.004.662.331.551.170.930.780.670.580.52
13.051.531.020.760.610.510.440.380.340.314.662.331.551.170.930.780.670.580.520.47
IV: Flow Velocity = 3.0 m/s
Input Flow Percentage0.10.20.30.40.50.60.70.80.910.10.20.30.40.50.60.70.80.91
0.1−1.00−1.00−1.00−1.00−1.00−1.00−1.00−1.00−1.002.03−1.00−1.00−1.00−1.00−1.00−1.00−1.00−1.00−1.003.11
0.2−1.00−1.00−1.00−1.00−1.00−1.00−1.00−1.002.031.02−1.00−1.00−1.00−1.00−1.00−1.00−1.00−1.003.111.55
0.3−1.00−1.00−1.00−1.00−1.00−1.00−1.002.031.020.68−1.00−1.00−1.00−1.00−1.00−1.00−1.002.031.021.04
0.4−1.00−1.00−1.00−1.00−1.00−1.002.031.020.680.51−1.00−1.00−1.00−1.00−1.00−1.003.111.551.040.78
0.5−1.00−1.00−1.00−1.00−1.002.031.020.680.510.41−1.00−1.00−1.00−1.00−1.003.111.551.040.780.62
0.6−1.00−1.00−1.00−1.002.031.020.680.510.410.34−1.00−1.00−1.00−1.003.111.551.040.780.620.52
0.7−1.00−1.00−1.002.031.020.680.510.410.340.29−1.00−1.00−1.003.111.551.040.780.620.520.44
0.8−1.00−1.002.031.020.680.510.410.340.290.25−1.00−1.003.111.551.040.780.620.520.440.39
0.9−1.002.031.020.680.510.410.340.290.250.23−1.003.111.551.040.780.620.520.440.390.35
12.031.020.680.510.410.340.290.250.230.203.111.551.040.780.620.520.440.390.350.20
V: Flow Velocity = 5.0 m/s
Input Flow Percentage0.10.20.30.40.50.60.70.80.910.10.20.30.40.50.60.70.80.91
0.1−1.00−1.00−1.00−1.00−1.00−1.00−1.00−1.00−1.001.22−1.00−1.00−1.00−1.00−1.00−1.00−1.00−1.00−1.001.86
0.2−1.00−1.00−1.00−1.00−1.00−1.00−1.00−1.001.220.61−1.00−1.00−1.00−1.00−1.00−1.00−1.00−1.001.860.93
0.3−1.00−1.00−1.00−1.00−1.00−1.00−1.002.031.020.68−1.00−1.00−1.00−1.00−1.00−1.00−1.003.111.551.04
0.4−1.00−1.00−1.00−1.00−1.00−1.001.220.610.410.31−1.00−1.00−1.00−1.00−1.00−1.001.860.930.620.47
0.5−1.00−1.00−1.00−1.00−1.001.220.610.410.310.24−1.00−1.00−1.00−1.00−1.001.860.930.620.470.37
0.6−1.00−1.00−1.00−1.001.220.610.410.310.240.20−1.00−1.00−1.00−1.001.860.930.620.470.370.31
0.7−1.00−1.00−1.001.220.610.410.310.240.200.17−1.00−1.00−1.001.860.930.620.470.370.310.27
0.8−1.00−1.001.220.610.410.310.240.200.170.15−1.00−1.001.860.930.620.470.370.310.270.23
0.9−1.001.220.610.410.310.240.200.170.150.14−1.001.860.930.620.470.370.310.270.230.21
11.220.610.410.310.240.200.170.150.140.121.860.930.620.470.370.310.270.230.210.19
Note: In the Tables, {−1.00} indicates that there is no overflow predicted in this situation, where the output pipe has an available cross-section that can cover the input flow.

Appendix B

Figure A1. SQL database for the cleaned data.
Sustainability 14 14036 g0a1

References

  1. Hamed, M.M.; Elsayad, M.A.; Mahfouz, S.Y.; Khadr, W.M.H. Graphical user interface for water distribution network pressure—driven analysis using artificial elements. Sustain. Water Resour. Manag. 2022, 8, 89. [Google Scholar] [CrossRef]
  2. Abbas, M.Z.; Abu Baker, K.; Ayaz, M.; Mohamed, H.; Tariq, M.; Ahmed, A.; Faheem, M. Key factors involved in pipeline monitoring techniques using robots and WSNs: Comprehensive survey. J. Pipeline Syst. Eng. Pract. 2018, 9, 4018001. [Google Scholar] [CrossRef]
  3. Hawari, A.; Alkadour, F.; Elmasry, M.; Zayed, T. A state of the art review on condition assessment models developed for sewer pipelines. Eng. Appl. Artif. Intell. 2020, 93, 103721. [Google Scholar] [CrossRef]
  4. Rocher, J.; García-Navas, J.L.; Romero, O.; Lloret, J. A WSN-based monitoring system to control Sewerage. In Proceedings of the 2019 Sixth International Conference on Internet of Things: Systems, Management and Security (IOTSMS), Granada, Spain, 22–25 October 2019; IEEE: Piscataway, NJ, USA, 2019; pp. 277–282. [Google Scholar]
  5. Altarabsheh, A.; Ventresca, M.; Kandil, A.; Abraham, D. Markov chain modulated Poisson process to stimulate the number of blockages in sewer networks. Can. J. Civ. Eng. 2019, 46, 1174–1186. [Google Scholar] [CrossRef]
  6. Arthur, S.; Crow, H.; Pedezert, L. Understanding Blockage Formation in Combined Sewer Networks. In Proceedings of the Institution of Civil Engineers-Water Management; Thomas Telford Ltd.: London, UK, 2008; Volume 161, pp. 215–221. [Google Scholar]
  7. Okwori, E.; Viklander, M.; Hedström, A. Performance assessment of Swedish sewer pipe networks using pipe blockage and other associated performance indicators. H2Open J. 2020, 3, 46–57. [Google Scholar] [CrossRef] [Green Version]
  8. Okwori, E.; Viklander, M.; Hedström, A. Spatial heterogeneity assessment of factors affecting sewer pipe blockages and predictions. Water Res. 2021, 194, 116934. [Google Scholar] [CrossRef] [PubMed]
  9. Ugarelli, R.; Kristensen, S.M.; Røstum, J.; Sægrov, S.; Di Federico, V. Statistical analysis and definition of blockages-prediction formulae for the wastewater network of Oslo by evolutionary computing. Water Sci. Technol. 2009, 59, 1457–1470. [Google Scholar] [CrossRef] [PubMed]
  10. Butler, D.; Digman, C.; Makropoulos, C.; Davies, J.W. Urban Drainage, 4th ed.; Crc Press: Boca Raton, FL, USA, 2018; ISBN 9781498752930. [Google Scholar]
  11. Rodríguez, J.P.; McIntyre, N.; Díaz-Granados, M.; Maksimović, Č. A database and model to support proactive management of sediment-related sewer blockages. Water Res. 2012, 46, 4571–4586. [Google Scholar] [CrossRef] [PubMed]
  12. Arthur, S.; Crow, H.; Pedezert, L.; Karikas, N. The holistic prioritisation of proactive sewer maintenance. Water Sci. Technol. 2009, 59, 1385–1396. [Google Scholar] [CrossRef] [PubMed]
  13. Hillas, T.T. Reducing the Occurrence of Flooding Through the Effective Management of Sewer Blockages. Master’s Thesis, University of Exeter, Exeter, UK, June 2014. [Google Scholar]
  14. Hafskjold, L.S.; Kønig, A.; Sægrov, S.; Schilling, W.; Saegrov, S.; Schilling, W. Improved assessment of sewer pipe condition. In Proceedings of the CityNet 19th European Junior Scientist Workshop on Process Data and Integrated Urban Water Modelling, Meaux-la-Montagne, France, 15 March 2004. [Google Scholar]
  15. Ikeshoji, T.; Hafskjold, B.; Furuholt, H. Molecular-level calculation scheme for pressure in inhomogeneous systems of flat and spherical layers. Mol. Simul. 2003, 29, 101–109. [Google Scholar] [CrossRef]
  16. Ugarelli, R.; Venkatesh, G.; Brattebø, H.; Di Federico, V.; Sægrov, S. Historical analysis of blockages in wastewater pipelines in Oslo and diagnosis of causative pipeline characteristics. Urban Water J. 2010, 7, 335–343. [Google Scholar] [CrossRef]
  17. Pingel, J.; Bartels, E.M.; Nielsen, J.B. New perspectives on the development of muscle contractures following central motor lesions. J. Physiol. 2017, 595, 1027–1038. [Google Scholar] [CrossRef] [PubMed] [Green Version]
  18. Priyanka, E.B.; Maheswari, C.; Thangavel, S.; Bala, M.P. Integrating IoT with LQR-PID controller for online surveillance and control of flow and pressure in fluid transportation system. J. Ind. Inf. Integr. 2020, 17, 100127. [Google Scholar] [CrossRef]
  19. Bhaskaran, P.E.; Maheswari, C.; Thangavel, S.; Ponnibala, M.; Kalavathidevi, T.; Sivakumar, N.S. IoT Based monitoring and control of fluid transportation using machine learning. Comput. Electr. Eng. 2021, 89, 106899. [Google Scholar] [CrossRef]
  20. Ramadhin, S.P.K.; Anand, S.; Aishwarya, R.; Yogitha, R. Smart Drainage and Health Monitoring System of Manual Scavenger using IoT. In Proceedings of the 2021 5th International Conference on Intelligent Computing and Control Systems (ICICCS), Madurai, India, 6–8 May 2021; IEEE: Piscataway, NJ, USA, 2021; pp. 412–416. [Google Scholar]
  21. Chen, A.; Dong, H. A Pipeline On-line Detection and Control System Based on the IoT. In Proceedings of the 2021 IEEE 4th International Conference on Electronics Technology (ICET), Chengdu, China, 7–10 May 2021; IEEE: Piscataway, NJ, USA, 2021; pp. 1095–1098. [Google Scholar]
  22. Villars, R.L.; Olofson, C.W.; Eastwood, M. Big Data: What It Is and Why You Should Care. White Paper; IDC: Framingham, MA, USA, 2011. [Google Scholar]
  23. Wu, S.-H.; Mou, C.-Y.; Lin, H.-P. Synthesis of mesoporous silica nanoparticles. Chem. Soc. Rev. 2013, 42, 3862–3875. [Google Scholar] [CrossRef] [PubMed]
  24. Chen, M.-S.; Han, J.; Yu, P.S. Data mining: An overview from a database perspective. IEEE Trans. Knowl. Data Eng. 1996, 8, 866–883. [Google Scholar] [CrossRef]
  25. Cios, K.J.; Pedrycz, W.; Swiniarski, R.W. Data Mining Methods for Knowledge Discovery; Springer Science & Business Media: Berlin/Heidelberg, Germany, 2012; Volume 458, ISBN 978-1-4615-5589-6. [Google Scholar]
  26. Hand, D.J. Data mining: Statistics and more? Am. Stat. 1998, 52, 112–118. [Google Scholar]
Figure 1. Methodological approach.
Sustainability 14 14036 g001
Figure 2. The dBi ultrasonic water level sensor.
Sustainability 14 14036 g002
Figure 3. (a) The distribution of all targeted manholes. (b) The distribution of manholes with blockage situations. (c) the general parameters of manhole no. 17.
Sustainability 14 14036 g003aSustainability 14 14036 g003b
Figure 4. A flow chart of the knowledge discovery process used in this research.
Sustainability 14 14036 g004
Figure 5. (a) Defining the 5 relevant columns. (b) Cleaning code.
Sustainability 14 14036 g005aSustainability 14 14036 g005b
Figure 6. The percentages of readings with values greater than or equal to 100% of the diameter of the sewage pipe.
Sustainability 14 14036 g006
Figure 7. All sewage level readings for manholes that had a potential partial blockage: (a) manhole no. 17, (b) manhole no. 50, (c) manhole no. 45, and (d) manhole no. 30.
Sustainability 14 14036 g007aSustainability 14 14036 g007b
Figure 8. The time (in minutes) to overflow based on different inflow situations: (a) different flow velocity (normal situation) and (b) in manhole no. 17.
Sustainability 14 14036 g008
Figure 9. The sewage level before and after the cleaning work in (a) manhole No. 17 and (b) manhole No. 54.
Sustainability 14 14036 g009aSustainability 14 14036 g009b
Figure 10. The time (in minutes) to overflow based on different inflow situations and based on the before and after cleaning cases for manhole no. 54.
Sustainability 14 14036 g010
Figure 11. The sewage level before and after self-cleaning in manhole No. 30.
Sustainability 14 14036 g011
Publisher’s Note: MDPI stays neutral with regard to jurisdictional claims in published maps and institutional affiliations.

