Abstract
The sustainable development of the aquaculture industry is of great significance for national food security within the context of increasing consumer demand, scarce land resources, and continuous ecological and environmental deterioration. China is a major shrimp farming country. It is crucial to investigate the spatiotemporal variations in the characteristics of shrimp aquaculture for the stability and sustainable development of China’s shrimp aquaculture industry, as well as to explore an optimization strategy for the spatial layout of this industry. Existing research mainly focuses on the fluctuations in shrimp production and their influencing factors, while studies on the spatiotemporal variations of shrimp aquaculture and their influencing mechanisms are few. In this study, we analyzed the patterns of spatiotemporal variation in shrimp aquaculture in China and further explored their influencing factors using standard deviational ellipse and Geodetector, based on China’s shrimp aquaculture production data from 2003 to 2020. The results show that (1) there has been a steady upward trend in shrimp aquaculture production in China over the past 18 years, with a growth rate of 128% and an average annual growth rate of 5.2%; (2) the spatial distribution range of shrimp farms has expanded, showing a zonal distribution pattern from the northeast to southwest, and the center of the shrimp aquaculture industry has generally shifted southward; and (3) the level of development within the fishing industry, labor quantity, and per capita income are the main factors affecting the spatial distribution variability of shrimp aquaculture. The degree of influence of each different factor on spatial distribution of shrimp aquaculture varied temporally.
1. Introduction
From a global perspective, fisheries and aquaculture have made an essential contribution to global food and nutrition security [1]. Food security is a cornerstone for safeguarding national security and is closely related to the development of the national economy. China is the largest developing country in the world. With the continuous development of the country’s society and economy, the contradiction between people and land has been further aggravated, and it is difficult for land agricultural resources to meet the development needs of people’s food consumption upgrading and safeguarding national food security. Therefore, making full use of abundant freshwater and marine resources and striving to develop the aquaculture industry will not only help to protect China’s terrestrial ecosystems, but also safeguard national food security [2]. China is a major contributor to global aquaculture, as well as shrimp farming. The sustainable development of shrimp aquaculture is of great significance for China’s national food security.
From 1978 to 1984, China’s shrimp aquaculture industry entered its initial stage. In 1982, the National Shrimp Breeding Work Conference was held, and the policy of “consolidating and improving, steady development” was put forward, which made the amount of coastal shrimp aquaculture rise rapidly. The shrimp aquaculture industry in China developed rapidly from 1985 to 1992. In 1985, the Central Committee of the Communist Party of China and the State Council issued “the instructions on relaxing policies and accelerating the development of the aquaculture industry” and put forward the policy of “focusing on aquaculture”, which accelerated the development of China’s shrimp aquaculture industry, with aquaculture production ranking first in the world. During 1993–1996, the production of shrimp declined rapidly due to global white spot syndrome. In 1993, the Ministry of Agriculture convened the National Shrimp Breeding Work Conference, analyzed the causes of shrimp disease outbreaks, and adopted corresponding policy measures [3]. From 1998 to 2003, the government strongly supported the development of the shrimp farming industry and promoted the cultivation of Litopenaeus vannamei. Since 2004, China’s shrimp aquaculture industry has been continuously improving and developing into a peak period [4]. In 2016, the 13th Five-Year Plan for Economic and Social Development of the People’s Republic of China (hereafter called the 13th Five-Year Plan) proposed a focus on improving quality and efficiency, reducing volume and increasing income, and accelerating the restructuring of the fishery industry [5]. In 2021, the document “Notice on the implementation of fishery development support policies to promote high-quality development of fisheries” mentioned that it was necessary to improve fishery development support policies, optimize fishery industrial structure, and promote the sustainable development of the fishery industry [6]. In 2019, the Ministry of Agriculture and Rural Affairs and other departments issued “Several Opinions on Accelerating the Green Development of Aquaculture”, which mentioned the current situation of unreasonable aquaculture layout in China to varying degrees.
Exploring the spatial pattern of industries through spatial analysis can formulate industrial development policies from the macro management level, and then optimize regional industrial spatial layout to promote the healthy and sustainable development of industries [7,8,9,10]. Under the premise of stable total shrimp aquaculture output in China, it is necessary to consider how to optimize the layout of the shrimp aquaculture industry to achieve sustainable development [11]. An in-depth analysis of the yield and spatial distribution of shrimp culture production in China and a clear understanding of the main factors affecting the change of shrimp aquaculture production distribution are essential for formulating targeted production policies of shrimp aquaculture, optimizing the regional layout of shrimp aquaculture, and guiding the sustainable and healthy development of the shrimp aquaculture industry.
Spatial layout variations in the agricultural industry are becoming a research hotspot for scholars worldwide. Researchers abroad have mainly analyzed the spatial agglomeration features of characteristic agricultural industries [12,13,14]. In comparison, researchers in China have carried out studies not only according to different agricultural sectors, such as integrated agriculture [15], animal husbandry [16], and plantations [17], but also according to agricultural products, including vegetables [18], fruits [19], grains [9], meat [10], oil crops [20], and cotton [21]. Chinese scholars have also made progress in studying the spatial layout of the fishing industry [22,23,24,25,26,27]. Through their study, they found that fishing production is characterized by spatial distribution variations, agglomeration, and spatial autocorrelation, and the influencing factors include natural resource utilization [22,23,24,25,27], labor quantity [24,27], aquaculture technology [22,23,24], enterprise agglomeration [23], industrial policy [22,23,24], consumption demand [22,23,24,25], and market interest [22,25].
There are few studies on the spatial layout of the shrimp aquaculture industry. It has been found that shrimp aquaculture production in China has certain spatial agglomeration characteristics, but a quantitative analysis of their influencing factors is lacking [11,22,24]. Based on the analysis of spatiotemporal variation features of shrimp aquaculture in China using the standard deviational ellipse, this paper introduces a Geodetector to explore the factors influencing the spatial distribution variability of shrimp aquaculture and the interactions between these factors. The objectives of this study, therefore, were to (1) analyze the variation characteristics and spatial evolution trend of shrimp aquaculture production in China from 2003 to 2020, and (2) identify influencing factors of spatial distribution differences in shrimp aquaculture production in China.
2. Materials and Methods
2.1. Data Sources
This paper examines the spatiotemporal variations of shrimp aquaculture in China and their influencing factors at the provincial level. In view of the availability of data, we selected the shrimp production data of 31 provinces in China from 2003 to 2020, excluding Hong Kong, Macao, and Taiwan. The information on shrimp aquaculture production and its influencing factors was retrieved from the China Fishery Statistical Yearbooks 2004–2021 and the China Statistical Yearbooks 2004–2021. Shrimp aquaculture in China includes mariculture and freshwater culture. The main shrimp mariculture species include Litopenaeus vannamei, Penaeus monodon, Fenneropenaeus chinensis, and Penaeus japonicus. The main shrimp species cultured in freshwater include Litopenaeus vannamei, Macrobrachium rosenbergii, and Macrobrachium nipponense.
2.2. Research Methods
2.2.1. Standard Deviational Ellipse
The standard deviational ellipse was first proposed in 1962 by Welty Lefever, a Professor of Sociology at the University of Southern California, and it can be used to measure the spatial distribution orientation and range of a dataset in order to analyze the spatial distribution pattern and its variation characteristics [28]. The calculation results are represented by an ellipse, whose basic parameters include the center, azimuth, semi-major axis, and semi-minor axis. The center of the ellipse indicates the central location of the spatial distribution of the data. The azimuth indicates the dominant directional trend of the spatial distribution of the data. The semi-major and semi-minor axes indicate the direction and range of the spatial distribution of the data, respectively, and the larger the difference between the semi-major axis and semi-minor axis, the more significant the directionality of the data.
2.2.2. Geodetector
The Geodetector is a statistical technique for exploring the spatial distribution variability of data and its causes. It can not only detect the degree of influence of each factor, but also analyze interactions between multiple influencing factors [29]. This method has been widely applied in interdisciplinary research in social sciences and natural sciences [30,31,32,33,34,35]. The core idea is based on the assumption that if an independent variable has an important impact on a dependent variable, the spatial distribution of the independent variable and the dependent variable should be similar; that is, the two have a high degree of consistency in the spatial distribution state, and the greater the impact of the independent variable on the dependent variable, the higher the degree of consistency of the spatial distribution of the two. The core idea of the Geodetector is based on the assumption that if an independent variable has an important influence on a dependent variable, the spatial distribution of the independent variable and the dependent variable should be similar; that is, the two have a high degree of consistency in the spatial distribution state, and the greater the influence of the independent variable on the dependent variable, the higher the degree of consistency of the spatial distribution of the two. Therefore, the dependent variable in this paper is the shrimp aquaculture output of each province in China, and the independent variable is the factor affecting the shrimp aquaculture output. The specific formulae are as follows:
where q is the explanatory power of the factor on spatial differentiation, with a value range of [0, 1]. The higher the q value, the stronger the explanatory power of the independent variable on the dependent variable, and vice versa. h indicates the stratum of the dependent variable or independent variable, and h = 1, …, L. Nh and N are the number of units in the stratum h and the entire region, respectively. σh2 and σ2 are the variances of the dependent variable in the stratum h and the entire region, respectively. SSW and SST are the sum of the variances within a stratum and the total variance of the entire region, respectively.
2.3. Index Selection
The spatial distribution of shrimp aquaculture production is determined by the interaction between supply and demand. In this study, we thoroughly examined the characteristics of the aquaculture industry and the specific circumstances of shrimp farming in China when exploring the influencing factors of spatial distribution differences in domestic shrimp aquaculture production. Referring to the relevant literature [11,22,23,24], we chose the natural resource utilization, level of production technology, level of industrial development, labor quantity, population size, and per capita income level as the six main factors affecting the differences in the spatial distribution of shrimp aquaculture production. The aquaculture area (X1), number of aquatic technical extension personnel (X2), total fisheries economic output (X3), number of aquaculture workers (X4), total population at the end of the year (X5), and per capita disposable income (X6) of each province were selected as specific indices to represent the six different influencing factors (Table 1). The descriptive statistics of the six variables are shown in Table 2.

Table 1.
Influencing factors on the spatial distribution differences in shrimp aquaculture production and their specific indices.
Table 2.
Descriptive statistics of variables.
- Natural resource utilization: Marine and freshwater area is the basis for the development of the aquaculture industry. The richer the water resources of an area, the more favorable the conditions for shrimp aquaculture production. In this study, the aquaculture area was chosen to represent the natural resource utilization.
- Level of production technology: The improvement of aquaculture technology raises production efficiency, increases output rate, and improves total aquaculture production. For the shrimp aquaculture industry, the improvement of aquaculture technology not only increases aquaculture production but also contributes to the expansion of aquaculture area. In practice, aquatic technical extension personnel play an important role in the promotion and application of aquaculture technology. Thus, the number of aquatic technical extension personnel was selected to represent the level of production technology in this study.
- Level of industrial development: The areas with higher levels of industrial development have more complete infrastructure facilities and more mature industry chains. For the shrimp aquaculture industry, the higher the total economic output of a region’s fishing industry, the higher the development level of the fishing industry in this region. Such a high level corresponds to more complete infrastructure facilities and more mature industry chains, favorable to the development of the shrimp aquaculture industry and also conducive to guaranteeing stable earnings. As a result, the producers will be more willing to invest in aquaculture, and a higher yield may be achieved. In this study, the total fisheries economic output was chosen to represent the level of industrial development.
- Labor quantity: Material production is a process of labor acting on the means of production. At present, China’s aquaculture industry is still labor-intensive [36]. For shrimp aquaculture, increasing the number of workers is beneficial to improving shrimp aquaculture production. In this study, the number of aquaculture workers was chosen to represent the labor quantity.
- Population size: An increase in population size increases the consumer demand for commodities, thereby affecting the production of those commodities. For the shrimp aquaculture industry, an increase in population size stimulates production by increasing consumer demand. In this study, the total population at the end of the year was chosen to represent the population size.
- Per capita income: In general, the increase in consumers’ income increases consumer demand for commodities, thereby driving production. Shrimp is a popular food commodity for global consumers because of its high nutritional value. The consumption of shrimp increases with the development of the social economy and the continuous increase in people’s income. In this study, per capita disposable income was chosen to represent per capita income.
3. Results
3.1. Analysis of the Spatiotemporal Variations of Shrimp Aquaculture in China
3.1.1. Analysis of Shrimp Aquaculture Production Variations
According to the data from the China Fishery Statistical Yearbooks, shrimp aquaculture production in China showed a steady upwards trend from 2003 to 2010, increasing from 1.1 million tonnes in 2003 to 2.6 million tonnes in 2020, with a growth rate of 128% and an average annual growth rate of 5.2% (Figure 1).
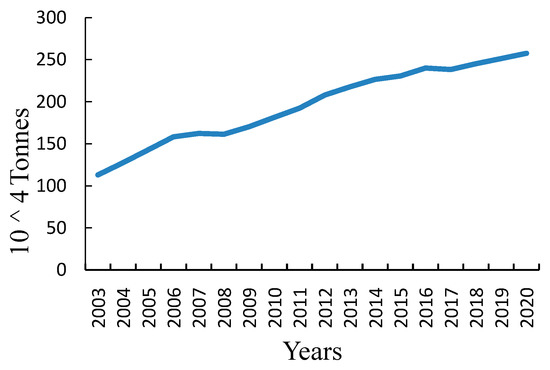
Figure 1.
Variations in shrimp aquaculture production from 2003 to 2020. Data source: China Fishery Statistical Yearbooks. Available online: https://www.cafs.ac.cn/info/1397/37342.htm (accessed on 12 March 2022).
The increase in aquaculture production had two drivers: the increase in aquaculture area [37] and the increase in yield per unit area [4]. For example, in the case of marine aquaculture, the area of marine shrimp farming in 2003 was about 240,000 ha, and the yield was about 2000 kg/ha. In 2020, the area was nearly 250,000 ha, and yield reached 6000 kg/ha, roughly three times the yield of 2003. The increase in shrimp yield was due to increased aquaculture inputs and technical advancement [38]. For the aquaculture inputs, the number of shrimp seeds bred in 2003 was 0.2 trillion, and the number increased tenfold by 2020, reaching 2.4 trillion. In terms of aquaculture technology, the shrimp nursery, feed processing, and disease prevention and control technology, as well as breeding practices, have been comprehensively improved. For instance, in 2003, the fisheries technology extension station of Binzhou City, Shandong Province, successfully explored an effective way to farm Litopenaeus vannamei in barren saline alkaline wetlands with high yield and high efficiency, achieving economic benefits [39]. In 2010 and 2017, the Litopenaeus vannamei strains Zhongke No. 1 and Haixingnong No. 2 were bred in China. To date, nine new strains have been officially recognized, and the total production of Litopenaeus vannamei in China has been about 550 billion, of which the shrimp seed production of improved strains is about 250 billion [40].
3.1.2. Analysis of Spatial Distribution Variations in Shrimp Aquaculture Production
Spatial Distribution
Shrimp aquaculture production in China from 2003 to 2020 exhibited a steady upwards trend, without inflection points of obvious fluctuations (Figure 1). Therefore, we equally divided the study period into the years 2003, 2008, 2014, and 2020 in order to investigate the spatiotemporal variations in shrimp aquaculture and their influencing factors. The shrimp aquaculture areas exhibit a zonal spatial distribution pattern from the northeast to southwest, mainly concentrated along the coast and in the middle and lower reaches of the Yangtze River inland (Figure 2). Shrimp aquaculture production of coastal farms accounted for a high proportion of total national shrimp aquaculture production. In 2003, shrimp aquaculture production of the eleven coastal provincial regions accounted for 92.6% of the total national shrimp aquaculture production, and the proportion increased to 94.9% in 2020. Shrimp aquaculture production of the four inland provinces in the middle and lower reaches of the Yangtze River (Anhui Province, Jiangxi Province, Hubei Province, and Hunan Province) accounted for approximately 90% of total inland shrimp aquaculture production in China. The reason is that these regions have formed the major shrimp aquaculture areas due to abundant natural resources, ideal fishery infrastructure, and high aquaculture technology. The coastal regions have become important mariculture production areas in China because of their favorable geographical conditions and abundant marine resources. The four inland provinces are major freshwater aquaculture production areas due to the rich freshwater resources of rivers and lakes in the middle and lower reaches of the Yangtze River [11]. These regions also have the vast majority of shrimp seedlings, feed and processing enterprises, and aquaculture research institutions in China, so their shrimp aquaculture infrastructure is ideal and the aquaculture technology level is high. Taking Guangdong Province, with the highest shrimp production in China, as an example, shrimp aquaculture is an important pillar industry of aquaculture, and the processing of shrimp seedlings, feed, and shrimp products is the national precedent. To comprehensively improve the scientific and technological innovation ability and core competitiveness of the shrimp aquaculture industry, Guangdong Province gathered aquaculture research units and enterprise experts in 2019 to strengthen and expand its modern shrimp aquaculture industry by combining the advantageous scientific and technological resources in the province [41].
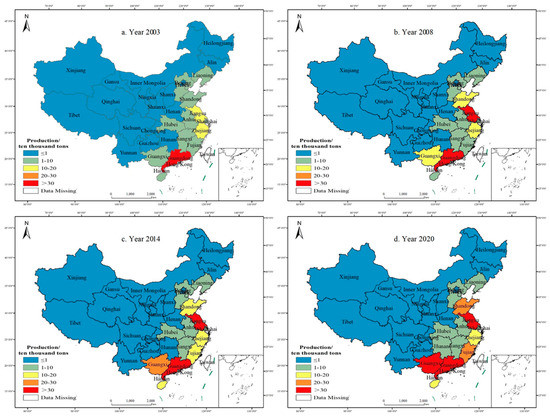
Figure 2.
Spatial distribution of shrimp aquaculture production by province across different years. The subfigures (a–d) represents the spatial distribution of shrimp production in provinces of China in 2003, 2008, 2014 and 2020. Data source: China Fishery Statistical Yearbooks. Available online: https://www.cafs.ac.cn/info/1397/37342.htm (accessed on 12 March 2022).
Variation Trends in the Spatial Distribution
In this study, we used the Spatial statistical tool—Directional distribution (Standard deviational ellipse) in ArcGIS (https://www.arcgis.com/index.html, accessed on 10 April 2022, Environmental Systems Research Institute, Redlands, CA, USA) to construct the ellipses of the spatial distribution of shrimp aquaculture production in China in order to explore the spatial variation pattern from 2003 to 2020 (Figure 3). The distribution ellipses represent the spatial distribution of the main shrimp-producing areas. The major axis indicates the agglomeration direction of the spatial distribution of aquaculture production, the minor axis indicates the distribution range of aquaculture production, and the center point indicates the center of the entire primary shrimp-producing area. The range of the distribution ellipses from 2003 to 2020 (Figure 3) is consistent with the locations of the primary shrimp-producing areas (Figure 2). From 2003 to 2020, the distribution range of the shrimp-producing regions expanded. The aquaculture area extended inland, and the gravity center of shrimp aquaculture production generally shifted southward. The reason is that the spatial variation trend of shrimp farming is closely related to the development of shrimp farming varieties. Due to differences in geographical location and climate, shrimp farming varieties are slightly different in southern and northern China. Before the 1990s, in the early stage of artificial breeding, northern China was the main area of shrimp farming, and the breeding species was Fenneropenaeus chinensis. Fenneropenaeus chinensis is the dominant breeding species in China [4]. The success of full artificial breeding of Penaeus monodon in 1984 promoted the development of the shrimp farming industry along the southeast coast of China [42]. In 1998, China introduced the artificial breeding technology of Litopenaeus vannamei. The southern region of China became the main area of shrimp culture, Litopenaeus vannamei became the main species of shrimp culture in China, and the aquaculture output accounted for approximately 50% of the total shrimp culture output in China [43]. At the same time, Litopenaeus vannamei has the growth characteristics of seawater and freshwater aquaculture, and some inland areas, such as Hubei, Anhui, and Jiangxi, have gradually begun to breed Litopenaeus vannamei [11]. From the spatial distribution of shrimp aquaculture production (Figure 2), we find that Hunan Province had joined the regions with a shrimp aquaculture production of more than 10,000 tonnes by 2020, compared with the pattern in 2003, and the range of shrimp farming regions was expanding. In 2003, the shrimp aquaculture production in the main producing areas, Guangdong Province, Guangxi Province, Hainan Province, and Fujian Province, in southern China accounted for 49.6% of the total national shrimp aquaculture production, and the proportion rose to 58.8% in 2020. It can be seen that the main producing areas of China’s shrimp aquaculture are distributed in the south of the country, and the gravity center of shrimp farming is shifting southward. Zeng et al. also said that before the 1990s, the main shrimp aquaculture areas were distributed across Shandong, Hebei, and Liaoning, and the aquaculture production of Hebei Province alone was equivalent to the sum of the production of Guangdong, Hainan, and Guangxi at that time. The shrimp aquaculture industry in these three southern provinces began to grow in 1997, and the aquaculture production there started to account for 60% of the national production. Then, the shrimp aquaculture center in China began to move southward from the north along the coastline [44].
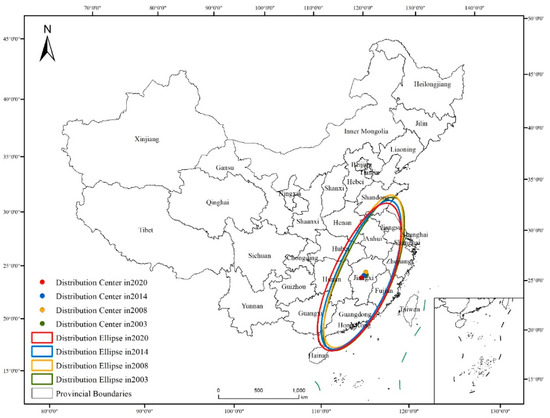
Figure 3.
Distribution ellipses of shrimp aquaculture production across different years. Data source: China Fishery Statistical Yearbooks. Available online: https://www.cafs.ac.cn/info/1397/37342.htm (accessed on 12 March 2022).
3.2. Factors Influencing the Spatial Distribution Differences in China’s Shrimp Aquaculture Production
3.2.1. Calculation Results
We used the Geodetector to analyze the effects of different factors on the spatial distribution differences in China’s shrimp aquaculture production across different years. Since the independent variable X entered by the Geodetector should be a type quantity, it is necessary to discretize the numerical quantity in advance [29]. The Natural Breaks (Jenks) in ArcGIS was used to grade the evaluation indexes. The aquaculture area, number of aquatic technical extension personnel, total fisheries economic output, number of aquaculture workers, total population at the end of the year, and per capita disposable income were divided into three categories.
The magnitude of q values reveals that per capita disposable income (X6), total fisheries economic output (X3), and the number of aquaculture workers (X4) are the main factors influencing spatial distribution variability of shrimp aquaculture production. From 2003 to 2020, the q values of these three indices remained higher than those of the other indices. The explanatory power of per capita disposable income (X6) on the spatial distribution variability of shrimp aquaculture production increased to 71%, and the explanatory power of the total fisheries economic output (X3) and the number of aquaculture workers (X4) increased to 65% and 53%, respectively. In comparison, the other three indices, aquaculture area (X1), number of aquatic technical extension personnel (X2), and total population at the end of the year (X5), had relatively weak explanatory power on the spatial distribution variability of shrimp aquaculture production (Table 3).
Table 3.
The changes in the relative effect of factors in different periods.
For the q value variation trends of the same influencing factor in different periods, from 2003 to 2020, the q values of the aquaculture area (X1) and the number of aquaculture workers (X4) first increased and then decreased. The q values of the number of aquatic technical extension personnel (X2) and total population at the end of the year (X5) had a generally increasing trend. The q value of total fisheries economic output (X3) continuously grew. The q value of per capita disposable income (X6) gradually decreased. It can be seen that the q value magnitudes of different influencing factors differed significantly from each other in the same period (Table 3).
The six influencing factors—natural resource utilization, level of production technology, level of industrial development, labor quantity, population size, and per capita income—not only have an impact on the spatial distribution of shrimp aquaculture production by themselves, but also interact with each other to jointly affect the spatial distribution of shrimp aquaculture production (Table 4).
Table 4.
Interaction detection results of different influencing factors in 2020.
The q values of the interactions between the per capita disposable income (X6) and other influencing factors are all greater than 0.77. The q values of the interactions between the total fisheries economic output (X3) and other influencing factors are all greater than 0.71. The q values of the interactions between the total population at the end of the year (X5) and other influencing factors are all greater than 0.61. The q values of the interactions between the number of aquatic technical extension personnel (X2) and other influencing factors are all greater than 0.58. The q values of the interactions between the aquaculture area (X1) and other influencing factors and between the number of aquaculture workers (X4) and other influencing factors are all greater than 0.48 (Table 4).
The above analysis results show that the six influencing factorsnot only have an impact on the spatial distribution of shrimp aquaculture production by themselves, but also interact with each other to enhance their influences on the spatial distribution of shrimp aquaculture production. This means that the spatial distribution variability of China’s shrimp aquaculture production is caused by the joint effects of multiple factors, which leads to the complexity of the spatial distribution variability of shrimp aquaculture production.
3.2.2. Analysis of Influence Degree of Different Influencing Factors
(1) Natural resource utilization
From 2003 to 2020, the degree of influence of the aquaculture area on the spatial distribution differences in China’s shrimp aquaculture production first increased and then decreased. The importance of aquaculture area in the ranking of the six influencing factors shifted from the fourth at the beginning to the sixth later on. This suggests that the size of the aquaculture area played an important role in the early stage of the shrimp aquaculture industry in China. With the continuous development of society, shrimp aquaculture became more dependent on factors other than the size of the aquaculture area [22]. For instance, aquaculture development is heavily constrained by natural resource utilization [23], and the water area suitable for shrimp farming plays a fundamental role in the development of the shrimp aquaculture industry. Thus, in the early stages, the spatial distribution of shrimp farming production coincided with the distribution of aquaculture area, and the degree of coincidence increased. However, with the improvement in the technology level of each aquaculture production link, the shrimp yield per unit area has risen remarkably [37]. For example, the yield of shrimp mariculture was 2000 kg/ha in 2003 but reached 6000 kg/ha in 2020, increasing threefold. This indicates that simply enlarging the aquaculture area is no longer a means to increase aquaculture production. The shrimp aquaculture industry is developing toward intensification and factorization. Consequently, the degree of coincidence between the spatial distribution of shrimp aquaculture production and the distribution of aquaculture area started to decrease in the later stages.
(2) Level of production technology
From 2003 to 2020, the degree of influence of the number of aquatic technical extension personnel on the spatial distribution differences in China’s shrimp aquaculture production generally increased. The promotion and application of aquaculture technology are based on the efforts of aquatic technical extension personnel [45]. The more aquatic technical extension personnel, the stronger the technical support in the farming process, which is directly reflected in the level of aquaculture yield. The roughly threefold increase in the yield of shrimp mariculture from 2003 to 2020, as mentioned above, is just one example of this. Therefore, the spatial distribution of shrimp aquaculture production corresponded with the distribution of the number of aquatic technical extension personnel, and the degree of coincidence increased over time.
(3) Level of industrial development
By analyzing the level of industrial development of influencing factors, it was found that from 2003 to 2020, the degree of influence of total fisheries economic output on the spatial distribution differences in China’s shrimp aquaculture production continuously increased. The higher the total fisheries economic output, the higher the regional fisheries economic development level. Such a high level corresponds to more complete fisheries infrastructure facilities and relatively mature technology in each link of the industry chain in the region, favorable to the development of the shrimp aquaculture industry [10]. Meanwhile, a high fisheries economic development level is more conducive to ensuring the stability of fishers’ income. Fishers are more willing to invest in aquaculture, and a higher aquaculture production may be achieved. Therefore, the spatial distribution of shrimp aquaculture production coincided with the distribution of the total fisheries economic output, and the degree of coincidence became increasingly higher over time. The shrimp aquaculture production of Guangdong Province always ranked first in China. The total fisheries economic output of Guangdong Province constantly accounted for about 15% of the total national fisheries economic output from 2003 to 2020, and its shrimp aquaculture production accounted for around 30% of the total national shrimp aquaculture production. In 2020, the shrimp seed production of Guangdong Province accounted for 21% of China’s total shrimp seed production. At the same time, major seed and feed enterprises are mostly distributed in Guangdong Province, such as Guangdong HAID Group Co., Ltd., Guangdong Evergreen Conglomerate Co., Ltd., and Guangdong Yuehai Feeds Group Co., Ltd.
(4) Labor quantity
From 2003 to 2020, the degree of influence of the number of aquaculture workers on the spatial distribution differences in China’s shrimp aquaculture production first increased and then decreased. In the early stages, since the shrimp aquaculture technology level and the degrees of aquaculture intensification and factorization were relatively low, shrimp aquaculture was a labor-intensive industry, and the increase in the number of workers was beneficial to raising shrimp aquaculture production. Thus, in the early stages, the spatial distribution of shrimp aquaculture production corresponded with the distribution of the number of aquaculture workers, and the degree of correspondence increased. With the improvement of shrimp aquaculture technology level in every aspect, the shrimp aquaculture industry began to develop toward intensification and factorization. The increased level of mechanization in aquaculture has reduced the degree of labor intensity [9]. As a result, the degree of coincidence between the spatial distribution of shrimp aquaculture production and the distribution of the number of aquaculture workers started to decrease in the later stages. For example, in Jiangsu Province, a major shrimp-producing region, a factorized aquaculture enterprise has six permanent employees, an aquaculture area of 0.6 ha, and a yield of 45,000 kg/ha. An aquaculture household with sufficient management conditions has one permanent employee, an aquafarm area of 1.33 ha, and a yield of 3000 kg/ha. The per capita production of factorized aquaculture is 7500 kg/ha, significantly higher than the value of 3000 kg/ha of traditional aquaculture practice (results calculated from the data obtained from the authors’ field research in 2019).
(5) Population size
From 2003 to 2020, the degree of influence of the total population at the end of the year on the spatial distribution differences in China’s shrimp aquaculture production generally increased. An increase in population size raises the demand for shrimp, driving shrimp aquaculture production [10]. In Guangdong Province, where the population growth rate and aquaculture production are both high, its population accounted for 7% of the total national population at the end of 2003 and 8.9% at the end of 2020, with an increase of 2%. At the same time, its shrimp aquaculture production accounted for 29.1% of the total national production in 2003 and 32.6% in 2020, with an increase of 3.5%. Therefore, the spatial distribution of shrimp aquaculture production coincided with the distribution of the total population at the end of the year, and the degree of coincidence increased over time.
(6) Per capita income
From 2003 to 2020, the degree of influence of per capita disposable income on the spatial distribution differences in China’s shrimp aquaculture production gradually decreased. The importance of per capita disposable income in the ranking of the six influencing factors dropped from the first at the beginning to the third in the later period. In terms of the per capita consumption of aquatic products in rural areas, the per capita consumption in the rural non-main production areas of shrimp aquaculture accounted for 14.4% of total shrimp consumption in rural China in 2003, and the proportion increased to 19.7% in 2019, indicating that the consumption of aquatic products in non-main production areas was increasing. This suggests that in the early stages, per capita disposable income had a significant impact on the consumer demand for shrimp. With continuous socioeconomic development, per capita income level is rising, and people’s consumption structure is upgrading. Moreover, with the increase in shrimp production, shrimp consumption is becoming more and more popular, and consumer demand for shrimp is continuously increasing [11]. In addition, the geographical range of shrimp consumption has also expanded because of the improvement of cold chain logistics facilities and cold chain logistics management levels. Therefore, the degree of coincidence between the spatial distribution of shrimp aquaculture production and the distribution of per capita disposable income continuously decreased.
4. Discussion
From a global perspective, fisheries and aquaculture have made an essential contribution to global food and nutrition security. Global per capita consumption of fish reached a new record of 20.5 kg per year in 2018. Fishery products are not only recognized as the healthiest food in the world, but also a food category with less impact on the natural environment [1]. China is a major country in aquaculture and aquatic products trade in the world. Fishery has grown into an important industry in agriculture and national economy, making important contributions to ensuring national food security, increasing fishermen’s income, and building a powerful marine country [24]. Along with the process of large-scale specialization of agricultural regionalization in China, the spatial pattern of agricultural development is constantly evolving [23]. Spatial layout variations in the agricultural industry are becoming a research hotspot for scholars worldwide. In 2019, the Ministry of Agriculture and Rural Affairs and other departments issued “Several Opinions on Accelerating the Green Development of Aquaculture”, which mentioned the current situation of unreasonable aquaculture layout in China to varying degrees, which hinders the healthy development of aquaculture. China is a major shrimp farming country. Under the premise of stable total shrimp aquaculture output in China, it is necessary to consider how to optimize the layout of the shrimp aquaculture industry to achieve its sustainable development [11]. An in-depth analysis of the yield and spatial distribution of shrimp culture production in China and a clear understanding of the main factors affecting the change of shrimp aquaculture production distribution are essential for formulating targeted production policies of shrimp aquaculture, optimizing the regional layout of shrimp aquaculture, and guiding the sustainable and healthy development of the shrimp aquaculture industry.
In this study, we first analyzed the variation characteristics and spatial evolution trend of shrimp aquaculture production in China from 2003 to 2020. The results show that from 2003 to 2020, shrimp aquaculture production in China showed a steady upward trend. The growth rate of shrimp aquaculture production was 128%, with an average annual growth rate of 5.2%. The spatial distribution of shrimp aquaculture production has expanded, with the aquaculture area extending inland. At the same time, the aquaculture areas exhibit a striped distribution pattern from the northeast to southwest, predominantly concentrated along the coast and in the middle and lower reaches of the Yangtze River inland, and the gravity center of the shrimp aquaculture industry has been shifting southward. This result is in line with the research by Xiong et al. (2020) [11] on the geographical agglomeration characteristics and spatial evolution trend of China’s shrimp aquaculture industry. They found that the geographical agglomeration characteristics of China’s shrimp aquaculture industry are remarkable, mainly concentrated in the eastern coastal and central coastal areas along the Yangtze River, and the southern area has more advantages than the northern area in shrimp aquaculture. Similarly, Yao et al. (2017) [22] and Li et al. (2017) [24] analyzed the spatial and temporal characteristics of aquaculture industry and fishery geographic agglomeration in China. The results showed that shrimp aquaculture in China was concentrated along the coastal and the Yangtze River, and the distribution center of aquaculture production shifted to the south of China as a whole. They thus suggested relying on the advantages of natural resources in various regions, based on environmental carrying capacity, to promote the development of shrimp aquaculture towards a more concentrated and advantageous direction, rational planning of industrial layout, and the sustainable development of shrimp aquaculture.
To better understand the formation of spatial distribution differences in shrimp aquaculture production in China, it is necessary to understand its influencing factors. The present study has focused on this aspect. The factors influencing the spatial distribution difference of fisheries include natural resource utilization [22,23,24,25,27], labor quantity [24,27], aquaculture technology [22,23,24], enterprise agglomeration [23], industrial policy [22,23,24], consumption demand [22,23,24,25], and market interest [22,25]. We analyzed the influencing factors of spatial distribution differences in shrimp aquaculture production in China from the perspective of supply and demand. The results show that the level of industrial development, labor quantity, and per capita income are the main factors affecting the spatial distribution variability of shrimp aquaculture production in China from 2003 to 2020. The interactions between two different influencing factors enhanced the spatial distribution variability of shrimp aquaculture production.
Compared with the research on the spatial layout of the agricultural industry, there is less research on the spatial layout of the fishery industry [22,46]. Scholars have studied the overall spatial layout characteristics of the fishery industry and discussed the influencing factors of its spatial distribution. Such research has also mentioned the characteristics of the spatial layout of algae, shellfish, fish, shrimp, and crab industries [22,24], but lack discussion of the spatial layout of fishery subdivision industries. Some scholars have studied the spatial distribution of shrimp farming industry [11], but like most scholars who study the spatial distribution of the fishery industry, they only conducted qualitative analysis instead of quantitative analysis when studying the influencing factors of the spatial distribution of the industry [11,23,25,26,27]. In summary, the existing literature has important reference significance for this study, but there is still some room for expansion. First, the existing literature mostly studies the spatial layout of the agricultural industry and the overall spatial layout of the fishery industry, and lacks analysis of the spatial layout of the fishery subdivision industry. Second, the existing literature contains more qualitative analysis of industrial spatial distribution factors, and lacks quantitative analysis. This may cause the research conclusions not to accurately reflect the influence of various influencing factors on the spatial distribution of the industry. Third, the existing literature is mostly based on the previous research and the particularity of the research object when selecting the influencing factors, and the research on the selection of indicators from the perspective of economic theory is relatively scarce.
The main contributions of this study are as follows. First, it provides reference for the study of the spatial distribution and evolution of fishery subdivision industries, and also provides reasonable policy recommendations for optimizing the development of the shrimp aquaculture industry. Second, different from other scholars, the Geodetector is introduced in the study to quantitatively analyze the influencing factors of the spatial distribution of shrimp aquaculture industry from the perspective of space, quantify the size of influencing factors, and analyze the interaction between different influencing factors. Third, the relevant influencing factors are selected from the perspective of supply and demand of economic theory. This study also has some shortcomings. The study of influencing factors in this paper only selected six factors for analysis from the perspective of supply and demand. However, there are many factors affecting the spatial distribution of shrimp aquaculture industry, including market, traffic conditions, urbanization rate, industrial development policies, and other factors [11,24], in addition to the indicators selected in this paper. The influence of these factors on the spatial distribution of shrimp culture industry remains to be further studied.
5. Conclusions and Recommendations
In this study, we explored the spatiotemporal variation patterns of shrimp aquaculture in China and their influencing factors using the standard deviational ellipse and Geodetector, based on China’s shrimp aquaculture production data from 2003 to 2020. The results show that (1) there has been a steady upward trend in shrimp aquaculture production in China over the past 18 years, with a growth rate of 128% and an average annual growth rate of 5.2%; (2) the spatial distribution range of shrimp farms has expanded, showing a zonal distribution pattern from the northeast to southwest, and the center of the shrimp aquaculture industry has generally shifted southward; and (3) the level of development within the fishing industry, labor quantity, and per capita income are the main factors affecting spatial distribution variability of shrimp aquaculture. The degree of influence of each different factor on spatial distribution of shrimp aquaculture varies temporally. This study allows readers to have a further understanding of shrimp aquaculture in China from the perspective of space. At the same time, it quantitatively analyzes the influencing factors of spatial distribution differences in shrimp aquaculture from the perspective of space, which is of great significance to the study of the spatial distribution of aquaculture.
Based on the above findings, we propose the following policy suggestions for the development of the shrimp aquaculture industry and the optimization of the spatial layout of the shrimp industry to promote the sustainable development of China’s shrimp aquaculture industry:
- Support the development of advantageous production areas of shrimp aquaculture according to local conditions. At the macroscopic level, the shrimp aquaculture industry should be rationally deployed; the re-exploration, re-planning, and re-development of aquaculture resources in different regions should be further strengthened to support the development of advantageous production areas of shrimp aquaculture based on local natural resource utilization; and specific implementation plans should be proposed. Coastal areas can make full use of the advantages of rich beaches and shallow sea resources, expand development space, and scientifically plan the layout of coastal shrimp aquaculture. The region along the Yangtze River can give full play to the advantages of resources, market, and location in the Yangtze River Basin, and develop advantageous varieties and ecological efficient breeding. At the same time, the breeding environment and water quality problems are the main reasons for shrimp diseases and difficulties in breeding [47]. Therefore, it is necessary to sufficiently protect water resources in the main producing areas of shrimp farming and to recycle natural resources to achieve the sustainable development of the shrimp farming industry.
- Improve fisheries infrastructure facilities and extend the industrial chain. Local governments should focus on improving fisheries infrastructure facilities and the shrimp industry chain. In addition to strengthening and expanding the shrimp aquaculture industry, we must ensure the synchronized and coordinated development of seed and feed production, shrimp processing, and marketing. In particular, strengthening the construction of the seed base, increasing the construction of original aquatic seed farms and of shrimp breeding bases that specialize in shrimp with high-quality characteristics, promoting the integration of breeding and propagation, and improving the coverage rate of good seeds are necessary. The production links of the seed and feed enterprises should be further standardized. It is essential to build large-scale shrimp processing enterprises that produce frozen products, canned products, dried products, and health care products, as well as wholesale markets of aquatic products. These enterprises should establish and promote their own brands of shrimp products and sell their products through multiple channels.
- Raise per capita income and increase domestic demand. The income level of urban residents could be raised by increasing employment, stabilizing wage income, improving the social security system, and expanding the size of the urban middle-income population. Additionally, the per capita income level of rural residents could be raised by improving the economic benefits of the agricultural industry through agricultural industry structure adjustment; creating distinctive town economies so that farmers can be employed in their hometowns; increasing input according to the national policies on agriculture, rural areas, and farmers; improving the policies on agriculture subsidies; and ensuring the implementation of poverty alleviation and rural revitalization measures.
- Strengthen scientific and technological support for fisheries and enhance aquacultural mechanization levels. We should actively promote the informatization and intelligent integration of shrimp farming, accelerate the construction of the full mechanization system of aquaculture in large-scale aquaculture waters such as ponds and factories, enhance the popularization ability of shrimp farming mechanization technology, and promote the full realization of mechanization of shrimp farming. Research cooperation among universities, scientific research institutions, and leading enterprises should be promoted. Technical research should be carried out in various fields, such as breeding, feed formulation, disease control, and aquaculture practices. Each aquatic technical extension organization should implement the promotion and application of technology, striving to achieve further increases in total shrimp aquaculture production, further enlargement of aquaculture scale, and further industrial upgrading.
Author Contributions
Methodology, J.W.; Primary data collection, J.W.; Data curation, J.W.; Software, J.W.; Writing—original draft, J.W.; Conceptualization, B.C. and C.S.; Writing—review and editing, B.C. and C.S.; Supervision, B.C. and C.S.; Funding acquisition, C.S. All authors have read and agreed to the published version of the manuscript.
Funding
This research was funded by the Ministry of Agriculture of People’s Republic of China through the China Agriculture Research System, grant number CARS-48.
Institutional Review Board Statement
Not applicable.
Informed Consent Statement
Not applicable.
Data Availability Statement
The data are available upon request from the authors.
Conflicts of Interest
The authors declare no conflict of interest.
References
- FAO. The State of World Fisheries and Aquaculture 2020; FAO: Rome, Italy, 2020. [Google Scholar]
- Han, L.M.; Li, D.H. Blue food system: Guarantee of China’s food security. Issues Agric. Econ. 2015, 36, 24–29+110. [Google Scholar] [CrossRef]
- Huang, T.S. Development of shrimp aquaculture in China. Chin. Fish. Econ. 2002, 1, 26–27. [Google Scholar] [CrossRef]
- Zhou, J.J. Development path and technological change of shrimp aquaculture in China. Chin. Agric. Sci. Bull. 2016, 32, 22–29. [Google Scholar]
- Cao, J.H.; Sang, F.E. Thinking on theory, model and evaluation method of aquaculture green development. Ecol. Econ. 2020, 36, 101–106+153. Available online: https://kns.cnki.net/kcms/detail/detail.aspx?FileName=STJJ202008018&DbName=DKFX2020 (accessed on 15 February 2022).
- Luo, Y. Implementation of high-quality fishery development support policy. Ocean. Fish. 2021, 4, 21. [Google Scholar] [CrossRef]
- Gou, J.S.; Li, Z.N.; Wu, B.Q.; Jiang, Y.; Dong, X.C. Spatial Pattern and Influencing Factors of Aquaculture Industry in Sichuan Province. Southwest China J. Agric. Sci. 2022, 1, 1–10. [Google Scholar]
- Li, J. Analysis and Research on the Spatial-Temporal Pattern of Fisheries in Fujian Province. Master’s Thesis, Fuzhou University, Fuzhou, China, 2018. [Google Scholar]
- Wang, F.; Liu, Y.F.; Kong, X.S.; Chen, Y.Y.; Pan, J.W. Spatial and temporal variation of grain production and its influencing factors at the county level in China. Econ. Geogr. 2018, 38, 142–151. [Google Scholar]
- Li, F.; Qiang, W.L.; Liu, X.J.; Niu, S.W.; Zhu, Q.Y.; Li, P. Spatio-temporal evolution of meat production in China’s counties and its influencing factors. J. Nat. Resour. 2021, 36, 1224–1237. [Google Scholar] [CrossRef]
- Xiong, Z.D.; Guo, Y.; Zhou, W.W.; Dai, X.L.; Liu, H. Geographical agglomeration characteristic and spatial evolution trends of shrimp aquaculture industry in China. Heilongjiang Anim. Sci. Vet. Med. 2021, 18, 26–32+147. [Google Scholar] [CrossRef]
- Choi, J.H.; Jang, H.; Woo, B. Agro-industry cluster development in five transition economic. J. Rural. Dev. 2006, 29, 85–119. [Google Scholar]
- Combes, P.P.; Mayer, T.; Thisse, J.F. Economic Geography: The Integration of Regions and Nations; Princeton University Press: Princeton, NJ, USA, 2008; pp. 255–301. [Google Scholar]
- Porter, M.E. Location, competition and economic development: Local clusters in a global economy. Econ. Dev. Q. 2013, 14, 15–34. [Google Scholar] [CrossRef]
- Li, E.L.; Pang, A.C.; Zhu, J.G. Analysis of the evolution path and mechanism of China’s agricultural agglomeration and geographic patter. Geogr. Res. 2012, 31, 885–898. [Google Scholar] [CrossRef]
- Yu, J.T.; Wang, Y.G. A spatial-temporal analysis of the main livestock meat production in China by using the method based on spatial autocorrelation and gravity center trajectory. Anim. Husb. Feed. Sci. 2016, 37, 93–97. [Google Scholar] [CrossRef]
- Xiao, W.D. Geographical agglomeration of Chinese planting industry: Temporal and spatial characteristics, trend and influencing factors. Chin. Rural. Econ. 2012, 5, 19–31. [Google Scholar]
- Ji, L.; Wu, W.J. Spatial-temporal characteristics and affecting factors of vegetable produce geographic agglomeration in China. Econ. Geogr. 2015, 35, 141–148. [Google Scholar] [CrossRef]
- Wang, W.X.; Xiang, Y.; Qi, C.J. Study on geographic agglomeration of fruit industry in China: Spatial-temporal characteristics and affecting factors. Econ. Geogr. 2013, 33, 97–103. [Google Scholar]
- Huang, L.T. Study on the spatio-temporal evolution characteristics of oil production in China. Tea Fujian 2019, 41, 53–54. [Google Scholar]
- Zhong, F.N.; Hu, X.M. Study on the regional pattern and influencing factors of cotton production in China. J. Agrotech. Econ. 2008, 1, 4–9. [Google Scholar] [CrossRef]
- Yao, C.S.; Li, Z.T.; Wang, W.; Liao, Y.Q.; Zhang, X.Z. Geographical agglomeration characteristic and spatial evolution mechanism of aquaculture industry in China. Econ. Geogr. 2016, 36, 118–127. [Google Scholar] [CrossRef]
- Rui, Y.; Li, J.L.; Tang, B.P.; Ma, E.P.; Zhang, J. Spatial pattern evolution and its influencing mechanism of freshwater fisheries in China. Areal Res. Dev. 2018, 37, 1–5+12. [Google Scholar]
- Li, J.L.; Rui, Y.; Li, T.S.; Liu, X.Q.; Zhang, J.; Zhao, X.Z. Spatial-temporal characteristics and affecting factors of fisheries geographic agglomeration in China. Geogr. Geo-Inf. Sci. 2017, 33, 100–107. [Google Scholar]
- Wang, Y.G.; Sun, H.W. Spatial distribution and evolution of grass carp industry in China: Based on standard eliptic modelal. Chin. Agric. Sci. Bull. 2020, 36, 142–151. Available online: https://kns.cnki.net/kcms/detail/detail.aspx?FileName=ZNTB202025022&DbName=DKFX2020 (accessed on 18 February 2022). [CrossRef]
- Zhao, J.; Gao, Y.; Chen, S.Y.; Xiong, W.K. The research of marine aquaculture industry layout in our country. Territ. Nat. Resour. Study 2016, 03, 60–65. [Google Scholar] [CrossRef]
- Wang, J.Y. Research on the spatial distribution and the influencing factors of marine fishery in Zhejiang. Sci. Technol. Manag. 2016, 18, 1–6. [Google Scholar] [CrossRef]
- Zhang, J.Q.; Liu, Y.N.; Song, B.F. Study on the spatial distribution characteristics of life service industry in the main urban area of Zhengzhou City based on POI data. World Reg. Stud. 2022, 31, 339–409. [Google Scholar] [CrossRef]
- Wang, J.F.; Xu, D.C. Geodetector: Principle and prospective. Acta Geogr. Sin. 2017, 72, 116–134. [Google Scholar] [CrossRef]
- Chen, C.L.; Zhang, Q.J.; Lv, X.; Huang, X.J. Analysis on spatial-temporal characteristics and driving mechanisms of cropland occupation and supplement in Jiangsu province. Econ. Geogr. 2016, 36, 155–163. [Google Scholar] [CrossRef]
- Chen, Y.B.; Li, W.H.; Huang, Y.X.; Li, X.G.; Hua, J.M. Spatio-temporal spreading features and the influence factors of dengue fever in downtown Guangzhou. Trop. Geogr. 2016, 36, 767–775. [Google Scholar] [CrossRef]
- Zhu, H.; Liu, J.M.; Tao, H.; Li, L.; Wang, R. Temporal-spatial pattern and contributing factors of urban RBDs in Beijing. Acta Geogr. Sin. 2015, 70, 1215–1228. [Google Scholar] [CrossRef]
- Bi, S.B.; Ji, H.; Chen, C.C.; Yang, R.R.; Shen, X. Application of Geodetector in human-environment relationship study of prehistoric settlements. Prog. Geogr. 2015, 34, 118–127. [Google Scholar] [CrossRef]
- Yu, J.; Liu, J.P. Quantitative analysis with Geodetector on the influence factor of temperature variation in northeast China. Hubei Agric. Sci. 2015, 54, 4682–4687. [Google Scholar] [CrossRef]
- Tong, L.G.; Xu, X.L.; Fu, Y.; Wei, F.H. Impact of environmental factors on snail distribution using Geodetector. Prog. Geogr. 2014, 33, 625–635. [Google Scholar] [CrossRef]
- Fang, J.G.; Li, Z.J.; Jiang, Z.J.; Wang, Q.D. Development strategy for ecological aquaculture and new mode of aquacultural farming. Strateg. Study CAE 2016, 18, 22–28. [Google Scholar] [CrossRef]
- Jiang, Y.M.; Mu, Y.T.; Yao, L.N. A Study on the contributions of input factors to the seawater aquaculture output in China—Analysis based on the panel data by coastal province. Mar. Econ. 2013, 3, 32–37. [Google Scholar] [CrossRef]
- Xu, J.J. Research on the efficiency of marine aquaculture production in China’s coastal provinces based on the DEA-Malmquist index. J. Guizhou Prov. Party Sch. 2020, 1, 57–68. [Google Scholar] [CrossRef]
- Zeng, X.Y.; Xu, G.F.; Zhang, X.F. Experiment on culture of south American white shrimp in northern saline-alkali depression. Freshw. Fish. 2004, 34, 2. [Google Scholar] [CrossRef]
- Huang, J.; Mu, X.Y.; Wei, Y.J. A Note on Breeding ‘Retrogression’ of Penaeus vannamei; Nanfang Daily: Nanfang, China, 2021; p. A19. [Google Scholar]
- Jin, Y.P. Shrimp and crab industry development in Guangdong province has ‘Think Tank’ that based on industry development needs and focus on key technology research. Ocean. Fish. 2020, 4, 24–25. Available online: https://kns.cnki.net/kcms/detail/detail.aspx?FileName=HYUY202004015&DbName=CJFQ2020 (accessed on 20 February 2022).
- Zeng, H. Successful artificial breeding of Penaeus monodon. Mar. Sci. Bull. 1986, 1, 96. [Google Scholar]
- Zhou, H. Domestic traders and the world—Thoughts on the development of domestic shrimp industry. Guangdong Feed. 2010, 19, 13–16. [Google Scholar] [CrossRef]
- Zeng, J.; Tuo, C.J.; Zheng, Y.Y. A Review of Thirty Years of Shrimp Culture in China; Southern Rural Newspaper: Maffra, Australia, 2008; p. A1. [Google Scholar]
- Zhang, J.P. Problems and countermeasures of aquatic technology extension system in China. China Fish. 2004, 3, 30–31+34. [Google Scholar] [CrossRef]
- Hou, X.G.; Yang, Z.Y.; Li, J.Y. Evolution characteristics and causes analysis of turbot aquaculture agglomeration in China. J. Shandong Agric. Univ. 2016, 2, 304–310. Available online: https://kns.cnki.net/kcms/detail/detail.aspx?FileName=SCHO201602029&.DbName=CJFQ2016 (accessed on 20 February 2022).
- Wu, Y.H. Water control shrimp disease. Ocean. Fish. 2016, 9, 58–59. [Google Scholar]
Publisher’s Note: MDPI stays neutral with regard to jurisdictional claims in published maps and institutional affiliations. |
© 2022 by the authors. Licensee MDPI, Basel, Switzerland. This article is an open access article distributed under the terms and conditions of the Creative Commons Attribution (CC BY) license (https://creativecommons.org/licenses/by/4.0/).