1. Introduction
With skyrocketing numbers of tourists and intensifying mobility flows, the tourism industry has experienced an extraordinary growth over recent decades [
1] and, despite the significant fracture caused by the recent COVID-19 pandemic [
2], the trend is likely to increase in the future. Therefore, unfolding and better understanding the spatial behavior of tourists is becoming increasingly important. On the one hand, for national and local governments it is crucial to have up-to-date information on the spatio-temporal dynamics and real time characteristics of international and domestic tourists at different destinations. Such knowledge can contribute to a more efficient planning and management of tourism-related infrastructure and transport facilities and can help elaborate national and local policies to increase tourism revenues [
3,
4,
5,
6]. On the other hand, alongside the obvious economic benefits, the rapid growth of tourism also brings challenges [
7,
8,
9]. The negative impacts of tourism include the increasing carbon emission or damage to the natural environment [
10,
11,
12], over-tourism and the discontent of local communities with mass tourism [
13,
14]. To make tourism development more sustainable, it is worth identifying tourist destinations with rapidly expanding ecological footprint, congestion and social conflict in order to mitigate the negative environmental and social impacts of tourism [
15,
16]. In addition, private actors, such as representatives of the hospitality industry, event organizers etc., can also benefit from a more comprehensive knowledge regarding the spatial and temporal behavior of tourists [
17,
18].
While traditional data sources (accommodation and border crossing statistics) are useful for macro-level analyses (countries, regions, larger administrative units) of the spatio-temporal aspects of tourism [
19,
20,
21], such data have several limitations when it comes to a lower geographical scale such as the analysis of intra-urban tourist flows, intra-regional moves of same-day visitors or cross-border day trippers [
22,
23]. To capture such statistically unobserved forms of tourism, GIS-based data from a variety of sources can be used [
24,
25,
26,
27,
28,
29,
30], such as GPS-based tracking systems [
31,
32], wireless, Bluetooth [
33] and geotagged social media photos and posts [
34], or mobile positioning data (MPD) [
35,
36,
37]. With the spread of new Information and Communication Technologies (ICT), a more accurate tracking of human movements has become possible, especially with data obtained from mobile positioning data (MPD).
Previous studies using mobile phone datasets have focused predominantly on the possible methodological approaches of determining anchor points of users (most typically home and work) in order to assess the spatio-temporal mobility of individuals [
38]. For instance, based on the analysis of communication data of 100,000 anonymized and randomly chosen individuals in Portugal and with the help of clustering methods, Csáji et al. [
39] identified home and office locations of users and compared the results with official census data. In the same vein, many studies using mobile positioning data have been concerned, with either home detection [
40,
41,
42,
43] or flow detection [
44,
45,
46,
47,
48] as a prerequisite of locating users in real time.
Despite the growing body of literature on the possible use of MPD in tourism research, there are still several methodological challenges and obstacles in the field [
49]. According to Li et al. [
33], this can be linked partly with the fact that most of the studies focus only on international visitors [
37,
50,
51,
52,
53], which is also confirmed by Grassini et al., who highlight the overrepresentation of the international context in MPD tourism research [
49]. One of the reasons behind the scarcity of MPD analysis of domestic tourist flows is the limitation regarding definitions, benchmarks and methodological considerations regarding how to process, filter and analyze such data. To date, we know only one comprehensive work focusing on methodological considerations related to MPD by Saluveer et al. [
54]; however, domestic tourism is not considered by these authors either. This is the point of departure for this paper, which aims to introduce a data processing method regarding various forms of domestic and international tourism. This is a challenging task, because the overwhelming majority of MPD are generated by domestic users, resulting in log files that are Terabytes in size, which in turn makes data processing only possible if using big data compatible algorithms. This methodological advancement is important also because the role of domestic tourism has been on the rise recently due to the COVID-19 pandemic [
55].
In addition to the analysis of domestic tourist flows, this paper also aims to provide new methodological considerations regarding international visitors. In this study, each event is attached to a municipality (i.e., settlement), instead of cell towers, resulting in more interpretable and geographically precise information. Via this method, we are also able to identify same-day visitors, day tripper shopping tourists from neighboring countries, extending the method used by Saluveer et al. [
54]. Our aim here is to provide a data processing guideline through which not only domestic tourist flows can be understood better, separating touristic and non-touristic daily movements of local people [
56,
57,
58], but also a more comprehensive picture on international tourist flows can be achieved, separating ’tourism’ ‘from transit traffic’ or ‘migrant workers’[
54].
Before introducing the methodology and describing the steps in data processing, it is important to conceptualize and operationalize the terms used in this paper. We use the UNWTO recommendations [
59]—along with Mamei and Colonna [
58]—to define tourism-related terms, based on which a visitor is a person who travels for business, leisure or other personal purposes for less than a year. The domestic tourist is the visitor if his/her trip includes at least one overnight stay, while the same-day tourist (day trippers or excursionist) is the visitor who does not spend a night, so the day of arrival and departure is the same. With this interpretation, we follow the approach described by Saluveer et al. [
54]. However, using MPD we can identify significantly more tourists than appear in official statistics, also described by De Cantis et al. [
60] as unobserved tourism, the extent of which has already been quantified by Nyns and Schmitz [
61] based on AirDNA and CDR data. During the research, we apply the theoretical framework developed by De Cantis et al. for approaching unobserved tourism.
In the remaining part of the paper, first the data acquisition procedure is presented, with a general overview of the raw data. This is followed by the description of data processing methodology. In the results and discussion section, we assess the final database and shed light on the limitations of the proposed method. We use Hungary as a study area, but the purpose is not a case-study unto itself. Instead, we intend to enrich the literature with a detailed insight into every step of the data life cycle, focusing more on different aspects of the data processing procedure, such as the identification of unobserved forms of tourism, [
50] rather than providing case-specific research findings.
2. Data Description
This research is based on a dataset obtained by the Hungarian Tourism Agency (HTA) from one of Hungary’s mobile network operators (provider in the following), which had a market share of 26% of domestic subscribers and 28% of international users in 2018. Through a contract, HTA was able to get access to the full MPD of the provider stored between 1 June and 31 December 2018. Thus, the dataset contains the full log data of each SIM card that connected to the provider’s network in the 6-month period as well as anonymized user meta information for the SIM cards. The MPD in this case is passive call detail records (CDR), i.e., log events that are generated each time a user makes a phone call, sends a text message or uses cellular data. In such events, the mobile phone connects to a nearby mobile cell tower, usually to the closest one, which logs the event. While connecting to the tower, the network is able to locate the position of the cell phone, with an accuracy that depends on various attributes, most importantly on the distance between the mobile phone and the tower.
The SIM cards present in the dataset are of two kinds: domestic and international. Domestic cards belong to users living in Hungary who have an active subscription with the provider. The international SIM cards correspond to foreigners who travelled to (or through) Hungary and their phones connected to the provider’s network. These users are usually subscribers of the providers’ partner networks in their home country. However, tourists also have the option to manually choose among operators. Furthermore, there is a random factor, determining which network a cell phone connects to when staying in a foreign country.
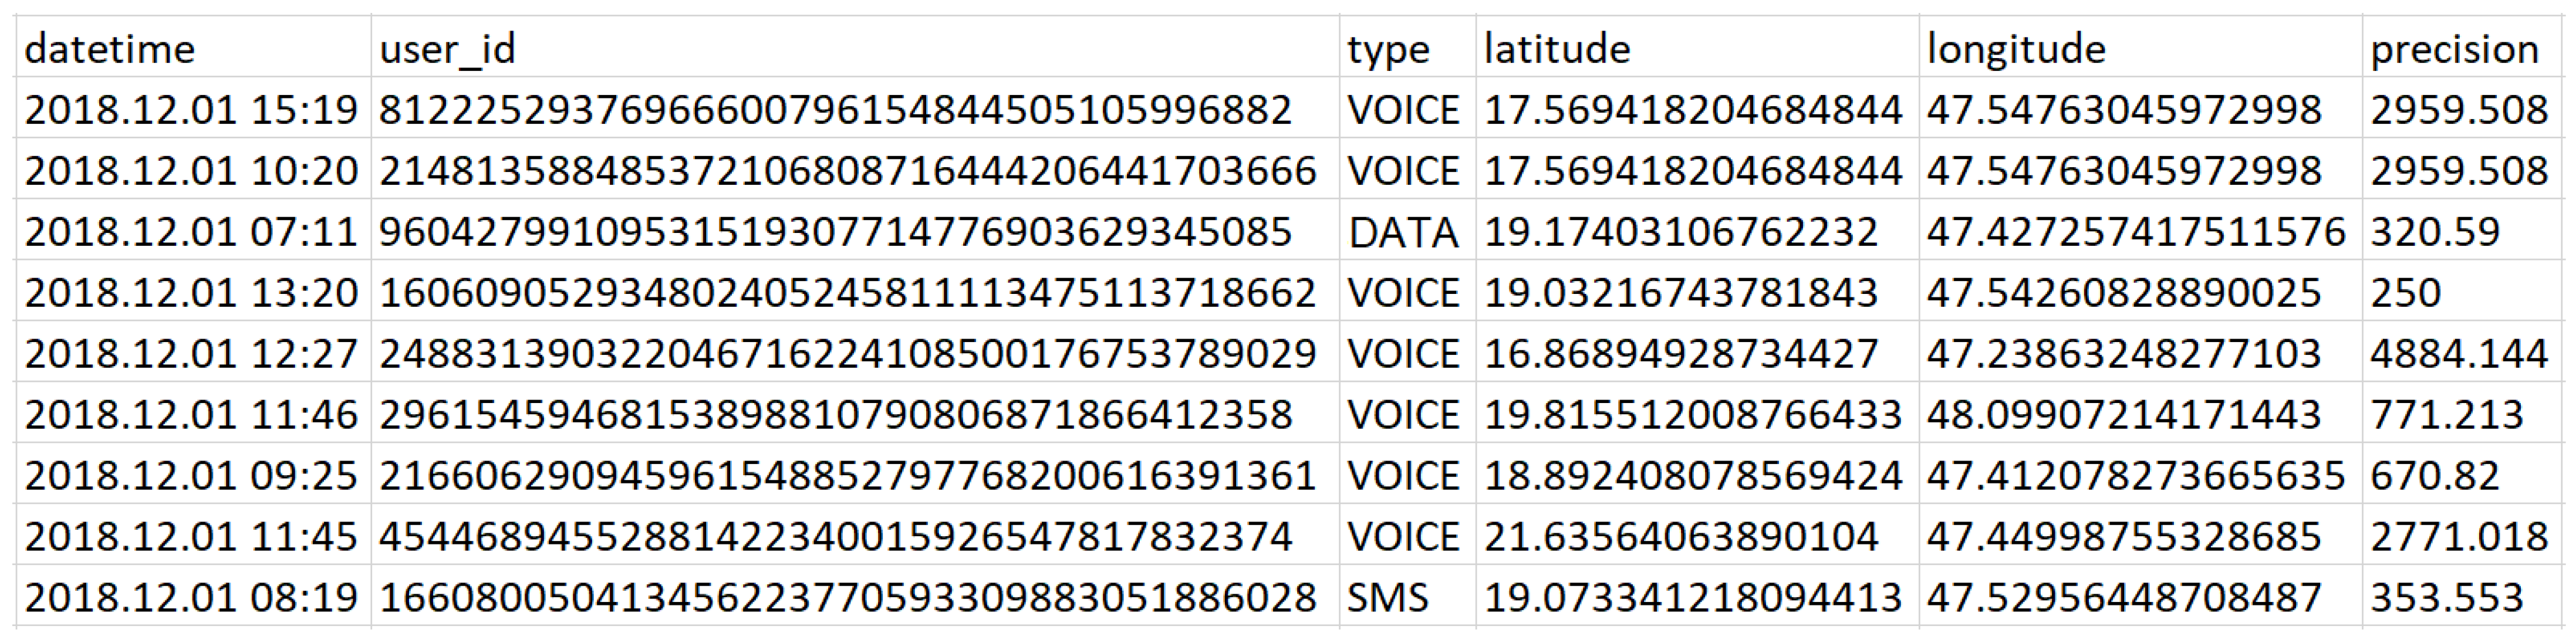
In the raw data we have two comma separated value (CSV) files without headers for each day in the 6-month period. One of them contains the log events for a particular day, while the other file contains the anonymized user information for each user that had at least one log event on that day. The log events file contains columns in the following order separated by semicolons:
The date of the event with minute precision in datetime format;
The id of the user, which is a 38-digit number;
The type of the event, i.e., whether it is a voice call, text message (SMS) or data usage;
The latitude coordinates;
The longitude coordinates;
The precision of the location.
The exact location of an event was fixed inside a circle with the center defined by the latitude and longitude coordinates and the radius defined by the precision variable (in meters).
Figure 1 shows a sample of the raw log data. Because of this, the use of Voronoi tessellation algorithm (which was used through other CDR data processing [
62,
63,
64]) is not necessary, since the CDR data contained the precision value, so we were able to correctly estimate the errors of the coordinates.
The user information files contain the following columns. Day; user id; whether the user has a pre- or postpaid subscription plan; business type; business type code; the country code of the SIM card; the name of the country where the SIM card was bought; whether the SIM is domestic or international; age; gender; country of residence; postal code; brand of the cell phone, if the user has a subscription, whether it is a smartphone or not; the amount of last bill in Hungarian Forints; whether mobile parking, motorway ticket, or other services have been bought through the subscription. However, not all information is available for every user. In addition, the data were anonymized, so it was not possible to identify a concrete person based on the attributes, and only the user id was used during the data processing, along with the data management regulations set by the European Union’s General Data Protection Regulation (GDPR).
One log event file is around 2.5–4 GB in size when compressed and around 6–9 GB when uncompressed. For the user information files, these numbers are 110–140 and 500–600 MB, respectively. On average, a log event file contains around 100 million events, while a user information file contains around 3–4 million users. This means, the uncompressed raw log dataset was around 1.8 Terabytes, comprising around 18 billion events, which is the final raw dataset that we rely on in this paper (
Figure 2).
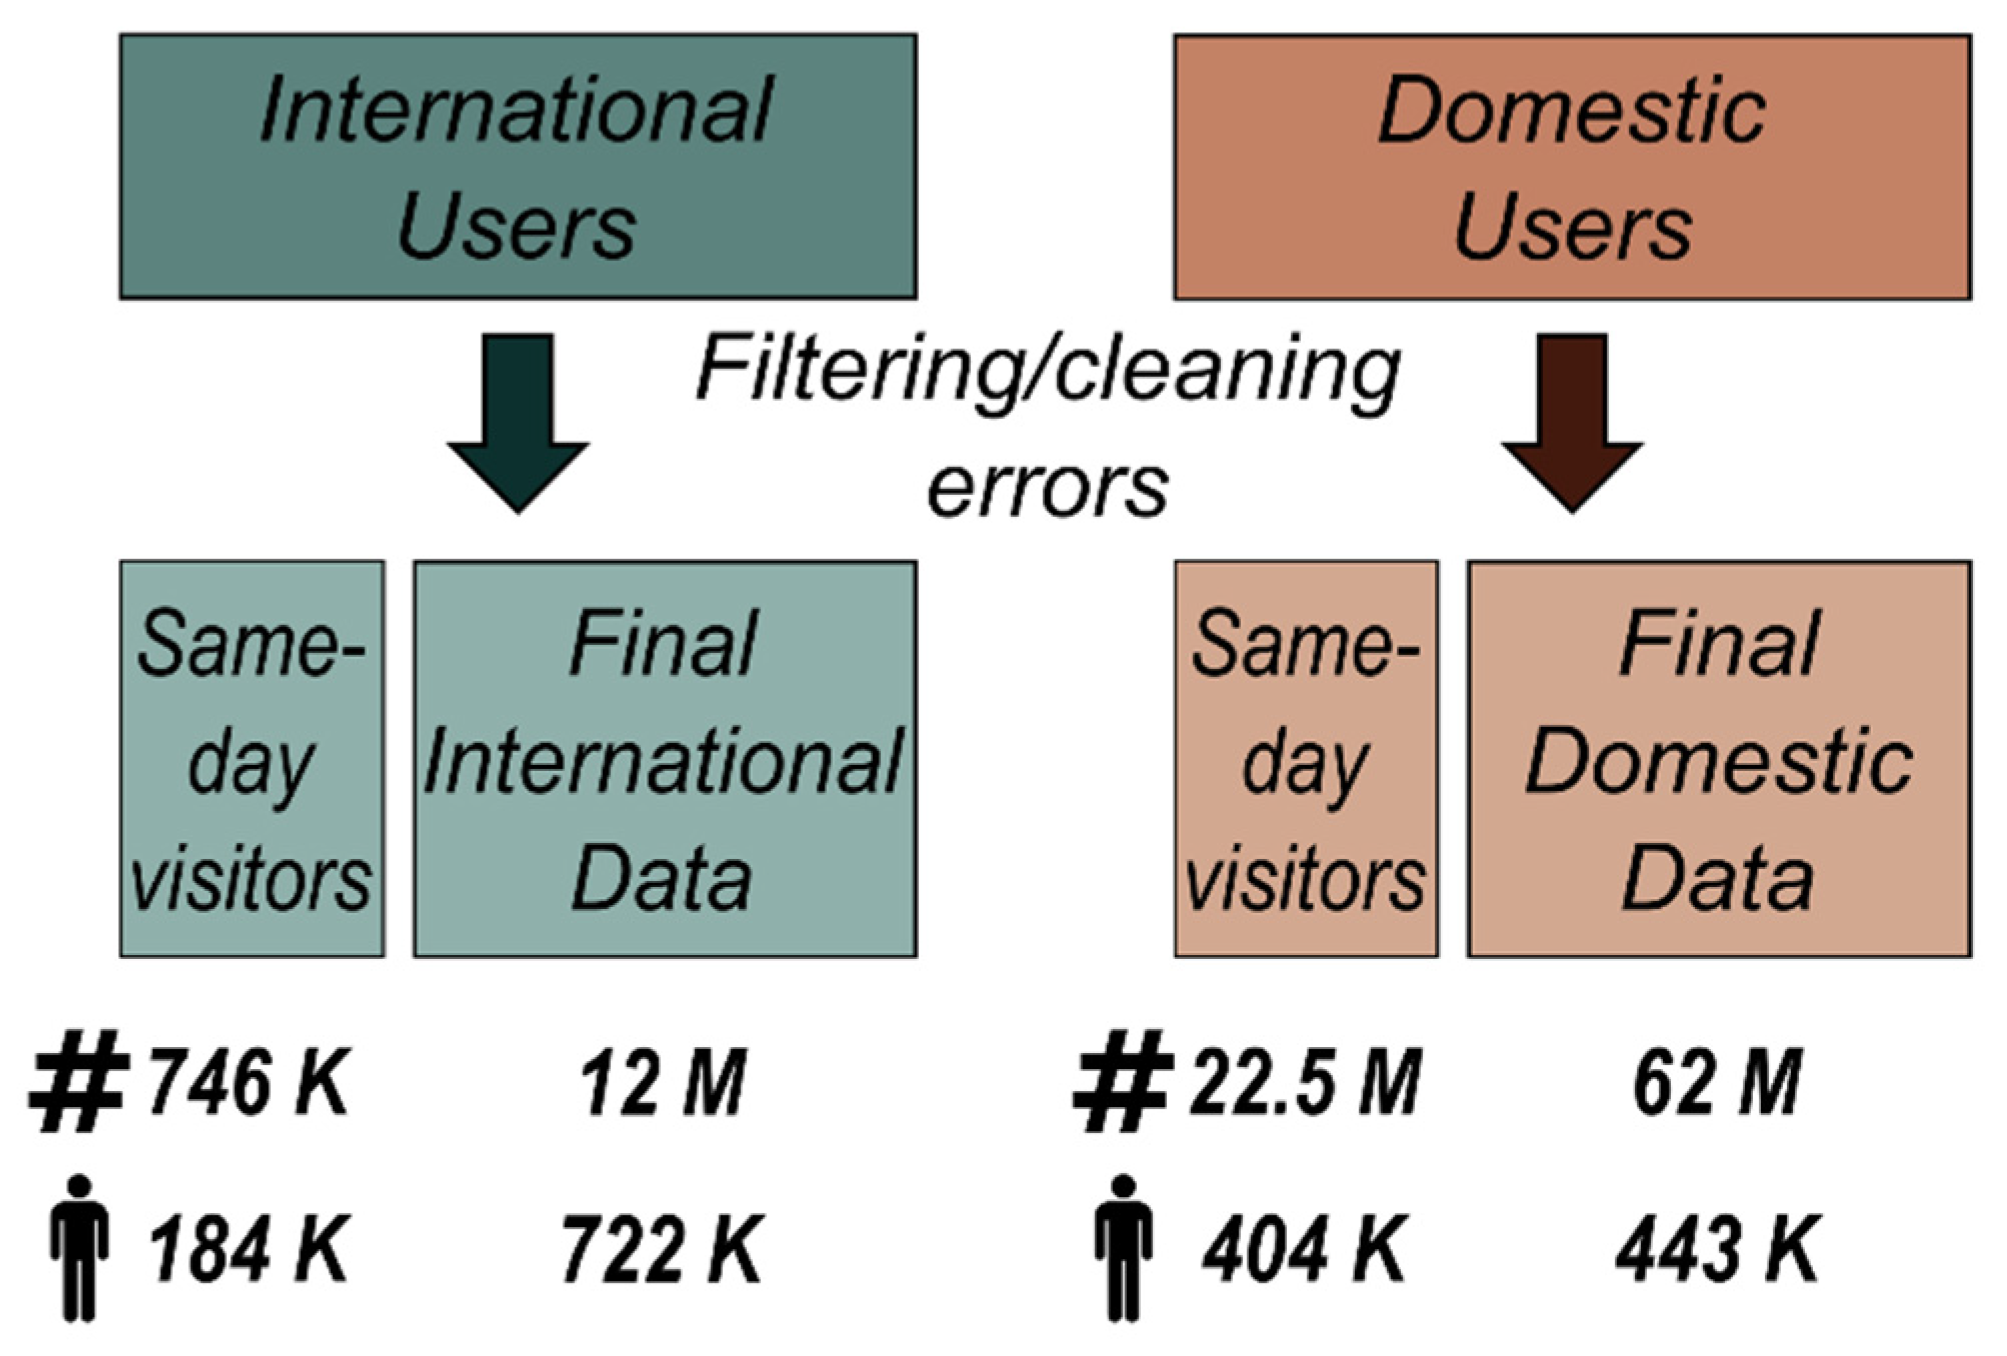
3. Data Processing and Cleaning
Prior to the assessment of mobile positioning data, it is important to describe the logic of data processing resulting in a reliable dataset. First, the steps of processing raw data are summarized which can be useful for similar research in the future. Then the steps of extending the database with user information and splitting it into international and domestic parts are described. For research purposes it is necessary to separate the domestic tourism-related movements from usual activities, for which the concept of network of usual places (NUP) is applied, based on the existing literature. Finally, a detailed description is provided regarding the filtering and cleaning of the two (domestic vs. international) datasets, removing possible errors (
Figure 3).
3.1. Loading the Data into the SQL Database
As the first step of data processing, data were loaded into the sql database. To do this, a data collector script was used that downloads and uncompresses the daily batch files in chronological order, while splitting the data into rows and columns based on the separator characters. Then, the script inputs were applied in the Kafka stream processing application. The Kafka application uses a persistent storage, which means that it does not delete the raw data while processing it.
During data processing, the log and user information data were handled separately. Since the size of the user information files was relatively small, we were able to load them simply into a postgresql database using the raw data columns without any further modification. Next, the daily user information tables were merged into one table since the daily tables contain many repetitions. The resulting table contained all the 7.3 million users that appeared in the log events during the studied period.
To be able to load the huge log data into the database, the raw daily batch files had to be processed. Using the Kafka application, data were split into 12 partitions based on the user ids. This means that every event of a user was loaded into the same partition. A random sampling method of the user ids was used to partition them, based on the assumption that the ids are coming from a normal distribution.
Since the daily data batches are not grouped by user id, nor are they ordered by time, during processing a grouping and ordering step for each batch had to be included. This was done after partitioning the daily events based on the user ids, i.e., the events were grouped and ordered for each user chronologically in each partition. This made the processing significantly faster later, since the merge and heap ordering methods that were used have quadratic time complexity in terms of the number of events. Since the daily packages were processed in chronological order, in the final raw data tables the events of every user appeared in daily batches and were ordered by time.
When events were merged during the grouping and sorting process, the number of distinct events were also reduced for scalability reasons. Our aim was to merge several events into one robust event, which in itself contains all the information that the merged events contained, but in a denser format. Since the whole time series of a user could not be processed in one step due to the enormous size of the data, the merging was done right after processing each daily batch log file. In this way we were able to work with the grouped and sorted daily events while they were still in the Kafka stream and loaded only the merged data into the sql database. The idea was that successive events of a user that happen at the same place are merged. A counter was kept that tracked how much time the user spent at a specific location in order not to lose any information from the raw data.
3.2. Merging Events
The input data for our proposed algorithm is a time series of circles on the map defined by their center and their radius. The output is a time series of points on the map with an extra attribute that refers to the time spent at the corresponding location. Events were iterated through each user and each day when the user had at least one event.
Our algorithm used four variables. The first one is the ‘current place circle’, where the user is assumed to be currently. The second is a ‘time spent’ variable that measures how much time the user spent at the current place. Third, a ‘temporary circle’ was used that was compared to the current place variable. Finally, a ‘temporary set of circles’ was used to calculate the exact place of the user in the merged event (
Figure 4).
For each user, the first circle was started with the first occurrence in the daily log data. The current place was set to the first circle and the time spent attribute to zero. This circle was also added to the temporary set of circles. Then, whether the subsequent circle of the user in the data intersected with the current place circle was checked (In practice, we used the maximum norm instead of the Euclidean norm, since it scales much better). If they intersected, this circle was merged into the current place; this circle was inserted into the temporary set of circles and updated the time spent attribute to the time difference between this and the current place event. The merging process was continued until a circle did not intersect with the current place circle or the user did not have any circles left. When this happened, first a new data point was created for the user, based on the current set of temporary circles and the time spent variable. The latitude and longitude coordinates for this new point were set to be the averages of the latitude and longitude coordinates of the temporary set of circles, respectively. The time spent attribute for this data point was set to be the current value of the time spent variable. Second, the current place variable was set to the temporary circle that did not intersect with the previous current place. The circles were also deleted from the temporary set of circles while adding this circle to the set, and the time spent variable was set to zero. The merging process was iterated for all the circles in the input for each user (Algorithm 1).
| Algorithm 1. The pseudo code of the merging algorithm. |
forall USER do:
Input: USER_circles[]
Output: USER_points_with_time_spent[]
current_place_circle <- USER_circles [0]
time_spent <- 0
temporary_circle <- USER_circles[0]
temporary_set_of_circles.append(USER_circles[0])
for circle_i in USER_circles[1:] do:
if circle_i INTERSECT temporary_circle do:
temporary_set_of_circles.append(circle_i)
time_spent += circle_i.time - temporary_circle.time
temporary_circle <- circle_i
else:
current_location <- AVG(temporary_set_of_circles.location)
USER_points_with_time_spent.append(current_location, time_spent)
current_place_circle <- circle_i
time_spent <- 0
temporary_circle <- circle_i
temporary_set_of_circles.clear()
temporary_set_of_circles.append(circle_i)
end if;
end for;
return USER_points_with_time_spent;
end forall; |
Those events that were close to each other were merged, while keeping track of how much time the user spent at the place of the merged events. In summary, our algorithm compressed the data from 16 billion events to around 3.5 billion events, with almost a one to five compression rate. After the merging process the output data was loaded into the postgresql database and split into partitions.
3.3. Adding User Information and Interpreting Coordinates
Although the dataset became denser after the first stage of processing, further steps were needed to make it more compact and researchable. For example, the data types of the user id and the coordinate variables had to be changed, since they were not efficient, which made querying slow. Thus, a new user id was created that is a 32bit integer, instead of the large integer used previously; in addition, a 16 bit floating point number was used for the coordinates moving forward. The information contained in the log events and the user information tables were joined, in order to make querying possible based on, for example, the users’ country of origin. At this point, although it was possible, no additional information on the users was added to the tables in order to keep the size relatively small.
The next step was to connect the coordinates of each event to a local municipality. This enabled later querying and filtering of events based on their location. This was done by using an additional data source that contained the polygon coordinates of all municipalities (3155) in Hungary and each event was assigned to a polygon of a settlement (i.e., municipality). Finally, based on the municipality where the event took place, the code of the county and the region of the event also added. These attributes helped us later to easily find all the tourists in a certain region or to identify tourist flows between counties or municipalities.
Consequently, there were 11 attributes for the final baseline sql tables; a new user id that is an 8-digit integer; the time of the event; the day of the event; the country of origin of the user; the time spent attribute; the latitude and longitude coordinates; the municipality, the postal code, the county and the region.
3.4. Identifying Domestic and International Users
After processing the raw data and loading the results into the sql database using the Kafka stream processing framework, the data processing was continued in the postgresql environment. First of all, the data were split into two groups according to the nationality of the users: domestic and international. This was important because the overwhelming majority of the domestic data was not tourism-related, while most of the foreign user data belonged to this category. Hence, these two groups had to be handled separately and processed differently.
Figure 5 shows that the datasets of domestic and foreign users differ significantly. First of all, the number of events generated by domestic users (3.5 billion) is almost a hundred-fold that of foreign users (37 million). However, the number of distinct users is almost the same in the two groups (3.8 and 3.5 million users, respectively). The average number of events per user is 947 with a median of 387 for the domestic users and 10.7 with a median of 4 for the foreign users. This difference is, however, quite intuitive, since domestic users were present in the country for the whole period, while international users were captured only for a shorter period of time. Domestic users had events in 68 different days on average with a median of 62 days, while the same value for international users was 4 and 2, respectively. The event density (i.e., the number of events per day) was 14 for the domestic and 3 for the international users. This means, that not only the number of events, but their density is also significantly higher among domestic users. More than half of the international users had only less than 5 events (
Figure 6). For domestic users, the numbers were much more balanced, but in this case also more than one-third of the users had less than 180 events in total, which is less than one event per day.
3.5. Defining the Touristic Activities of Domestic Users
Since our aim was to create a database that would provide meaningful insights on tourism-related movements, not only for international but also for domestic users, we had to clean the dataset further to get rid of the bad quality and noisy data. For domestic users, those intervals had to be defined that could be related to tourism activities and they had to be separated from the usual environment, following the UNWTO approach [
59]. A conceptual framework has already been developed for the detection of the usual environment [
65,
66], which we also used to select tourism events, but we had to adapt it to our own database and purposes. A table was created to support the labelling as follows: first, the number of events was counted for each user as well as the number of distinct days at every location the user visited. Based on these data, we could define for each user the Usual Place (‘UP’), Near Usual Place (‘NUP’) or Touristic Place (‘T’) and label the municipalities. The motivation of the labelling was to identify those places where a user usually spent longer time and more frequently, such as the users’ home and workplaces or places they regularly visited. In defining these places, existing conceptual frameworks and the principles of the concept of network of usual places (NUP) [
65,
66] were considered, although the thresholds were determined based on the natural breaks shown in our dataset. These events should not be considered as touristic movements. At the same time, all other events that were not at or near usually visited places were considered as tourism-related activity.
For a user, we labelled a location UP if at least one of the following held:
It was (one of) the users most visited place(s), based on the number of days the user spent there;
The user had an event on at least 25 distinct days;
The user had an event on at least 20% of his/her total number of days.
A location was labelled NUP, if it was less than 15 km away from the place labelled as UP. The intuition with the NUP label was that certain movements in the narrower home/work environment could not be considered as tourism-related events, such as, for example, if the user went home on a different route or visited a nearby shopping mall or sport facility. Every other place was labelled as T.
As a next step, in order to separate tourism-related activities of a user, events that took place in a location labelled either UP or NUP were deleted. Doing so, the users’ timeline was split into touristic intervals, i.e., such intervals that were consecutive events with T labels. As a result, every interval could be considered as a possible touristic visit for each user. Each such visit could be considered a separate entity, similar to an international visit, and a special ID was assigned for each of them. This means that a distinct touristic visit could be examined without considering the users’ other visits.
In order to detect the usual places properly, every user was filtered out with less than 100 distinct days. This was necessary to be able to work with only those users that had events throughout most of the examined period. Users with less distinct days also tended to have proportionally more touristic visits, because of the definition of the usual place.
Obviously, this labelling is not perfect, for example, rare occasions such as family visits or work trips are not distinguishable from touristic visits, since they have very similar patterns. Although the original aim of the research was precisely to explore unobserved tourism (which contains these activities), and in practice our methodology works well for identifying touristic visits, and because of the size of the domestic data, more sophisticated filtering methods would not be scalable.
As a final step of the labelling of domestic data, the resulting dataset was divided into two tables: same-day visitors and tourists, based on whether the user had at least one sleeping event (stay overnight) during the visit or not. For some research questions, these two tables were merged; however, for certain questions it was more meaningful to work with two separate tables.
3.6. Filtering the Data
The next step was to clean the datasets, extracting the touristic movements of domestic users and international visitors from roaming activities. For this, the following heuristic was used to filter bad quality users and events. First, the variables of ‘time difference’, ‘distance’ and ‘velocity’ were created. The time difference variable refers to the time difference between the current and the previous event. The distance variable is the distance between the locations of the current and the previous event. The velocity variable equals the distance divided by the time difference. These parameters were created to filter such errors in the dataset where the users travelled very long distances during a very short period of time. These events usually came in bunches for certain users, with the user jumping back-and-forth between places far from each other.
Next, different variables were created with the help of experts from the Hungarian Tourism Agency (HTA) that helped identify meaningful events at certain places, such as: ‘1 h spent’, ‘4 h spent’ and ‘sleeping’. These variables were experimented and calculated beforehand based on the time spent variable, which indicated for a particular event how much time the user stayed at a certain place. If the time spent variable for an event was greater than 1 h or 4 h, then we assigned the value ‘True’ to these variables. The value ‘False’ was assigned otherwise. As for the sleeping event, we assigned ‘True’ to either the very first event after 4 am in the morning or the last event before 4 am, based on which place is more common for the users, based in turn on his/her visit. If these two events were at the same place then the user obviously slept there. However, when the place of these two events differed, it was not obvious which place should be chosen as a sleeping place. In these cases, the heuristic above proved to work the best in finding the sleeping place.
These variables could be used in further steps of the research to answer the questions: ‘Where did those people stay overnight who spent at least 4 h in a specific location but did not sleep there?’ or ‘Have the tourists staying at a particular location taken same-day trips in neighboring places?’.
As a first step, those visits were filtered for which at least one of the following criteria was fulfilled:
It has less than five events,
It does not contain at least one event where the 1 h spent variable is true,
The difference between the latest and earliest event is less than 12 h,
The speed variable in one of the events exceeds 500 km/h,
The speed variable exceeds 300 km/h and the time difference variable is at most 3 in multiple events.
The last two conditions aimed to filter visits that contained errors. On the one hand, where the speed exceeded 500 km/h, the user travelled way too fast for the event not to be an error. On the other hand, the last condition filtered out those back-and-forth movements that usually are the result of two users having the same user id.
All the thresholds above are purely based on heuristics and can be changed when using other datasets. At the same time, these numbers were those that worked the best for us on this particular dataset in terms of the resulting data quantity and quality trade-off. To answer specific research questions, obviously other threshold settings can be used. For example, to examine a place with only few tourists, the settings can be loosened, allowing consideration of more users in the filtered dataset. However, analyzing such problems where the number of users was big enough, stricter filtering settings could be applied for the sake of better data quality.
For the international users, our assumption was that, except for some special cases (e.g., truck drivers), every visit can be considered as tourism-related activity. However, similarly to the domestic users, we had to filter the data to keep only those that reflect tourist visits. Every international user was disregarded for whom at least one of the following was fulfilled:
The user had less than five events in total,
The user had an event per day ratio less than 1.5,
The user had events on more than 25 distinct days,
The user did not have a sleeping event.
The first two conditions are straightforward data quality requirements. The third one makes sure that users who stay in the country for a longer period of time (e.g., Erasmus students) are not considered, since they are not tourists by strict definition. Finally, the last criterion filters out the same-day visitors. Separate tables were created for the users with at least 25 distinct days and one day tourists in order to be able to gain insight also into their spatial behavior [
6].
Figure 7 shows the overall event distribution for the filtered international and domestic events and users within Hungary.
3.7. Validation of the Final Database
In order to assess the reliability and representativeness of the filtered database, official tourism-related statistics of the Hungarian Central Statistical Office (HCSO) were used. During the assessment, the official data of guests and spent guest nights of a given period at the municipal level was compared to the dataset based on MPD. While the former contains only data of tourists who were officially registered by commercial accommodation services, the latter includes the data of those who used the services of the provider (between 27 and 45% of all domestic mobile users [
67]). However, we must keep in mind that in the case of international tourists it is not straightforward which network their mobile phone connects to when they arrive to a given country. Therefore, the shares of the total visitors that connected to our network provider for each country had to be calculated. In addition to representativeness at the macro-scale, spatial and temporal validation of domestic and international tourists is also important. For this purpose, correlation and regression coefficients were calculated regarding the spatial (settlement level) and temporal (monthly) distribution of guests and guest nights derived from the HCSO and the MPD datasets, in order to determine to what extent the filtered database differs from official statistics. However, certain biases do not necessarily mean that the database is of bad quality, as several tourism-related activities can be detected with the MPD, which are not included in commercial statistics (e.g., unobserved tourism which can be linked with family relations, or private accommodation services, or same-day visits).
4. Results and Discussion: Assessment of the Final Database
In this section we aim to assess the reliability and representativeness of the final database. For the validation, we use official statistics collected by the Hungarian Central Statistical Office at the settlement level. Data on international and domestic tourists staying at commercial accommodation establishments (hotels, pensions, camp-sites, hostels, bed-and-breakfasts, etc.) cover the period 1 July–31 December 2018. The share of officially recorded international tourists captured by MPD differs very much by country (
Table 1). According to our dataset, more than two thirds of tourists arriving from France, Cyprus and Bulgaria were connected to the network of our provider, whereas only 6% from the USA, and even fewer from Japan and Norway. This means that MPD of a single service provider can be highly representative for some countries, whereas it has limitations for others. Our estimation is that, below 20% representativeness, the data of foreign visitors should be handled with caution. For a full coverage of international tourism, obviously, data of all mobile network operators (in Hungary there are three) should be collected and processed, which means not only a methodological, but also a financial and organizational challenge.
As a next step, the filtered datasets (both domestic and international tourists) were evaluated with correlation coefficients at the settlement level (
Table 2). Regarding the number of domestic tourists, the correlation coefficient is 0.733 and the slope of the regression line is 0.24. The latter means that, on average, 24% of tourists were detected using MPD, while the former shows how accurately the tourist pattern was captured by the filtered database when compared to the official statistics. The degree of correlation can be considered good, especially since the figure shows that the MPD tended to overestimate the number of tourists at those settlements where the number of visitors was low, and hence they are probably more exposed to unobserved tourism (i.e., tourists not appearing in accommodation statistics) [
68]. The values were similar in the case of the number of guest nights, but this was estimated with a slightly higher efficiency (R = 0.766), but to a lesser degree (19%). With the exclusion of those municipalities where the number of guests was zero in commercial accommodation, but the MPD detected tourist movements, the efficiency of the estimation increases (R = 0.771 and R = 0.779).
The spatial concentration of international tourists is very high in Hungary, but Budapest, the capital city, attracts a disproportionately large share of foreign visitors, which thus, distorts the correlation and regression calculations which are highly sensitive to outliers. Therefore, the efficiency of the estimation was also examined without Budapest. Nonetheless, the calculated correlation coefficients and the slope of the regression lines also provided useful information, as according to both official statistics and MPD more than half of the international tourists concentrated in the capital city and 21% of these guests and 17% of guest-nights were captured by MPD (
Table 2). These values significantly decrease with the exclusion of Budapest (16% and 7%, respectively).
We were also interested in the geographical pattern of unobserved tourism. Based on
Figure 8, our preliminary assumption was that unobserved tourists concentrate predominantly outside major tourist hotspots. To test this hypothesis, we separated the data of Budapest and the 100 biggest destinations based on the number of officially registered tourists (both international and domestic) within the country. As
Table 3 shows, the 101 most important tourist destinations concentrated 93.5% of the international and 76.6% of the domestic tourists officially registered in the country in the second half of 2018. Our MPD dataset captured 28.2% of the officially recorded international visitors in the period, which is very similar to the market share of the provider. However, the spatial distribution of international SIM cards was significantly different from national statistics on tourism, since, as opposed to 93.5%, only 70.9% of the international tourists could be linked with major tourist destinations. In our opinion, a substantial part of international visitors travelling to regions/settlement less frequented by tourism normally stay with friends, relatives, or at private accommodation facilities. In this way most of them remain hidden for tourism statistics. According to our data, the share of unobserved visitors is even higher in domestic tourism. There were 3.7 million domestic tourists in Hungary in the studied period, out of which MPD recorded 3.1 million, again predominantly outside the most frequented tourist destinations. These results shed light on the limitations of accommodation statistics and confirm the usefulness of MPD as a proxy for the actual number of tourists in a given location/region.
The correlation coefficients calculated on a monthly basis reflect the spatial accuracy of the estimation in time. Based on this calculation, we can say that there was no significant change in the case of domestic tourism, i.e., the MPD database estimated the official statistics with similar efficiency in every month (
Table 4). However, the accuracy of international tourism estimates is steadily declining over time in terms of both the number of guests and the guest nights. This may be the result of the high seasonality of international tourism in Hungary [
69], i.e., it is easier to create a geographically accurate database from MPD for a larger number of tourists in the summer period (
Figure 9). Thus, for the late fall and winter months, our dataset is less accurate.
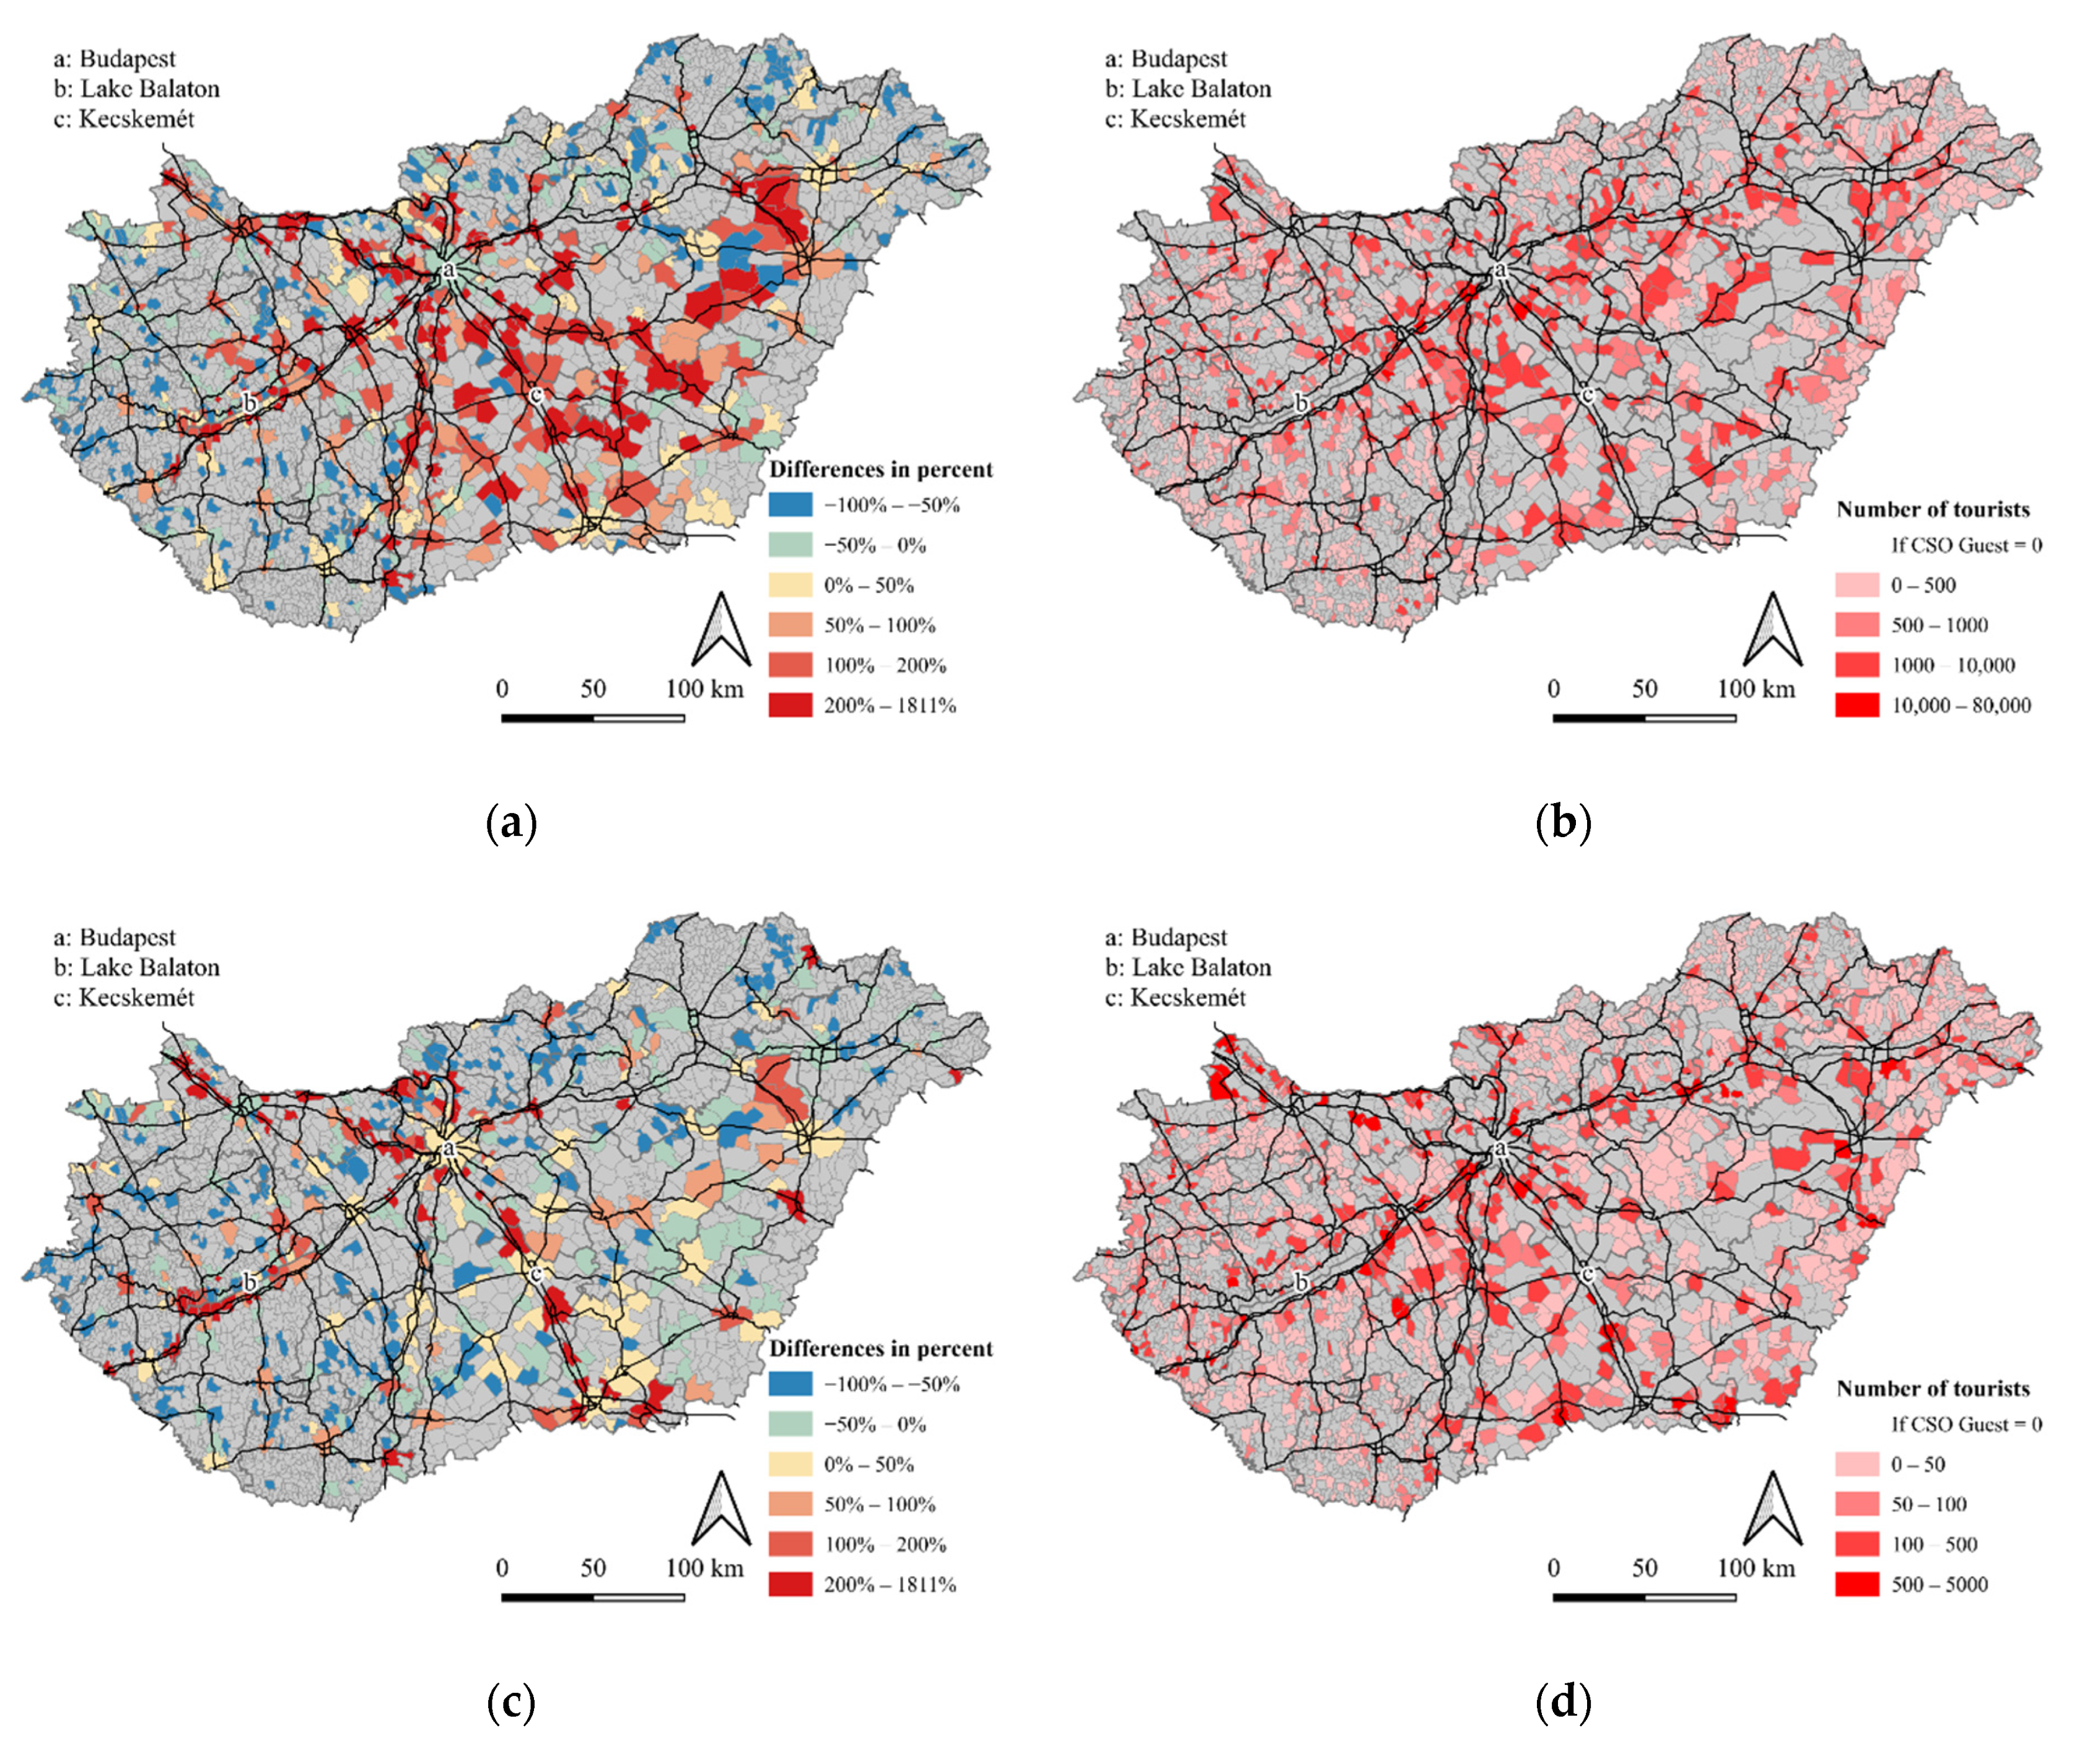
The difference between the number of guests predicted by the regression line and detected by the MPD has distinct spatial variations for both domestic and international tourists (
Figure 10a,c). In the case of domestic tourists, the inaccuracy of the estimate is minimal for major tourist destinations (i.e., regional centres), while in the case of medium-size towns and smaller settlements, where the phenomenon of unobserved tourism is more likely, the number of guests was overestimated (
Figure 10a). This can also be observed in the case of Lake Balaton (for the estimation of international tourists too), where a significant part of guest nights is not recorded in commercial accommodations [
70,
71]. The spatial configuration of international tourists shows a similar but much more concentrated pattern, where flows related to the concentrations of foreign direct investments (i.e., business and logistic centres) may play a role in the overestimation (for example, the Mercedes plant in Kecskemét) (
Figure 10c). In addition, there are several settlements in Hungary without commercial accommodation services (where no guests can officially be registered), but we could detect tourists on the basis of MPD (
Figure 10b,d). Out of the 3155 Hungarian settlements, international tourists were captured in 1531, and domestic tourists in 1404 locations, i.e., 48.5% and 44,5% of the settlements, respectively. According to our understanding, they can be defined as unobserved tourists. This phenomenon is more prevalent in the central part of the country, in the wider urban agglomeration of Budapest, and in the eastern part of the country [
72]. In our opinion, most of these visitors are either people staying with relatives or friends, or use some alternative (non-registered) accommodation, or they are transit travelers (especially near the border crossings) (
Figure 10b).
5. Conclusions
Even though this research had clear methodological considerations, the presented results also have some conceptual and policy implications. As was demonstrated, official statistics on tourism have many shortcomings and ambiguities that can be eliminated by new research technologies, such as mobile positioning data. Knowledge of the real-time activities of tourists at a certain location and their spatio-temporal behavior can provide much added value for sustainable tourism policy and destination management [
73]. As was highlighted in the introduction of this paper, despite the growing importance of Big Data sources in tourism research, a comprehensive overview of the processing and filtering of mobile positioning data to capture various unobserved forms of tourist movements is by and large missing from the literature. Therefore, the main aim of this paper was to present a case-study on the processing and cleaning mechanisms of mobile positioning data to gain reliable information about the actual number of visitors (both domestic and international) at a certain location. Such data sources can extend the knowledge provided by accommodation statistics, improving the timeliness and spatiotemporal resolution of the data.
While the majority of previous studies in the field used only data for a shorter period of time (e.g., two weeks or the time of specific events) [
74] or focused exclusively on inbound international tourism [
75], this research was based on the full dataset of one of Hungary’s mobile network operators for six months in 2018. Our main aim was to shed light on the challenges and opportunities of MPD processing, especially regarding statistically unobserved forms of tourism (e.g., day trippers, family visitors), and to provide possible benchmarks and solutions. On the one hand, we presented solutions to challenges caused by the size and structure of the dataset (e.g., data management, filtering, cleaning, etc.), and on the other hand, we demonstrated how a more accurate picture of the spatio-temporal dimensions of tourist movements can be achieved. The novelty of the research lays in (1) the definition of thresholds for data filtering, (2) a more sophisticated and accurate definition of possible errors in the dataset, (3) the introduction of new variables that facilitate data reduction in tourism-related analyses, (4) an accurate identification of unobserved (same day) tourism. The definition of the thresholds is well-grounded due to the size and the time-span of the dataset. After defining the key variables, it was possible to identify and analyze the flows of various user groups (i.e., domestic and international tourists). As was shown with the inclusion of the 1-h and 4-h spent variables (and the merging of these events), a significant data reduction could be achieved, while the new dataset offered good opportunities for measuring hidden forms of touristic activities (e.g., cross border trips, one day visitors) [
76]. Thus, we can say that through the application of our approach, the study of various forms of unobserved tourism at the intra-urban and intra-regional level becomes possible.
Furthermore, the delimitation of secondary destinations without officially registered tourist visitors became possible and the spatio-temporal characteristics of the related tourist flows could also be measured [
6]. Such locations can gain useful information about the actual number of tourists (both international and domestic) visiting them, their seasonality and spatio-temporal behavior. This knowledge can help less frequented tourist destinations elaborate their own tourism policies and pursue sustainable tourism planning and destination development. Altogether, the methodological procedure presented in this study can help increase the efficiency and reliability of the use of MPD and contribute to the standardization of the methods used in Big Data tourism research. The methodology can support the analysis of local tourism flows; thus, it may lead to better management and more optimal policy formulations at the local level. At the macro-geographical (national, regional) scale, the analysis of MPD with the suggested methodology can help track tourism flows more accurately, identifying secondary tourism hot spots that remain very often hidden in statistics [
16]. Challenges related to the recent COVID-19 pandemic also increased the importance of such analyses [
15,
77]. Tracking the tourism-related spread of infections or monitoring the effects of changing travel regulations on tourism activities has great potential in future studies [
2]. Future research could also refine the data cleaning process, for example, filtering transit traffic (e.g., truck drivers) that cross the country without any tourism-related activity.
As with other research in the field, this study has also certain limitations. First of all, we used data only from one network provider and the clienteles of the other two operators have not been covered. As was shown by our assessment, using the data of one single operator may lead to bias. This is important to note because the structure of the data and the problems arising during data processing may be different in the case of other providers. In addition, the sending countries are not equally represented either, because this depends on the provider’s international collaborations, so this distortion should be considered in the interpretation of results. Furthermore, the simultaneous use of data from various providers may positively affect the reliability and comparability of such data. Last, but not least, while MPD offers useful insights to tourism flows, their underlying causes and motivations remain unexplored, thus the presented Big Data method should be extended by conventional methodologies (e.g., surveys) to obtain a comprehensive picture of the driving forces of tourism related mobility.


