Article

A Transfer Learning-Based Artificial Intelligence Model for Leaf Disease Assessment

1
Chitkara University Institute of Engineering and Technology, Chitkara University, Rajpura 140401, Punjab, India
2
Higher Polytechnic School, Universidad Europea del Atlántico, C/Isabel Torres 21, 39011 Santander, Spain
3
Faculty of Engineering, Universidade Internacional do Cuanza, Estrada Nacional 250, Bairro Kaluapanda, Cuito-Bié 250, Angola
4
Department of Electrical Engineering, College of Engineering, Princess Nourah bint Abdulrahman University, Riyadh 11671, Saudi Arabia
5
Department of Project Management, Universidad Internacional Iberoamericana, Campeche 24560, Mexico
6
Electronics Engineering Department, J.C. Bose University of Science and Technology, YMCA (Formerly YMCA UST), Faridabad 121006, Haryana, India
7
Department of Computer Science and Engineering, Central University of Haryana, Mahendragarh 123031, Haryana, India
*
Author to whom correspondence should be addressed.
Sustainability 2022, 14(20), 13610; https://doi.org/10.3390/su142013610
Submission received: 26 August 2022 / Revised: 14 October 2022 / Accepted: 14 October 2022 / Published: 20 October 2022

Abstract

:
The paddy crop is the most essential and consumable agricultural produce. Leaf disease impacts the quality and productivity of paddy crops. Therefore, tackling this issue as early as possible is mandatory to reduce its impact. Consequently, in recent years, deep learning methods have been essential in identifying and classifying leaf disease. Deep learning is used to observe patterns in disease in crop leaves. For instance, organizing a crop’s leaf according to its shape, size, and color is significant. To facilitate farmers, this study proposed a Convolutional Neural Networks-based Deep Learning (CNN-based DL) architecture, including transfer learning (TL) for agricultural research. In this study, different TL architectures, viz. InceptionV3, VGG16, ResNet, SqueezeNet, and VGG19, were considered to carry out disease detection in paddy plants. The approach started with preprocessing the leaf image; afterward, semantic segmentation was used to extract a region of interest. Consequently, TL architectures were tuned with segmented images. Finally, the extra, fully connected layers of the Deep Neural Network (DNN) are used to classify and identify leaf disease. The proposed model was concerned with the biotic diseases of paddy leaves due to fungi and bacteria. The proposed model showed an accuracy rate of 96.4%, better than state-of-the-art models with different variants of TL architectures. After analysis of the outcomes, the study concluded that the anticipated model outperforms other existing models.

1. Introduction

The paddy crop is the most essential and useable crop in agriculture. The yield of an agricultural harvest is significant for boosting a country’s economy. Several aspects influence the production and yield of the crops, such as diseases, pests, and environmental factors. Crop disease is one of the most critical factors that drastically hamper crop quality [1,2,3]. Detecting plant leaf infections can reduce deficits in yield. The most effective illness regulator is a precise, accurate, and fast diagnosis in the earlier stage of disease development. Initially, manual checking was the only way to identify plant leaf disease based on leaf texture [4]. Skilled and experienced individuals were required to complete the task, which required a huge amount of time spent and led to a reduction in crop yield. That is why a more efficient disease detection method is needed. Over the past few years, researchers have used image processing and computer vision technology [5,6] to tackle various issues such as yield estimation, identifying nutrient deficiency [7,8,9], geometric size of crops [10], and weed identification [11,12,13,14,15,16]. Plant leaf disease identification has substantial agricultural benefits. However, this task remains problematic owing to the scarcity of artificial intelligence for farming applications [17,18,19,20,21].
The issue was addressed by various researchers with diversifying AI techniques such as machine learning techniques [22], deep learning and hybrid techniques [23,24,25,26,27,28,29,30,31,32,33,34,35,36,37,38,39,40,41,42,43,44,45,46,47,48,49,50,51,52,53,54,55,56,57,58,59,60,61,62,63,64,65,66,67,68,69,70,71], and transfer learning techniques [72,73,74,75,76,77], as elaborated below.
An architecture of four input-level neurons [22], five hidden-level neurons, and one output-level neuron is the best disease-identifying Artificial Neural Network (ANN) architecture. This architecture has 66.3% precision for identifying paddy diseases, namely hispa, brown spot, leaf blast, and healthy.
The sugar beet leaves’ diseases were classified and detected using an updated Fast R-Convolution Neural Network (CNN) [23]. The model was trained with 155 images and attained an accuracy of 95.48%. SoyNet is a two-module-based approach that first segments hidden parts of images; afterward, the deep learning-based hand-crafted models were applied to soybean leaves to detect disease [24]. Pretrained deep-learning models were used to identify tomato leaf disease using a Plant Village dataset with reasonable accuracy [25,26,27]. The deep learning method was used [28] to diagnose cassava leaf disease. In the paper, the authors used a deep convolutional network to detect tulip leaf disease [29]. An approach was proposed [30] to detect millet crop disease. The author used a combined depth-wise convolution neural network with reduced MobileNet to enhance the detection rate. Enhanced classical models with exodus understanding were used to detect leaf disease with a 92% accuracy rate [31]. A two-stage CNN architecture was used to recognize paddy leaf disease, and the proposed approach achieved 93.3% accuracy [32]. Three distinct CNNs have been proposed to incorporate contextual non-image metadata using a dataset [33]. A method was proposed to identify leaf disease based on image classification [34]. In this study, the authors considered 14 plants with 79 different diseases with better accuracy. The PlantVillage dataset deals with detecting four significant stages of apple black rot disease [35,36]. The authors created a CNN to identify tomato crop diseases with three convoluted, max-pooling, interconnected layers. The experimental results indicated that the proposed model has been competitive over the pre-trained model, i.e., VGG16, MobileNet, and InceptionV3, and the proposed model has an average accuracy of 91.2%. An image processing algorithm was used to identify paddy leaf diseases [37].
The inputs were acquired based on the scale of leaves and lesions, the numbers and types of lesions, the color characteristics of the lesions, and the intact parts. The experimental evaluation can achieve competitive efficiency at a measured cost of computation [38]. The author used a deep convolution-based CNN to detect and classify the lesion. In this article, the precision of the CNN model is 96.43%. Detecting apple leaf diseases using a deep learning (DL) model is discussed in [39]. Authors in [40,41,42] presented a research outline of one such application for paddy growers taking images of the farm and processing them through the deep learning model to predict crop regions affected by the disease. The author created deep learning strategies based on the success of CNNs in classifying images [43]. In addition, a new two-stage training concept derived from the fine-tuning concept has been applied to train against paddy diseases with simple CNN architecture [44]. One of the techniques used in deep learning was the neural network (NN). There are several types of NN, one of which is the convolutional neural network. A CNN-based model was proposed in [45] to detect paddy diseases such as brown spots, leaf smuts, and bacterial leaf blight and achieved an accuracy of 86.67%. They implemented the algorithms by designing a model that trained the input images passed through distinct layers of the neural convolution network [45]. Even with damaged pictures and unclear data, the training and testing were performed and achieved an accuracy of more than 70% using a guava plant image dataset. The identification of paddy diseases with a CNN was proposed in [46,47]. However, the prediction of diseases with classification algorithms seems complicated because the various input parameters’ accuracy varies. These methods have been used in recent years to visualize apple [48], tea [49], and guava [50] lesions. In [51], predicting paddy blast disease developed a neuronal network with meteorological parameters such as temperature, relative moisture, precipitation, and wind speed. There were many applications where deep learning has been used with the best results, as discussed in [52,53,54,55,56,57,58,59,60]. A neuro-fuzzy-based technique was employed to detect paddy leaf disease and attain 74.21% accuracy [61]. A hybrid approach was employed to detect paddy leaf disease and attained an accuracy of 90% [62,63]. A feed-forward neural network was used to identify leaf disease with 88% accuracy [64]. Optimized DNN and a Jaya algorithm were employed to identify paddy leaf diseases and attained an average accuracy of 93.5% [65]. An expert system, ESforRPD2, was developed to detect paddy leaf disease and attained an 87.5% classification accuracy rate [66]. Hybrid features were extracted and processed with radial function to recognize leaf disease with an 83.34% accuracy rate [67].
A principal component analysis (PCA) and neural network-based approach were proposed in [68] to identify bacterial disease with 95.83% accuracy. A particle swarm optimization (PSO) centered incremental classifier was proposed in [69] to detect bacterial and fungi infection in paddy leaves and attained an accuracy of 84.02%. Hyperspectral data were used to identify fungus infection in paddy and attained an accuracy of 82% [70]. Finally, a pattern-dependent noise prediction (PdNP) system was used to detect bacterial and fungi infection and attained an accuracy of 85% [71]. These issues are encountered differently with state-of-the-art solutions using the latest technologies.
A transfer learning-based deep learning model was developed in [72] that used training data from a pre-trained network to predict leaf disease with 91.50% accuracy. Here a huge rice dataset was used to predict plant leaf disease. The system used a transfer learning-based deep neural network to detect olive leaf disease and attained an accuracy of 88% [73]. The rice leaf dataset was used to detect leaf disease using a transfer learning-based machine learning approach and achieved better accuracy [74]. The computer vision technique used an inception network to detect leaf disease [75,76]. Transfer learning based RestNet was used in [77] and attained 84.3% accuracy.
Deep learning technology widely recognizes leaf problems with a high accuracy rate. Various paddy illnesses have been examined in paddy fields, including paddy leaf blast, false smut, neck blast, sheath blight, bacterial stripe disease, and brown spots.
This paper proposed a transfer learning-based deep learning method to overcome all the issues. The objective of the research is to improve the accuracy, efficacy, and suitability of paddy disease diagnosis. The objective of this research is to:
(a)
Create a transfer learning-based model to diagnose three paddy leaf diseases.
(b)
Model performance analysis and evaluation based on various evaluation parameters.
(c)
Deploy and test the proposed method in a cloud environment.
Further, in the research, paddy leaf images were processed to detect plant leaf disease. The image processing techniques encountered problems such as changes in brightness and spectral reflectivity, image contrast, and image size.
The primary intention was to highlight the diseased parts of a leaf and use them to diagnose leaf diseases. The initial phase of the approach was to preprocess the images using functions including picture resizing, cropping, and filtering [78,79,80]. Next, the preprocessed image was further segmented into parts that discover the region of interest (RoI) [81]. Many challenges were associated with the segmentation method, as given below:
  • In segmentation, the brightness of images is a major concern.
  • The preliminary seed selection is crucial for segmentation.
  • The image texture is difficult to tackle.
  • To resolve the segmentation issues, semantic segmentation was used to extract a region of interest.
The main contribution was listed as follows:
  • The semantic/vegetation segmentation is used here to resolve the issues in normal segmentation.
  • The proposed approach considers only leaf lesion parts that enhance the detection accuracy.
  • The proposed approach has used state-of-the-art transfer learning models such as InceptionNet, SqueezeNet, VGG16, VGG19, and ResNet.
  • The rest of the paper is explained in different sections. The materials and methods are described in Section 2. Section 3 presents the results and discussion, followed by a conclusion in Section 4.

2. Materials and Methods

2.1. Dataset Description

This research was carried out on a dataset collected from two standard repositories, Mendeley [60] and Kaggle [82]. The dataset contained 1500 paddy pictures comprising 1000 pictures for training data and 500 for testing and validating data. The data were required to train, test, and validate object recognition tasks. The dataset consists of four classes: three paddy leaves that were infected and one type of paddy leaf that was healthy. Figure 1 and Table 1 indicate the four classes of paddy leaves.

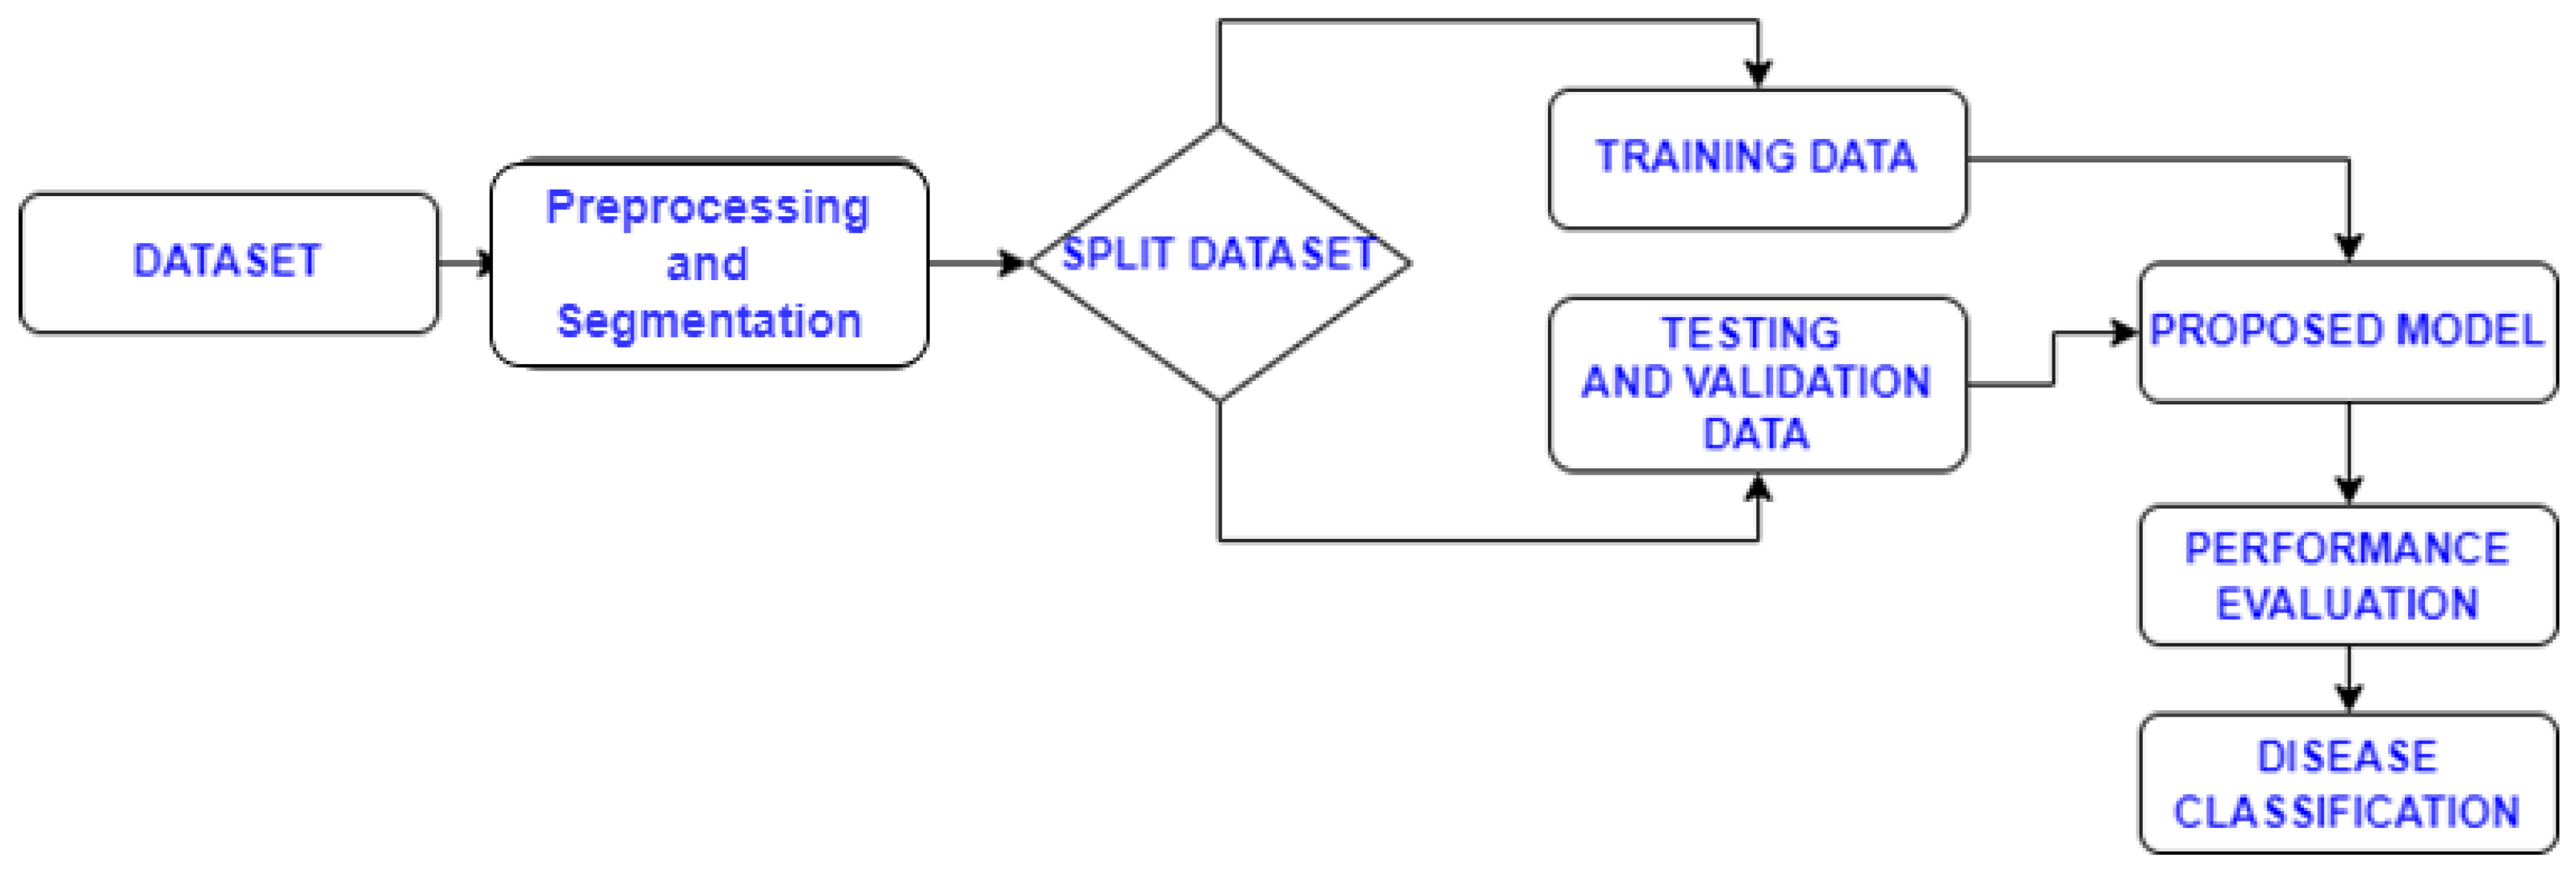
2.2. Proposed Methodology

The proposed methodology started with image preprocessing, argumentation, and semantic segmentation to divide an image into multiple tiles, and tiles were further used to extract disease segments. The segmented images are further used to train pre-trained models such as SqueezeNet, VGG16, etc. The pre-trained networks have multiple convolution layers followed by multiple ReLu layers. Finally, the same outcome is passed as input to the enhanced, fully connected layer of the deep neural network to address the diseases. The proposed architecture is shown in Figure 2.

2.2.1. Image Processing and Argumentation

Image preprocessing was used to enhance the dataset’s quality before training a deep-learning model. The first move is to standardize image size—resized pictures with the Python Imaging Library to 256 × 256 pixels with a python script (PIL). The next stage consists of grouping paddy images by category and then defining any disease’s acronym images.
After image processing, a set of augmentation operations was used to enhance dataset operations like rotation, segmentation, flipping, and Python libraries.
Semantic segmentation was used here to enhance detection accuracy. In the segmentation process, the complete image was divided into a number of tiles, as expressed in Algorithm 1. The tiled segments were used to extract the targeted part of the leaf image. The same was used to extract the features used to train and test the model. In addition, this technique was used to highlight the target area from the image to extract the diseased part of the image and improve the detection accuracy. Finally, the image data was transferred to the pre-trained neural network, as discussed in the following subsection.
Algorithm 1: Semantic Masking
Input: Dataset Images
Output: Masking Image.
    • Generate vegetation masking image ( M a s k v ) from input ( I P   )
    • Cover I p   With M a s k v to get M a s k m ;
    • Generate n T i l e i from M a s k m
    • for ( T i l e i   in M a s k m ) do
      i.
      Classify T i l e i   into   M a s k m Paddy diseases.
      ii.
      if T i l e i   has the disease then Identify the disease
    • end

2.2.2. Training Phase

In this phase, the internal weights of the model were rationalized over various iterations. Finally, the dataset features were used to train the model and to classify leaf disease.
Two methods are used to train a model: from scratch or transfer learning. First, a network pre-trained on a large set of images (for example, ImageNet, and its 1.2 million images in 1000 classes) was used and adapted to another task. Various transfer learning models are used to resolve such types of issues, as discussed in [83,84,85]. The transfer learning models are given below:
  • AlexNet has five convolutional layers, three fully connected layers followed by an output layer, and contains 62.3 million parameters.
  • Visual Geometry Group (VGG) network contains VGG16 and VGG19. In this network, multiple 3 × 3 filters are used to extract complex features at a low cost.
  • ResNet is a 34-layer plain network inspired by VGG-19. ResNet50 and ResNet152 are example networks of ResNet.
  • InceptionV4, with 43 million parameters and an upgraded Stem module with three residuals and one InceptionV4, achieves better performance.
  • SqueezeNet is a CNN with 18 layers deep. They are offering the SqueezeNet small CNN architecture with 50× fewer parameters.
  • Xception has 71 layers and 23 million parameters. It is based on InceptionV3. Xception was heavily inspired by InceptionV3. The convolutional blocks are replaced with depth-wise separable convolutions.
In deep learning, transfer learning is the reuse of a pre-trained network on a new job as shown in Figure 3. Transfer learning is very popular in deep learning because it can train the network with a small amount of data and high accuracy. In transfer learning, a machine exploits knowledge gained from a previous task to improve generalization about another. In transfer learning, the last few layers of the pre-trained network (VGGNet, SqueezeNet, InceptioNet, and XceptionNet) are replaced with new layers, such as a convolutional layer, a fully connected layer, and a SoftMax classification layer, with several classes: we used four classes in our paper, as given in Figure 3. All models were tested with different dropout values, learning rates, and batch sizes. The training and architectural strategies are presented in the following sub-sections.
An innovative solution has been developed using transfer learning models to provide appropriate solutions in the agriculture domain. The author has fine-tuned various transfer learning models with paddy leaf image datasets. Transfer learning benefits when no prior weights are available to train the model. The idea was to train a new model with features extracted from a large dataset and fine-tune it on specific data, as given in Figure 1.
In transfer learning techniques, the domains and tasks must be addressed, and in our case, the domain is image classification, and our task is to classify disease. As stated previously, starting from scratch would require many optimizations, more data, and longer training to improve performance. The transfer learning models were used to identify domains and tasks properly. After identifying both, it is easy to train an optimized deep neural network (DNN) to finally identify the task. This is what transfer learning accomplishes. The flow of the complete methodology is shown in Figure 4, and the optimized parameters of the architecture are given in Table 2. The TL-based deep neural network’s components are described below.
i.
Convolutional Layer
The convolutional layer is important in a deep neural network that is used to extract high-level and low-level features from the input image. This layer uses convolution operation to extract features from the input. The initial layers extract low-level features, and the layers at the end extract high-level features from the input. In this paper, the dataset contains 256 × 256 images, and a 3 × 3 filter is used for convolution operation to extract image features. In this arrangement, fifteen convolution filters with a 3 × 3 kernel size are used with the activation function (ReLu). This function provides the capability to learn more complex and complicated features from the input. This rectifies the vanishing gradient problem.
The convolution operation is defined as a binary operation (represented by the symbol ‘*’) between two real-valued functions (for example, Z and Y). In the continuous domain, it can be mathematically defined as in Equation (1).
Each characteristic of the map is intertwined with numerous input attributes. For example, the following equations apply to input x of the ith convolution layer:
h i c = F Z i Y
where F is a function of activation, Y   is convolution, and Z   is a layer kernel of convolution. The number of kernel convolutions on a single layer is =   Z i 1 , Z i 2 , , Z i k .
The weight matrix is given as: A A B is the kernel Z i k .
Where: A is the window, and B is the number of channels.
ii.
Pooling Layer
A huge number of convolution layers will increase the network parameter exponentially, which can be reduced using max pooling layers because the convolution layer generates a huge feature map that can be reduced with pooling layers. The pooling layer extracts potential features from the feature map. In this layer, the maximum value is taken from the available feature map. The pooling layer is also used to minimize dimensions and can aid translation invariantly. To begin with, region R has max pooling that can be defined as average pooling.
M p = m a x i R j x i
A p :   x i i ϵ R j x i
A 2-stage pooling is required in 2-stage kernel size. The map shows the maximum values for the four quadrants and the average pooling value.
After the convolution and pooling layer, the pre-trained models generate a fixed feature vector from segmented images. Color, texture, nd shape are primary features that are usually extracted by systems. A feature vector will generate after image processing through pre-trained models. This approach is used to identify plant diseases. The feature vector was used by a fully connected layer to optimize features to detect leaf disease.
iii.
Fully Connected Layer
After the max pooling layer, the detection and classification are performed in the FC layer. For evading the overfitting problems, masking probability with dropout is subjected to the penultimate layer. The final classification is portrayed as,
t ^ = μ ( x I   ( h s I ) + w I  
Thus, the classified outcome is designated as DNN Qc, which indicates either bacterial blight, leaf blast, or brown spot.
The prime objective of the deep learning model is to uncover hidden data. In this case, the model is not guaranteed to give a high accuracy rate. Indeed, overfitting is a primary concern in the neural network. However, an appropriate dataset per network capacity can resolve the overfitting problem by applying regularization techniques to overcome overfitting. This paper uses two regularization methods to overcome overfitting: augmentation and dropout, as given in Table 2.

2.3. Model Evaluation

Model evaluation is an important phase used to determine the performance of the model. Evaluation matrices are used to determine the performance of the model in this phase. Based on specified parameters, the analysis is made that the predicted class is equivalent to the targeted class. The model performance can be improved based on the result analysis. The performance matrices are given below:
a.
A c c u r a c y = T P + T N / T P + F P + T N + F N
b.
P r e c i s i o n = T P / T P + F P
c.
R e c a l l = T P / T P + F N
d.
F 1 - s c o r e = 2 T P / 2 T P + F P + F N

3. Results and Discussion

This study was supported by a relative assessment of the anticipated models with other models. A comparative evaluation of different transfer learning-based methods has been carried out in this paper to support our proposal. The research paper performed several binary classification techniques with pre-trained models, such as VGG16, VGG19, InceptionNet, and SqueezNet. The methodology presented here outperforms other state-of-the-art methods.
These models adopted transfer learning for stability. The models were first trained with a paddy image dataset and used the checkpoints to store the weights of the anticipated model. Next, the experiment was performed with several values of the factors, such as learning rate, batch size, and epochs. The variation in the investigation was carried out by adjusting all these parameters.
The entire experiment setup has been accomplished in Python with Co-Lab. The karas neural network libraries were used to construct, compile, and evaluate the model. The experiment was performed on Google Co-lab to avail Graphical Processing Unit (GPU) recourses. The experiment was performed in cross-validation with a set of images due to memory restrictions on Co-Lab. The experiment was performed with several training-testing ratio setups, such as 80:20, 70:30, and 60:40, with cross-fold validations of 5, 10, 15, and 20, and the average classification validation accuracy was recorded for each experiment.

3.1. Analysis Using Sampling

Tests were carried out to measure how the number of epochs can affect system performance. The tests were performed with different epoch values, such as 50, 100, 200, 250, and 1000, and the rates of leanings are 0.01, 0.001, and 0.0001. The experiment results are presented in Table 3.
After the experiment, it was observed that the increase in the epoch and learning rate would impact the classification accuracy. The proposed model showed better results with a high epoch value. A higher epoch value represents that the model was trained with multiple training samples and adequately prepared. However, in some cases, the epoch value may be ineffective after some point. Hence, the results were presented with 200 epochs with different learning rates. The results are shown in Figure 5, Figure 6, Figure 7 and Figure 8.
Figure 5 concludes that the model achieved 96.47% validation accuracy with 200 epochs and a rate of learning of 0.1. Figure 5a depicts a comparison of training and validation accuracy that increases with the epoch value. It showed that the validation accuracy is maximum as model training completes. Figure 5b depicts the error rate that decreases with epoch values. This figure shows that the error rate declines as the model accuracy grows or epochs increase. The lower value of the error rate maximizes the model prediction accuracy. Therefore, it can infer that a more significant number of epochs can be more reliable based on the testing process. It completed the model training, and the error rates started to decline. However, it takes longer to complete the training if the epoch frequency increases.
Figure 6 concludes that the model achieved 96.47% validation accuracy with 200 epochs and a rate of learning of 0.01. Figure 6a depicts a comparison of training and validation accuracy that increases with the epoch value. It showed that the validation accuracy is maximum as model training completes. Figure 6b depicts that the error rate decreases with epoch values. This led to a decline in the error rate as the accuracy of the model grew or epochs increased. The lower value of the error rate maximizes the model prediction accuracy. Therefore, it can infer that a more significant number of epochs can be more reliable based on the testing process. It completed the model training, and the error rates started to decline. However, it takes longer to complete the training if the epoch frequency increases.
Tests are performed to assess the impact of learning on machine efficiency. The learning rate is one of the training parameters used to estimate the value of weight correction during the training stage. Figure 7 concludes that the model achieved 96.47% validation accuracy with 200 epochs and a learning rate of 0.001. Figure 7a depicts a comparison of training and validation accuracy that increases with the epoch value. It showed that the validation accuracy is maximum as model training completes. Figure 7b depicts that the error rate decreases with epoch values. This led to a decline in the error rate as the accuracy of the model grew or epochs increased. The lower value of the error rate maximizes the model prediction accuracy. Therefore, it can infer that a more significant number of epochs can be more reliable based on the testing process. It completed the model training, and the error rates started to decline. However, it takes longer to complete the training if the epoch frequency increases.
Figure 8 concludes that the model achieved 96.47% validation accuracy with 200 epochs and a learning rate of 0.001. Figure 8a depicts a comparison of training and validation accuracy that increases with the epoch value. It showed that the validation accuracy is maximum as model training completes. Figure 8b depicts that the error rate decreases with epoch values. This led to a decline in the error rate as the accuracy of the model grew or epochs increased. The lower value of the error rate maximizes the model prediction accuracy. Therefore, it can infer that a more significant number of epochs can be more reliable based on the testing process. It completed the model training, and the error rates started to decline. However, it takes longer to complete the training if the epoch frequency increases.
Subsequently, the results demonstrate that the accuracy rate is entirely dependent on two factors: the rate of learning and epoch. Therefore, the more reliable the value of the epoch will lead to a better outcome.
The proposed model is compared with state-of-the-art models for paddy crops, as discussed in [83,84,85,86,87,88,89,90]. The proposed model’s results compared with other detection models, as presented in Table 4, depicts that the proposed model’s solution outperforms other state-of-the-art models. In addition, the proposed model’s accuracy was much better than the models presented in Table 4.

3.2. Analysis with K-Folds Validation

The results demonstrate that the rate of learning and epoch acted as metrics for the accuracy rate. Therefore, the more reliable the epoch value will lead to better results.
New prediction accuracy can be demonstrated using cross-validation, an evaluation parameter for models used to test the model’s efficacy in this study. Data is split into k sets and tried k times in K-fold cross-validation. Every iteration used the k subset as a training sample and the k-1 subset as a testing sample. The performance evaluation of the proposed model with other models using k-fold cross-validation is presented in Table 5 and Figure 9. Table 5 depicts the outcomes of various pre-trained models with three datasets [88,89,90] on multiple folds. The proposed model showed better results as compared to other models.
Diseases were predicted and classified using a dataset of paddy leaf pictures. At the beginning of the process, transfer learning-based deep learning models are constructed and used as classifiers, and then deep learning models are used to make predictions and evaluate their performance.
Due to the time and complexity involved in obtaining samples, predicting disease from laboratory findings was difficult. However, InceptionV3 produced the most outstanding results in leaf prediction accuracy, f1-score, and recall at 96.47%. The results are not shocking, given that InceptionV3 is well-suited to a powerful image-processing function. The dataset is split into 80/20 training/tests to validate the algorithms’ performance. Even in research using small to medium samples, the k-fold cross-validation approach is often employed in artificial intelligence for disease classifications and identification investigations. The best-performing algorithm, neural network, has an AUC of 96.47%, an accuracy of 96.4230%, an f1-score of 96.413%, a precision of 96.434%, and a recall of 96.413% while using the 20-fold cross-validation approach for leaves prediction performance. The results of the proposed model with InceptionV3 and cross-validation were compared and presented in Figure 10. The comparative study showed that the proposed model outperforms other state-of-the-art models with cross-validation.

3.3. Confusion Matrix with InceptionV3

Similarly, the confusion matrix percentage distributions from Table 6, accuracy, error rate, and precision, can be assessed using a confusion matrix. As percentages, the findings are as follows:

4. Conclusions and Future Work

In this research, the experiment was performed with 1500 leaf images taken from two well-known datasets: Kaggel and Mandley. The dataset contains images of four different classes. To further improve the raw dataset, in the proposed approach, we used various operations, such as preprocessing and argumentation. After dataset enhancement, the segmentation method highlighted the diseased part of the image. Based on the segmented dataset, several pre-trained models are trained, and further, the extracted features are used to train and test with a deep neural network to identify leaf disease. We evaluated the proposed approach on the following parameters: accuracy, F1-score, precision, and recall. The model was 96.43% accurate and 96.43% precise. As a result, the F1 scores reached more than 96.43 for each disease type. We compared the proposed model with other deep learning and machine learning models on the same dataset. After analyzing the outcomes, it has been concluded that the proposed model outperforms other models. As stated earlier, this research was limited to only four biotic diseases, and the study identified only a single biotic disease impact.
In the future, the model will be extended to identify multi-biotic or combinatorial disease impact on a plant leaf. The research will consider the effect of two or more diseases at some point. In addition, some abiotic factors, such as nutrient values, will be explored as the reason for diseases in the plant leaf.

Author Contributions

Conceptualization, V.G., N.K.T. and A.S.; methodology, H.G.M., I.D.N. and P.K.; validation, N.G.; formal analysis, V.G. and N.K.T.; investigation, A.S. and H.G.M.; writing—original draft preparation, V.G., N.K.T. and N.G.; writing—review and editing, A.S., I.D.N. and P.K.; supervision, N.K.T. and N.G.; project administration, I.D.N. and H.G.M. All authors have read and agreed to the published version of the manuscript.

Funding

Princess Nourah bint Abdulrahman University Researchers Supporting Project number (PNURSP2022TR140), Princess Nourah bint Abdulrahman University, Riyadh, Saudi Arabia.

Institutional Review Board Statement

Not applicable.

Informed Consent Statement

Not applicable.

Data Availability Statement

Not applicable.

Acknowledgments

Princess Nourah bint Abdulrahman University Researchers Supporting Project number (PNURSP2022TR140), Princess Nourah bint Abdulrahman University, Riyadh, Saudi Arabia.

Conflicts of Interest

The authors declare no conflict of interest.

References

  1. Van Eeuwijk, F.A.; Bustos-Korts, D.; Millet, E.J.; Boer, M.P.; Kruijer, W.; Thompson, A.; Malosetti, M.; Iwata, H.; Quiroz, R.; Kuppe, C.; et al. Modelling strategies for assessing and increasing the effectiveness of new phenotyping techniques in plant breeding. Plant Sci. 2019, 282, 23–39. [Google Scholar] [CrossRef] [PubMed]
  2. Martinelli, F.; Scalenghe, R.; Davino, S.; Panno, S.; Scuderi, G.; Ruisi, P.; Dandekar, A.M. Advanced methods of plant disease detection. A review. Agron. Sustain. Dev. 2015, 35, 1–25. [Google Scholar] [CrossRef] [Green Version]
  3. Kaur, P.; Gautam, V. Plant Biotic Disease Identification and Classification based on Leaf Image: A Review. In Proceedings of the 3rd International Conference on Computing Informatics and Networks, LNCS, Delhi, India, 29–30 July 2020; Springer: Berlin/Heidelberg, Germany, 2021. [Google Scholar]
  4. Sethy, P.K.; Barpanda, N.K.; Rath, A.K.; Behera, S.K. Image processing techniques for diagnosing rice plant disease: A survey. Procedia Comput. Sci. 2020, 167, 516–530. [Google Scholar] [CrossRef]
  5. Gong, A.; Yu, J.; He, Y.; Qiu, Z. Citrus yield estimation based on images processed by an Android mobile phone. Biosyst. Eng. 2013, 115, 162–170. [Google Scholar] [CrossRef]
  6. Deng, R.; Jiang, Y.; Tao, M.; Huang, X.; Bangura, K.; Liu, C.; Qi, L. Deep learning-based automatic detection of productive tillers in rice. Comput. Electron. Agric. 2020, 177, 105703. [Google Scholar] [CrossRef]
  7. Xu, G.; Zhang, F.; Shah, S.G.; Ye, Y.; Mao, H. Use of leaf color images to identify nitrogen and potassium deficient tomatoes. Pattern Recognit. Lett. 2011, 32, 1584–1590. [Google Scholar] [CrossRef]
  8. Baresel, J.P.; Rischbeck, P.; Hu, Y.; Kipp, S.; Barmeier, G.; Mistele, B.; Schmidhalter, U. Use of a digital camera as alternative method for non-destructive detection of the leaf chlorophyll content and the nitrogen nutrition status in wheat. Comput. Electron. Agric. 2017, 140, 25–33. [Google Scholar] [CrossRef]
  9. Tao, M.; Ma, X.; Huang, X.; Liu, C.; Deng, R.; Liang, K.; Qi, L. Smartphone-based detection of leaf color levels in rice plants. Comput. Electron. Agric. 2020, 173, 105431. [Google Scholar] [CrossRef]
  10. Liu, H.; Ma, X.; Tao, M.; Deng, R.; Bangura, K.; Deng, X.; Qi, L. A plant leaf geometric parameter measurement system based on the android platform. Sensors 2019, 19, 1872. [Google Scholar] [CrossRef] [Green Version]
  11. Jiang, H.; Zhang, C.; Qiao, Y.; Zhang, Z.; Zhang, W.; Song, C. CNN feature-based graph convolutional network for weed and crop recognition in smart farming. Comput. Electron. Agric. 2017, 174, 105450. [Google Scholar] [CrossRef]
  12. Liu, B.; Bruch, R. Weed detection for selective spraying: A review. Curr. Robot. Rep. 2020, 1, 19–26. [Google Scholar] [CrossRef] [Green Version]
  13. Asad, M.H.; Bais, A. Weed detection in canola fields using maximum likelihood classification and deep convolutional neural network. Inf. Process. Agric. 2020, 7, 535–545. [Google Scholar] [CrossRef]
  14. Mishra, A.M.; Harnal, S.; Mohiuddin, K.; Gautam, V.; Nasr, O.A.; Goyal, N.; Singh, A. A Deep Learning-Based Novel Approach for Weed Growth Estimation. Intell. Autom. Soft Comput. 2022, 31, 1157–1172. [Google Scholar] [CrossRef]
  15. Ngugi, L.C.; Abelwahab, M.; Abo-Zahhad, M. Recent advances in image processing techniques for automated leaf pest and disease recognition—A review. Inf. Process. Agric. 2021, 8, 27–51. [Google Scholar] [CrossRef]
  16. Zhang, M.; Qin, Z.; Liu, X. Remote sensor spectral imagery to detect late blight in field tomatoes. Precis. Agric. 2005, 6, 489–508. [Google Scholar] [CrossRef]
  17. Strange, R.N.; Scott, P.R. Plant disease: A threat to global food security. Annu. Rev. Phytopathol. 2015, 43, 83–116. [Google Scholar] [CrossRef]
  18. Islam, T.; Sah, M.; Baral, S.; Choudhury, R. RA faster technique on rice disease detection using image processing of affected area in agro-field. In Proceedings of the 2018 Second International Conference on Inventive Communication and Computational Technologies (ICICCT), Coimbatore, India, 20–21 April 2018; pp. 62–66. [Google Scholar]
  19. Zhu, W.; Chen, H.; Ciechanowska, I.; Spaner, D. Application of infrared thermal imaging for the rapid diagnosis of crop disease. IFAC 2018, 51, 424–430. [Google Scholar] [CrossRef]
  20. Li, B.; Liu, Z.; Huang, J.; Zhang, L.; Zhou, W.; Shi, J. Hyperspectral identification of rice diseases and pests based on principal component analysis and probabilistic neural network. Trans. Chin. Soc. Agric. Eng. 2009, 25, 43–147. [Google Scholar]
  21. Gautam, V. Qualitative model to enhance quality of metadata for data warehouse. Int. J. Inf. Technol. 2020, 12, 1025–1036. [Google Scholar] [CrossRef]
  22. Gunawan, P.A.; Kencana, E.N.; Sari, K. Classification of paddy leaf diseases using artificial neural network. J. Phys. Conf. Ser. IOP Publ. 2013, 2013, 1722. [Google Scholar]
  23. Ozguven, M.M.; Adem, K. Automatic detection and classification of leaf spot disease in sugar beet using deep learning algorithms. Phys. A Stat. Mech. Appl. 2019, 535, 122537. [Google Scholar] [CrossRef]
  24. Karlekar, A.; Seal, A. SoyNet: Soybean leaf diseases classification. Comput. Electron. Agric. 2020, 172, 105342. [Google Scholar] [CrossRef]
  25. Agarwal, M.; Sing, A.; Arjaria, S.; Sinha, A.; Gupta, S. ToLeD: Tomato leaf disease detection using convolution neural network. Proc. Comput. Sci. 2020, 167, 293–301. [Google Scholar] [CrossRef]
  26. Rangarajan, A.K.; Purushothaman, R.; Ramesh, A. Tomato crop disease classification using pre-trained deep learning algorithm. Procedia Comput. Sci. 2018, 133, 1040–1047. [Google Scholar] [CrossRef]
  27. Trivedi, N.K.; Gautam, V.; Anand, A.; Aljahdali, H.M.; Villar, S.G.; Anand, D.; Kadry, S. Early Detection and Classification of Tomato Leaf Disease Using High-Performance Deep Neural Network. Sensors 2021, 21, 7987. [Google Scholar] [CrossRef]
  28. Sambasivam, G.; Opiyo, G.D. A predictive machine learning application in agriculture: Cassava disease detection and classification with imbalanced dataset using convolutional neural networks. Egypt. Inform. J. 2021, 22, 27–34. [Google Scholar] [CrossRef]
  29. Polder, G.; van de Westeringh, N.; Kool, J.; Khan, H.A.; Kootstra, G.; Nieuwenhuizen, A. Automatic detection of tulip breaking virus (TBV) using a deep convolutional neural network. IFAC 2019, 52, 12–17. [Google Scholar] [CrossRef]
  30. Coulibaly, S.; Kamsu-Foguem, B.; Kamissoko, D.; Traore, D. Deep neural networks with transfer learning in millet crop images. Comput. Ind. 2019, 108, 115–120. [Google Scholar] [CrossRef] [Green Version]
  31. Kamal, K.C.; Yin, Z.; Wu, M.; Wu, Z. Depth wise separable convolution architectures for plant disease classification. Comput. Electron. Agric. 2019, 165, 104948. [Google Scholar]
  32. Hossain, S.M.; Tanjil, M.; Morhsed, M.; Ali, M.A.B.; Islam, M.Z.; Islam, M.; Mobassirin, S.; Sarker, I.H.; Islam, S.M. Rice leaf diseases recognition using convolutional neural networks. In Proceedings of the International Conference on Advanced Data Mining and Applications, Foshan, China, 12–15 November 2020; pp. 299–314. [Google Scholar]
  33. Picon, A.; Seitz, M.; Alvarez-Gila, A.; Mohnke, P.; Ortiz-Barredo, A.; Echazarra, J. Crop conditional Convolutional Neural Networks for massive multi-crop plant disease classification over cell phone acquired images taken on real field conditions. Comput. Electron. Agric. 2019, 167, 105093. [Google Scholar] [CrossRef]
  34. Barbedo, J.G.A. Plant disease identification from individual lesions and spots using deep learning. Biosyst. Eng. 2019, 180, 96–107. [Google Scholar] [CrossRef]
  35. Natalia, K.; Rosemarie, W. Molecular biology of viroid–host interactions and disease control strategies. Plant Sci. 2014, 228, 48–60. [Google Scholar]
  36. Wang, G.; Sun, Y.; Wang, J. Automatic image-based plant disease severity estimation using deep learning. Comput. Intell. Neurosci. 2017, 2017, 2917536. [Google Scholar] [CrossRef] [PubMed] [Green Version]
  37. Sladojevic, S.; Arsenovic, M.; Anderla, A.; Culibrk, D.; Stefanovic, D. Deep neural networks-based recognition of plant diseases by leaf image classification. Comput. Intell. Neurosci. 2016, 2016, 3289801. [Google Scholar] [CrossRef]
  38. Fuentes, A.; Yoon, S.; Kim, S.C.; Park, D.S. A robust deep-learning-based detector for real-time tomato plant diseases and pests recognition. Sensors 2022, 17, 2022. [Google Scholar] [CrossRef] [Green Version]
  39. Bhagawati, R.; Bhagawati, K.; Singh, A.; Nongthombam, R.; Sarmah, R.; Bhagawati, G. Artificial neural network assisted weather-based plant disease forecasting system. Int. J. Recent Innov. Trends Comput. Commun. 2015, 3, 4168–4173. [Google Scholar]
  40. Atole, R.R.; Park, D. A multiclass deep convolutional neural network classifier for detection of common paddy plant anomalies. Int. J. Adv. Comput. Sci. Appl. 2018, 9, 67–70. [Google Scholar]
  41. Chawathe, S.S. Paddy Disease Detection by Image Analysis. In Proceedings of the 2020 10th Annual Computing and Communication Workshop and Conference (CCWC), Las Vegas, NV, USA, 6–8 January 2020; pp. 0524–0530. [Google Scholar]
  42. Narmadha, R.P.; Arulvadivu, G. Detection and measurement of paddy leaf disease symptoms using image processing. In Proceedings of the 2017 International Conference on Computer Communication and Informatics (ICCCI), Coimbatore, India, 5–7 January 2017; pp. 1–4. [Google Scholar]
  43. Velesaca, H.O.; Mira, R.; Suárez, P.L.; Larrea, C.X.; Sappa, A.D. Deep learning based corn kernel classification. In Proceedings of the Conference on Computer Vision and Pattern Recognition Workshops, Seattle, WA, USA, 14–19 June 2020; pp. 66–67. [Google Scholar]
  44. Hammad Masood, M.; Saim, H.; Taj, M.; Awais, M.M. Early Disease Diagnosis for Paddy Crop. In Proceedings of the ICLR 2020 Workshop on Computer Vision for Agriculture (CV4A), Addis Ababa, Ethiopia, 26 April 2020. [Google Scholar]
  45. Chen, J.; Zhang, D.; Nanehkaran, Y.A.; Li, D. Detection of rice plant diseases based on deep transfer learning. J. Sci. Food Agric. 2020, 100, 3246–3256. [Google Scholar] [CrossRef]
  46. Barbedo, J.G.A. Impact of dataset size and variety on the effectiveness of deep learning and transfer learning for plant disease classification. Comput. Electron. Agric. 2018, 153, 46–53. [Google Scholar] [CrossRef]
  47. Rasjava, A.R.I.; Sugiyarto, A.W.; Kurniasari, Y.; Ramad han, S.Y. Detection of Paddy Plants Diseases Using Convolutional Neural Network (CNN). Int. Conf. Sci. Eng. 2020, 3, 393–396. [Google Scholar]
  48. Baranwal, S.; Khandelwal, S.; Arora, A. Deep learning convolutional neural network for apple leaves disease detection. In Proceedings of the International Conference on Sustainable Computing in Science, Technology and Management (SUSCOM), Jaipur, India, 26–28 February 2019. [Google Scholar]
  49. Karmokar, B.C.; Ullah, M.S.; Siddiquee, M.K.; Alam, K.M.R. Tea leaf diseases recognition using neural networkensemble. Int. J. Comput. Appl. 2015, 114, 975–8887. [Google Scholar]
  50. Srinivas, B.; Satheesh, P.; Naidu, P.R.S.; Neelima, U. Prediction of Guava Plant Diseases Using Deep Learning. Int. Conf. Commun. Cyber Phys. Eng. (ICCCE) 2020, 698, 1495–1505. [Google Scholar]
  51. Goluguri, N.R.R.; Devi, K.S.; Srinivasan, P. Paddy-net: An efficient artificial fish swarm optimization applied deep convolutional neural network model for identifying the Oryza sativa diseases. Neural Comput. Appl. 2020, 33, 5869–5884. [Google Scholar] [CrossRef]
  52. Trivedi, N.K.; Sarita, S.; Lilhore, U.K.; Sharma, S.K. COVID-19 Pandemic: Role of Machine Learning & Deep Learning Methods in Diagnosis. Int. J. Cur. Res. Rev. 2021, 13, 150–156. [Google Scholar]
  53. Mahrishi, M.; Morwal, S.; Muzaffar, A.W.; Bhatia, S.; Dadheech, P.; Rahmani, M.K.I. Video index point detection and extraction framework using custom YoloV4 Darknet object detection model. IEEE Access 2021, 9, 143378–143391. [Google Scholar] [CrossRef]
  54. Bhalla, K.; Koundal, D.; Bhatia, S.; Khalid, M.; Rahmani, I.; Tahir, M. Fusion of infrared and visible images using fuzzy based siamese convolutional network. Computer. Mater. Conf. 2022, 70, 5503–5518. [Google Scholar]
  55. Noon, S.K.; Amjad, M.; Qureshi, M.A.; Mannan, A. Use of deep learning techniques for identification of plant leaf stresses: A review. Sustain. Comput. Inform. Syst. 2020, 28, 100443. [Google Scholar] [CrossRef]
  56. Gandhi, P.; Bhatia, S.; Dev, K. Data Driven Decision Making Using Analytics; CRC Press: Boca Raton, FL, USA, 2021. [Google Scholar]
  57. Gautam, V. Analysis and application of vehicular ad hoc network as intelligent transportation system. In Mobile Radio Communications and 5G Networks; Springer: Singapore, 2021; pp. 1–17. [Google Scholar]
  58. Kansal, N.; Bhushan, B.; Sharma, S. Architecture, Security Vulnerabilities, and the Proposed Countermeasures in Agriculture-Internet-of-Things (AIoT) Systems. Internet Things Anal. Agric. 2021, 3, 329–353. [Google Scholar]
  59. Sethi, R.; Bhushan, B.; Sharma, N.; Kumar, R.; Kaushik, I. Applicability of Industrial IoT in Diversified Sectors: Evolution, Applications and Challenges. Stud. Big Data Multimed. Technol. Internet Things Environ. 2020, 79, 45–67. [Google Scholar]
  60. Sethy, P.K.; Barpanda, N.K.; Rath, A.K.; Behera, S.K. Deep feature-based rice leaf disease identification using support vector machine. Comput. Electron. Agric. 2020, 175, 105527. [Google Scholar] [CrossRef]
  61. Kahar, M.A.; Sofianita, M.; Shuzlina, A.R. Early detection and classification of paddy diseases with neural networks and fuzzy logic. In Proceedings of the International Conference Mathematical Computational Methods in Science and Engineering, Kuala Lumpur, Malaysia, 23–25 April 2015; pp. 248–257. [Google Scholar]
  62. Khaing, W.H.; Chit, S.H. Development of Paddy Diseased Leaf Classification System Using Modified Color Conversion. Int. J. Softw. Hardw. Res. Eng. 2018, 6, 24–32. [Google Scholar]
  63. Ganesan, G.; Chinnappan, J. Hybridization of ResNet with YOLO classifier for automated paddy leaf disease recognition: An optimized model. J. Field Robot. 2022, 39, 1087–1111. [Google Scholar] [CrossRef]
  64. Akila, M.; Deepan, P. Detection and Classification of Plant Leaf Diseases by using Deep Learning Algorithm. Int. J. Eng. Res. Technol. 2018, 6, 1–5. [Google Scholar]
  65. Ramesh, S.; Vydeki, D. Recognition and classification of paddy leaf diseases using Optimized Deep Neural network with Jaya algorithm. Inf. Process. Agric. 2020, 7, 249–260. [Google Scholar] [CrossRef]
  66. Fahrul, A.; Muh, I.; Dyna, M.K.; Krishna, P.C. Expert System for Rice Plant Disease Diagnosis. F1000Research 2019, 7, 1902. [Google Scholar]
  67. Toran, V.; Sipi, D. Optimizing Rice Plant Diseases Recognition in Image Processing and Decision Tree Based Model. In Proceedings of the International Conference on Next Generation Computing Technologies, Dehradun, India, 30–31 October 2017; pp. 733–751. [Google Scholar]
  68. Xiao, M.; Ma, Y.; Feng, Z.; Deng, Z.; Hou, S.; Shu, L.; Lu, Z. Rice blast recognition based on principal component analysis and neural network. Comput. Electron. Agric. 2018, 154, 482–490. [Google Scholar] [CrossRef]
  69. Shampa, S.; Asit, K.D. Particle Swarm Optimization based incremental classifier design for rice disease prediction. Comput. Electron. Agric. 2017, 140, 443451. [Google Scholar]
  70. Huang, J.; Liao, H.; Zhu, Y.; Sun, J.; Sun, Q.; Liu, X. Hyperspectral detection of rice damaged by rice leaf folder (Cnaphalocrocis medinalis). Comput. Electron. Agric. 2012, 82, 100–107. [Google Scholar] [CrossRef]
  71. Wei, J.Y.; Jing, H.C.; Guo, N.C.; Shi, H.W.; Feng, F.F. The early diagnosis and fast detection of blast fungus, Magnaporthe grisea, in rice plant by using its chitinase as biochemical marker and a rice cDNA encoding mannose-binding lectin as recognition probe. Biosens. Bioelectron. 2013, 15, 820–826. [Google Scholar]
  72. Chen, J.; Chen, J.; Zhang, D.; Sun, Y.; Nanehkaran, Y.A. Using deep transfer learning for image-based plant disease identification. Comput. Electron. Agric. 2020, 173, 105393. [Google Scholar] [CrossRef]
  73. Uguz, S.; Uysal, N. Classification of olive leaf diseases using deep convolutional neural networks. Neural Comput. Appl. 2021, 33, 4133–4149. [Google Scholar] [CrossRef]
  74. Sharma, M.; Kumar, C.J.; Deka, A. Early diagnosis of rice plant disease using machine learning techniques. Arch. Phytopathol. Plant Prot. 2022, 55, 1–25. [Google Scholar] [CrossRef]
  75. Szegedy, C.; Vanhoucke, V.; Ioffe, S.; Shlens, J.; Wojna, Z. Rethinking the inception architecture for computer vision. In Proceedings of the IEEE Conference on Computer Vision and Pattern Recognition (CVPR), Las Vegas, NV, USA, 26–30 June 2016. [Google Scholar]
  76. Szegedy, C.; Liu, W.; Jia, Y.; Sermanet, P.; Reed, S.; Anguelov, D.; Erjam, D.; Vanhoucke, V.; Rabinovich, A. Going deeper with convolutions. In Proceedings of the 2015 IEEE Conference on Computer Vision and Pattern Recognition (CVPR), Boston, MA, USA, 7–12 June 2015. [Google Scholar]
  77. Peng, J.; Kang, S.; Ning, Z.; Deng, H.; Shen, J.; Xu, Y.; Zhang, J.; Zhao, W.; Li, X.; Gong, W. Residual convolutional neural network for predicting response of trans arterial chemoembolization in hepatocellular carcinoma from CT imaging. Eur. Radiol. 2020, 30, 413–424. [Google Scholar] [CrossRef] [PubMed] [Green Version]
  78. Ma, J.; Du, K.; Zheng, F.; Zhang, L.; Sun, Z. A segmentation method for processing greenhouse vegetable foliar disease symptom images. Inf. Process. Agric. 2019, 6, 216–223. [Google Scholar] [CrossRef]
  79. Suryanarayana, G.; Chandran, K.; Khalaf, O.I.; Alotaibi, Y.; Alsufyani, A.; Alghamdi, S.A. Accurate Magnetic Resonance Image Super-Resolution Using Deep Networks and Gaussian Filtering in the Stationary Wavelet Domain. IEEE Access 2021, 9, 71406–71417. [Google Scholar] [CrossRef]
  80. Li, G.; Liu, F.; Sharma, A.; Khalaf, O.I.; Alotaibi, Y.; Alsufyani, A.; Alghamdi, S. Research on the natural language recognition method based on cluster analysis using neural network. Math. Probl. Eng. 2021, 2021, 9982305. [Google Scholar] [CrossRef]
  81. Singh, V.; Misra, A.K. Detection of plant leaf diseases using image segmentation and soft computing techniques. Inf. Process. Agric. 2017, 4, 41–49. [Google Scholar] [CrossRef] [Green Version]
  82. Rice Leaf Dataset. 2022. Available online: https://www.kaggle.com/minhhuy2810/rice-diseases-image-dataset (accessed on 2 February 2022).
  83. Krizhevsky, A.; Sutskever, I.; Hinton, G.E. Imagenet classification with deep convolutional neural networks. Adv. Neural Inf. Process. Syst. 2017, 60, 84–90. [Google Scholar] [CrossRef] [Green Version]
  84. Simonyan, K.; Andrew, Z. Very deep convolutional networks for large-scale image recognition. arXiv 2014, arXiv:1409.1556. [Google Scholar]
  85. He, K.; Zhang, X.; Ren, S.; Sun, J. Deep residual learning for image recognition. In Proceedings of the IEEE conference on computer vision and pattern recognition, Las Vegas, NV, USA, 27–30 June 2016; pp. 770–778. [Google Scholar]
  86. Chung, C.L.; Huang, K.J.; Chen, S.Y.; Lai, M.H.; Chen, Y.C.; Kuo, Y.F. Detecting bakanae disease in rice seedlings by machine vision. Comput. Electron. Agric. 2016, 121, 404–411. [Google Scholar] [CrossRef]
  87. Lu, Y.; Yi, S.; Zeng, N.; Liu, Y.; Zhang, Y. Identification of rice diseases using deep convolutional neural networks. Neurocomputing 2017, 267, 378–384. [Google Scholar] [CrossRef]
  88. Rafeed, R.C.; Saha, A.P.; Eunus, A.M.; Khan, M.A.I.; Hasan, A.S.; Nowrin, F.; Wasif, A. Identification and recognition of rice diseases and pests using convolutional neural networks. Biosyst. Eng. 2020, 194, 112–120. [Google Scholar]
  89. Liang, W.J.; Zhang, H.; Zhang, G.F.; Cao, H. Rice blast disease recognition using a deep convolutional neural network. Sci. Rep. 2019, 9, 1–10. [Google Scholar]
  90. Chen, W.L.; Lin, Y.B.; Ng, F.L.; Liu, C.Y.; Lin, Y.W. Ricetalk: Rice blast detection using internet of things and artificial intelligence technologies. IEEE Internet Things J. 2019, 7, 1001–1010. [Google Scholar] [CrossRef]
  91. Duong-Trung, N.; Quach, L.D.; Nguyen, M.H.; Nguyen, C.N. Classification of grain discoloration via transfer learning and convolutional neural networks. In Proceedings of the International Conference on Machine Learning and Soft Computing, Da Lat, Vietnam, 25–28 January 2019; pp. 27–32. [Google Scholar]
  92. Shrivastava, V.K.; Pradhan, M.K.; Minz, S.; Thakur, M.P. Rice plant disease classification using transfer learning of deep convolution neural network. Int. Arch. Photogramm. Remote Sens. Spat. Inf. Sci. 2019, XLII-3/W6, 631–635. [Google Scholar] [CrossRef] [Green Version]
  93. Deng, R.; Tao, M.; Xing, H.; Yang, X.; Liu, C.; Liao, K.; Qi, L. Automatic diagnosis of rice diseases using deep learning. Front. Plant Sci. 2021, 12, 701038. [Google Scholar] [CrossRef]
Figure 1. Blight (a), Blast (b), Brown Spot (c), and Healthy (d).
Sustainability 14 13610 g001
Figure 2. Proposed Model.
Sustainability 14 13610 g002
Figure 3. Transfer Learning with DNN.
Sustainability 14 13610 g003
Figure 4. Methodology Flow Graph.
Sustainability 14 13610 g004
Figure 5. Experiment results with LR 0.1 and 200 epochs.
Sustainability 14 13610 g005
Figure 6. Experiment results with LR 0.01 and 200 epochs.
Sustainability 14 13610 g006
Figure 7. Experiment results with LR 0.001 and 200 epochs.
Sustainability 14 13610 g007
Figure 8. Experiment results with LR 0.0001 and 200 epochs.
Sustainability 14 13610 g008
Figure 9. Comparison of different transfer learning architectures.
Sustainability 14 13610 g009
Figure 10. Comparison of classification accuracy of the classifier with InceptionV3.
Sustainability 14 13610 g010
Table 1. Leaf of Paddy Images Dataset.
ClassCount of ImagesTraining Images Testing/Validation Images
Blight30025050
Blast36530065
Brown spot33527065
Healthy500400100
Table 2. Deep Neural Network Description.
Hyper ParameterDescription
No. of Con. Layer15
No. of Max Pooling Layer15
Dropout rate0.25, 0.5
Network Weight AssignedUniform
Activation FunctionReLu
Learning Rates0.001, 0.01, 0.1
Epoch50, 100, 200, 250
Batch Sizes32, 50, 60, 100
Table 3. Experiment with different epochs and learning rates.
EpochLearning RateAccuracy (%)
500.196.23
0.0196.42
0.00196.35
0.00196.52
1000.196.23
0.0196.36
0.00196.35
0.00196.32
1500.196.65
0.0196.36
0.00196.33
0.00196.32
2000.196.62
0.0196.47
0.00197.47
0.00196.47
Table 4. Comparison of proposed models with other models.
YearDiseases CountTechniquesAccuracy (%)Reference
20161SVM, GA87.90[86]
201710CNN95.48[87]
20189CNN93.30[88]
20191CNN, SVM, LBPH95.83[89]
20191RiceTalk89.40[90]
20191InceptionV388.20[91]
20193AlexNet, CNN, SVM91.37[92]
20213Ensemble DL91[93]
Table 5. Comparison of different transfer learning architectures.
Dataset UsedModelNumber of FoldsAccuracyF1 ScorePrecisionRecall
Paddy Leaf
[88]
Mobile Net50.850.8450.8340.85
VGG160.870.86540.870.87
VGG190.90.910.90.9
RestNet0.910.910.900.9
SqueezeNet0.670.680.670.68
InceptionNet0.920.920.91850.92
Proposed Model0.95740.95780.95880.95
Mobile Net 100.890.890.890.89
VGG160.8870.8870.880.88
VGG190.90.910.90.9
RestNet0.910.910.900.9
SqueezeNet0.670.680.670.68
InceptionNet0.920.920.91850.92
Proposed Model0.96740.96780.96880.96
Mobile Net 200.890.890.890.89
VGG160.8870.8870.880.88
VGG190.90.910.90.9
RestNet0.910.910.900.9
SqueezeNet0.670.680.670.68
InceptionNet0.920.920.91850.92
Proposed Model0.9680.9680.96880.968
Paddy Leaf
[89]
Mobile Net 50.850.8450.8340.85
VGG160.870.86540.870.87
VGG190.90.910.90.9
RestNet0.910.910.900.9
SqueezeNet0.670.680.670.68
InceptionNet0.920.920.91850.92
Proposed Model0.95740.95780.95880.95
Mobile Net 100.890.890.890.89
VGG160.8870.8870.880.88
VGG190.90.910.90.9
RestNet0.910.910.900.9
SqueezeNet0.670.680.670.68
InceptionNet0.920.920.91850.92
Proposed Model0.96740.96780.96880.96
Mobile Net 200.890.890.890.89
VGG160.8870.8870.880.88
VGG190.90.910.90.9
RestNet0.910.910.900.9
SqueezeNet0.670.680.670.68
InceptionNet0.920.920.91850.92
Proposed Model0.9680.9680.96880.968
Table 6. Confusion matrix for the proposed model with InceptionV3 and k Fold 20.
Predicted
Actual BlightBlastBrown SpotHealthy
Blight96.460%1.90%1.00%0.5%300
Blast1.85%96.490%0.70%0.55%365
Brown Spot0.50%0.7%98.00%0.8%335
Healthy0.50%0.60%2.10%96.80%500
3003653355001500
Publisher’s Note: MDPI stays neutral with regard to jurisdictional claims in published maps and institutional affiliations.

