Article

Impact of Land System Changes and Extreme Precipitation on Peak Flood Discharge and Sediment Yield in the Upper Jhelum Basin, Kashmir Himalaya

Department of Geoinformatics, University of Kashmir, Srinagar 190006, India
*
Author to whom correspondence should be addressed.
Sustainability 2022, 14(20), 13602; https://doi.org/10.3390/su142013602
Submission received: 15 September 2022 / Revised: 6 October 2022 / Accepted: 17 October 2022 / Published: 20 October 2022

Abstract

:
The Kashmir valley is prone to flooding due to its peculiar geomorphic setup compounded by the rapid anthropogenic land system changes and climate change. The scarcity of observations is one of the major challenges for understanding various land surface processes in the mountainous and mostly ungauged terrain. The study assesses the impact of land use and land cover (LULC) changes between 1980 and 2020 and extreme rainfall on peak discharge and sediment yield in the Upper Jhelum Basin (UJB), Kashmir Himalaya, India using KINEROS2 model. Analysis of LULC change revealed a notable shift from natural LULC to more intensive human-modified LULC, including a decrease in vegetative cover, deforestation, urbanization, and improper farming practices. The findings revealed a strong influence of the LULC changes on peak discharge, and sediment yield relative to the 2014 timeframe, which coincided with the catastrophic September 2014 flood event. The model predicted a peak discharge of 115,101 cubic feet per second (cfs) and a sediment yield of 56.59 tons/ha during the September 2014 flooding, which is very close to the observed peak discharge of 115,218 cfs indicating that the model is reliable for discharge prediction. The model predicted a peak discharge of 98,965 cfs and a sediment yield of 49.11 tons/ha in 1980, which increased to 118,366 cfs and, 58.92 tons/ha, respectively, in 2020, showing an increase in basin’s flood risk over time. In the future, it is anticipated that the ongoing LULC changes will make flood vulnerability worse, which could lead to another major flooding in the event of an extreme rainfall as predicted under climate change and, in turn, compromise achievement of sustainable development goals (SDG). Therefore, regulating LULC in order to modulate various hydrological and land surface processes would ensure stability of runoff and reduction in sediment yield in the UJB, which is critical for achieving many SDGs.

1. Introduction

Flooding, exacerbated by land use changes in drainage basins, causes a massive influx of sediment load, which is a major global concern [1,2,3]. There are several reasons for the increase in the frequency of flood events across the world; however, land system and climatic changes are undoubtedly the most important factors to consider [4]. The frequency and magnitude of floods have increased over time, owing primarily to global warming which is expected to surge in the future, intensive natural resource exploitation, inappropriate land use changes, sedimentation of water courses, and rapid urbanization, all of which have accelerated the occurrence of natural phenomena and processes such as flooding and gravitational mass movements [5,6,7,8,9,10]. The Jhelum Basin’s peculiar geomorphic set up, comprising a flat valley floor surrounded on all sides by lofty mountains, heterogeneous lithology, and varying hydrological conditions, makes the basin extremely vulnerable to flooding [11,12]. The presence of injudicious socioeconomic structures [13] and massive land system changes in the floodplains [12,14,15], which interfere with the hydraulic and hydrological processes during flooding. The 2014 flooding event was one of the massive disasters in the flood history of Kashmir in which 100 people died, resulting in an economic loss of INR 1 trillion [16], which includes losses to agricultural as well as direct damage to buildings and infrastructure. The government declared the storm a “natural catastrophe” after it inundated large number of areas along the Jhelum main stream and its tributaries in the Kashmir valley. According to the World Bank report, the government described the disaster as “the worst tragedy in a century”, with “colossal loss of life and extensive damage to residential and commercial sectors, public facilities, including hospitals, road infrastructure, agriculture, and transport sectors”. About 350,000 buildings were affected in the Kashmir valley by the 2014 floods, including 250,000 residential houses, and about 1.2 million families living in 5500 flood-hit villages across the state were displaced [17].
Anthropogenic LULC changes cause environmental changes at all scales [18] and are responsible for the changes in a basin state and hydrological response [19]. There is a growing awareness of the importance of LULC and its impacts on various hydrological and land surface processes. It is important to analyze and understand the effects of LULC on hydrological, ecological, climatic, and biological processes over time and space [20,21,22,23]. Several studies have been conducted on the impact of human activities and climate change on hydrological processes in catchments [9,24,25,26,27,28,29]. Anthropogenic activities such as urbanization have reduced permeability and infiltration, resulting in increased and peak runoff in urban areas [30,31]. Moreover, vegetation removal, which is usually associated with urbanization and infrastructure development, is responsible for reduced rainfall interception and soil water storage [32]. Geographical distribution and dynamics of land cover are critical factors for estimating the impermeability along slopes and identification of areas contributing to the runoff into the channels that drain the catchment [33]. Various studies have focused on LULC change at the catchment scale and its potential impact on flooding [34]. All these studies showed diverging results and demonstrate the complexity of understanding the impacts of land system changes [35]. How the loss of pervious area and vegetation cover increases runoff from catchments is an important research area linked to LULC change. Apart from that, other factors such as changes in flow regimes, or constrained river morphology, all contribute to the worsening of flood conditions [36,37,38].
The Himalayas, due to the steep slopes and young geologic materials, is recognized as one of the world’s most fragile and vulnerable ecosystems [39], and it poses a major challenge for soil development due to the excessive runoff and high soil erosion rates, both of which contribute to land degradation and natural hazards, particularly those triggered by the action of water [40]. Anthropogenic activities such as the construction of embankments, barrages, dams, land clearance, urbanisation, loss of wetlands, and land use changes, among others, have impacted drainage capacity of rivers due to increased sediment load and storm runoff, resulting in catastrophic floods [41,42,43]. Deforestation, terrain steepness, high intensity rainfall leading to excessive runoff and sediment production, overgrazing, tectonics, and intensive and primitive farming are the main causes of soil erosion [44,45,46,47,48,49].
Climate change has received attention from hydrologists in recent years as it significantly affects various components of the hydrological cycle [50]. The projected climate changes in the Jhelum basin would have significant impacts on the frequency of climate extremes, and streamflow of the Jhelum River, which in turn would adversely impact various ecosystem services and other key economic sectors in the basin [51]. Recent studies have found that extreme hydrological events, such as floods, are becoming more frequent and severe as a result of climate change [52,53,54,55] and therefore compromise the achievement of several SGDs especially in low- and middle-income countries [56].
Geospatial modelling has significantly aided runoff and soil erosion studies [12,28,57,58], which have helped in the development of appropriate soil and water conservation measures, particularly at catchment scale [59]. In this study, the past and present LULC changes in UJB between 1980 and 2020 were assessed using remote sensing and GIS techniques to quantify their impact on hydrological processes and flood hazard risk in the UJB using the 2014 flooding event as a reference point employing an event-based distributed and dynamic conceptual modelling framework, that requires varied information about soils, LULC, and geomorphology in GIS environment. This study aims to understand the inter-dependent relationships between LULC changes, extreme rainfall events, and flood risk, and the findings would inform the development of a suitable policy to achieve SDGs and ensure the sustainable development of UJB.

2. Materials and Methods
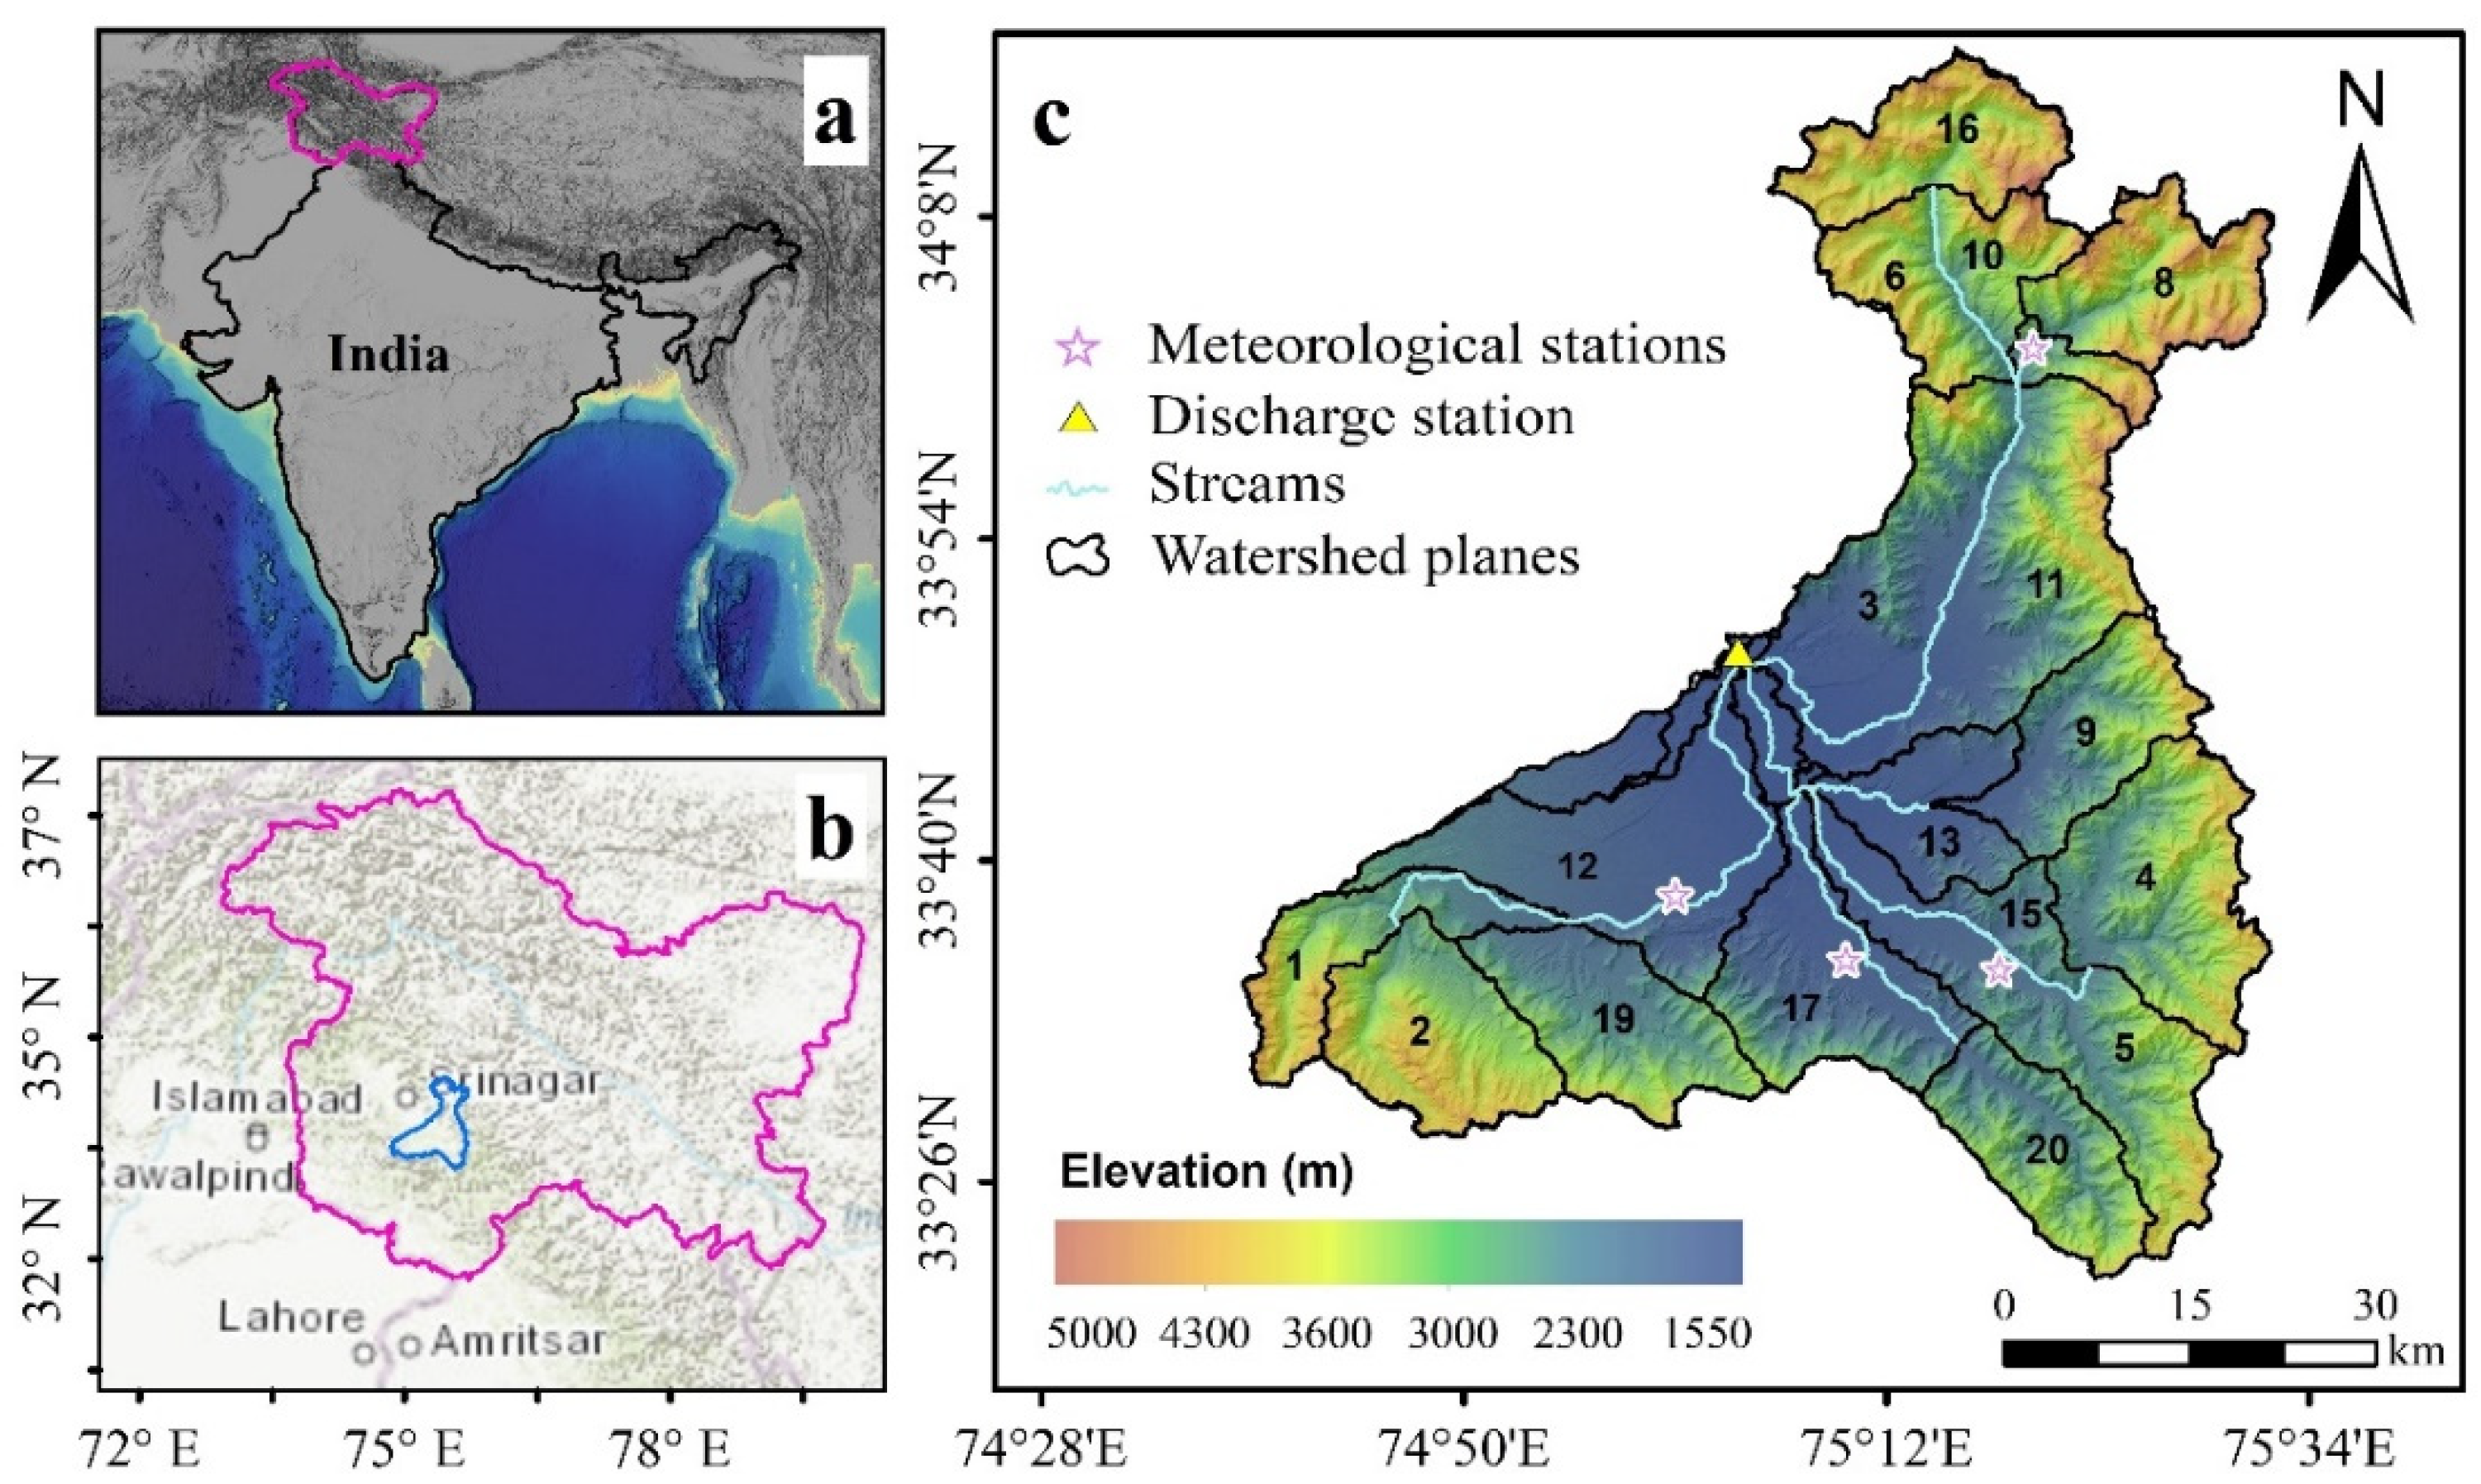
2.1. Study Area

The study was carried out in the Upper Jhelum Basin (UJB), in the Kashmir Himalaya, India (Figure 1a), The Kashmir valley, which encompasses Jhelum basin, has a fairly well developed drainage system headed by the Jhelum main channel and comprises of 24 catchments [60]. The River Jhelum, situated in a tectonically active geomorphic setting, makes some of the finest meanders over its course and deposits a good deal of its suspended load along its bank [37]. The UJB, comprising of five catchments such as Lidder, Kuthar, Bringi, Sandran and Veshu, lies between 33°24′54″ N to 34°27′52″ N latitude and 74°24′08″ E to 75°30′36″ E longitude, having a catchment area of 3670 km2 and basin length of 34.5 km up to Sangam (Figure 1a). The average elevation of the UJB is about 2684 m above sea level and is generally precipitous with an average slope of 29.4%. Average annual precipitation (based on 38 years of data) is 1005 mm and the majority of its precipitation is received in the form of snowfall from the western disturbances during the winter season [61,62]. However, the mountainous parts of the basin receive early snowfall from October and normally continues till late April. The surrounding Pir-Panjal mountain range from the south-west limits the effect of summer monsoons in the basin, notwithstanding the periodic monsoon intrusions into the basin [63,64].
Significant precipitation is received in March, April, and May, and the mountains remain covered with snow until the end of June [65]. July is the warmest month, with a mean maximum temperature of 24.6 °C, whereas January is the coldest month, with a mean minimum temperature of 1 °C [66]. The climate of Kashmir is temperate, with significant seasonal fluctuations. Soils are medium developed and generally of a loam texture, with lithosols and associated cambisols being the predominant soil group [67]. Most of the vegetation in the catchment is composed of horticulture, plantations, scrublands, and forests [68]. However, the study area also includes a variety of other LULC types, some of which are natural, whereas most are controlled and managed by humans.

2.2. KINEROS2 Model

KINEROS2 (K2) is an event-based distributed and dynamic model, which simulates hydrological event for peak streamflow and sediment yield [69,70]. The model has been used to predict surface runoff, soil erosion, infiltration, and interception depth from catchments [69,71]. Saran et al., 2021, showed that by integrating data from remote sensing with KINEROS2 in GIS, the approach worked well and the output was helpful in designing sustainable catchment management strategies [72]. In another study, Hernandez et al., 2000, used the KINEROS2 model to estimate runoff response to land cover and rainfall changes in semi-arid catchments and were able to characterize the basin’s runoff response to changes in land cover [73]. The KINEROS2 was used by [74] to model runoff and erosion on steep highways in northern Thailand and in a small Mediterranean mountain basin. Results demonstrated that the KINEROS2 was able to simulate land erosion, with limited robustness [75]. The study area is very susceptible to flooding, with a sizable upstream area covered in steep mountainous terrain. Extreme rainfall events typically induce rapid streamflow, creating floods, which the model best takes into account. Another justification for using the KINEROS2 model in this investigation is the absence of gauging stations in the study area.
In the model framework, catchment is approximated by a cascade of overland flow planes, channels, and impoundments. Overland flow planes can be split into multiple components with different slopes, roughness, soils, and so on [76]. The LULC, soils, precipitation, and GPS field data are integrated in GIS to simulate infiltration, erosion, and runoff processes along planes and channels. To account for the soil redistribution behavior, the KINROS model requires a distribution index of the pore size (λ) parameter, which serves as a basic descriptor of soil hydraulic characteristics. The model simulates the effects of changing geographical variation in soil hydraulic conductivity (Ks) to account for the random variation in soil hydraulic properties. KINEROS2 also requires land cover parameters, which include hydraulic roughness for different LULC classes, impervious and pervious surfaces, interception depths for impervious and pervious surfaces, and canopy cover fractions. The KINEROS2 model is driven by precipitation data in terms of time-intensity or time-accumulated depth pairs. The parameter characteristics of the planes and channels is shown in Table 1.
KINEROS2 employs the generalized Smith–Parlange model to estimate infiltration [77]. When rainfall intensity exceeds the soil’s infiltration capability, the overland flow situation arises. The infiltration capacity, f(t), is calculated as follows:
f t = K S 1 + ω / e ω F t / G + h Φ θ i 1
where F(t) represents the cumulative infiltration depth of water in the soil, h is the flow depth, Φ refers to soil absorbency, θi is the initial soil moisture content prior to the event, and ω is a parameter having a value between zero and one, Ks is the soil hydraulic conductivity, and G is the net capillary drive parameter.
KINEROS2 simulates flow across individual rectangular planes using a kinematic wave approximation and solves the continuity problem as follows:
h t + a m h m 1 h x = q L x , t
where t is time, x is the distance along the slope direction, a and m parameters are related to slope, qL refers to lateral inflow rate, flow regime, and surface roughness. The relationship between unit flow discharge q and flow depth h is shown as follows:
q = a h m
The overland flow entering the channel is then routed to the catchment outlet.

2.3. Model Input Parameters

Table 2 provides information about the key parameters and their sources required as input for the model. Carto DEM obtained from the Cartosat-1 satellite stereo images with a spatial resolution of 30 m was used in this study as it has shown better performance accuracy compared to other publicly available DEMs [78]. LULC data was derived from a time series of Landsat satellite data from 1980, 2014, and 2020 using on-screen digitization [79].
Food and Agriculture Organization (FAO) digital soil map provided by the United Nations Educational, Scientific and Cultural Organization (UNESCO) [80] and having a spatial resolution of 1:5 million was used in this study. Hourly precipitation data from 3 September to 6 September 2014, provided by the Indian Meteorological Department (IMD) from 04 stations situated within and around the UJB catchments, was used to estimate rainfall depth for input into the model. Daily soil moisture (percent volumetric soil moisture) derived from the Climate Data Records (CDR), based on the ESA Climate Change Initiative (CCI), was used as a model input parameter [81]. Initial relative soil saturation used in the model was derived from Soil Moisture data product version 4. River discharge data, recorded at the exit of the UJB at Sangam from 3–6 September 2014, was used to validate the model output to determine the model efficiency in simulating the peak flood discharge.

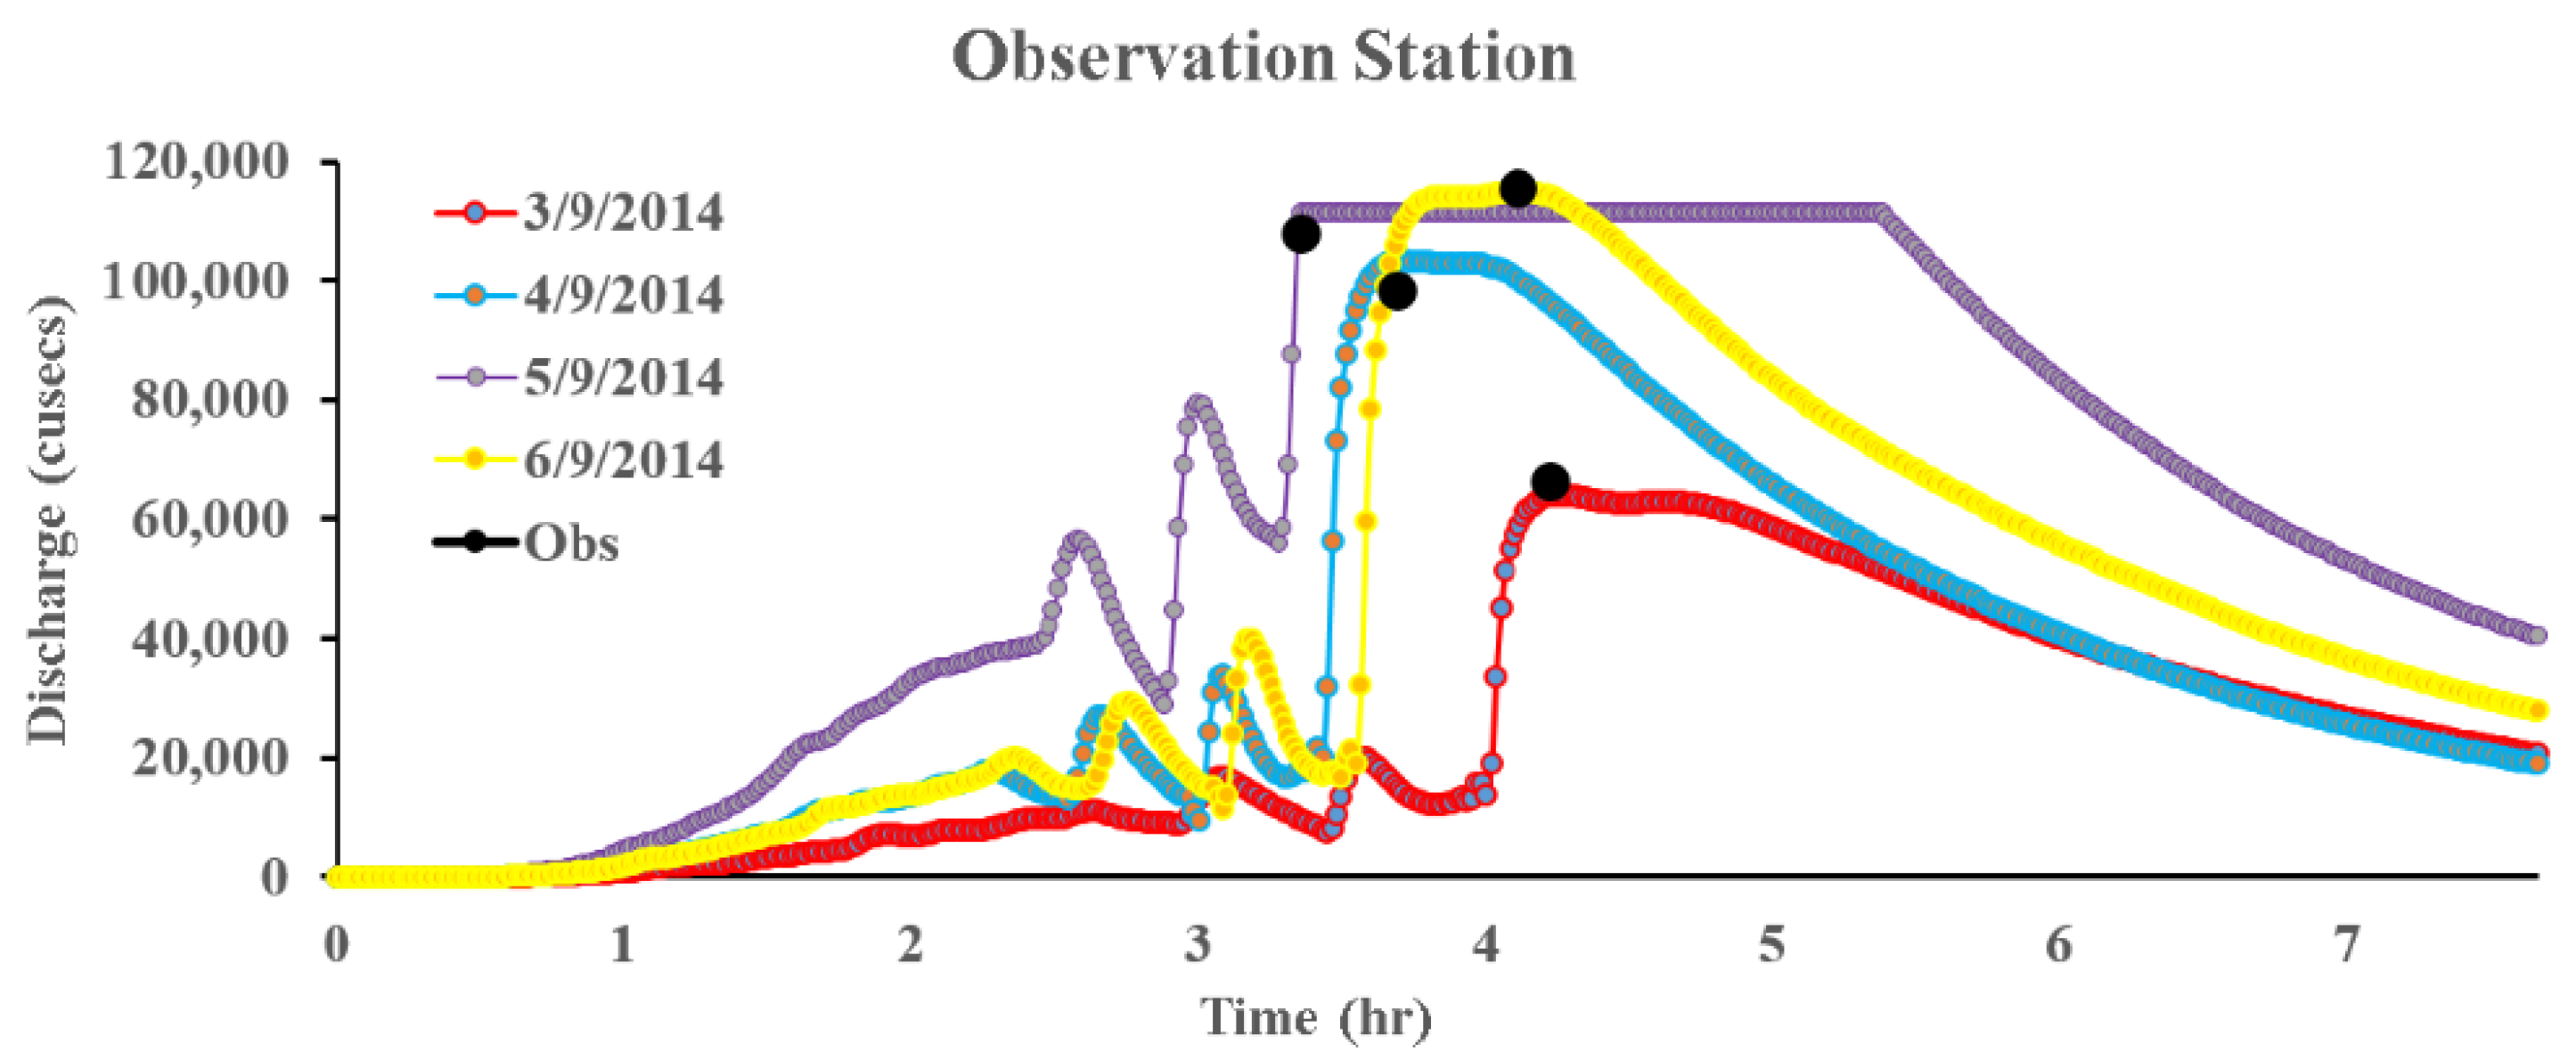
2.4. Storm Runoff Simulation

The KINEROS2 model was used to simulate storm runoff from UJB in response to the specific extreme rainfall event that occurred between 3–6 September 2014, with an average rainfall depth of 121 mm in the range of 42 mm to 206 mm observed throughout the study area. Using the average rainfall depth for calibration, storm runoff and erosion was simulated. The model specifically simulates peak flow (m3 s−1), storm volume (mm), peak sediment discharge (kg s−1), and storm sediment yield (kg s−1). The model was first run using 2014 LULC data, to accurately represent the land system scenario at the time of the occurrence of the extreme rainfall event in September 2014. In order to determine the changes in rainfall-runoff processes in response to the changing LULC in the past (1980) and present (2020) scenarios, the model was run with changing the LULC information while keeping all other model input parameters static (e.g., calibration parameters, soil saturation index, precipitation data, soil map, and DEM). This was done to simulate peak discharge and peak discharge volume caused by a similar extreme rainfall event as that of the 2014 September event but under the changing LULC scenario as present during 1980 and 2020.

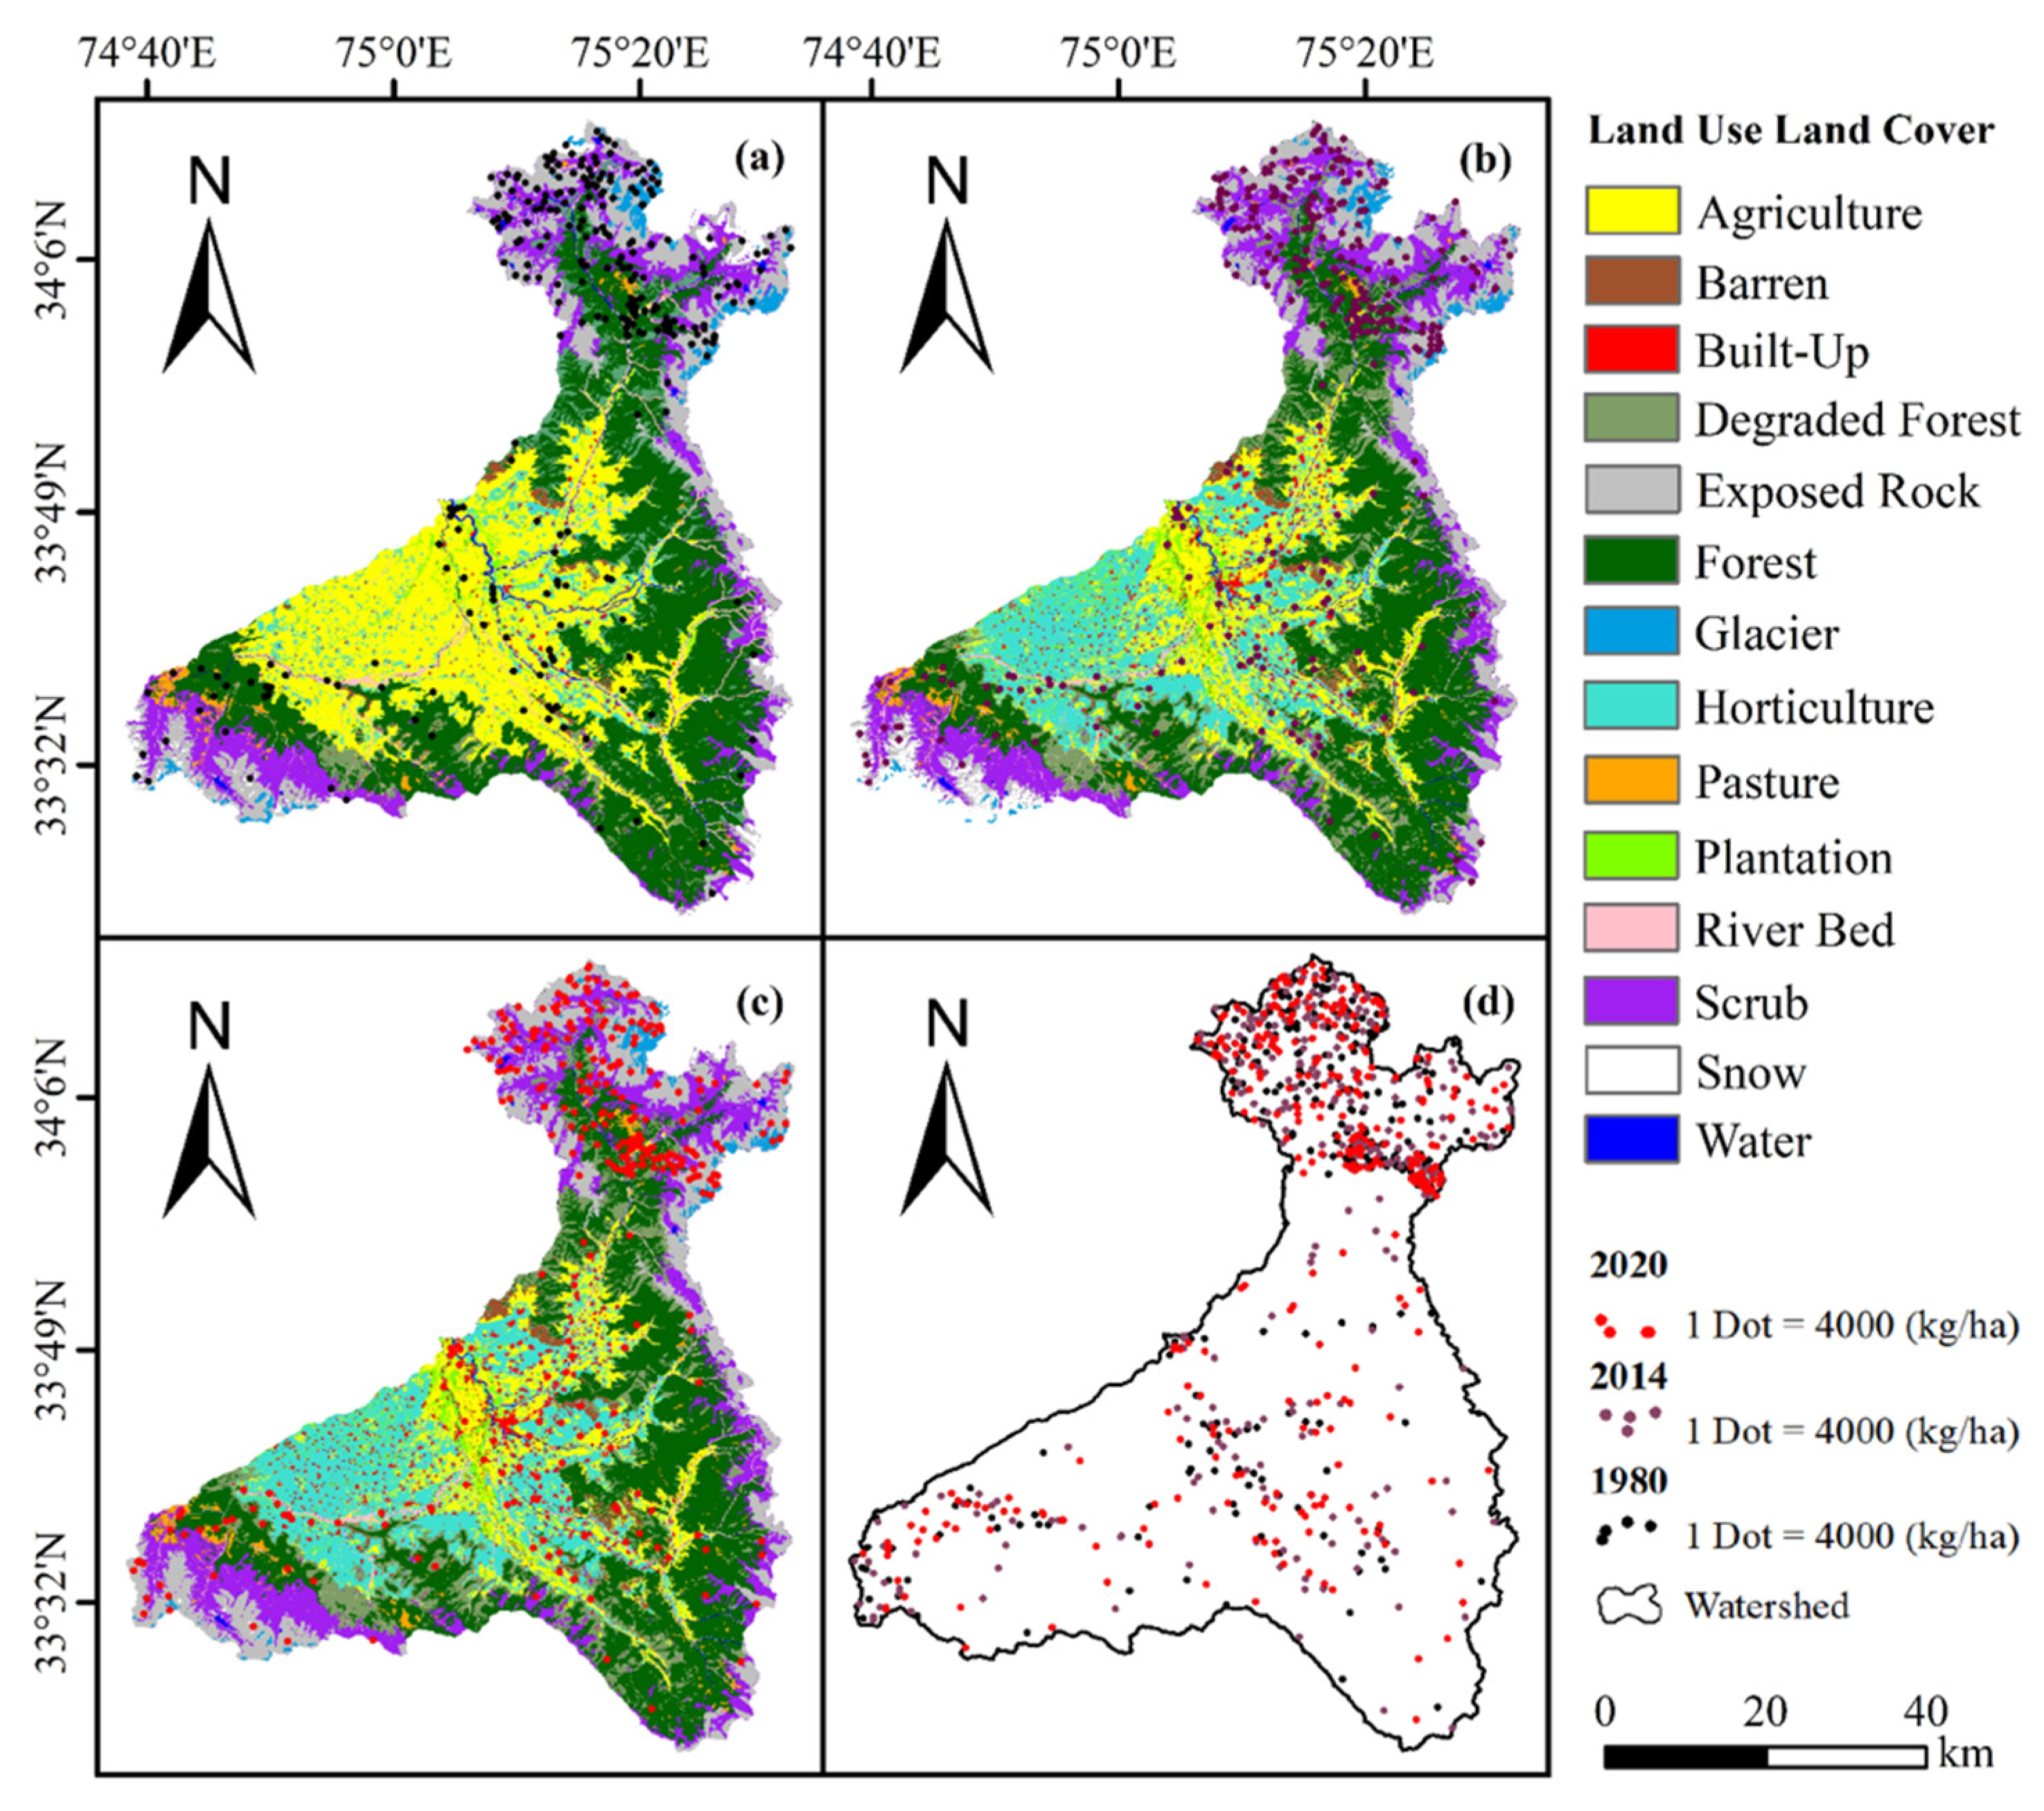
2.5. Land Use and Land Cover Information

LULC data was extracted from satellite imageries [82] acquired from Landsat MSS sensor for the year 1980, ETM sensor for the year 2014, and OLI/TIRS sensors for the year 2020. In order to investigate the LULC change w.r.t time, fourteen distinct land-cover types were chosen: (1) Agriculture; (2) Barren land; (3) Horticulture; (4) Forests; (5) Degraded Forest; (6) Exposed rocks; (7) Built Up; (8) Pasture; (9) Scrub land; (10) Plantation; (11) River Bed; (12) Glaciers; (13) Snow; (14) Water. An on-screen digitization technique was used for all three date satellite images [83] through image interpretation, followed by accuracy assessment of the LULC data using 800 validation ground truth points chosen across the UJB and also supported by high resolution Google earth data. Classification accuracy of the LULC map was determined using Kappa coefficient [84,85]. Overall, accuracy of the LULC was evaluated from the error (confusion) matrix. The accuracy assessment result revealed an overall accuracy of 85% and a kappa value of 0.80 for the year 2020. User’s accuracy ranged from 49.4% to 91% while producer’s accuracy ranged from 52% to 100%. User’s accuracy is the more appropriate measure of the LULC classification’s actual utility in the field. Horticulture showed the highest user accuracy of 91%. Land-cover attributes were linked to the LULC through LUT; each of the fourteen land-cover classes received representative values for the following variables: estimated canopy cover, interception, Manning’s roughness coefficient, and imperviousness (percent paved area), following [69,86].

2.6. Model Calibration and Validation

Model calibration and validation are crucial stages in the development and implementation of any process-based hydrological model [87]. A multiplier strategy was employed for both calibration and sensitivity analysis of the model [88]. In this method, all initial values are multiplied by a factor to increase or decrease their value. The model’s sensitivity to change was determined by altering a series of parameters from their original values to determine the change in the peak discharge during each run. The calibration was performed for three rainfall events that occurred on 3rd, 4th, and 5th, September 2014. The values of Ks and n were changed by ±60% of the initial value at an interval of 5%. Each model run revealed that the Ks value is close to 50% or 1.5 times the initial value, and n values are close to +35% or 1.35 times the initial value. After the parameters were improved, the model was validated using the rainfall event of 6th September 2014. KINEROS2 model calibration required three storm events; therefore, the model validation was carried out for the consecutive 6th September 2014 flood event. The validated event dated September 6th was therefore used as a baseline event for assessing the impact of temporal LULC change on peak discharge and sediment yield in the basin under both past and present LULC scenarios as shown in Figure 2. However, no validation of the simulated sediment output could be performed, as there is no observed sediment data available in any of the catchments in the UJB.

3. Results

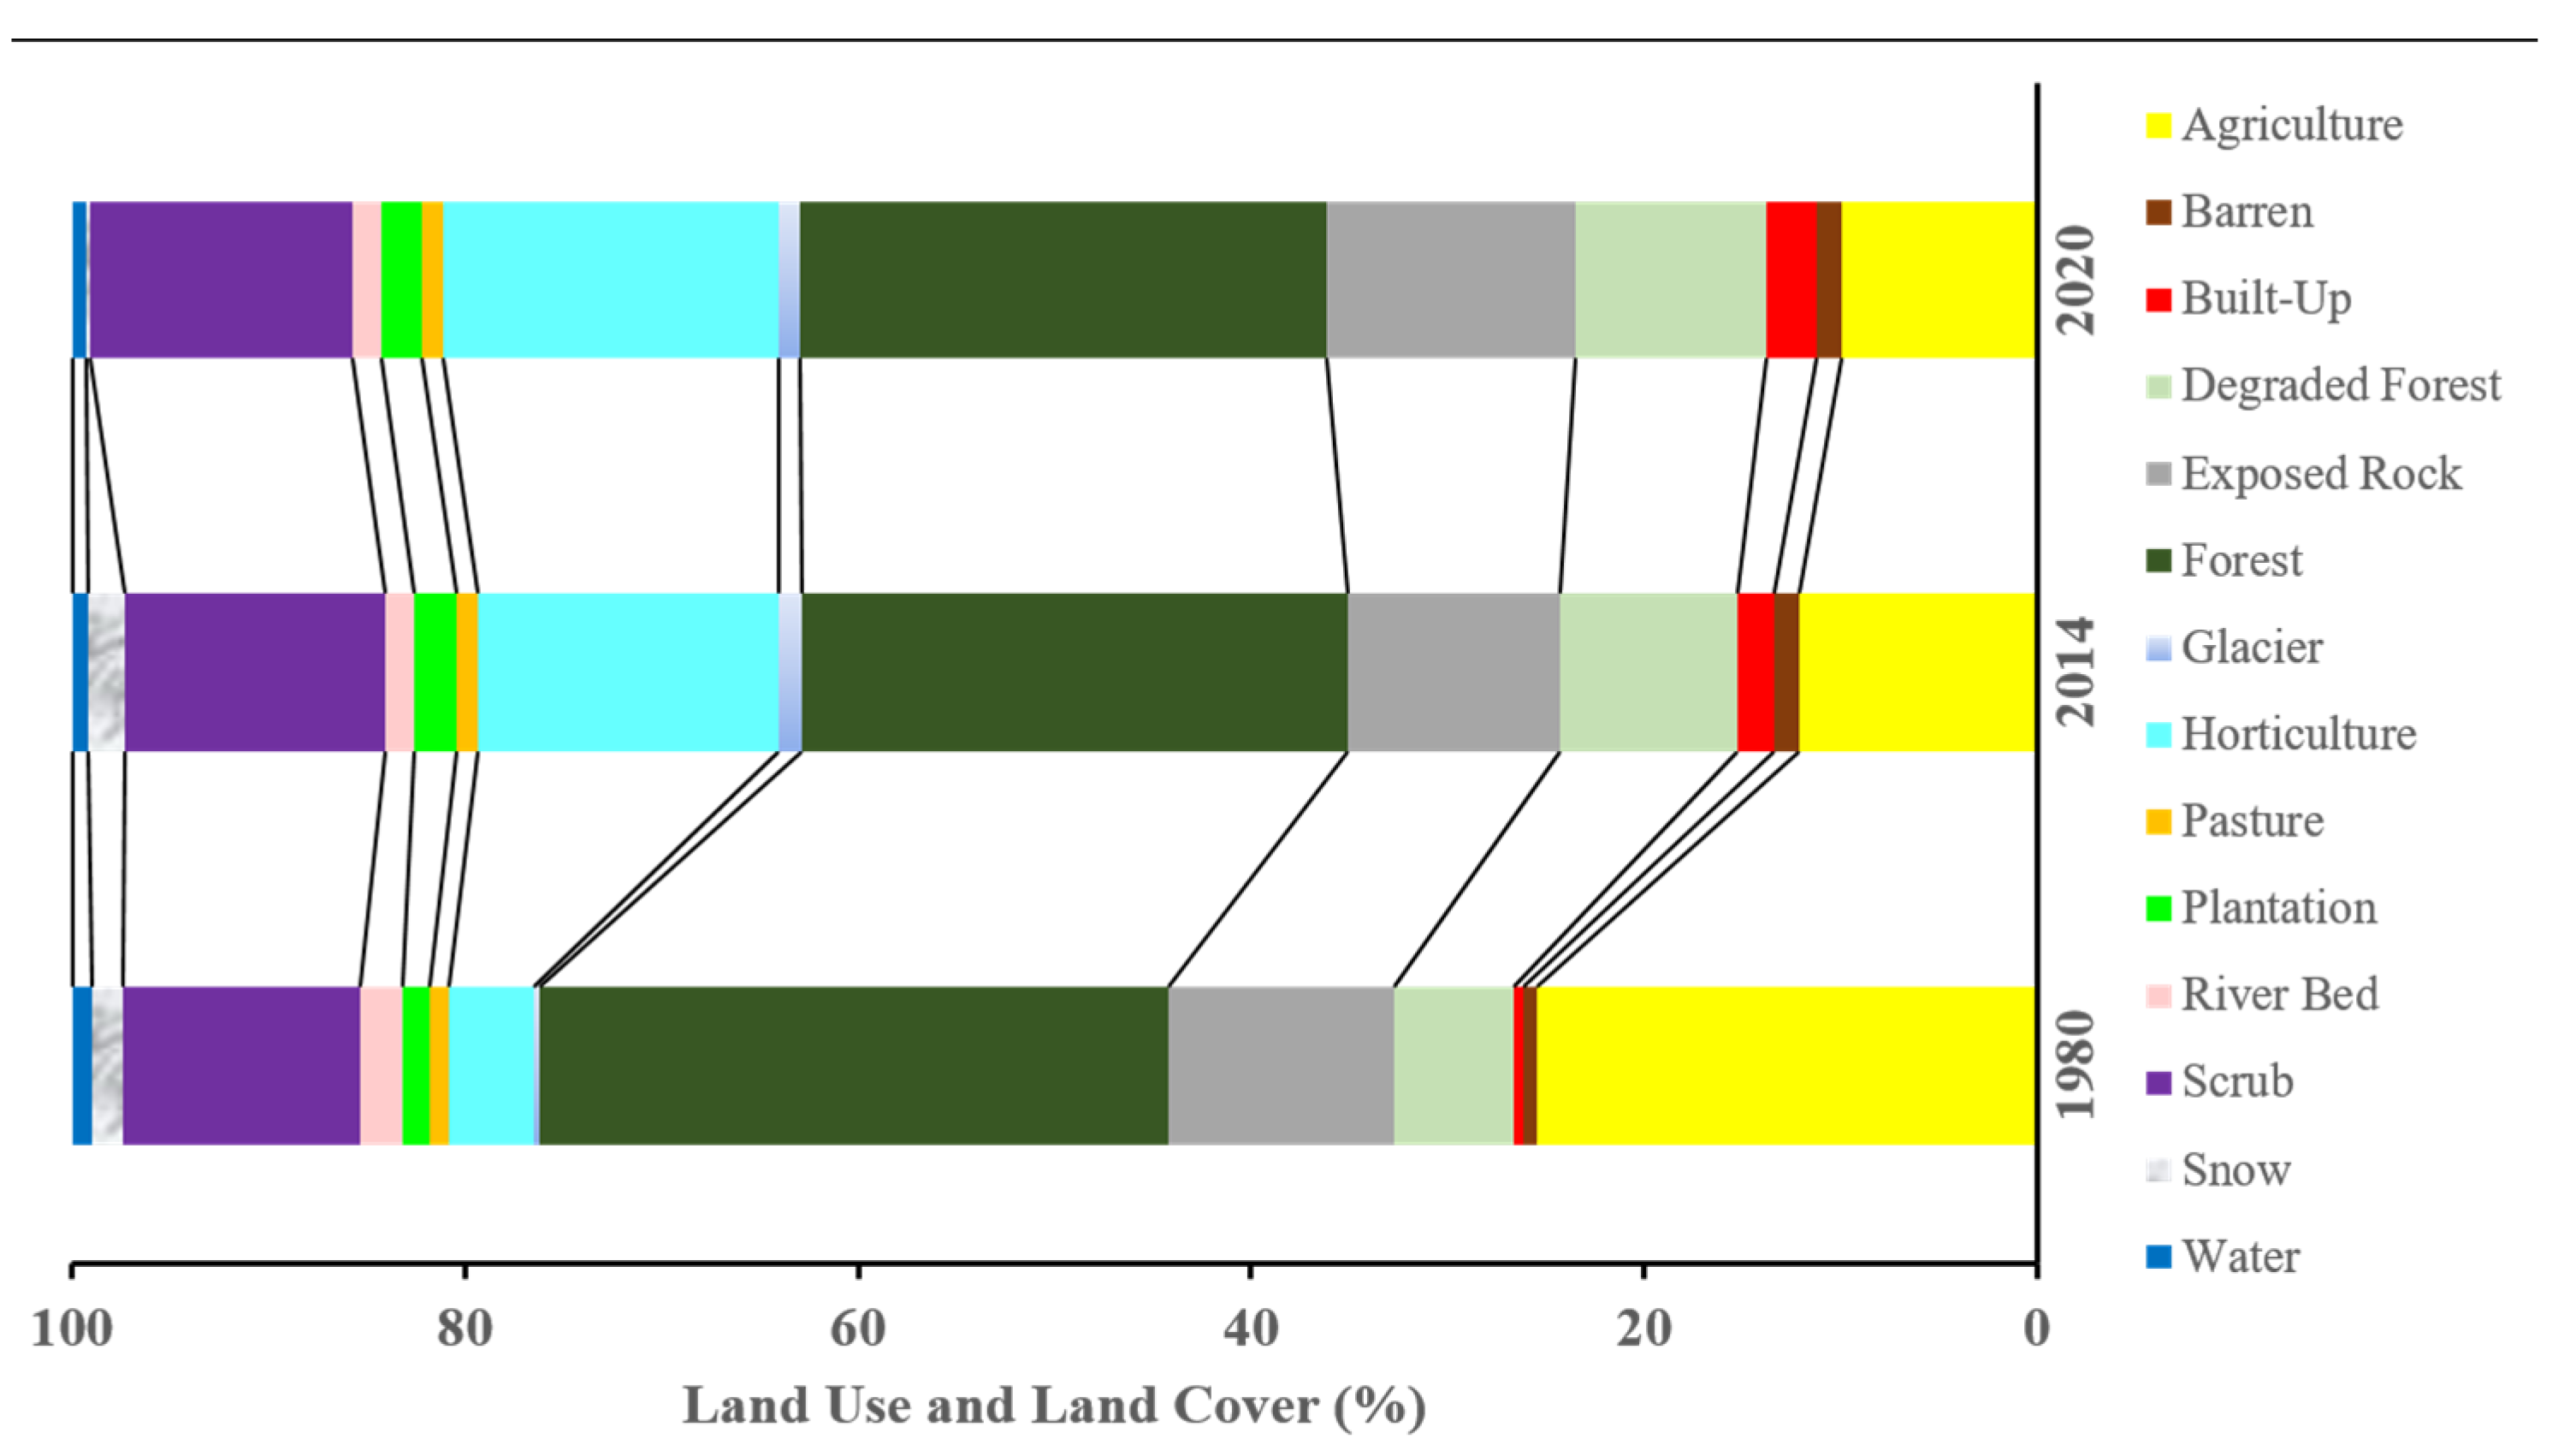
3.1. Land Use-Land Cover Change Analysis

The satellite image analysis showed a significant LULC change in the study area during the last 40 years from 1980 to 2020 as shown in Figure 3 and Table 3. It is obvious from the analysis of the 1980 data that large portions of the land in the UJB are utilized for forestry and agriculture (paddy) purpose. The existing LULC scenario in 2020, on the other hand, indicates a considerable shift towards horticulture and other anthropogenic-driven LULC.
Table 3 compares the LULC changes that have occurred in the UJB between 1980 and 2020. The agriculture land use has witnessed the maximum change across the five catchments, declining from 25.4% in 1980 to 9.98% in 2020, showing a decrease of −13.27% during 1980–2014 period and −2.2% during 2014–2020 period. Correspondingly, horticulture showed a significant increase, implying a significant shift from agricultural to horticulture, which has increased from 4.3% in 1980 to 17.08% in 2020. The analysis of the LULC data showed a significant decrease in the forest cover from 31.99% in 1980 to 26.79% in 2020. Between 1980 and 2014, the built-up area of UJB expanded by 1.38%, and between 2014 and 2020, the built-up expanded by 0.7%, showing a total increase of 2.08% between 1980–2020. All other LULC classes showed varying changes, as evident from the data provided in Figure 3 and Table 3. The comparison of the LULC data, also clearly indicates the land system changes that have occurred in the study area during the last 40 years in the UJB.

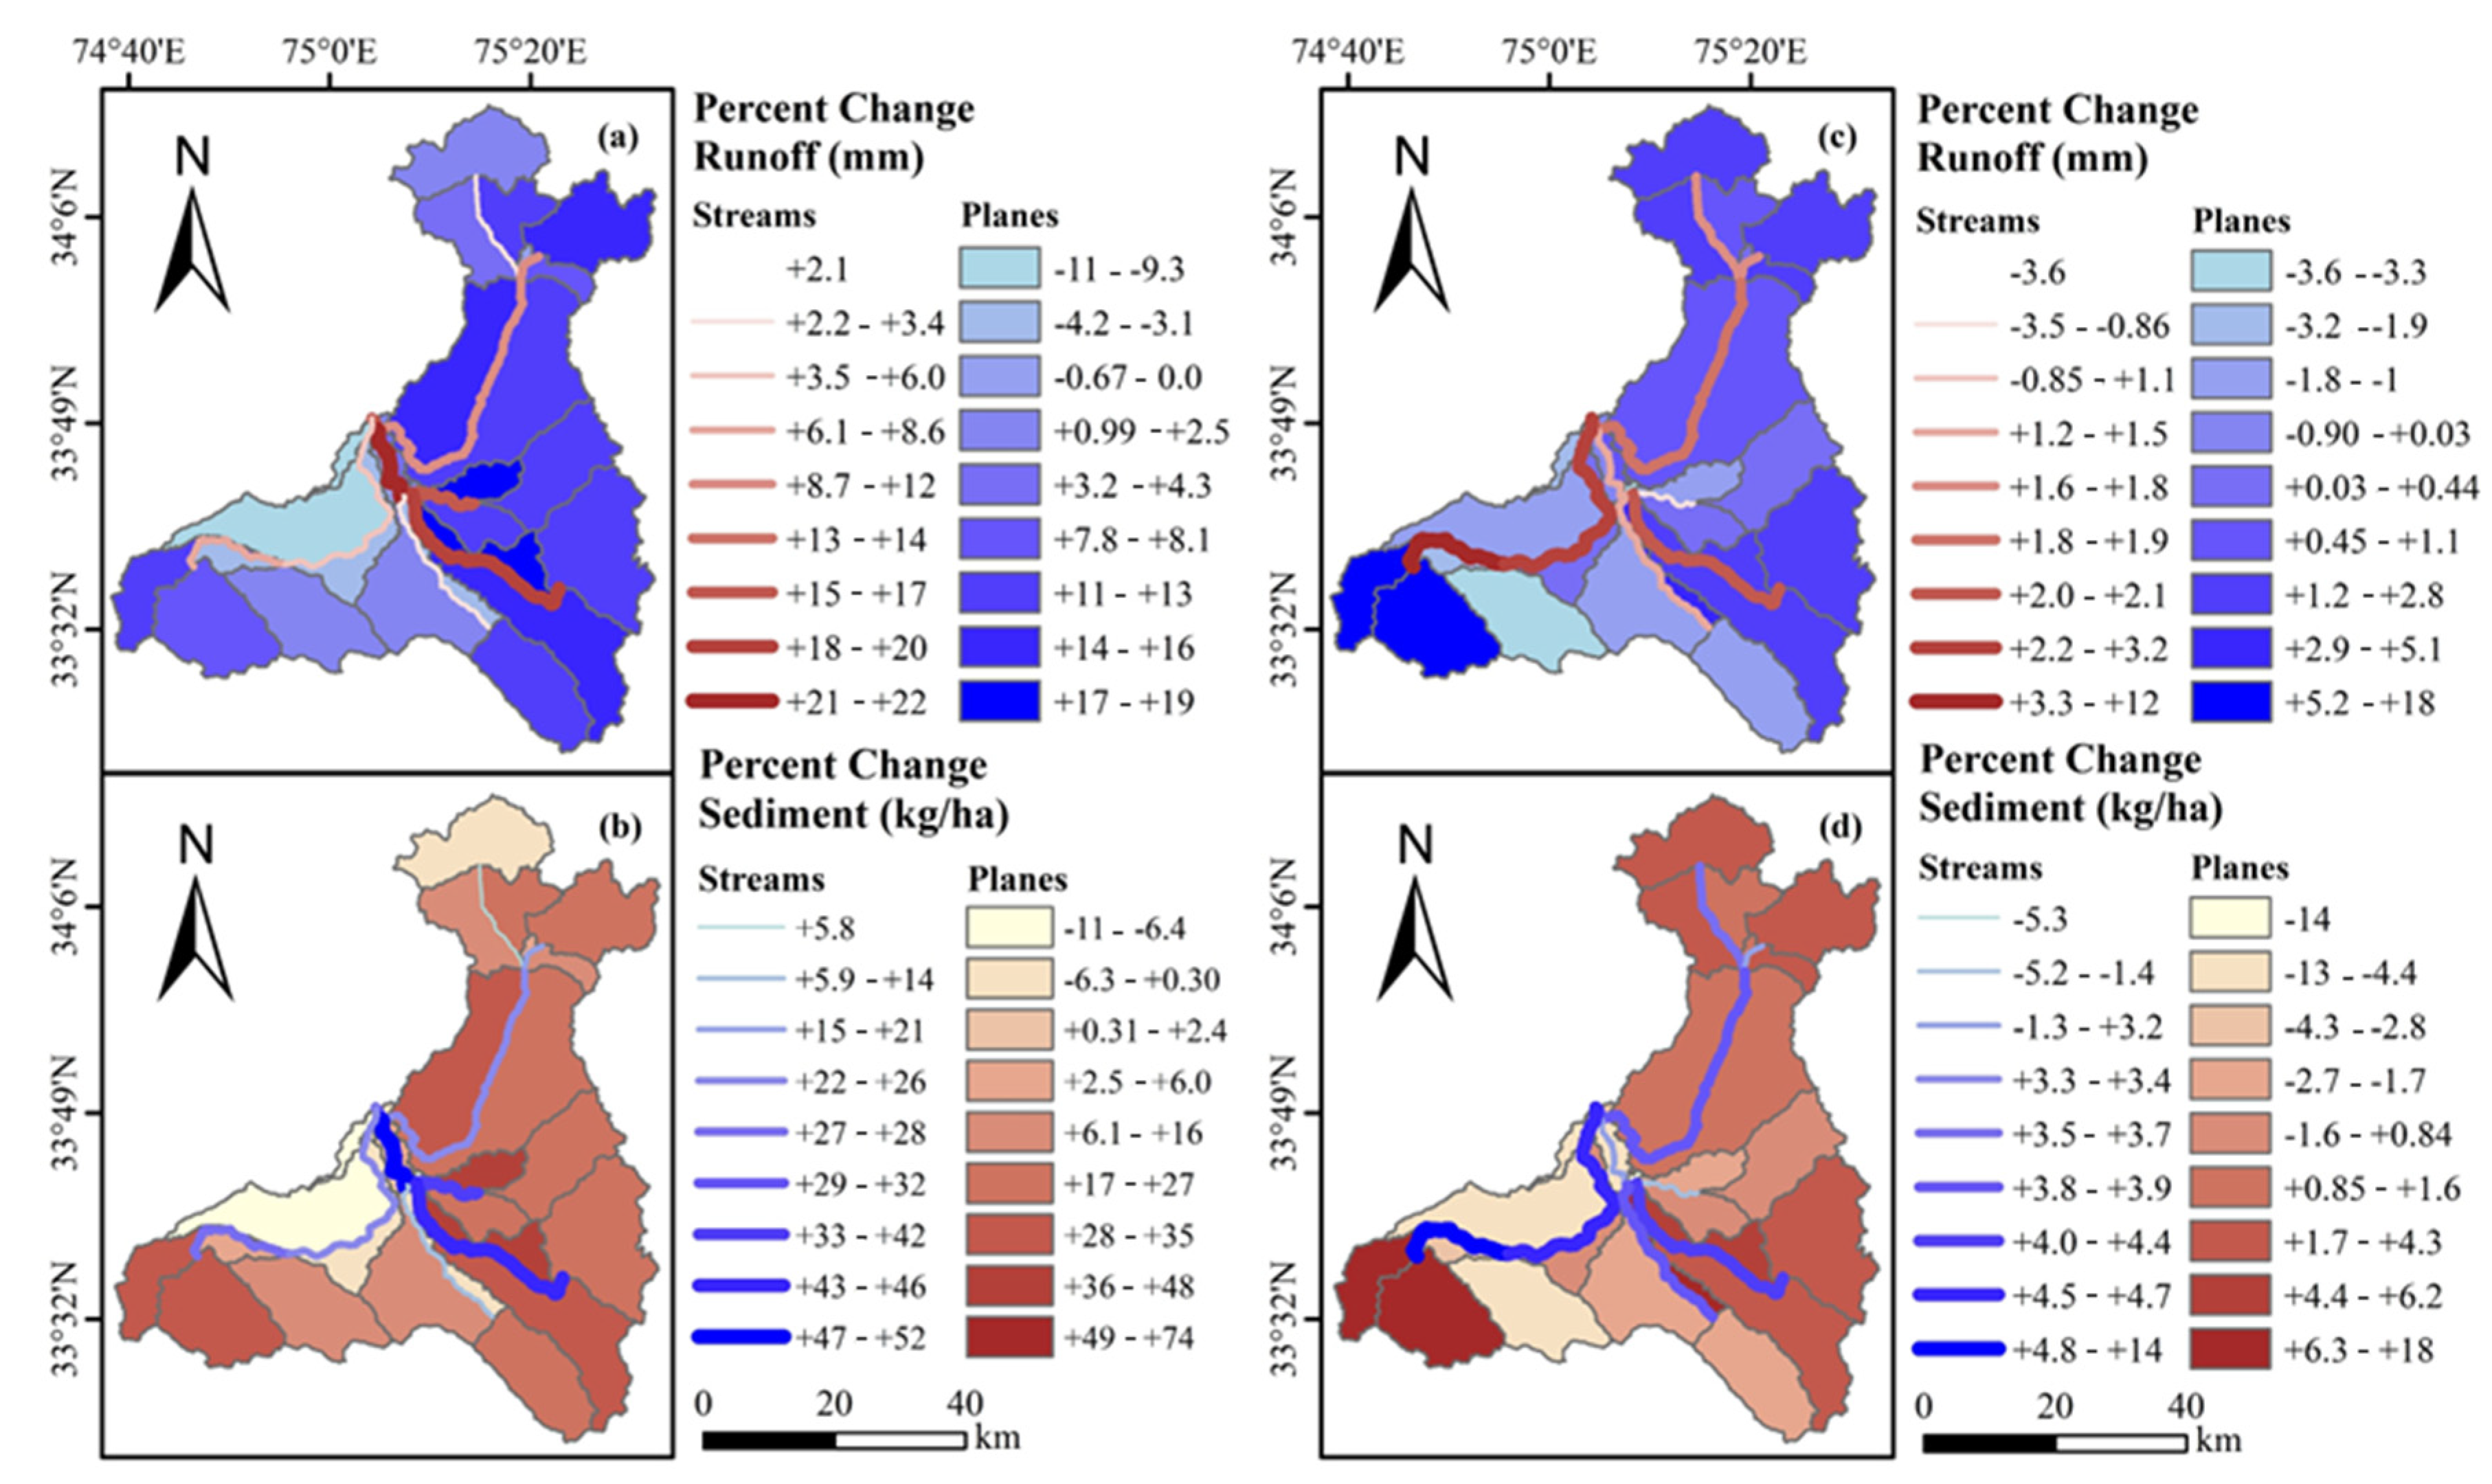
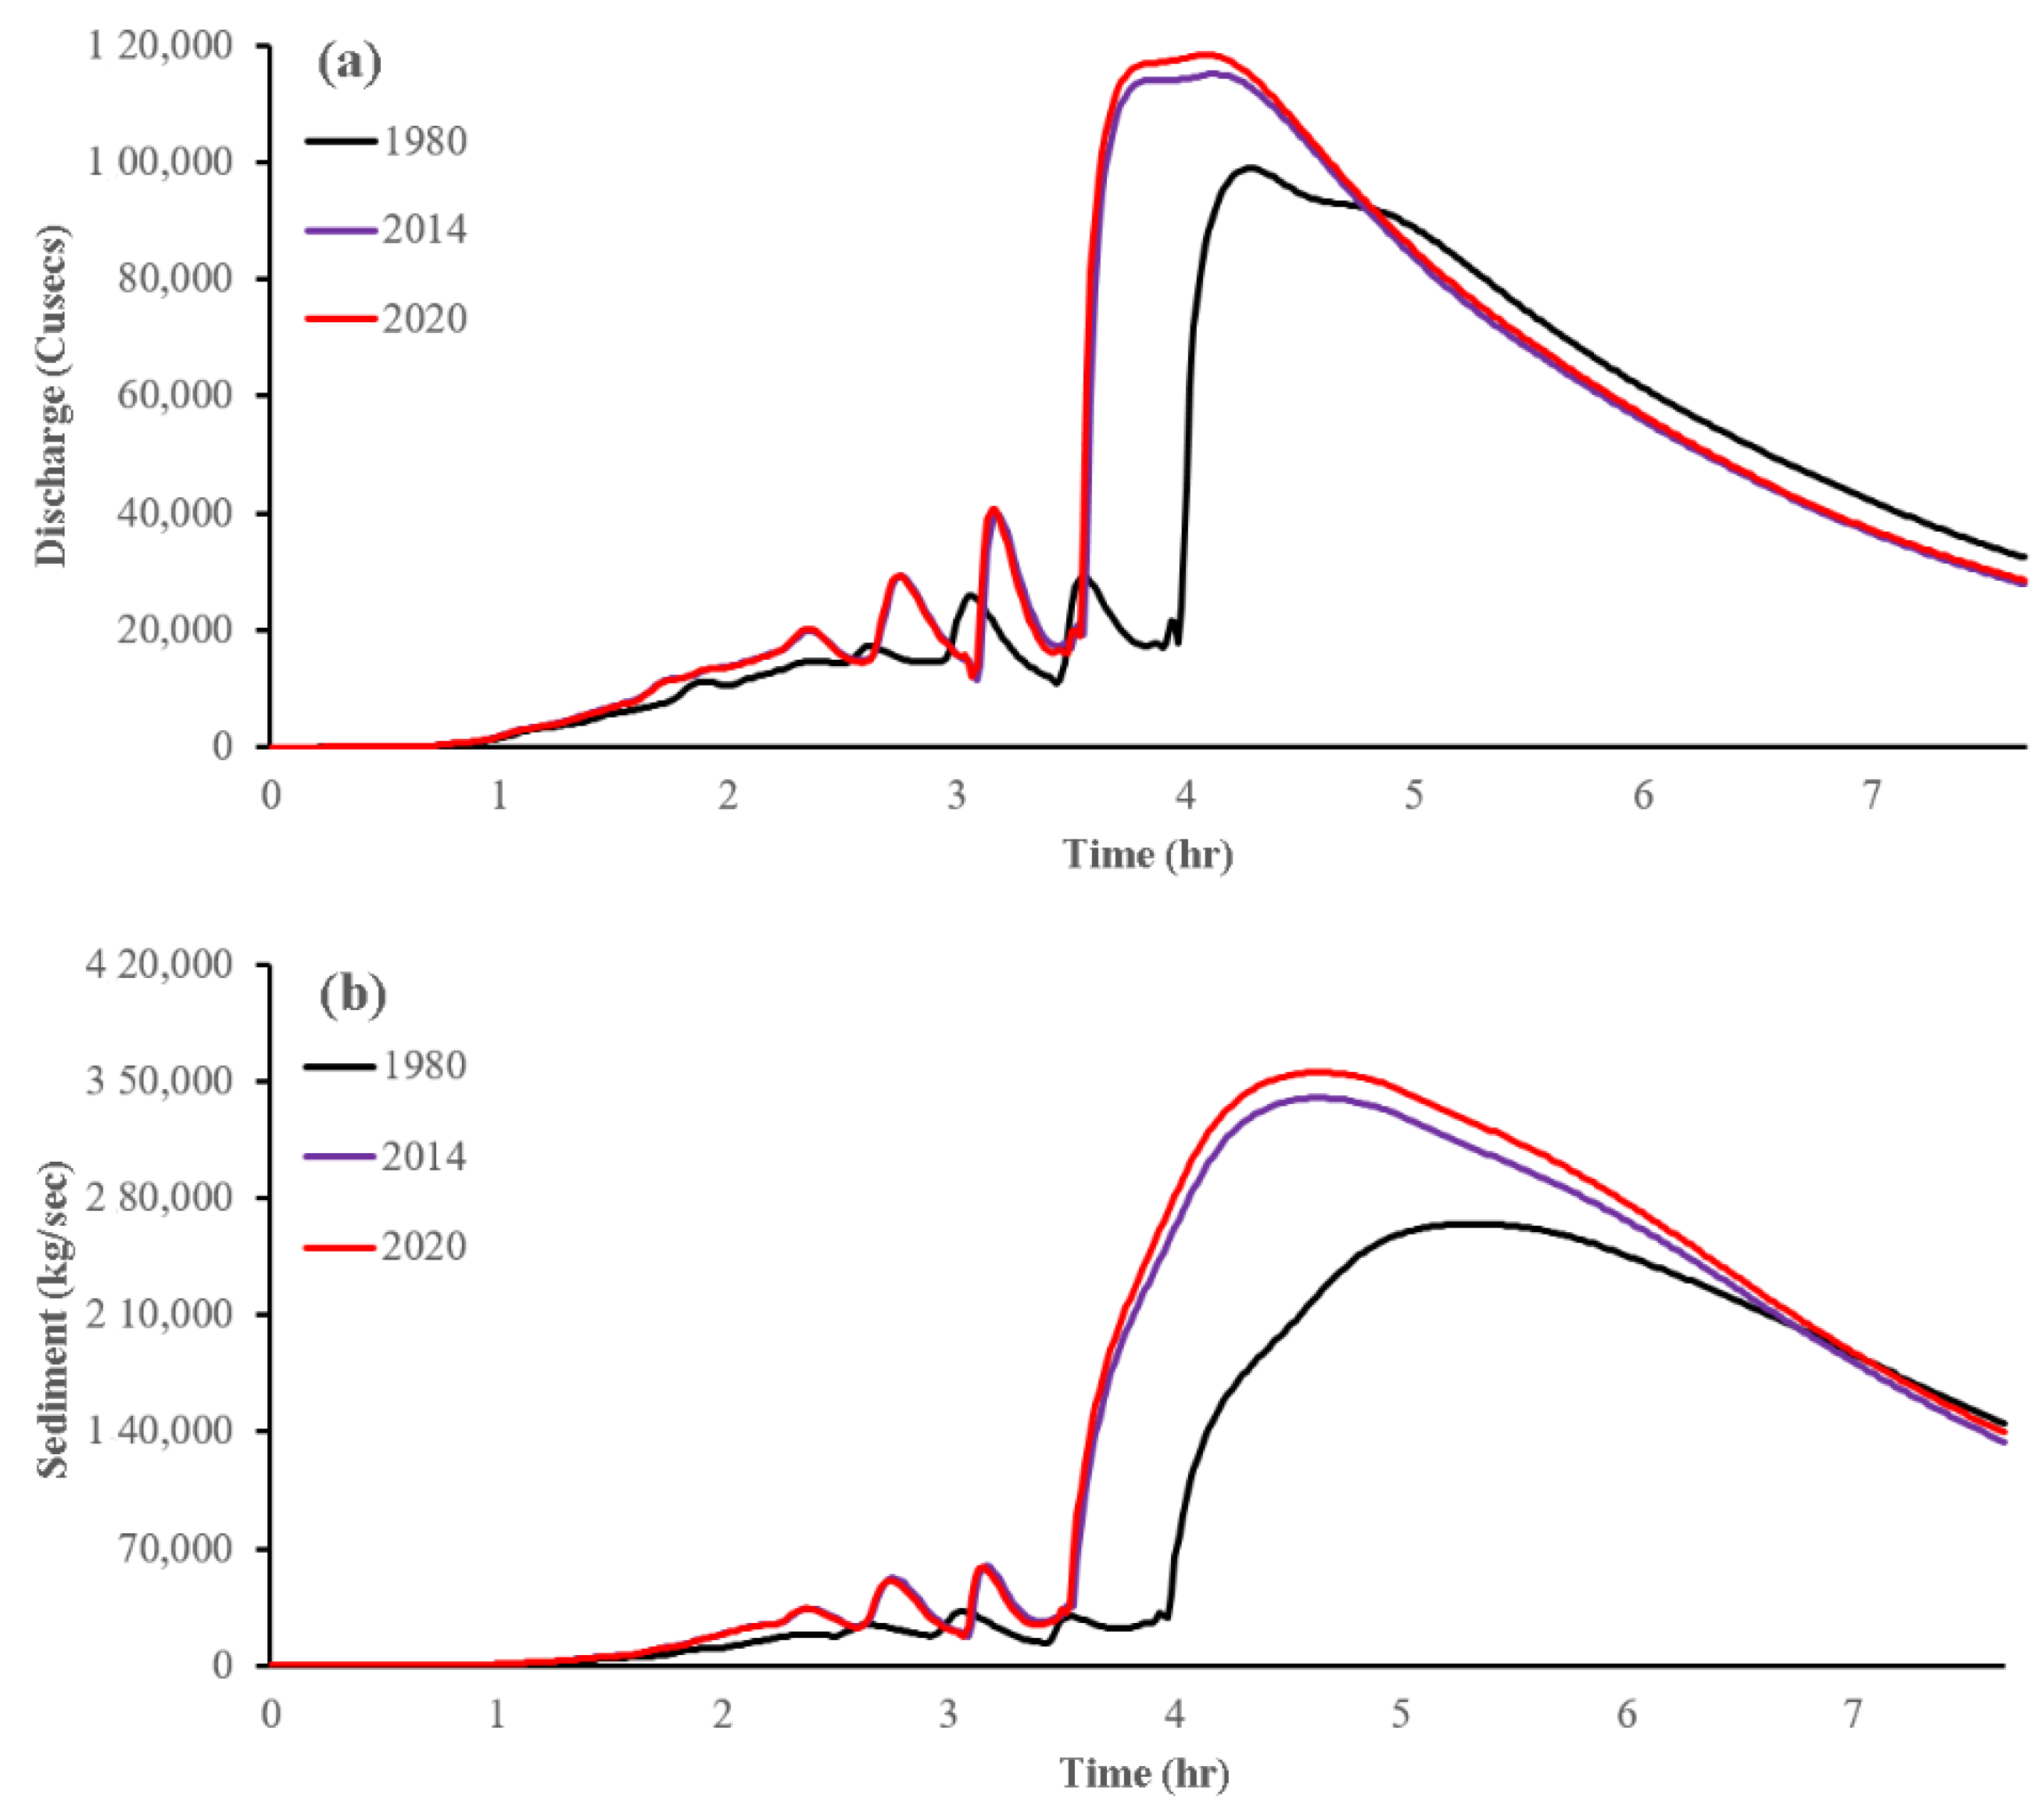
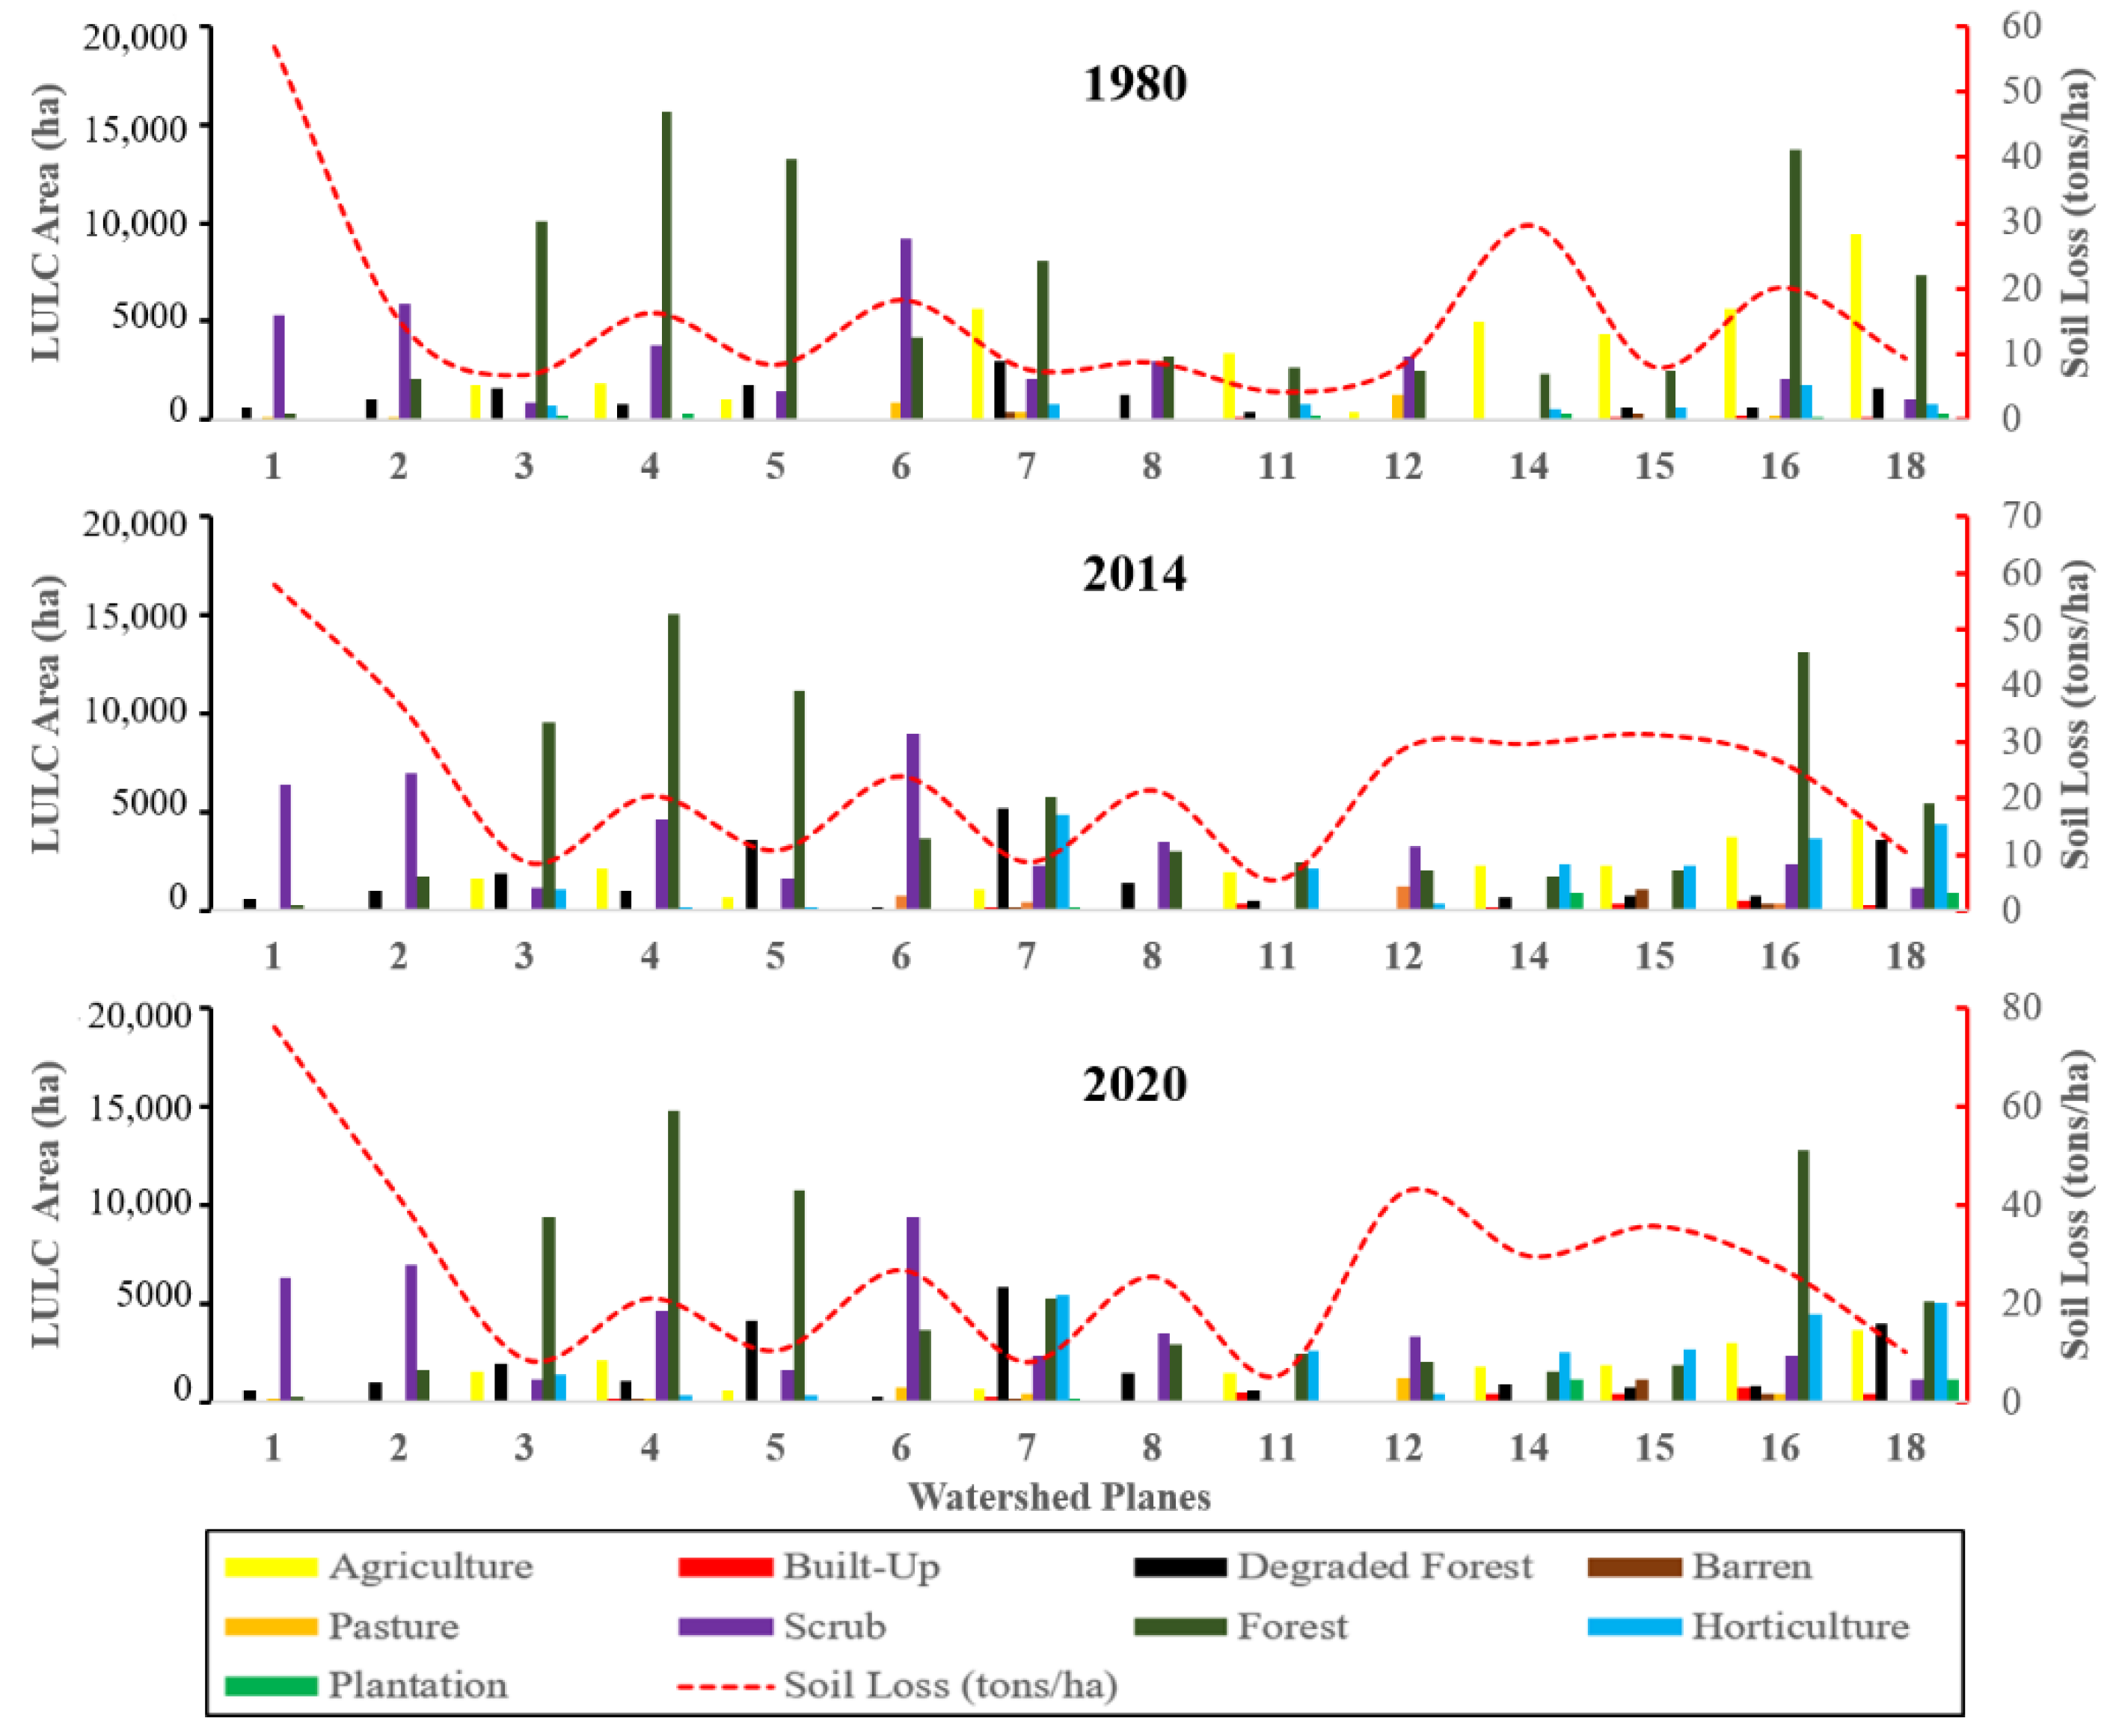
3.2. Runoff, Soil Loss, and Sediment Yield

Sensitivity analysis of the model showed that the model is very sensitive to the changes in the saturated hydraulic conductivity (Ks) and the Manning’s coefficient (n), both of which have a significant impact on surface runoff generation [89,90]. Based on the model calibration, it was obvious that despite close matches found between observed and simulated peak discharge as shown in Table 4 which was run using 2014 LULC data, the model did not accurately predict the falling peak of one of the high-intensity events on 5th of September. The simulated changes in runoff resulting from the land cover changes are shown in Figure 4, which also indicates the positive and negative changes in runoff volume (Figure 4a,c). It is important to note that the study area exhibits an increasing runoff tendency which varied between 2% and 22% in the streams and 1% to 19% at the UJB level between 1980 and 2014, though, some negative changes in some planes were also observed as seen in Figure 4a. Furthermore, the runoff has increased from +0.03% to +18% from 2014 to 2020 in the UJB, with a negative change of −3% to −1% in planes and channels, respectively, as shown in Figure 4c. Overall, the average runoff in the catchment has changed from 22.52 mm in 1980, to 23.42 mm in 2014, and 23.61 mm in 2020, mainly due to the transition of LULC classes from natural vegetation cover to bare lands and urban areas driven by anthropogenic activities.
Peak discharge with respect to the 6 September 2014 storm event is predicted to have increased from 115,101 cfs to 118,366 cfs in 2020, indicating an increase of 2.8% in the peak discharge, as shown in Figure 5a. Peak discharge for the same rainfall event simulated in 1980 decreased to 98,965 cfs, showing a 16% reduction in the peak discharge under 1980 LULC scenario.
The simulated change in sediment yield in response to the LULC changes from 1980 to 2020 are depicted in Figure 4b,d, which indicates both positive and negative changes in the UJB. Sediment yield increased from +5.8% to +52% in the streams and +0.3% to +74% in the planes as shown in Figure 4b during 1980 to 2014 and from +3.2% to +14% in the streams and +0.84% to +18% in the planes during 2014 to 2020 (Figure 4d), with few negative changes in some planes and streams. In absolute terms, the sediment yield increased from 334.6 tons s−1 in 2014 to 349.6 tons s−1 in 2020, showing an increase of 4.5% during the period as shown in Figure 5b. However, as per the model simulations sediment yield in 1980 in response to the extreme rainfall event (of the magnitude witnessed in September 2014) was 260.6 tons s−1, indicating a reduction of 28% in the sediment yield. It is evident from the results that the variation in the peak discharge and sediment yield due to the LULC changes significantly influences the production of sediment load from 1980 to 2020 in the basin.
The spatial and temporal assessment of soil loss in the basin during 1980, 2014, and 2020 is displayed as a dot density map (Figure 3a–c), with each dot representing 4000 kg ha−1 of soil loss. Figure 6 depicts the soil loss for each LULC class in the study area. Scrublands showed an increased soil erosion by 11.87% from 1980 to 2014 and 0.19% from 2014 to 2020. Degradation of forests showed an increased soil loss of 62.6% between 1980 and 2014 and a further increase of 8.7% between 2014 and 2020. Scrublands and degraded forests had the maximum soil erosion rates, showing a consistently increasing trend from 1980 to 2020. Degraded forests situated on denudated and steep slopes with little tree cover are directly exposed to the raindrop impact which accelerates the detachment, removal, and transportation of soil particles resulting in enhanced soil erosion. Similarly, barren lands showed an 11.67% increase in soil erosion between 1980 and 2014 and 6.27% between 2014 and 2020.
However, forests showed a decrease of 12.5% in soil erosion production from 1980 to 2014 and a further reduction of 3.82% from 2014 to 2020, which only implies that there has been a significant loss of forest area in the study region which is collaborated from the significant loss of forest cover (5.54%) in the study area since 1980. The forests and horticulture LULC types had the lowest per unit area soil loss rates. However, forest cover has declined over the period, whereas horticulture has significantly increased between 1980 and 2020 as depicted in Figure 7. Forests all over showed lower erosion rates in 1980, 2014, and 2020 with an average of 5.11 tons ha−1, whereas some planes showed erosion rates greater than 10 ton ha−1. The varying magnitude and spatial variation of erosion in the study area from 1980 to 2020 is due to the changing LULC as evident from the perusal of the information in Figure 6 and Figure 7. It is noteworthy that there is even slightly low erosion under built-up category due to the presence of some non-concrete roads, railways, and other non-concrete spaces associated with built-up in the study area.
This variation occurred due to the transition of one LULC class into another between 1980 and 2020 with the natural land cover types such as forests increasingly being converted into anthropogenic LULC having higher potential for soil erosion. The dot density maps clearly show that soil erosion is higher in the north and north-eastern parts of the UJB, which have steep slopes devoid of any significant vegetal cover.

4. Discussion

Large scale expansion of horticulture, urbanization, and degradation of forests in the study area are the most notable LULC changes, leading to the loss of agriculture and forests from 1980 to 2020. The expansion of horticulture is primarily driven by economic considerations as fruit crops fetch higher economic returns to the farmers compared to the paddy cultivation [91]. The significant expansion in settlements in the study area has occurred at the expense of agriculture, horticulture, and even forests. This has led to significant increase in impervious surfaces, which impede infiltration, and thus boasting storm runoff in the event of heavy rainfall in the basin [92]. Furthermore, the increase in population and the consequent need for housing and other required infrastructure, expansion of economic activities, and other related LULC processes are responsible for the urbanization witnessed in the basin. Similarly, deforestation has reduced tree density in the forest, thereby increasing the surface runoff and soil erosion rates from degraded forests [93]. The estimated soil loss from each LULC type varies depending upon several factors such as vegetation cover extent and type, slope, soil properties, and social economic setting [94]. Analysis of the LULC data provided in Table 3 shows that the land system has changed significantly between 1980 and 2020 in the basin.
Due to the mountainous topography, the UJB is prone to multiple natural hazards such as avalanches, flooding, cloud bursts, and landslides [95]; the settlements are mostly confined to the plains and along the river courses. The LULC changes bring about consequential changes in the roughness, particularly the increase in the built environment enhancing surface runoff and even flooding, if, the streamflow exceeds bank full discharge of a river [96,97]. That is exactly like what happened during the September 2014 flood event. To gain a better insight into the potential impacts of such changes, hydrodynamic-numerical modelling was employed as it serves as an appropriate tool to investigate the effects of different scenarios of LULC changes on flooding characteristics. The extent and location of natural land cover influences the amount of energy that is available to displace more water and materials [98]. Basins with a good forest cover are able to accommodate and handle energy associated with rainfall better than those having significant proportion of bare land and human settlements [99]. The UJB has tremendous hydrological importance due to its direct effect and potential to influence hydrological regime, flood volumes, and soil erosion downstream of the Sangam [12,100,101]. The high anthropogenic pressure on LULC due to population growth and infrastructure development, determines the magnitude and patterns of land system changes that many basins undergo these days [102,103]. Generally, the continuing loss of natural cover, especially in the mountainous regions where land is a scarce resource, imposes a great challenge on flood risk management [104]. Moreover, extreme precipitation events caused by climate change [12], usually exceeds the energy threshold of rains falling on denuded lands, causing huge volumes of sediment detachment and transportation from a degraded catchment [105,106]. Anthropogenic landscape changes are more likely to have a profound influence on land surface processes related to hydrology and erosion in the event of extreme rainfall, the probability of which is increasing in the basin under changing climate. To accommodate and absorb excess runoff, non-structural measures such as the restoration of degraded forests is imperative as a part of the comprehensive catchment management strategies [107].
Due to the expansion of settlements and the associated built-up urban infrastructure such as roads, highways, railways, etc., the proportion of the impervious surfaces has significantly increased, thereby adversely affecting the vulnerability of basin to storm run-off and overland flow with the consequent increase in the sediment yield transported out of the basin [108,109]. Basin areas covered with highly erodible soils are more susceptible to soil loss and sediment delivery to streams than those with non-erodible soils [9,110] as rain drops have the ability to accelerate the displacement, separation, removal, and movement of soil particles from denuded and deforested slopes [98]. Furthermore, the expansion of scrublands to the previously forested steep slopes, exposed these lands to direct impact of raindrop that aided the erosion of the top soil layer [12]. This entire scenario facilitates the transport and deposition of the eroded sediments into the streams, water courses and water bodies leading to their sedimentation, thus increasing the vulnerability of floodplains to flood inundation [111,112]. The flood situation becomes worse due to the inadequate and deteriorating flood control infrastructure and institutional weaknesses to manage the magnitude of heavy flooding [12]. Deteriorated flood control infrastructure, shrinking wetlands, deforestation, rapid urbanization of Jhelum floodplains, and siltation of watercourses seen over the last few decades have reduced the environment’s ability to absorb excess rainwater in the Jhelum basin [113], thus increasing the basin’s vulnerability to flooding [11].

5. Conclusions

The study demonstrated the usefulness of integrating remote sensing, GIS, and field observations with a distributed hydrological model in the GIS environment for simulating a hydrological response to an extreme precipitation event under changing LULC at a catchment scale. The land system has undergone significant changes in the basin since 1980. The increase in the impervious area due to the built-up expansion have altered the natural hydrology and infiltration properties of the soils in catchments. Deforestation and land degradation, particularly in mountainous catchments, alter the soil’s physical properties and thus give a flip to runoff generation, erosion, and the sedimentation processes.
The KINEROS2 model predicted the 2014 peak flood discharge very well, despite not accurately capturing the falling peak of the flood hydrograph. The results were generated using different data land use maps on a single validated event on 6th September 2014. The significant LULC changes in the basin from 1980 to 2020, particularly the dwindling agriculture and degraded forests, urbanization, and horticulture expansion have significantly affected the hydrological response of the basin to extreme rainfall events. In the event of heavy rainfall, the storm runoff generation and subsequent peak discharge in the basin showed an increase compared to 1980. The increasing trend of the peak discharges, sediment yield, and erosion rates predicted in 2020 is due to the land system changes that have occurred in the basin since 1980 such as built-up expansion, forest degradation, and agriculture loss indicating have significantly enhanced the probability of flooding in the basin. The research revealed that the average runoff volume has increased from 22.52 mm in 1980 to 23.42 mm in 2014, and 23.61 mm in 2020. The sediment yield in the planes of the basin increased from 49.11 tons ha−1 in 1980 to 56.59 tons ha−1 in 2014, and 58.92 tons ha−1 in 2020.
These findings from this work indicate significant alterations in the catchment hydrological and land surface processes, which can have disastrous consequences for the public property and life in the eventuality of an extreme rainfall event in the near future, which have become more frequent in the basin due to climate change. Therefore, there is a need to regulate the land system changes in the basin with a focus to increase vegetal cover, conserve soil and land resources, and encourage infiltration-friendly urban planning to minimize flood peak and volume and reduce sediment yield and erosion from the catchments in the eventuality of an extreme weather event. This would increase the resilience of people and places to natural hazards and climate change, which is critical for realizing many Sustainable Development Goals.

Author Contributions

Conceptualization, S.A.R. and A.Y.; methodology, S.A.R. and A.Y.; software, A.Y.; validation, S.A.R. and A.Y.; formal analysis, S.A.R.; investigation, A.Y.; resources, S.A.R.; data curation, A.Y.; writing—original draft preparation, S.A.R. and A.Y.; writing—review and editing, S.A.R., visualization, S.A.R.; project administration, S.A.R.; funding acquisition, S.A.R. All authors have read and agreed to the published version of the manuscript.

Funding

This research received no external funding.

Data Availability Statement

Not applicable.

Acknowledgments

The research work was carried out as part of the Ministry of Education, Government of India, Rashtriya Uchchatar Shiksha Abhiyan (RUSA), sponsored research project titled “Strengthening the Innovative Research in Geomatics, Climate Change, and Hydrology”. We gratefully recognize the financial support provided by the project’s sponsors. The authors thank the Journal for providing an APC waiver for this paper. The four anonymous reviewers are acknowledged by the authors for their comments and suggestions, which improved the quality of the manuscript. Sincere gratitude is extended by the authors to Shea Burns (USDA/ARS) for his help, encouragement, and sharing of knowledge regarding the KINEROS2 model.

Conflicts of Interest

The authors declare no conflict of interest.

References

  1. García-Ruiz, J.M.; Regüés, D.; Alvera, B.; Lana-Renault, N.; Serrano-Muela, P.; Nadal-Romero, E.; Navas, A.; Latron, J.; Martí-Bono, C.; Arnáez, J. Flood Generation and Sediment Transport in Experimental Catchments Affected by Land Use Changes in the Central Pyrenees. J. Hydrol. 2008, 356, 245–260. [Google Scholar] [CrossRef] [Green Version]
  2. Zhang, S.; Lu, X.X.; Higgitt, D.L.; Chen, C.-T.A.; Han, J.; Sun, H. Recent Changes of Water Discharge and Sediment Load in the Zhujiang (Pearl River) Basin, China. Glob. Planet. Chang. 2008, 60, 365–380. [Google Scholar] [CrossRef]
  3. Zhang, X.; Wenhong, C.; Qingchao, G.; Sihong, W. Effects of Landuse Change on Surface Runoff and Sediment Yield at Different Watershed Scales on the Loess Plateau. Int. J. Sediment Res. 2010, 25, 283–293. [Google Scholar] [CrossRef]
  4. Vörösmarty, C.J.; McIntyre, P.B.; Gessner, M.O.; Dudgeon, D.; Prusevich, A.; Green, P.; Glidden, S.; Bunn, S.E.; Sullivan, C.A.; Liermann, C.R. Global Threats to Human Water Security and River Biodiversity. Nature 2010, 467, 555–561. [Google Scholar] [CrossRef] [PubMed] [Green Version]
  5. Conacher, A.J.; Sala, M. Land Degradation in Mediterranean Environments of the World: Nature and Extent, Causes and Solutions; John Wiley and Sons Ltd.: Hoboken, NJ, USA, 1998. [Google Scholar]
  6. Morton, R.A. Geoindicators of Coastal Wetlands and Shorelines. In Proceedings of the Geoindicators: Assessing Rapid Environmental Changes in Earth Systems, 1996; pp. 207–230. Available online: https://pascal-francis.inist.fr/vibad/index.php?action=getRecordDetail&idt=6310962 (accessed on 23 July 2022).
  7. Reynard, N.S.; Prudhomme, C.; Crooks, S.M. The Flood Characteristics of Large UK Rivers: Potential Effects of Changing Climate and Land Use. Clim. Chang. 2001, 48, 343–359. [Google Scholar] [CrossRef]
  8. Yanmaz, A.M.; Usul, N. Assessment of Flood Induced Problems of Urbanized Areas in Turkey. 1999. Available online: https://open.metu.edu.tr/handle/11511/78307 (accessed on 23 July 2022).
  9. Zaz, S.N.; Romshoo, S.A. Assessing the Geoindicators of Land Degradation in the Kashmir Himalayan Region, India. Nat. Hazards 2012, 64, 1219–1245. [Google Scholar] [CrossRef]
  10. Ullah, I.; Saleem, F.; Iyakaremye, V.; Yin, J.; Ma, X.; Syed, S.; Hina, S.; Asfaw, T.G.; Omer, A. Projected Changes in Socioeconomic Exposure to Heatwaves in South Asia under Changing Climate. Earth’s Future 2022, 10, e2021EF002240. [Google Scholar] [CrossRef]
  11. Meraj, G.; Romshoo, S.A.; Yousuf, A.R.; Altaf, S.; Altaf, F. Assessing the Influence of Watershed Characteristics on the Flood Vulnerability of Jhelum Basin in Kashmir Himalaya. Nat. Hazards 2015, 77, 153–175. [Google Scholar] [CrossRef]
  12. Romshoo, S.A.; Amin, M.; Ahmad, I.; Sastry, K. Soil Erosion Estimation of Lidder Watershed, Kashmir Himalaya Using Morgan-Morgan-Finney Model in GIS Environment. J. Himal. Ecol. Sustain. Dev. 2016, 11, 3–20. [Google Scholar]
  13. Hassan, Z.u.; Shah, J.A.; Kanth, T.A.; Pandit, A.K. Influence of Land Use/Land Cover on the Water Chemistry of Wular Lake in Kashmir Himalaya (India). Ecol. Process. 2015, 4, 9. [Google Scholar] [CrossRef] [Green Version]
  14. Oza, G.M. Destruction of forests and wildlife in the Kashmir wilderness. Environmentalist 2003, 23, 189–192. [Google Scholar] [CrossRef]
  15. Rather, M.I.; Rashid, I.; Shahi, N.; Murtaza, K.O.; Hassan, K.; Yousuf, A.R.; Romshoo, S.A.; Shah, I.Y. Massive Land System Changes Impact Water Quality of the Jhelum River in Kashmir Himalaya. Environ. Monit. Assess. 2016, 188, 185. [Google Scholar] [CrossRef] [PubMed]
  16. World Bank World Bank. Environment and Social Management Framework, Jhelum and Tawi Flood Recovery Project; Project Management Unit, J&T FRP, Government of Jammu and Kashmir: Srinagar, India, 2015. [Google Scholar]
  17. Ray, K.; Bhan, S.C.; Bandopadhyay, B.K. The Catastrophe over Jammu and Kashmir in September 2014: A Meteorological Observational Analysis. Curr. Sci. 2015, 109, 580–591. [Google Scholar]
  18. Wu, F.; Zhan, J.; Xu, Q.; Xiong, Y.; Sun, Z. A Comparison of Two Land Use Simulation Models under the RCP4. 5 Scenario in China. Adv. Meteorol. 2013, 2013. [Google Scholar] [CrossRef] [Green Version]
  19. Wang, G.; Liu, J.; Kubota, J.; Chen, L. Effects of Land-Use Changes on Hydrological Processes in the Middle Basin of the Heihe River, Northwest China. Hydrol. Process. 2007, 21, 1370–1382. [Google Scholar] [CrossRef]
  20. Blöschl, G.; Ardoin-Bardin, S.; Bonell, M.; Dorninger, M.; Goodrich, D.; Gutknecht, D.; Matamoros, D.; Merz, B.; Shand, P.; Szolgay, J. At What Scales Do Climate Variability and Land Cover Change Impact on Flooding and Low Flows? Hydrol. Process. 2007, 21, 1241–1247. [Google Scholar] [CrossRef]
  21. Fredj, E.; Silver, M.; Givati, A. An Integrated Simulation and Distribution System for Early Flood Warning. Int. J. Comput. Inf. Technol. 2015, 4, 517–526. [Google Scholar]
  22. Kidane, Y.; Stahlmann, R.; Beierkuhnlein, C. Vegetation Dynamics, and Land Use and Land Cover Change in the Bale Mountains, Ethiopia. Environ. Monit. Assess. 2012, 184, 7473–7489. [Google Scholar] [CrossRef]
  23. Rozenstein, O.; Karnieli, A. Comparison of Methods for Land-Use Classification Incorporating Remote Sensing and GIS Inputs. Appl. Geogr. 2011, 31, 533–544. [Google Scholar] [CrossRef]
  24. Ghaffari, G.; Keesstra, S.; Ghodousi, J.; Ahmadi, H. SWAT-Simulated Hydrological Impact of Land-Use Change in the Zanjanrood Basin, Northwest Iran. Hydrol. Process. Int. J. 2010, 24, 892–903. [Google Scholar] [CrossRef]
  25. He, H.; Zhou, J.; Zhang, W. Modelling the Impacts of Environmental Changes on Hydrological Regimes in the Hei River Watershed, China. Glob. Planet. Chang. 2008, 61, 175–193. [Google Scholar] [CrossRef]
  26. Li, Z.; Liu, W.; Zhang, X.; Zheng, F. Impacts of Land Use Change and Climate Variability on Hydrology in an Agricultural Catchment on the Loess Plateau of China. J. Hydrol. 2009, 377, 35–42. [Google Scholar] [CrossRef]
  27. Nearing, M.A.; Jetten, V.; Baffaut, C.; Cerdan, O.; Couturier, A.; Hernandez, M.; Le Bissonnais, Y.; Nichols, M.H.; Nunes, J.P.; Renschler, C.S. Modeling Response of Soil Erosion and Runoff to Changes in Precipitation and Cover. Catena 2005, 61, 131–154. [Google Scholar] [CrossRef]
  28. Ouyang, W.; Skidmore, A.K.; Hao, F.; Wang, T. Soil Erosion Dynamics Response to Landscape Pattern. Sci. Total Environ. 2010, 408, 1358–1366. [Google Scholar] [CrossRef] [PubMed]
  29. Nut, N.; Mihara, M.; Jeong, J.; Ngo, B.; Sigua, G.; Prasad, P.V.V.; Reyes, M.R. Land Use and Land Cover Changes and Its Impact on Soil Erosion in Stung Sangkae Catchment of Cambodia. Sustainability 2021, 13, 9276. [Google Scholar] [CrossRef]
  30. Choi, W.; Deal, B.M. Assessing Hydrological Impact of Potential Land Use Change through Hydrological and Land Use Change Modeling for the Kishwaukee River Basin (USA). J. Environ. Manag. 2008, 88, 1119–1130. [Google Scholar] [CrossRef]
  31. Kliot, N. Man’s Impact on River Basins: An Israeli Case Study. Appl. Geogr. 1986, 6, 163–178. [Google Scholar] [CrossRef]
  32. Issa, O.M.; Valentin, C.; Rajot, J.-L.; Cerdan, O.; Desprats, J.-F.; Bouchet, T. Runoff Generation Fostered by Physical and Biological Crusts in Semi-Arid Sandy Soils. Geoderma 2011, 167, 22–29. [Google Scholar] [CrossRef]
  33. Zhang, Y.; Shuster, W. Impacts of Spatial Distribution of Impervious Areas on Runoff Response of Hillslope Catchments: Simulation Study. J. Hydrol. Eng. 2014, 19, 1089–1100. [Google Scholar] [CrossRef]
  34. O’Connell, P.E.; Ewen, J.; O’Donnell, G.; Quinn, P. Is There a Link between Agricultural Land-Use Management and Flooding? Hydrol. Earth Syst. Sci. 2007, 11, 96–107. [Google Scholar] [CrossRef] [Green Version]
  35. Slocum, T.; McMaster, R.; Kessler, F.; Howard, H. Thematic Cartography and Geographic Visualization; Pearson/Prentice Hall: Upper Saddle River, NJ, USA, 2009; ISBN 978-0-13-229834-6. [Google Scholar]
  36. Bogardi, J.J.; Leentvaar, J.; Nachtnebel, H.P. GWSP River Basins and Change; UNESCO, Brahmer, G., Braun, M., Bremicker, M., Buiteveld, H., Busch, N., Engel, H., Hammer, M., Hodel, H., Junod, P., Eds.; UNESCO: Delft, The Netherlands, 2012. [Google Scholar]
  37. Dar, R.A.; Mir, S.A.; Romshoo, S.A. Influence of Geomorphic and Anthropogenic Activities on Channel Morphology of River Jhelum in Kashmir Valley, NW Himalayas. Quat. Int. 2018, 507, 333–341. [Google Scholar] [CrossRef]
  38. Milliman, J.D.; Farnsworth, K.L.; Jones, P.D.; Xu, K.H.; Smith, L.C. Climatic and Anthropogenic Factors Affecting River Discharge to the Global Ocean, 1951–2000. Glob. Planet. Chang. 2008, 62, 187–194. [Google Scholar] [CrossRef]
  39. Tiwari, P.C. Land-Use Changes in Himalaya and Their Impact on the Plains Ecosystem: Need for Sustainable Land Use. Land Use Policy 2000, 17, 101–111. [Google Scholar] [CrossRef]
  40. Altaf, S.; Meraj, G.; Romshoo, S.A. Morphometry and Land Cover Based Multi-Criteria Analysis for Assessing the Soil Erosion Susceptibility of the Western Himalayan Watershed. Environ. Monit. Assess. 2014, 186, 8391–8412. [Google Scholar] [CrossRef] [PubMed]
  41. Ali, K.F.; De Boer, D.H. Spatial Patterns and Variation of Suspended Sediment Yield in the Upper Indus River Basin, Northern Pakistan. J. Hydrol. 2007, 334, 368–387. [Google Scholar] [CrossRef]
  42. Sinha, R. The Great Avulsion of Kosi on 18 August 2008. Curr. Sci. 2009, 97, 429–433. [Google Scholar]
  43. Walling, D.E. The Changing Sediment Load of the Mekong River. Ambio 2008, 37, 150–157. [Google Scholar] [CrossRef]
  44. Bartarya, S.K.; Valdiya, K.S. Landslides and Erosion in the Catchment of the Gaula River, Kumaun Lesser Himalaya, India. Mt. Res. Dev. 1989, 9, 405–419. [Google Scholar] [CrossRef]
  45. Nasir Ahmad, N.S.B.; Firuza, M.; Muhammad Yusoff, S.; Gideon, D. A Systematic Review of Soil Erosion Control Practices on the Agricultural Land in Asia. Int. Soil Water Conserv. Res. 2020, 8, 103–115. [Google Scholar] [CrossRef]
  46. Pimentel, D.; Harvey, C.; Resosudarmo, P.; Sinclair, K.; Kurz, D.; McNair, M.; Crist, S.; Shpritz, L.; Fitton, L.; Saffouri, R. Environmental and Economic Costs of Soil Erosion and Conservation Benefits. Science 1995, 267, 1117–1123. [Google Scholar] [CrossRef] [Green Version]
  47. UNEPI. World Map on Status of Human-Induced Soil Degradation; Boom-Ruygrok: Harllem, The Netherlands, 1990. [Google Scholar]
  48. Jain, S.K.; Kumar, S.; Varghese, J. Estimation of Soil Erosion for a Himalayan Watershed Using GIS Technique. Water Resour. Manag. 2001, 15, 41–54. [Google Scholar] [CrossRef]
  49. Meraj, G.; Romshoo, S.A.; Ayoub, S.; Altaf, S. Geoinformatics Based Approach for Estimating the Sediment Yield of the Mountainous Watersheds in Kashmir Himalaya, India. Geocarto Int. 2018, 33, 1114–1138. [Google Scholar] [CrossRef]
  50. Omer, A.; Elagib, N.A.; Zhuguo, M.; Saleem, F.; Mohammed, A. Water Scarcity in the Yellow River Basin under Future Climate Change and Human Activities. Sci. Total Environ. 2020, 749, 141446. [Google Scholar] [CrossRef] [PubMed]
  51. Romshoo, S.A.; Bashir, J.; Rashid, I. Twenty-First Century-End Climate Scenario of Jammu and Kashmir Himalaya, India, Using Ensemble Climate Models. Clim. Chang. 2020, 162, 1473–1491. [Google Scholar] [CrossRef]
  52. Mahmoud, S.H.; Gan, T.Y. Urbanization and Climate Change Implications in Flood Risk Management: Developing an Efficient Decision Support System for Flood Susceptibility Mapping. Sci. Total Environ. 2018, 636, 152–167. [Google Scholar] [CrossRef]
  53. Remondi, F.; Burlando, P.; Vollmer, D. Exploring the Hydrological Impact of Increasing Urbanisation on a Tropical River Catchment of the Metropolitan Jakarta, Indonesia. Sustain. Cities Soc. 2016, 20, 210–221. [Google Scholar] [CrossRef]
  54. Azimi Sardari, M.R.; Bazrafshan, O.; Panagopoulos, T.; Sardooi, E.R. Modeling the Impact of Climate Change and Land Use Change Scenarios on Soil Erosion at the Minab Dam Watershed. Sustainability 2019, 11, 3353. [Google Scholar] [CrossRef] [Green Version]
  55. Pall, P.; Patricola, C.M.; Wehner, M.F.; Stone, D.A.; Paciorek, C.J.; Collins, W.D. Diagnosing Conditional Anthropogenic Contributions to Heavy Colorado Rainfall in September 2013. Weather Clim. Extrem. 2017, 17, 1–6. [Google Scholar] [CrossRef]
  56. United Nations. Transforming Our World: The 2030 Agenda for Sustainable Development; United Nations: New York, NY, USA, 2015.
  57. Rashid, M.; Lone, M.A.; Romshoo, S.A. Geospatial Tools for Assessing Land Degradation in Budgam District, Kashmir Himalaya, India. J. Earth Syst. Sci. 2011, 120, 423–433. [Google Scholar] [CrossRef]
  58. Romshoo, S.A.; Altaf, S.; Amin, M.; Ameen, U. Sediment Yield Estimation for Developing Soil Conservation Strategies in GIS Environment for the Mountainous Marusudar Catchment, Chenab Basin, J&K, India. J. Himal. Ecol. Sustain. Dev. 2017, 12, 16–32. [Google Scholar]
  59. Sorooshian, S.; Gupta, V.K. Model Calibration. Comput. Model. Watershed Hydrol. 1995, 1, 23–68. [Google Scholar]
  60. Raza, M.; Ahmad, A.; Mohammad, A. The Valley of Kashmir a Geographical Interpretations; The Land; Vikas Publishing House: New Delhi, India, 1978; Volume 1. [Google Scholar]
  61. Dad, J.M.; Muslim, M.; Rashid, I.; Reshi, Z. Time Series Analysis of Climate Variability and Trends in Kashmir Himalaya. Ecol. Indic. 2021, 126, 107690. [Google Scholar] [CrossRef]
  62. Dar, R.A.; Chandra, R.; Romshoo, S.A.; Lone, M.A.; Ahmad, S.M. Isotopic and Micromorphological Studies of Late Quaternary Loess–Paleosol Sequences of the Karewa Group: Inferences for Palaeoclimate of Kashmir Valley. Quat. Int. 2015, 371, 122–134. [Google Scholar] [CrossRef]
  63. Agrawal, D.P. Palaeoclimatic Data from Kashmir: A Synthesis and Some Correlations. Proc. Indian Natl. Sci. Acad. Part A Phys. Sci. 1988, 54, 333–342. [Google Scholar]
  64. Agrawal, D.P.; Dodia, R.; Kotlia, B.S.; Razdan, H.; Sahni, A. The Plio-Pleistocene Geologic and Climatic Record of the Kashmir Valley, India: A Review and New Data. Palaeogeogr. Palaeoclimatol. Palaeoecol. 1989, 73, 267–286. [Google Scholar] [CrossRef]
  65. Qadri, H.; Dar, I. A preliminary study on the changing patterns of temperature and precipitation of srinagar, kashmir, india. Int. Res. J. Mod. Eng. Technol. Sci. 2021, 2, 2582–5208. [Google Scholar]
  66. Zaz, S.N.; Romshoo, S.A. Recent Variation In Temperature Trends In Kashmir Valley (India). J. Himal. Ecol. Sustain. Dev. 2013, 8, 42–63. [Google Scholar]
  67. FAO. Soil Map of the World: Revised Legend; ISRIC: Wageningen, The Netherlands, 1988; p. 60. [Google Scholar]
  68. Rasool, R.; Fayaz, A.; Shafiq, M.U.; Singh, H.; Ahmed, P. Land Use Land Cover Change in Kashmir Himalaya: Linking Remote Sensing with an Indicator Based DPSIR Approach. Ecol. Indic. 2021, 125, 107447. [Google Scholar] [CrossRef]
  69. Semmens, D.J.; Goodrich, D.C.; Unkrich, C.L.; Smith, R.E.; Woolhiser, D.A.; Miller, S.N. KINEROS2 and the AGWA Modeling Framework. In Hydrological Modelling in Arid and Semi-Arid Areas; Cambridge University Press: Cambridge, UK, 2008. [Google Scholar]
  70. Woolhiser, D.A.; Smith, R.E.; Goodrich, D.C. KINEROS: A Kinematic Runoff and Erosion Model: Documentation and User Manual; US Dept. of Agriculture, Agricultural Research Service: Washington, DC, USA, 1990. [Google Scholar]
  71. Smith, R.E.; Goodrich, D.C.; Unkrich, C.L. Simulation of Selected Events on the Catsop Catchment by KINEROS2: A Report for the GCTE Conference on Catchment Scale Erosion Models. Catena 1999, 37, 457–475. [Google Scholar] [CrossRef]
  72. Saran, S.; Sterk, G.; Aggarwal, S.P.; Dadhwal, V.K. Coupling Remote Sensing and GIS with KINEROS2 Model for Spatially Distributed Runoff Modeling in a Himalayan Watershed. J. Indian Soc. Remote Sens. 2021, 49, 1121–1139. [Google Scholar] [CrossRef]
  73. Hernandez, M.; Miller, S.N.; Goodrich, D.C.; Goff, B.F.; Kepner, W.G.; Edmonds, C.M.; Bruce Jones, K. Modeling Runoff Response to Land Cover and Rainfall Spatial Variability in Semi-Arid Watersheds. In Monitoring Ecological Condition in the Western United States; Springer: Berlin/Heidelberg, Germany, 2000; pp. 285–298. [Google Scholar]
  74. Ziegler, A.D.; Giambelluca, T.W. Simulation of Runoff and Erosion on Mountainous Roads in Northern Thailand: A First Look. IAHS Publ. Ser. Proc. Rep. Intern Assoc. Hydrol. Sci. 1997, 245, 21–29. [Google Scholar]
  75. Martínez-Carreras, N.; Soler, M.; Hernández, E.; Gallart, F. Simulating Badland Erosion with KINEROS2 in a Small Mediterranean Mountain Basin (Vallcebre, Eastern Pyrenees). Catena 2007, 71, 145–154. [Google Scholar] [CrossRef] [Green Version]
  76. Kenneth, G. Renard Erosion Research and Mathematical Modelling. Toy ed 1977, 31–44. Available online: https://catalogue.nla.gov.au/Record/2496368 (accessed on 23 July 2022).
  77. Parlange, J.-Y.; Lisle, I.; Braddock, R.D.; Smith, R.E. The Three-Parameter Infiltration Equation. Soil Sci. 1982, 133, 337–341. [Google Scholar] [CrossRef]
  78. Romshoo, S.A.; Yousuf, A.; Altaf, S.; Amin, M. Evaluation of Various DEMs for Quantifying Soil Erosion Under Changing Land Use and Land Cover in the Himalaya. Front. Earth Sci. 2021, 9, 782128. [Google Scholar]
  79. Jia, X.; Richards, J.A. Remote Sensing Digital Image Analysis; Springer-Verlag Berlin Heidelberg: New York, NY, USA, 2006; ISBN 978-3-540-25128-6. [Google Scholar]
  80. Sanchez, P.A.; Ahamed, S.; Carré, F.; Hartemink, A.E.; Hempel, J.; Huising, J.; Lagacherie, P.; McBratney, A.B.; McKenzie, N.J.; de Lourdes Mendonça-Santos, M.; et al. Digital Soil Map of the World. Science 2009, 325, 680–681. [Google Scholar] [CrossRef] [Green Version]
  81. Dorigo, W.; Wagner, W.; Albergel, C.; Albrecht, F.; Balsamo, G.; Brocca, L.; Chung, D.; Ertl, M.; Forkel, M.; Gruber, A. ESA CCI Soil Moisture for Improved Earth System Understanding: State-of-the Art and Future Directions. Remote Sens. Environ. 2017, 203, 185–215. [Google Scholar] [CrossRef]
  82. Yang, X.; Liu, Z. Using Satellite Imagery and GIS for Land-use and Land-cover Change Mapping in an Estuarine Watershed. Int. J. Remote Sens. 2005, 26, 5275–5296. [Google Scholar] [CrossRef]
  83. Roy, P.; Roy, A.; Joshi, P.; Kale, M.; Srivastava, V.; Srivastava, S.; Dwevidi, R.; Joshi, C.; Behera, M.; Meiyappan, P.; et al. Development of Decadal (1985–1995–2005) Land Use and Land Cover Database for India. Remote Sens. 2015, 7, 2401–2430. [Google Scholar] [CrossRef] [Green Version]
  84. Anderson, J.; Hardy, E.; Roac, J.; Witmer, R. A Land Use and Land Cover Classification System for Use with Remote Sensing Data; US Government Printing Office: Washington, DC, USA, 1976; Volume 964.
  85. Congalton, R.G.; Green, K. Assessing the Accuracy of Remotely Sensed Data: Principles and Practices, 3rd ed.; CRC Press: Boca Raton, FL, USA, 2019; ISBN 978-0-429-05272-9. [Google Scholar]
  86. Miller, S.N.; Semmens, D.J.; Goodrich, D.C.; Hernandez, M.; Miller, R.C.; Kepner, W.G.; Guertin, D.P. The Automated Geospatial Watershed Assessment Tool. Environ. Model. Softw. 2007, 22, 365–377. [Google Scholar] [CrossRef]
  87. Daggupati, P.; Yen, H.; White, M.J.; Srinivasan, R.; Arnold, J.G.; Keitzer, C.S.; Sowa, S.P. Impact of Model Development, Calibration and Validation Decisions on Hydrological Simulations in West Lake Erie Basin. Hydrol. Process. 2015, 29, 5307–5320. [Google Scholar] [CrossRef]
  88. Tajbakhsh, S.M.; Memarian, H.; Sobhani, M.; Aghakhani Afshar, A.H. Kinematic Runoff and Erosion Model Efficiency Assessment for Hydrological Simulation of Semi-Arid Watersheds. Global J. Environ. Sci. Manag. 2018, 4, 127–140. [Google Scholar] [CrossRef]
  89. Al-Qurashi, A.; McIntyre, N.; Wheater, H.; Unkrich, C. Application of the Kineros2 Rainfall–Runoff Model to an Arid Catchment in Oman. J. Hydrol. 2008, 355, 91–105. [Google Scholar] [CrossRef]
  90. Yatheendradas, S.; Wagener, T.; Gupta, H.; Unkrich, C.; Goodrich, D.; Schaffner, M.; Stewart, A. Understanding Uncertainty in Distributed Flash Flood Forecasting for Semiarid Regions. Water Resour. Res. 2008, 44. [Google Scholar] [CrossRef]
  91. Ghosh, S.P. Carrying Capacity of Indian Horticulture. Curr. Sci. 2012, 102, 889–893. [Google Scholar]
  92. Recanatesi, F.; Petroselli, A.; Ripa, M.N.; Leone, A. Assessment of Stormwater Runoff Management Practices and BMPs under Soil Sealing: A Study Case in a Peri-Urban Watershed of the Metropolitan Area of Rome (Italy). J. Environ. Manag. 2017, 201, 6–18. [Google Scholar] [CrossRef] [PubMed]
  93. Qazi, N.Q.; Bruijnzeel, L.A.; Rai, S.P.; Ghimire, C.P. Impact of Forest Degradation on Streamflow Regime and Runoff Response to Rainfall in the Garhwal Himalaya, Northwest India. Hydrol. Sci. J. 2017, 62, 1114–1130. [Google Scholar] [CrossRef]
  94. Gelagay, H.S.; Minale, A.S. Soil Loss Estimation Using GIS and Remote Sensing Techniques: A Case of Koga Watershed, Northwestern Ethiopia. Int. Soil Water Conserv. Res. 2016, 4, 126–136. [Google Scholar] [CrossRef] [Green Version]
  95. Romshoo, S.A.; Rashid, I.; Altaf, S.; Dar, G.H. Jammu and Kashmir State: An Overview. In Biodiversity of the Himalaya: Jammu and Kashmir State; Springer: Singapore, 2020; pp. 129–166. ISBN 978-981-329-173-7. [Google Scholar]
  96. Du, S.; Shi, P.; Van Rompaey, A.; Wen, J. Quantifying the Impact of Impervious Surface Location on Flood Peak Discharge in Urban Areas. Nat. Hazards 2015, 76, 1457–1471. [Google Scholar] [CrossRef]
  97. Gilroy, K.L.; McCuen, R.H. A Nonstationary Flood Frequency Analysis Method to Adjust for Future Climate Change and Urbanization. J. Hydrol. 2012, 414, 40–48. [Google Scholar] [CrossRef]
  98. Panagos, P.; Borrelli, P.; Meusburger, K.; Yu, B.; Klik, A.; Jae Lim, K.; Yang, J.E.; Ni, J.; Miao, C.; Chattopadhyay, N.; et al. Global Rainfall Erosivity Assessment Based on High-Temporal Resolution Rainfall Records. Sci. Rep. 2017, 7, 4175. [Google Scholar] [CrossRef] [Green Version]
  99. Li, G.; Wan, L.; Cui, M.; Wu, B.; Zhou, J. Influence of Canopy Interception and Rainfall Kinetic Energy on Soil Erosion under Forests. Forests 2019, 10, 509. [Google Scholar] [CrossRef] [Green Version]
  100. Altaf, F.; Meraj, G.; Romshoo, S.A. Morphometric Analysis to Infer Hydrological Behaviour of Lidder Watershed, Western Himalaya, India. Geogr. J. 2013, 2013, 178021. [Google Scholar] [CrossRef]
  101. Bhat, S.; Romshoo, S.A. Digital Elevation Model Based Watershed Characteristics of Upper Watersheds of Jhelum Basin. J. Appl. Hydrol. 2009, 21, 23–34. [Google Scholar]
  102. de Dieu Nambajimana, J.; He, X.; Zhou, J.; Justine, M.F.; Li, J.; Khurram, D.; Mind’je, R.; Nsabimana, G. Land Use Change Impacts on Water Erosion in Rwanda. Sustainability 2020, 12, 50. [Google Scholar] [CrossRef] [Green Version]
  103. Petit, C.C.; Lambin, E.F. Long-Term Land-Cover Changes in the Belgian Ardennes (1775–1929): Model-Based Reconstruction vs. Historical Maps. Glob. Chang. Biol. 2002, 8, 616–630. [Google Scholar] [CrossRef]
  104. Tullos, D.; Byron, E.; Galloway, G.; Obeysekera, J.; Prakash, O.; Sun, Y.-H. Review of Challenges of and Practices for Sustainable Management of Mountain Flood Hazards. Nat. Hazards 2016, 83, 1763–1797. [Google Scholar] [CrossRef]
  105. Junk, W.J.; Bayley, P.B.; Sparks, R.E. The Flood Pulse Concept in River-Floodplain Systems. Can. Spec. Publ. Fish. Aquat. Sci. 1989, 106, 110–127. [Google Scholar]
  106. Sparks, R.E. Need for Ecosystem Management of Large Rivers and Their Floodplains. BioScience 1995, 45, 168–182. [Google Scholar] [CrossRef]
  107. Bhatt, C.M.; Rao, G.S.; Farooq, M.; Manjusree, P.; Shukla, A.; Sharma, S.; Kulkarni, S.S.; Begum, A.; Bhanumurthy, V.; Diwakar, P.G. Satellite-Based Assessment of the Catastrophic Jhelum Floods of September 2014, Jammu & Kashmir, India. Geomat. Nat. Hazards Risk 2017, 8, 309–327. [Google Scholar]
  108. Lu, Q.; Gao, Z.; Ning, J.; Bi, X.; Wang, Q. Impact of Progressive Urbanization and Changing Cropping Systems on Soil Erosion and Net Primary Production. Ecol. Eng. 2015, 75, 187–194. [Google Scholar] [CrossRef]
  109. Wang, L.-Y.; Xiao, Y.; Rao, E.-M.; Jiang, L.; Xiao, Y.; Ouyang, Z.-Y. An Assessment of the Impact of Urbanization on Soil Erosion in Inner Mongolia. Int. J. Environ. Res. Public Health 2018, 15, 550. [Google Scholar] [CrossRef] [PubMed] [Green Version]
  110. Kim, H.-S.; Julien, P.Y. Soil Erosion Modeling Using RUSLE and GIS on the IMHA Watershed. Water Eng. Res. 2006, 7, 29–41. [Google Scholar]
  111. Habersack, H.; Liébault, F.; Comiti, F. Sediment Dynamics in Alpine Basins. Geomorphology 2017, 291, 1–3. [Google Scholar] [CrossRef]
  112. O’Brien, G.C.; Dickens, C.; Baker, C.; Stassen, R.; van Weert, F. Sustainable Floodplains: Linking E-Flows to Floodplain Management, Ecosystems, and Livelihoods in the Sahel of North Africa. Sustainability 2020, 12, 10578. [Google Scholar] [CrossRef]
  113. Romshoo, S.A.; Ali, N.; Rashid, I. Geoinformatics for Characterizing and Understanding the Spatio-Temporal Dynamics (1969 to 2008) of Hokersar Wetland in Kashmir Himalayas. Int. J. Phys. Sci. 2011, 6, 1026–1038. [Google Scholar]
Figure 1. Location of study area in the figure with. (a) Union of India; (b) The UTs of Jammu, Kashmir, and Ladakh; (c) Upper Jhelum Basin (UJB) with numbers representing different sub-watersheds.
Sustainability 14 13602 g001
Figure 2. Hydrograph of four extreme rainfall events observed during 3–6 September 2014.
Sustainability 14 13602 g002
Figure 3. Land use and land cover of the study area in in the figure with (a) 1980; (b) 2014; (c) 2020; and (d) dot density map showing spatio-temporal variability of soil erosion from 1980 to 2020.
Sustainability 14 13602 g003
Figure 4. Percent change in the figure with (a) surface runoff (mm) from 1980 to 2014; (b) sediment yield (kg/ha) from 1980 to 2014; (c) surface runoff (mm) from 2014 to 2020; and (d) sediment yield (kg/ha) from 2014 to 2020.
Sustainability 14 13602 g004
Figure 5. Impact of land use and land cover changes on (a) peak discharge and (b) sediment yield in 1980, 2014, and 2020.
Sustainability 14 13602 g005
Figure 6. Land use and land cover (LULC) information and soil loss for each watershed plane during 1980, 2014, and 2020.
Sustainability 14 13602 g006
Figure 7. Land use and land cover information of the study area in 1980, 2014, and 2020.
Sustainability 14 13602 g007
Table 1. Watershed plane and Channel parameter characteristics [70].
Plane ParametersParameters DefinitionsChannel
Parameters
Parameter Definitions
LengthLength (m)UpstreamUpstream Identifier(s) to ten upstream contributing elements
WidthWidth (m)LateralIdentifier(s) of up to two plane elements contributing lateral inflow
SlopeSlope (rise/run)LengthLength (m)
ManningRoughness coefficient
(sm−1/3)
WidthBottom Width (m)
KSaturated hydraulic conductivity (mm/h)SlopeBottom Slope (rise/run)
GMean capillary drive, mmManningRoughness coefficient (sm−1rs)
PorosityPorositySATInitial degree of soil saturation
ROCKVolumetric rock fractionSS1, SS2Bank side slopes-right or left
DISTPore size distribution indexKfsSaturated hydraulic conductivity (mm/h)
CVCoefficient of variation of KGMean capillary drive, mm
INTERInterception depth (mm)PorosityPorosity
CANOPYFraction of surface covered by intercepting coverROCKVolumetric rock fraction
FRACTList of particle class fractionDISTPore size distribution index
SPLASHRain splash coefficientCOHSoil cohesion coefficient
COHSoil cohesion coefficientFRACTList of particle class fractions
TYPESimple or Compound
Table 2. Details of the KINEROS2 model input data and the sources thereof.
S. No.ParametersSourceYearResolutionSources
1.Slope and AspectCARTO DEM201428 (m)http://bhuvan.nrsc.gov.in (accessed on 20 August 2021)
2.Land Use Land CoverLandsat1980, 2014, and 202060 (m) and 30 (m)http://earthexplorer.usgs.gov (accessed on 20 August 2021)
3.Soil DatabaseDigital soil map of the world20131:5 Millionhttp://www.fao.org (accessed on 2 February 2022)
4.PrecipitationAverage rainfall Depth3–6 September 2014DailyIndian Metrological Department (IMD)
5.Soil MoistureVolumetric soil moisture (%)3–6 September 2014Dailyhttps://climate.copernicus.eu/climate-data-store (accessed on 2 February 2022)
6.Discharge DataGauge recorder3–6 September 2014DailyIrrigation and Flood Control (IFC)
Table 3. Land use and land cover information during 1980, 2014 and 2020 and the changes thereof.
Land Use/Land Cover Type1980
(% Area)
2014
(% Area)
2020
(% Area)
1980–2014
(% Change)
2014–2020
(% Change)
Agriculture25.4012.139.98−13.27−2.2
Barren0.681.211.260.530.1
Built-Up0.511.892.581.380.7
Degraded Forest6.118.999.672.880.7
Exposed Rock11.4910.8212.69−0.681.9
Forest31.9927.8526.79−4.14−1.1
Glacier0.281.141.100.860.0
Horticulture4.3115.3217.0811.011.8
Pasture1.041.061.070.020.0
Plantation1.392.152.020.76−0.1
River Bed2.151.461.49−0.690.0
Scrub12.0113.3313.321.320.0
Snow1.571.800.190.23−1.6
Water1.070.860.76−0.21−0.1
Table 4. Land use and land cover information during 1980, 2014, and 2020 and the changes thereof.
Events3 September 20144 September 20145 September 20146 September 2014
Rainfall Depth (mm)55.2298.2127.2101.32
Initial Soil Moisture (%)79%88%72%89%
Observed discharge66,08298,257107,647115,218
Simulated discharge64,104103,455111,447115,101
Publisher’s Note: MDPI stays neutral with regard to jurisdictional claims in published maps and institutional affiliations.

