Article

Relationship between Soil Organic Carbon, Soil Nutrients, and Land Use in Linyi City (East China)

Shandong Provincial Key Laboratory of Water and Soil Conservation and Environmental Protection, College of Resources and Environment, Linyi University, Linyi 276005, China
*
Authors to whom correspondence should be addressed.
These authors contributed equally to this work.
Sustainability 2022, 14(20), 13585; https://doi.org/10.3390/su142013585
Submission received: 3 September 2022 / Revised: 16 October 2022 / Accepted: 18 October 2022 / Published: 20 October 2022
(This article belongs to the Special Issue Land Use/Cover Change and Its Environmental Effects)

Abstract

:
The distribution characteristics of soil organic carbon (SOC) and soil nutrients under different land-use types in Linyi City, East China, were studied. The spatial distribution of SOC under different land-use types and the relationship between SOC and soil nutrients were analyzed using remote sensing interpretation and soil sample analyses. The results showed that SOC in Linyi was mainly stored in drylands and paddy fields. SOC and total nitrogen (TN) levels were positively correlated for most land use types. There was a positive linear correlation between SOC and total K in the paddy fields. The coefficients of variation for SOC and TN differed greatly among the land use types studied. Total SOC storage was 8772.73 × 103 kg in the surface 0.2 m soil layer. The order of total SOC storage was drylands (6771.45 × 103 ton) > paddy field (764.67 × 10³ ton) > nurseries (510.79 × 10³ ton) > forest land (413.49 × 10³ ton) > low-cover grasslands (238 × 103 ton) > bare land (74.35 × 10³ ton). With the largest SOC storage, and C density, respectively, drylands and paddy fields are conducive to enhancing soil C sequestration, achieving low-carbon goals, and mitigating climate change.

1. Introduction

Soil organic carbon (SOC) is an important component of soil. It is not only an important basis for soil quality but also plays a crucial role in the global C cycle. With expanding global warming research, studies on the C cycle have attracted widespread attention [1]. Over the past 250 years, the accumulation of greenhouse gases in the atmosphere has led to a change in Earth’s climate; the concentrations of CO2, CH4, and N2O in the atmosphere have increased by 30%, 14.5%, and 15%, respectively [2]. These increases in greenhouse gas content are primarily caused by the use of fossil fuels, land-use changes, and agricultural activities [3]. Soil is the core of terrestrial ecosystems and connects the atmosphere, the hydrosphere, and the biosphere. Small changes in the soil C pool can directly lead to an increase in atmospheric CO2 concentration through the emission of greenhouse gases into the atmosphere, which then affects global climate change through the greenhouse effect [4]. Changes in land use not only directly change the content and distribution of SOC but also indirectly change the content and distribution of SOC by affecting the formation and transformation of SOC, and thus have an important impact on atmospheric CO2 concentration. Therefore, understanding the storage and transformation of soil C in a region is an important prerequisite for understanding the ecosystem C cycle. Accurate estimation of the storage of soil C pools under different land-use types is of great significance for the accurate evaluation of the role of soil in the C cycle of terrestrial ecosystems [5]. However, the traditional method of measuring sample points is time-consuming and costly and is thus not suitable for large-scale monitoring [6]. To address these challenges, scholars have gradually begun to explore the use of robust and cost-effective approaches to predict the SOC content.
Since the 1960s, satellite remote sensing has grown to be a powerful tool to fulfill the data needs for monitoring spatial and temporal environmental processes. Visible and infrared imaging sensors have been used to collect information on land surface parameters such as land use and vegetation cover [7]. A combination of remote sensing interpretation and field surveys can provide a more accurate understanding of the situation in the study area. Therefore, this study used remote sensing interpretation and field sample collection to study the distribution of SOC and explore the relationship between SOC and nutrients.
Land use is responsible for controlling soil C stocks [8] and is a critical factor affecting soil C stocks. Land use changes, such as the conversion from forest land to agricultural land, leads to the loss of soil C. Houghton and Hackler [9] observed that 156 Pg of soil C has been released into the atmosphere owing to land use changes globally since 1850. There is a 20–50% loss in SOC when forest land is converted into cultivated land. Xia et al. [10] revealed that land use conversion from forestry to cultivated land caused a decrease in soil C by 30.7 Tg. Similarly, Kooch et al. [11] concluded that the conversion of forest to cropland and other land uses caused a decrease in SOC, whereas a change in the opposite direction increased SOC stock.
Understanding the impact of land use on soil C stocks is crucial for implementing land-use management to increase C stocks and reduce C emissions. The influence of land use on SOC content is mainly due to the differences in vegetation [12]. Under different land uses, the nature and quantity of plant litter differ, as does the nature of the organic matter decomposed in the soil. In the 1990s, with the development of 3S technology (remote sensing, geographical information systems, and the global position system), research on terrestrial SOC pools began to use geographic information technology to describe the attributes and spatial distribution of different levels of soil C pools [13].
Human activities strongly interfere with the C and N cycles of the Earth and aggravate the greenhouse effect, which indirectly affects biochemical cycle processes such as plant primary productivity, biological N fixation, soil nitrification and denitrification, and C/N changes; however, the impact mechanism is not very clear. Human activity increases the levels of SOC and total N in the surface soil, and stratification occurs in the soil profile [14]. Understanding the stratification of soil C/N is important for understanding the relationship between soil C and N.
The soil stratification rate is usually used as an index to evaluate soil quality or ecological function, particularly the changes in soil physical and chemical properties caused by tillage, such as SOC, porosity, and aggregate stability [15]. Analysis of the impact of human activities on the stratification rate of various soil properties can help to understand the impact of conservation tillage on ecological effects. Tillage is generally believed to disturb the soil so that nutrients are evenly distributed in the plow layer, whereas with no-tillage, straw remains on the soil surface so that nutrients are enriched in the surface layer [16,17]. Franzluebbers and Stuedemann [18] showed that the stratification rate of degraded soil organic matter is rarely greater than 2, and a high stratification rate indicates good soil quality. Generally, the stratification rates of SOC and total N in the no-tillage soil were greater than 2, whereas those in the plowed soil were less than 2. Studies have shown that short-term tillage (<9 years) has no significant effect on the stratification rate of the soil N pool, and with an increase in years, the stratification rate of the no-tillage soil N pool was significantly higher than that of tillage, and the ratio was greater than 2 after 19 years of no-tillage. Škrabec et al. [19] analyzed 85 soil profiles and found that long-term reduced tillage and no tillage could improve the stratification rates of SOC, total N, and C/N. They believed that crop straw residues were more conducive to increasing soil C/N rates than root systems; in no-tillage measures, straw mainly covers the soil surface, and thus soil C/N decreases with increasing soil depth. Jiang et al. [20] believed that the decomposing power of SOC in no-tillage topsoil was lower than that of tillage, whereas SOC, total N, and C/N stratification rates increased. Wang et al. [21] studied double-cropping paddy fields in southern China and showed that after long-term no-tillage, the implementation of tillage and rotary tillage reduced the content of SOC in the surface layer (0–5 cm), increased the content of SOC in the 5–20 cm soil layer, and reduced the stratification rate of SOC in the plowed soil layer. Therefore, a comprehensive analysis of the impact of land use on the effects of C and N is of great significance for in-depth understanding of changes in soil fertility and their ecological effects.
However, there remains a lack of analysis on the driving forces of C sources and sinks in farmland ecosystems, and analysis of the correlation between C absorption and different land uses in northern rocky mountain areas is lacking. Linyi City, a major agricultural city in Shandong Province, was used as an example. The aims of this study were to (1) analyze the spatial distribution characteristics of SOC and (2) study the relationship between SOC and soil nutrients.

2. Study Area and Research Methods
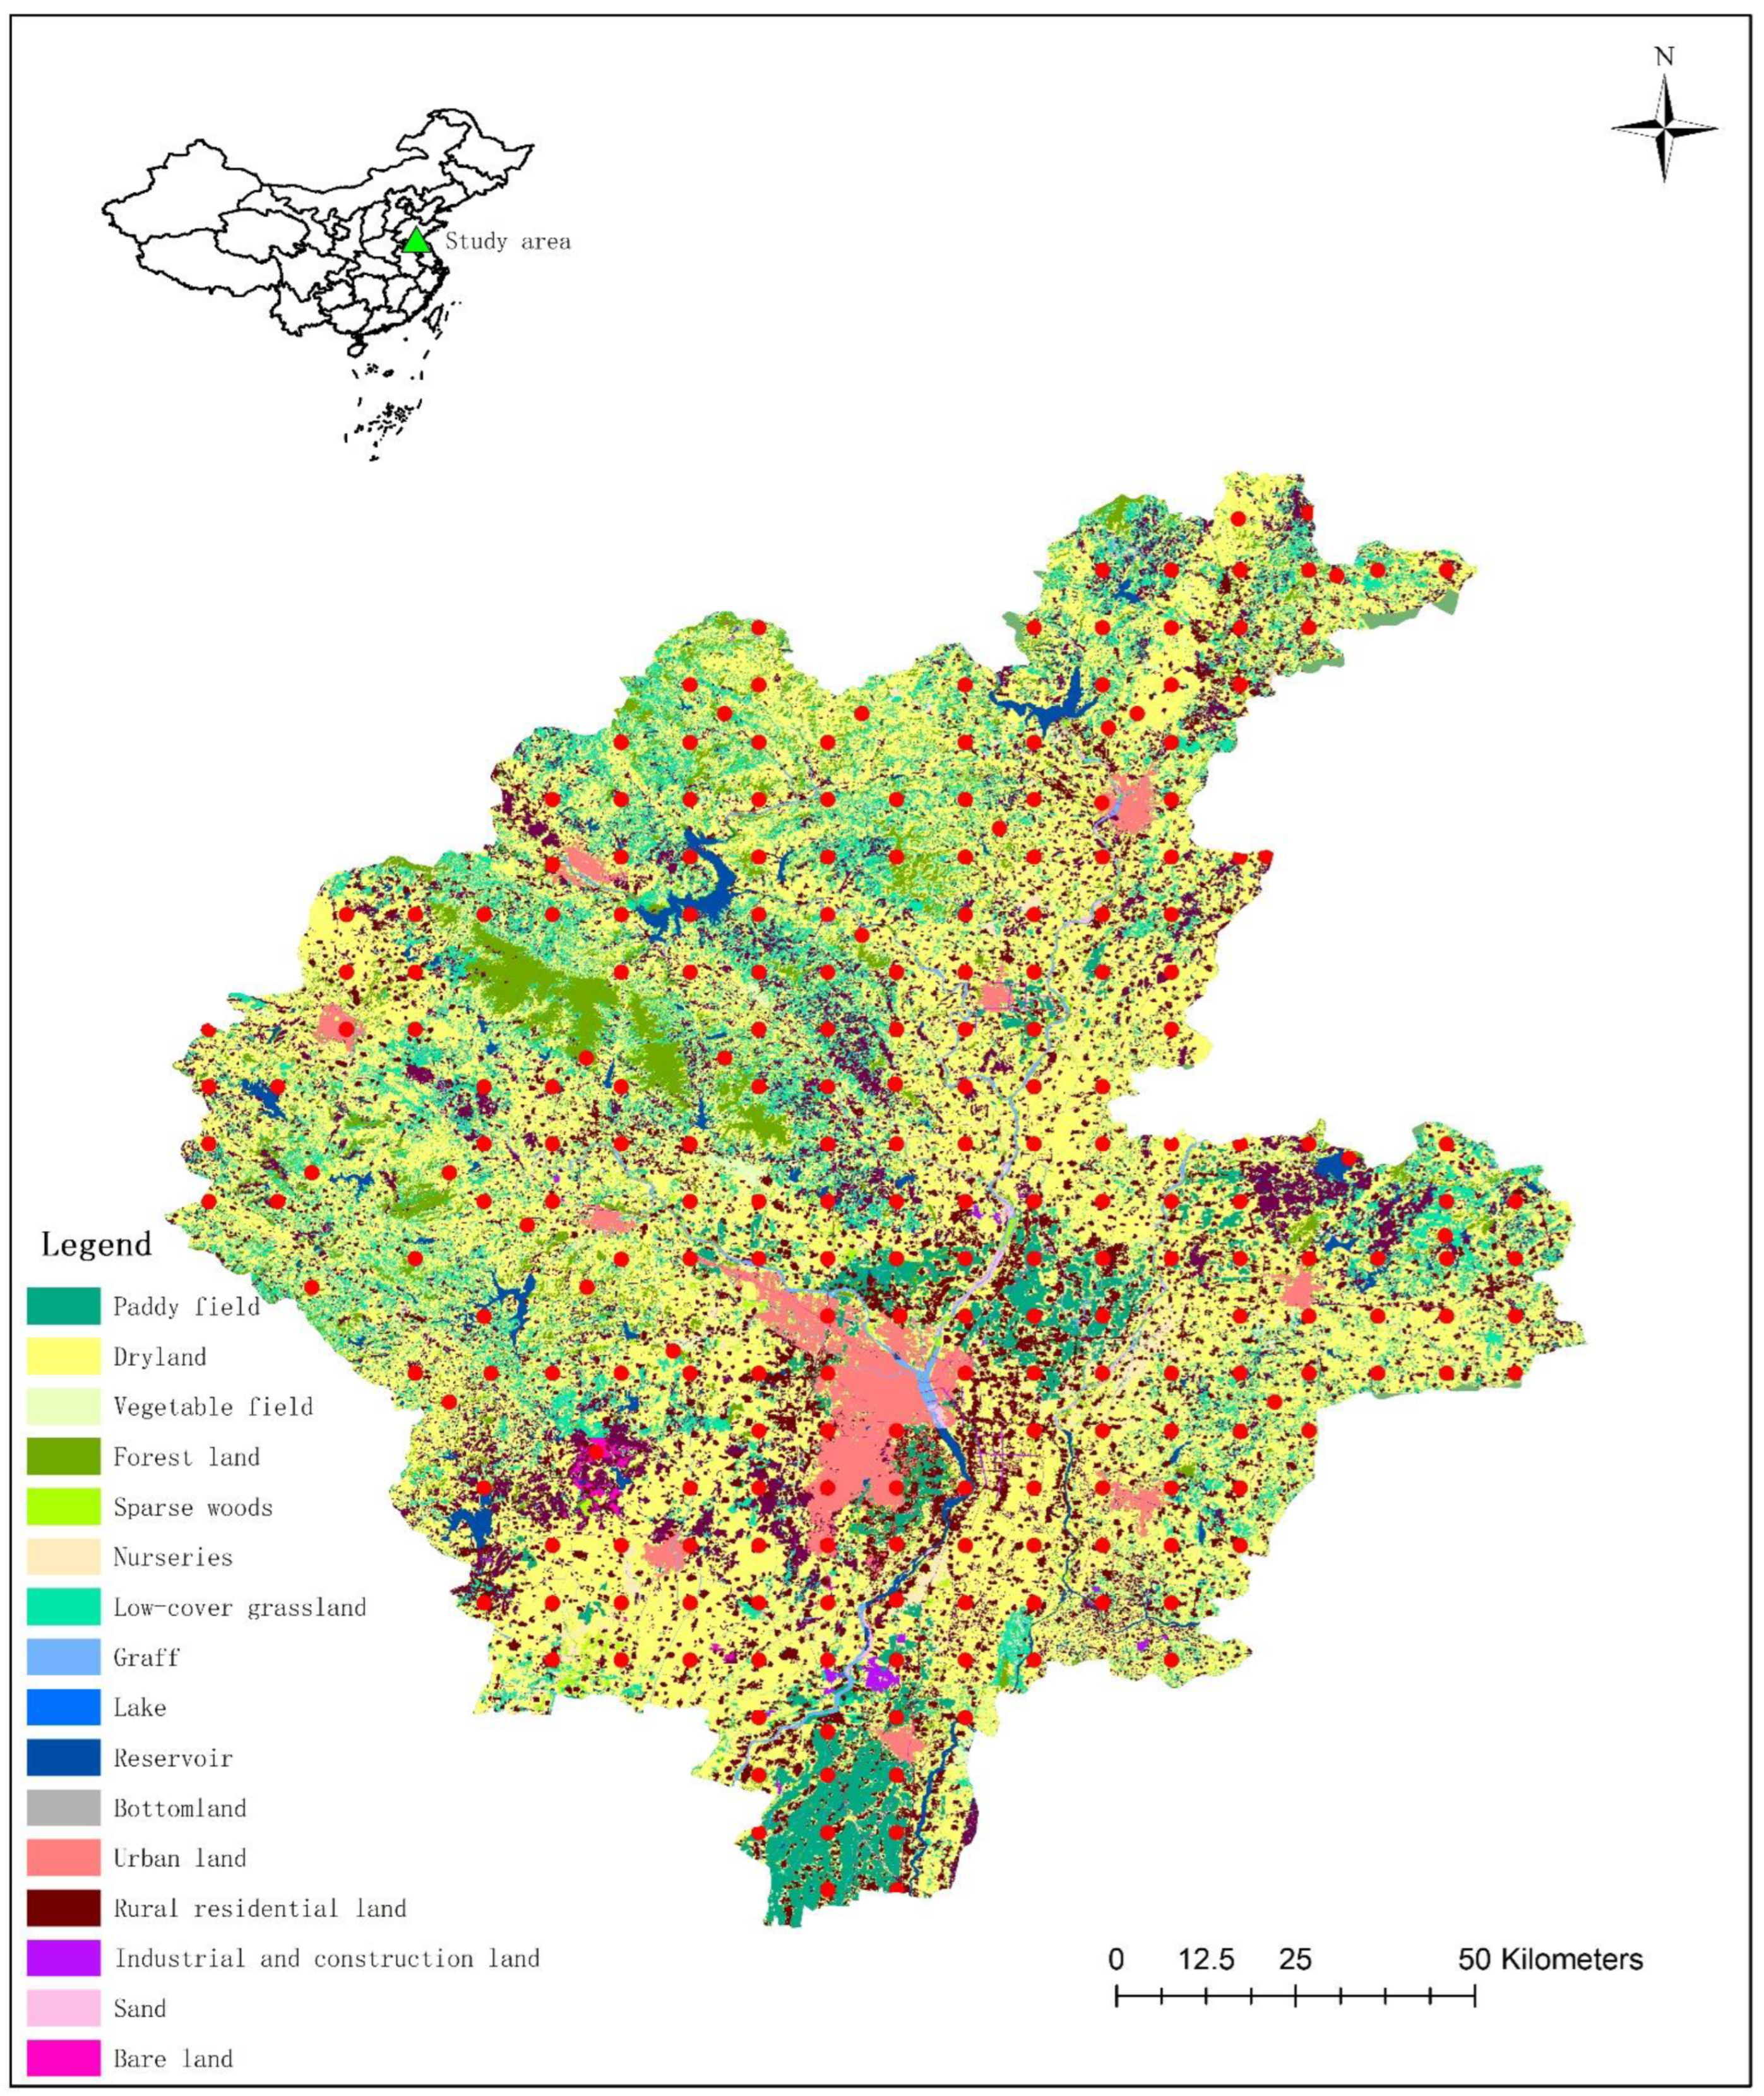
2.1. Study Area

The study area, Linyi City, is located southeast of the central and southern mountains of Shandong Province, with a total land area of 1.7184 million hm2, accounting for 11.01% of the total land area of Shandong Province. The terrain of the city is high in the northwest and low in the southeast, and mountain and hill areas account for approximately two thirds of the total land area of the city. Mountain valleys, alluvial plains, and depressions account for only one third of the city’s total land area [22].
Linyi City is located in the hinterland of the Yimeng Mountain area and its landform is closely controlled by regional tectonic faults. From southwest to northeast, the entire region is divided into four fault block zones extending from northwest to southeast, forming a landform type of alternating distribution of mountains, hills, intermountain plains, basins, and valleys, which gradually decrease from northwest to southeast. The general characteristics are as follows: the mountainous area is vast, the mountains are high, the surface is rugged, and the soil layer is barren [23].
The study area has a warm temperate monsoon continental climate with no significant differences in the domestic climate. The climate is characterized by rain and heat in the same season, alternating between cold and heat, and four distinct seasons. Spring is from March to May, with rapid warming, low precipitation, high wind speed, and dry climate; summer is from June to August, with high temperature, high humidity, concentrated precipitation, hot and humid climate; and autumn is from September to November. When the temperature drops, rainfall decreases sharply; the winter is from December to February, with little rain and snow, and is cold and dry. The annual average temperature is 14.1 °C, the extreme maximum temperature is 36.5 °C, the minimum temperature is −11.1 °C, the annual average precipitation is 813 mm, and the annual dominant wind direction is the southeast wind. The wind direction varies with the season. The wind is mostly northwest in winter, southeast in spring and summer, southeast in early autumn, and northwest in late autumn.
Linyi is located in the alluvial plain of the Yi and Shu rivers, which belong to the Huai River Basin and the Yi-shu River system. The main soil types are skeletal, lithosol, brown, fluvo-aquic, lime concretion black, and paddy soils. Skeletal soil and lithosols are mainly distributed in areas of bare land. Brown soil is mainly distributed in the drylands. Fluvo-aquic and paddy soils are mainly distributed in areas of paddy fields. Lime concretion black soil is mainly distributed in the piedmont junction depression, inter-hill depression, and inter-river depression, and the main land use type is low-cover grasslands.
The cultivated land in the city is 793,700 hm2, accounting for 46.20% of the total land area; forest land is 315,400 hm2, accounting for 18.36% of the total land area; and unused land is 200,000 hm2, accounting for 11.62% of the total land area. Among the cultivated lands, the drylands area is large, 504,800 hm2, and the paddy field area is relatively small, 260,500 hm2 (Figure 1).
Soil sampling was conducted in March 2018. According to the requirements of the soil sampling point layout in DZ/T 0295–2016 Specification of Land Quality Geochemical Assessment, 253 topsoil sampling points were distributed based on the land parcel and grid, and the sampling medium was a 0.2 m soil column on the surface. Land use classification followed the standard according to Land-Based Classification Standards (LBCS) (Figure 1).

2.2. Test Items and Methods

After the collected samples were air-dried, plant roots and other impurities were removed. Soil pH, SOC, total nitrogen (TN), total phosphorus (TP), and total potassium (TK) were determined using conventional agrochemical soil analysis methods. The pH was measured using a pH meter, and the potassium dichromate volumetric method was used to measure the SOC. The semi-micro Kjeldahl method was used to measure the TN. Molybdenum antimony anti-colorimetry and atomic absorption spectrophotometry were used to determine the TP and TK, respectively [24]. All samples were analyzed in triplicate and the data are expressed as the mean.

2.3. Calculation of SOC Density and SOC Pool

SOC density refers to the organic C storage at a certain depth of the soil layer per unit area. Owing to the exclusion of the influence of area factors, SOC density was calculated based on the soil volume. Soil C density has become an extremely important index for evaluating and measuring organic C storage in the soil.
The SOC density of a layer i is calculated as follows:
SOCi = Ci × Di × Ei × (1 − δ2mm)
where SOCi is the SOC density, Ci is the SOC content (%), Di is the soil bulk density (g·m−3), Ei is the depth of the soil layer (m), and δ2mm is the volume percentage of gravel larger than 2 mm (%).
The formula for calculating SOC storage is as follows:
SOC = i = 1 n S O C i × P i
where SOC is the total C storage (kg) and Pi is the area occupied by a certain soil type (m2).

2.4. Sentinel-2 Images

Sentinel-2 images acquired in August 2018 were obtained from the official website of the European Space Agency. This is because only this image had no cloud cover in the study area and its acquisition time was close to the sampling time. The image is at the L2A level; therefore, it does not require atmospheric correction. The data of each band were resampled to a 10 m resolution in SNAP (version 7.0, European Space Agency, Paris France). Ten bands (B2, B3, B4, B5, B6, B7, B8, B8a, B11, and B12) with higher resolution were retained. In this study, Sentinel-2 data were preprocessed using SNAP 7.0, including calibration, thermal noise removal, multilooking, speckle filtering, and terrain correction.

2.5. Data Analysis

In this study, the results were presented as an average of triplicates, and significance was determined at a probability level of 0.05. Pearson’s correlation was used to analyze the correlation between the SOC content and nutrients. Statistical analyses were performed using SPSS version 25 (IBM, Armonk, NY, USA). Least significant difference (LSD) of one-way analysis of variance (ANOVA) in SPSS 25 was used to calculate the SOC, SOC density, and C/N ratio of the different land-use types. The confidence level was set at p < 0.05. The Kriging interpolation method in ArcMap 10.8 (ESRI, Redlands, CA, USA) was used for the difference analysis of SOC and physical and chemical indices. The ArcMap 10.8 supervised classification was used to process images to obtain different land-use types.

3. Results

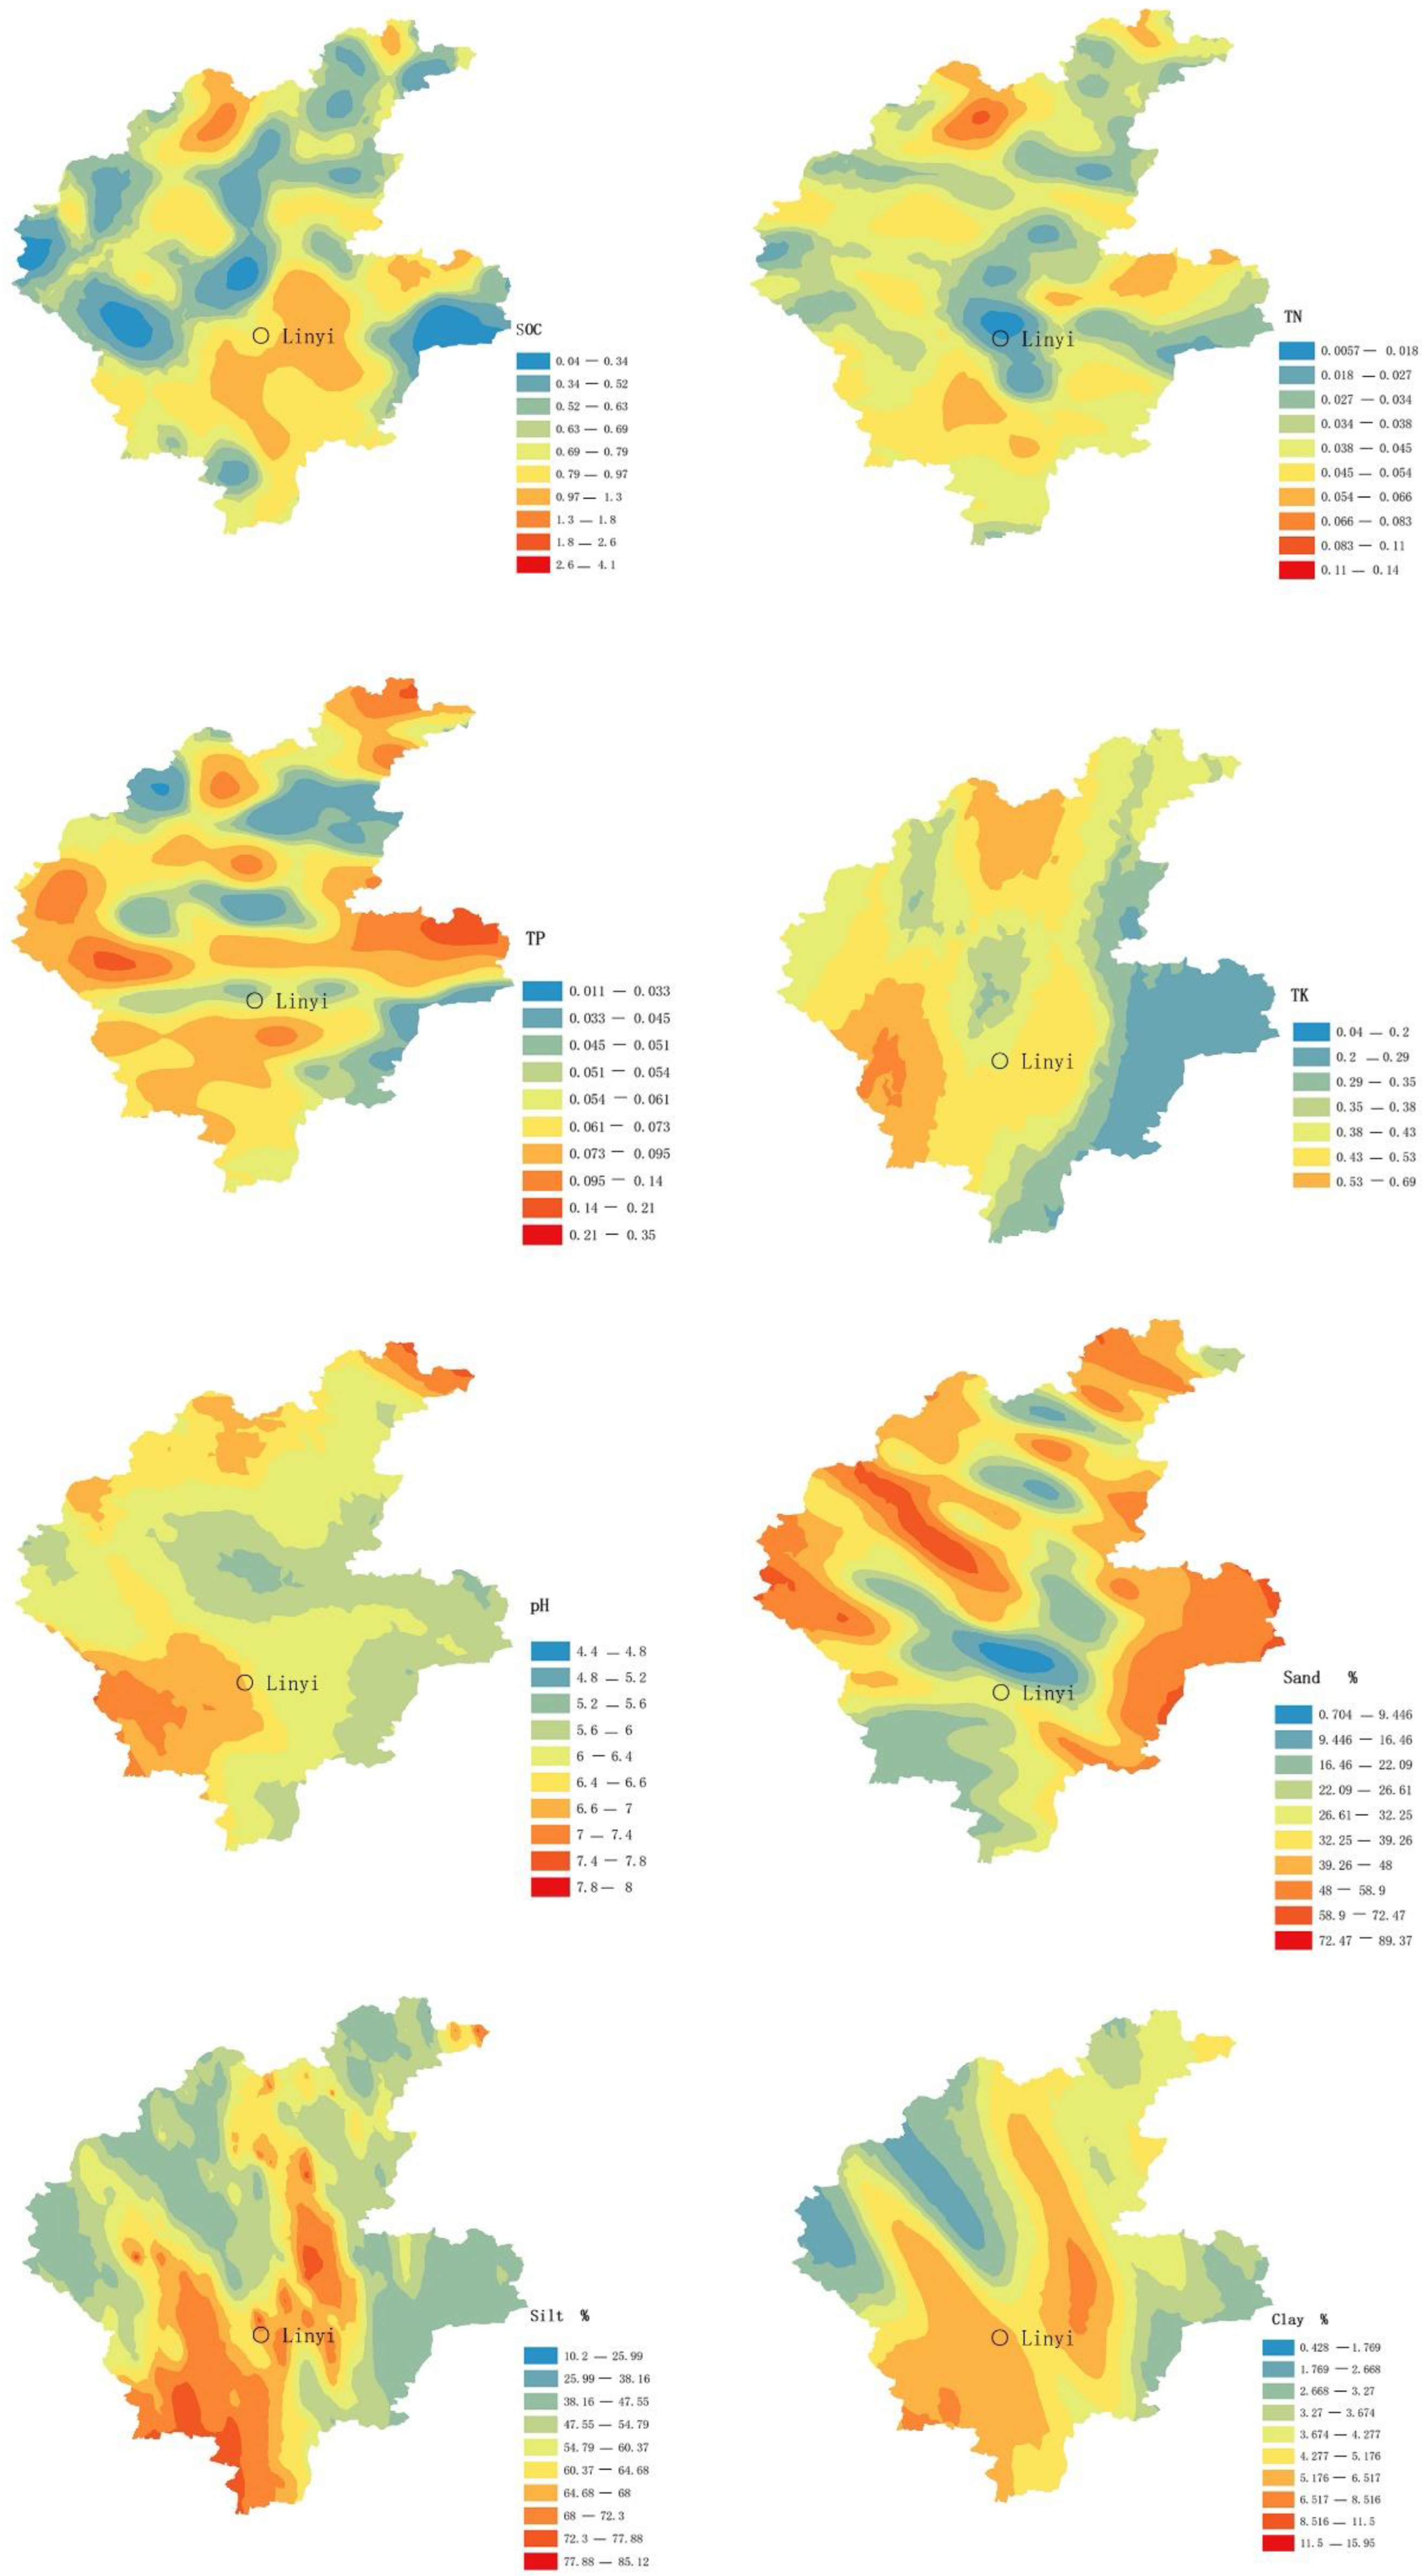
3.1. Spatial Distribution of SOC and Other Physical and Chemical Characteristics

SOC was mainly concentrated in the central and southern areas of Linyi City and a small part of the northwest region (0.97–4.1 g·kg−1). This is consistent with the distribution area of drylands and paddy fields; therefore, soil C in Linyi was mainly concentrated in drylands and paddy field areas. The spatial distribution of TN and TP was similar to that of SOC. Total N content was relatively high in the south-central region and a small part of the northern farming area (0.054–0.14 g·kg−1). Total P content was higher in the south-central part, and in the eastern and northern farming areas (0.073–0.35 g·kg−1). Total K was distributed in a stepped manner, increasing from east to west, with a higher content in the southwest and north (0.43–1.4 g·kg−1). The pH was lower in the eastern and central regions (4.4–6.0) than in the southwest and northern regions (6.4–8.0), and was generally higher in the west and lower in the east. Regarding the spatial distribution of the surface soil texture, the soil sand content was low in the central and southern regions and high in the eastern, northern, and western regions. The distribution trends of silt and clay were opposite to those of sand (Figure 2).

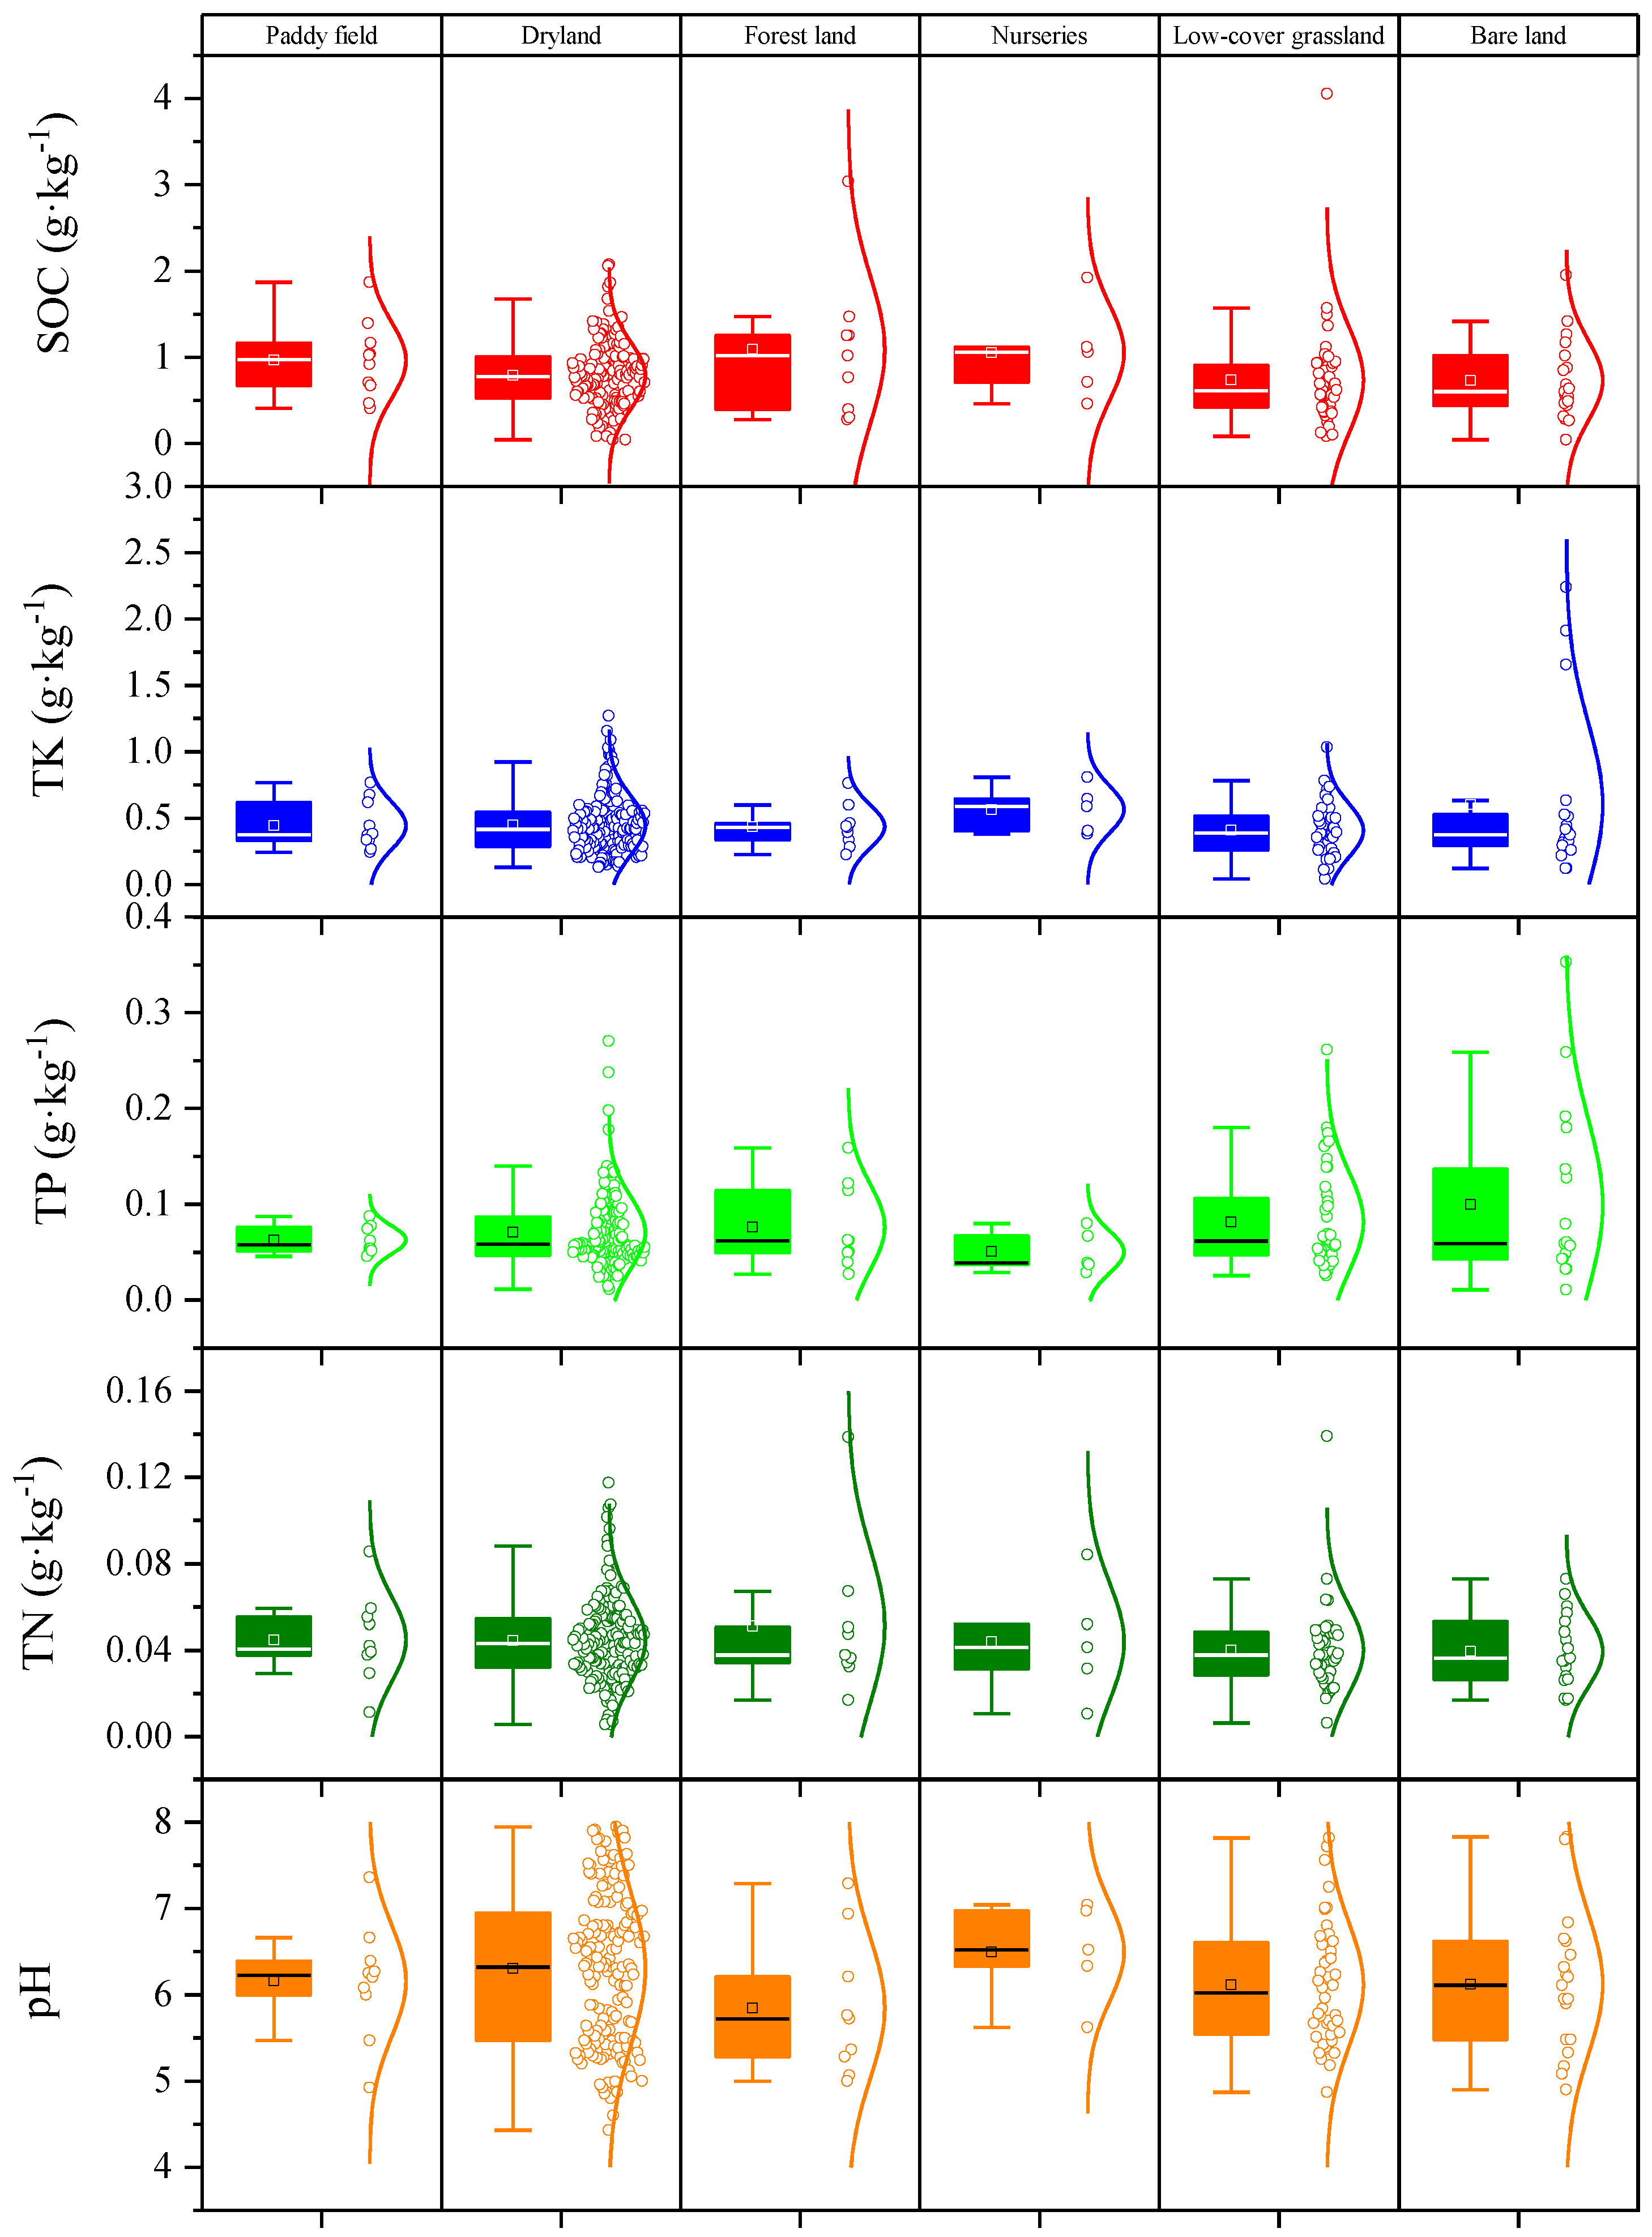
3.2. Distribution of Organic C and Nutrients among Different Land-Use Types

Drylands, paddy fields, nurseries, and low-cover grasslands were areas with a concentrated distribution of organic C. TK content was the highest in the nurseries, and the content change range of bare land was the highest. The TP content in the nurseries was relatively low and the range of change in the low-cover grasslands and bare land was relatively large. The TN content in drylands, paddy fields, nurseries, and forest land was relatively high and changed greatly, and the content in low-cover grasslands and bare land was relatively low. The pH was relatively high in drylands, paddy fields, and nurseries, and relatively low in low-cover grasslands, forest land, and bare land (Figure 3).
The coefficient of variation of soil nutrient content provides a good measure of the disturbance caused by human cultivation on soil nutrients. The soil nutrient content of Linyi was low, and the nutrient content for different land use types was relatively poor. The coefficient of variation reflects the distribution of soil nutrients and degree of human interference. Generally, a coefficient of variation greater than 36% indicates areas with a highly variable distribution of nutrients, a value between 16% and 35% indicates moderate distribution, and values less than 15% are considered low. The coefficients of variation for SOC and TN under different land use types exhibited a high degree of variation. The coefficient of variation for TP was 21.22% in drylands, which was moderate, whereas it was high for other land-use types. The coefficient of variation for TK was moderate in nurseries and forest land, and high in other land-use types (Table 1).
In the study area, major elements were significantly affected by external interference and their levels showed large spatial differences. Only soil pH in the entire region showed a low level of variation. This is mainly related to soil buffering, that is, the ability of soil to resist acidic and alkaline substances and to resist a change in pH value.

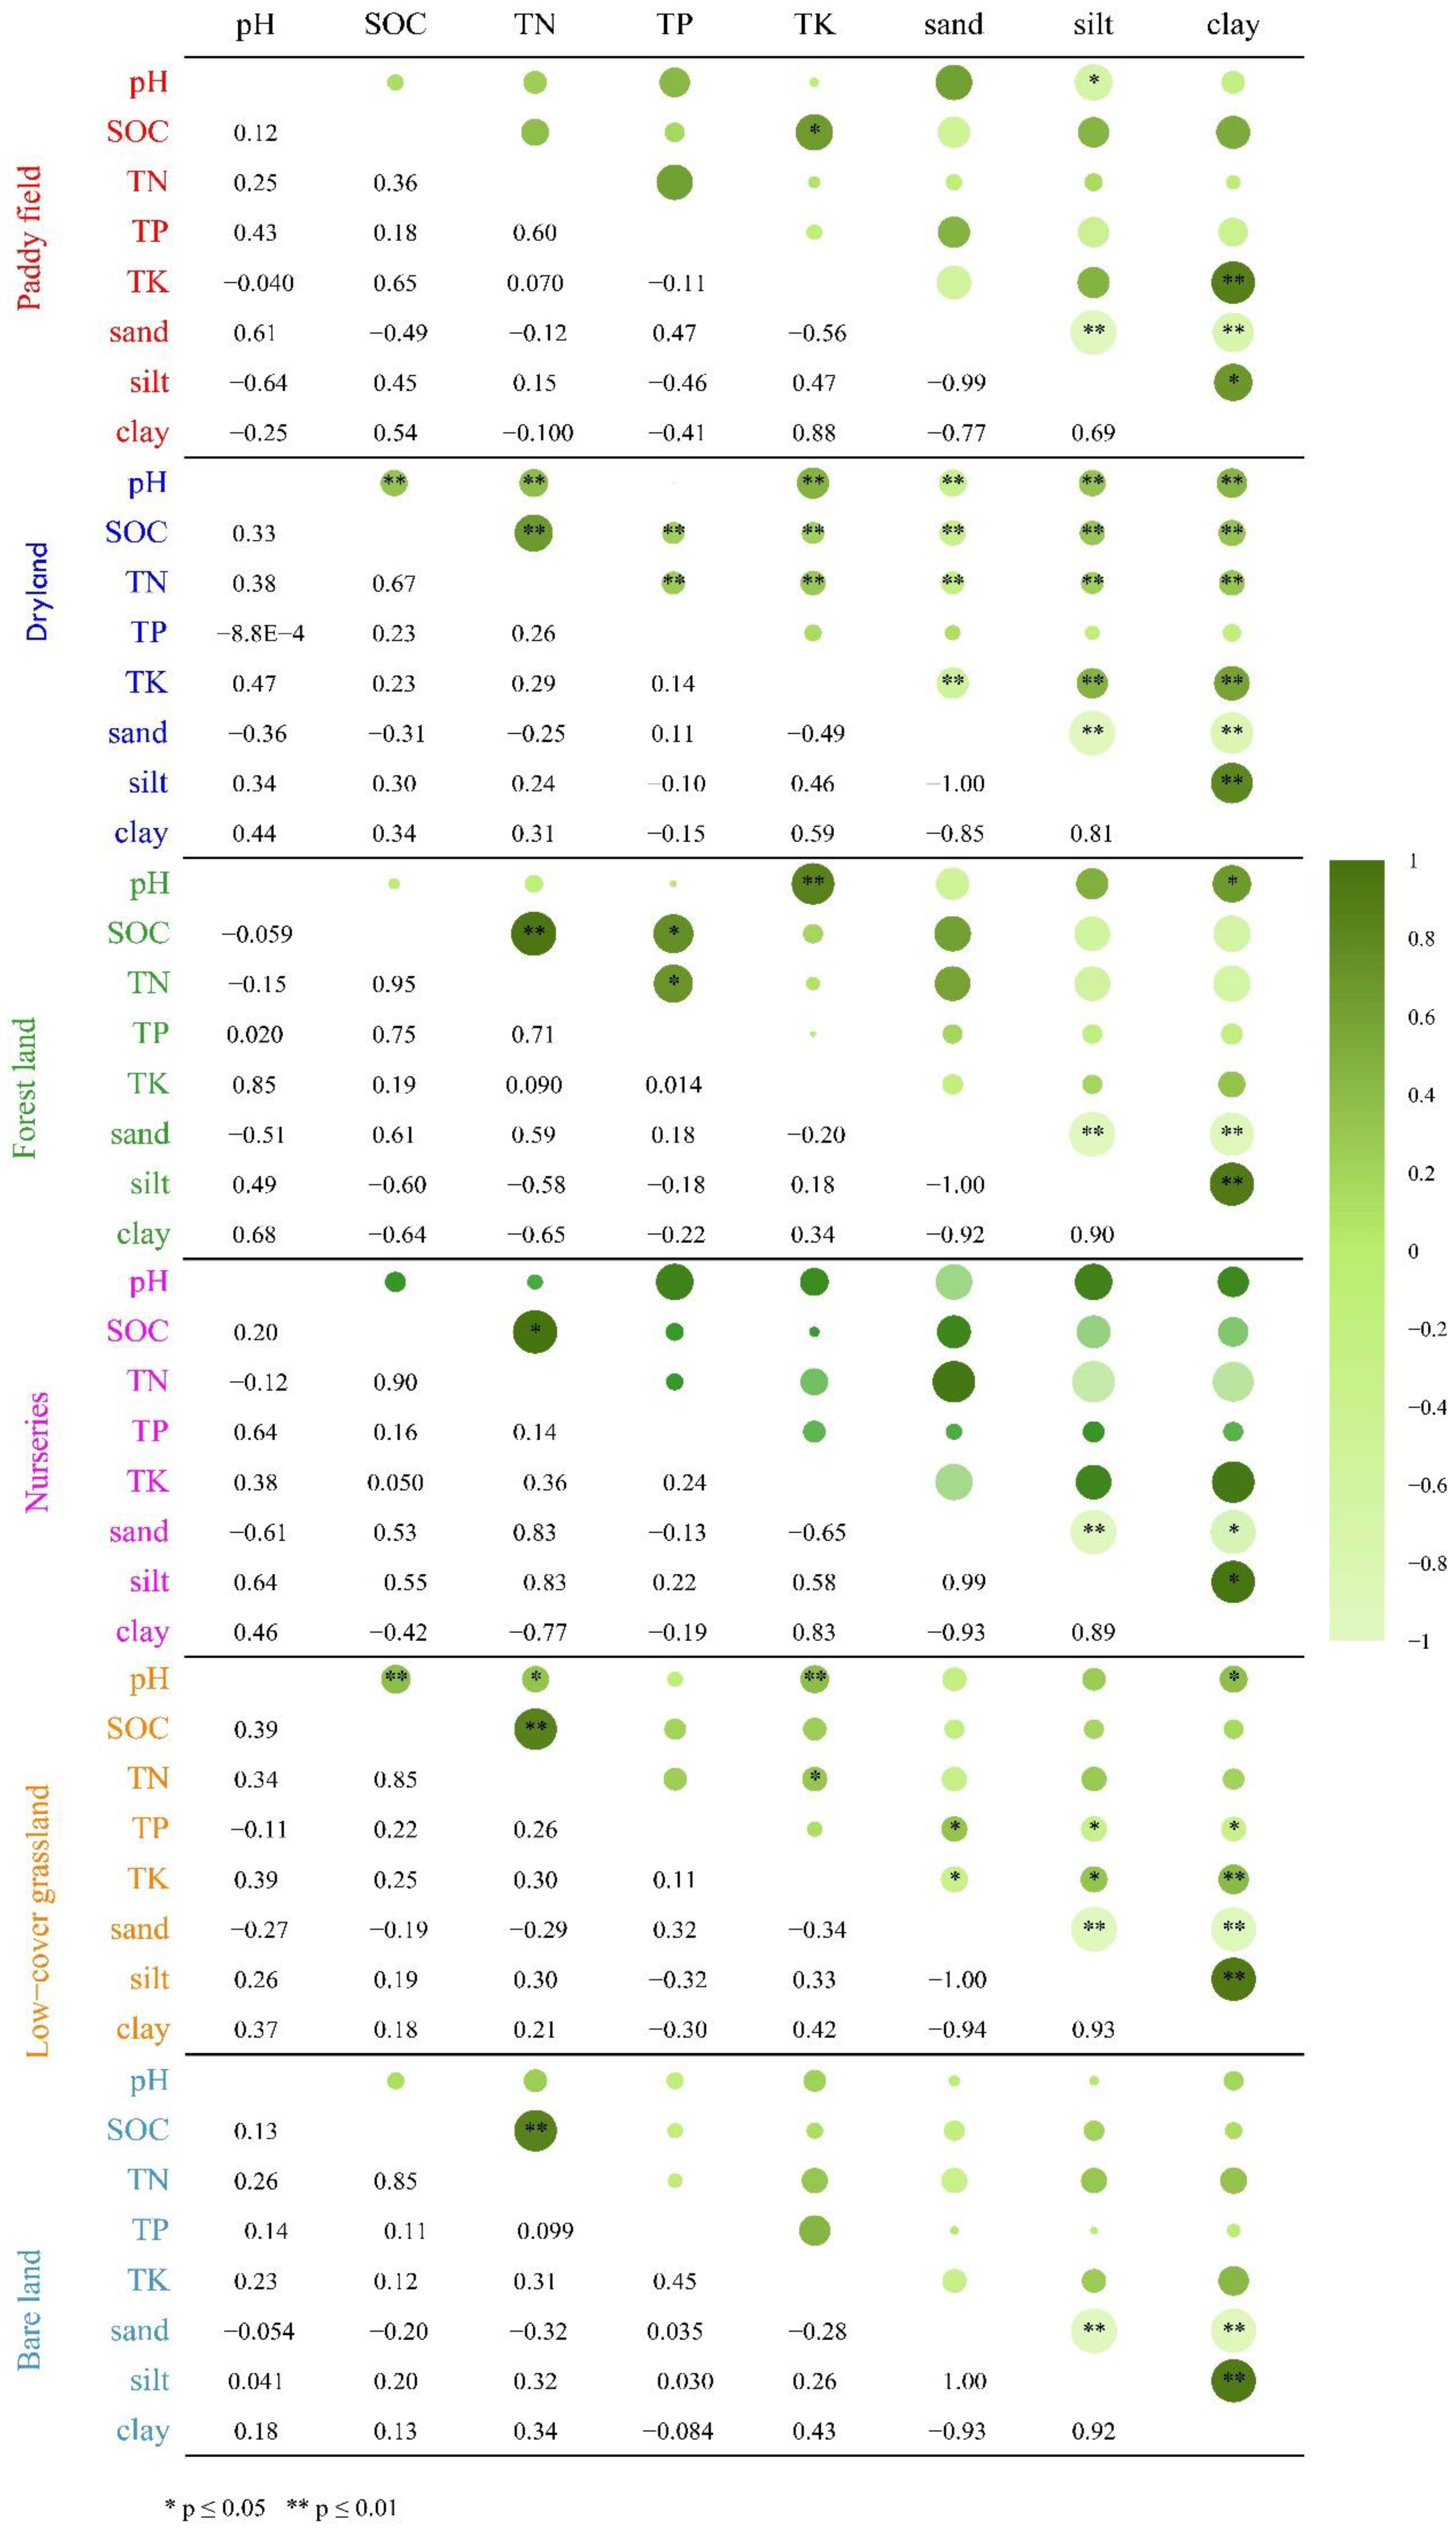
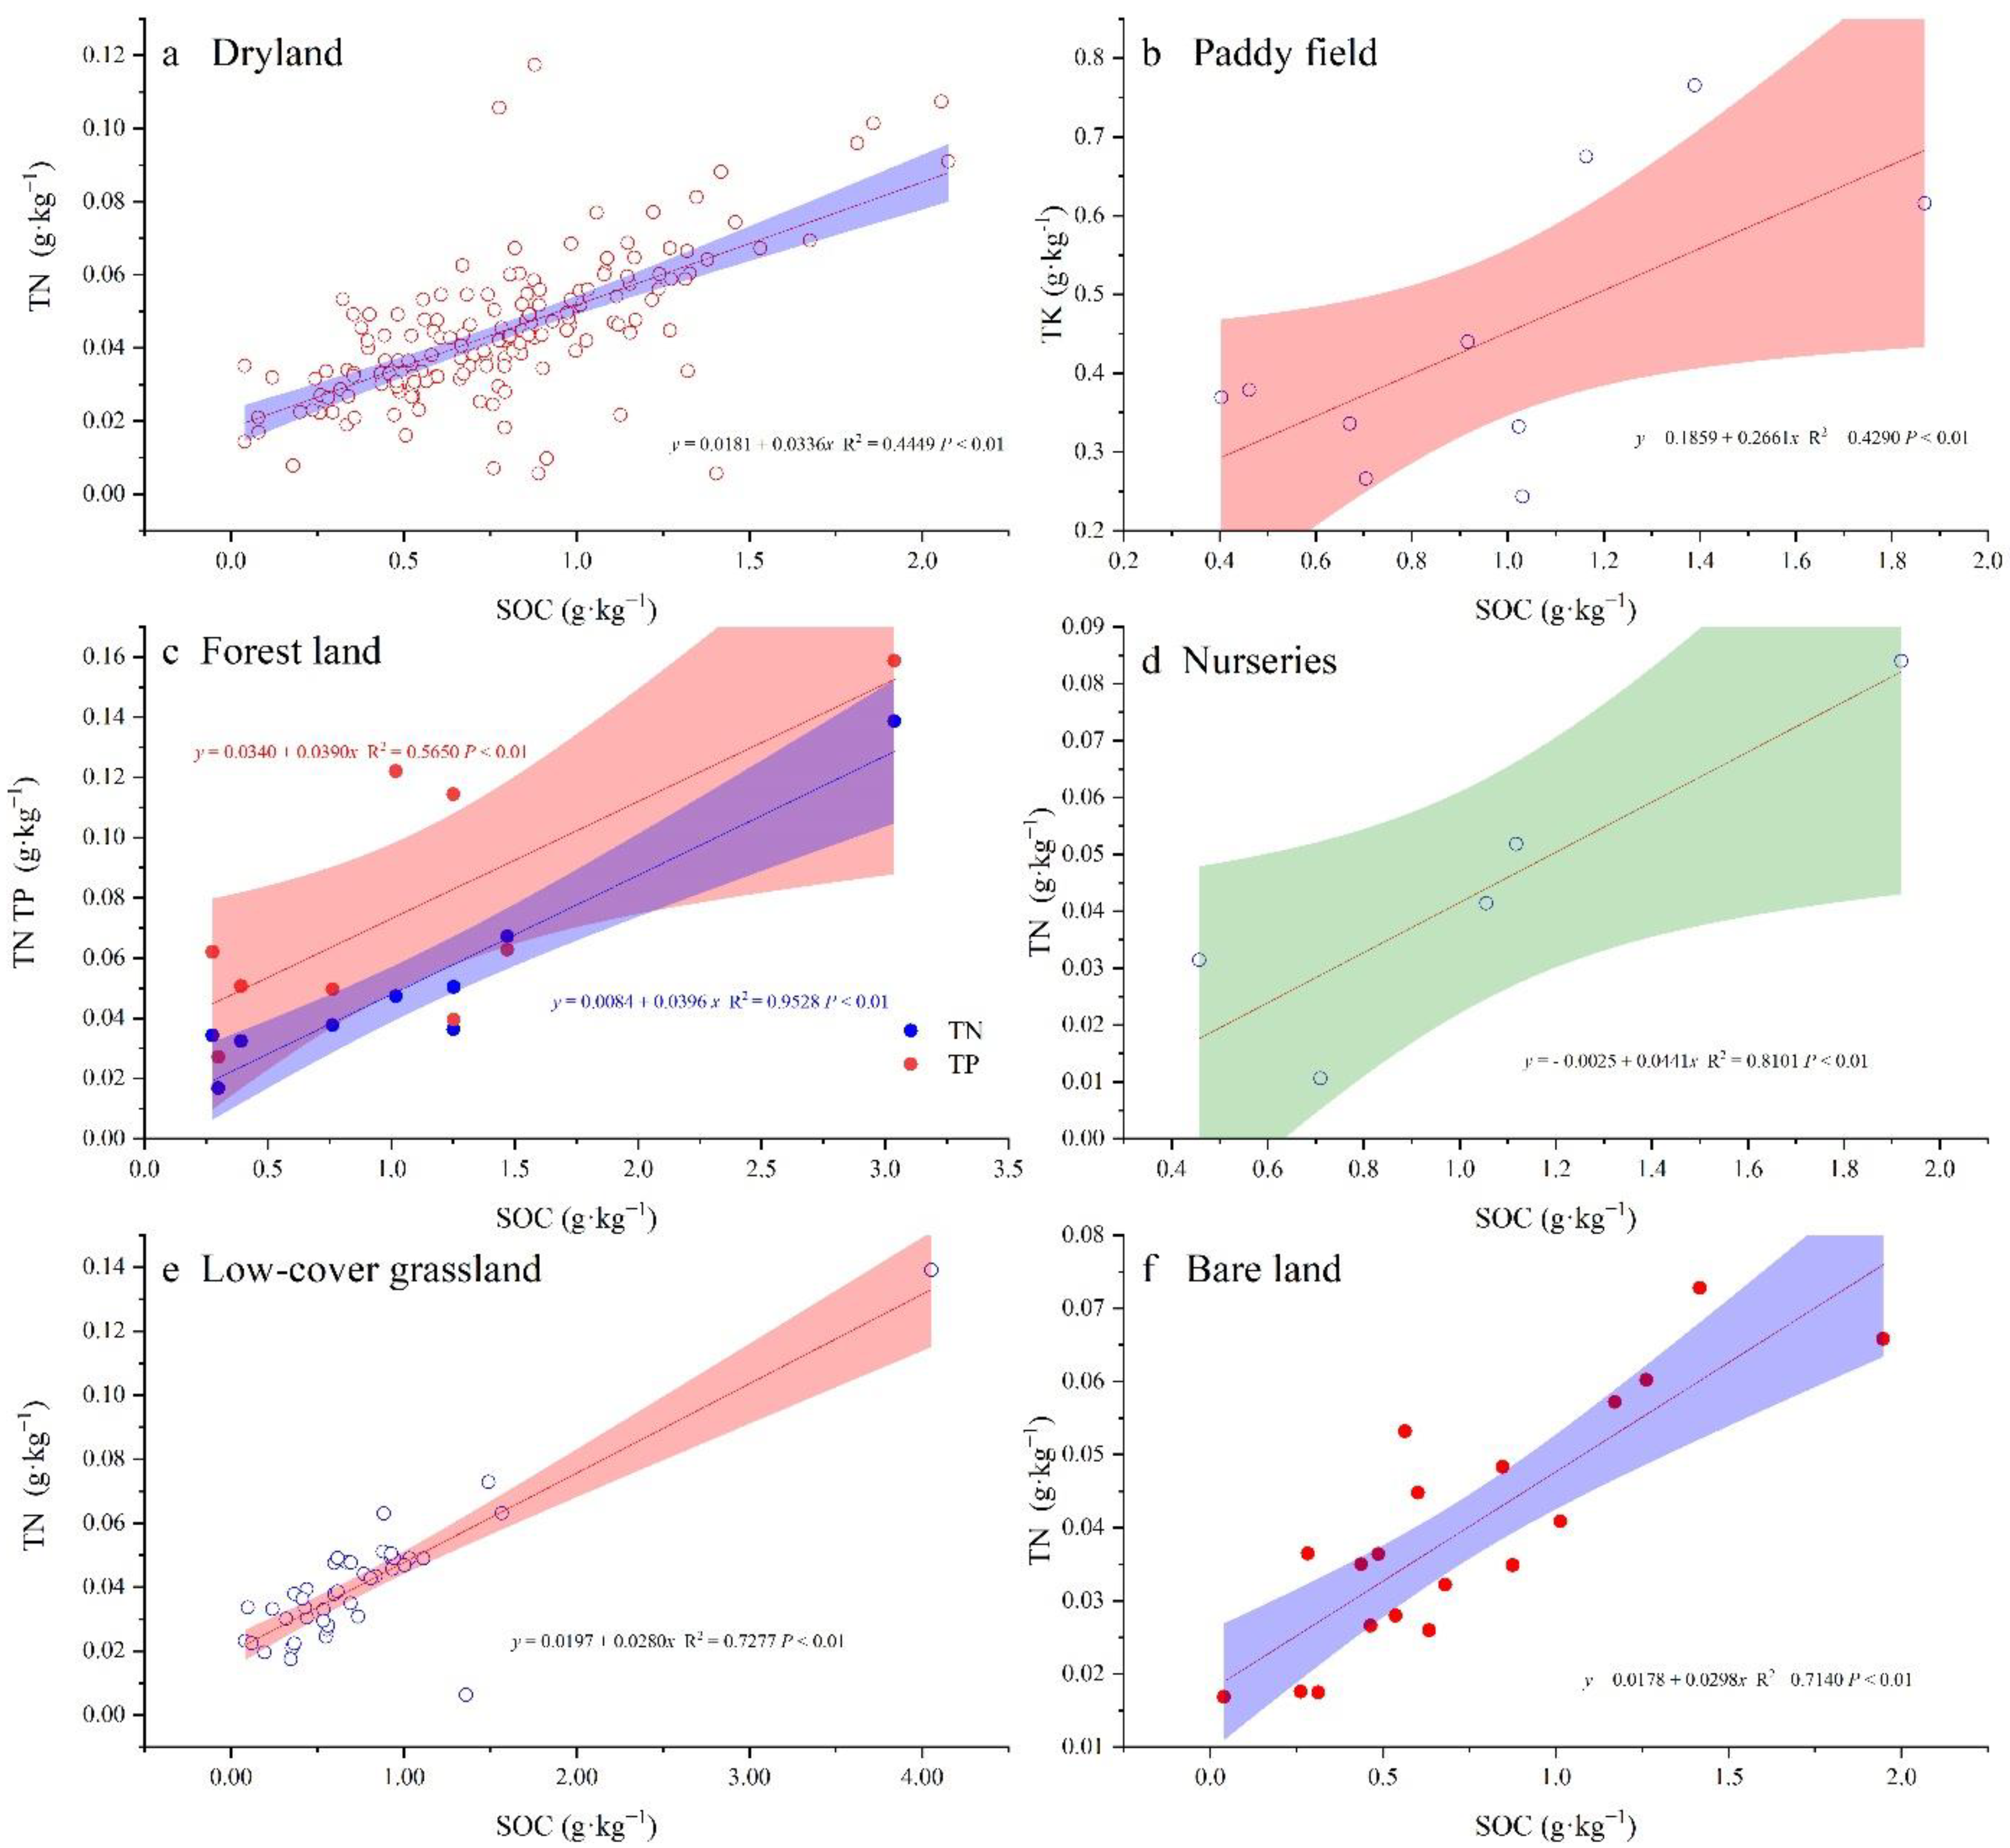
3.3. Soil Nutrient Content and Its Correlation

The soil samples were analyzed to study the relationship between various indicators and to determine the correlation between SOC and the soil physical and chemical indicators. The results of the correlation analysis of different soil nutrients in the study area showed that the correlation between pH and nutrients was low, and there was a considerable positive correlation between pH and TK and TP only in forest land and nurseries. The correlation between pH and the percentage of sand, silt, and clay was low in drylands, low-cover grasslands, and bare land. In paddy fields, pH was significantly positively correlated with the percentage of sand in the soil, but in other land-use types, pH was negatively correlated with the percentage of sand in varying degrees and positively correlated with the percentage of silt and clay in varying degrees (Figure 4).
Both SOC and TN were positively correlated with different land-use types. Except for paddy fields, SOC and TN were highly correlated and exhibited a significant correlation with other land use types. The correlation between SOC and the percentage of sand, silt, and clay was low in the different land use types. Total P and TN were positively correlated in paddy and forest lands, but TK had a weak correlation with other nutrients. Total N, TP, and TK were correlated in drylands, low-cover grasslands, bare land, forest land, and nurseries, but the correlation coefficient was low (Figure 4).
Regression analysis of SOC and TN showed that there was a strong linear relationship between TN and SOC in drylands, nurseries, forest land, low-cover grasslands, and bare land, and that TN increased with an increase in SOC. This shows that the correlation between soil TN and SOC levels is high, and that the content of soil TN is conducive to the fixation and improvement of SOC. The linear regression slopes of dryland, forestland, nurseries, low-cover grasslands, and bare land were 0.0336, 0.0396, 0.044, 0.0280, and 0.0298, respectively (Figure 5).
In contrast to other land-use types, there was a strong linear relationship between SOC and TK in paddy fields, and TK content gradually increased with increasing SOC. The correlation between SOC and TN was weak.

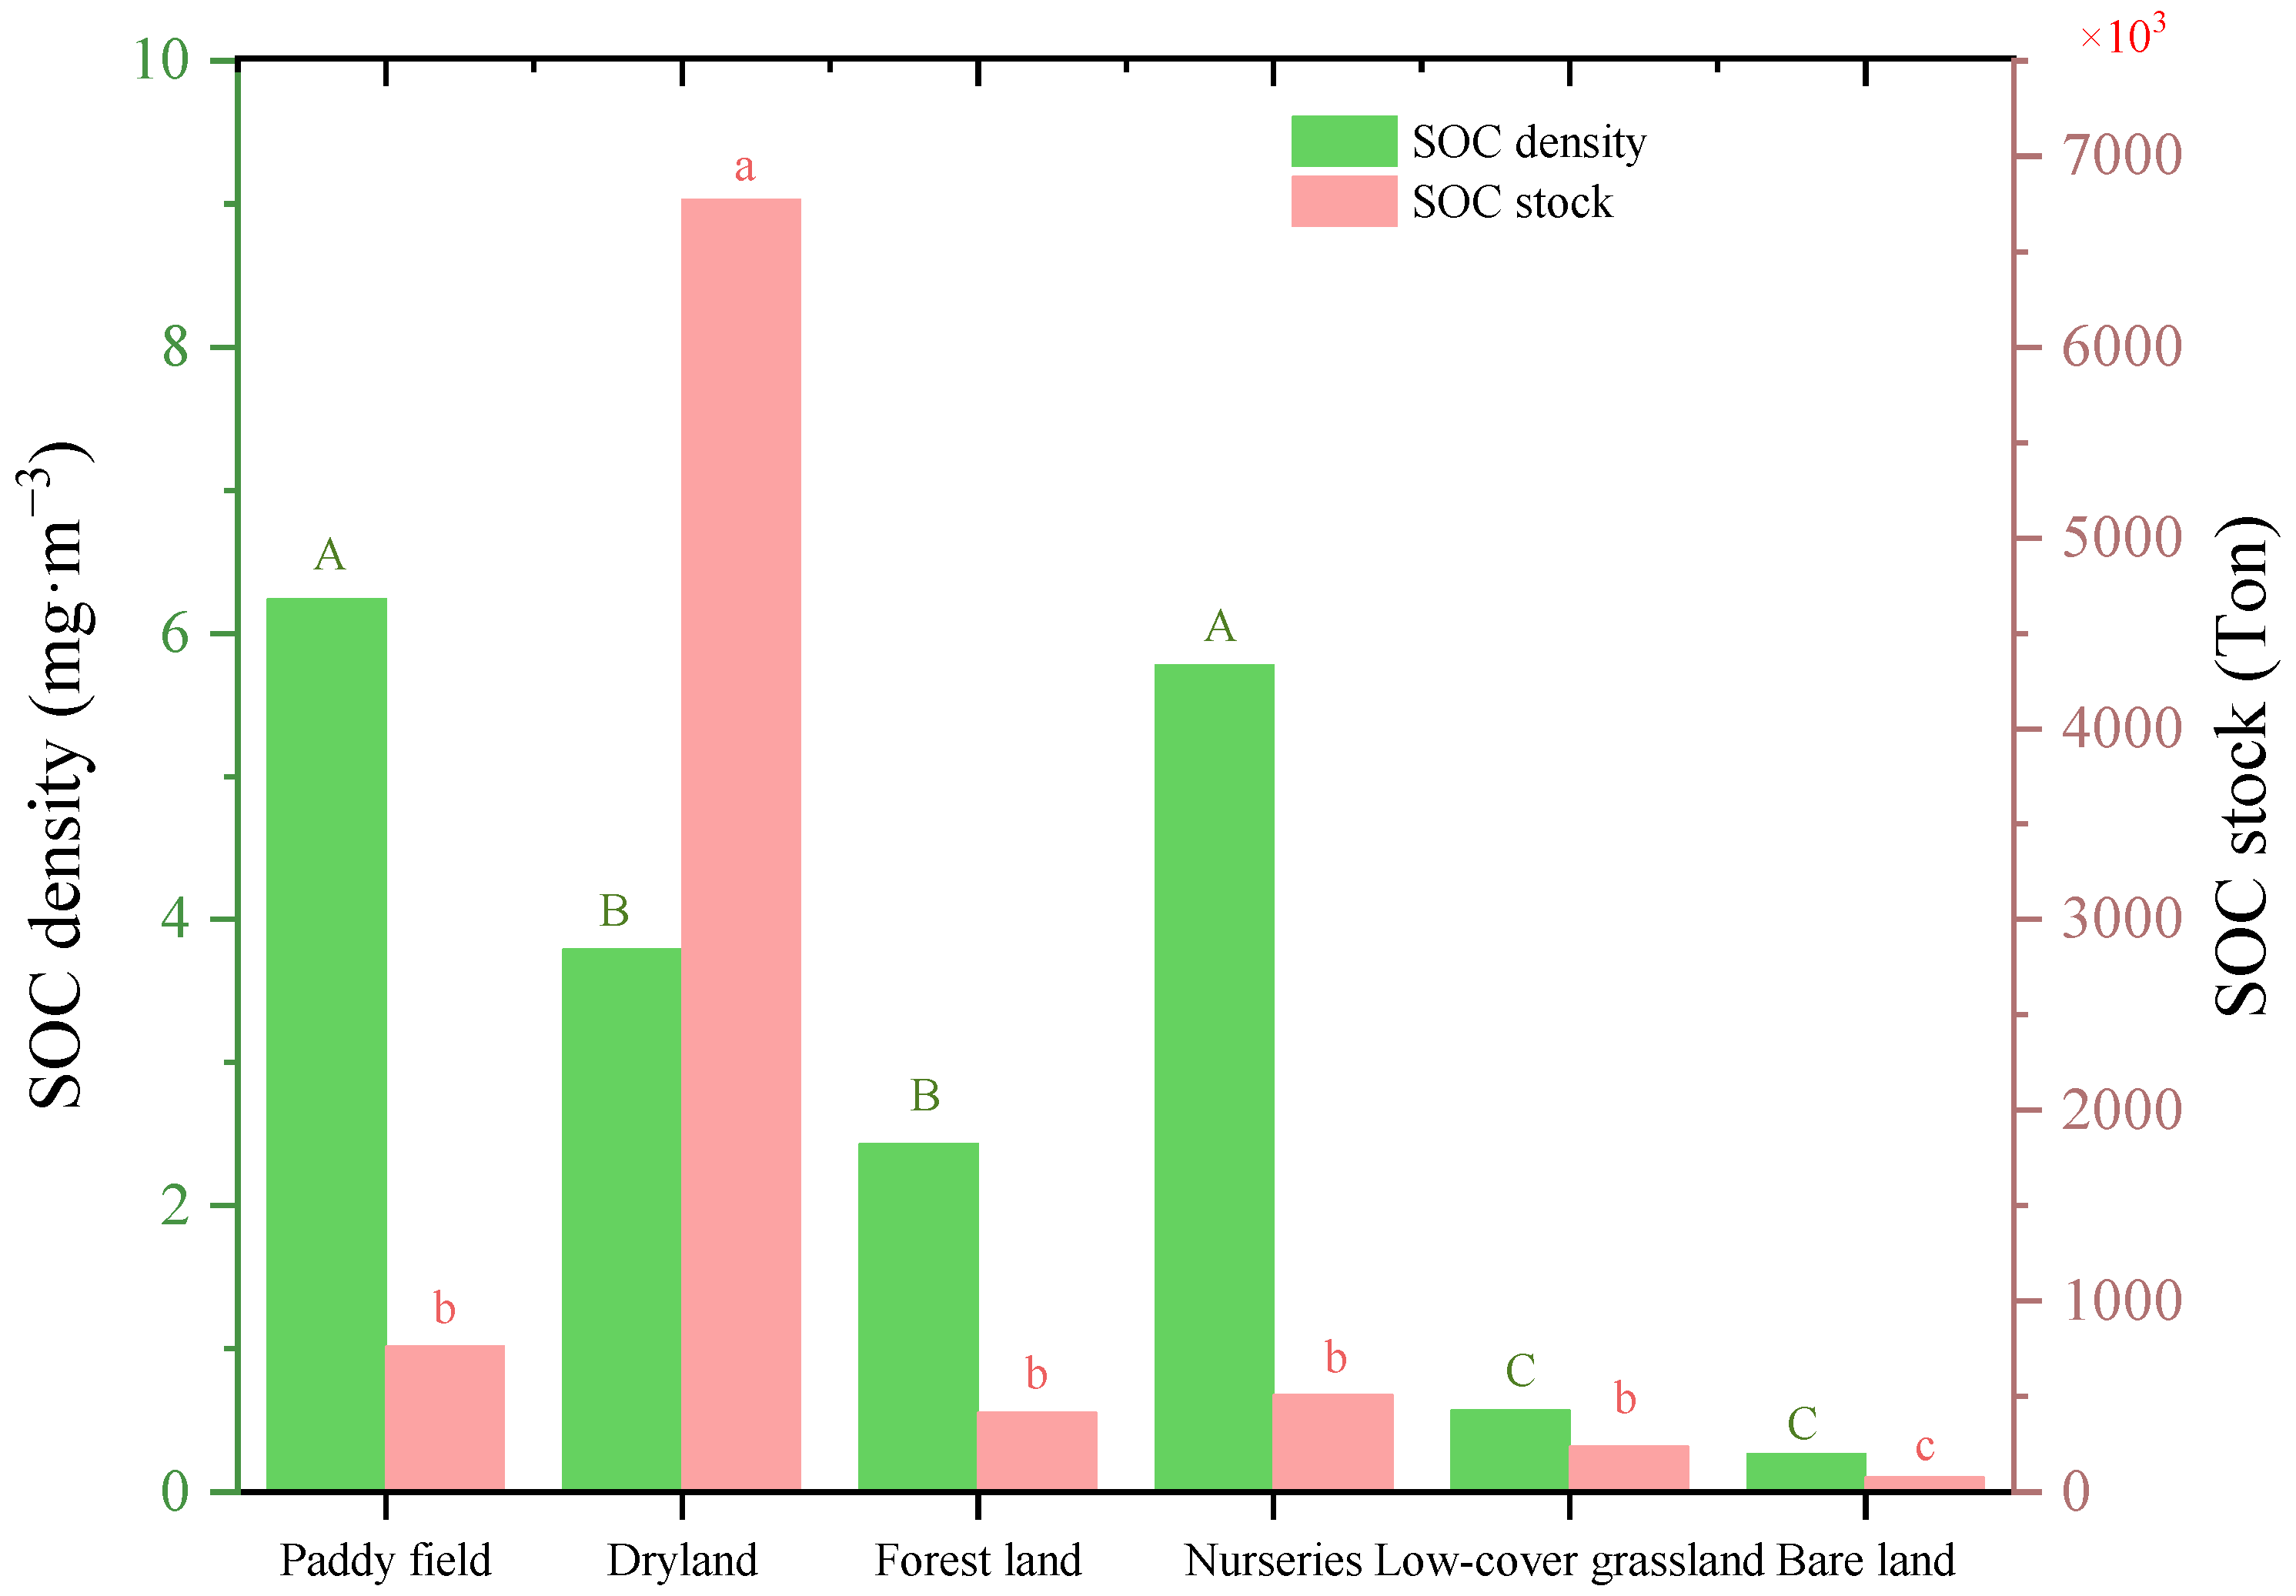
3.4. Estimation of the SOC Pool and Distribution of SOC Density in the Main Land-Use Types

The results of the soil C density calculations showed that paddy fields had the highest soil C density. The order of soil C density for different land use types was paddy field > nurseries > dryland > forest land > low-cover grassland > bare land (Figure 6). In the northern and western regions, the soil types are mainly skeletal soil and lithosols, which are not conducive to agricultural cultivation and have low organic C density. Paddy soil, lime concretion black soil, and fluvo-aquic soil have high organic C densities; thus, strengthening the management of these three soil types will help to improve SOC storage in Linyi City.
The total storage of SOC in Linyi was 8772.73 × 103 ton, of which the largest storage was in dryland 6771.45 × 103 ton, accounting for 77.12% of total reserves. The order of total SOC storage for different land use types was drylands > paddy field > nurseries > forest land > low-cover grasslands > bare land. The SOC density in paddy fields was relatively high, but the area was relatively small; therefore, SOC storage by this land-use type was only 8.72% of the SOC storage.

4. Discussion

The SOC content depends on the amount of soil decomposition and the input of external organic material carbon, whereas the difference in SOC between different land uses is mainly affected by the input of soil parent materials, organic materials, and agricultural management [25]. This study showed that the SOC content of forest land was higher than that of dryland and paddy field (Table 1), because the biomass of organic matter in the forest land was large and was less disturbed by human activities. Therefore, forestland is more conducive to the accumulation of soil organic carbon content, which is in agreement with findings from previous studies [26,27,28]. Feng et al. [29] analyzed 259 soil samples and found that the SOC of forestland was significantly higher than that of farmland and grasslands. This is because farmland soils may intensify the mineralization of organic carbon during continuous cultivation. In addition, the soil is moved up and down in the 0–20 cm soil layer, and the soil structure is significantly damaged, which leads to an accelerated decomposition rate of organic carbon in the soil system, resulting in a low SOC content. However, during the long-term absence of agricultural management, low vegetation coverage, and increasingly severe soil erosion and water and soil loss in bare land, SOC is also lost [30,31], which is consistent with the results of this study.
In this study, the SOC content in dry land and paddy fields was also high, which was related to straw mulching in this area. Previous studies have shown that straw mulching can increase SOC content. Li et al. [32] reported similar results in a study of sustainable technology of saving water and improving efficiency in dryland winter wheat production, as did Li [33] regarding the influence of straw mulch and no-tillage on soil respiration, its components and economic benefit in a Chinese wheat–maize cropping system.
Tillage measures are believed to be conducive to the formation of soil aggregates and can increase the SOC content of large aggregates in surface soil [34]. Research by Zhang [35] on organic C in soil aggregates showed that, compared with traditional tillage, ridge tillage increased the organic C content in aggregates of all particle sizes, whereas no tillage increased the organic C content in particulate aggregates. Therefore, the chemical structure of cultivated SOC is more complex than that of tillage, and the SOC is more stable. In this study, the C/N ratios of land use with a relatively large interference from human activities (paddy fields, drylands, forest land, and nurseries) were greater than those of land use with a relatively small interference from human activities (low-cover grasslands and bare land). The C/N ratios of the different land-use types were in the order nurseries > paddy field > low-cover grasslands > drylands > forest land > bare land (Figure 7). Therefore, it can be considered that human activities can increase the C/N ratio in soil.
A surface C/N ratio of 20 was the actual equilibrium value for biological solidification and mineralization. When the C/N ratio was less than 20, mineralization was stronger than solidification, and when the C/N ratio was greater than 20, biological fixation exceeds mineralization [36]. The C/N ratio of organic matter components in bare soil under different land-use types was less than 20, indicating that net mineralization occurred in these soils. Biological fixation in paddy fields exceeds mineralization. The order of C/N was nurseries > paddy field > low-cover grasslands > drylands > forest land.
Different land use types had a significant influence on SOC content. This is mainly because vegetation differs under different land use types [37]. SOC content mainly depends on the annual amount of vegetation returned and the decomposition rate of vegetation. A large return amount of litterfall and a slow decomposition rate will lead to increased organic C accumulation in the soil; however, soil aggregates also have a significant impact on SOC content [38]. The irrigated paddy fields had better soil aggregates than the soil under other utilization types, and the soil was more conducive to the protection and fixation of organic matter under anaerobic conditions. When straw was returned to the field, a humid environment helped humification; therefore, the average organic matter content in the irrigated paddy field was relatively high among all land-use types. Liu [39] showed that the utilization efficiency of soil active substances, soil vitality, and nutrients under drylands was lower than that of paddy fields. In addition, the amount of straw and other plant residues returned to the field under dryland and nursery conditions was low, the amount of inorganic fertilizer was large, and the amount of organic fertilizer was small, which resulted in an SOC deficit state; hence, the SOC content of the dryland and nurseries was low [40]. The soil in the nurseries was a highly mature soil type. Human efforts to strengthen vegetation management should include efforts to generate a high SOC content. However, in this study, SOC in the nurseries was relatively dispersed as large-scale planting had not been undertaken. The input to the nurseries was uneven, which also explains why the SOC content was low and the coefficient of variation was high.
The spatial differentiation of SOC in different land use types can be quite different and is largely attributed to the level of farmers’ investment in the land [41]. Paddy fields and drylands are the primary land use types in Linyi. To obtain a high yield, farmers apply more fertilizer; therefore, the soil nutrient content in paddy fields is less affected by the original physical and chemical properties of the soil but more affected by human management measures, and the soil nutrient distribution is uniform. The nurseries in Linyi are extensively managed and mainly distributed in the northern higher terrain and on both sides of the river, which is not conducive to farming and management [42]. SOC content was greatly affected by the inherent physical and chemical properties of the soil, resulting in a high coefficient of variation and an uneven distribution of soil nutrients.
Different soil types have important effects on SOC content. The SOC content in the Linyi region is generally expressed as skeletal soil < lithosol < brown soil < fluvo-aquic soil < lime concretion black soil < paddy soil [43]. Skeletal soil and lithosols belonging to the primary soil are mainly distributed in areas of bare land, where soil nutrient content is low and unfavorable for agricultural cultivation. Brown soil is mainly distributed in the drylands owing to the influence of agricultural cultivation and fertilization, resulting in a relatively high C content [44]. Fluvo-aquic and paddy soils are mainly distributed in areas of paddy fields. The organic C content of the paddy soil was relatively high, indicating that the soil is conducive to the accumulation and improvement of SOC under long-term flooding. This might be the main reason why the SOC content in the study area was mainly distributed in paddy fields. Fertilization and other farming measures also greatly influenced the distribution of SOC content; thus, the SOC content in paddy fields showed a more uniform distribution than that in other types of land use. The texture of the brown soil in the areas with drylands was sandy loam. The texture of sandy soil is loose, and soil aeration and permeability are strong, which is conducive to the activity of microorganisms but not to water and fertilizer conservation; hence, organic C in sandy soil is not conducive to accumulation and preservation, resulting in its low levels [42]. There was a positive correlation between the distribution of SOC and soil texture. The more viscous the soil texture, the more conducive it is to the retention and accumulation of soil nutrients and the more conducive it is to the distribution of SOC (Figure 2).
Different geomorphic types have important effects on the SOC distribution. Landforms affect land use by affecting the circulation, mode, and direction of surface materials, thereby determining the level of SOC [45]. There are many mountains in the west of Linyi City, hills in the east, and plains in the south. Combined with the distribution of SOC (Figure 2), it can be seen that the SOC content was high in plain areas and low in mountainous and hilly areas. This is primarily because different geomorphic types are distributed at different altitudes and have different restrictions on their human use. The mountains and hills are characterized by high altitude and a large elevation drop, which is not conducive to large-scale agricultural utilization. The agricultural input and management levels were low; therefore, organic C content was low.
Returning farmland straw to the field and leaf litter to the forest floor are important factors affecting SOC content [46]. In farmland soil, the root residues, returned straw, and organic fertilizer left on the surface and in soil after the harvest of crops enter the soil every year and become the food of soil organisms (including soil animals and soil microorganisms). Under the action of soil organisms, especially soil microorganisms, organic materials are decomposed and transformed and CO2 and mineral nutrients are released [47]. Simultaneously, the metabolic activities of soil organisms produce soil humus, most of which is not converted into stable organic C but continues to be decomposed and mineralized after being retained in the soil for a certain number of years [48]. Research shows that after fresh organic substances, such as green manure, are mechanically crushed and plowed into the soil, the most easily decomposed parts (organic substances with low C/N) are used as food and energy by soil organisms within a few months and converted into CO2 [42]. Organic materials that are difficult to decompose, such as root residues with a high C/N ratio and high lignin content, decompose slowly, but will also be completely degraded and mineralized in decades. Under good agricultural production conditions, the nutrient organic C entering the soil every year nurtures soil organisms, promotes various beneficial soil biological processes, promotes the continuous degradation and regeneration of soil humus, and promotes the formation of soil aggregate structures, which has a positive impact on soil biological, physical, and chemical properties, and nurtures fertile soil [49]. This is an important reason for the relatively high SOC content in forested land and the agricultural cultivation areas in the present study. Because the practice of returning straw to paddy fields for farming is absent, the correlation between SOC and TN content in paddy fields was poor, whereas SOC and TK showed a good linear correlation.

5. Conclusions

The results of the analysis of the relationship between land use and SOC were as follows.
Land use type can affect the SOC content. SOC content was relatively high in the central and southern parts of Linyi, and the area with high SOC content was consistent with the distribution of paddy fields. The comparison of SOC content of different land use types showed that the SOC content in forestland was the highest. The distribution of SOC content was influenced by factors including land use type, soil type, landform type, and farming method. Soil organic C was positively correlated with TN under different land-use types.
Land use types can affect the storage and density of SOC. The total SOC storage in Linyi City was 8772.73 × 103 ton in the surface 0.2 m soil layer, of which the largest storage was in drylands (6771.45 × 103 ton), accounting for 77.12% of total reserves. Paddy fields had the highest soil C density (6.24 kg·m−3) in the surface 0.2 m soil layer. The order of soil C density for different land-use types was paddy fields > nurseries > drylands > forest land > low-cover grasslands > bare land. With the largest SOC storage, and C density, respectively, drylands and paddy fields are conducive to enhancing soil C sequestration, achieving low-carbon goals, and mitigating climate change in warm temperate monsoon continental climate.

Author Contributions

All authors contributed to the conception and design of this study. Material preparation, data collection, and analysis were performed by L.W., X.W., and H.S. The first draft of the manuscript was written by L.W., and data analysis was performed by J.A., Y.W. (Yuanzhi Wu), and Y.W. (Yun Wang). Q.L. commented on the previous versions of the manuscript. All authors have read and agreed to the published version of the manuscript.

Funding

This work was supported by the National Natural Science Foundation of China (42277337, 32071630, 41977067, and 42277306) and Natural Science Foundation of Shandong Province, China (ZR2021MD045, ZR2021MD003, and ZR2020MD102).

Institutional Review Board Statement

Not applicable.

Informed Consent Statement

Not applicable.

Data Availability Statement

The data used to support the findings of this study are available from the corresponding author upon request (e-mails: [email protected] and [email protected]).

Conflicts of Interest

The authors declare no conflict of interest.

References

  1. Nakayama, T.; Pelletier, G.J. Impact of global major reservoirs on carbon cycle changes by using an advanced eco-hydrologic and biogeochemical coupling model. Ecol. Model. 2018, 387, 172–186. [Google Scholar] [CrossRef]
  2. Yamaka, W.; Phadkantha, R.; Rakpho, P. Economic and energy impacts on greenhouse gas emissions: A case study of China and the USA. Energy Rep. 2021, 7, 240–247. [Google Scholar] [CrossRef]
  3. Chen, J.H.; Jiang, L.C.; Wang, W.T.; Wang, P.Y.; Li, X.; Ren, H.; Wang, Y.G. Facile construction of highly porous carbon materials derived from porous aromatic frameworks for greenhouse gas adsorption and separation. Microporous Mesoporous Mater. 2021, 326, 111385. [Google Scholar] [CrossRef]
  4. Fang, C. Decreased temperature sensitivity of soil respiration induced by warming slowed topsoil carbon turnover in a semi-arid grassland. Appl. Soil Ecol. 2022, 180, 104620. [Google Scholar] [CrossRef]
  5. Leifeld, J.; Keel, S.G. Quantifying negative radiative forcing of non-permanent and permanent soil carbon sinks. Geoderma 2022, 423, 115971. [Google Scholar] [CrossRef]
  6. Wang, H.; Zhang, X.; Wu, W.; Liu, H.B. Prediction of Soil Organic Carbon under Different Land Use Types Using Sentinel-1/-2 Data in a Small Watershed. Remote Sens. 2021, 13, 1229. [Google Scholar] [CrossRef]
  7. Bhagat, V.S. Space-borne Passive Microwave Remote Sensing of Soil Moisture:A Review. Recent Prog. Space Technol. 2014, 4, 119–150. [Google Scholar]
  8. Zhou, Y.; Hartemink, A.E.; Shi, Z.; Liang, Z.Z.; Lu, Y.L. Land use and climate change effects on soil organic carbon in North and Northeast China. Sci. Total Environ. 2019, 647, 1230–1238. [Google Scholar] [CrossRef]
  9. Houghton, R.A.; Hackler, J.L. Emissions of carbon from forestry and land-use change in tropical Asia. Glob. Chang. Biol. 1999, 5, 481–492. [Google Scholar] [CrossRef]
  10. Xia, X.Q.; Yang, Z.F.; Liao, Y.; Cui, Y.J.; Li, Y.S. Temporal variation of soil carbon stock and its controlling factors over the last two decades on the southern Song-nen Plain, Heilongjiang Province. Geosci. Front. 2010, 1, 125–132. [Google Scholar] [CrossRef] [Green Version]
  11. Kooch, Y.; Ghorbanzadeh, N.; Kuzyakov, Y.; Praeg, N.; Ghaderi, E. Investigation of the effects of the conversion of forests and rangeland to cropland on fertility and soil functions in mountainous semi-arid landscape. Catena 2022, 210, 105951. [Google Scholar] [CrossRef]
  12. Khosravi Aqdam, K.; Yaghmaeian Mahabadi, N.; Ramezanpour, H.; Rezapour, S.; Mosleh, Z.; Zare, E. Comparison of the uncertainty of soil organic carbon stocks in different land uses. J. Arid Environ. 2022, 205, 104805. [Google Scholar] [CrossRef]
  13. Batjes, N. Total carbon and nitrogen in the soils of the world. Eur. J. Soil Sci. 1996, 47, 151–163. [Google Scholar] [CrossRef]
  14. Xu, H.W.; Qu, Q.; Li, G.W.; Liu, G.B.; Geissen, V.; Ritsema, C.J.; Xue, S. Impact of nitrogen addition on plant-soil-enzyme C–N–P stoichiometry and microbial nutrient limitation. Soil Biol. Biochem. 2022, 170, 108714. [Google Scholar] [CrossRef]
  15. Zhang, X.; Li, M.J.; Yang, C.; Zhan, L.Q.; Wu, W.; Liu, H.B. The stratification of soil organic carbon and total nitrogen affected by parent material and cropping system. Catena 2022, 210, 105898. [Google Scholar] [CrossRef]
  16. Kooch, Y.; Ehsani, S.; Akbarinia, M. Stratification of soil organic matter and biota dynamics in natural and anthropogenic ecosystems. Soil Tillage Res. 2020, 200, 104621. [Google Scholar] [CrossRef]
  17. Qu, Q.; Xu, H.W.; Xue, S.; Liu, G.B. Stratification ratio of rhizosphere soil microbial index as an indicator of soil microbial activity over conversion of cropland to forest. Catena 2020, 195, 104761. [Google Scholar] [CrossRef]
  18. Franzluebbers, A.J.; Stuedemann, J.A. Soil-profile distribution of inorganic N during 6 years of integrated crop-livestock management. Soil Tillage Res. 2013, 134, 83–89. [Google Scholar] [CrossRef]
  19. Škrabec, C.G.; Carné, A.V.; Pérez, M.C.; Corral, J.; Pujol, A.F.; Cuadrado, M.; Troya, J.; Ibáñez, J.-F.J.; Parés, D. Early and late anastomotic leak after colorectal surgery: A systematic review of the literature. Cirugía Española Engl. Ed. 2022, in press. [Google Scholar] [CrossRef]
  20. Jiang, T.; Schuchardt, F.; Li, G.X.; Guo, R.; Zhao, Y.Q. Effect of C/N ratio, aeration rate and moisture content on ammonia and greenhouse gas emission during the composting. J. Environ. Sci. 2011, 23, 1754–1760. [Google Scholar] [CrossRef]
  21. Wang, X.; Jing, Z.H.; He, C.; Liu, Q.Y.; Qi, J.Y.; Zhao, X.; Xiao, X.P.; Zhang, H.L. Temporal variation of SOC storage and crop yield and its relationship—A fourteen year field trial about tillage practices in a double paddy cropping system, China. Sci. Total Environ. 2021, 759, 143494. [Google Scholar] [CrossRef] [PubMed]
  22. Dong, X.; Li, Y.; Pan, Y.; Huang, Y.; Cheng, X. Study on Urban Fire Station Planning based on Fire Risk Assessment and GIS Technology. Procedia Eng. 2018, 211, 124–130. [Google Scholar] [CrossRef]
  23. Hong, Z.H.; Li, H.X.; Rullkötter, J.; Mackenzie, A.S. Geochemical application of sterane and triterpane biological marker compounds in the Linyi Basin. Org. Geochem. 1986, 10, 433–439. [Google Scholar]
  24. Six, J.; Elliott, E.T.; Paustian, K.; Doran, J.W. Aggregation and Soil Organic Matter Accumulation in Cultivated and Native Grassland Soils. Soil Sci. Soc. Am. J. 1998, 62, 1367–1377. [Google Scholar] [CrossRef] [Green Version]
  25. Song, B.; Almatrafi, E.; Tan, X.; Luo, S.; Xiong, W.; Zhou, C.; Qin, M.; Liu, Y.; Cheng, M.; Zeng, G.; et al. Biochar-based agricultural soil management: An application-dependent strategy for contributing to carbon neutrality. Renew. Sustain. Energy Rev. 2022, 164, 112529. [Google Scholar] [CrossRef]
  26. Koga, N.; Shimoda, S.; Shirato, Y.; Kusaba, T.; Shima, T.; Niimi, H.; Yamane, T.; Wakabayashi, K.; Niwa, K.; Kohyama, K.; et al. Assessing changes in soil carbon stocks after land use conversion from forest land to agricultural land in Japan. Geoderma 2020, 377, 114487. [Google Scholar] [CrossRef]
  27. Fu, C.; Chen, Z.; Wang, G.; Yu, X.; Yu, G. A comprehensive framework for evaluating the impact of land use change and management on soil organic carbon stocks in global drylands. Curr. Opin. Environ. Sustain. 2021, 48, 103–109. [Google Scholar] [CrossRef]
  28. Phukubye, K.; Mutema, M.; Buthelezi, N.; Muchaonyerwa, P.; Cerri, C.; Chaplot, V. On the impact of grassland management on soil carbon stocks: A worldwide meta-analysis. Geoderma Reg. 2022, 28, e00479. [Google Scholar] [CrossRef]
  29. Feng, Z.; Fan, Z.; Song, H.; Li, K.; Lu, H.; Liu, Y.; Cheng, F. Biochar induced changes of soil dissolved organic matter: The release and adsorption of dissolved organic matter by biochar and soil. Sci. Total Environ. 2021, 783, 147091. [Google Scholar] [CrossRef]
  30. Bi, H.; Liu, B.; Wu, J.; Yun, L.; Chen, Z.; Cui, Z. Effects of precipitation and landuse on runoff during the past 50 years in a typical watershed in Loess Plateau, China. Int. J. Sediment Res. 2009, 24, 352–364. [Google Scholar] [CrossRef]
  31. Yao, H. Characterizing landuse changes in 1990–2010 in the coastal zone of Nantong, Jiangsu province, China. Ocean Coast. Manag. 2013, 71, 108–115. [Google Scholar] [CrossRef]
  32. Li, R.; Chai, S.; Chai, Y.; Li, Y.; Chang, L.; Cheng, H. Straw strips mulching: A sustainable technology of saving water and improving efficiency in dryland winter wheat production. J. Integr. Agric. 2022, in press. [Google Scholar] [CrossRef]
  33. Li, Z.; Zhang, Q.; Qiao, Y.; Du, K.; Li, Z.; Tian, C.; Zhu, N.; Leng, P.; Yue, Z.; Cheng, H.; et al. Influence of straw mulch and no-tillage on soil respiration, its components and economic benefit in a Chinese wheat–maize cropping system. Glob. Ecol. Conserv. 2022, 34, e02013. [Google Scholar] [CrossRef]
  34. Jin, H.; Zhong, Y.; Shi, D.; Li, J.; Lou, Y.; Li, Y.; Li, J. Quantifying the impact of tillage measures on the cultivated-layer soil quality in the red soil hilly region: Establishing the thresholds of the minimum data set. Ecol. Indic. 2021, 130, 108013. [Google Scholar] [CrossRef]
  35. Zhang, S.X.; Li, Q.; Zhang, X.P.; Wei, K.; Chen, L.J.; Liang, W.J. Effects of conservation tillage on soil aggregation and aggregate binding agents in black soil of Northeast China. Soil Tillage Res. 2012, 124, 196–202. [Google Scholar] [CrossRef]
  36. Matsumoto, S.; Terada, A.; Tsuneda, S. Modeling of membrane-aerated biofilm: Effects of C/N ratio, biofilm thickness and surface loading of oxygen on feasibility of simultaneous nitrification and denitrification. Biochem. Eng. J. 2007, 37, 98–107. [Google Scholar] [CrossRef]
  37. Lahai, M.K.; Kabba, V.T.S.; Mansaray, L.R. Impacts of land-use and land-cover change on rural livelihoods: Evidence from eastern Sierra Leone. Appl. Geogr. 2022, 147, 102784. [Google Scholar] [CrossRef]
  38. Yang, S.H.; Dong, Y.; Song, X.D.; Wu, H.Y.; Zhao, X.R.; Yang, J.L.; Chen, S.C.; Smith, J.; Zhang, G.L. Vertical distribution and influencing factors of deep soil organic carbon in a typical subtropical agricultural watershed. Agric. Ecosyst. Environ. 2022, 339, 108141. [Google Scholar] [CrossRef]
  39. Liu, B.Y.; Cheng, X.; He, X.; Bei, Q.C.; Dai, Y.S.; Wang, Y.F.; Zhu, B.; Zhang, K.P.; Tian, X.Q.; Duan, M.C.; et al. Effects of bio-mulching on wheat soil microbial community and carbon utilization efficiency in southwest China. Catena 2022, 214, 106260. [Google Scholar] [CrossRef]
  40. Biswal, P.; Swain, D.K.; Jha, M.K. Straw mulch with limited drip irrigation influenced soil microclimate in improving tuber yield and water productivity of potato in subtropical India. Soil Tillage Res. 2022, 223, 105484. [Google Scholar] [CrossRef]
  41. Li, Y.W.; Chai, Y.W.; Ma, J.T.; Li, R.; Cheng, H.B.; Chang, L.; Chai, S.X. Straw strip mulching in a semiarid rainfed agroecosystem achieves carbon sequestration and emission reduction from winter wheat fields. Agric. Ecosyst. Environ. 2022, 334, 107990. [Google Scholar] [CrossRef]
  42. Guo, J.; Liu, Q.; Zhang, H.; Fang, N.; Li, J.; Wang, L. Temporal variations in rill erosion resistance following incorporated wheat straw returning combined with nitrogen and polyphenols. Catena 2022, 217, 106502. [Google Scholar] [CrossRef]
  43. Li, M.; Liu, Q.; Zhang, H.; Wells, R.R.; Wang, L.; Geng, J. Effects of antecedent soil moisture on rill erodibility and critical shear stress. Catena 2022, 216, 106356. [Google Scholar] [CrossRef]
  44. Liu, H.T.; Wang, X.; Song, X.Q.; Leng, P.; Li, J.; Mazza Rodrigues, J.L.; Hong, Z.Q.; Kuzyakov, Y.; Xu, J.M.; Dai, Z.M. Generalists and specialists decomposing labile and aromatic biochar compounds and sequestering carbon in soil. Geoderma 2022, 428, 116176. [Google Scholar] [CrossRef]
  45. Huang, Y.; Xin, Z.; Liu, J.; Liu, Q. Divergences of soil carbon turnover and regulation in alpine steppes and meadows on the Tibetan Plateau. Sci. Total Environ. 2022, 814, 152687. [Google Scholar] [CrossRef] [PubMed]
  46. Wang, Y.L.; Wu, P.N.; Mei, F.J.; Ling, Y.; Qiao, Y.; Liu, C.S.; Leghari, S.J.; Guan, X.K.; Wang, T.C. Does continuous straw returning keep China farmland soil organic carbon continued increase? A meta-analysis. J. Environ. Manag. 2021, 288, 112391. [Google Scholar] [CrossRef]
  47. Yan, S.; Song, J.; Fan, J.; Yan, C.; Dong, S.; Ma, C.; Gong, Z. Changes in soil organic carbon fractions and microbial community under rice straw return in Northeast China. Glob. Ecol. Conserv. 2020, 22, e00962. [Google Scholar] [CrossRef]
  48. Li, Y.P.; Wang, J.; Shao, M.A. Earthworm inoculation and straw return decrease the phosphorus adsorption capacity of soils in the Loess region, China. J. Environ. Manag. 2022, 312, 114921. [Google Scholar] [CrossRef]
  49. Cui, H.X.; Luo, Y.L.; Chen, J.; Jin, M.; Li, Y.; Wang, Z.L. Straw return strategies to improve soil properties and crop productivity in a winter wheat-summer maize cropping system. Eur. J. Agron. 2022, 133, 126436. [Google Scholar] [CrossRef]
Figure 1. Land use map and distribution of sampling sites (red dots) in the study area of Linyi City, East China.
Sustainability 14 13585 g001
Figure 2. Spatial distribution of SOC and other physical and chemical characteristics (SOC, TN, TP, TK unit g·kg−1). SOC, soil organic C; TN, total N; TP, total P; TK, total K.
Sustainability 14 13585 g002
Figure 3. Box diagram of soil nutrients under different land-use types. The box plot shows the interquartile range (25% to 75% of the data), the median as lines and individual samples as dots.
Sustainability 14 13585 g003
Figure 4. Pearson correlations of soil properties under different land-use types SOC, soil organic C; TN, total N; TP, total P; TK, total K.
Sustainability 14 13585 g004
Figure 5. Linear regression of SOC and TN and TK under different land-use types. The shaded part is 95% confidence interval.
Sustainability 14 13585 g005
Figure 6. Estimation of the soil organic C (SOC) pool and distribution of SOC density in the surface 0.2 m soil layer in the main land-use types in Linyi City, East China. Different uppercase letters indicate significant differences between SOC density, different lowercase letters indicate significant differences between SOC stock among different land use types at 0.05 significant level.
Sustainability 14 13585 g006
Figure 7. C/N ratio of different land-use types (mean ± SD), the same lowercase letter means no significant difference (p > 0.05).
Sustainability 14 13585 g007
Table 1. Chemical characteristics of soils in the study area of Linyi City, East China (SOC, TN, TP, TK unit g·kg−1).
Land UseData Descriptive StatisticspHSOCTNTPTK
Paddy fieldMean6.160.960.040.060.44
Standard deviation0.590.400.020.010.16
Coefficient of variation (%)9.5541.6339.7421.2236.84
NurseriesMean6.501.050.040.050.56
Standard deviation0.510.500.020.020.16
Coefficient of variation (%)7.947.155.3339.0228.15
Low-cover grasslandsMean6.120.730.040.080.41
Standard deviation0.710.610.020.050.20
Coefficient of variation (%)11.683.0149.6862.9249.06
Forest landMean5.851.080.050.080.44
Standard deviation0.770.810.030.040.15
Coefficient of variation (%)13.1674.5265.4754.9635.32
DrylandsMean6.300.790.040.070.44
Standard deviation0.880.380.020.040.22
Coefficient of variation (%)14.0148.8143.452.949.9
Bare landMean6.120.730.040.100.60
Standard deviation0.790.450.020.090.60
Coefficient of variation (%)12.9862.3940.6787.2699.86
SOC, soil organic C; TN, total N; TP, total P; TK, total potassium.
Publisher’s Note: MDPI stays neutral with regard to jurisdictional claims in published maps and institutional affiliations.

