Article

Ecological Effects of Surface Water Evolution in the Yellow River Delta

1
School of Geography and Tourism, Qilu Normal University, Jinan 250020, China
2
School of Geography and Environment, Shandong Normal University, Jinan 250014, China
*
Author to whom correspondence should be addressed.
Sustainability 2022, 14(20), 13544; https://doi.org/10.3390/su142013544
Submission received: 18 August 2022 / Revised: 14 October 2022 / Accepted: 18 October 2022 / Published: 20 October 2022

Abstract

:
With the ecological protection and high-quality development of the Yellow River Basin rising to China’s national strategy, the Yellow River Delta is facing a historic development opportunity, and the surface water problems in this region are becoming more and more severe. Owing to the dual effects of the swing of the Yellow River’s channel and human activities, the surface water in the Yellow River Delta is in an evolving state. Consequently, it is important to pay attention to the ecosystem response caused by surface water evolution for the ecological protection and high-quality development of the Yellow River Delta. Drawing on ecological, economic, and network analysis, in this study, the ecological service and landscape effects of the surface water evolution in the Yellow River Delta from 1986 to 2019 are explored using remote sensing and socioeconomic data. The results are as follows: (1) The surface water in the Yellow River Delta has evolved significantly in the last 35 years. Artificial water accounted for the dominant proportion of the total water, and the composition of water tended to be remarkably heterogeneous. (2) The ecological services of the surface water in the delta increased significantly during the study period. The ecological services of the surface water improved to varying degrees except for sedimentary land reclamation. Tourism, materials production, and water supply became the leading service functions of the surface water in the Yellow River Delta. The proportion of cultural functions rose rapidly, and the share of regulatory functions shrank significantly. (3) The evolution of the surface water had an evident impact on the landscape pattern of the Yellow River Delta, which was manifested as physical cutting and spatial attraction. This demonstrates the comprehensive effect of protective constraints, spatial attraction, and spatial exclusion on the landscape pattern of regional land types. The results of this study have a certain guiding significance for the development and management of the water resources in the Yellow River Delta and also provide information for ecological protection in this region.

1. Introduction

Surface water provides material support for socioeconomic development and is an essential component of the ecosystem, exerting a profound impact on a region’s society, economy, and ecology [1,2,3]. Examining surface water evolution (increases and decreases) and its ecological response is an inevitable choice for sustainable socioeconomic development and environmental protection [4,5]. The surface water represented by the Yellow River shapes the geomorphological structure of the Yellow River Delta, affects the physiological characteristics and distribution pattern of the vegetation, and regulates the ecosystem evolution of the delta [6,7]. The frequent swings in the lower reaches and the increasingly intense human activities have constantly driven the evolution of the surface water in the Yellow River Delta [8,9]. To a certain extent, the freshwater system represented by the surface water is the key component of the Yellow River Delta and has a profound impact on the operation and succession of the Yellow River Delta’s ecosystem. The evolution of the surface water reflects the development of the Yellow River Delta [10]. As the famous golden delta, the Chinese government has been paying great attention to the development and utilization of the Yellow River Delta, especially since 2019, when the Yellow River Basin’s ecological protection and high-quality development were approved as a significant national strategy. The Yellow River Delta is facing a historic opportunity. Under the combined effects of intense human exploitation and global climate change, the water consumption for living, production, and ecology in this region will further increase, posing higher requirements for water resources and surface water [11]. Research on the ecological effects of surface water evolution and clarifying the inner link between the surface water evolution and the entire ecosystem in the Yellow River Delta will provide not only a theoretical reference for the utilization and layout of water resources in the Yellow River Delta but also a scientific impetus to the ecological protection and high-quality development of this region.
The ecological effects of surface water evolution have drawn extensive attention from scholars, and the related studies can be classified into two categories. In the first category, researchers took the surface water as the influencing factor and focused on exploring the single-element response of ecosystems caused by various types of water. It has been found that rivers affect the regional groundwater level by changing the water circulation paths, such as runoff and infiltration [12,13]. Rivers also shape the topography and embankment morphology by changing the sediment erosion and siltation [14,15]. The changes in the sediment content and water level affect the community status of the river animals [16] and the habitat characteristics [17]. The changes in the water quantity and depth have direct effects on the animal communities [18], plant diversity [19], and leaf characteristics [20] in the lake, and the evolution of the lake’s landscape pattern plays a significant role in the regional ecosystem service value [21]. As a common intermittent wetland system, ponds and ditches play a unique role in affecting the physiological traits of plants [22], maintaining biodiversity [23], degrading agricultural pollution [24], regulating the regional carbon cycle [25], and changing the regional hydrological conditions [26]. The second category of research focused on exploring the ecological environmental effects of different types of water evolution. For example, the construction of dams and other water conservancy projects has significant effects on the regional air temperature [27], regional precipitation [28], regional groundwater dynamics [29], regional net primary productivity [30], downstream river hydrological dynamics [31], and topography [32]. Water transfer projects have a certain impact on the regional groundwater system [33], water quality [34], and animal and plant community characteristics [35]. Studies on the evolution of water resource utilization have mainly focused agricultural irrigation and urban expansion. In addition to the responses of the groundwater level [36] and water quality [37], the eco-ring effect of agricultural irrigation also affects the spatial distribution of mosquitoes [38]. The evolution caused by urban expansion is more focused on land-use change [39] and the urban heat island effect [40].
In summary, previous studies have focused on the ecological effects of specific elements in the ecological system or on specific types of water evolution. Relatively few studies have been conducted on the overall response of regional ecosystems, and even less attention has been paid to the new estuary. Examining the ecological impact of surface water evolution is the only pragmatic way to realize the ecological protection and high-quality development of the Yellow River Delta based on the actual needs of the Yellow River Delta since surface water is an essential water source in the Yellow River Delta.

2. Study Area

The history of the Yellow River Delta can be periodized into the ancient, modern, and contemporary Yellow River Delta [41]. This study takes the modern Yellow River Delta as the study area, which roughly starts from the Zhimai River estuary in the south and reaches the Taoer estuary in the north, with Ninghai Village (Kenli County, Dongying City, Shandong Province) as the apex, covering an area of about 5400 km2. Spatially, the study area is located on the south bank of Bohai Bay and the west bank of Laizhou Bay, between 117°31′–119°18′ E and 36°55′–38°16′ N. In terms of administrative divisions, this area is mainly situated in Dongying City, Shandong Province, including Hekou District, Lijin District, Kenli District, and Dongying District (Figure 1). The surface water in the Yellow River Delta can be roughly divided into rivers, ditches, reservoirs, pit ponds, and salt aquaculture ponds. The main rivers in the region include more than 20 rivers, such as the Zhimai River, Yongfeng River, and Guangli River. The Yellow River is the most critical water resource in the Yellow River Delta. To provide the water resources in this area, a large number of reservoirs have been built in the study area for production and living. As of 2019, there were 658 reservoirs in the Yellow River Delta, with a total storage capacity of 831 million m3. The Yellow River is the most critical water resource in the Yellow River Delta. The ecosystem is sensitive and fragile because of its land form development timeframe. The soil salt content is high, and the soil types are mainly evolutionary-tidal soil and saline soil. The vegetation type is relatively simple, and the vegetation is mainly salt tolerant species, such as willow, Robinia pseudoacacia, reeds, and tamarix.

3. Data and Methods

3.1. Data

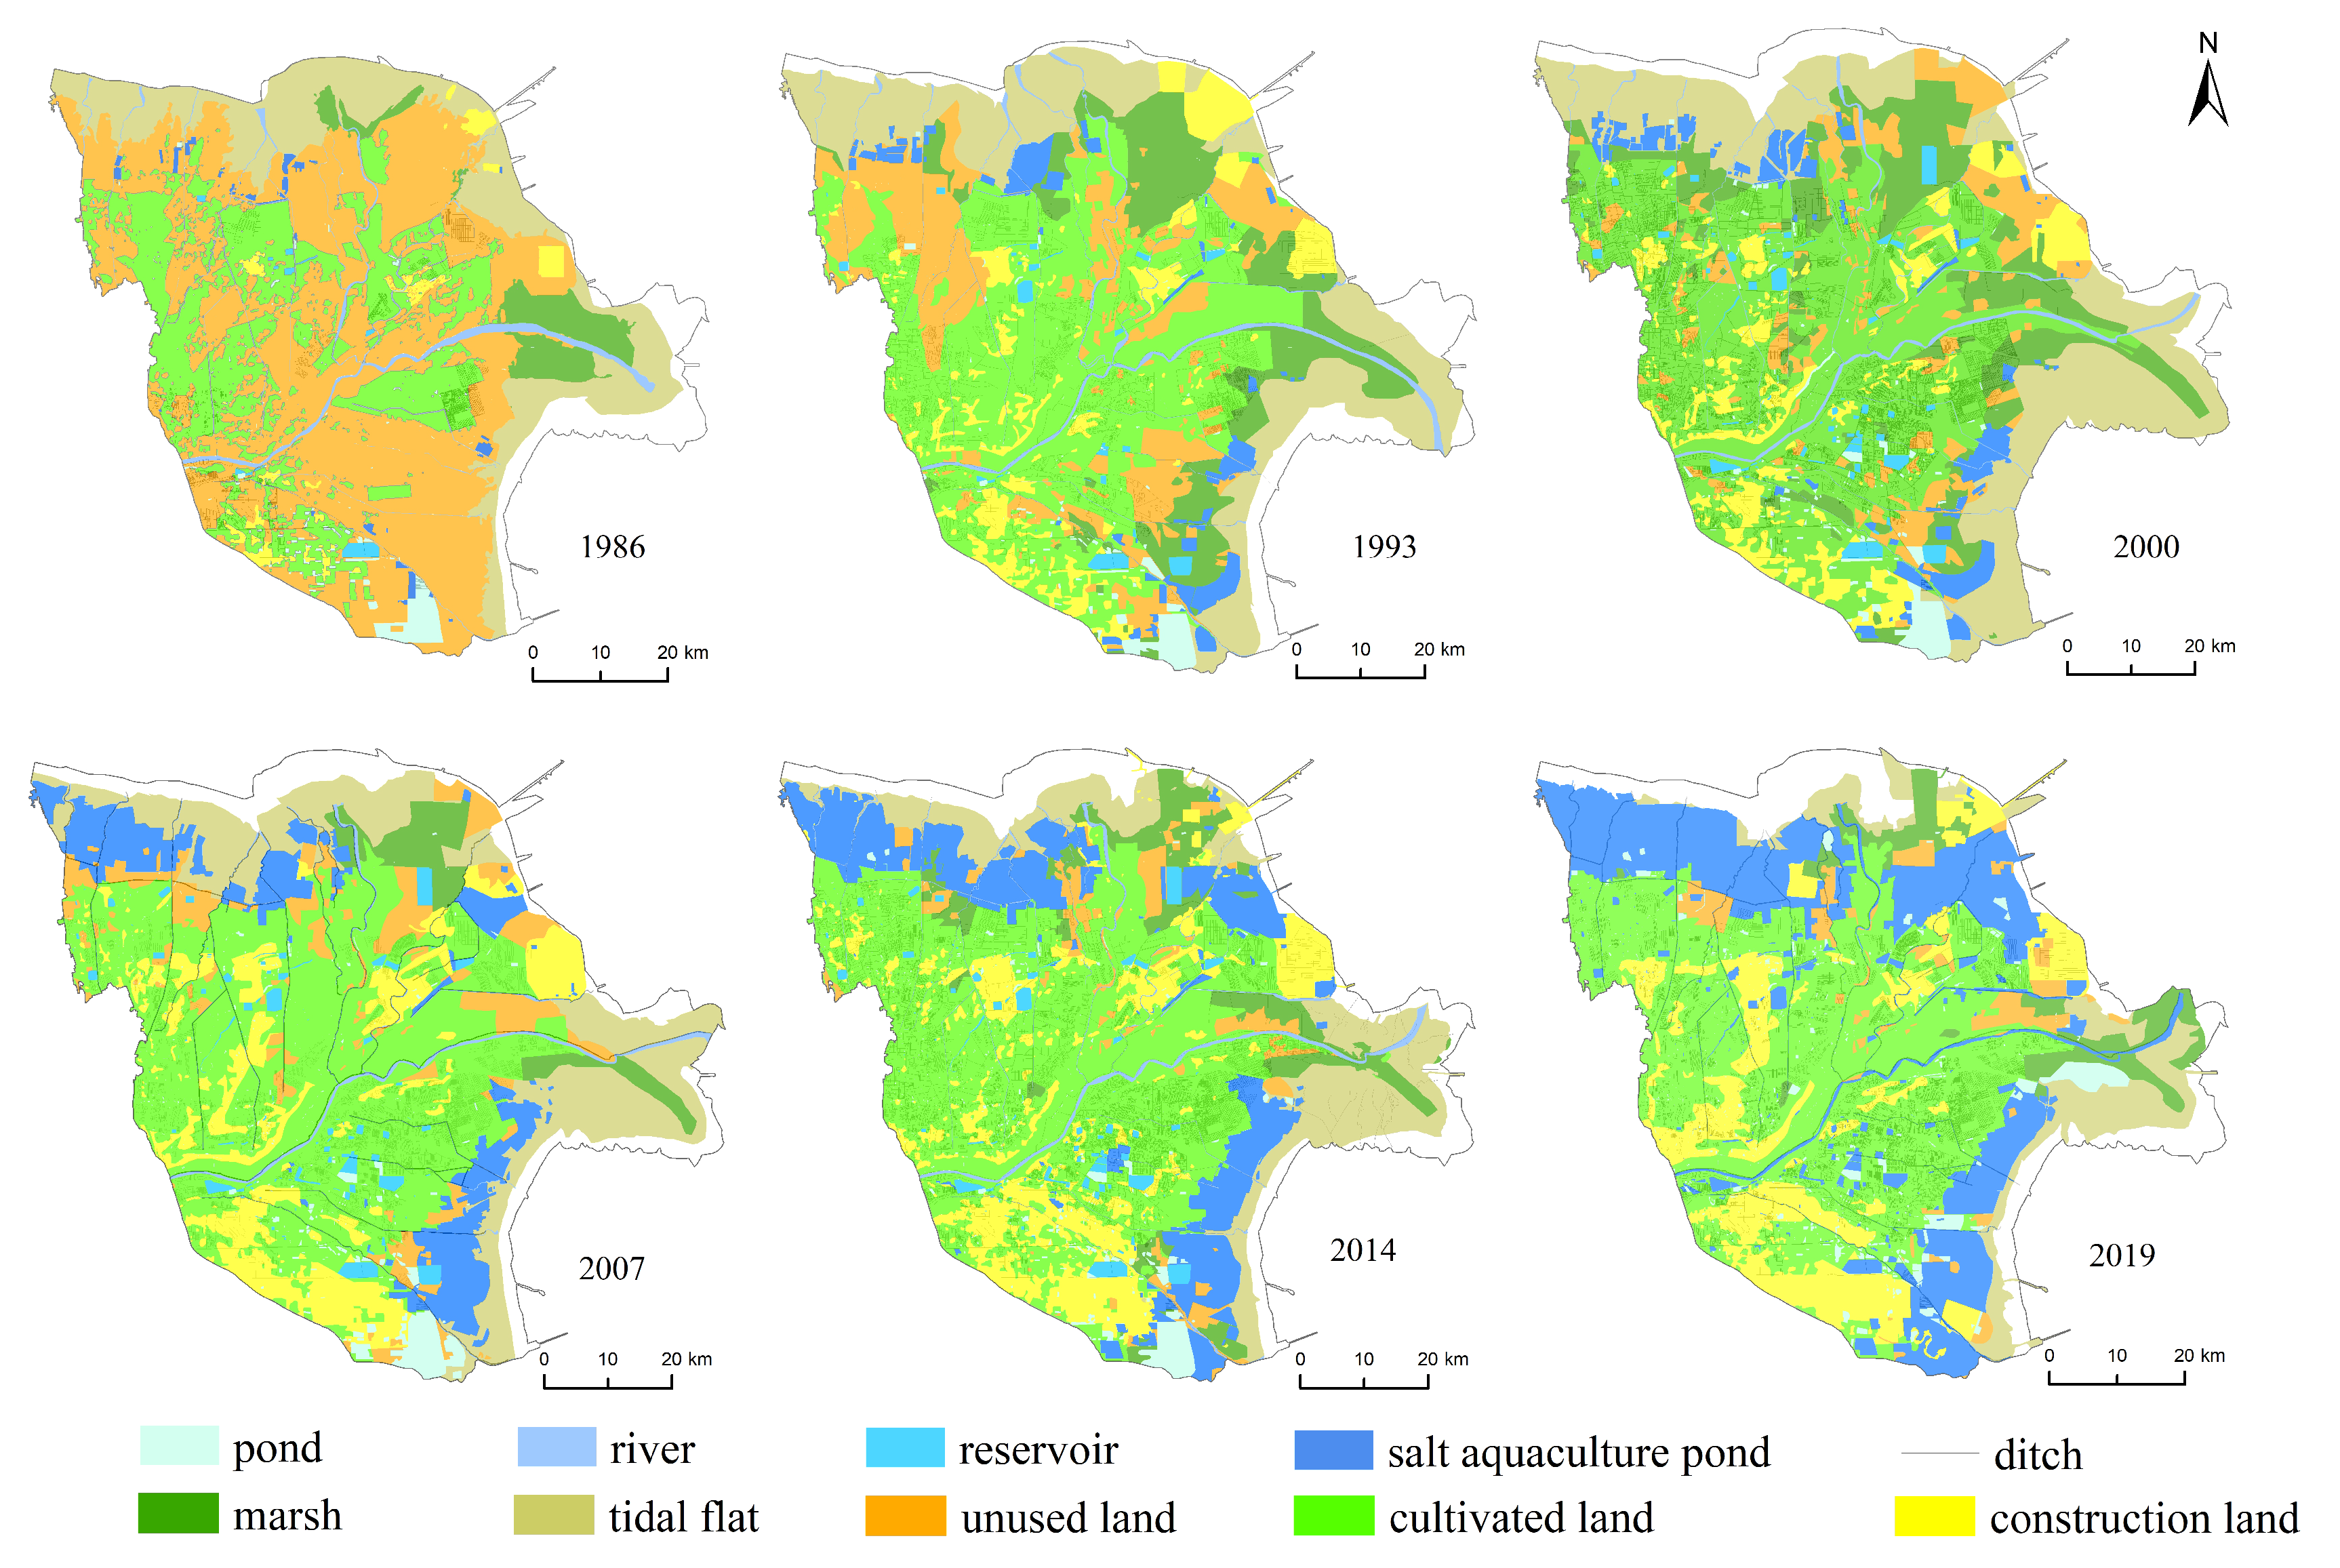
The data used in this study included remote sensing data and socioeconomic data. Specifically, the remote sensing data used were Landsat data for the Yellow River Delta for 1986, 1993, 2000, 2007, 2014, and 2019, which were downloaded from the Geospatial Data Cloud (GScloud.cn). The land/land-cover types and surface water data for the Yellow River Delta were derived through unsupervised classification and manual visual interpretation, and the land/land-cover types in the study area were classified into surface water and other land-use types, with a total of 10 types in two categories. The surface water consisted of rivers, reservoirs, ponds, salt aquaculture ponds, and ditches, while the other land types consisted of cultivated land, unused land, tidal flats, swamps, and construction land. The tests revealed that the total classification accuracy of the images in each period was greater than 85.77%, meeting the requirements for use (Figure 2). The socioeconomic data were mainly obtained from the Dongying City Statistical Yearbook (2020) [42] and the Dongying Yearbook (1983–1995) [43], which were used to acquire data on the ecological service functions of the Yellow River Delta, such as the materials production and resource supply.

3.2. Methods

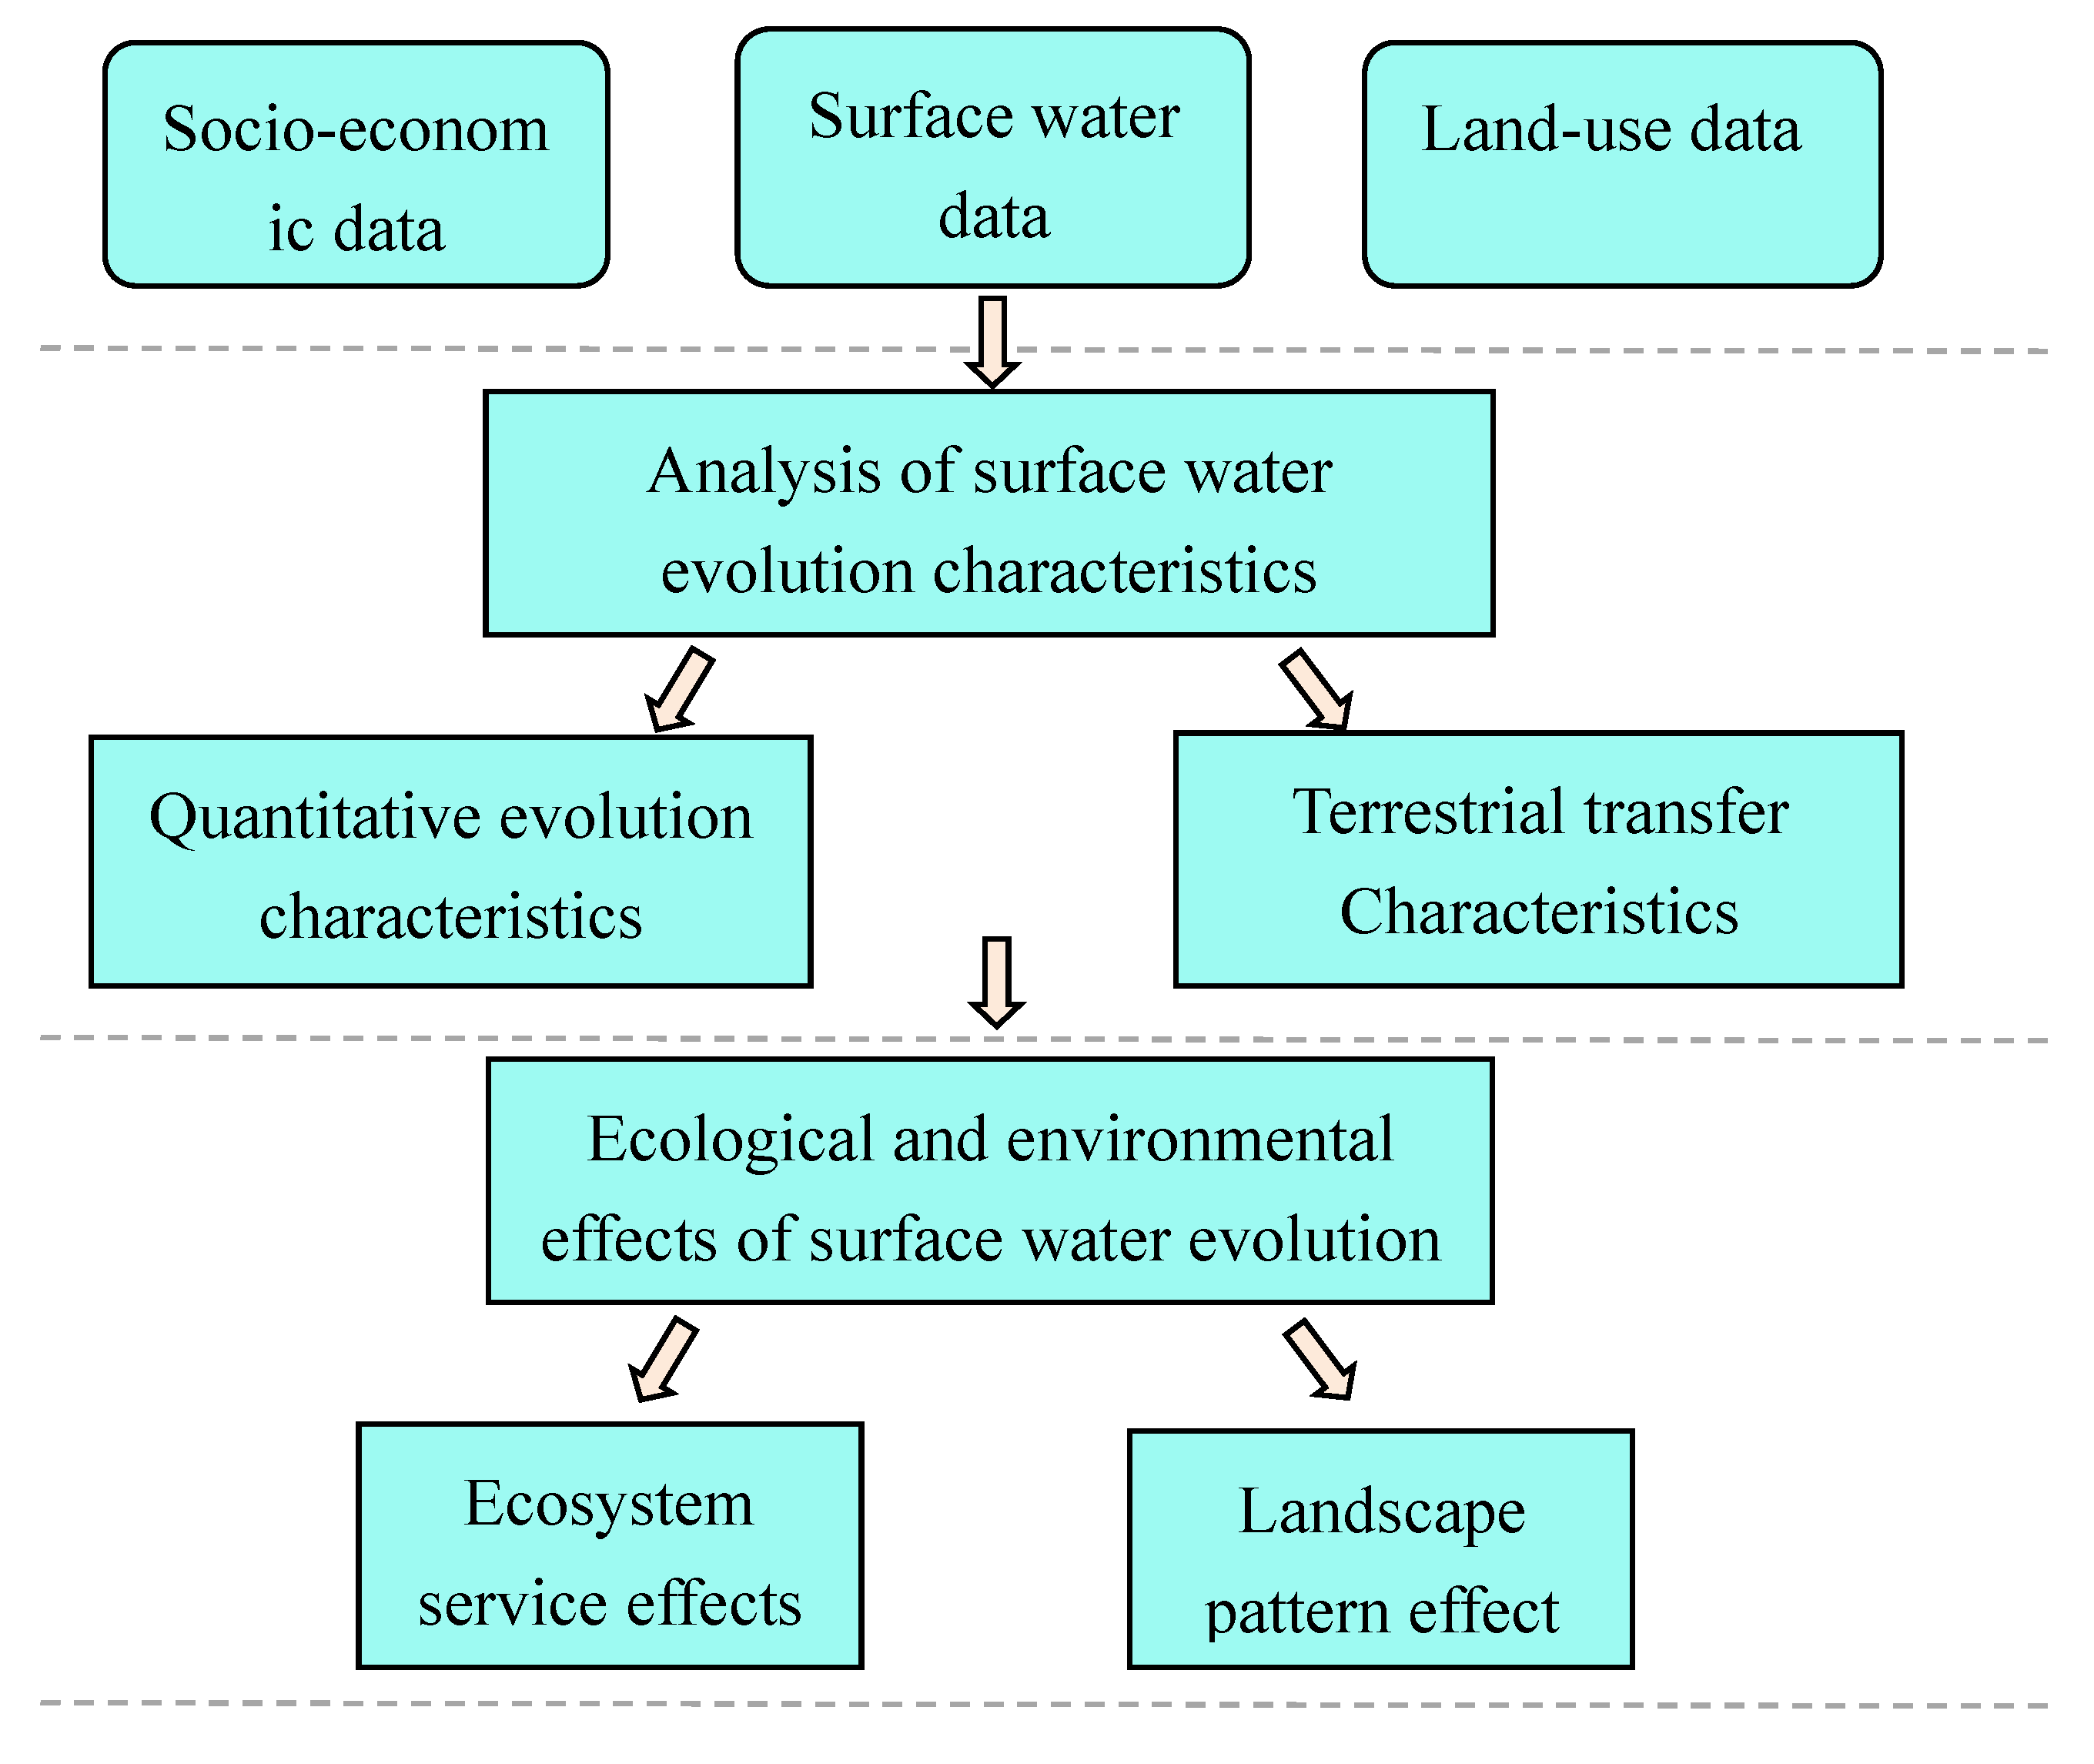
Based on the remote sensing data, land-use data, and socioeconomic data of the Yellow River Delta, this paper firstly analyzes the evolution characteristics of the surface water in the Yellow River Delta. On this basis, the ecosystem service effect and landscape pattern effect caused by water evolution were explored (Figure 3). The ecological service effects were measured by comparing the values of the ecological services. The ecological service functions of the surface water in the Yellow River Delta included supply (water supply, materials production), regulation (flood regulation and storage, habitat maintenance, water purification, sedimentary land reclamation), aesthetics (tourism and leisure), and support (habitat maintenance) functions [44]. Different methods were used to quantitatively estimate the functional value of the ecological services, specifically the value supply for the water supply and materials production, the proportional conversion for tourism and leisure, the benefit replacement for the flood regulation and storage, the production cost for purification, the opportunity cost for sedimentary land reclamation, and the value parameter for habitat maintenance. The landscape effects were examined through correlation analysis between the road network pattern index, the quantitative characteristic index, and landscape pattern metrics. Among them, the quantitative structural characteristic index included the water surface rate and water network density [45,46]. The pattern characteristic analysis adopted the network pattern characteristic indexes, including the network closure, line-point rate, and network connectivity. The landscape pattern metrics included the following indexes: the patch density, dispersion and juxtaposition index, landscape fragmentation, Shannon diversity index, landscape aggregation degree, component area, maximum patch index, patch aggregation degree, fragmentation index, and component fragmentation index [47,48].

4. Results

4.1. Evolution of Surface Water in the Yellow River Delta

Overall, the surface water in the Yellow River Delta exhibited an increasing trend from 1986 to 2019 (Table 1). Specifically, the planar water increased by 1121.2 km2. Among the types of planar water, the rivers decreased by 30.7 km2; the pit-ponds increased by 67.4 km2; the reservoirs increased by 124.9 km2; and the salt aquaculture ponds increased by 959.6 km2, which was the most dramatic change among all of the types of planar water. The linear water increased from 2200.3 km to 11730.3 km. The length of the river increased by only 4 km, while the total length of the ditches increased by about 9530 km. In terms of the water structure, rivers and ditches were the dominant types of both planar and linear water in the Yellow River Delta in 1986. At that time, the water was evenly composed of natural and artificial water. In 2019, the salt aquaculture ponds became the largest type of planar water in the study area, and the main role of the ditches in the linear water was further strengthened. The composition of the water was remarkably heterogeneous, and artificial water accounted for a dominant proportion of the total water.
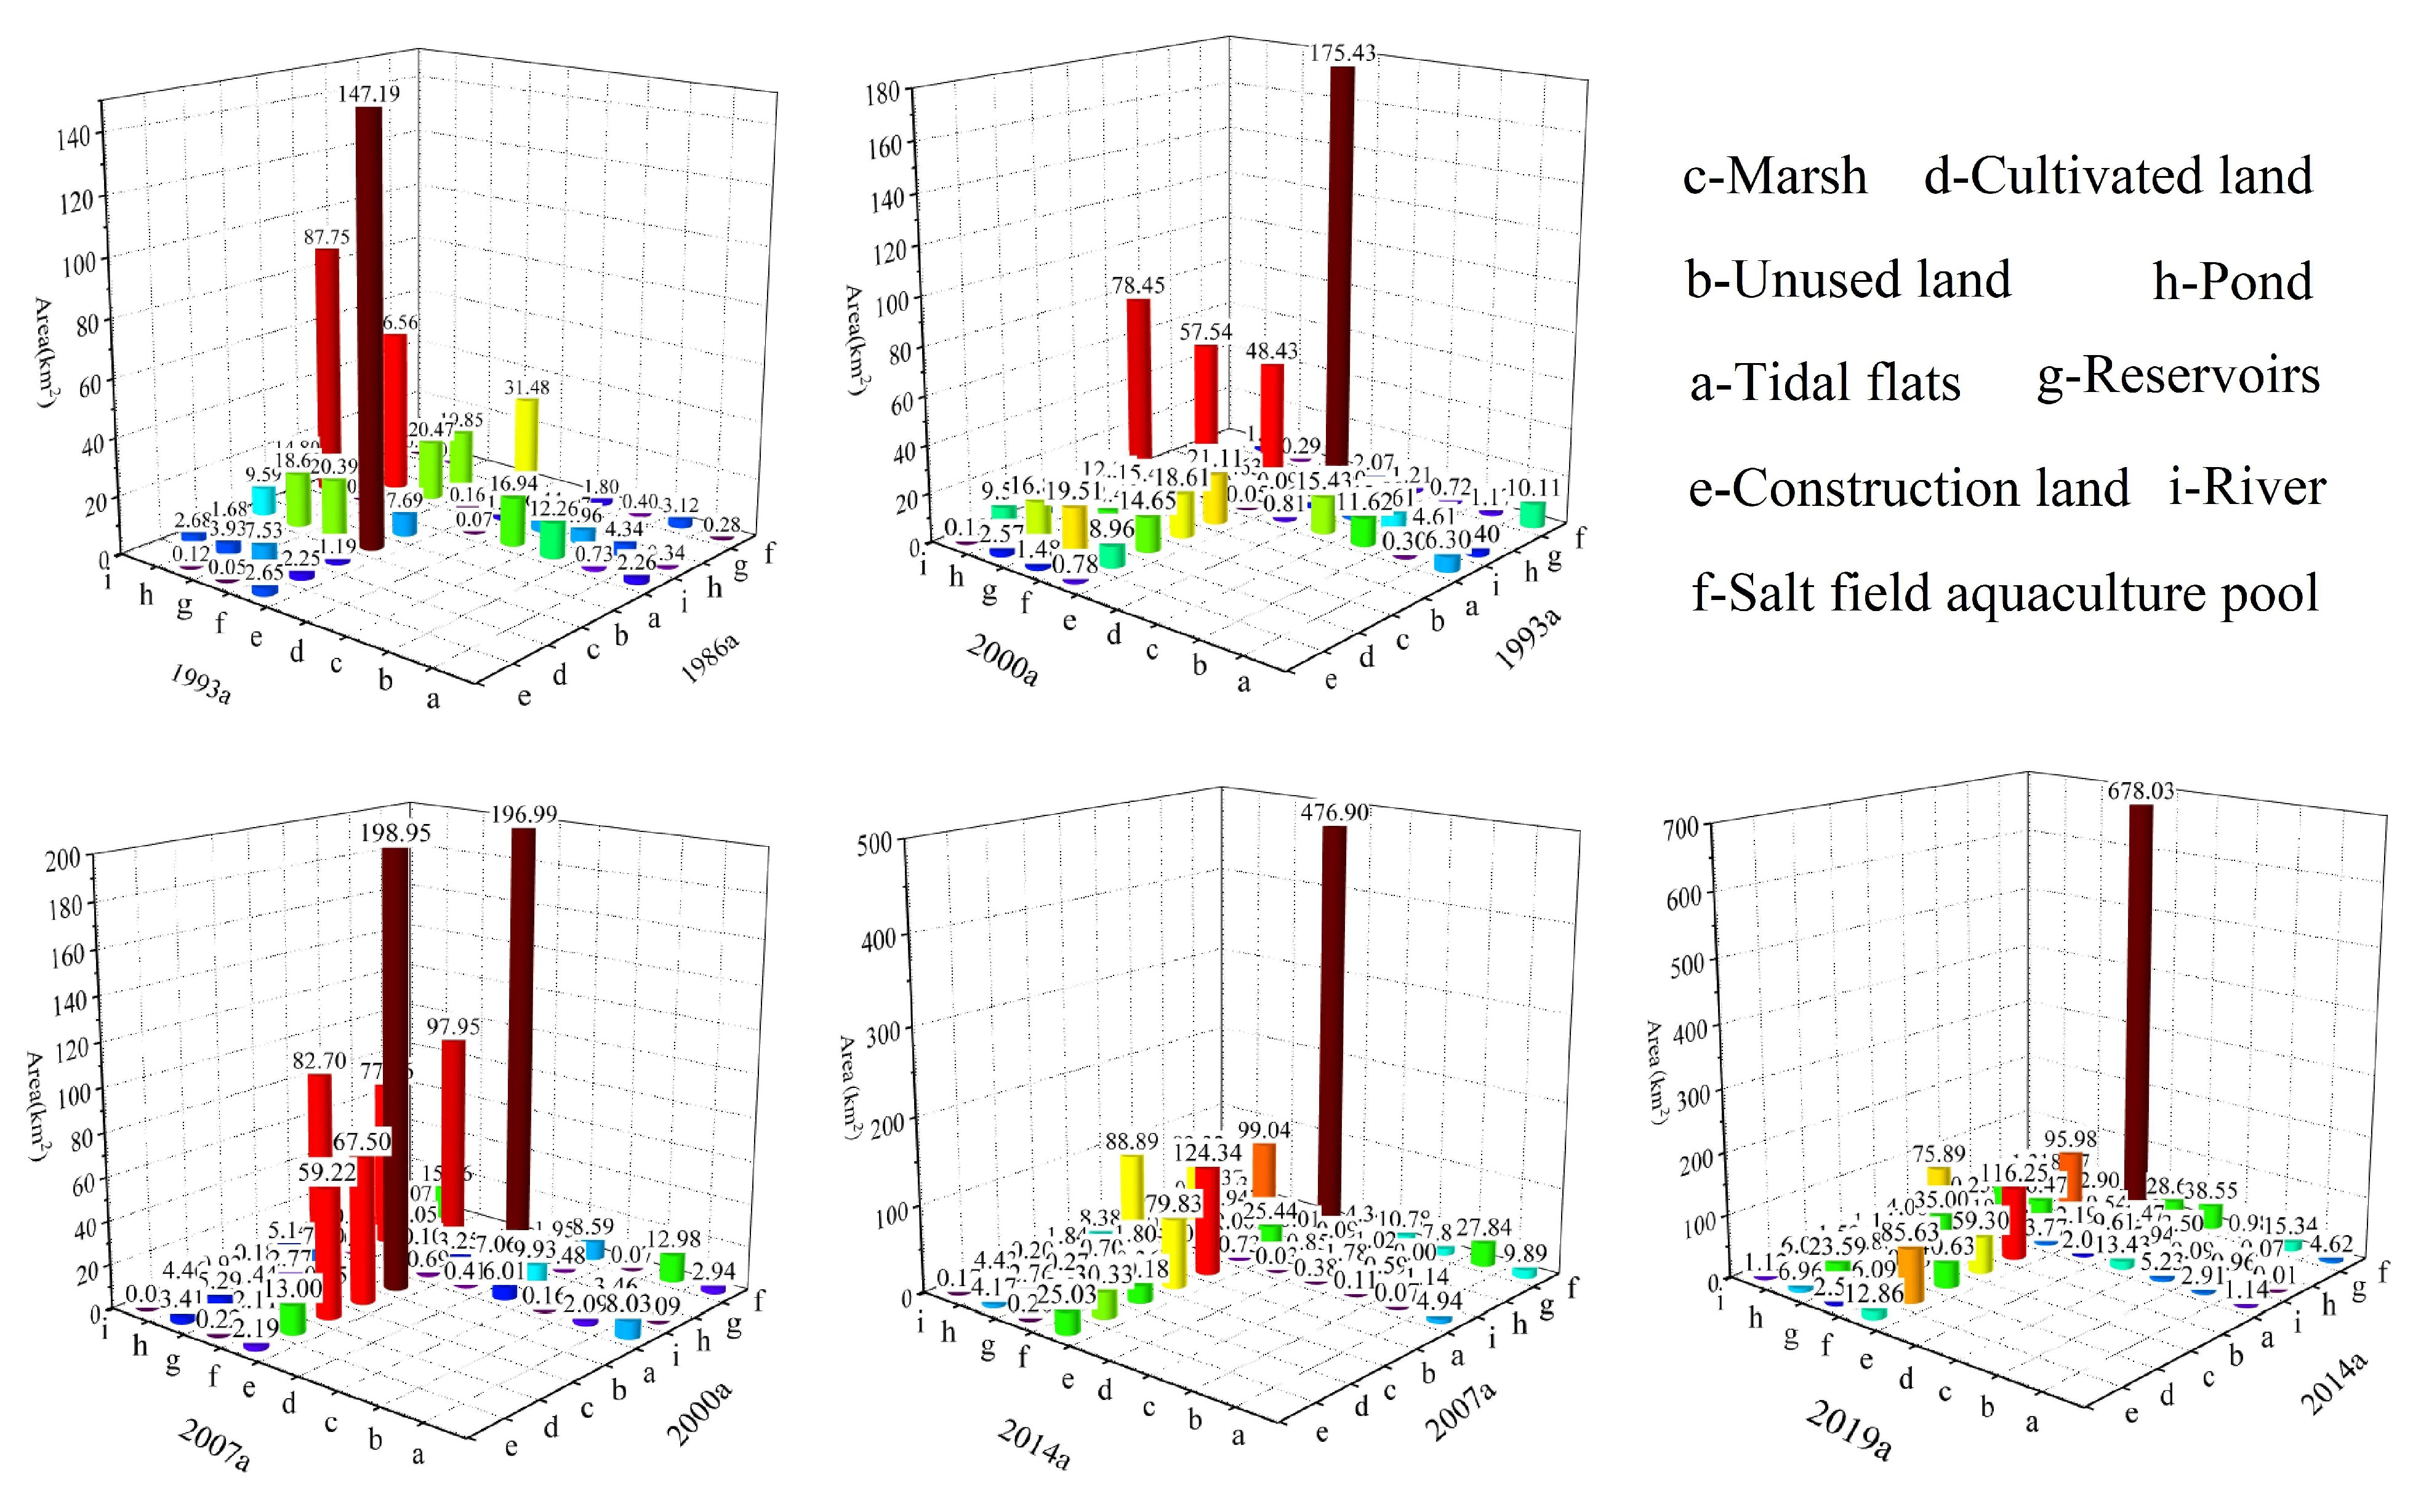
The conversion between surface water and other land-use types in the Yellow River Delta exhibited a certain pattern. As shown in Figure 4, the rivers were mainly converted into cultivated land (increase 21.15 km2, decrease 58.76 km2) and tidal flats (increase 21.53 km2, decrease 30.35 km2). The pit-ponds were converted in different stages. They were converted primarily from unused land (23.58 km2) and cultivated land (36.22 km2) before 2000, and they were mainly transformed into swamps (12.57 km2), reservoirs (21.48 km2), and unused land (12.41 km2). After 2000, mutual conversion occurred between salt aquaculture ponds (increase 27.63 km2, decrease 37.55 km2) and construction land (increase 10.46 km2, decrease 11.13 km2). The reservoirs were mainly converted from or into ponds (23.98 km2), cultivated land (37.13 km2), and unused land (36.66 km2). The salt aquaculture ponds were chiefly transformed into tidal flats (increase 695.60 km2, decrease 30.26 km2), unused land (increase 303.10 km2, decrease 77.31 km2), and cultivated land (increase 150.92 km2, decrease 64.26 km2).

4.2. Ecological Service Effects

4.2.1. Single Ecological Services of Surface Water

The surface water supply of the Yellow River Delta in 1986 and 2019 5.3 × 10⁸ m3, 4.0 × 10⁸ m3, 1.1 × 10⁸ m3, and 8.0 × 10⁸ m3 and 1.2 × 10⁸ m3, 2.1 × 10⁸ m3, 5.5 × 10⁷ m3, and 4.1 × 10⁸ m3, respectively) and the water resource fee standard of 3.2 × 10⁻³ yuan/m3 in corresponding years can obtain the water resource supply function value of the surface water ecosystem of the Yellow River Delta [49]. The water supply function was measured based on the water supply volume and water resource fee standards of the Yellow River Delta in 1986 and 2019. The results revealed that in 1986, the rivers had the greatest supply value (1.696 billion), followed by the pit-ponds (384 million), reservoirs (352 million), and ditches (176 million). In 2019, the reservoirs had the greatest supply value (2.56 billion), followed by the rivers (1.280 billion), ditches (1.312 billion), and ponds (672 million). In this 35-year period, the supply value of the surface water in the Yellow River Delta increased from CNY 2.608 to 5.824 billion, an increase of CNY 3.216 billion. The water supply structure also underwent significant changes, with reservoirs replacing rivers as the type of water with the highest supply value.
Aquaculture and raw salt production are the main material production methods from surface water in the Yellow River Delta. Among them, aquaculture can be divided into two categories: marine aquaculture and freshwater aquaculture. Marine aquaculture refers to the artificial rearing of saltwater fish on tidal flats. Freshwater aquaculture is mainly carried out in freshwater such as pits, rivers, and reservoirs. In 1986, the yield per unit area of mariculture and freshwater aquaculture was 107,527.5 kg/km2 and 82,893.57 kg/km2, respectively. In 2016, the yield per unit area of mariculture was 366,331.76 kg/km2, and that of freshwater aquaculture was 438,804.36 kg/km2 [50]. The raw salt is primarily produced from salt fields. In 1986, the raw salt yield in the Yellow River Delta was 4,781,947.48 kg/km2, and in 2016, the raw salt yield per unit area was 4,622,093 kg/km2. According to the average prices of fish and raw salt that year, The average output price of freshwater products in Dongying City in 2016 was CNY 23.18/kg, and the price of mariculture was CNY 10.87/kg. The price of raw salt is about CNY C185/ton [51]. In 1986, the fresh water area of the Yellow River Delta was 242.6 km2, and the salt pond area was 37.33 km2. In 2016, the fresh water area was 575.7 km2, and the salt pond area was 996.9 km2. According to the average prices of fish and raw salt in 1986 and 2019, it was estimated that the production value of the surface water in the Yellow River Delta increased considerably from CNY 633 million in 1986 to CNY 6.850 billion in 2019, a tenfold increase.
The cultural and aesthetic value was represented by the income of level 3A and above scenic spots in the Yellow River Delta, of which the scenic spots related to surface water accounted for 52.38% of the total sites. The cultural and aesthetic value of the surface water was estimated based on the total tourism revenue in 1986 and 2019. In 1986, the Yellow River Delta had not yet embraced tourism, and the tourism revenue was recorded as 0. In 2019, its tourism revenue was recorded as CNY 12.242 billion. According to the conversion ratio, the leisure tourism value of the surface water in the Yellow River Delta in 2019 was CNY 6.947 billion. From 1986 to 2019, the leisure tourism value of the surface water experienced development from nothing, and it increased by CNY 6.947 billion.
Surface water not only has the ability to reduce flood peak and homogenize flood but also can store flood water by changing flood velocity through vegetation. The value of the surface water in terms of flood regulation and storage was measured based on agricultural losses it averted by protecting cultivated land. Given that the agricultural disaster loss was about CNY 5532.9/hm2 [52], the value of the surface water in terms of flood regulation and storage in 1986 was estimated to be CNY 77 million, and the value in 2019 was CNY 126 million, an increase of CNY 50 million. This indicates that the increase in the surface water area enhanced the effect of the ecosystem on flood regulation and storage.
The habitat maintenance value refers to the global habitat maintenance value, which was USD 439/hm2 [53]. In 1986, the surface water area of the Yellow River Delta was 27,994 hm2, and the habitat maintenance value was CNY 87 million. In 2019, the surface water area was 157,262 hm2, and the habitat maintenance value was CNY 489 million, an increase of about CNY 400 million.
Plants, microorganisms, and bacteria in water can purify water through the deposition, decomposition, and transformation of pollutants. In this paper, the substitution cost method is used to calculate the purification function value of surface water in the Yellow River Delta. In 1986, Dongying City discharged a total of 17.177 million tons of sewage, with a treatment rate of 50%. In 2020, the treatment rate of 112.6618 million tons of sewage was 95%, and the unit sewage treatment price was CNY 0.6/ton. In 1986, in the Yellow River Delta, 22,801 tons of nitrogen fertilizer (measured after conversion) and 9225 tons of phosphate fertilizer were applied. In 2019, the amount of nitrogen fertilizer applied was 39,964 tons, and the amount of phosphate fertilizer applied was 18,870 tons. About 40% of the fertilizer was absorbed by vegetation, and the remaining 60% was released into the water. The unit pollutant purification value of the surface water was CNY 1500/ton for total nitrogen and CNY 2500/ton for total phosphorus. Adding the two items together, the purification value of the surface water in the Yellow River Delta was CNY 39 million in 1986 and CNY 67 million in 2019, an increase of CNY 28 million, indicating that the increase in surface water area improved the pollution purification capacity in the study area.
In this study, the opportunity cost method was used to estimate the functional value of the surface water in the Yellow River Delta in terms of the sedimentary land reclamation, and the total income of the land after conversion was taken as the functional value of the water in terms of sedimentary land reclamation. Due to human activities such as industrial and agricultural water diversion, soil and water conservation, and water conservancy projects, the sediment discharge of the Yellow River decreased from 469 million tons in 1986 to 11 million tons in 2019 [54,55], and about 64% of the sediment in the Yellow River runoff was deposited in the estuary delta [56]. According to the total agricultural output value and cultivated land area of Dongying City, the land income per unit area was CNY 2.6 million/km2 in 1986 and CNY 21.8 million/km2 in 2019. Based on this, it was estimated that the value of sedimentary land reclamation in the Yellow River Delta was CNY 1.905 billion in 1986 and about CNY 361 million in 2019, with a dramatic decrease of CNY 1.544 billion. This was because the average sediment load in the estuary of the Yellow River Delta was 801 million tons from 1980 to 1990, and the average after 2000 was about 150 million tons, which further dropped to 100 million tons, especially after 2015. The gradual reduction in the sediment content in the runoff of the Yellow River had a huge impact on the sedimentary land reclamation function of the Yellow River Delta.

4.2.2. Overall Ecological Services of Surface Water

The increase in the surface water area contributed to the huge change in its overall ecological service value (Table 2). The ecological service value of the surface water in the Yellow River Delta was CNY 5.349 billion in 1986 and CNY 20.664 billion in 2019, an increase of CNY 15.315 billion. All of the services increased to varying degrees except for the sedimentary land reclamation. The ecological services of the surface water also experienced a significant change in composition. In 1986, water supply, sedimentary land reclamation, and materials production were the core services of the surface water in the Yellow River Delta (96.2%). In 2019, tourism, materials production, and water supply became the main services of the surface water (94.95%). While the water supply function diminished, it remained the core service of the surface water in the Yellow River Delta. The importance of sedimentary land reclamation and water supply gradually declined, while that of the aesthetic functions and materials production functions increased significantly. The supply, cultural, regulatory, and supporting functions of the surface water in the Yellow River Delta increased to varying degrees, with the supply, supporting, and cultural functions accounting for a greater proportion and the regulatory function a smaller proportion. This indicates that with the increase in the surface water area, the absolute value of its regulatory and supporting functions increased, but its importance gradually decreased, and its function became marginalized. This may be associated with the higher proportion of artificial water and the lower proportion of natural water in the Yellow River Delta.

4.3. Effects of Surface Water Evolution on Landscape

4.3.1. Overall Landscape Effects

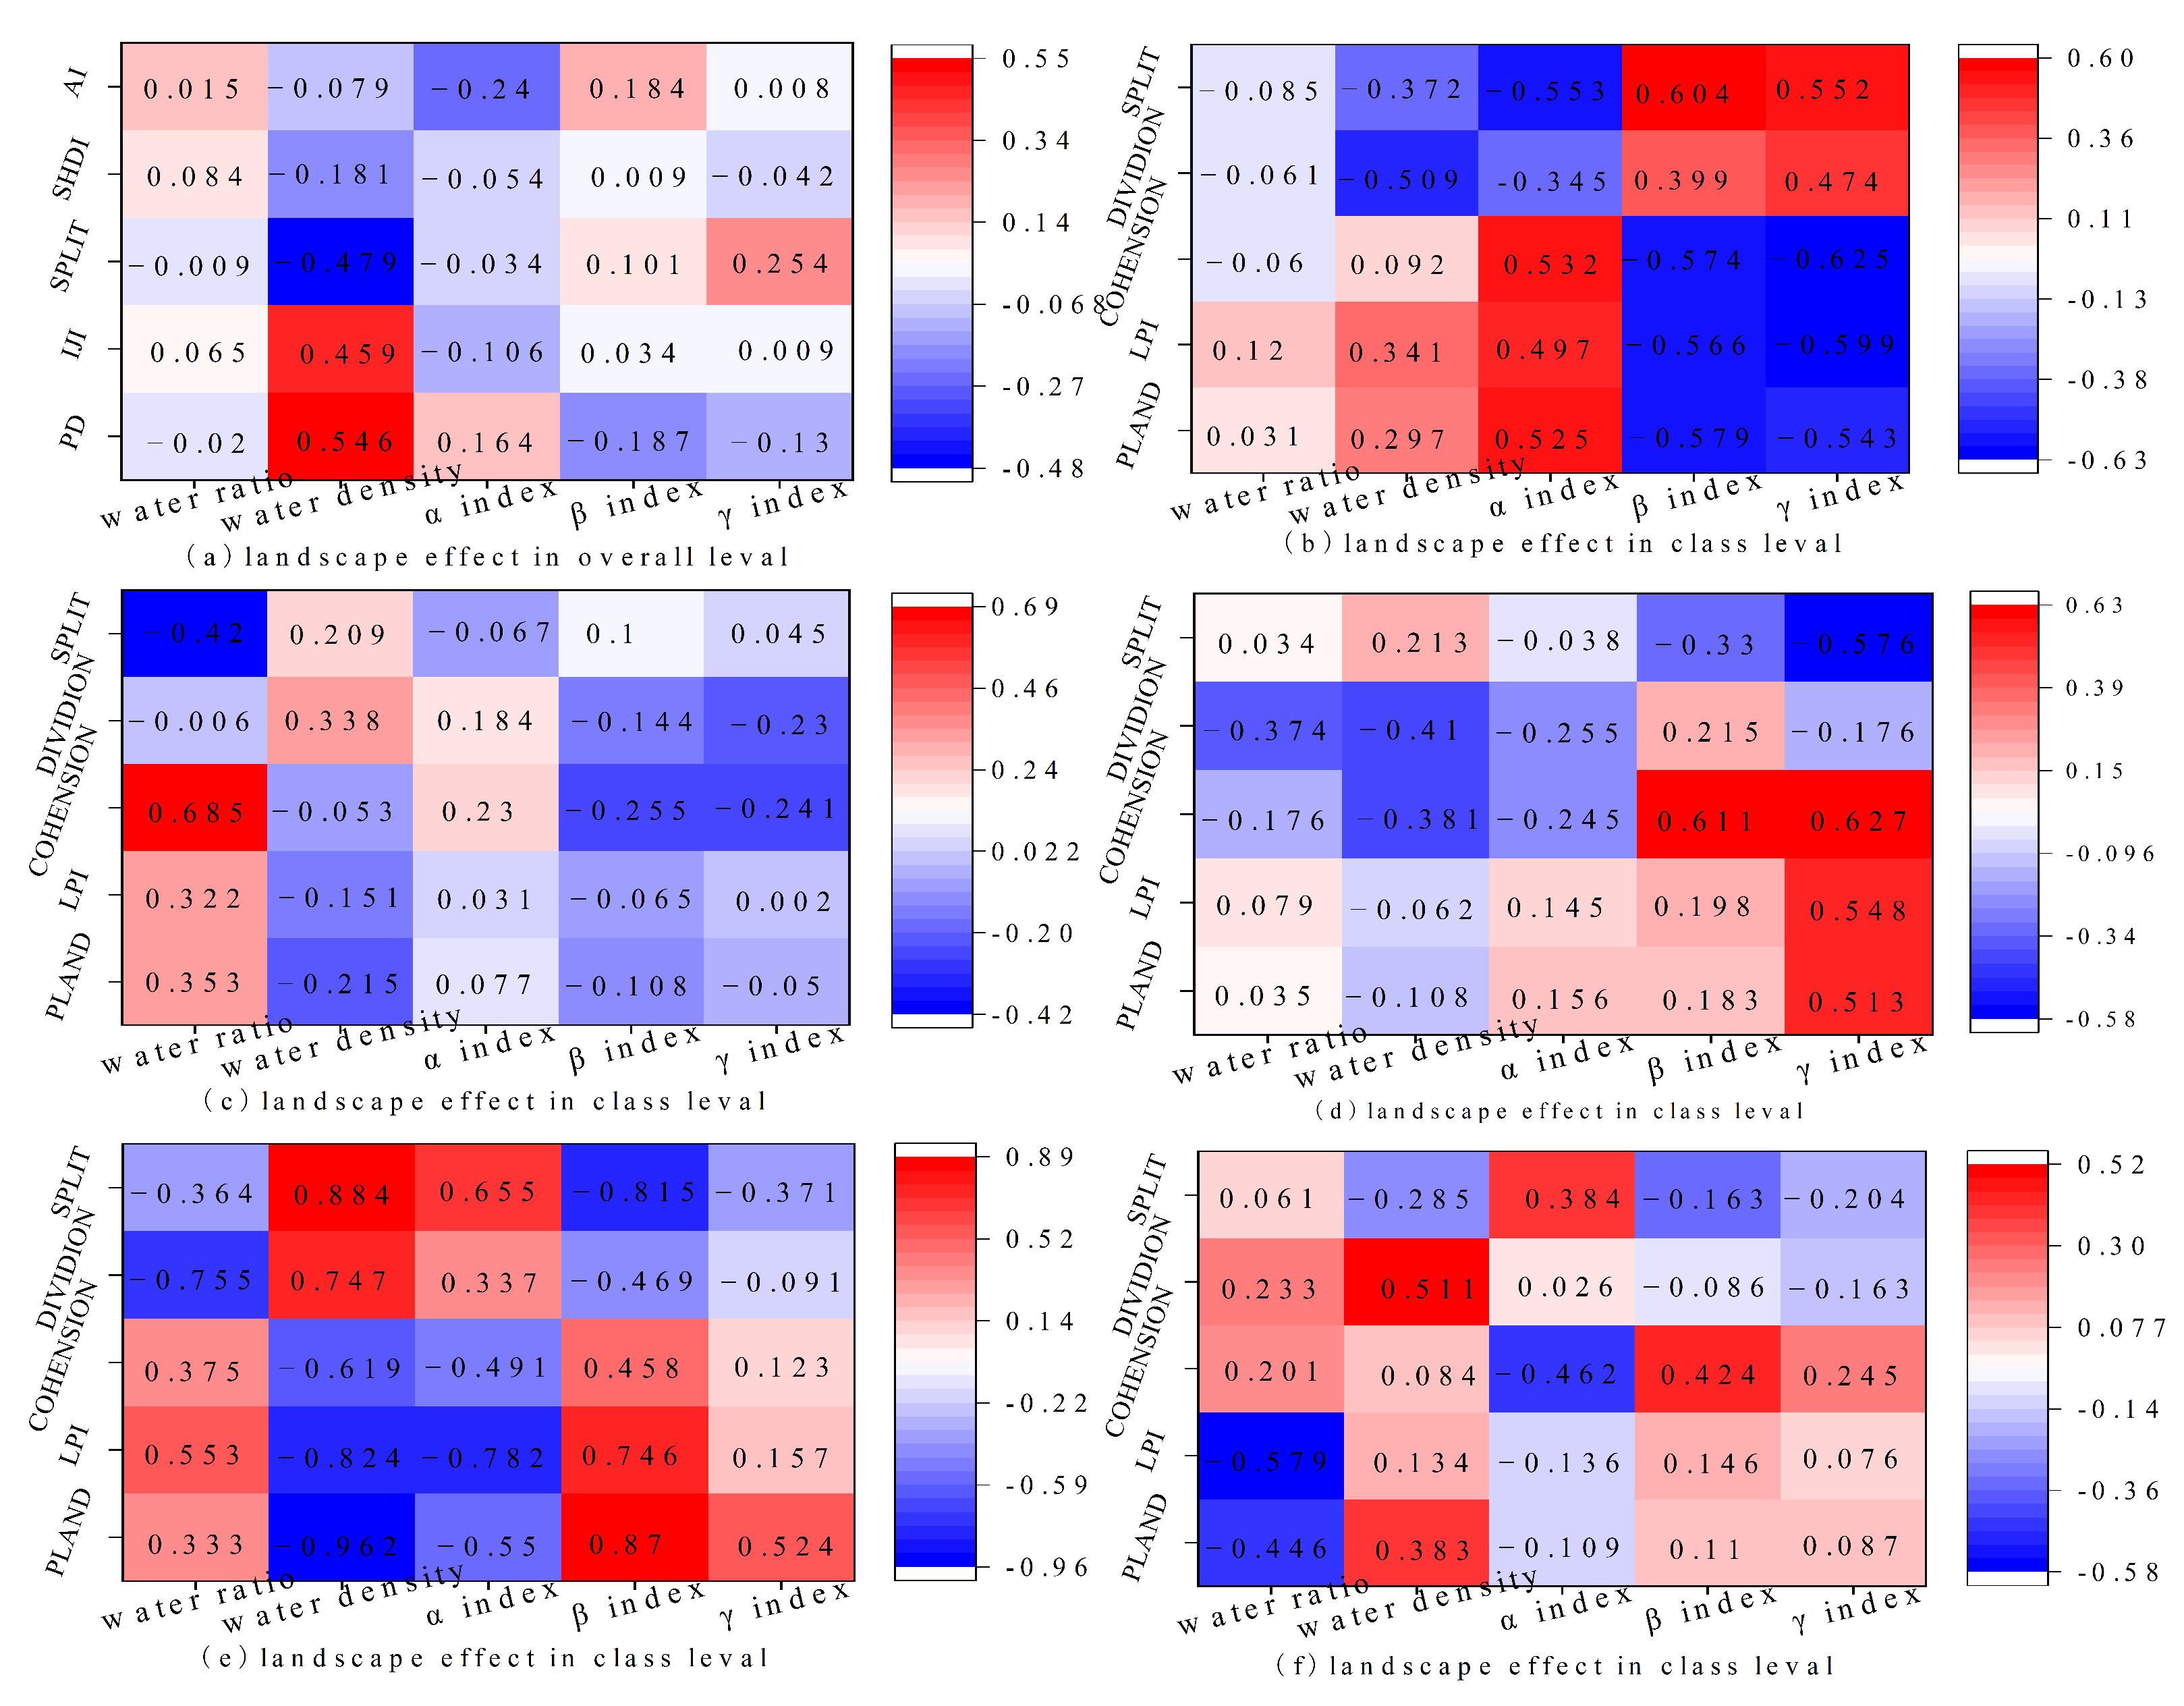
The change in the water density exhibited a strong correlation with the landscape change index, significant positive correlations with the patch density and the dispersion and juxtaposition index, and a significant negative correlation with the component fragmentation index (Figure 4a). This indicates that as the surface water became longer and denser, and the density of the landscape patches in the Yellow River Delta continued to increase, each landscape patch was more closely connected with the water, and the fragmentation of the components was reduced. The β index exhibited a negative correlation with the landscape patch density and a positive correlation with the landscape aggregation degree. That is, the more complex the surface water network was, the lower the patch density at the overall landscape level in the Yellow River Delta was and the stronger the aggregation degree of the same landscape was, revealing that the surface water had an obvious spatial attraction effect on the land use in its vicinity.

4.3.2. Landscape Effects by Type

From 1986 to 2019, some of the landscape pattern indices of the cultivated land, unused land, construction land, and swamps were significantly correlated with the water network characteristics, while the landscape indices of the tidal flats and unused land did not exhibit significant correlations with the water network indices (Figure 5b–f). Among them, the proportion of cultivated land patches in the landscape, the largest patch index, and the patch aggregation index were significantly positively correlated with the water network and were negatively correlated with the fragmentation index and component fragmentation index. This suggests that the area of cultivated land, the largest patch index, and the patch aggregation degree increased as the water density and water network closure increased in the study area, while the fragmentation degree of the cultivated land and the complexity of the landscape diminished. This was the result of the spatial attraction effect of the surface water network and the ecological demand for cultivated land. The patch aggregation index of the unused land was positively correlated with the water surface ratio, indicating that the aggregation degree of the unused land patches increased as the water surface ratio of the Yellow River Delta increased, which was a result of the spatial repulsion effect of the surface water and the environmental constraints of the unused land. The swamp fragmentation index was positively correlated with the water network, indicating that as the water density increased, the area of swamp landscape decreased, and the spatial repulsion effect of the surface water network was significant. This was attributed to the spatial attraction effect of the surface water and the constraints of the urban environmental conditions.

5. Discussion

In this study, the landscape pattern effects and ecosystem services effects caused by the surface water evolution in the Yellow River Delta were analyzed. The evolution of the surface water not only directly changed the overall landscape pattern of the Yellow River Delta but also influenced the changes in the other land-use types, thus leading to evolution of the ecosystem service value of the Yellow River Delta. Studies have found that different control schemes for sluices and dams lead to different water depth distributions, resulting in different soil water contents and soil salt contents, affecting the spatial distributions of the nutrients and pollution [57] and forming different vegetation cover types and land-use patterns [58]. Based on the results of this study, the single-factor response of the water evolution is the basis of the overall response of the ecosystem. The two are only different in scale but are not contradictory.
However, this study still has the following limitations. First, in this study, an increasing trend was identified, and the artificial water increased the most rapidly, which is consistent with the results of other studies [59,60]. This study focused on the overall response of the Yellow River Delta ecosystem to the surface water evolution, and the different types of surface water were distinguished; however, the ecological effects of the water with different salinities (salt or freshwater) and different uses (artificial or natural water) are bound to be different. Second, the ecological effects of the surface water evolution, as a key element in the ecological environment, should be multi-dimensional. In this study, its effects were only explored from the perspective of landscape patterns and water system services, which obviously cannot fully reflect the impact of the surface water on the Yellow River Delta. Therefore, future research can be conducted from the following two aspects: First, the ecological effects of the specific water types, such as salt water and fresh water or artificial water and natural water, should be examined. Second, the ecological effects of both single element and multiple elements should be explored, particularly whether there is an inherent relationship between the effects of single factors and multiple factors.

6. Conclusions

Overall, the surface water in the Yellow River Delta exhibited an overall increasing trend from 1986 to 2019. The artificial water accounted for the dominant proportion of the total water, and the composition of the water tended to be remarkably heterogeneous.
The ecological services of the surface water all increased significantly during the 35-year study period except for the sedimentary land reclamation. Tourism, materials production, and water supply became the main service functions of the surface water in the Yellow River Delta.
The evolution of the surface water had obvious physical cutting and spatial attraction effects on the landscape pattern of the Yellow River Delta. This demonstrates the comprehensive effect of the protective constraints, spatial attraction, and spatial exclusion on the landscape pattern of the regional land-use types.

Author Contributions

Data curation, methodology, software, visualization, and writing—original draft, Y.L., S.H. and X.K.; conceptualization, funding acquisition and project administration, and supervision, M.H. and Y.L.; writing and editing, Y.L., M.W. and H.H. All authors have read and agreed to the published version of the manuscript.

Funding

This research was funded by the National Social Science Foundation of China (No. 21BG026).

Institutional Review Board Statement

Not applicable.

Informed Consent Statement

Not applicable.

Data Availability Statement

Not applicable.

Acknowledgments

The authors thank Xiyong Hou (Institute of Coastal Zone Research, Chinese Academy of Sciences) and Yubin Liu (Qilu Normal University) for their insightful comments and helpful suggestions.

Conflicts of Interest

The authors declare no conflict of interest.

References

  1. Fu, Y.; Xu, X.L.; Tong, L.G.; Li, S. Spatial-temporal variation and driving forces of surface water in Beijing over one hundred years. Resour. Sci. 2014, 36, 75–83. [Google Scholar]
  2. Guevara, O.C.; Medina, S.A.; Vives, L. Spatio-temporal effect of climate change on water balance and interactions between groundwater and surface water in plains. Sci. Total Environ. 2020, 72, 78–86. [Google Scholar] [CrossRef]
  3. Diva, B.; Mall, R.K. Surface Water Resources, Climate change and simulation modeling. Aquat. Procedia 2015, 4, 730–738. [Google Scholar]
  4. Verpoorter, C.; Kutser, T.; Seekell, D.A.; Tranvik, L.J. A global inventory of lakes based on high-resolution satellite imagery. Geophys. Res. Lett. 2014, 41, 6396–6402. [Google Scholar] [CrossRef]
  5. Pekel, J.F.; Cottam, A.; Gorelick, N.; Belward, A.S. High-resolution mapping of global surface water and its long-term changes. Nature 2016, 540, 418–422. [Google Scholar] [CrossRef]
  6. Zhang, X.L.; Xiao, Z.M.; Xu, Z.J.; Zhang, C.H. Biodiversity characteristics and protection countermeasures of the coastal wetlands in the Yellow River Delta. Wetl. Sci. 2011, 9, 125–131. [Google Scholar]
  7. Xie, C.J.; Cui, B.S.; Xie, T.T.; Yu, S.L.; Liu, Z.Z.; Chen, C.; Ning, Z.H.; Wang, Q.; Zou, Y.X.; Shao, X.J. Hydrological connectivity dynamics of tidal flat systems impacted by severe reclamation in the Yellow River Delta. Sci. Total Environ. 2020, 739, 139860. [Google Scholar] [CrossRef]
  8. Sun, S.A.; Tang, Q.H. Spatiotemporal patterns and driving factors of water resources use in the Yellow River Basin. Resour. Sci. 2020, 42, 2261–2273. [Google Scholar] [CrossRef]
  9. Xu, X.G.; Liang, Z.; Zhou, X. Land and sea coordination for sustainable development in the Yellow River Delta. Resour. Sci. 2020, 42, 424–432. [Google Scholar] [CrossRef]
  10. Xu, X.G.; Guo, X.L.; Guo, H.H.; Lin, H.P. A study on land use and land cover quality change: Taking Yellow River Delta as a case. Acta Geogr. Sin. 2001, 56, 640–648. [Google Scholar]
  11. Jiang, W.X.; Niu, Z.G.; Wang, L.C.; Yao, R.; Gui, X.; Xiang, F.F.; Ji, Y.X. Impacts of Drought and Climatic Factors on Vegetation Dynamics in the Yellow River Basin and Yangtze River Basin, China. Remote Sens. 2022, 14, 930. [Google Scholar] [CrossRef]
  12. Ji, H.Y.; Chen, S.L.; Jiang, C.; Fan, Y.S.; Fu, Y.T.; Li, P.; Liu, F.C. Damming-Induced Hydrogeomorphic Transition in Downstream Channel and Delta: A Case Study of the Yellow River, China. Water 2022, 14, 2079. [Google Scholar] [CrossRef]
  13. Baalaousha, H.M. Characterisation of groundwater-surface water interaction using field measurements and numerical modeling: A case study from the Ruataniwha Basin, Hawke’s Bay, New Zealand. Appl. Water Sci. 2012, 2, 109–118. [Google Scholar] [CrossRef] [Green Version]
  14. Baartman, J.; Nunes, J.P.; Masselink, R.; Darboux, F.; Wainwright, J. What do models tell us about water and sediment connectivity? Geomorphology 2020, 20, 107300. [Google Scholar] [CrossRef]
  15. Blake, W.H.; Kelly, C.; Wynants, M.; Patrick, A.; Lewin, S.; Lawson, J.; Nasolwa, E.; Page, A.; Nasseri, M.; Marks, C.; et al. Integrating land-water-people connectivity concepts across disciplines for co-design of soil erosion solutions. Land Degrad. Dev. 2020, 32, 3415–3430. [Google Scholar] [CrossRef]
  16. Li, S.W.; Li, F.; Song, X.K.; Zhang, M.L. The influence of water-sediment regulation on macrobenthic community structures in the Huanghe River (Yellow River) Estuary during 2012–2016. Acta Oceanol. Sin. 2020, 39, 120–128. [Google Scholar] [CrossRef]
  17. Zhong, Q.; Xue, B.; Noman, M.A.; Wei, Y.Q.; Liu, H.J.; Liu, H.B.; Zheng, L.P.; Jing, H.M.; Sun, J. Effect of river plume on phytoplankton community structure in Zhujiang River estuary. J. Oceanol. Limnol. 2021, 39, 550–565. [Google Scholar] [CrossRef]
  18. Zou, Y.F.; Wang, L.; Xu, H.M.; Yan, Y.; Zhang, J.Y.; Liu, Y.; Li, P.; Peng, Z.Y.; Lu, H.Y. Do changes in water depth and water level influence the diatom diversity of Yunlong Lake, in Yunnan Province, Southwest China? J. Paleolimnol. 2020, 64, 273–291. [Google Scholar] [CrossRef]
  19. Dos, S.; Natan, G.S.; Ligia, R.O.; Angelica, I.; Carlos, C.; Maria, S.M. How free-floating macrophytes influence interactions between planktivorous fish and zooplankton in tropical environments? An in-lake mesocosm approach. Hydrobiologia 2020, 847, 1357–1370. [Google Scholar]
  20. Fu, H.; Zhong, J.Y.; Yuan, G.X.; Cao, T.; Ni, L.Y. Sources and structures of functional traits variations in submersed macrophytes: A case of Potamogeton maackianus. J. Lake Sci. 2015, 27, 429–435. [Google Scholar]
  21. Ma, G.Q.; Xiao, J.P.; Li, Q.J.; Zhang, L.X.; An, B.; Sun, G.J.; Cheng, H.; Tang, J.Q.; Li, H. Impact of the evolution of Plateau Lake landscape pattern on ecosystem service value in the Pearl River basin: A case study of Yilong Lake Basin in Yunnan Province, China. Acta Geophys. 2022, 23, 1–17. [Google Scholar] [CrossRef]
  22. Milena, D.; Nicolay, L.C.; Rozângela, B.R.; Geraldo, A.D.; Vanda, L.F. Trait-Environment Relationship of Aquatic Vegetation in a Tropical Pond Complex System. Wetlands 2020, 40, 299–310. [Google Scholar]
  23. James, S.S.; Lindsey, S.R.; Carrie, R.A.; Eban, B.; Alexander, J.R.; Basil, V.I. Vegetation management and benthic macroinvertebrate communities in urban stormwater ponds: Implications for regional biodiversity. Urban Ecosyst. 2021, 24, 725–735. [Google Scholar]
  24. Cai, M.; Li, S.; Ye, F.; Hong, Y.G.; Lü, M.Q.; Opden, C.; Huub, J.M.; Wang, Y. Artificial ponds as hotspots of nitrogen removal in agricultural watershed. Biogeochemistry 2022, 159, 283–301. [Google Scholar] [CrossRef]
  25. Daniel, K.; Carla, W.; Anke, G.; Gerald, J. Drainage Ditches Contribute Considerably to the CH4 Budget of a Drained and a Rewetted Temperate Fen. Wetlands 2021, 41, 71. [Google Scholar]
  26. Dobrovol’skii, S.G.; Lebedeva, I.P.; Istomina, M.N.; Solomonova, I.V. World Reservoirs: Analysis of Quantitative Characteristics and Their Effect on the Structure of Long-Term Runoff Variations of Regulated Rivers. Water Resour. 2020, 47, 1–12. [Google Scholar] [CrossRef]
  27. Samuel, O.; Adeyemi, O.; Ibiyinka, F.; Olufemi, D. Temporal variation in deterministic chaos: The influence of Kainji dam on downstream stations along lower Niger River. Arab. J. Geosci. 2022, 15, 237. [Google Scholar]
  28. Wolf, S.; Esser, V.; Lehmkuhl, F.; Schüttrumpf, H. Long-time impact of a large dam on its downstream river’s morphology: Determined by sediment characteristics, pollutants as a marker, and numerical modelling. J. Sediment. Environ. 2022, 7, 403–424. [Google Scholar] [CrossRef]
  29. Mandana, B.; Saeid, E.; Gholamreza, S.; Alborz, H. Assessing the earth dams’ effect on the groundwater of its location case study: Kord-Oliya dam. Arab. J. Geosci. 2020, 13, 1199. [Google Scholar]
  30. Xu, X.B.; Tan, Y.; Yang, G.S.; Li, H.P.; Su, W.Z. Impacts of China’s Three Gorges Dam Project on net primary productivity in the reservoir area. Sci. Total Environ. 2011, 409, 4656–4662. [Google Scholar] [CrossRef]
  31. Murat, C.; Emre, Ç.; Adem, A.; Emrah, D. The effects of the dam construction process on downstream river geomorphology. Arab. J. Geosci. 2021, 14, 333–349. [Google Scholar]
  32. Pang, G.W.; Yang, Q.K.; Wang, C.M.; Li, R.; Zhang, L. Quantitative assessment of the influence of terrace and check dam construction on watershed topography. Front. Earth Sci. 2020, 14, 360–375. [Google Scholar] [CrossRef]
  33. Yang, Z.Q.; Hu, L.T.; Sun, K.N. The potential impacts of a water transfer project on the groundwater system in the Sugan Lake Basin of China. Appl. Hydrogeol. 2021, 29, 1485–1499. [Google Scholar] [CrossRef]
  34. Liu, W.W.; Kuo, Y.M.; Zhao, E.M. Influence of the south-to-north water transfer and the Yangtze River mitigation projects on the water quality of Han River, China. Environ. Earth Sci. 2021, 80, 246. [Google Scholar] [CrossRef]
  35. Kandathil, R.D.; Zhao, S.S.; Chen, Y.S.; Cheng, F.; Zhang, L.; Qin, J.; Thundiparambil, S.A.; Schmidt, V.B.; Xie, S.G. A comparison of zooplankton assemblages in Nansi Lake and Hongze Lake, potential influences of the East Route of the South-to-North Water Transfer Project, China. J. Oceanol. Limnol. 2021, 39, 623–636. [Google Scholar]
  36. Bidur, P.; Amartya, P.; Pulak, M.; Bhagirath, B. Irrigation-based agricultural intensification and future groundwater potentiality: Experience of Indian states. SN Appl. Sci. 2021, 3, 449. [Google Scholar]
  37. Gugulothu, S.; Subbarao, N.; Das, R.; Dhakate, R. Geochemical evaluation of groundwater and suitability of groundwater quality for irrigation purpose in an agricultural region of South India. Appl. Water Sci. 2022, 12, 142. [Google Scholar] [CrossRef]
  38. Frake, A.N.; Namaona, W.; Walker, E.D. Estimating spatio-temporal distributions of mosquito breeding pools in irrigated agricultural schemes: A case study at the Bwanje Valley Irrigation Scheme. Malar. J. 2020, 19, 38. [Google Scholar] [CrossRef] [Green Version]
  39. Bijay, H.; Jatisankar, B.; Khaled, M.K.; Chow, M.F.; Fredolin, T.G.; Yaseen, Z.M. Delineation of urban expansion influences urban heat islands and natural environment using remote sensing and GIS-based in industrial area. Environ. Sci. Pollut. Res. 2022, 29, 73147–73170. [Google Scholar]
  40. Zhang, H.; Yin, Y.X.; An, H.M.; Lei, J.P.; Li, M.; Song, J.J.; Han, W.H. Surface urban heat island and its relationship with land cover change in five urban agglomerations in China based on GEE. Environ. Sci. Pollut. Res. 2022, 22, 1–15. [Google Scholar] [CrossRef]
  41. Han, M.; Du, H.; Zhang, C.; Li, G.W.; Shi, L.H. Water resources sustainable utilization evaluation based on the DPSIR in the Yellow River Delta. China Popul. Resour. Environ. 2015, 25, 154–160. [Google Scholar]
  42. Dongying Statistical Yearbook Committee. Dongying Statistical Yearbook (2020); China local Records Publishing: Beijing, China, 2020. [Google Scholar]
  43. Dongying Local History Compilation Committee. Annals of Dongying City (1983–1995); Zhonghua Book Company: Beijing, China, 1996. [Google Scholar]
  44. OuYang, Z.Y.; Zhao, T.Q.; Wang, X.K.; Miao, K. Ecosystem serices analysis and vauation of Chinese terrestrial surface water system. Acta Ecol. Sin. 2004, 24, 2091–2099. [Google Scholar]
  45. Gu, M.L.; Ye, C.S.; Li, X.; Hu, H.P. Land-Use optimization based on ecosystem service value: A case study of urban agglomeration around Poyang lake, China. Sustainability 2022, 14, 7131. [Google Scholar] [CrossRef]
  46. Zhao, Q.J.; Wang, Q.Y. Water ecosystem service quality evaluation and value assessment of Taihu lake in China. Water 2021, 13, 618. [Google Scholar] [CrossRef]
  47. Wang, L.; Zeng, H. The principle of road network structures and its ecological effects on landscape in Shenzhen. Geogr. Res. 2012, 31, 853–862. [Google Scholar]
  48. Gersh, M.; Gleason, K.E.; Surunis, A. Forest fire effects on landscape snow albedo recovery and decay. Remote Sens. 2022, 14, 4079. [Google Scholar] [CrossRef]
  49. Dongying City Marine and Fishery Annals Compilation Committee. Journal of Ocean and Fishery in Dongying City; Zhonghua Book Company: Beijing, China, 2005. [Google Scholar]
  50. Dongying Statistical Yearbook Committee. Dongying Statistical Yearbook (2017); China Local Records Publishing: Beijing, China, 2017. [Google Scholar]
  51. Zhao, T.Q.; OuYang, Z.Y.; Wang, X.K.; Miao, K.; Wei, Y.C. Ecosystem services and their valuation of terrestrial surface water system in China. J. Nat. Resour. 2003, 18, 443–452. [Google Scholar]
  52. Costanza, R.; Arge, R.; Groot, R.D.; Farber, S.; Grasso, M.; Hannon, B.; Limburg, K.; Naeem, S.; Robert, V.O.; Paruelo, J. The value of the world’s ecosystem services and natural capital. Ecol. Econ. 1997, 25, 253–260. [Google Scholar] [CrossRef]
  53. Gao, P.; Mu, X.M.; Wang, F.; Li, R. Changes in streamflow and sediment discharge and the response to human activities in the middle reaches of the Yellow River. Hydrol. Earth Syst. Sci. 2010, 15, 347–350. [Google Scholar] [CrossRef]
  54. Peng, J.; Chen, S.L. The variation process of water and sediment and its effect on the Yellow River Delta over the six decades. Acta Geogr. Sin. 2009, 64, 1353–1362. [Google Scholar]
  55. Wang, Y.M. Analysis on the Water and Sediment Variation in Yellow River and Its Influence on the Change of Yellow River Delta; University of Chinese Academy of Science and Ministry of Education: Beijing, China, 2016. [Google Scholar]
  56. Qu, Z.C.; Li, Y.Z.; Yu, J.; Yang, J.B.; Yu, M.; Zhou, D.; Wang, X.H.; Wang, Z.K.; Yu, Y.; Ma, Y.Q.; et al. Influence of Gate Dams on Yellow River Delta Wetlands. Land 2022, 11, 706. [Google Scholar] [CrossRef]
  57. Qi, Y.; Zhao, Y.L.; Fu, G.; Li, J.S.; Zhao, C.Y.; Guan, X.; Zhu, S.Y. The Nutrient and Heavy Metal Contents in Water of Tidal Creek of the Yellow River Delta, China: Spatial Variations, Pollution Statuses, and Ecological Risks. Water 2022, 14, 713. [Google Scholar] [CrossRef]
  58. Wang, X.H.; Zhang, D.J.; Guan, B.; Qi, Q.; Tong, S.Z. Optimum water supplement strategy to restore reed wetland in the Yellow River Delta. PLoS ONE 2017, 12, e0177692. [Google Scholar] [CrossRef] [PubMed] [Green Version]
  59. Zhang, B.L.; Zhang, Q.Y.; Feng, C.Y.; Feng, Q.Y.; Zhang, S.M. Understanding Land Use and Land Cover Dynamics from 1976 to 2014 in Yellow River Delta. Land 2017, 6, 20. [Google Scholar] [CrossRef] [Green Version]
  60. Wei, C.X.; Guo, B.; Fan, Y.W.; Zang, W.Q.; Ji, J.W. The Change Pattern and Its Dominant Driving Factors of Wetlands in the Yellow River Delta Based on Sentinel-2 Images. Remote Sens. 2022, 14, 4388. [Google Scholar] [CrossRef]
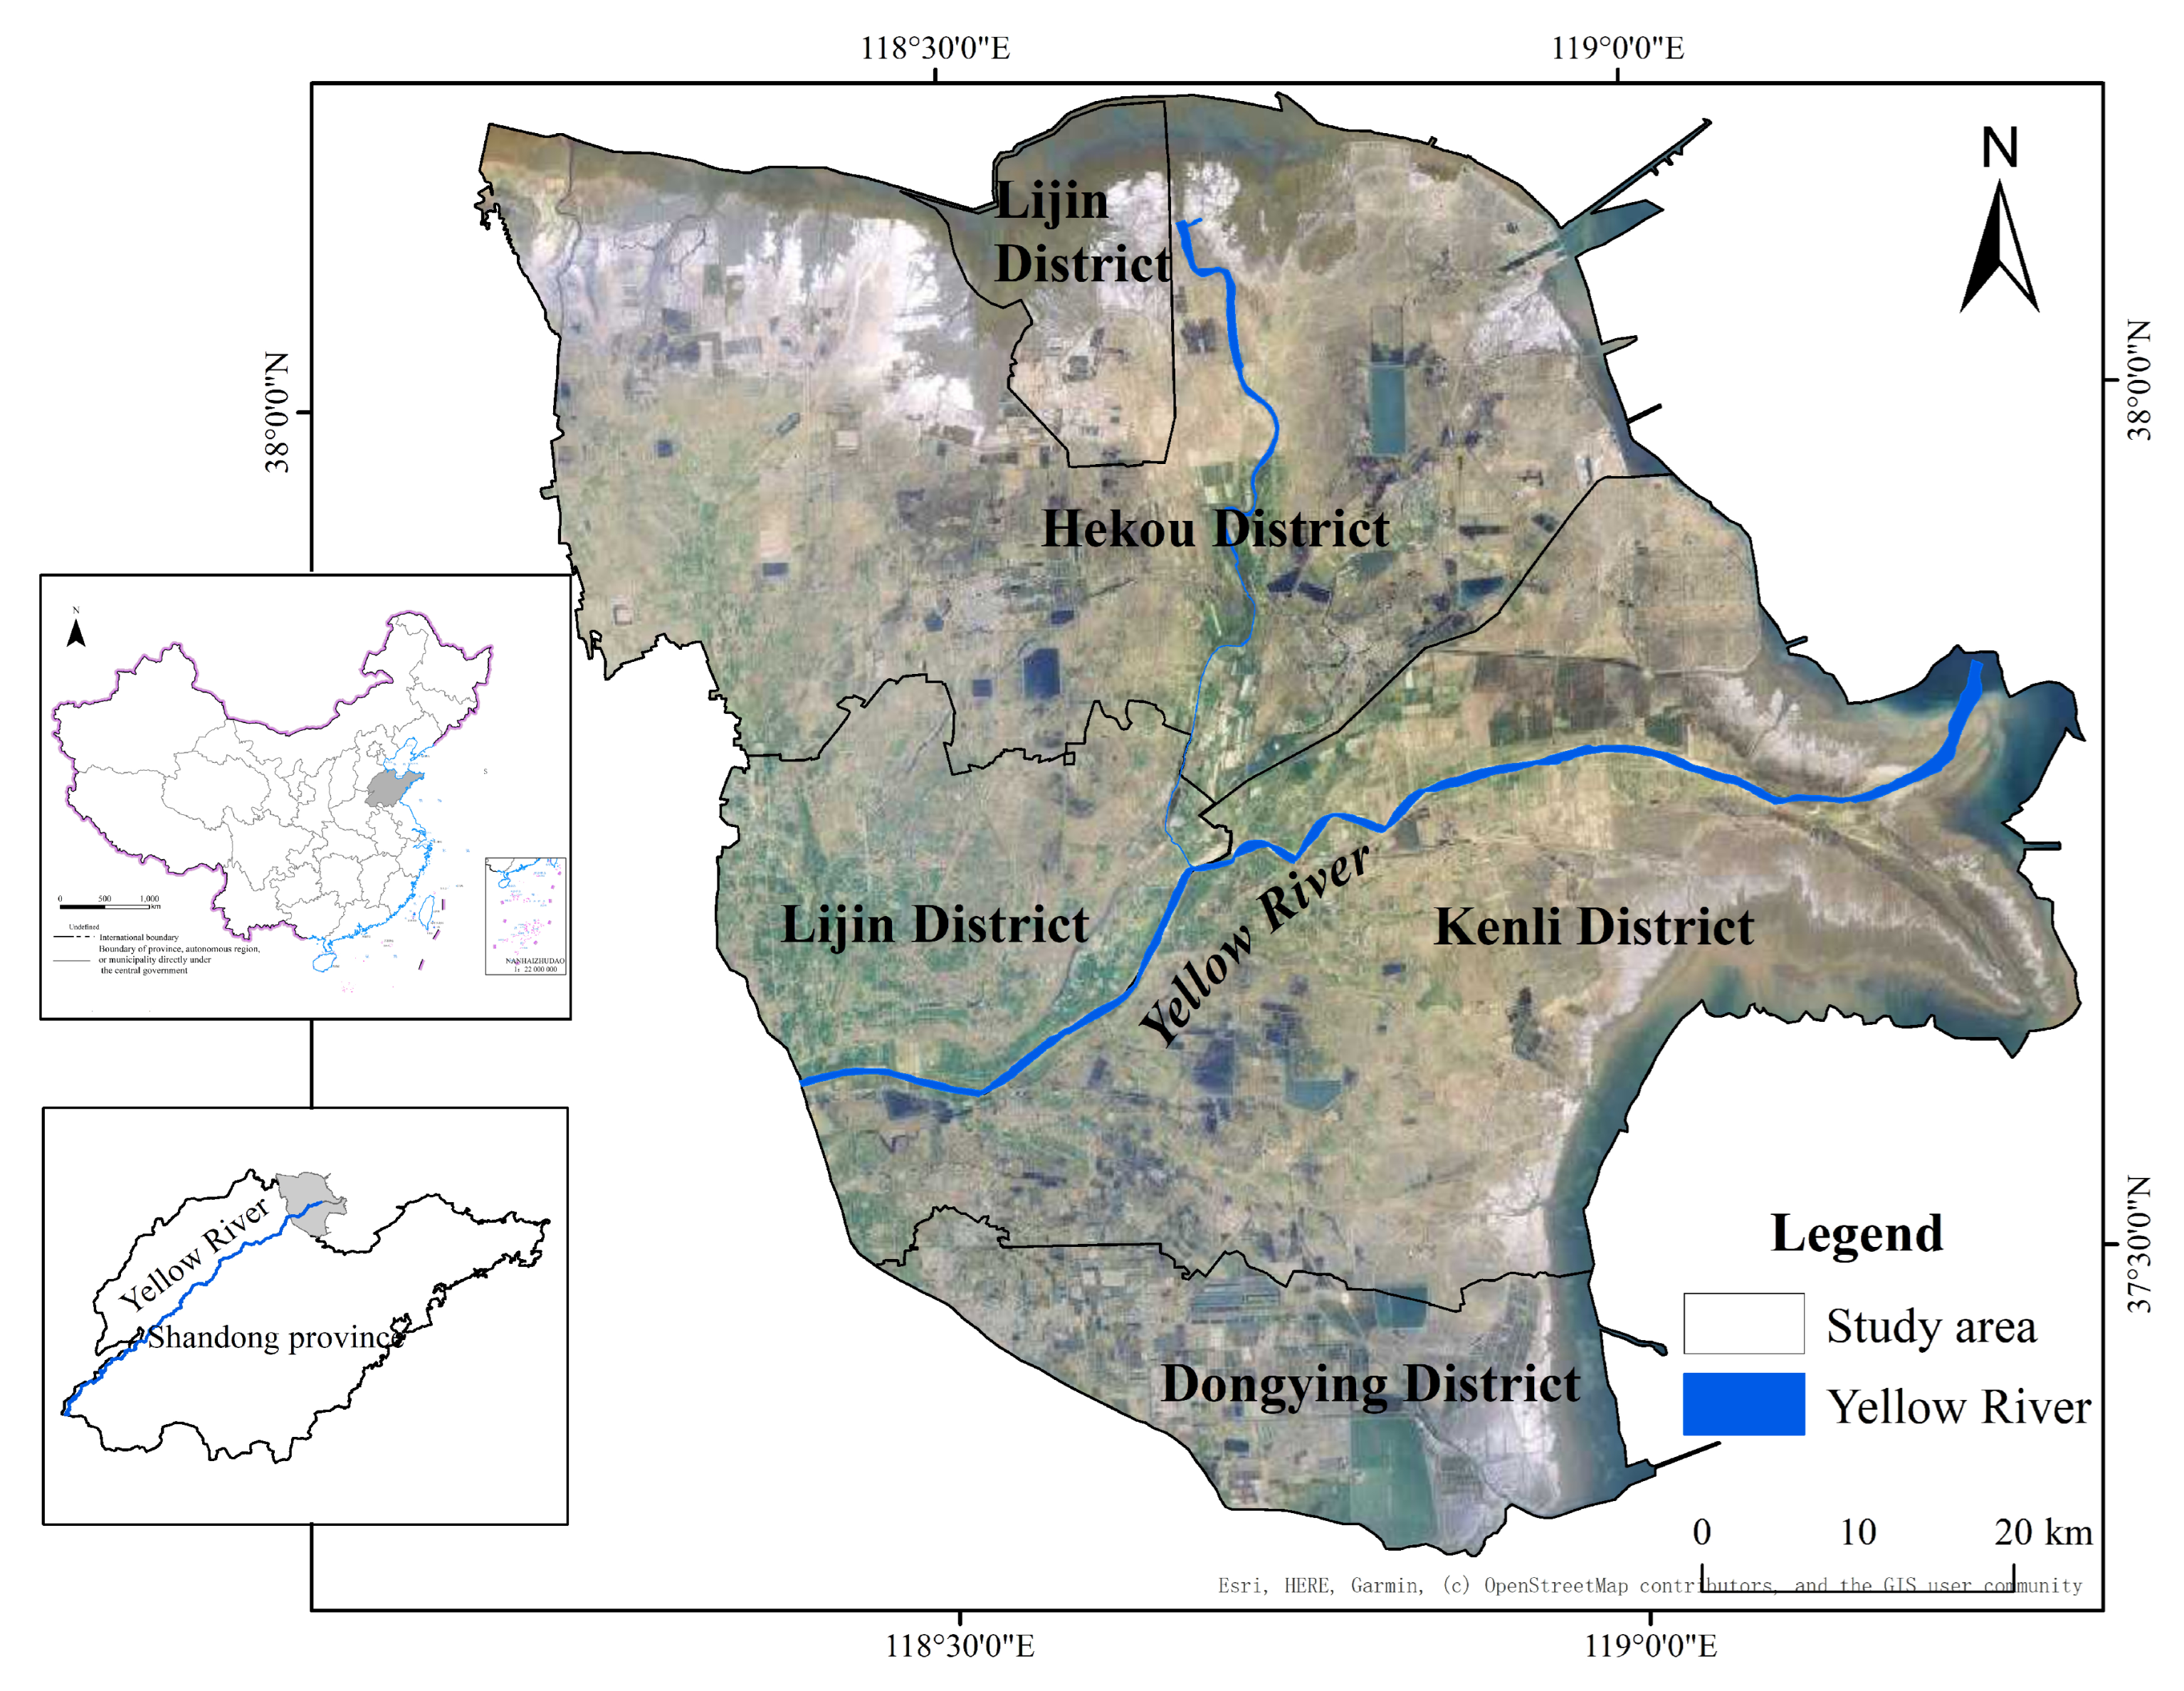
Figure 1. Location and scope. Note: The review number of China map is GS (2020)4630.
Sustainability 14 13544 g001
Figure 2. Land/land-cover types in the Yellow River Delta from 1986 to 2019.
Sustainability 14 13544 g002
Figure 3. Research framework diagram.
Sustainability 14 13544 g003
Figure 4. The conversion metrics of surface water.
Sustainability 14 13544 g004
Figure 5. The landscape effects of surface water evolution.
Sustainability 14 13544 g005
Table 1. Statistics on the evolution of surface water.
Type of Water Planar Water (km2)Linear Water (km2)
RiverPit-PondReservoir Salt Aquaculture Pond TotalRiverDitchTotal
1986Area121.374.519.937.3253.1707.71492.62200.3
Ratio47.9329.447.8614.7410032.1667.84100
2019Area90.6141.9144.8996.91374.3711.911,018.411,730.3
Ratio6.5910.3310.5472.541006.0793.93100
Table 2. Comparison of ecological service values of surface water.
Functions19862019
Value
(CNY 100 Million)
PercentageValue
(CNY 100 Million)
Percentage
SupplyWater supply26.0848.7658.2428.18
Material production6.3311.8368.5033.15
CulturalTourism0069.4733.62
RegulatorySedimentary land reclamation 19.0535.613.611.75
Purification0.390.730.670.32
Flood regulation and storage0.771.441.260.61
SupportingHabit maintenance0.871.634.892.37
Total53.49100206.64100
Publisher’s Note: MDPI stays neutral with regard to jurisdictional claims in published maps and institutional affiliations.