Abstract
In the paper, we propose a novel method to analyze the rebalancing of the free-floating bike-sharing system. First, we construct a visualization method to analyze the rebalancing of the system. Then, for the first time, we set up a coarse-grained way to study dynamics rebalancing during rush hours. Finally, we complete the empirical analysis with the real-time cycling data of the Nanjing Mobike Sharing-bike Company. The results show that: static rebalancing is weak, and dynamic rebalancing during rush hours is serious. Therefore, increasing the number of shared bikes in parking spots can ease the rebalancing. At the same time, we find that commuting to and from work is not the main factor that constitutes the rebalancing of the free-floating bike-sharing system, though the rebalancing is proportional to travel frequency.
1. Introduction
As a convenient [1] and economical [2] green travel tool to ease the last kilometer [3], the bike-sharing system has gradually been widely accepted and used by the public [4,5]. Shared bikes promote the reduction of air pollution [6,7], the alleviation of traffic congestion [8,9] and better health through increased exercise [10].
To overcome the inconvenience of the fixed pile, free-floating bike-sharing systems as a new type first appeared in China [11,12,13], such as Mobike, ofo, and Hellobike [14]. It can borrow or return bicycles near cyclists’ destinations through a mobile APP, which is convenient for the cyclist and has been accepted and used by many countries [15].
Providing stable borrowing and returning services for cyclists is the basis for the daily operation of the bike-sharing system [16]. Although there is no fixed pile in the free-floating bike-sharing systems, it is also necessary to confirm whether there is a bike to borrow or a suitable place to park [1]. Therefore, rebalancing is still a problem that the system must face in the daily operation process.
Repositioning bicycles through vehicles is the most effective way to solve the rebalancing [17]. To obtain the optimal dynamic rebalancing scheme, some scholars studied the starting time of the rebalancing through the Birth–Death processes [18], and some scholars predicted the rebalancing demand [19]. Other scholars also consider the issue of carbon dioxide emissions [20].
The existing literature on the rebalancing problem of free-floating bike-sharing systems focuses on prediction [21], vehicle scheduling routes [22], location optimization [23,24], etc. Results about the spatiotemporal evolution of rebalancing itself based on cycling records are rare. At the same time, the topic of visual methods of rebalancing has not been explored.
To fill the two gaps, we propose a novel method to analyze the rebalancing of the free-floating bike-sharing systems (Figure 1). Firstly, we built a way to achieve rebalancing visualization for the first time. Then, we set up a new coarse-grained method to produce the evolution law of dynamic rebalancing.
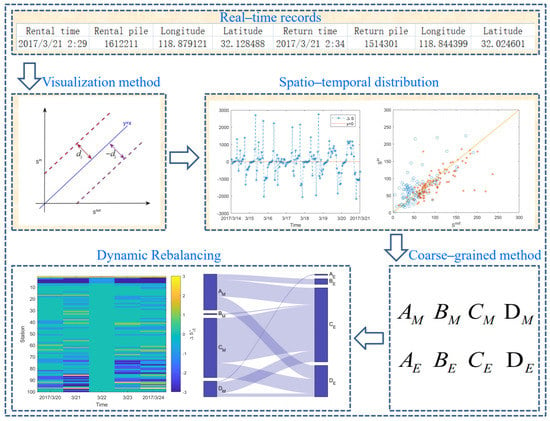
Figure 1.
Flow chart of rebalancing demand analysis.
2. Methods
2.1. Visualization Method
We construct square grids which cover the activity area of the shared bike and obtain the rebalancing on the grid by calculating the difference between the frequency of borrowing and returning: , .
When the value of and are equal, point falls on line ; When and are different, point will offset line and the distance from to line depicts the degree of rebalancing on grid (Figure 2):
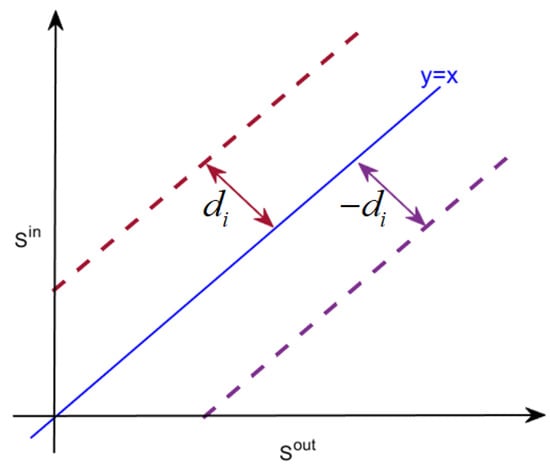
Figure 2.
The distance from to line.
Therefore, the scatter diagram of , constructed by indicators , , , and is an effective visual method to depict the rebalancing. Based on the above discussion, we set up a new visualization method to analyze the rebalancing.
2.2. Dynamic Rebalancing Analysis Method
In this section, we propose an analysis method of dynamic rebalancing based on a coarse-grained method for the first time. The specific steps are as follows:
Step1: Rebalancing during morning rush hour
The first 100 grids with the most active riding behaviors are called S-type important grids and are recorded as , . A coarse-grained method, by the distance from to line , is proposed to analyze the rebalancing on grid quantitatively. and respectively represent the frequency of borrowing and returning on the grid during morning rush hour. The specific steps are as follows:
(a) Calculation of the distance: from to line :
(b) Coarse-grained analysis of the rebalancing on grid at the morning peak of the day:
(c) Conversion of the rebalancing on grid during the morning rush hour of weekdays into vector :
(d) Classification of vector according to the following methods:
(e) According to the above results, grid during the morning rush hour is divided into four types: , , and . Here, , , , .
Step2: Rebalancing during evening rush hour
Replace , , with the frequency of borrowing and returning , , on the grid during evening rush hour, repeat steps (a)–(e) in Step 1, and divide the grids during evening rush hour into four types: , , and , where , , , .
Step3: Transformation of rebalancing types
Based on and , depict the transformation relationship of rebalancing types of grid during the rush hour. Here,
and , .
3. Empirical Analysis
All data are from Nanjing Mobike Sharing-bike Company from 12 March 2017 to 21 February 2017, including 1,446,669 real-time cycling records of 48,485 shared bikes. We divide the cycling area in Nanjing into 102,287 squares with a side length of 300 m (Shaheen, 2012). There are 10197 squares with riding behavior recorded as , .
3.1. Time Distribution
By an interval of one hour, we respectively counted the frequency of borrowing and returning records on grids and obtained the time distribution of the rebalancing within a week (Figure 3).

Figure 3.
The time distribution.
The time distribution of rebalancing (the sign only represents the type of rebalancing) is seriously unbalanced, but it has good consistency with the riding frequency. During the rush time of weekdays, the value increases sharply, forming a tidal phenomenon (Wednesday afternoon did not appear because of rain). On weekends, tidal phenomena occur during the evening rush hour. Therefore, there is a clear positive correlation between rebalancing and cycling frequency.
3.2. Space Distribution
From the perspective of spatial distribution, the cycling behavior concentrates on 10197 grids. However, the distribution of and on grid is uneven, and grid with higher frequency is surrounded by grid with lower frequency (Figure 4a,b).
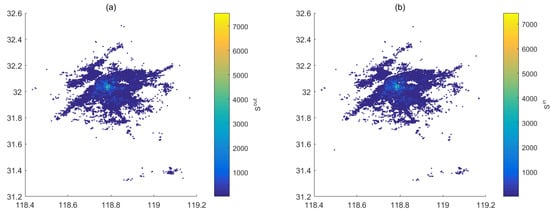
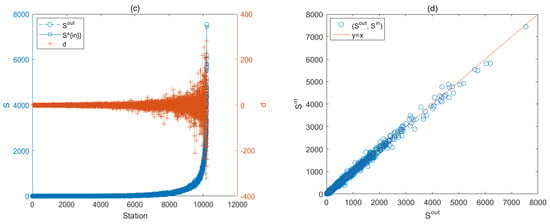
Figure 4.
Space distribution: (a) borrowing behavior; (b) returning behavior; (c) recording frequency; (d) the rebalancing.
According to the distribution of , 9607 grids are not 0. The average of is 150, the minimum is 1, and the maximum is 7536. As far as the distribution of is concerned, 9237 grids are not 0. The average of is 156, the minimum is 1, and the maximum is 7442 (Figure 4c). By comparing the values of and on grid , we found that their distributions are consistent (Figure 4d). on grid with larger is larger, whereas is smaller. That is to say, the rebalancing on grid is weak, and rebalancing is proportional to .
Taking as the horizontal axis and as the vertical axis, we get the spatial distribution of daily rebalancing on grid (Figure 5a–f). We find that is near line , and the smaller the value of is, the closer it is to and line . Thus, daily rebalancing is generally weak; the regions with serious rebalancing for the systems are clustered in the grids with high .
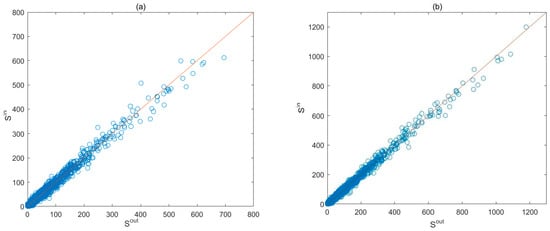
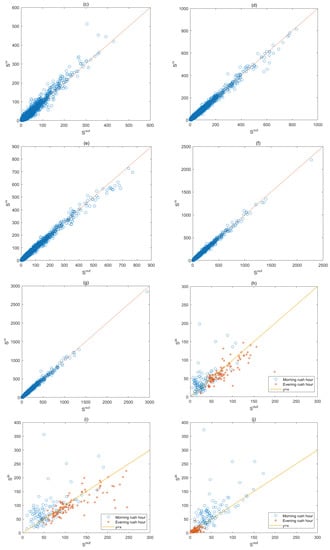

Figure 5.
Space distribution: (a–g) daily rebalancing on grid ; (h–n) daily rebalancing on grid .
3.3. S-Type Important Grid
Based on the above analysis, we calculate the total frequency of riding behavior on grids within a week and determine the top 100 grids with the most activity, which are called S-type important grids and recorded as , .
Taking and on as the research object, we obtained the distribution of during the rush hour of each day (Figure 5h–l). On weekdays, is higher than during the morning rush hour, and point tends to be close to line (Figure 5h–l). is lower than during the evening rush hour, and point tends to be below line . On weekends, point tends to be near line (Figure 5m,n).
To further quantify the rebalancing on grid , we first calculate the distance from to line according to formula (1). Then, according to the steps in Section 2.2, we coarse-grained and identified the types of rebalancing on grids during the rush hour of weekdays (Figure 6).
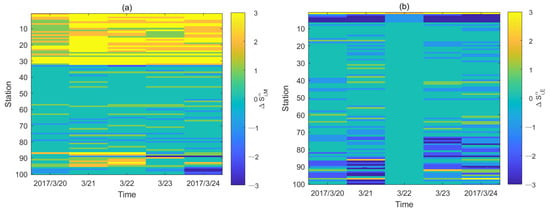
Figure 6.
Distribution of rebalancing types: (a) morning rush hour; (b) evening rush hour.
During morning rush hour, there are 33 grids with serious rebalancing and clear cycling direction, including 32 grids and 1 grid . There are 53 grids with weak rebalancing and 14 grids with sharp fluctuations in rebalancing and travel direction changing with working days. During evening rush hour, there are only six grids with serious rebalancing and clear cycling direction, including 1 grid and 5 grids . There are 66 grids with weak rebalancing and 28 grids with sharp fluctuations in rebalancing and changing cycling direction with working days.
The proportion of grids (, ) with weak rebalancing during rush hour is high, accounting for 53% and 66% of the morning and evening rush hour. The proportion of the grids with serious rebalancing is different. During the morning rush hour, the proportion of grids is the largest, followed by grids , and the proportion of grids is the smallest, accounting for 68.1%, 29.8% and 2.1%, respectively. During the evening rush hour, the proportion of grids is the largest, followed by grids , and the proportion of grids is the smallest, accounting for 82.4%, 14.7% and 2.9%, respectively. Therefore, grids , with less rebalancing are dominant in the grids (Figure 6).
According to Formulas (6) and (7), we get the transformation relationship between different types of grids (Figure 7).
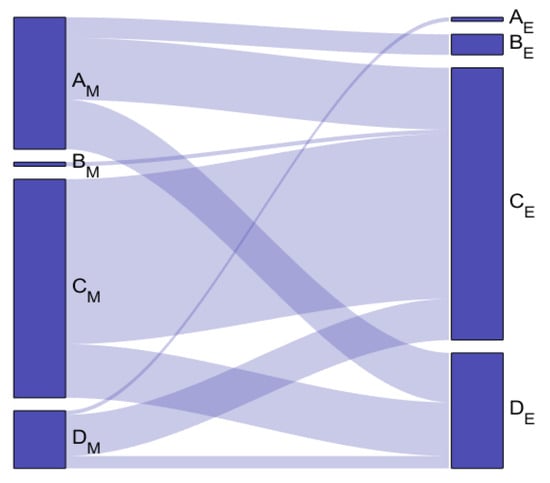
Figure 7.
Transformation relationship between different types of grids.
The grids tend to be grids or grids . Grids belong to grids during morning rush hour. There are only 5 grids with clearly commuting behavior (morning rush hour travel, evening rush hour return), accounting for only 5% of the total grid (Figure 7). A total of 75.5% of grids are converted to grids , and others are converted to grids . The grids are mainly grids and grids during morning rush hour. A total of 76.9% of grids are converted to grids , 21.4% remain unchanged and others are converted to grids . A total of 46.4% of grids are grids , 42.9% of grids and others are grids during morning rush hour.
To sum up, we find that the rebalancing of the free-floating bike-sharing system has the following two characteristics: (1) The rebalancing on the grids is positively correlated with the frequency of the travel behaviors. (2) The static rebalancing is weak and the dynamic rebalancing during rush hours is serious. Therefore, the rebalancing can be alleviated by increasing the number of shared bikes at parking grids. At the same time, we find that the commute behavior is not the main factor that constitutes the rebalancing demand because the grids only constitute 5% of the grids .
4. Conclusions and Expectation
This paper presents a new method to analyze the rebalancing of the free-floating bike-sharing systems from a visual perspective. Firstly, based on the frequency of borrowing and returning records on the grid, we construct a visual method and analyze the spatial and temporal distribution of the rebalancing. Then, we establish a coarse-grained method for the first time to analyze the dynamic rebalancing during rush hour and obtain the transformation rules between different types.
Based on the real-time cycling data of Nanjing Mobike Sharing-bike Company, we completed the empirical analysis. The results show that the static rebalancing on the grids is weak and the dynamic rebalancing during rush hour is serious. Therefore, we can alleviate the rebalancing by increasing the number of shared bikes on the parking grids (i.e., the rebalancing can be alleviated by the location-allocation model).
At the same time, we find that the commute behavior of going out during the morning rush hour and returning to home during the evening rush hour is not the main factor that constitutes the demand for rebalancing on the grid, though the rebalancing demand is proportional to the frequency of travel behavior. It reminds us to analyze the cycling behavior from a new perspective. Subsequent papers will present more results.
Author Contributions
W.Z. designed and completed the experiments, and then wrote the manuscript. L.T. guided and enriched the whole research. G.Z. and X.N. participated in the discussion and provided some advice. W.Z., X.N. and G.Z. completed the English revision of the manuscript. All authors have read and agreed to the published version of the manuscript.
Funding
This work was supported by the following foundations: The National Natural Science Foundation of China (71690242, 71503132, 51876081, 12101268), Jiangsu Higher Education Institution of China (No. 21KJB110026) and Wuxi University Research Start-up Fund for Introduced Talents.
Institutional Review Board Statement
Not applicable.
Informed Consent Statement
Not applicable.
Data Availability Statement
The data presented in this study are available on request from the corresponding author. The data are not publicly available due to privacy.
Conflicts of Interest
The authors declare no conflict of interest.
References
- Luo, H.; Kou, Z.Y.; Zhao, F.; Cai, H. Comparative life cycle assessment of station-based and dock-less bike sharing systems. Resour. Conserv. Recycl. 2019, 146, 180–189. [Google Scholar] [CrossRef]
- Buehler, R.; Hamre, A. Economic Benefits of Capital Bikeshare: A Focus on Users and Businesses; Mid-Atlantic Universities Transportation Center: University Park, PA, USA, 2014. [Google Scholar]
- Si, H.Y.; Shi, J.G.; Wu, G.D.; Chen, J.D.; Zhao, X.B. Mapping the bike sharing research published from 2010 to 2018: A scientometric review. J. Clean. Prod. 2019, 213, 415–427. [Google Scholar] [CrossRef]
- Liu, A.; Ji, X.; Xu, L.; Lu, H. Research on the recycling of sharing bikes based on time dynamics series, individual regrets and group efficiency. J. Clean. Prod. 2018, 208, 666–687. [Google Scholar] [CrossRef]
- Ji, Y.J.; Ma, X.W.; He, M.J.; Jin, Y.C.; Yuan, Y.F. Comparison of usage regularity and its determinants between docked and dockless bike-sharing systems: A case study in Nanjing, China. J. Clean. Prod. 2020, 255, 120110. [Google Scholar] [CrossRef]
- Zhang, Y.; Mi, Z. Environmental benefits of bike sharing: A big data-based analysis. Appl. Energy 2018, 220, 296–301. [Google Scholar] [CrossRef]
- Cai, S.; Long, X.; Li, L.; Liang, H.; Wang, Q.; Ding, X. Determinants of intention and behavior of low carbon commuting through bicycle-sharing in China. J. Clean. Prod. 2019, 212, 602–609. [Google Scholar] [CrossRef]
- Wang, M.; Zhou, X. Bike-sharing systems and congestion: Evidence from US cities. J. Transp. Geogr. 2017, 65, 147–154. [Google Scholar] [CrossRef]
- Li, W.; Kamargianni, M. Providing quantified evidence to policy makers for promoting bike-sharing in heavily air-polluted cities: A mode choice model and policy simulation for Taiyuan-China. Transp. Res. Part A 2018, 111, 277–291. [Google Scholar] [CrossRef]
- Alliance for Biking & Walking. Walking, Bicycling and Walking in the United States: 2010 Benchmarking Report; Alliance for Biking & Walking: Washington, DC, USA, 2016. [Google Scholar]
- Pal, A.; Zhang, Y.; Kwon, C. Analyzing mobility patterns and imbalance of free floating bike sharing systems. Transp. Res. Part C. 2017, 80, 92–116. [Google Scholar] [CrossRef]
- Tian, Z.P.; Wang, J.Q.; Wang, J.; Zhang, H.Y. A multi-phase QFD-based hybrid fuzzy MCDM approach for performance evaluation: A case of smart bikesharing programs in Changsha. J. Clean. Prod. 2018, 171, 1068–1083. [Google Scholar] [CrossRef]
- Zhang, Y.; Lin, D.; Mi, Z. Electric fence planning for dockless bike-sharing services. J. Clean. Prod. 2019, 206, 383–393. [Google Scholar] [CrossRef]
- Du, Y.C.; Deng, F.W.; Liao, F.X. A model framework for discovering the spatio-temporal usage patterns of public free-floating bike-sharing system. Transport. Res. C 2019, 103, 39–55. [Google Scholar] [CrossRef]
- Mooney, S.J.; Hosford, K.; Howe, B.; Yan, A.; Winters, M.; Bassok, A.; Hirsch, J.A. Freedom from the station: Spatial equity in access to dockless bike share. J. Transp. Geogr. 2019, 74, 91–96. [Google Scholar] [CrossRef] [PubMed]
- Legros, B. Dynamic repositioning strategy in a bike-sharing system; how to prioritize and how to rebalance a bike station. Eur. J. Oper. Res. 2019, 272, 740–753. [Google Scholar] [CrossRef]
- Caggiani, L.; Ottomanelli, M. A dynamic simulation based model for optimal fleet repositioning in bike-sharing systems. Procedia-Soc. Behav. Sci. 2013, 87, 203–210. [Google Scholar] [CrossRef]
- Chiariotti, F.; Pielli, C.; Zanella, A.; Zorzi, M. A dynamic approach to rebalancing bike-sharing systems. Sensors 2018, 18, 512. [Google Scholar] [CrossRef]
- Caggiani, L.; Camporeale, R.; Ottomanelli, M.; Szeto, W.Y. A modeling framework for the dynamic management of free-floating bike-sharing systems. Transp. Res. C Emerg. Technol. 2018, 87, 159–182. [Google Scholar] [CrossRef]
- Shui, C.S.; Szeto, W.Y. Dynamic green bike repositioning problem–A hybrid rolling horizon artificial bee colony algorithm approach. Transp. Res. Part D Transport Environ. 2018, 60, 119–136. [Google Scholar] [CrossRef]
- Xu, C.C.; Ji, J.Y.; Liu, P. The station-free sharing bike demand forecasting with a deep learning approach and large-scale datasets. Transp. Res. Part C Emerg. Technol. 2018, 95, 47–60. [Google Scholar] [CrossRef]
- Liu, Y.; Szeto, W.Y.; Ho, S.C. A static free-floating bike repositioning problem with multiple heterogeneous vehicles, multiple depots, and multiple visits. Transp. Res. Part C: Emerg. Technol. 2018, 92, 208–242. [Google Scholar] [CrossRef]
- Zhang, W.B.; Tian, Z.H.; Tian, L.X.; Wang, D.Z. A Two-Stage Location and Allocation Framework of Dockless Bike-Sharing System. IEEE Intell. Transp. Syst. Mag. 2022. [Google Scholar] [CrossRef]
- Zhang, J.; Meng, M.; Wang, D.Z.; Du, B. Allocation strategies in a dockless bike sharing system: A community structure-based approach. Int. J. Sustain. Transp. 2022, 16, 95–104. [Google Scholar] [CrossRef]
Publisher’s Note: MDPI stays neutral with regard to jurisdictional claims in published maps and institutional affiliations. |
© 2022 by the authors. Licensee MDPI, Basel, Switzerland. This article is an open access article distributed under the terms and conditions of the Creative Commons Attribution (CC BY) license (https://creativecommons.org/licenses/by/4.0/).