Article

Application of Geospatial Techniques in Evaluating Spatial Variability of Commercially Harvested Mangoes in Bangladesh

by
Md Moniruzzaman
1,*,
Md. Sorof Uddin
2,
Md. Abdullah Elias Akhter
3,
Akshar Tripathi
4 and
Khan Rubayet Rahaman
1
1
Department of Geography and Environmental Studies & Wicked Problems Lab, Saint Mary’s University, 923 Robie Street, Halifax, NS B3H 3C3, Canada
2
Pomology Division, Horticulture Research Centre, Bangladesh Agricultural Research Institute, Gazipur 1701, Bangladesh
3
Department of Physics, Khulna University of Engineering & Technology (KUET), Khulna 9203, Bangladesh
4
National Center for Geodesy (NCG), Indian Institute of Technology (IIT) Kanpur, Kanpur 208016, Uttar Pradesh, India
*
Author to whom correspondence should be addressed.
Sustainability 2022, 14(20), 13495; https://doi.org/10.3390/su142013495
Submission received: 6 September 2022 / Revised: 12 October 2022 / Accepted: 15 October 2022 / Published: 19 October 2022
(This article belongs to the Special Issue Dynamics of Heat Spots and Sustainable Agriculture)

Abstract

:
Mango is widely known as a popular fruit in South Asia, including Bangladesh. The country is a significant producer of different local and exotic varieties of mangoes in different geographic locations. Therefore, a study of fruit maturity at diverse locations and climatic conditions becomes critical for a sustainable mango production. In responding to this need, this study evaluates the variability of a few selected commercial mango (Mangifera indica L.) varieties and their maturity timeline with respect to spatial extent (longitudinal-latitudinal variations), elevation profile, and time. Remote sensing technology has been widely used for horticultural applications to study fruit phenology, maturity, harvesting time, and for mapping locational differences. In doing so, we have employed remotely sensed data, such as the Shuttle Radar Topography Mission (SRTM) digital elevation model (DEM) of 30 m spatial resolution, GPM IMERGM precipitation datasets (0.1 × 0.1 degree), NASA GLDAS (Global Land Data Assimilation System) surface skin temperature (0.25 × 0.25 degree), and Noah Land Surface Model L4 3-hourly soil moisture content datasets (0.25 × 0.25 degree). Alongside these, an intensive field data collection campaign has been carried out for 2019 and 2020. It was found that 1° locational variations may result in approximately 2–5 days delay of mango harvesting. The outcome of this study may enhance the appropriate planning of harvesting, production, and the commercialization of mango selection in specific geographic setting for a sustainable harvest and production system in the country.

1. Introduction

Mangoes are consumed in several countries as a tropical fruit for their unique tastes, aroma, and nutritional values [1]. The fruit is very popular and produced in approximately 100 countries worldwide, mostly in tropical climates [2,3]. In 2009 alone, 35 million metric tons of mangoes have been produced worldwide, which shows the importance and popularity of the fruit globally [4]. Asia (e.g., India, Thailand, and Bangladesh) contributes approximately 77% of the global share of mango production, the Americas (e.g., Mexico, Brazil, and Chile), and Africa (e.g., Egypt, Nigeria, and Sudan) follow with approximately 13% and 9%, respectively [2,5]. It is worthwhile to note that 3–4% of world production is usually traded internationally, and the rest of the share is traded and consumed within the countries of production [3]. Additionally, the processed mango industries are increasing their share for producing mango juice, pickles, pulps, dry mangoes, slices in brine, and mango flowers [6,7,8]. Major importers of mangoes and mango products are included but not limited to the United Arab Emirates (UAE), the Kingdom of Saudi Arabia (KSA), Kuwait, the United States of America (USA), the United Kingdom (UK), The Netherlands, and Canada [2]. The production methods of growing mangoes are lower input intensive in comparison to similar food grain and fruits (e.g., guava, banana, orange, etc.). Thus, it requires fewer resources and less investments in generating more profits for resource-poor farmers, who are generating considerable income and creating employment opportunities for both male and female populations, especially in rural areas through cultivation, processing, and marketing [9]. However, the fruit is perishable in nature and requires a strategic management plan ahead of time to save the taste and color of the mangoes. Markets in several countries rely heavily on the mangoes’ physical properties (i.e., appeal of color, shape, and intact skin) when available on shelves. Interestingly, the taste remains of secondary importance for the sale of fresh mangoes in most cases. Red-skinned cultivars have been a popular product in most of cases, however, yellow-skinned cultivars are now increasingly receiving popularity on the virtue of their yellow skin color and appeal [10]. Furthermore, the size of mangoes is receiving more attention these days from consumers, with an approximate weight of 200–300 g [1,6,11,12]. As a result, it is critical for multiple stakeholders associated with mango production, packaging, transportation, marketing, appropriate ripening strategies, and storing facilities, to understand the critical phases of safeguarding products of different varieties. Additionally, it is necessary to understand the appropriate time of harvesting mangoes, depending on the climate and geographic setting.
Mangoes are considered a popular commercial fruit in Bangladesh. Moreover, the required types of soil and appropriate climate for producing mangoes provide immense potential to grow this fruit in almost every region of the country. In terms of mango production among tropical fruits grown in the world and area occupied by mango fruits, among the other fruits grown within the country, in both cases Bangladesh ranked third (3rd) [10,13]. Bangladesh produced around 1.22 million tons of mango in approximately 95,283 ha of land during the period of 2019–2020 [14]. Consequently, mango is the leading seasonal cash crop in the north-western districts of Bangladesh (e.g., Rajshahi, and Chapainawabganj in particular), and dominates the economy for seasonal jobs during the harvesting periods, engaging approximately 85% of people in mango-related jobs [15]. More than 500 different varieties of sweet edible mangoes are found in Bangladesh, and the most common local names are given in Table 1 [15,16,17]. Interestingly, the north-western part of the country is very popular for producing diverse varieties of mangoes due to suitable weather and soil composition. Additionally, farming and producing mangoes is becoming more popular in the south-eastern region of the country, which includes the mountainous landscapes of the country (e.g., Khagrachori and Bandarban) [18]. In the last few years, the climatic anomalies (e.g., sudden rise in the temperature, abrupt rainfall, and inconsistent humidity) during fruit development phases have been critically felt in the mango gardens. It does not only affect the external appearance of the fruit, but also aggravates pests, such as mealy bugs, and physiological disorders like spongy tissue, which further add to the loss of price and harvests [19]. The affected fruits return poor prices in the market, and such fruits are also rejected for processing. This causes serious economic loss to mango growers, the majority of whom are marginal farmers. Moreover, the unprecedented change of climate triggers the loss of production, along with fluctuating the ripening times. The situation generates loss to the farmers, investors, and exporters in the market, who must seek better management techniques so that the economic losses can be navigated. As a result, it is necessary to map climatic considerations to address ripening issues associated with mango production and assess the maturity and growth of the fruits in Bangladesh, to help marginal farmers avoid economic losses.
Contemporary scientific approaches have considered several methods and approaches to assess the growth and maturity of mangoes in different geographic setting across the world. Consequently, because of the importance of the fruit in developing countries, studies have been conducted to understand the ripening issues associated with storing and packaging problems. The wide body of literature mostly has adopted the following scientific methods to analyze location, maturity, appropriate time harvesting, and the growth of mangoes:
  • Several literatures have suggested that the ripening and maturity of the product (i.e., mangoes) are heavily depending on climatic conditions, air temperature, and the appropriate time of harvesting [3,16,19,20,21]. These studies have collected samples from different geographic locations and have found that the air temperature influences the early growth and maturity of mangoes and may require attention for early harvesting and packaging.
  • Other studies have considered that the production of mangoes depends on genetic improvements and plant physiology [10], cultivation techniques [11,12], the post-harvest management of the land surface [10,12,19], and disease and pest control mechanisms [8,11,15,22]. These studies have collected samples from the field and completed statistical modeling in order to demonstrate the difference of variables responsible for contributing a good or poor crop in certain times.
  • Few studies have performed the physiographical characteristics of mangoes to understand tastes, skin colors, and the pesticides used during the growth of the products in field [4,8]. The researchers in this study have collected mangoes from the field and tested the chemical composition in a laboratory to demonstrate variables responsible for skin color, smell, and post-harvest storing issues upon analyzing variances (i.e., statistical measures) of the collected samples in different locations.
  • Some studies have demonstrated the complex relationships among location, climate, the sweetness of the fruits, and its diversity, by employing statistical models and geographical information techniques to map locational variations [5,6,23,24]. These studies have primarily collected samples from the field and included them in the GIS software to map suitable locations for growing mangoes in the face of climate change. Many of these studies have employed visible to near infrared (NIR) bands in spectrophotometric measurements and partial least square regressions to summarize the obtained data.
  • Interestingly, few studies have included climate change and the adaptation of mango farming with different varieties and species in tropical countries across the globe [24,25,26]. These studies have identified that rainfall and temperature are critical climatic variables to influence the production and quality of mangoes. These scientific researches have generated models based on station-based climatic data (i.e., rainfall, temperature, and humidity) available at lower spatial resolution, mostly in tropical areas.
  • In some other studies, researchers have set up marketing strategies and policy directions depending on the harvesting time of mangoes from the field to the nearest available markets, considering temporal approaches [9,19,27,28,29,30]. These studies have included primary sources of information collected from the fields and statistical agreements between variables, to summarize the time scale of marketing strategies to safeguard marginal farmers.
  • With the advancement of satellite remote sensing (RS) and geographical information systems (GIS), several studies have included air-borne satellite data to map the suitable locations of mango gardens, mostly in Asia (e.g., India, Philippines, Thailand, etc.) depending on climatic variables [6,10,29,31]. These studies have summarized non-differential vegetation indices (NDVI) information obtained from Indian Remote Sensing (IRS), Unmanned Aerial Vehicle (UAV) data, and light detection and ranging (LiDAR) information, to demonstrate the suitable locations which are free of pesticides, have adequate rainfall, appropriate elevation, and can tolerable surface temperature, to produce the highest possible number of fruits in a given time frame.
However, recently published scientific approaches have barely considered an enhanced method of employing satellite remote sensing data, elevation data, statistical models, and observed field investigation in a single platform, to demonstrate the appropriate time for harvesting mangoes in varied geographical setting in Bangladesh. Thus, the study utilizes satellite-derived data on specific parameters namely DEM, temperature, precipitation, and soil moisture, along with ground reference information, to demonstrate an appropriate harvesting time for mangoes. Consequently, the study explores the reasons behind the maturity periods of the same varieties of mango species across different geographical settings in Bangladesh, and identifies the responsible factors of such differences using remote sensing data.
Table 1. Some common varieties of mangoes widely cultivated in Bangladesh.
S. No.Local NameGenotypeScientific NamePictureRef.
1KhirsapatKhirsapatMangifera indica L.Sustainability 14 13495 i001[32]
2LangraLangraMangifera indica L.Sustainability 14 13495 i002[32]
3FazliFazliMangifera indica L.Sustainability 14 13495 i003[32]
4LaxmanbhogBARI Mango-2Mangifera indica L.Sustainability 14 13495 i004[32]
5AmropaliBARI Mango-3Mangifera indica L.Sustainability 14 13495 i005[33]
6BARI Aam-4BARI Mango-4Mangifera indica L.Sustainability 14 13495 i006[32]
7HarivangaHarivangaMangifera indica L.Sustainability 14 13495 i007[34]
8AshwinaAshwinaMangifera indica L.Sustainability 14 13495 i008[34]
9BARI Aam-7BARI Mango-7Mangifera indica L.Sustainability 14 13495 i009[32]
10GourmotiBARI Mango-12Mangifera indica L.Sustainability 14 13495 i010[34]
11SurjopuriSurjopuriMangifera indica L.Sustainability 14 13495 i011[34]
12GopalbhogGopalbhogMangifera indica L.Sustainability 14 13495 i012[34]
13MohanandaBARI Aam-1Mangifera indica L.Sustainability 14 13495 i013[32]

2. Materials and Methods
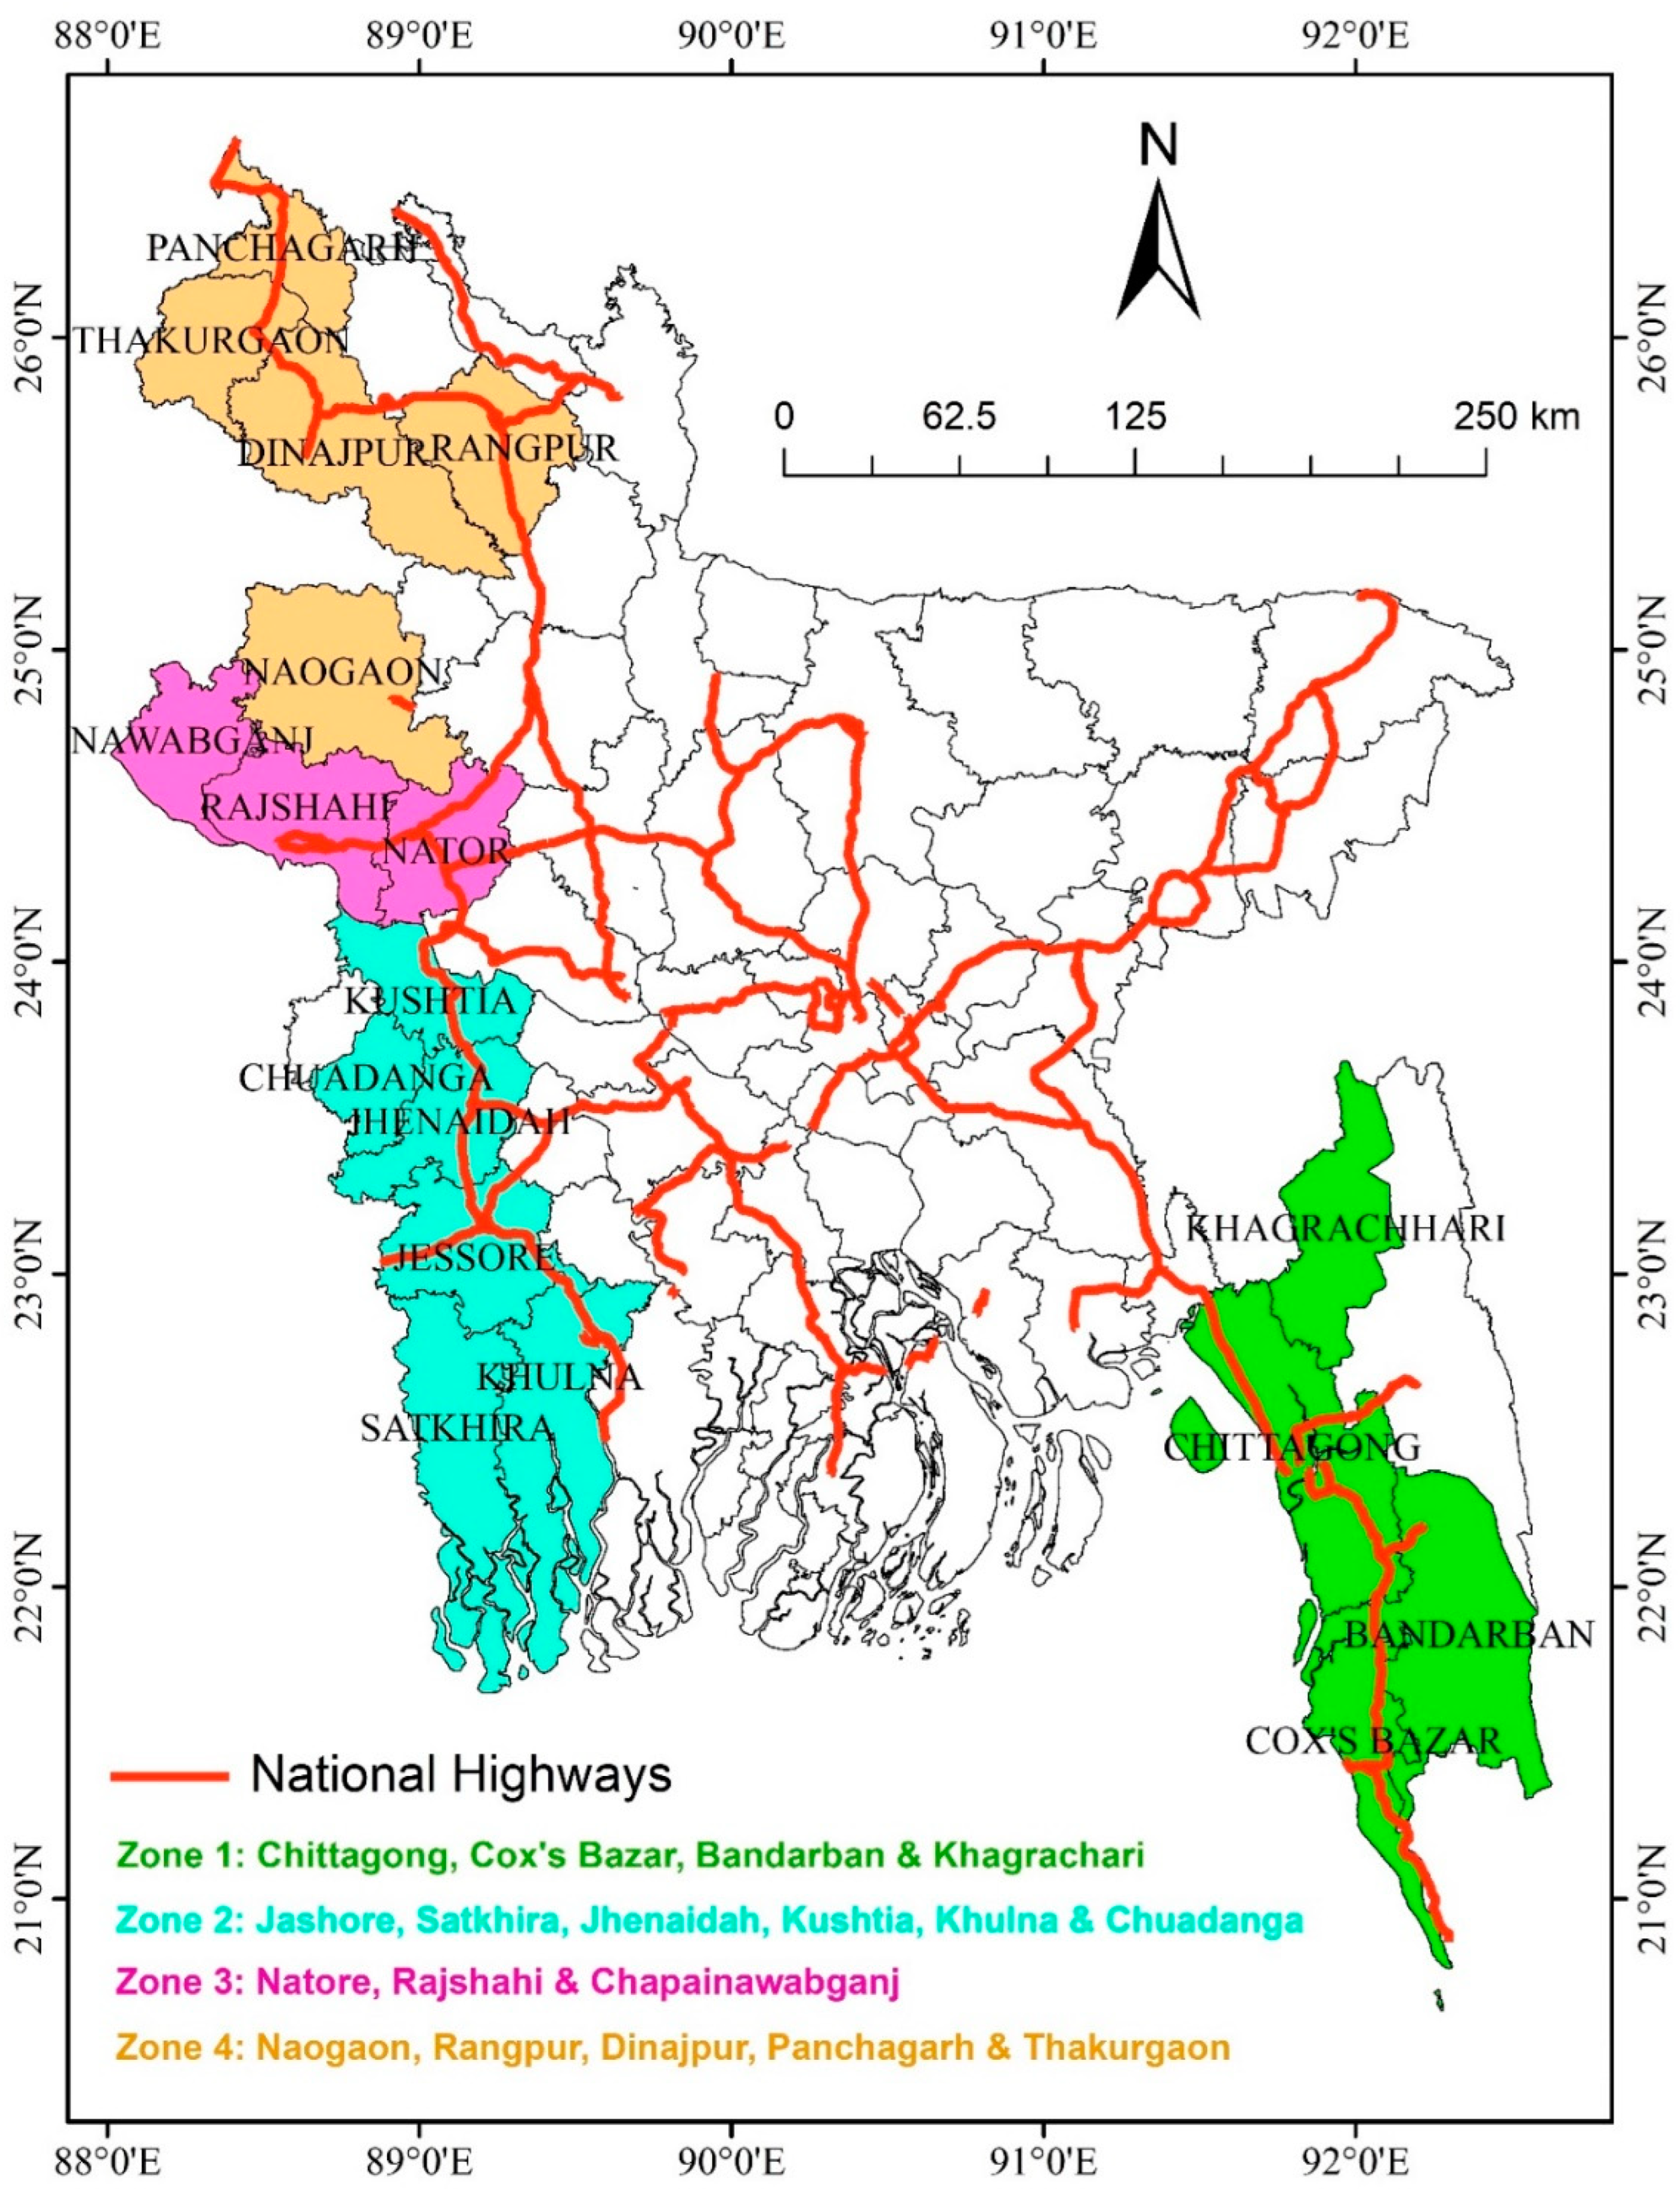
2.1. Study Area

Bangladesh is a densely populated and rapidly growing country with a population of 166,303,498 (according to the last UN estimation on 1 July 2021) [35]. The country has eight administrative divisions and furthermore is subdivided into 64 districts, with predominantly rich fertile flat mainland [36]. Bangladesh has a humid, warm climate that is influenced by pre-monsoon, monsoon, and post-monsoonal circulations, with average temperatures varying between 15–34 °C, which is ideal for growing mangoes. The rich alluvium brought by the mighty rivers of Bangladesh also adds to the fertility of the soil [37]. Initially, we have considered the whole country to understand the harvesting seasons of mangoes, however, it is noted that four regions are typically the major producers of mangoes, as seen in Figure 1. The zones are classified further depending on the varieties of mangoes produced in the districts specified as:
Zone 1: Chittagong, Coxes Bazar, Bandarban, and Khagrachari (available common mango varieties are: BARI Aam-3, BARI Aam-4, BARI Aam-8).
Zone 2: Jashore, Satkhira, Jhenaidah, Kushtia, Khulna, and Chuadanga (available common mango varieties are: Gobindobhog, Himsagor, Langra, BARI Aam-3, Fazli, BARI Aam-4).
Zone 3: Natore, Rajshahi, and Chapainawabganj (available common mango varieties are: Gopalbhog, Langra, Khirsapat, Fazli, BARI Aam-1, BARI Aam-2, BARI Aam-3, BARI Aam-4, BARI Aam-7, BARI Aam-12, Ashwina, Bombay).
Zone 4: Naogaon, Rangpur, Dinajpur, Panchagarh, and Thakurgaon (available common mango varieties are: BARI Aam-3, BARI Aam-4, Fazli, Ashwina, Harivanga, Surjopuri, Nac Fazli).

2.1.1. Physiography

Bangladesh is a riverain country and geographically flat plain area. The elevation of the country is mostly under 12 m sea level [38]. Up until the British colonial period, the country has had 20% forest cover [39], however, FAO 2009 has estimated actual forest cover at 6% [40]. The country’s haor wetlands are of significance to global environmental science and the areas are surrounded in the north-eastern region [41]. The country has achieved a Forest Landscape Integrity Index mean score of 5.45/10 in 2018 and ranked 101st globally out of 172 countries (Grantham et al., 2020). The north-western region is a drought prone Barind Tract area with different geographic settings [42]. The southern sea coast areas are the lowest land of Bangladesh, which are under various disaster risks [43]. Cyclones, tsunamis, storm surges, etc. occur almost every year, however, the area is fertile and prominent in agricultural productions [44].

2.1.2. Climate

Bangladesh is located in the sub-tropical monsoon climate regime. Based on the analysis of rainfall and temperature, the climate of this country can be described under the following four seasons (Ayesha et al., 2016): (i) winter or northeast monsoon (December–February); (ii) summer or pre-monsoon (March–May); (iii) southwest monsoon (June–September); and (iv) autumn or post-monsoon (October–November), as described by the Köppen climate classification (Rudolf 1954 and Rubel and Kottek 2011). The northeast region of Bangladesh receives relatively high rainfall compared to the southeast [45]. The country receives around 2000 mm rainfall annually, and the majority of the rain (more than 80%) occurs during the monsoon (Rahman et al., 2017). As a result, the monsoon season looks wet, while winter is mostly dry. The highest temperature of Bangladesh from 1958–2017 has been found to be 33 °C during the pre-monsoon season; and during the winter, monsoon, and post-monsoon, the temperatures are recorded as 26 °C, 32 °C, and 30 °C, respectively [46]. Additionally, the highest temperature is observed in the southern coastal region and gradually decreases towards the north. Furthermore, the lowest temperature is observed in the Rajshahi district, especially during the winter months [46]. In this study, climate data used for year 2019 and 2020.

2.1.3. Soil

The Soil Resources Development Institute (SRDI) in Bangladesh has identified 500 soil series [47], and to simplify the large number of technical soil group further, they have sub-divided this into 20 general types, along with seven tracts throughout the 30 agro-ecological zones (Table 2) [48]. Islam et al., 2017, found 12 different types of soil texture in Bangladesh in his study and denoted that silt, sandy, and loamy sand soils, are found in parts of Chittagong, Cox’s Bazar, Rangamati, Khagracharia, and the Bandarban districts (Zone 1); clay, clay loam, and silty clay soils, are found in some parts of Jessore, Kustia, Satkhira, and Khulna (Zone 2); terrace soils are found in Rajshahi and Chapainwabganj (Zone 3); and sandy clay loam soils are located in some parts of Panchagarh, Thakurgaogh, and the Dinajpur districts (Zone 4) [48].

2.2. Methodology

The methodology of this study is divided into three major parts, which are as follows: (i) collecting the satellite-borne remote sensing data of selected parameters (e.g., DEM, temperature, precipitation, and soil moisture), processing, and performing analysis; (ii) obtaining ground reference data along with geo-tag photo and executing processing, and analysis; and (iii) establishing the relationships among the selected parameters The detailed information of data used in the study is provided in Table 3. In addition, a methodological flowchart is also presented in Figure 2.

2.2.1. Field Data Collection

The ground reference data was collected using a smart phone SAMSUNG Galaxy M20 throughout the selected zones during the season 2019 and 2020 from the month of January to August in sunny and clear sky conditions (approximately in-between morning 10.00 a.m. to 4.00 p.m.). A total of 239 representative geo-tag field-photos were captured for future reference, enabling the Global Positioning System (GPS) of the afore-mentioned smart phone (Figure 3). The harvesting date was collected from different districts as mentioned in Figure 1 and further organized into appropriate zones to simplify data presentation. The field data collection has been briefly illustrated in Figure 3.

2.2.2. Mango Harvesting

Mango harvesting starts when it becomes mature enough and is considered as ripe. Additionally, ripening can be identified by various parameters (e.g., aroma, color, texture, size, and association). In addition, specific gravity found 1.01–1.02 [53] during maturity, also the shoulder color changes to light green or yellowish, and the color of the pulp changes from white to yellow. The latex which comes out from pedicel is found to be more concentrated and dried quickly. In some cases, one or two mature fruits have fallen under the tree, which have bird eating symptoms. Moreover, if any of the afore-mentioned symptoms are found, the harvesting of the mangoes starts, in any of the location.

2.2.3. Commercial Mango Varieties

There are more than 500 types of mangoes, which are grown in Bangladesh in different regions identified in the study area [15]. Among them, seven commercially successful varieties have been chosen for this study are: Khirsapat, Langra, Fazli, BARI Aam-2, BARI Aam-3, BARI Aam-4, and Harivanga (Table 1). Note that the prominent areas of mango production in Bangladesh are Rajshahi, Chapainawabganj, Jashore, Satkhira, Chuadanga, Chittagong, Naogaon, Dinajpur, and areas nearby.

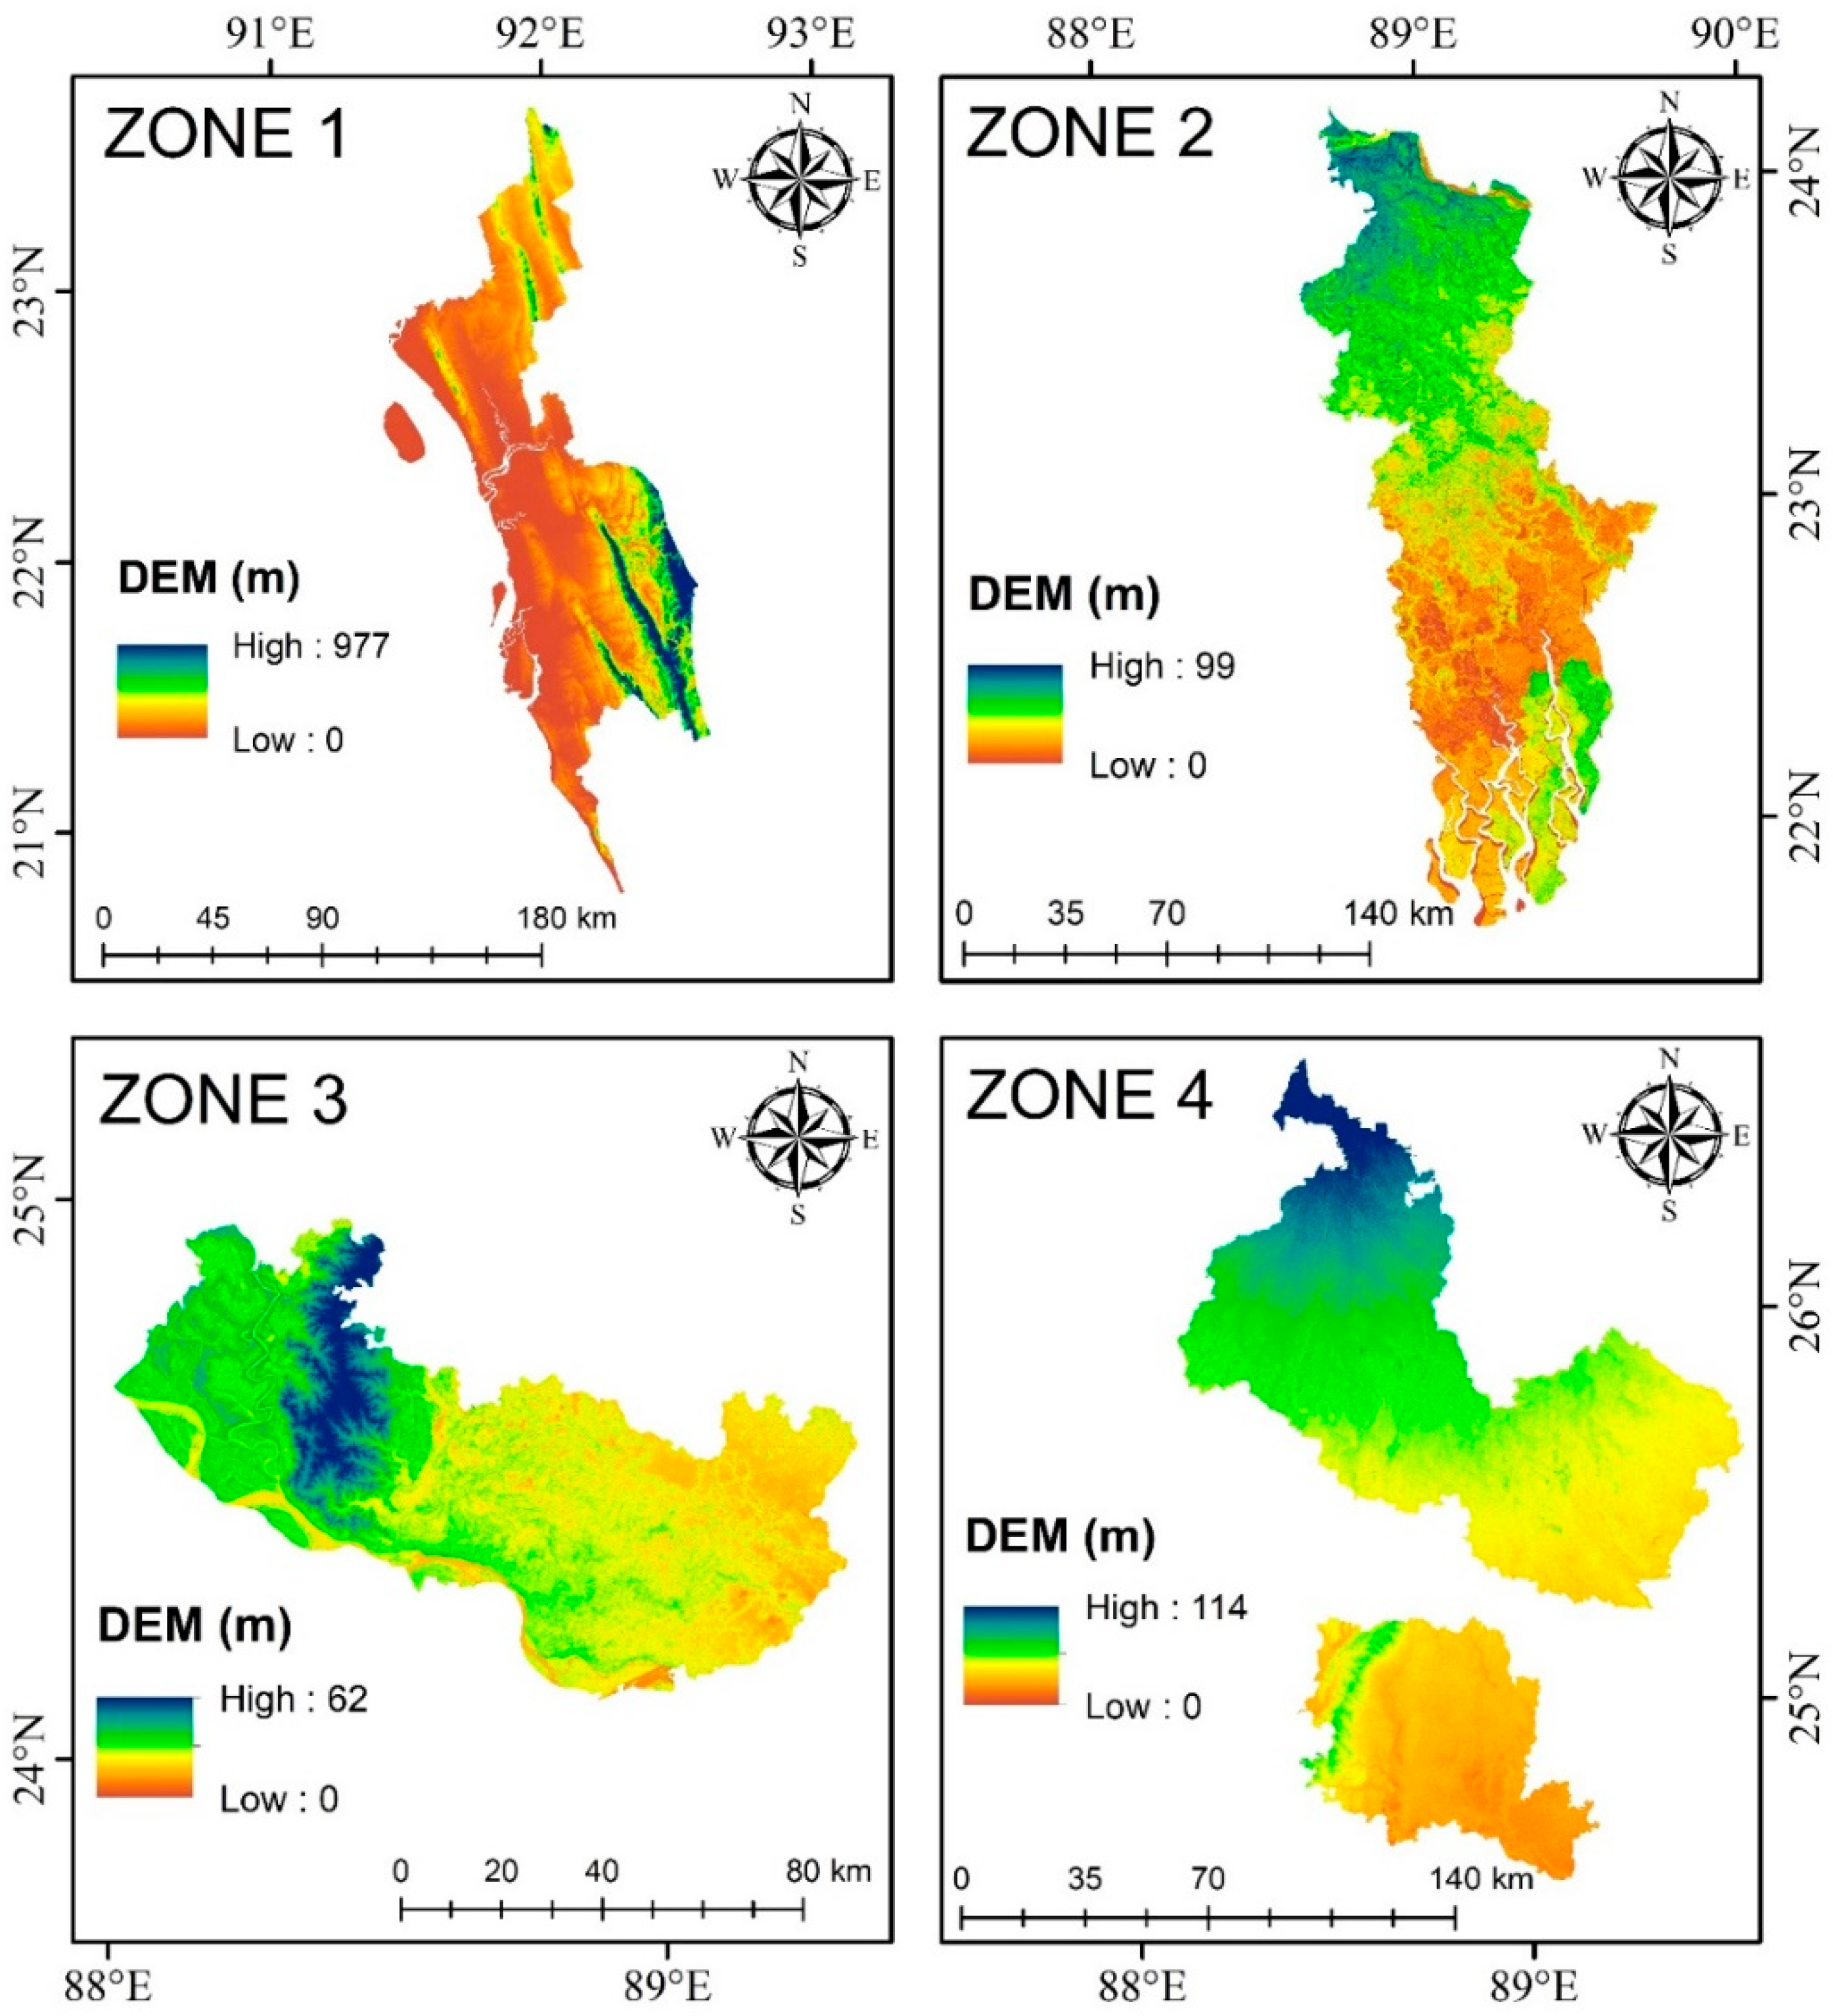
2.2.4. Digital Elevation Model (DEM)

The elevation of a geographic location is considered as an important factor for the growth of mangoes. As per general perception, mangoes grow well in warm and humid climatic regions. Furthermore, the areas of higher elevation with relatively lower temperature influence the growth of the fruit. However, this is not always the case since the rate of photosynthesis and nutrients’ distribution also varies with elevation. The areas of higher elevations receive more direct incident solar radiation that accelerates the rate of photosynthesis. Apart from this, the rate of growth varies from one variety of mango to another in different elevated geographies. Some varieties thrive well on higher elevations as compared to others. As a result, DEM becomes an important parameter of this study to understand the influence of elevated lands to determine mango growth and maturity. The National Aeronautics and Space Administration (NASA), Jet Propulsion Laboratory (JPL), provides Shuttle Radar Topography Mission (SRTM) V3 product (SRTM Plus) at a spatial resolution of 1 arc-second (approximately 30 m), which has been used in this study [50]. The void-filled datasets are derived from NASA, analyzed employing google earth engine (GEE), and further processed in the GIS platform (i.e., ArcGIS Pro) to prepare the maps.

2.2.5. Precipitation, Earth Surface Skin Temperature, and Soil Moisture Data

The maturity of mango depends a lot on adequate precipitation, and temperature regime. While a warm climate is important, with occasional showers in the early stage, a dry climate is critical in the reproductive and budding stage of growth. In the mature stage, a dry and warm climate is essential to ensure a good harvest. Low, local temperature and rainfall in the reproductive stage causes an adverse impact on growth. This results in the different times of maturity attainment for the same variety of mangoes. Moreover, the requirement of temperature also varies across the varieties of mangoes, but regular warm and dry weather is crucial.
The thickness of mango skin varies across varieties and so does the skin temperature. An adequate warm skin temperature is important for the crop to mature since additional warmth often leads to premature ripening of the fruit. In the scientific documents, highly dry soils are not recommended for a smooth mango crops’ growth. The soil should have an adequate moisture retaining the capacity to supply the required water for the mango trees that is imperative in the fruit development stages. In the maturity stage, soil moisture is not significant. However, it still affects the overall maturity rate of the mango fruit, therefore has been utilized as a parameter in this study.
The NASA and Japan Aerospace Exploration Agency (JAXA) joint cooperation evolved global precipitation measurement (GPM), and had been a global successor to the Tropical Rainfall Measuring Mission (TRMM) [54,55]. The GPM was launched in 2014 and its key advancement over TRMM system had been developed to observe precipitation in tropical and subtropical regions [56]. The sensors included in TRMM were visible and infrared radiometer system (VIRS), microwave imager (TMI), and precipitation radar (PR), that substituted GPM to the first space-borne Ku/Ka-band Dual-frequency Precipitation Radar (DPR), and a multi-channel GPM Microwave Imager (GMI) [57,58]. NASA’s TRMM and GPM measurements were then available as one unified data set. In the latest version of the Integrated Multi-satellite Retrievals for GPM (IMERG), we started to estimate early precipitation information collected in 2000–2014. During the operation of the TRMM satellite, it combined and homogenized data with recent precipitation estimates obtained by GPM satellite. In this study, the daily accumulated precipitation (combined microwave-IR) was estimated considering final run (product code: GPM GPM_3IMERGDF v06) daily (mm) precipitation at 0.1° × 0.1° spatial resolution data. The NASA GLDAS (Global Land Data Assimilation System) average surface skin temperature data (i.e., product code was GLDAS Model GLDAS_CLSM025_DA1_D v2.2, version 2.2), and soil moisture content information (i.e., product code: GLDAS_NOAH025_3H v2.1, version 2.1 of Noah Land Surface Model L4, daily datasets at a spatial resolution of 0.25° × 0.25°) were downloaded from the Giovanni website (https://giovanni.gsfc.nasa.gov/giovanni/ (accessed on: 21 April 2021)) [59]. The temperature data in this case was measured in Kelvin (°K) scale. Note that, the unit of downloaded soil moisture data was demonstrating kg m−2 as the unit of measurement. The datasets were collected from January to July for the years 2019 and 2020 focusing on the mango season. Apart from the satellite remote sensing data, Bangladesh Meteorological Department (BMD) supplied the daily rainfall data (mm) (1991–2020) and S-W Monsoon Onset (2015–2020) available through ground stations in the study area.

3. Results

3.1. Geo-Spatial Variability

The geographical extent of subdivided zones are: Zone 1 is the southeastern region, located in-between 91.3460–92.6280 N to 20.6420–23.6820 E and under Chittagong division; Zone 2 is under Khulna division where the Sundarbans located along with relatively low laying fertile land surrounded in-between 88.6430–89.7590 N to 21.6590–24.2090 E; Zone 3 is the eastern drought prone Barind Tract region located within 88.0110–89.3410 N to 24.1050–24.9670 E; and Zone 4 is mostly under the Rangpur division, close to the mighty Himalaya and located at 88.0870–89.5380 N to 24.5340–26.6340 E (Figure 4). Overall, the four zones are bounded within 88.0110–92.6280 N to 20.6420–26.6340 E, which ensures a wide spatial variability with heterogeneous geo-environmental settings. The elevation profiles of different zones is shown in Figure 4.

3.2. Elevation Profile

The elevation of Bangladesh varies from 0 to 1053 m and most of the hilly terrain is situated in the Chittagong division (Figure 4, Zone 1). Consequently, the zones chosen for the study are heterogeneous in nature. The height altitudes and mean elevation of Zone 1 to Zone 4 are 977 & 83 m; 99 & 8 m; 62 & 20 m; and 114 & 38 m, respectively. The variations of standard deviation are also distinct 114 m, 5 m, 8 m, and 17 m, respectively, from Zone 1 to Zone 4. Additionally, the standard deviation of elevation profile of Bangladesh is 60 m.

3.3. Temperature, Precipitation, and Soil Moisture Variability

The present study has used GLDAS temperature (daily, 0.25° × 0.25° spatial resolution), GPM IMERG precipitation (daily, 0.1° × 0.1°), and GLDAS NOAH soil moisture (daily, 0.25° × 0.25°), data for the year 2019, 2020 (1 January to 31 July) and the results are summarized in Table 4. The statistical parameters of temperature are found to be almost similar in each zone. However, in the whole country, the differences are spotted within 1 °K except for a sudden change in Zone 4 (i.e., decreased range from 3.8 to 2.5 °K). The reported average map of daily accumulated precipitation depicts a significant variation in all zones. A total of 216.4, 124.1, and 65.8 mm, of precipitation have been reported as increased in year 2020 for Zone 4, Zone 2, and Zone 3, respectively, while comparing with 2019. Interestingly, Zone 1 demonstrates little or no change of minimum, maximum, and mean precipitation, however, the other three zones depict an increase of precipitation regime (see Table 4). From the country’s perspective, all the considered parameters in this study have increased in 2020 significantly. In the case of soil moisture, it is found to be relatively similar trend in both 2019 and 2020. The variations in temperature and precipitation of different mango growing zones are mentioned in Table 4.
The harvesting time of the selected mango varieties are presented in Table 5. Note that Khirsapat has been harvested first in comparison to other varieties (i.e., 1 to 20 days gap among 4 zones). The Langra variety has been started to be harvested on 9th of June in Zone 1 and gradually increased harvesting time up to 24th of June (2020) in Zone 4. Other varieties have been following the similar pattern which began in Zone 1 and ended in Zone 4 after a certain gap of 21, 20, 16, and 17 days, for Fazli, BARI Aam-2, BARI Aam-3, BARI Aam-4, and Harivanga, respectively. We have noticed that the average time differences of harvesting periods varied between 42–46 days among the four zones. Consequently, we have found that the BARI Aam-4 variety has been harvested late among all the varieties. Table 5 shows the variety harvesting times.

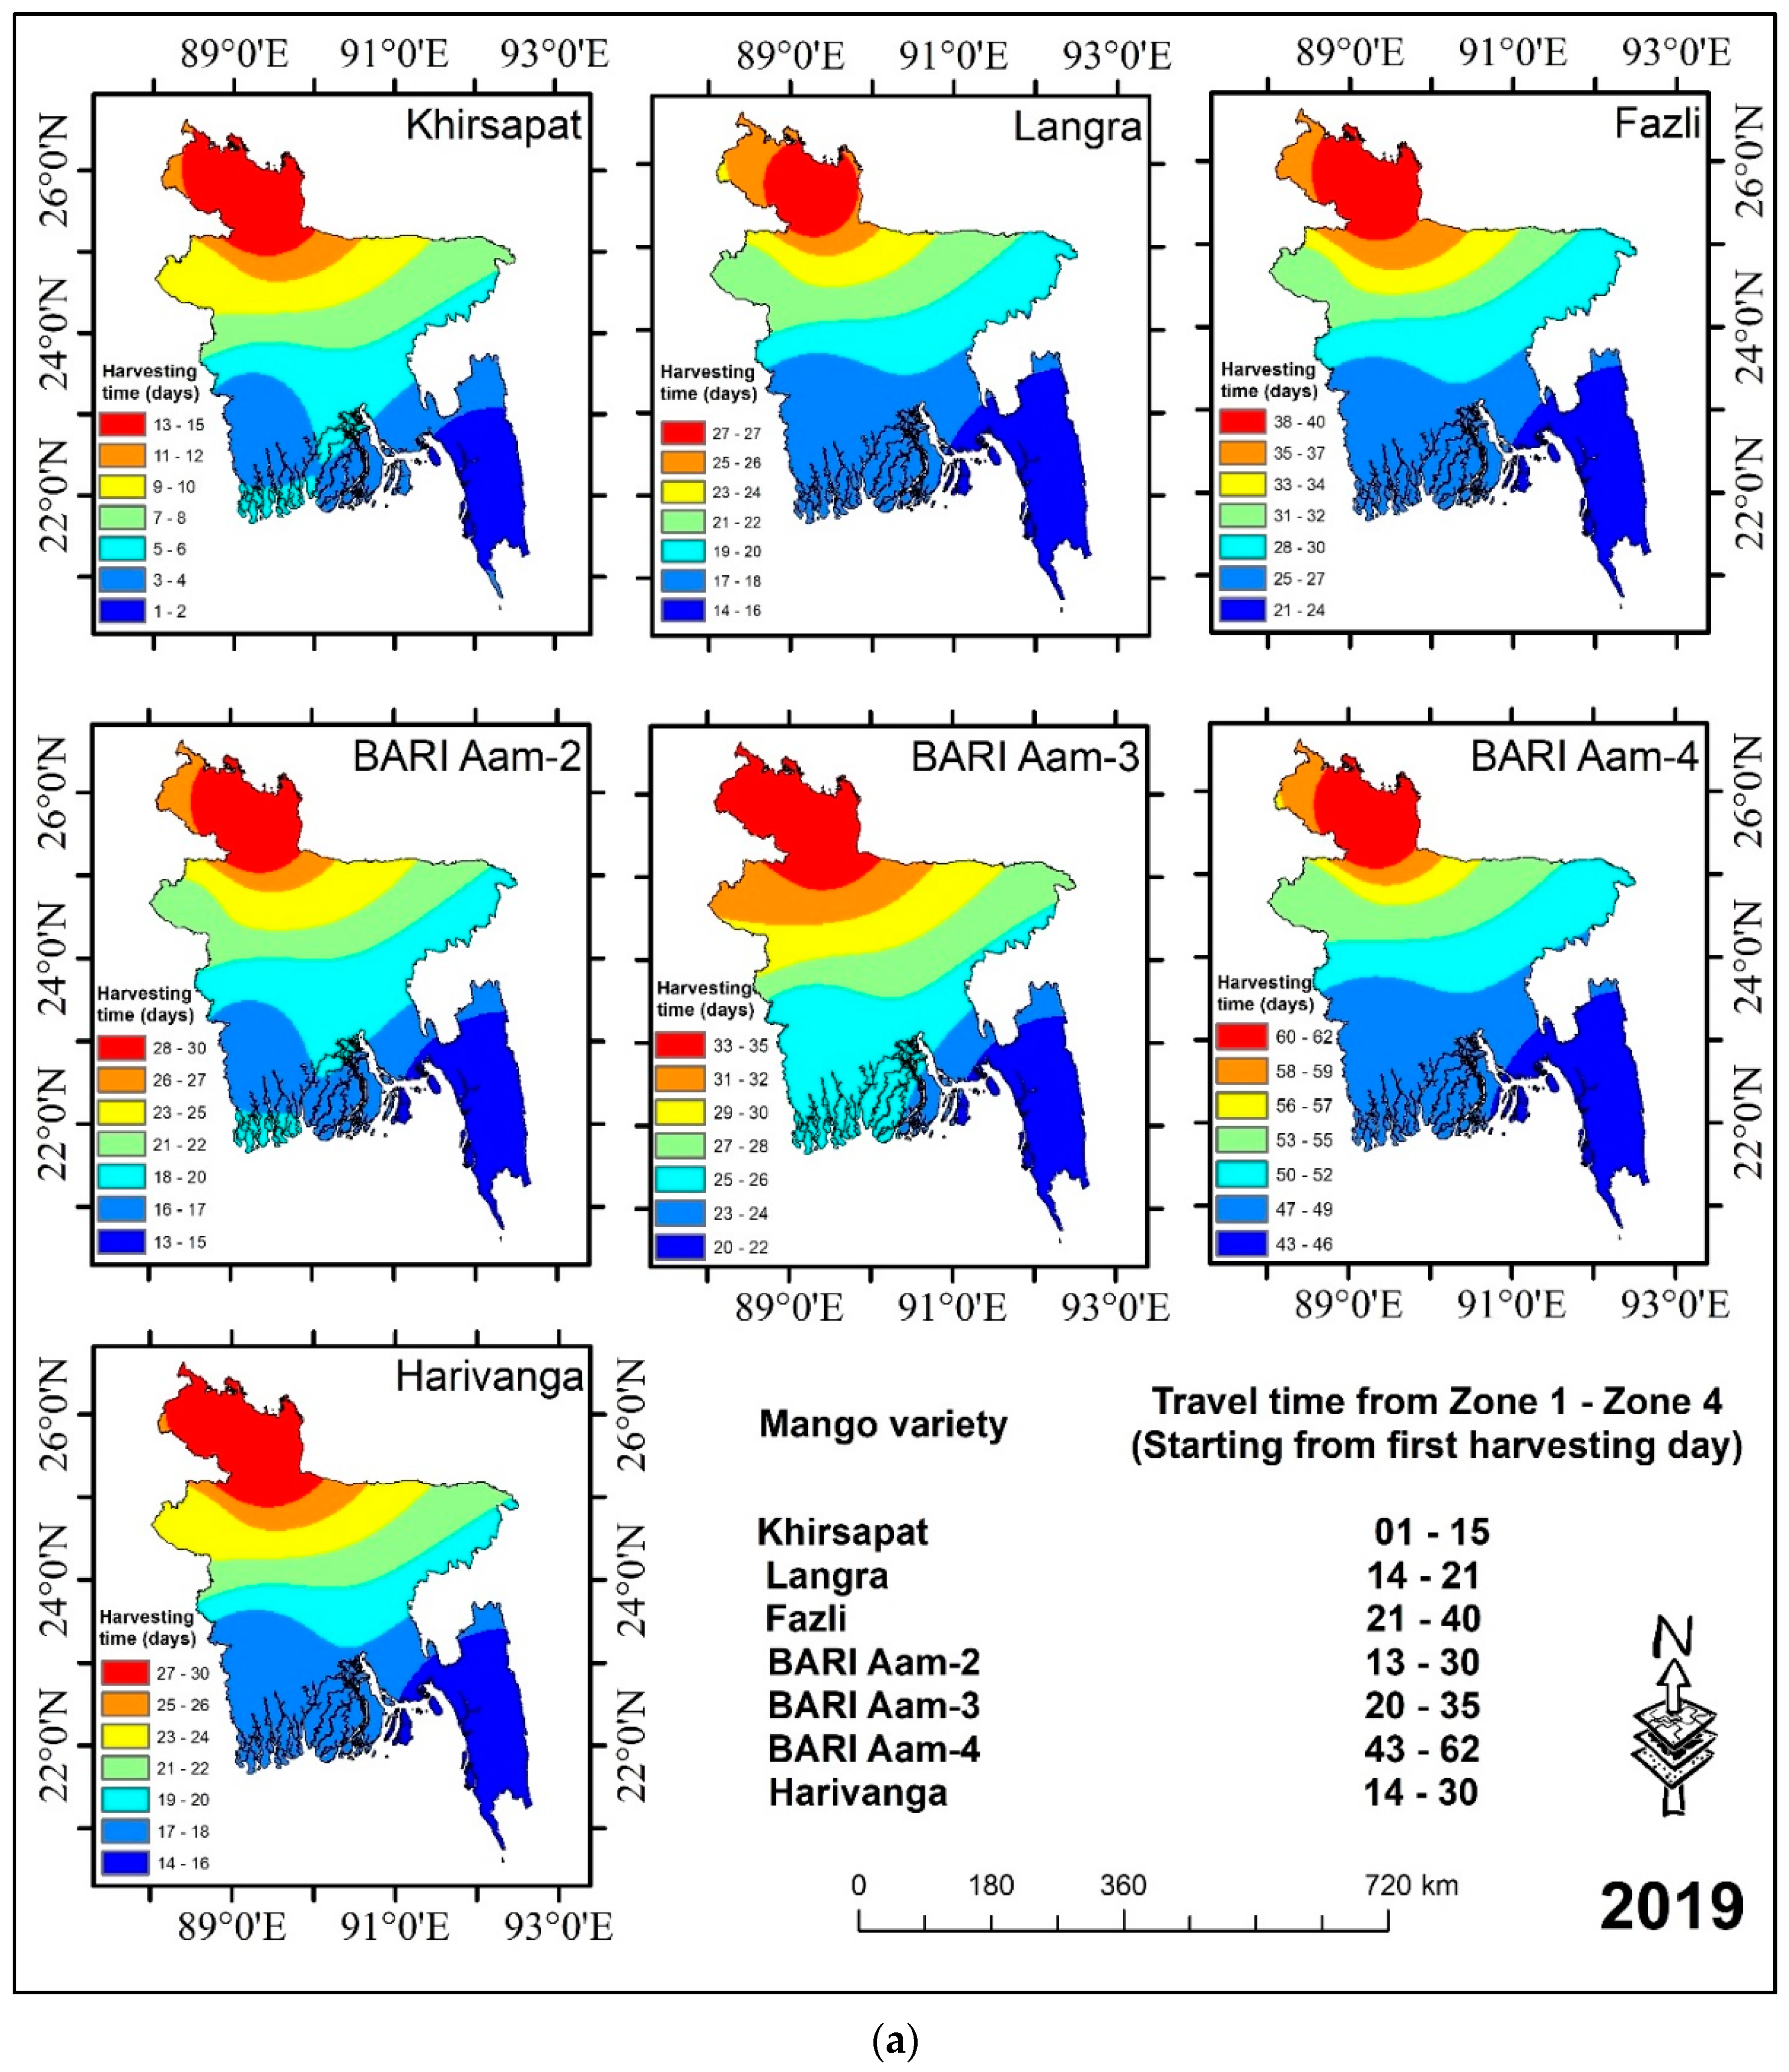
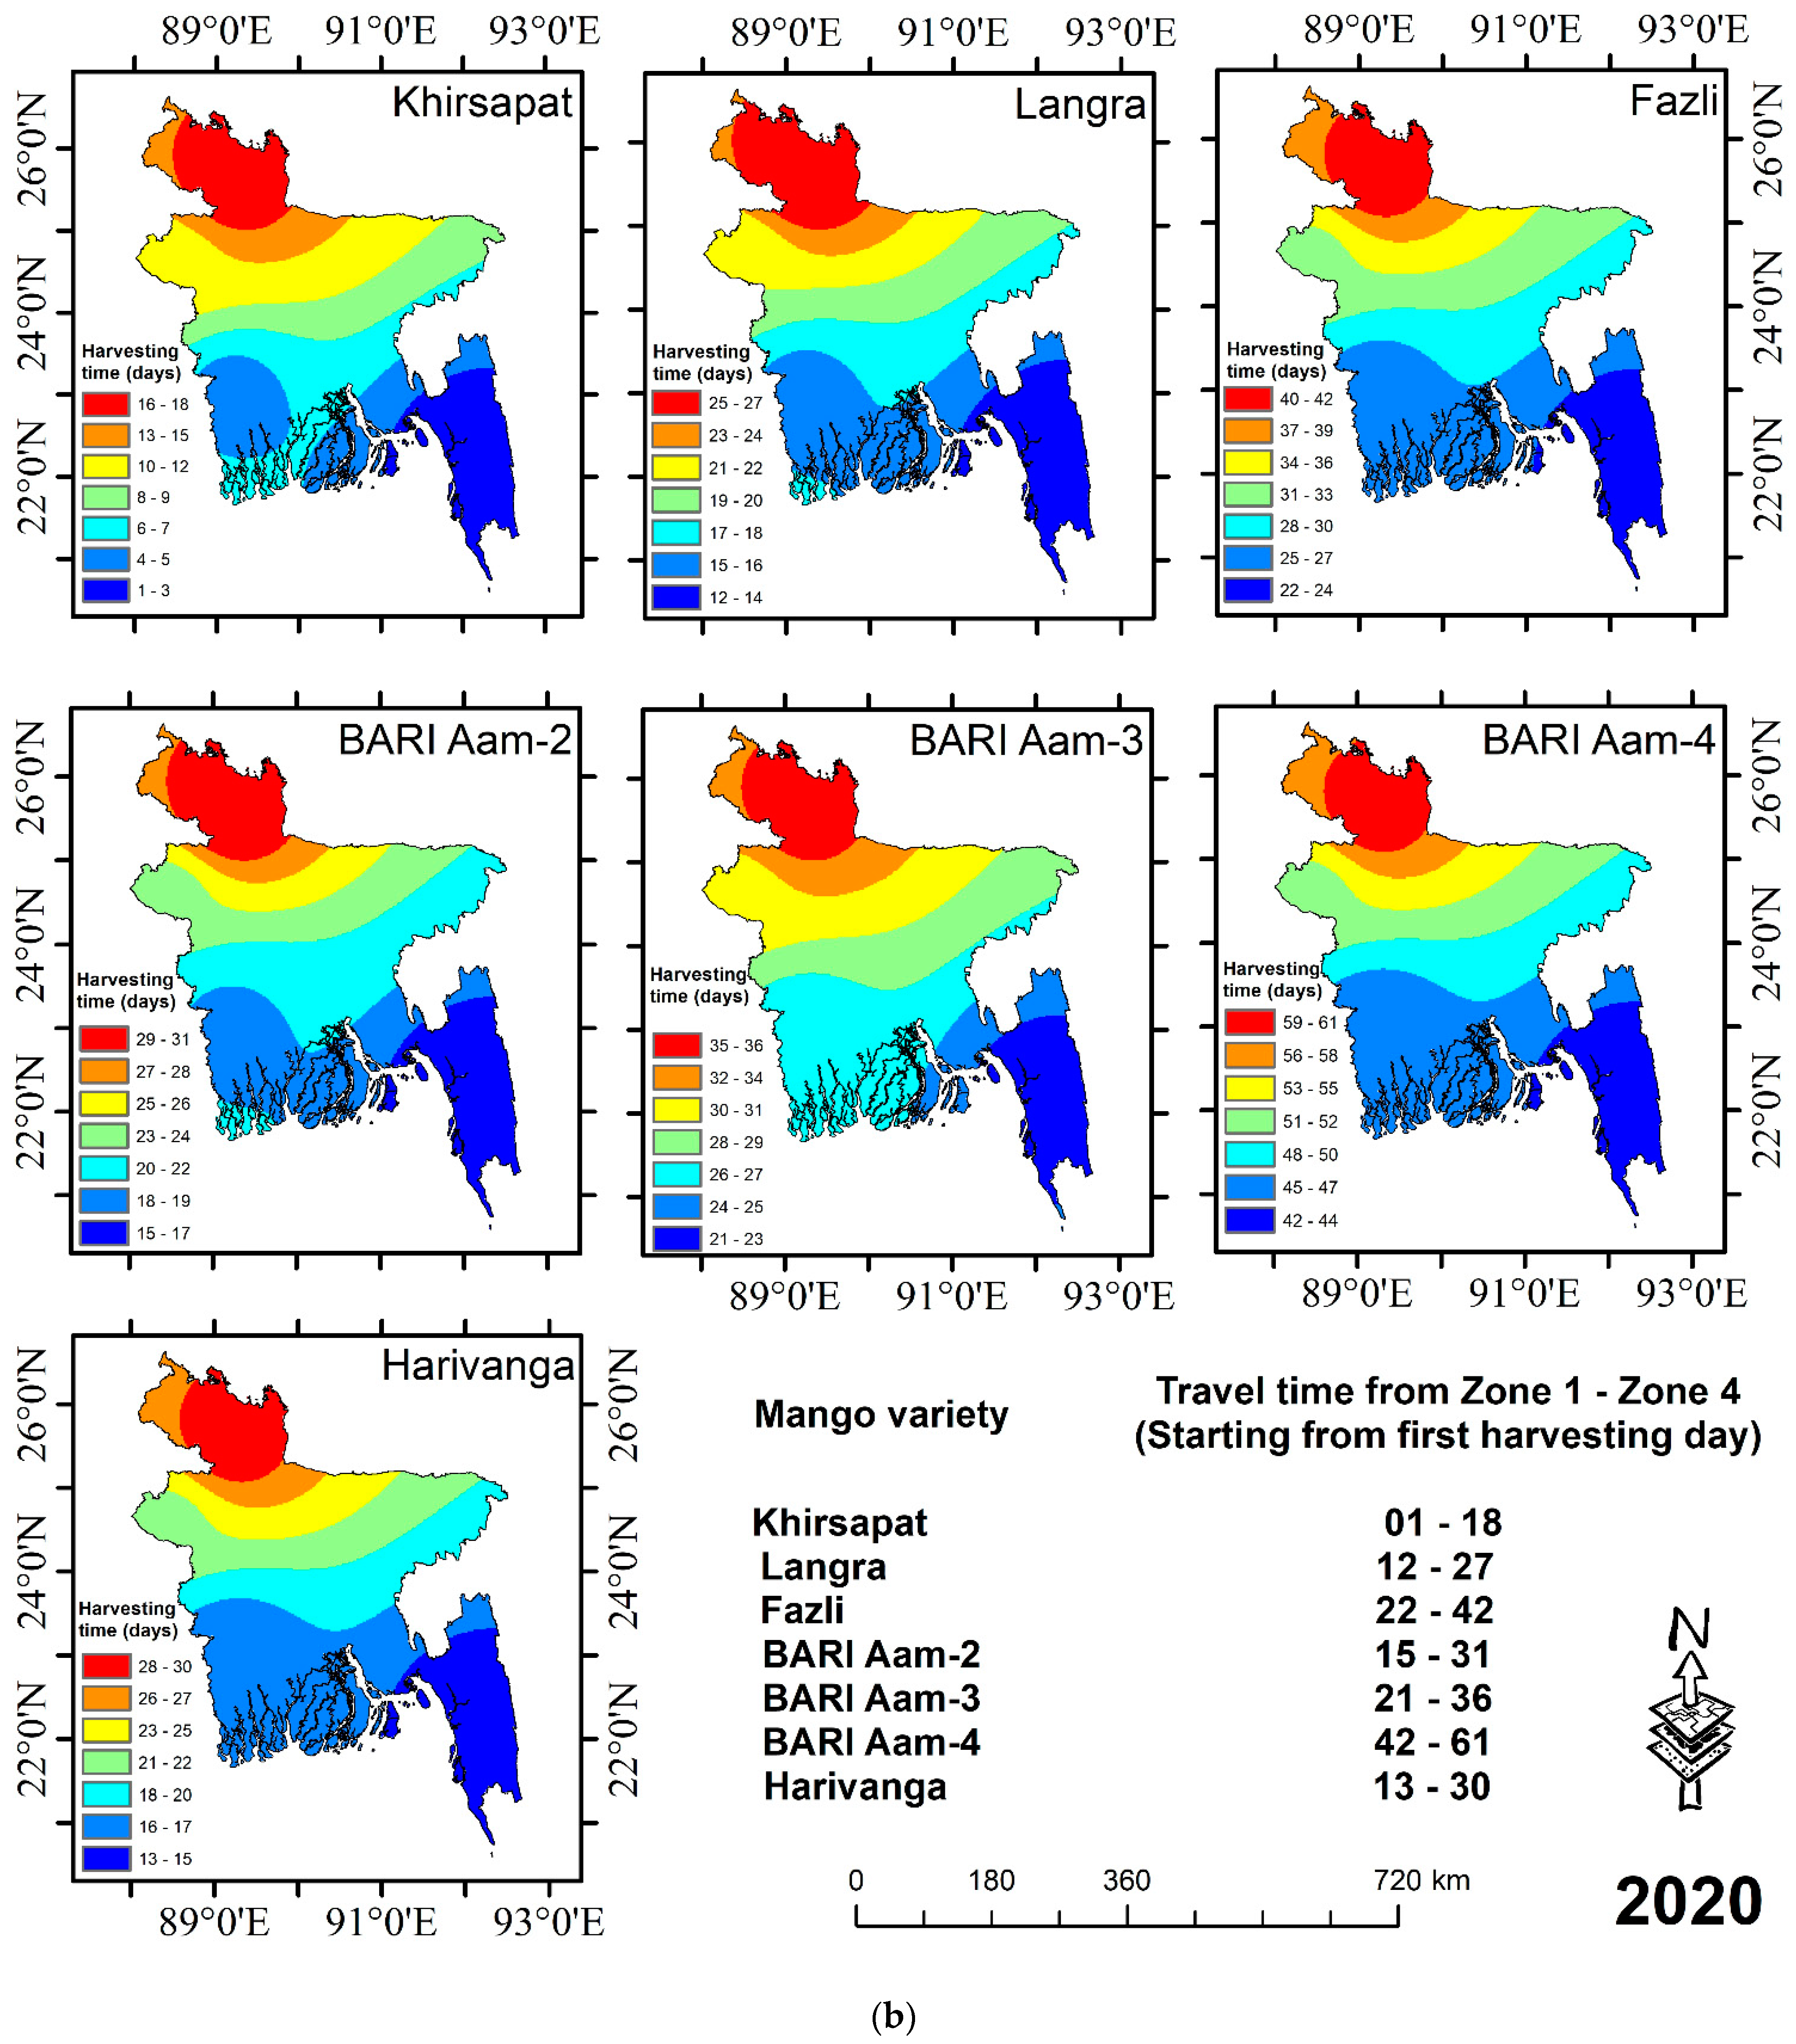
3.4. Variety Spatial Variations of Mango Harvesting Days

Figure 5a,b demonstrates the spatial distribution of harvesting time of the different varieties of mangoes on the first day of harvesting for both 2019 and 2020. The maps have been derived using Inverse Distance Weighted (IDW) interpolation algorithm in the ArcGIS platform. Khirshapat has taken half a month (i.e., 15 days), and BARI Aam-4 considers two months for harvesting in both 2019 and 2020. Additionally, the harvesting has started from Zone 4 in the beginning and ended in Zone 1. On the other hand, Langra, BARI Aam-2 and the Harivanga variety have shown a similar trend with being 1–6 days late for harvesting in 2020. Consecutively, Fazli and BARI Aam-4 have been harvested 1–2 day late in year 2020, in comparison to 2019. Overall, it has been observed that the 1° changes of location caused approximately a 2–5 day delay in mango harvesting throughout the zones considered in this study.
Additionally, we have found some interesting relationships among: (i) soil moisture and harvesting schedule; (ii) land surface temperature and harvesting period; (iii) precipitation and harvesting time; and (iv) elevation and harvesting for all four studied zones (Figure 6). Among all these relationships, temperature has been found to be a critical determinant of early or late harvesting of the mentioned mango varieties. Moreover, we have collected qualitative information from the field by capturing photographs using GPS-enabled smart phone that supports our results. The relevant photographs can be seen in Figure 3 for validation of our summarized maps.

4. Discussion

Bangladesh received the most rain in the monsoon season (June–September) during 1991–2021 (Figure 7), which was favorable for mango harvesting. For instance, the southeastern coastal area (Zone 1) received monsoon rainfall predominantly and gradually travelled from Zone 1 to Zone 4 from the arrival date of monsoon.
Monsoon arrival dates for the year 2019 and 2020 were 9 and 8 June, respectively (Table 6). Interestingly, the monsoons completed the journey from the southeastern part (Zone 1) to the north-western part (Zone 4) in 22 days (2019), and only 5 days in the year 2020. This occurred due to extreme humid weather conditions experienced in 2020, when compared to 2019. Harvesting started at the location (Zone 1) where the monsoon arrived first and shifted from lower latitude to higher latitude, and higher longitude to lower longitude, respectively.
Temperature is one of the fundamental atmospheric parameters to control the weather and climate at any location. In the pre-monsoon period, the weather becomes warm, and before the monsoon, the weather becomes humid, with warm conditions. Importantly, mango harvesting requires hot and humid weather. Hence, harvesting starts in Zone 1 depending on the arrival of the monsoon, and moves towards higher longitude to lower longitude, and then lower latitude to higher latitude. With respect to the elevation, harvesting time gets delayed from higher elevation (Zone 1) to lower elevation (Zone 3) except in Zone 4, which is relatively situated at higher altitude.
The monsoon arrived on June 9 in 2019 and June 8 in 2020 in the southeastern part of the country (Zone 1). Afterwards, the monsoon continued to be observed on June 15, 11, and June 20, 12, in year 2019, 2020 in Zones 2, 3, and 4, respectively. Additionally, temperature (max, mean) was reported to be (299.5, 298.2 K), (301.6, 300.8 K), (301.8, 301.1 K), and (300.8, 299.1 K), for year 2019 in Zones 1, 2, 3, and 4, during 1 January to 31 July. Note that, the maximum mean temperature was considered when obtaining the information. However, as the monsoon came late in 2020 in Zone 1, and expanded up to Zone 4, harvesting time was delayed because the temperature (max, min) of Zone 1 to 4 for the year 2020 were comparatively lower than 2019. The average temperature of 2020 during 1 January to 31 July for Zones 1 to 4 were reported as (299.1, 298.0 K), (300.2, 299.7 K), (300.0, 299.4 K), and (299.0, 298.1 K).
The harvesting time of selected mango varieties for 2019 started earlier than 2020 at Zones 1 to 4, since the temperature (max, min) in 2019 was more in keeping with 2020. The total duration of initial harvesting time from Zones 1 to 4 for the year 2019 is less or equal to that for 2020 (Table 5). It was happening because the temperature (max, min) in 2019 was noticed to be more than 2020. The duration between the onset and withdrawal of the monsoon in each zone (from Zone 1 to 1, Zone 2 to 2, Zone 3 to 3, and Zone 4 to 4) for the year 2019 is less or equal to that for 2020 (Table 6) because the temperature (max, min) in 2019 was noticed more than in 2020.
For the year 2019, from the precipitation (mean, mm) profile, a good correlation between precipitation (mean, mm) with harvesting time from Zone 1 to Zone 3 was noticed. An exception happened at Zone 4, because this zone had exceptional terrain due to the closeness to the Himalayas with high altitude, with less temperature (max, min, mean), more precipitation (mean), and more soil moisture (max, min, mean), in comparison to the adjacent Zone 3.
In the year 2019, selected mango varieties harvested earlier than year 2020. Additionally, the total duration from flowering to the start of harvesting were found to be longer in year 2020 than in 2019. During this period, in 2019, mean precipitation (mm) and soil moisture were found less, compared to the year 2020. So, it can be concluded that the combined effect of temperature and monsoon precipitation, along with soil moisture, impacted the harvesting time of all the selected mango varieties for Zone 1 to Zone 4, respectively. Harvesting started earlier where the temperature was higher, followed by lower precipitation, and less soil moisture conditions, and vice versa were observed.

5. Concluding Remarks

This study explores the dependency of harvesting time on seven popular varieties of mangoes in Bangladesh, considering the soil moisture, rainfall, temperature changes, and landscape elevation, of the four considered zones. In doing so, we have deployed satellite-borne remote sensing data, primary information obtained from the field, and geospatial information collected from reliable sources. We have explored that the surface temperature and terrain elevation are the main influencers of mango maturity and skin color. Furthermore, the varieties of mangoes (i.e., seven types in particular) are found in zones those have significant differences in temperature, soil moisture, precipitation (i.e., rainfall), and elevation from mean sea level. Additionally, this study reveals that the variations of maturity differs across the country, which has not usually been considered in earlier studies, while implementing the aforesaid variables. Moreover, the harvested fruits are transported to the capital city, Dhaka, using major highway routes (see Figure 1) to cater to demand. Note that, the fruit is perishable and can rot in three to four days if not preserved in an appropriate fashion. Additionally, the Ministry of Agriculture and Environment may be able to consider the need of their involvement at local government level to build capacity among the farmers for selecting appropriate time of harvesting based on empirical evidence. Interestingly, Zone 1 represents a mix of hill tracts and closeness to the sea and depicts an early maturity of the crop, while comparing it to Zone 4. Similar trends of harvesting mango varieties are evident in other zones, mainly depending on the temperature, elevation, and proximity to sea.
Furthermore, this study features a few novelties to add scientific evidence in the present body of literature considering: (i) the cost effectiveness of mapping spatial zones of mango harvesting is proven worthy upon considering freely available satellite images. Note that, the mango harvesting period is very short and requires reliable information for any potential adaptation strategies (e.g., irrigation, spraying pesticides, bagging, shading, etc.) to assist farmers; (ii) by using a smart phone, it is evident that farmers can supply primary information rapidly for efficient management strategies. Additionally, the mechanism engages scientists, farmers, entrepreneurs, and key stakeholders to work collectively; and (iii) an enhancement may be possible of this present study upon considering more climatic and spatial variables (e.g., humidity, wind direction, paste management mechanisms, irrigation system’s availability, etc.) through machine learning techniques, which may predict the accuracy of mango production in different zones. Consequently, we recommend that professionals and scientists who are inclinded to adopt this model may want to check the geographic location and climatic variables carefully before employing this technique in the real field.

Author Contributions

Conceptualization, M.M., M.S.U. and K.R.R.; methodology, M.M. and K.R.R.; software, M.M., A.T. and K.R.R.; validation, M.M., M.S.U., M.A.E.A., A.T. and K.R.R.; formal analysis, M.M. and K.R.R.; investigation, M.M., M.S.U., M.A.E.A., A.T. and K.R.R.; resources, M.M. and M.S.U.; data curation, M.M.; writing—original draft preparation, M.M., K.R.R.; writing—review and editing, M.M., K.R.R. and A.T.; supervision, K.R.R. All authors have read and agreed to the published version of the manuscript.

Funding

This research received no external funding.

Institutional Review Board Statement

Not Applicable.

Informed Consent Statement

Not Applicable.

Data Availability Statement

Data will be made available on request to the corresponding author.

Acknowledgments

The authors deeply acknowledge the Bangladesh Agricultural Research Institute (BARI), Gazipur-1701, Bangladesh and Pomology Division, Horticulture Research Centre, Bangladesh Agricultural Research Institute (BARI), Gazipur-1701, Bangladesh. Author’s also acknoledge the supports from the Department of Geography and Environmental Studies and Wicked Problems Lab, Saint Mary’s University, Halifax, NS, Canada.

Conflicts of Interest

The authors declare no conflict of interest.

References

  1. Ntsoane, M.L.; Zude-Sasse, M.; Mahajan, P.; Sivakumar, D. Quality Assesment and Postharvest Technology of Mango: A Review of Its Current Status and Future Perspectives. Sci. Hortic. 2019, 249, 77–85. [Google Scholar] [CrossRef]
  2. Evans, E.A. Recent Trends in World and U.S. Mango Production, Trade, and Consumption. EDIS 2008, 107, 106–111. [Google Scholar] [CrossRef]
  3. Mitra, S.K. Mango Production in the World-Present Situation and Future Prospect. Acta Hortic. 2016, 1111, 287–296. [Google Scholar] [CrossRef]
  4. Taiti, C.; Marone, E.; Bazihizina, N.; Caparrotta, S.; Azzarello, E.; Petrucci, A.W.; Pandolfi, C.; Giordani, E. Sometimes a Little Mango Goes a Long Way: A Rapid Approach to Assess How Different Shipping Systems Affect Fruit Commercial Quality. Food Anal. Methods 2016, 9, 691–698. [Google Scholar] [CrossRef]
  5. Normand, F.; Lauri, P.; Legave, J.M. Climate Change and Its Probable Effects on Mango Production and Cultivation. Acta Hortic. 2015, 1075, 21–32. [Google Scholar] [CrossRef]
  6. Yadav, I.S.; Srinivasa Rao, N.K.; Reddy, B.M.C.; Rawal, R.D.; Srinivasan, V.R.; Sujatha, N.T.; Bhattacharya, C.; Nageswara Rao, P.P.; Ramesh, K.S.; Elango, S. Acreage and Production Estimation of Mango Orchards Using Indian Remote Sensing (IRS) Satellite Data. Sci. Hortic. 2002, 93, 105–123. [Google Scholar] [CrossRef]
  7. Schulze, K.; Spreer, W.; Keil, A.; Ongprasert, S.; Müller, J. Mango (Mangifera indica L. Cv. Nam Dokmai) Production in Northern Thailand-Costs and Returns under Extreme Weather Conditions and Different Irrigation Treatments. Agric. Water Manag. 2013, 126, 46–55. [Google Scholar] [CrossRef]
  8. Dessalegn, Y.; Assefa, H.; Derso, T.; Tefera, M. Mango Production Knowledge and Technological Gaps of Smallholder Farmers in Amhara Region, Ethiopia. Am. Sci. Res. J. Eng. Technol. Sci. 2014, 10, 28–39. [Google Scholar]
  9. Prakash Singh, S.; Nandi, A.K. Economics of Mango Production, Marketing System and Constraints Faced by Growers in Lucknow District of Uttar Pradesh. Asian J. Dairy Food Res. 2021, 40, 213–219. [Google Scholar] [CrossRef]
  10. Sauco, V.G. Achieving Sustainable Cultivation of Mangoes; Burleigh Dodds Science Publishing Limited: Cambridge, UK, 2018; ISBN 9781786760326. [Google Scholar]
  11. Eitzinger, A.; Läderach, P.; Carmona, S.; Navarro, C.; Collet, L. Prediction of the Impact of Climate Change on Coffee and Mango Growing Areas in Haiti; Centro Internacional de Agricultura Tropical (CIAT): Cali, Colombia, 2013; p. 44. [Google Scholar]
  12. Zuazo, V.H.D.; García-Tejero, I.F.; Rodríguez, B.C.; Tarifa, D.F.; Ruiz, B.G.; Sacristán, P.C. Deficit Irrigation Strategies for Subtropical Mango Farming. A Review. Agron. Sustain. Dev. 2021, 41, 13. [Google Scholar] [CrossRef]
  13. Ud-Daula, A. Present Scenario of Insecticides and Fungicides Use in Largest Mango Cultivation Area in Bangladesh. Sci. J. Public Health 2016, 4, 20. [Google Scholar] [CrossRef]
  14. BBS. Statistical Year Book of Bangladesh 2020; Bangladesh Bureau of Statistics, Statistics Division, Ministry of Planning: Dhaka, Bangladesh, 2021; p. 203. [Google Scholar]
  15. Sultana, A.; Chowdhury, M.F.; Pervez, A.K.M.K. present status of mango cultivation in Bangladesh: Case of Shibgonj upazila of Chapainawabgonj district. J. Agric. Rural Res. 2018, 2, 47–55. [Google Scholar]
  16. Mohomud, M.S.; Ali, M.R. Effect of Temperature and Humidity on Shielf Life of Ripe Mangoes. Bangladesh Res. Publ. J. 2010, 3, 1193–1196. [Google Scholar]
  17. Shafique, M.; Ibrahim, M.; Helali, M.; Biswas, S. Studies on the Physiological and Biochemical Composition of Different Mango Cultivars at Various Maturity Levels. Bangladesh J. Sci. Ind. Res. 2006, 41, 101–108. [Google Scholar] [CrossRef]
  18. Ahmed, M.; Chowdhury, A.T.; Mohib, A.A. Office of Value Chain Analysis of Mango in Bangladesh International Conference on Business and Management Value Chain Analysis of Mango in Bangladesh. AIUB J. Bus. Econ. 2019, 16, 1–14. [Google Scholar]
  19. Islam, M.T.; Shamsuzzoha, M.; Rahman, M.S.; Bari, M.A.; Akter, M.M.; Khatun, A.; Huque, R.; Uddin, M.S. Effect of Bagging Time on Fruit Quality and Shelf Life of Mango (Mangifera indica L.) Cv. Langra in Bangladesh. Int. J. Agric. Environ. Bioresearch 2019, 4, 279–289. [Google Scholar] [CrossRef]
  20. Barua, S.; Rahi, T.; Ullah, E.; Ghosh, D.; Ahmed, S. Delay in Fruit Ripening: A Promising Approach for Reduction of Spoilage and Use of Hazardous Chemicals in Bangladesh. Int. J. Agron. Agric. Res. IJAAR 2015, 6, 163–173. [Google Scholar]
  21. Alam, M.M. Mango Supply Chain and Value Chain Analysis from Farm to Market. Int. J. Supply Chain Manag. 2018, 7, 7–12. [Google Scholar]
  22. Galdino, T.V.D.S.; Kumar, S.; Oliveira, L.S.S.; Alfenas, A.C.; Neven, L.G.; Al-Sadi, A.M.; Picanc, M.C. Mapping Global Potential Risk of Mango Sudden Decline Disease Caused by Ceratocystis Fimbriata. PLoS ONE 2016, 11, e0159450. [Google Scholar] [CrossRef] [Green Version]
  23. Nordey, T.; Léchaudel, M.; Génard, M.; Joas, J. Spatial and Temporal Variations in Mango Colour, Acidity, and Sweetness in Relation to Temperature and Ethylene Gradients within the Fruit. J. Plant Physiol. 2014, 171, 1555–1563. [Google Scholar] [CrossRef]
  24. Yadav, A.S.; Pandey, D.C. Geographical Perspectives of Mango Production in India. Imp. J. Interdiscip. Res. 2016, 2, 257–265. [Google Scholar]
  25. Sthapit, S.R.; Scherr, S.J. Tropical Fruit Tree Species and Climate Change; Biodiversity International: Rome, Italy, 2012; ISBN 9789290439097. [Google Scholar]
  26. Balderas-Palacios, G.F.; Urías López, M.A.; González-Carrillo, J.A.; González-Acuña, I.J.; Álvarez-Bravo, A. Distribución Temporal y Espacial de La Escama Blanca Del Mango En Sinaloa, México. Rev. Mex. Cienc. Agríc. 2017, 8, 4023–4034. [Google Scholar] [CrossRef] [Green Version]
  27. D’Haese, M.; Van Huylenbroeck, G.; Van Rooyen, C.J.; D’Haese, L. Financial Analysis of Mango Production on Small-Scale Emerging Commercial Farms in the Venda Region of South Africa. Agrekon 1999, 38, 209–219. [Google Scholar] [CrossRef]
  28. Rahman, M.A.; Saha, M.G.; Nasrin, T.A.A.; Islam, M.N.; Uddin, M.S.; Arfin, M.S. Postharvest Loss Assessment of Mango in the Existing Value Chain of Bangladesh. J. Bangladesh Hortic. 2017, 3, 15–22. [Google Scholar]
  29. Elsheikh, A.; Shariff, N.P. Mango Suitability Evaluation Based on GIS, Multi Criteria Weights and Sensitivity Analysis. Int. J. Adv. Comput. Res. 2015, 5, 25–34. [Google Scholar]
  30. Siddiqui, S.H.; Aktar, N.; Sultana, C. A Study on Mango Economy of Malda District. West Bengal. 2015, 61, 129–140. [Google Scholar]
  31. Sarron, J.; Malézieux, É.; Sané, C.A.B.; Faye, É. Mango Yield Mapping at the Orchard Scale Based on Tree Structure and Land Cover Assessed by UAV. Remote Sens. 2018, 10, 1900. [Google Scholar] [CrossRef] [Green Version]
  32. Uddin, M.; Sun, W.; He, X.; da Silva, J.T.; Cheng, Q. An Improved Method to Extract DNA from Mango Mangifera indica. Biologia 2014, 69, 133–138. [Google Scholar] [CrossRef]
  33. Uddin, M.; Hossain, M.F.; Islam, M.S.; Hossain, M.M.; Uddin, M.S. Effect of Post-Harvest Pruning on the Control of Tree Size and Yield of Mango. Bull. Inst. Trop. Agric. Kyushu Univ. 2014, 37, 41–46. [Google Scholar] [CrossRef]
  34. Molla, M.R.; Ahmed, I.; Hossain, M.A.; Islam, M.S.; Chowdhury, M.A.Z.; Shabnam, D.; Rohman, M.M. Morphological Characterization and Simple Sequence Repeats (SSRs) Based DNA Fingerprinting of Selected Mango (Mangifera indica L.) Genotypes in Bangladesh. J. Hortic. For. 2019, 11, 104–119. [Google Scholar]
  35. WP Bangladesh Population 2021 (Demographics, Maps, Graphs). Available online: https://worldpopulationreview.com/countries/bangladesh-population (accessed on 20 January 2022).
  36. NWPB. List of Divisions|People’s Republic of Bangladesh. Available online: http://www.bangladesh.gov.bd/site/view/division-list/List-of-Divisions (accessed on 6 March 2022).
  37. Phillips, D.A.; Gritzner, C.F. Bangladesh; Infobase Publishing: New York, NY, USA, 2007. [Google Scholar]
  38. Thomas, N.; Baltezar, P.; Lagomasino, D.; Stovall, A.; Iqbal, Z.; Fatoyinbo, L. Trees Outside Forests Are an Underestimated Resource in a Country with Low Forest Cover. Sci. Rep. 2021, 11, 7919. [Google Scholar] [CrossRef] [PubMed]
  39. Manzoor Rashid, A.Z.M.; Craig, D.; Mukul, S.A.; Khan, N.A. A Journey towards Shared Governance: Status and Prospects for Collaborative Management in the Protected Areas of Bangladesh. J. For. Res. 2013, 24, 599–605. [Google Scholar] [CrossRef]
  40. FAO. State of the World’s Forests; FAO: Rome, Italy, 2009. [Google Scholar]
  41. Hossain, M.S.; Alam, G.M.M.; Fahad, S.; Sarker, T.; Moniruzzaman, M.; Rabbany, M.G. Farmers’ Willingness to Pay for Flood Insurance as Climate Change Adaptation Strategy in Northern Bangladesh. J. Clean. Prod. 2022, 338, 130584. [Google Scholar] [CrossRef]
  42. Hossain, M.N.; Chowdhury, S.; Paul, S.K. Farmer-Level Adaptation to Climate Change and Agricultural Drought: Empirical Evidences from the Barind Region of Bangladesh. Nat. Hazards 2016, 83, 1007–1026. [Google Scholar] [CrossRef]
  43. Hoque, M.A.-A.; Ahmed, N.; Pradhan, B.; Roy, S. Assessment of Coastal Vulnerability to Multi-Hazardous Events Using Geospatial Techniques along the Eastern Coast of Bangladesh. Ocean Coast. Manag. 2019, 181, 104898. [Google Scholar] [CrossRef]
  44. Mallick, B.; Ahmed, B.; Vogt, J. Living with the Risks of Cyclone Disasters in the South-Western Coastal Region of Bangladesh. Environments 2017, 4, 13. [Google Scholar] [CrossRef]
  45. Jerin, J.N.; Islam, H.T.; Islam, A.R.M.T.; Shahid, S.; Hu, Z.; Badhan, M.A.; Chu, R.; Elbeltagi, A. Spatiotemporal Trends in Reference Evapotranspiration and Its Driving Factors in Bangladesh. Theor. Appl. Climatol. 2021, 144, 793–808. [Google Scholar] [CrossRef]
  46. Wahiduzzaman, M.; Luo, J.-J. A Statistical Analysis on the Contribution of El Niño–Southern Oscillation to the Rainfall and Temperature over Bangladesh. Meteorol. Atmos. Phys. 2021, 133, 55–68. [Google Scholar] [CrossRef]
  47. FAO; UNDP. Classification of the Soils of Bangladesh; Ministry of Agriculture: Dhaka, Bangladesh, 1986. [Google Scholar]
  48. Islam, M.A.; Hasan, M.A.; Farukh, M.A. Application of GIS in General Soil Mapping of Bangladesh. J. Geogr. Inf. Syst. 2017, 9, 604–621. [Google Scholar] [CrossRef] [Green Version]
  49. FAO. Land Resources Appraisal of Bangladesh for Agricultural Development; FAO: Rome, Italy, 1988; Volume 2. [Google Scholar]
  50. Farr, T.G.; Rosen, P.A.; Caro, E.; Crippen, R.; Duren, R.; Hensley, S.; Kobrick, M.; Paller, M.; Rodriguez, E.; Roth, L. The Shuttle Radar Topography Mission. Rev. Geophys. 2007, 45, 1–33. [Google Scholar] [CrossRef] [Green Version]
  51. Huffman, G.J.; Stocker, E.; Bolvin, D.; Nelkin, E.; Jackson, T. GPM IMERG Final Precipitation L3 Half Hourly 0.1 Degree × 0.1 Degree V06 (GPM_3IMERGHH); Goddard Earth Sciences Data and Information Services Center (GES DISC): Greenbelt, MD, USA, 2015. Available online: https://disc.gsfc.nasa.gov/datasets/GPM_3IMERGHH_06/summary (accessed on 20 April 2021).
  52. Li, B.; Beaudoing, H.; Rodell, M. GLDAS Catchment Land Surface Model L4 Daily 0.25 × 0.25 Degree GRACE-DA1 V2.2. Greenbelt Md. 2020, 16, 1–32. [Google Scholar]
  53. Mane, S.B.; Pawar, C.D.; Salvi, B.R.; Burondkar, M.M.; Haldankar, P.M.; Borkar, P.G.; Kulkarni, M.M. Effect of Precooling and Storage Temperature on Physical Parameters of Alphonso Mango (Mangifera indica L.) Fruits. Pharma Innov. J. 2021, 10, 984–989. [Google Scholar]
  54. Deng, G.; Zhang, H.; Guo, X.; Ying, H. Assessment of Drought in Democratic People’s Republic of Korea in 2017 Using TRMM Data. In Proceedings of the 2018 Fifth International Workshop on Earth Observation and Remote Sensing Applications (EORSA), Xi’an, China, 18–20 June 2018; pp. 1–5. [Google Scholar]
  55. Dung, N.B.; Long, N.Q.; Goyal, R.; An, D.T.; Minh, D.T. The Role of Factors Affecting Flood Hazard Zoning Using Analytical Hierarchy Process: A Review. Earth Syst. Environ. 2021, 6, 697–713. [Google Scholar] [CrossRef]
  56. Rousta, I.; Olafsson, H.; Moniruzzaman, M.; Zhang, H.; Liou, Y.-A.; Mushore, T.D.; Gupta, A. Impacts of Drought on Vegetation Assessed by Vegetation Indices and Meteorological Factors in Afghanistan. Remote Sens. 2020, 12, 2433. [Google Scholar] [CrossRef]
  57. Almazroui, M. Calibration of TRMM Rainfall Climatology over Saudi Arabia during 1998–2009. Atmos. Res. 2011, 99, 400–414. [Google Scholar] [CrossRef]
  58. Kummerow, C.; Barnes, W.; Kozu, T.; Shiue, J.; Simpson, J. The Tropical Rainfall Measuring Mission (TRMM) Sensor Package. J. Atmos. Ocean. Technol. 1998, 15, 809–817. [Google Scholar] [CrossRef]
  59. Giovanni. Available online: https://giovanni.gsfc.nasa.gov/giovanni/ (accessed on 10 February 2022).
Figure 1. Map demonstrating the four classified zones of the study area in the context of Bangladesh.
Sustainability 14 13495 g001
Figure 2. Schematic diagram demonstrating the methods employed in this study.
Sustainability 14 13495 g002
Figure 3. Ground referenced data and geotagged photo collected from selected areas (photographs captured by authors).
Sustainability 14 13495 g003
Figure 4. Elevation profile and geo-location of Zones (1–4).
Sustainability 14 13495 g004
Figure 5. (a) Spatial distribution of variety mango harvesting day, 2019. (b) Spatial distribution of variety mango harvesting day, 2020.
Sustainability 14 13495 g005aSustainability 14 13495 g005b
Figure 6. Mango harvesting schedule is plotted against soil moisture, temperature, precipitation, and elevation, to determine correlation among these variables.
Sustainability 14 13495 g006
Figure 7. Monthly mean rainfall of last 30 years (1991–2020) (Source: BMD station data).
Sustainability 14 13495 g007
Table 2. Generic soil types of Bangladesh (adopted from FAO, 1988) [49].
General Soil TypeArea (ha)(%)General Soil TypeArea (ha)(%)
Floodplain soils9,718,72278.96Terrace soils1,028,0308.35
Calcareous Alluvium591,7964.81Peat130,0051.06
Black Terai soils83,4080.68Grey Valley soils114,2870.93
Acid Basin clays348,9942.84Made land106,2780.86
Acid Sulphate soils226,6471.84Grey Piedmont Soils215,2791.75
Non-calcareous Alluvium562,2424.57Deep Grey Terrace soils352,1522.86
Calcareous Brown Floodplain soils478,5183.89Shallow Red-Brown Terrace soils72,5490.59
Calcareous Grey Floodplain soils170,7671.39Deep Red-Brown Terrace soils189,3801.54
Calcareous Dark Grey Floodplain soils1,434,67811.66Brown Mottled Terrace soils34,2350.28
Non-Calcareous Grey Floodplain soils3,387,15327.52Shallow Grey Terrace soils265,4272.16
Non-Calcareous Brown Floodplain soils383,3123.11Non-Calcareous Dark Grey Floodplain soils1,599,64513
Hill soils (Brown Hill Soils)1,561,47212.69Total soil area12,308,224100
Table 3. Data used in the study at a glance.
Data UsedPropertiesSpatial ResolutionSourceRemarks
DEMSRTM V3 product (SRTM Plus)30 mGEE (https://code.earthengine.google.com/) (accessed on: 1 April 2021).[50]
PrecipitationGPM GPM_3IMERGDF v06; daily (mm)0.1° × 0.1°GIOVANNI (https://giovanni.gsfc.nasa.gov/) (accessed on: 20 April 2021).[51]
TemperatureGLDAS Model GLDAS_CLSM025_DA1_D v2.2; daily (k)0.25° × 0.25°GIOVANNI (https://giovanni.gsfc.nasa.gov/) (accessed on: 21 April 2021).[52]
Soil moistureGLDAS Model GLDAS_NOAH025_3H v2.1; daily (kg m−2)0.25° × 0.25°GIOVANNI (https://giovanni.gsfc.nasa.gov/) (accessed on: 20 April 2021).[52]
Table 4. Variations of temperature, precipitation, and soil moisture over the four selected zones and the entire country.
Temperature Profile (°K)
BangladeshZone 1Zone 2Zone 3Zone 4
Year2019202020192020201920202019202020192020
MIN296.7296.4297.2297.0299.5299.0299.8298.5297.1296.5
MAX301.8300.2299.5299.1301.6300.2301.8300.0300.8299.0
RANGE5.13.92.32.12.01.31.91.53.82.5
MEAN299.1298.4298.2298.0300.8299.7301.1299.4299.1298.1
STD1.20.90.60.50.60.40.50.41.00.7
Precipitation Profile (mm)
BangladeshZone 1Zone 2Zone 3Zone 4
Year2019202020192020201920202019202020192020
MIN3.14.36.96.63.24.53.34.54.05.4
MAX13.616.09.48.55.05.75.16.28.211.2
RANGE10.511.62.41.91.81.21.81.74.25.8
MEAN6.67.48.27.44.15.13.95.26.08.1
STD2.12.10.50.40.50.40.40.41.11.6
SUM8203.39082.1918.7832.5518.1642.2209.2275.0646.0862.5
Soil Moisture Profile (kg m−2)
BangladeshZone 1Zone 2Zone 3Zone 4
Year2019202020192020201920202019202020192020
MIN3.54.54.54.53.94.83.54.54.05.0
MAX7.77.75.55.46.26.65.46.65.96.7
RANGE4.33.31.00.92.31.81.92.11.91.7
MEAN5.25.84.94.95.15.84.25.34.85.7
STD0.80.70.30.20.70.60.60.60.50.5
Table 5. Variety harvesting time.
YearZone 1Zone 2Zone 3Zone 4Total Days
2019202020192020201920202019202020192000
Khirsapat26.5.201928.5.202029.5.201901.6.202003.6.201907.6.202010.6.201915.6.20201619
Langra09.6.201909.6.202011.6.201912.6.202016.6.201917.6.202022.6.201924.6.20201416
Fazli18.6.201919.6.202022.6.201922.6.202028.6.201929.6.202007.7.201909.7.20202021
BARI Aam-208.6.201912.6.202011.6.201915.6.202016.6.201920.6.202024.6.201928.6.20201717
BARI Aam-317.6.201918.6.202021.6.201922.6.202027.6.201927.6.202002.7.201903.7.20201616
BARI Aam-408.7.201909.7.202010.7.201911.7.202016.7.201918.7.202026.7.201928.7.20201920
Harivanga09.6.201910.6.202011.6.201912.6.202017.6.201918.6.202025.6.201927.6.20201718
Table 6. S-W monsoon onset and withdrawal over Bangladesh (2015–2020).
Monsoon OnsetMonsoon Withdrawal
YearSoutheastern Part of the Country
(Zone 1)
Half Part of the Country
(Zone 1 & 2)
Over Bangladesh
(Zone 1, 2, 3 & 4)
Northwestern Part of the Country
(Zone 3 & 4)
Half Part of the Country
(Zone 2, 3 & 4)
Over Bangladesh
(Zone 1, 2, 3 & 4)
202106 June10 June11 June12 Oct12 October22 October
202008 June11 June12 June22 Oct26 October31 October
201909 June15 June20 June13 Oct14 October14 October
201801 June04 June12 June05 Oct05 October05 October
201730 May03 June12 June15 Oct16 October16 October
201610 June14 June17 June14 Oct15 October15 October
201505 June10 June11 June17 Oct17 October17 October
Onset/withdrawalZone1Zone 2Zone 3& 4zone 3 & 4zone 2zone 1
Publisher’s Note: MDPI stays neutral with regard to jurisdictional claims in published maps and institutional affiliations.

