Article

Analysis of the Determinants and Mechanism of Mutton Price in Xinjiang Region of China

1
School of Economics and Management, University of Chinese Academy of Sciences, Beijing 100190, China
2
WQ-UCAS Graduate School of Business, Binzhou Institute of Technology, Binzhou 256600, China
3
WQ-UCAS Joint Lab, University of Chinese Academy of Sciences, Beijing 100190, China
*
Author to whom correspondence should be addressed.
Sustainability 2022, 14(20), 13482; https://doi.org/10.3390/su142013482
Submission received: 31 May 2022 / Revised: 28 September 2022 / Accepted: 13 October 2022 / Published: 19 October 2022

Abstract

:
In order to deeply analyze the internal and external influencing factors of mutton price fluctuation, a multi-scale analytical framework was proposed in regards to the fluctuation mechanism analysis of mutton price in the Xinjiang region of China. By combining data decomposition and correlation analysis, this paper investigated the relationship between different mode components and multiple influencing factors to explain the fluctuation characteristics of mutton price in Xinjiang. Through empirical analysis, it was found that the proposed analytical framework could effectively explore the fluctuation mechanism of influencing factors related to mutton price, and could provide the corresponding policy support for the local government to adjust mutton price in Xinjiang.

1. Introduction

Xinjiang is one of the five major pastoral areas in China, and animal husbandry has always been one of the pillar industries of local economic development in the Xinjiang region of China. Due to the specific conditions of multi-ethnic settlement and Muslim population in Xinjiang, the mutton sheep industry has always had an important and irreplaceable position in animal husbandry production. Mutton is one of the most important consumer meat goods for local residents in Xinjiang. In recent years, with the gradual increase in mutton consumption demand, mutton prices have shown an obvious fluctuation trend. Therefore, it is of great practical significance to explore the influencing factors and action mechanism of mutton price fluctuation in Xinjiang. From the existing studies, many scholars have carried out studies concerning mutton price volatility from internal and external perspectives.
In regards to the internal influencing factors, the feeding and breeding costs caused by feed price, as the internal factors affecting the fluctuation of mutton price, have a certain impact on the fluctuation of mutton price. Scholars have undertaken considerable research from the perspective of feeding and breeding costs. In terms of feeding cost, Shi and Li [1] analyzed the fluctuation of mutton price in China from January 2006 to November 2010. Their research results show that the change in feeding mode and the increase in feeding cost, caused by the rise in agricultural and sideline product prices, are the main reasons for the rapid growth of mutton price. In terms of breeding costs, for example, Zhao [2] believed that the significant increase in mutton sheep breeding costs and the shortage of the mutton sheep breeding labor force are the main reasons for the rapid rise of mutton prices. Yu and Li [3] thought that the mutton price in China was mainly affected by some typical factors, such as the mutton price in the previous period and the production cost in the current period. Furthermore, the influence of different factors on the price of mutton was verified by using a multiple linear regression model. For example, Hao and Qian [4] believed that the general rise in prices and the continuous increase in production costs have played a key role in promoting the rise of mutton prices in China. In addition, Yu and Li [5] and Yang et al. [6] analyzed the influencing factors of mutton price fluctuation in Xinjiang. Their studies show that stock, feeding cost and demand are the main factors affecting mutton price in Xinjiang. Long and Liu [7] constructed a vector autoregressive (VAR) model based on Xinjiang mutton price, feed price, beef price, consumer price index and world mutton price, and analyzed the impact of different influencing factors on Xinjiang mutton price fluctuation by using the impulse response and empirical model decomposition (EMD) methods. Zhao et al. [8] found the decisive factors affecting the rise of mutton price in Xinjiang through econometric analysis. The results show that insufficient supply and high breeding costs are the leading factors affecting mutton price in Xinjiang. Similarly, Zhu et al. [9] pointed out that production cost is the key factor affecting the price fluctuation of mutton in Xinjiang.
For external factors, many scholars have carried out some investigations on the reasons or influencing factors of the continuous rise of mutton prices. According to the different characteristics of influencing factors, the existing studies divide the main factors of mutton price fluctuation into traditional factors and non-traditional factors. Traditional factors mainly include changes in supply and demand, market factors and the external impact on substitute prices [10]. For example, Yu and Li [3] believed that the price of mutton in China is mainly affected by the price of mutton in the previous period, the production cost in the current period, the output of mutton in the previous period, the population growth rate and the inflation rate in the previous period. Sun et al. [11] found that the reduction in output, the increase in demand and increased cost were the main direct factors for the continuous rise of mutton price. The main medium level indirect factors were low comparative benefit, extensive feeding management, low reproduction rate, high disease (death) rate, reduced stock, low slaughter rate and light carcass. The insufficient policy support, the low scale effect, the incomplete industrial chain, the imperfect breeding and extension system of improved varieties and the imperfect epidemic prevention and control system are the main deep-seated causes. Fan and Fu [12] found that the stock of mutton sheep, the carcass quality level of mutton sheep and the market price of mutton significantly affect the supply of the domestic mutton market. Ding and Xiao [13] revealed that the number of sheep and carcass weight have a significant impact on China’s mutton production, and the income level and mutton price have a significant impact on per capita mutton consumption. The continuous increase of mutton production and per capita mutton consumption will lead to the continuous rise of mutton price. Shen [14] found that the living standard, income level and population of urban and rural residents in the consumer market are the main factors affecting the fluctuation of mutton price. Therefore, the external traditional factors affecting the fluctuation of mutton price include mutton supply, mutton demand, the price of agricultural and sideline products, the price of substitutes and the number of people.
In addition to traditional factors, non-traditional factors mainly include international livestock product prices, future markets, energy prices, exchange rate factors, monetary policy and capital flows [15]. For example, Long and Liu [7] found that mutton price, beef price, feed price, the consumer price index and world mutton prices are the main factors affecting the fluctuation of mutton price in Xinjiang. Fan and Fu [12] found that per capita consumption and income level are important factors affecting the current per capita consumption of urban and rural residents. In addition, international mutton prices have a significant positive impact on domestic mutton exports. Zhu and Xu [16] showed that money supply is another external factor affecting the fluctuation of mutton price. Likewise, Zhang and Wang [10] believed that money supply is an important reason to affect the price fluctuation of livestock products in China. There are significant structural mutations in regards to the impact of international prices of similar products on beef prices and mutton prices. Chen and Xiao [17] thought that the per capita income level, mutton price and beef price have a significant impact on the mutton consumption of urban residents, and the poultry consumption price also has a significant impact on the mutton consumption of urban residents. Therefore, the non-traditional external factors affecting the fluctuation of mutton price include the international livestock product price, international crude oil price, exchange rate and money supply [18].
In summary, existing studies have analyzed the internal and external influencing factors of mutton price and have achieved considerable research results. However, the existing literature only focuses on some influencing factors of mutton price, and does not analyze the internal and external influencing factors of mutton price as a whole. The mechanism analysis used is also insufficient. Therefore, this paper analyzed the internal and external influencing factors of mutton price in Xinjiang and investigated the fluctuation mechanism of influencing factors related to mutton price by combining the data decomposition method and correlation analysis.
The remainder of the paper is organized as follows. Section 2 presents the analytical framework of the mechanism analysis. Section 3 describes the data sources and reports the corresponding empirical results. Conclusions will be drawn in Section 4.

2. Methodology

2.1. Analytical Framework

In order to analyze the impact mechanism of different influencing factors on mutton price, an integrated analytical framework combining data composition and correlation analysis is proposed. Accordingly, the general multi-scale analytical framework is illustrated in Figure 1.
As shown in Figure 1, in order to find the key driving factors of mutton price fluctuation, this paper mainly uses a combination of the data decomposition method and correlation analysis to explain the volatility of mutton price. This framework is divided into three main steps, as shown below.
(1)
Data decomposition. The main purpose of the original data decomposition was to generate relatively simple modes or components from complex original time series through the signal decomposition method. Accordingly, the ensemble empirical mode decomposition (EEMD) was used in this step.
(2)
Causality analysis. The main purpose of the causality analysis was to analyze the correlation factors of each component. Accordingly, the Granger causality test was used to explore the causal relationship between the mutton price factor series and components.
(3)
Key factor analysis. Principal component analysis (PCA) was used to obtain the key driving factors of mutton price fluctuation. Some details about the three methods in the above three steps are elaborated in Section 2.2, Section 2.3 and Section 2.4 below.

2.2. EEMD

The ensemble empirical mode decomposition (EEMD) is a method proposed by Wu and Huang [19] to solve the shortcomings of empirical mode decomposition (EMD). Both the EMD and EEMD methods are used in nonlinear and non-stationary time series. EEMD solves modal aliasing by adding white noise, which can be understood as the performance of regularization. EEMD mixes the original real-time series data and noise to formulate a new, closer to real-time series data, and adds some missing scales to help extract the real signal from the data.
The specific process of EEMD is as follows:
  • Set ensemble quantity and noise information.
  • Add white noise to original data: x i ( t ) = x ( t ) + ε i ( t )
  • EMD decomposition method is used to decompose the data with white noise into multiple intrinsic mode function (IMF) components.
  • Repeat Steps 2 and 3 with different white noises.
  • Calculate the average value of each IMF component after K times.
  • Calculate the original time series based on IMF and residuals, i.e.,
    x ( t ) = j = 1 K c j ( t ) + r K ( t )

2.3. Granger Causality Test

The Granger causality test [20] is employed to capture the causal relationship between the decomposed components and factor series of mutton price. Usually, the Granger causality running from the stationary time series yt to the stationary time series xt can be defined by
P r ( x t | I t 1 ) = P r ( x t | I t 1 Y t n n ) ( t = 1 , 2 , , T )
where P r ( x t | I t 1 ) is the conditional probability distribution of xt based on the bivariate information data I t 1 = { X t m m , Y t n n } , where X t m m = { x t m , , x t 1 } and Y t n n = { y t n , , y t 1 } consisting of a m-length lag vector of xt and a n-length lag vector of yt. If Equation (2) is statistically rejected, it can be proved that the series yt can help predict the series xt. That is, there is a causal relationship between yt and xt, i.e., yt Granger cause xt strictly [21].

2.4. PCA

Principal components analysis (PCA; also called the Karhunen-Loeve or K-L, method) searches for the k n-dimensional orthogonal vectors that can be best used to represent the data, where k n . The original data are thus projected onto a much smaller set, resulting in a dimensionality reduction. An advantage of PCA is that it can often reveal relationships that were not previously suspected and thereby many unordinary results can be explained. For more details about PCA, refer to Reference [22].

3. Empirical Analysis

In order to verify the effectiveness of the proposed multi-scale analytical framework based on univariate multi-scale decomposition, this section uses the monthly mutton price data from the Xinjiang region of China as the sample data. In this part, data descriptions are introduced in Section 3.1, and the data decomposition and mechanism analysis are investigated in Section 3.2.

3.1. Data Descriptions

The experimental data mainly uses the monthly data of Xinjiang mutton price, as illustrated in Figure 2. The main reasons for selecting the Xinjiang region are two-fold. On the one hand, Xinjiang is one of the five major pastoral areas in China, and the mutton sheep industry is one of the pillar industries of local economic development in Xinjiang. On the other hand, as an important industry, many prices and related data about mutton sheep are available from the local government in Xinjiang. In terms of the related literature, influencing factors of mutton price fluctuation in Xinjiang are illustrated in Figure 3.
As can be seen from Figure 3, we can divide the existing influencing factors into two categories, including internal factors (breeding cost factors and feeding price factors) and external factors (traditional factors and non-traditional factors). Among them, breeding cost factors include material and service cost and labor cost, and feeding cost includes corn price, soybean meal price and wheat bran price. Traditional factors include the price of agricultural and sideline products, the price of substitutes and the regional economy. Among them, the price of agricultural and sideline products includes the prices of special flour, corn flour, rapeseed oil, cotton seed oil, japonica rice, egg and soybean blended oil. The price of substitutes includes the prices of beef, pork, chicken and fish. Regional economic indicators include public policy revenue and CPI. Non-traditional factors include exchange rates, international energy price and international livestock product price. The exchange rate includes the US dollar exchange rate and euro exchange rate. The international energy price includes the spot price of WTI crude oil. The international price of livestock products includes the world prices of mutton and beef.
According to the availability of data, this section uses 12 internal and external factors (local public revenue, WTI crude oil spot price, world mutton price, world beef price, cotton seed oil price, beef price, chicken price, egg price, fish price, pork price, material and service costs and labor cost) to analyze the fluctuation of mutton price, as shown in Table 1. The data range selected in this study covers the period from January 2010 to December 2018, the data frequency is monthly data and the proportion of the training set and test set is 8:2. The data were collected and sorted out using the national compilation of cost-benefit data of agricultural products from 2010 to 2018, China Animal Husbandry Information Network, China Animal Husbandry 8 Statistical Yearbook (2010–2018) and the Wind database (http://www.wind.com.cn). Accordingly, a descriptive statistical analysis of mutton price and its 12 influencing factor indicators is shown in Table 1.

3.2. Experimental Analysis

EEMD is an adaptive learning data decomposition algorithm based on white noise. Its decomposition result depends on the inherent characteristics of the data. These decomposition components contain different factor information. Therefore, this section mainly uses the correlation analysis between the components decomposed by EEMD and various influencing factors. The IMF component fluctuation after decomposition is shown in Figure 4.
From Figure 4, it is easy to find that EEMD decomposes mutton price series into six components, namely IMF1–IMF6. For these six decomposed components and 12 influencing factors, a Granger causality test was conducted to verify the correlation relationship between price components and related influencing factors, and the Granger causality test results of IMF1-IMF6 are listed in Table 2, Table 3, Table 4, Table 5, Table 6 and Table 7.
It can be seen from the results in Table 2, Table 3, Table 4, Table 5, Table 6 and Table 7 that the influencing factors with a p value lower than 0.1 are the related driving factors of each component. Therefore, the correlation factors of IMF1 are the world beef price and the world mutton price, the correlation factors of IMF2 are the local public revenue, cotton seed oil price, egg price and fish price in Xinjiang, the correlation factors of IMF3 are cotton seed oil price, beef price and labor cost, the correlation factors of IMF4 are the local public financial revenue, cotton seed oil price, beef price, fish price and labor cost in Xinjiang, the correlation factors of IMF5 are the WTI crude oil spot price, world beef price, cotton seed oil price, beef price, chicken price, pork price, material and service cost and labor cost, and the correlation factors of IMF6 are the WTI crude oil spot price, world beef price, pork price, material and service cost and labor cost. At the same time, it can be seen from the above summary results that the world beef price affects IMF1, IMF5 and IMF6, the cotton seed oil price affects IMF2, IMF3, IMF4 and IMF5, the beef price affects IMF3, IMF4 and IMF5, and the labor cost affects IMF3, IMF4 and IMF6. Therefore, the world beef price, cottonseed oil price, beef price and labor cost have a great impact on the fluctuation of mutton price in the Xinjiang region of China.
As the PCA method is mainly used to deal with multivariate and multidimensional factor analysis, it depends on eigen decomposition, the positive semi-definite matrix and the matrix singular value decomposition. Therefore, after screening the correlation factors of each component using the Granger causality test, the PCA method is used to extract the key driving factors of each component. The corresponding results are shown in Table 8, Table 9, Table 10, Table 11, Table 12 and Table 13.
From Table 8, Table 9, Table 10, Table 11, Table 12 and Table 13, it can be seen that a key driver of IMF1 is the world mutton price, and the variance contribution rate is 0.3265. The key driver of IMF2 is fish price, with a variance contribution rate of 0.3774. The key driver of IMF3 is beef price, with a variance contribution rate of 0.5475. The key driver of IMF4 is beef price, with a variance contribution rate of 0.4602. The key driver of IMF5 is the costs of materials and services, with a variance contribution rate of 0.4714. The key driver of IMF6 is labor cost, and the variance contribution rate is 0.4778. Therefore, the main factors affecting the price of mutton are the world price of livestock products, the price of substitutes and the breeding cost of mutton sheep. Subsequently, the impact relationship between IMF components and their key drivers will be analyzed in detail, as shown in Figure 5, Figure 6, Figure 7, Figure 8, Figure 9 and Figure 10.
As can be seen from Figure 5, IMF1 has a relatively similar fluctuation trend as the world mutton price on the whole. Since IMF1 is a high-frequency component of mutton price, the fluctuation frequency of IMF1 is large. Even if the fluctuation frequency of IMF1 is large and the fluctuation frequency of world mutton price is small, the overall fluctuation trend of IMF1 and mutton price was found to be the same from the analysis of their peak and valley changes. Therefore, it can be seen from the trend chart of IMF1 and world mutton price that the world mutton price has a positive impact on mutton price in the Xinjiang region of China.
From Figure 6, IMF2 and fish prices generally have an opposite fluctuation trend. From the analysis of the peak and valley changes of the two variables, it was found that the overall fluctuation trend of the two variables always lags by two–four months. In addition, Figure 3 shows that IMF2 has an opposite trend relative to fish price fluctuation on the whole. Therefore, from the trend chart of IMF2 and fish price, fish price negatively affects mutton price in the Xinjiang region of China.
As can be seen from Figure 7, IMF3 and beef prices generally have a relatively similar fluctuation trend. From the analysis of the peak and valley changes of the two variables, it was found that the overall fluctuation trend of the two variables was consistent. Therefore, from the trend chart of IMF3 and beef price, beef price of substitutes had a positive impact on mutton price in the Xinjiang region of China.
From Figure 8, it is easy to see that IMF4 and beef prices have a relatively similar fluctuation trend on the whole. From the analysis of the peak and valley changes of the two variables, it was found that the overall fluctuation trend of the two variables was the same. Therefore, from the trend chart of IMF4 and beef price, the beef price of substitutes has a positive impact on mutton price in the Xinjiang region of China.
From Figure 9, the overall material and service costs showed a fluctuating trend of first rising, then falling and then rising, and finally reaching the peak from January to December 2013. Similarly, the fluctuation trend of IMF5 first decreases, then increases and then decreases. While the selected long-term factors have advantages in obtaining strong fluctuation signals, IMF5 is a low-frequency component, so the interpretation ability of low-frequency, moderate fluctuation signals is limited. Therefore, Figure 6 cannot reflect the impact of material and service costs on IMF5.
Similar to IMF5, the labor cost as a whole showed a fluctuating trend of first rising, then falling, and then rising slightly, and reaching the peak from January to November 2013 from Figure 10. Since IMF6 is the residual after decomposition, it shows an upward fluctuation trend on the whole. Therefore, the interpretation ability of the selected long-term factor for the low-frequency moderate fluctuation signal was limited, so that Figure 10 cannot reflect the impact of labor cost on IMF6.

4. Conclusions

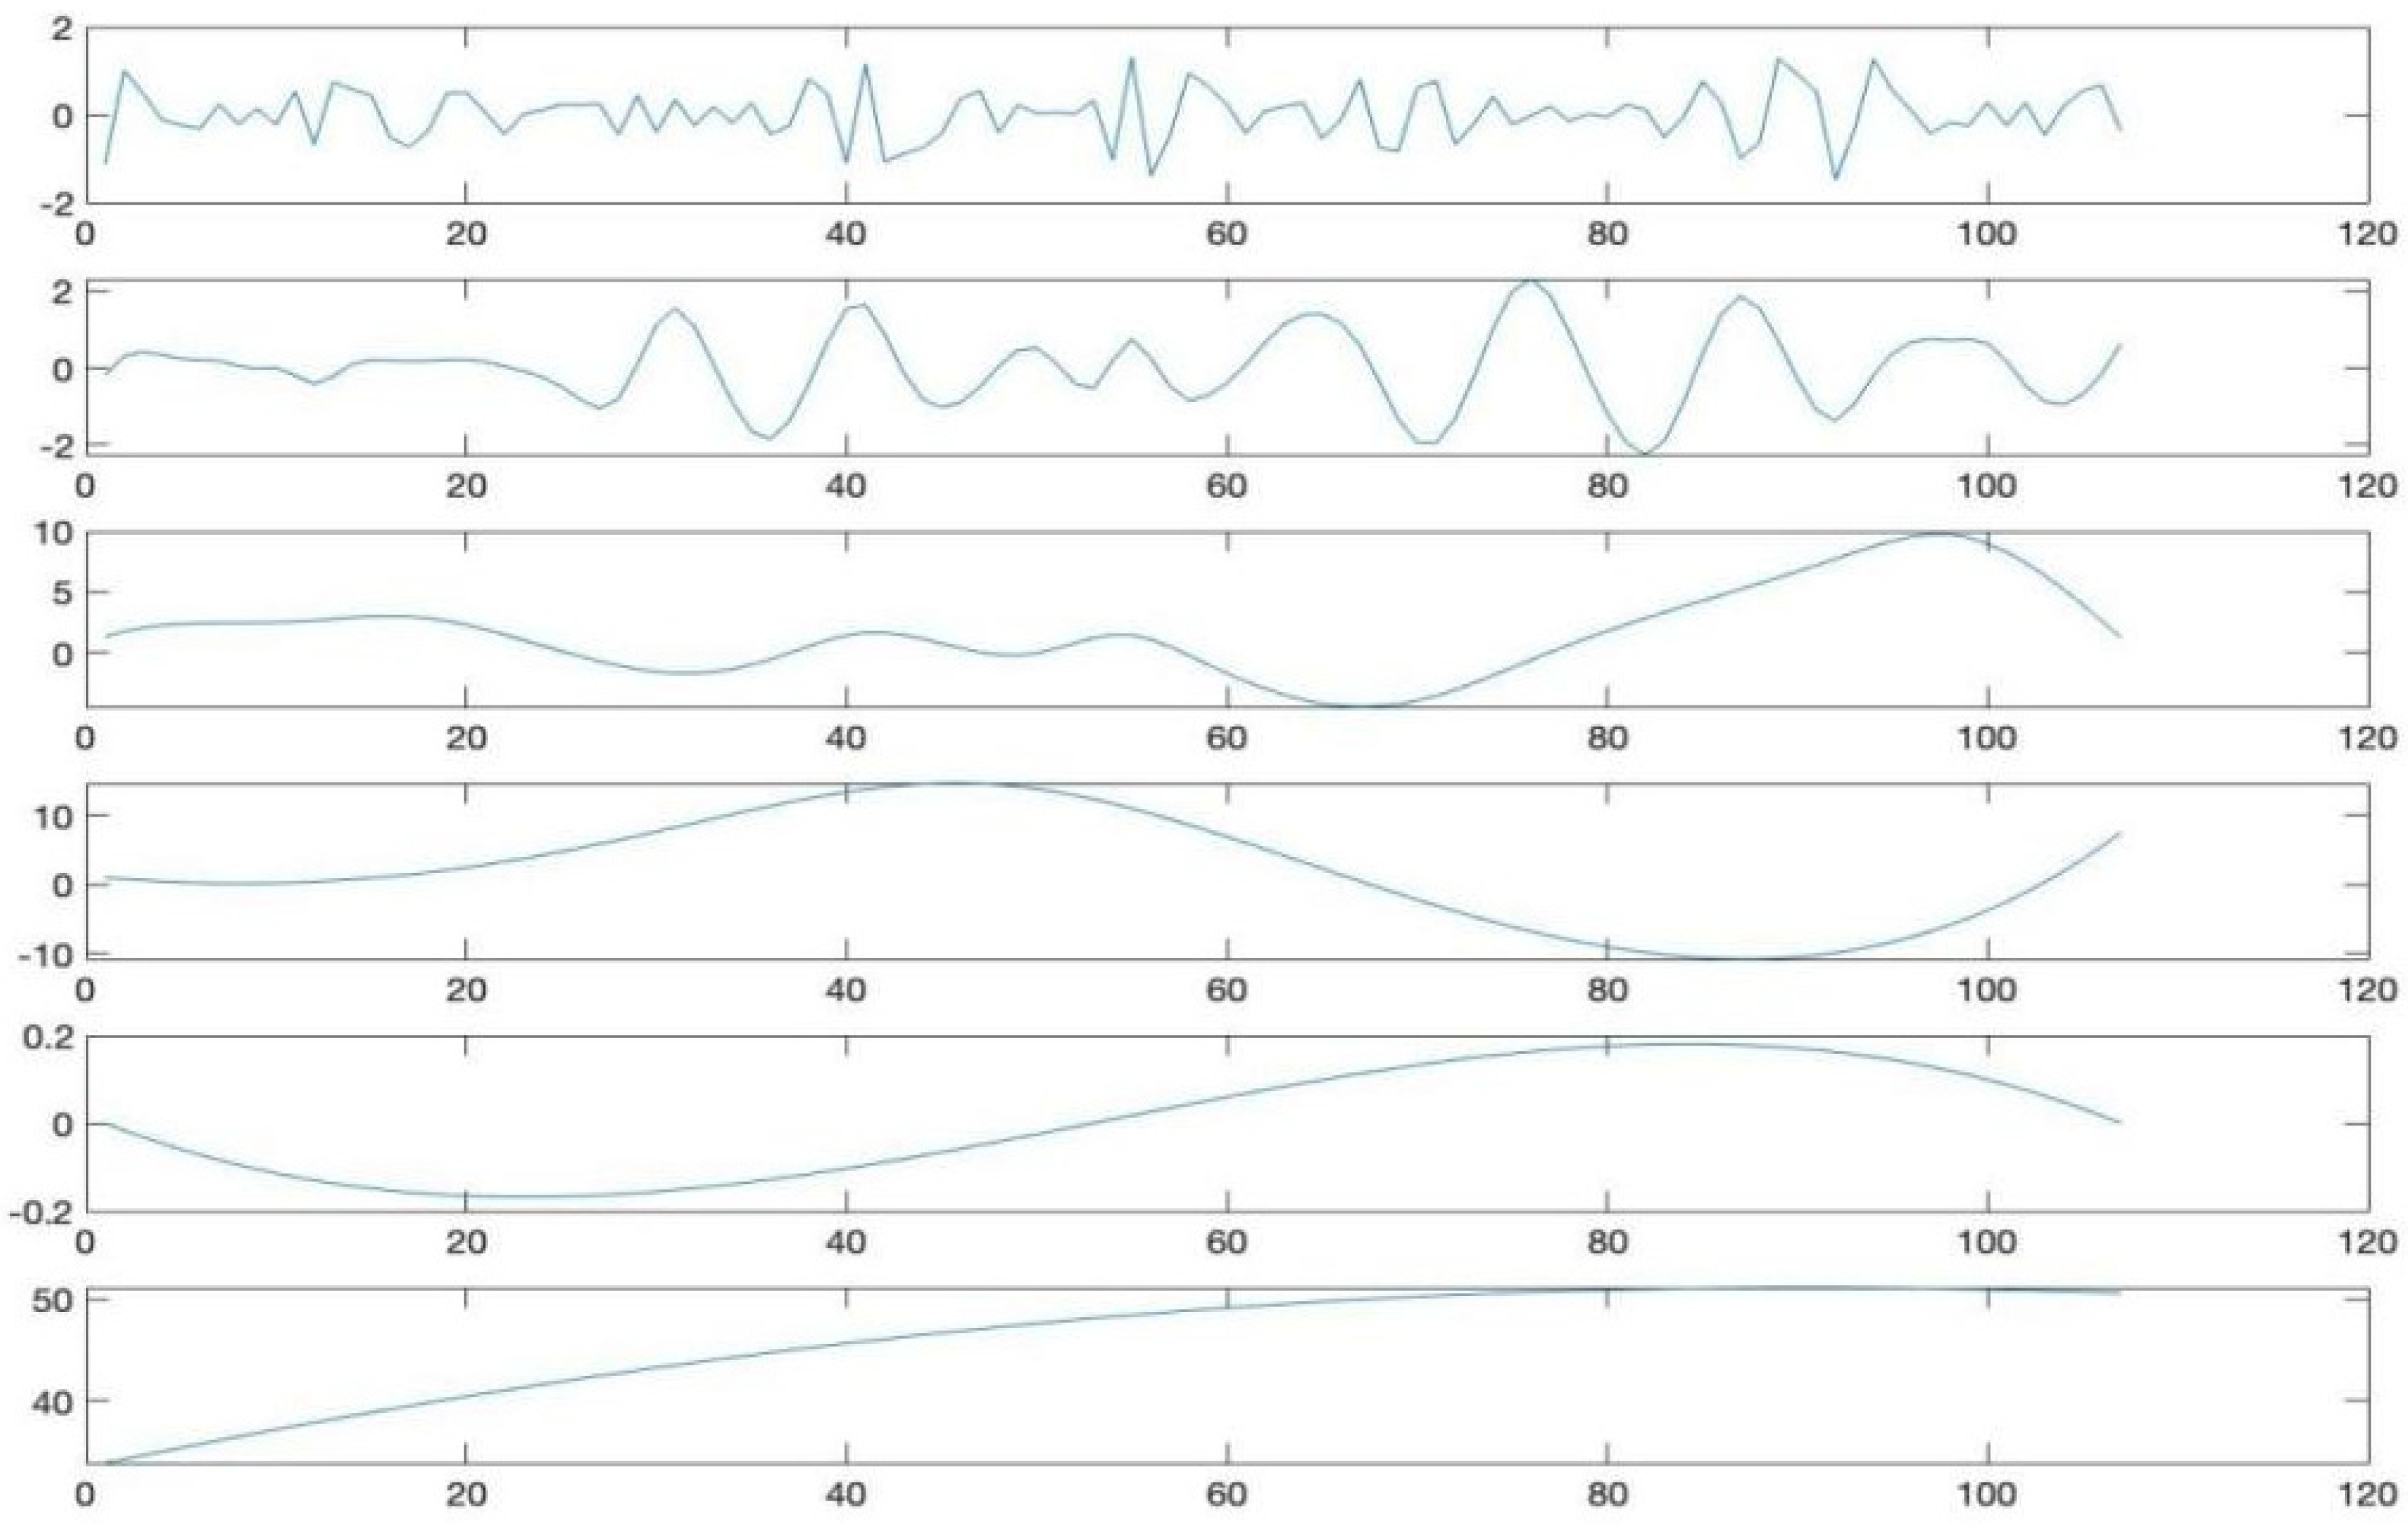
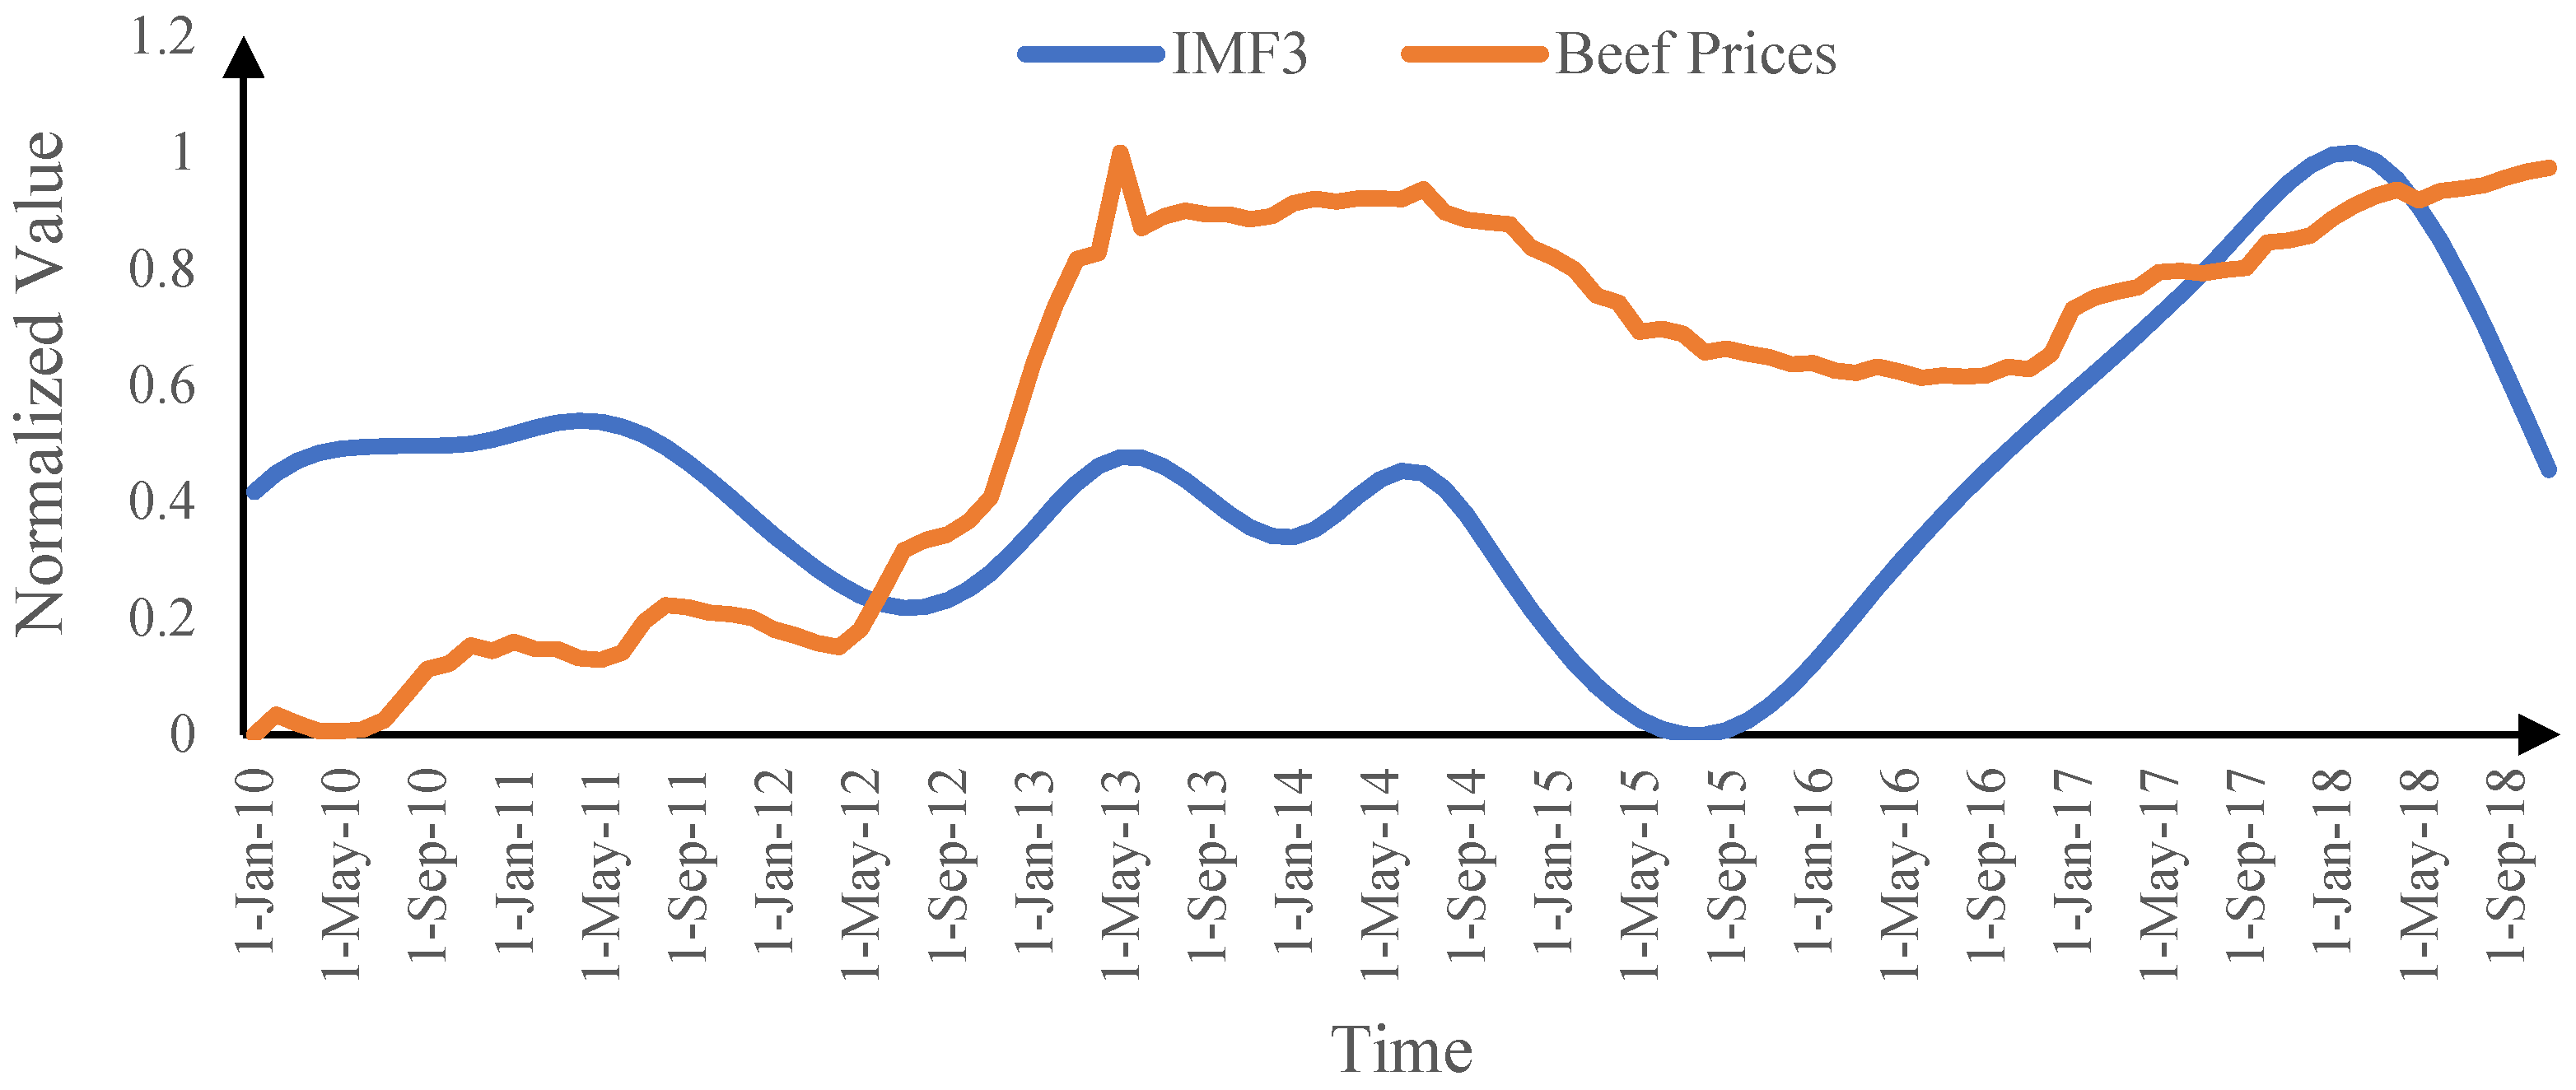
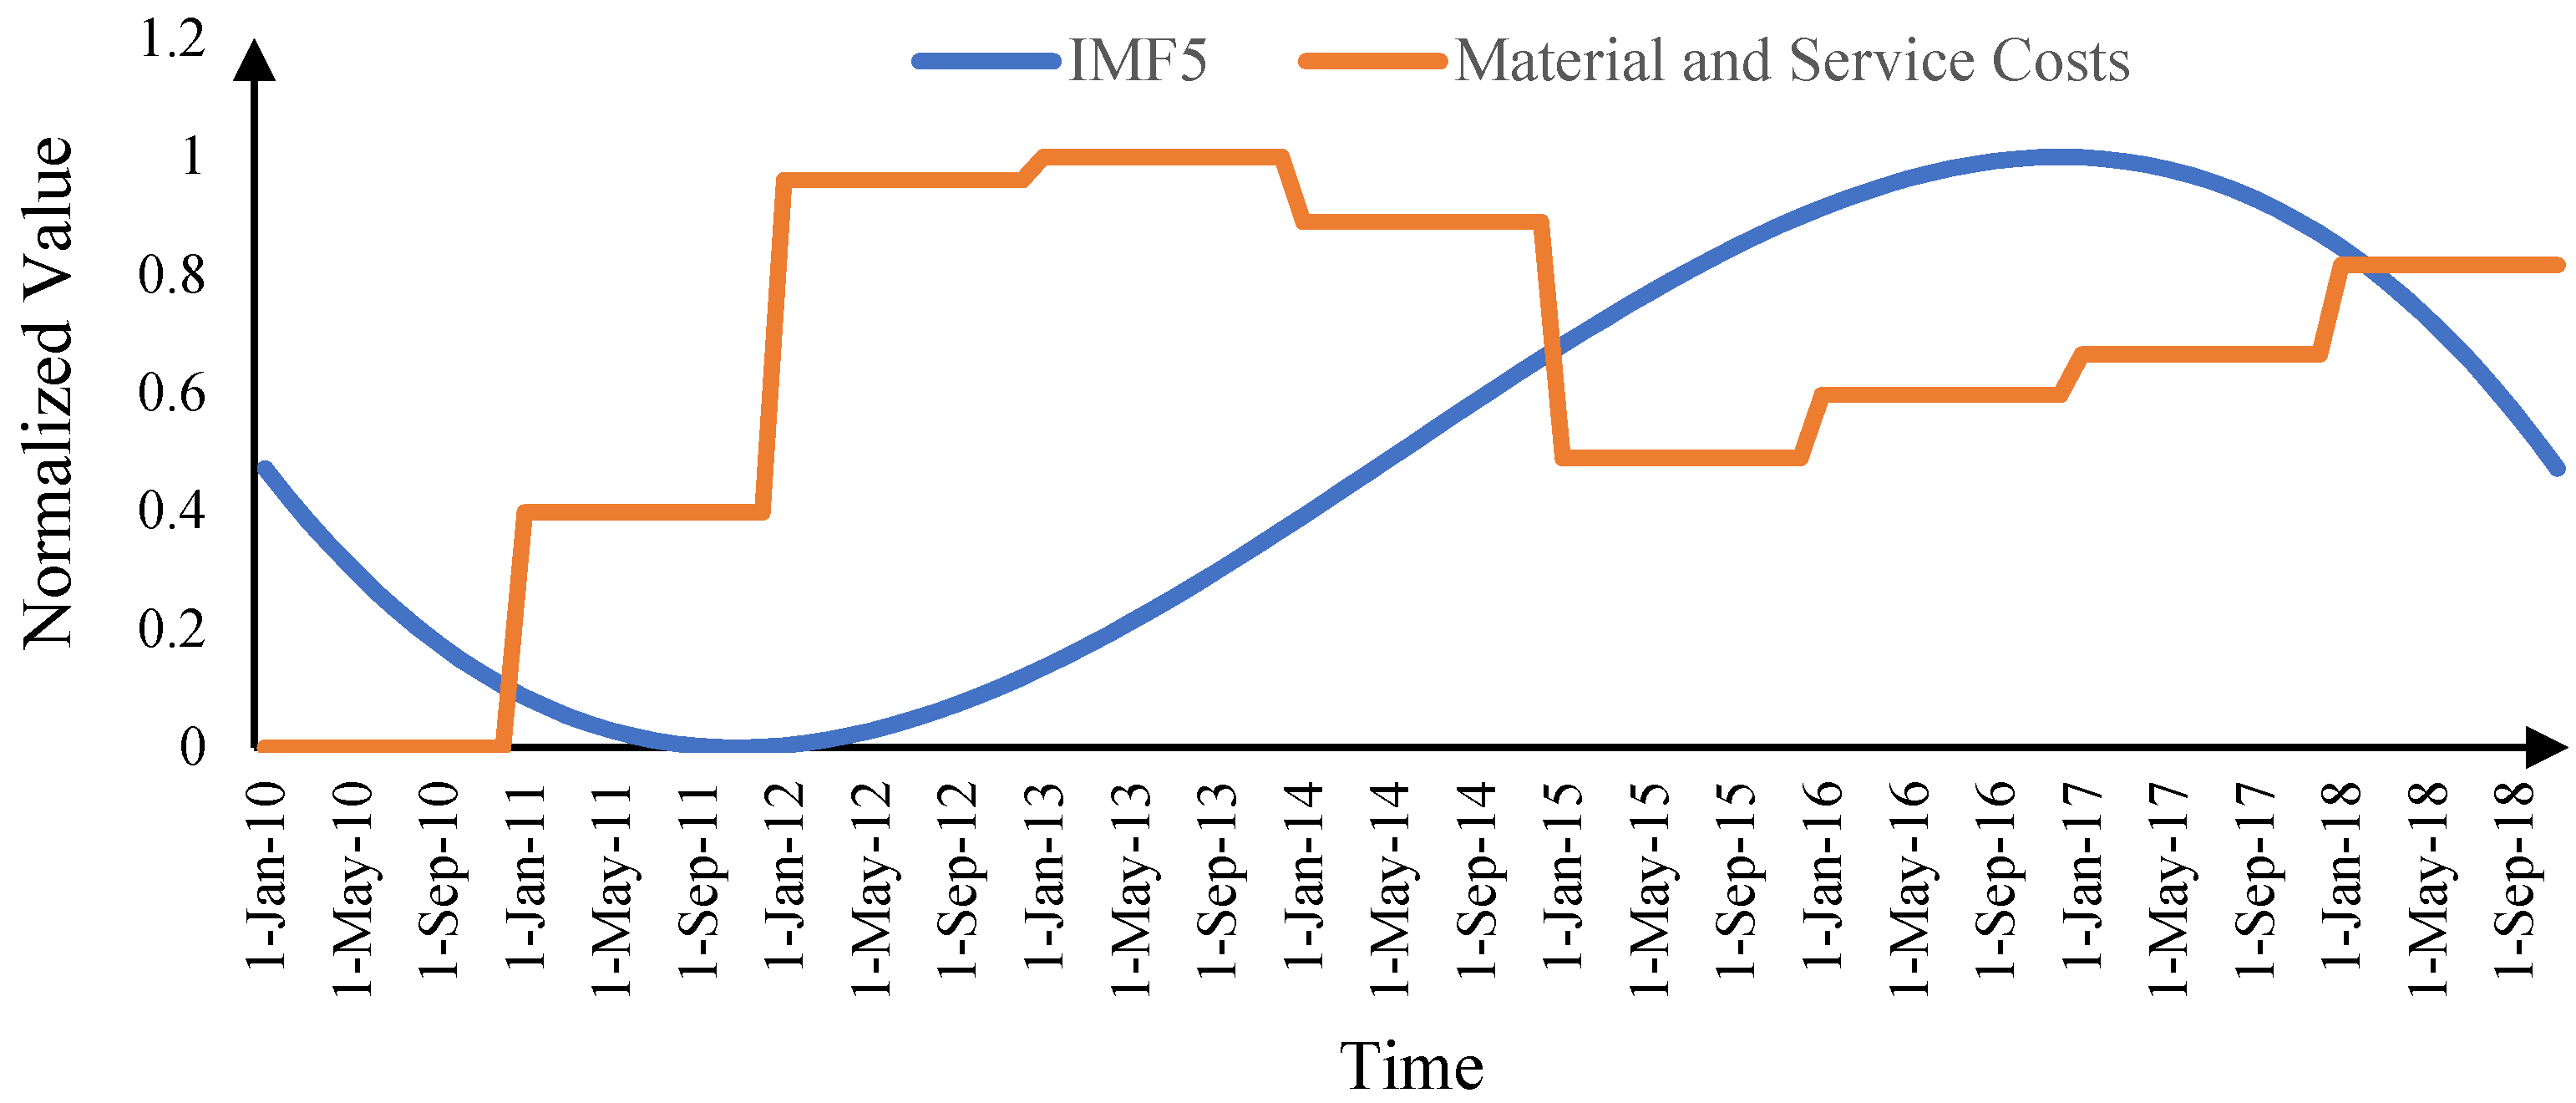
By analyzing the relationship between different components and multiple influencing factors, this paper explained the fluctuation characteristics of mutton price in Xinjiang from a multi-scale perspective. Based on the multiple factors affecting the fluctuation of mutton price, this paper analyzed the price fluctuation of mutton sheep through the combination of data decomposition and correlation analysis. Three main conclusions can be drawn.
(1)
Due to the fact that the world beef price, cottonseed oil price, beef price and labor cost have a great impact on the price component of mutton, changes in these indicators should be focused on in the future prediction of mutton price.
(2)
The main driving factors affecting mutton price fluctuation include the world price of livestock products, the price of substitutes and the breeding cost of mutton sheep.
(3)
World mutton prices in international livestock products and beef prices of substitutes have a positive impact on mutton price in Xinjiang, while fish prices of substitutes have a negative impact on mutton prices in Xinjiang. Interestingly, material and service costs and labor costs did not have a significant impact on mutton prices in Xinjiang.
From the main conclusions listed above, it can be found that the proposed univariate multi-scale analytical framework provides a feasible solution to illustrate the fluctuation mechanism of mutton price in the Xinjiang region of China. At the same time, these research findings can provide some policy guidelines and provide support to local government to adjust the mutton price fluctuation if these key driving factors are focused on in time.
However, how to combine the relevant mechanism analysis into an appropriate prediction model to improve the prediction accuracy of mutton price is a future research direction. In addition, among these influencing factors, whether they are long-term or short-term needs, further study is needed in the future.

Author Contributions

Writing—original draft, Y.Y.; Writing—review & editing, J.X. and L.Y. All authors have read and agreed to the published version of the manuscript.

Funding

This research received no external funding.

Conflicts of Interest

The authors declare no conflict of interest.

References

  1. Shi, Y.; Li, B.L. Analysis on the change trend and influence of mutton price in China-Reflections on the fluctuation of mutton price from 2006 to 2010. Price Theory Pract. 2011, 1, 60–61. [Google Scholar]
  2. Zhao, Y.Z. Vigorously developing modern mutton sheep industry is the fundamental way to stabilize the rational return of mutton market price. Mod. Anim. Husb. Vet. 2013, 3, 1–2. [Google Scholar]
  3. Yu, H.; Li, B.L. An empirical study on the influencing factors of mutton price fluctuation in China. Price Theory Pract. 2013, 2, 69–70. [Google Scholar]
  4. Hao, Y.H.; Qian, G.X. Analysis on the reasons for the rise of mutton price in China at the present stage. Agric. Outlook 2011, 7, 16–21. [Google Scholar]
  5. Yu, H.; Li, B.L. Reasons and countermeasures for the rise of mutton price in Xinjiang. China Anim. Husb. 2012, 22, 51–53. [Google Scholar]
  6. Yang, K.H.; Liu, N.N.; Wang, X.B.; Li, J.; Su, Y.L.; Zhang, Y.K. Influencing factors analysis of production cost and mutton price in Xinjiang. Herbiv. Livest. 2013, 2, 16–20. [Google Scholar]
  7. Long, T.; Liu, W.Z. Influencing factors for mutton price fluctuation in Xinjinag based on VAR model. Guizhou Agric. Sci. 2014, 42, 262–266. [Google Scholar]
  8. Zhao, N.; Xue, H.Y.; Shang, H.C. Empirical analysis on influencing factors of mutton price rise in Xinjiang. J. Qingdao Agric. Univ. (Soc. Sci. Ed.) 2014, 1, 30–33. [Google Scholar]
  9. Zhu, Z.N.; Zhu, M.L.; Gan, C.C. Empirical analysis on influencing factors of mutton price fluctuation based on the research data of Xinjiang mutton market. Chin. J. Anim. Husb. 2014, 50, 25–29, 34. [Google Scholar]
  10. Zhang, L.; Wang, Q. Analysis on influencing factors of price fluctuation of livestock products in China-Taking four main meat products as an example. West. Financ. 2019, 6, 8. [Google Scholar]
  11. Sun, S.M.; Feng, Y.; Zhang, H.F. Analysis on influencing factors of mutton price based on ISM Model-A case study of Shandong province. Agric. Technol. Econ. 2014, 8, 53–59. [Google Scholar]
  12. Fan, H.L.; Fu, W.G. Analysis of supply and demand changes of Chinese mutton market based on local equilibrium model. Zhejiang Agric. J. 2020, 32, 1123–1132. [Google Scholar]
  13. Ding, L.N.; Xiao, H.F. Influencing factors and future trend of mutton supply and demand in China-Analysis and prediction based on local equilibrium model. Agric. Technol. Econ. 2014, 9, 22–31. [Google Scholar]
  14. Shen, W.T. Analysis on Influencing Factors of Mutton Price Fluctuation in Inner Mongolia. Master’s Thesis, Inner Mongolia Agricultural University, Inner Mongolia, China, 2016. [Google Scholar]
  15. Zhai, X.L.; Xu, X.G.; Tan, Z.X.; Zhang, Z.X. The formation mechanism of the concept of agricultural financialization and its impact on the price of agricultural products. China Rural. Econ. 2013, 2, 83–95. [Google Scholar]
  16. Zhu, H.H.; Xu, G.Y. Study on production efficiency of mutton sheep and its influencing factors-Analysis of Xinjiang mutton sheep productivity based on DEA-SFA method. Price Theory Pract. 2019, 9, 63–66. [Google Scholar]
  17. Chen, T.; Xiao, H.F. Study on mutton consumption and influencing factors in China. Ind. Perspect. 2016, 52, 15–20. [Google Scholar]
  18. Du, Y.H. Influencing Factors and Policy Analysis of Mutton Price in Beijing. Master’s Thesis, Beijing Forestry University, Beijing, China, 2017. [Google Scholar]
  19. Wu, Z.; Huang, N.E. Ensemble empirical mode decomposition: A noise-assisted data analysis method. Adv. Adapt. Data Anal. 2009, 1, 1–41. [Google Scholar] [CrossRef]
  20. Granger, C.W.J. Investigating causal relations by econometric models and cross-spectral methods. Econometrica 1969, 37, 424–438. [Google Scholar] [CrossRef]
  21. Yu, L.; Zhao, Y.Q.; Tang, L.; Yang, Z.B. Online big data-driven oil consumption forecasting with Google trends. Int. J. Forecast. 2019, 35, 213–223. [Google Scholar] [CrossRef]
  22. Golabadi, M.; Arzani, A.; Maibody, S.M. Assessment of drought tolerance in segregating populations in durum wheat. Afr. J. Agric. Res. 2006, 1, 162–171. [Google Scholar]
Figure 1. Multi-scale analytical framework for the fluctuation mechanism of mutton price.
Sustainability 14 13482 g001
Figure 2. Price trend of mutton sheep in the Xinjiang region of China.
Sustainability 14 13482 g002
Figure 3. Influencing factors of mutton price fluctuation in Xinjiang.
Sustainability 14 13482 g003
Figure 4. Component fluctuation diagram after EEMD decomposition.
Sustainability 14 13482 g004
Figure 5. Trend chart of IMF1 and its key drivers.
Sustainability 14 13482 g005
Figure 6. Trend chart of IMF2 and its key drivers.
Sustainability 14 13482 g006
Figure 7. Trend chart of IMF3 and its key drivers.
Sustainability 14 13482 g007
Figure 8. Trend chart of IMF4 and its key drivers.
Sustainability 14 13482 g008
Figure 9. Trend chart of IMF5 and its key drivers.
Sustainability 14 13482 g009
Figure 10. Trend chart of IMF6 and its key drivers.
Sustainability 14 13482 g010
Table 1. Descriptive statistics of mutton price and its 12 influencing factors.
Influencing FactorMeanStdevMaxMinRangeSkewKurtosis
Mutton price50.037.6164.0034.9029.100.16−1.18
Local public revenue94.3542.13244.9525.14219.810.920.81
WTI crude oil spot price81.7926.39124.5431.9392.62−0.08−1.47
World mutton price5.710.677.004.412.59−0.24−0.82
World beef price4.230.526.173.023.151.153.48
Cotton seed oil price7.501.8110.005.304.700.23−0.79
Beef price52.0210.2365.0033.1031.90−0.57−1.23
Chicken price17.033.3522.0012.0010.00−0.380.87
Egg price8.892.0312.005.836.170.25−0.56
Fish price12.902.5916.0010.006.000.20−0.90
Pork price27.205.6633.0018.0015.00−0.78−0.15
Material and service costs955.46195.361154.84542.91611.93−1.190.97
Labor cost176.8146.53265.84123.55142.291.040.28
Table 2. Analytical results of related factors of IMF1 based on the Granger causality test.
Influencing FactorF Valuep Value
Local public revenue0.7750.592
WTI crude oil spot price0.7000.650
World mutton price2.4710.030
World beef price1.8710.095
Cotton seed oil price0.6140.719
Beef price0.3610.902
Chicken price0.9520.463
Egg price0.8360.545
Fish price0.3910.883
Pork price0.9100.491
Material and service costs0.5200.792
Labor cost0.7620.602
Table 3. Analytical results of related factors of IMF2 based on the Granger causality test.
Influencing FactorF Valuep Value
Local public revenue2.0020.074
WTI crude oil spot price1.1030.367
World mutton price0.9450.468
World beef price1.2540.287
Cotton seed oil price1.8920.091
Beef price0.7710.595
Chicken price0.2900.940
Egg price1.9100.088
Fish price3.8650.002
Pork price1.1650.332
Material and service costs0.4240.861
Labor cost1.3650.238
Table 4. Analytical results of related factors of IMF3 based on the Granger causality test.
Influencing FactorF Valuep Value
Local public revenue1.0120.415
WTI crude oil spot price0.7480.589
World mutton price1.5200.191
World beef price0.8400.525
Cotton seed oil price2.0430.080
Beef price2.4820.037
Chicken price0.3570.877
Egg price1.6370.158
Fish price0.9570.448
Pork price0.8360.528
Material and service costs1.2210.306
Labor cost3.1750.011
Table 5. Analytical results of related factors of IMF4 based on the Granger causality test.
Influencing FactorF Valuep Value
Local public revenue3.5090.006
WTI crude oil spot price1.2150.308
World mutton price0.5570.732
World beef price0.4230.832
Cotton seed oil price2.9310.017
Beef price2.7540.023
Chicken price0.9130.477
Egg price1.8390.113
Fish price3.9110.003
Pork price0.8030.551
Material and service costs0.5930.706
Labor cost11.5490.000
Table 6. Analytical results of related factors of IMF5 based on the Granger causality test.
Influencing FactorF Valuep Value
Local public revenue2.7210.102
WTI crude oil spot price13.7740.000
World mutton price0.3640.547
World beef price37.3820.000
Cotton seed oil price3.4800.065
Beef price21.7850.000
Chicken price8.2240.005
Egg price1.9850.162
Fish price1.6380.204
Pork price134.5240.000
Material and service costs37.9430.000
Labor cost21.7800.000
Table 7. Analytical results of related factors of IMF6 based on the Granger causality test.
Influencing FactorF Valuep Value
Local public revenue1.4790.227
WTI crude oil spot price23.8500.000
World mutton price2.3670.127
World beef price20.7340.000
Cotton seed oil price1.8330.179
Beef price1.7290.192
Chicken price0.2460.621
Egg price0.2260.636
Fish price0.1090.744
Pork price114.7530.000
Material and service costs25.2870.000
Labor cost19.3990.000
Table 8. PCA results of IMF1.
Related FactorsVariance Contribution Rate
World mutton price0.3265
World beef price0.3264
Table 9. PCA results of IMF2.
Related FactorsVariance Contribution Rate
Local public revenue0.3377
Cotton seed oil price0.3404
Egg price0.3130
Fish price0.3774
Table 10. PCA results of IMF3.
Related FactorsVariance Contribution Rate
Cotton seed oil price0.4660
Beef price0.5475
Labor cost0.4834
Table 11. PCA results of IMF4.
Related FactorsVariance Contribution Rate
Local public revenue0.3267
Cotton seed oil price0.4228
Beef price0.4602
Fish price0.3846
Labor cost0.3506
Table 12. PCA results of IMF5.
Related FactorsVariance Contribution Rate
WTI crude oil spot price0.4673
World beef price0.3307
Cotton seed oil price0.4668
Beef price0.4386
Chicken price0.4403
Pork price0.3023
Material and service costs0.4714
Labor cost0.3233
Table 13. PCA results of IMF6.
Related FactorsVariance Contribution Rate
WTI crude oil spot price0.3941
World beef price0.3929
Pork price0.3489
Material and service costs0.4210
Labor cost0.4778
Publisher’s Note: MDPI stays neutral with regard to jurisdictional claims in published maps and institutional affiliations.

