Analytical Methods for Physicochemical Characterization and Toxicity Assessment of Atmospheric Particulate Matter: A Review
Abstract
1. Introduction
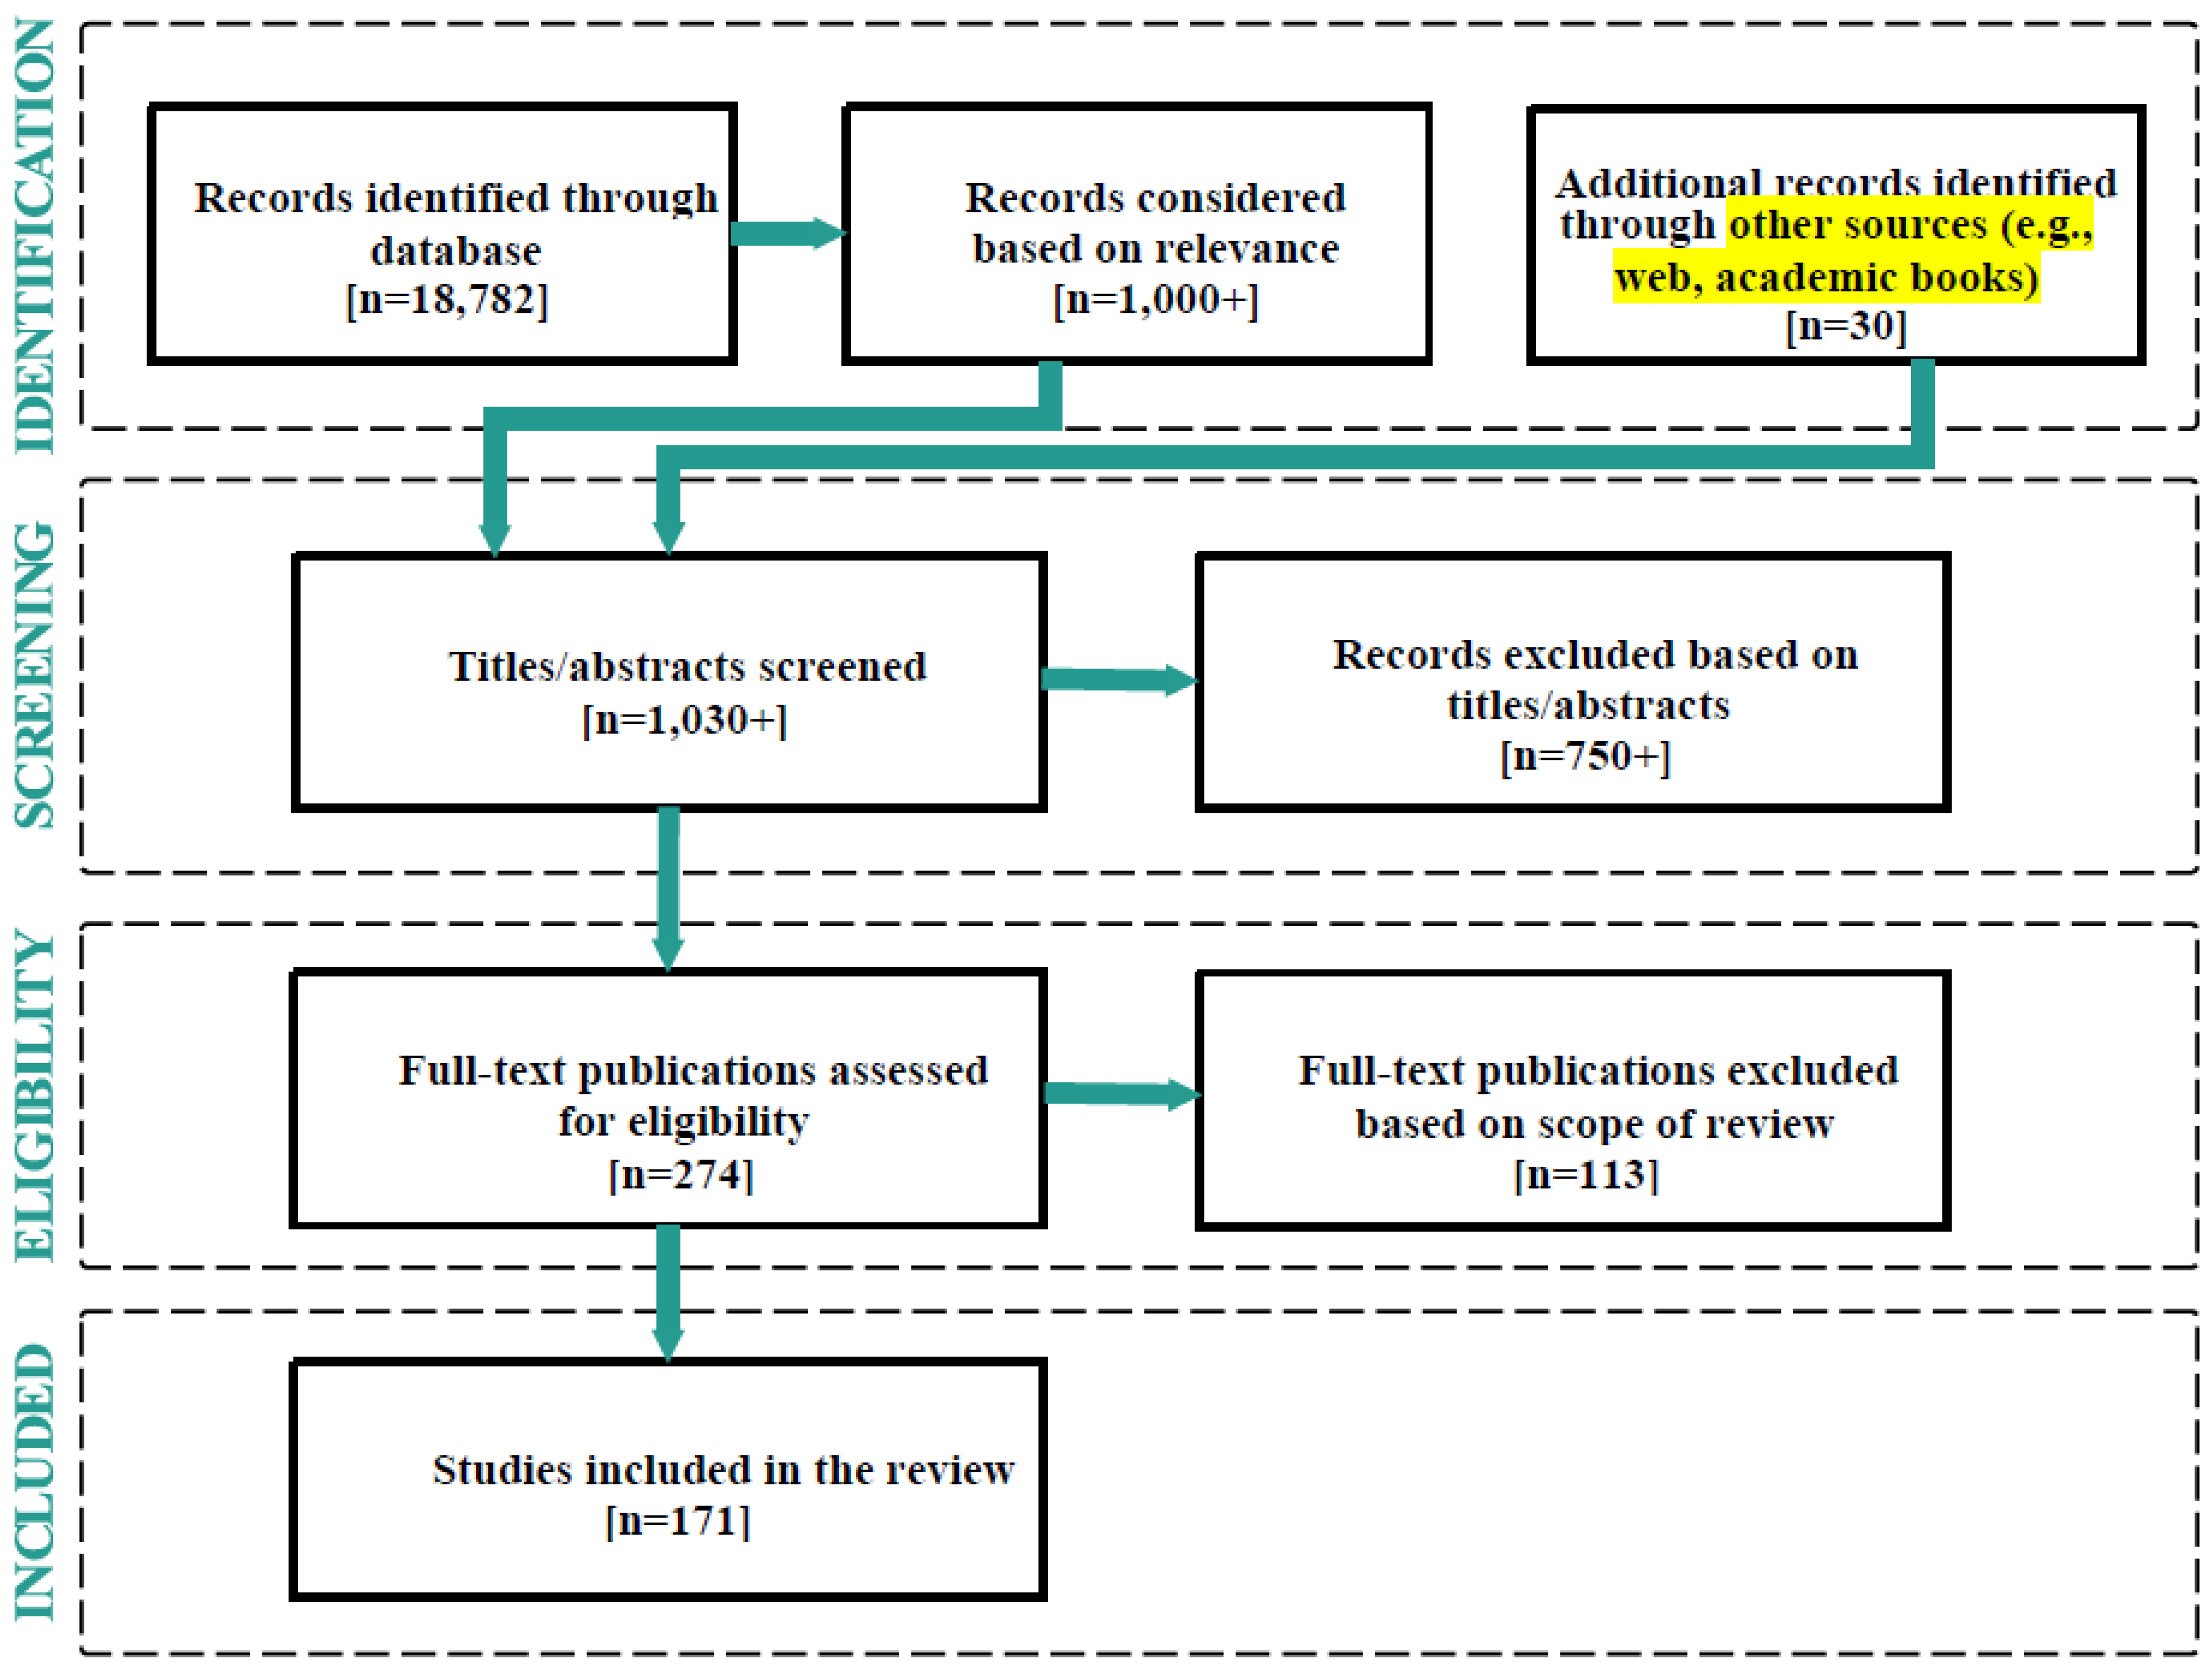
2. Methodology
3. Physicochemical Characteristics of PM as Determinants of Toxicity
3.1. Cytotoxic and Inflammatory Potential of Different Size Fractions of PM
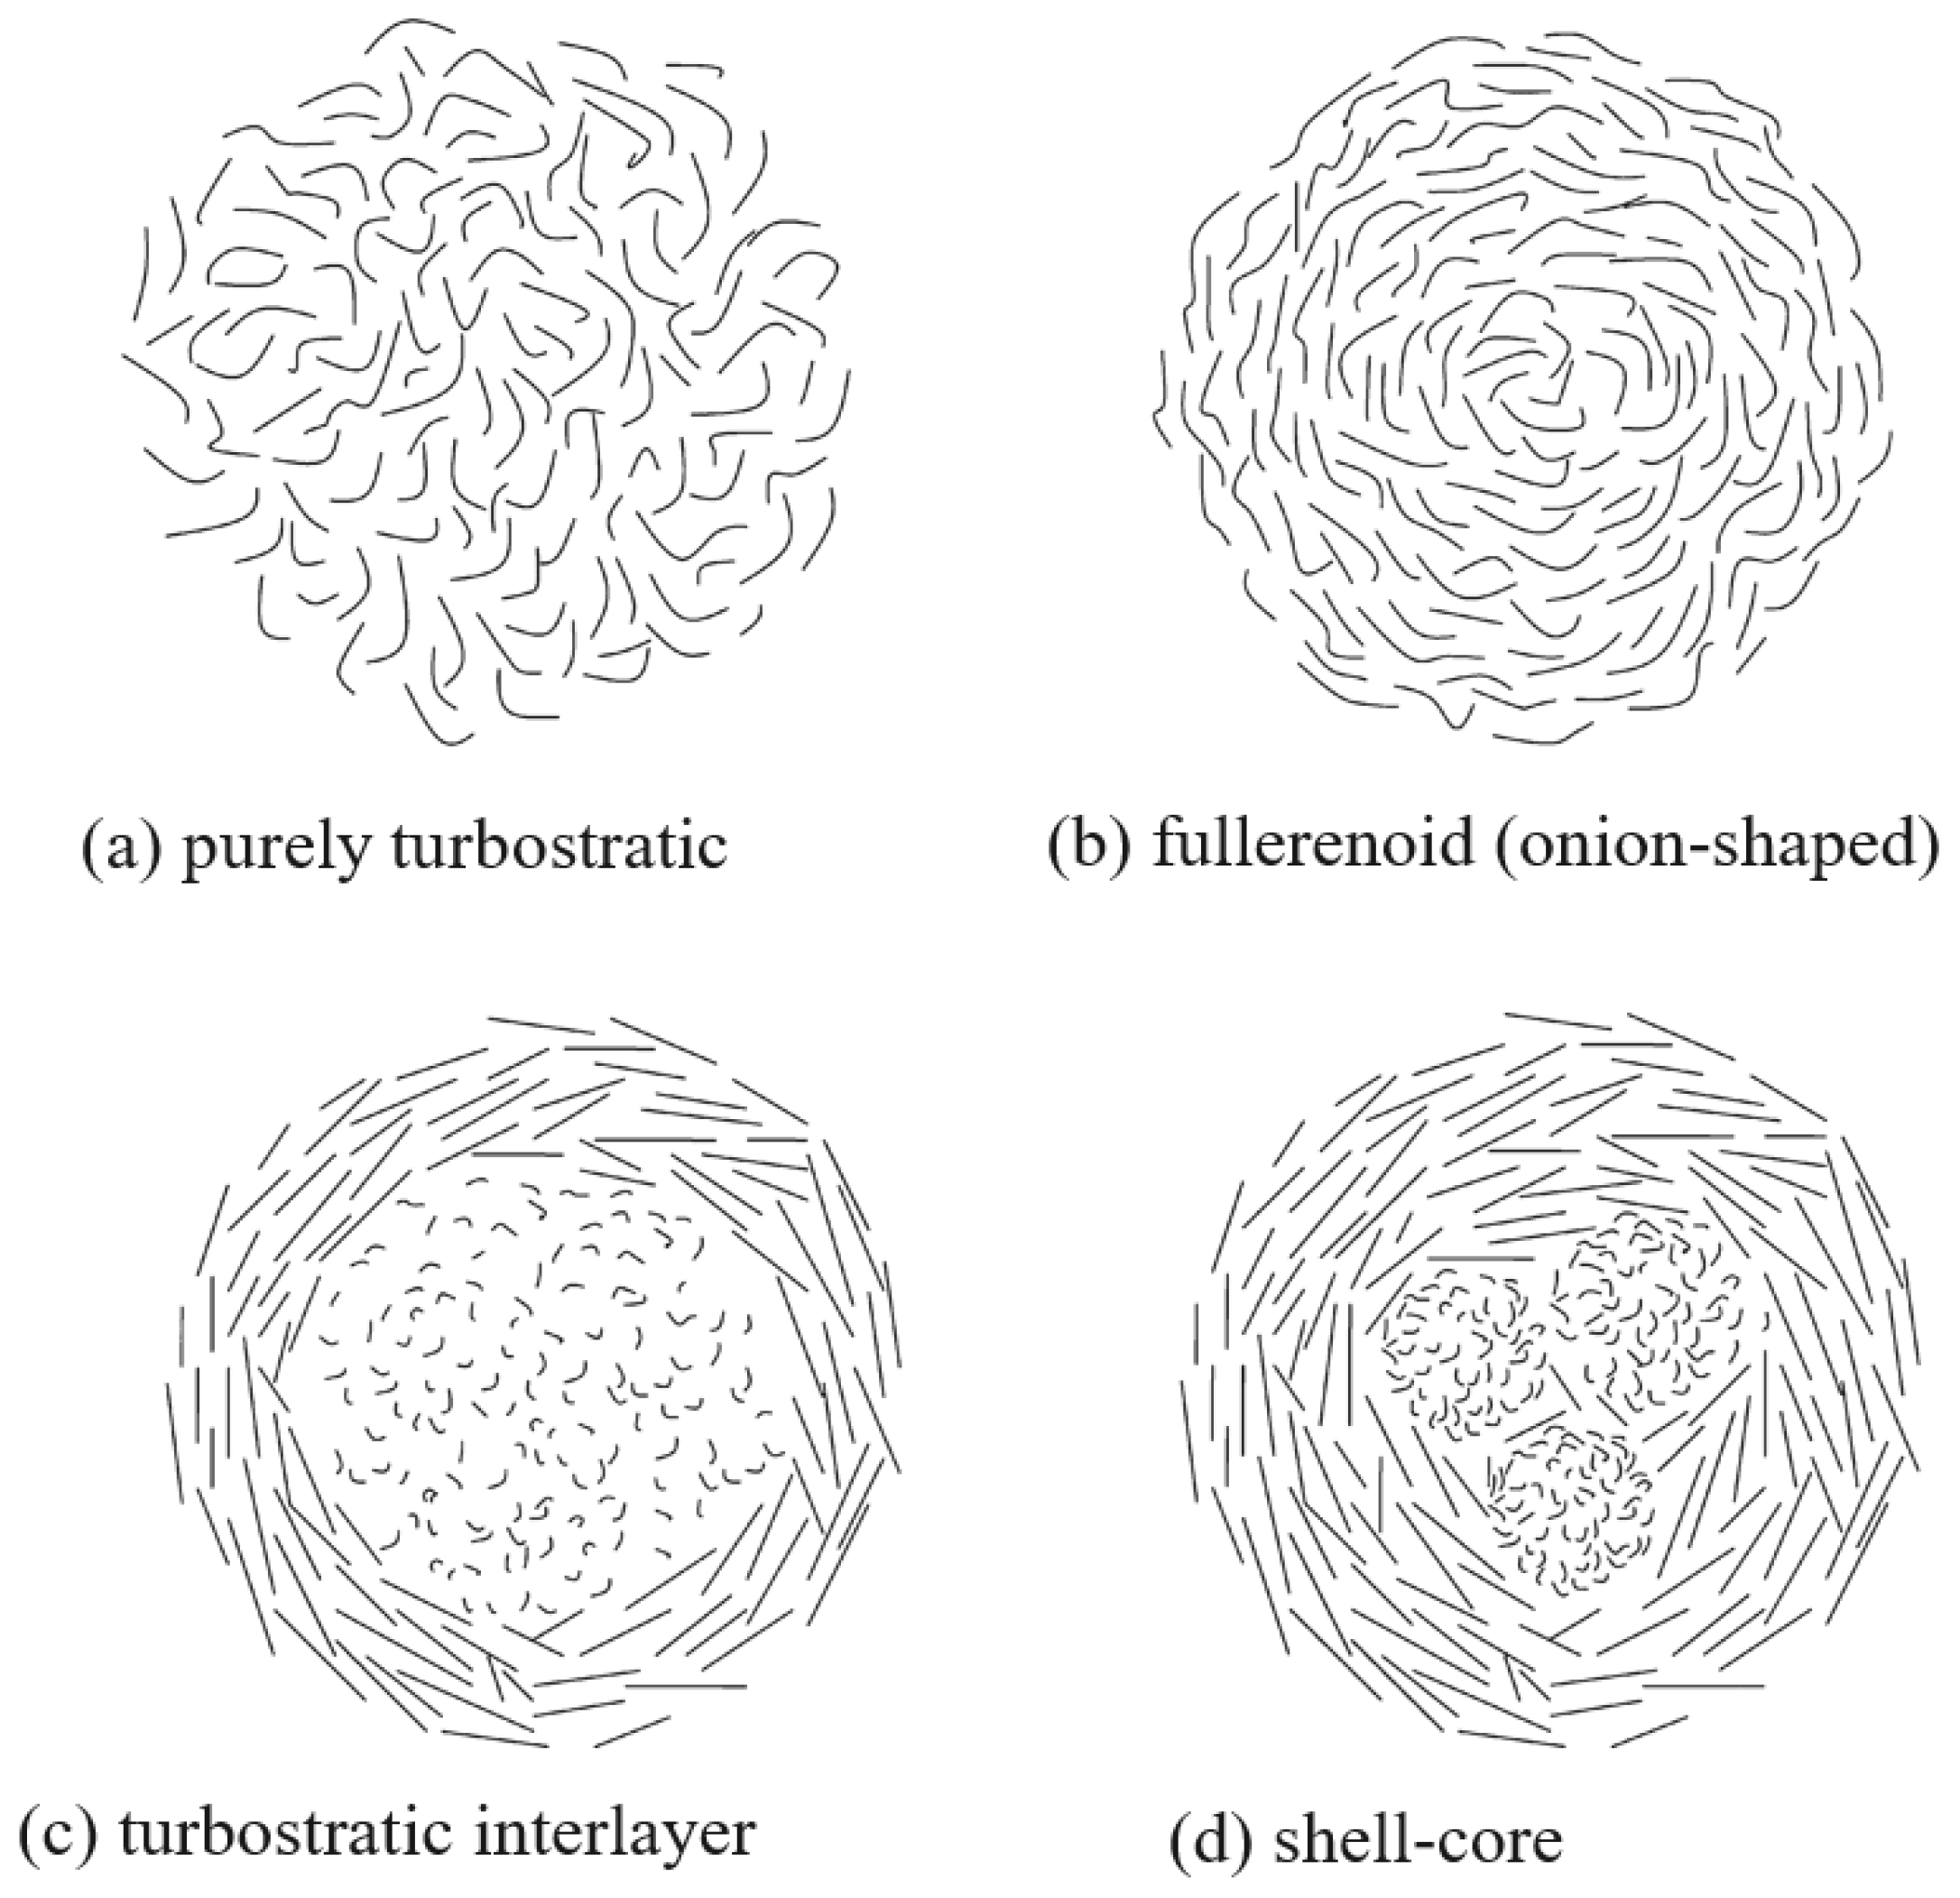
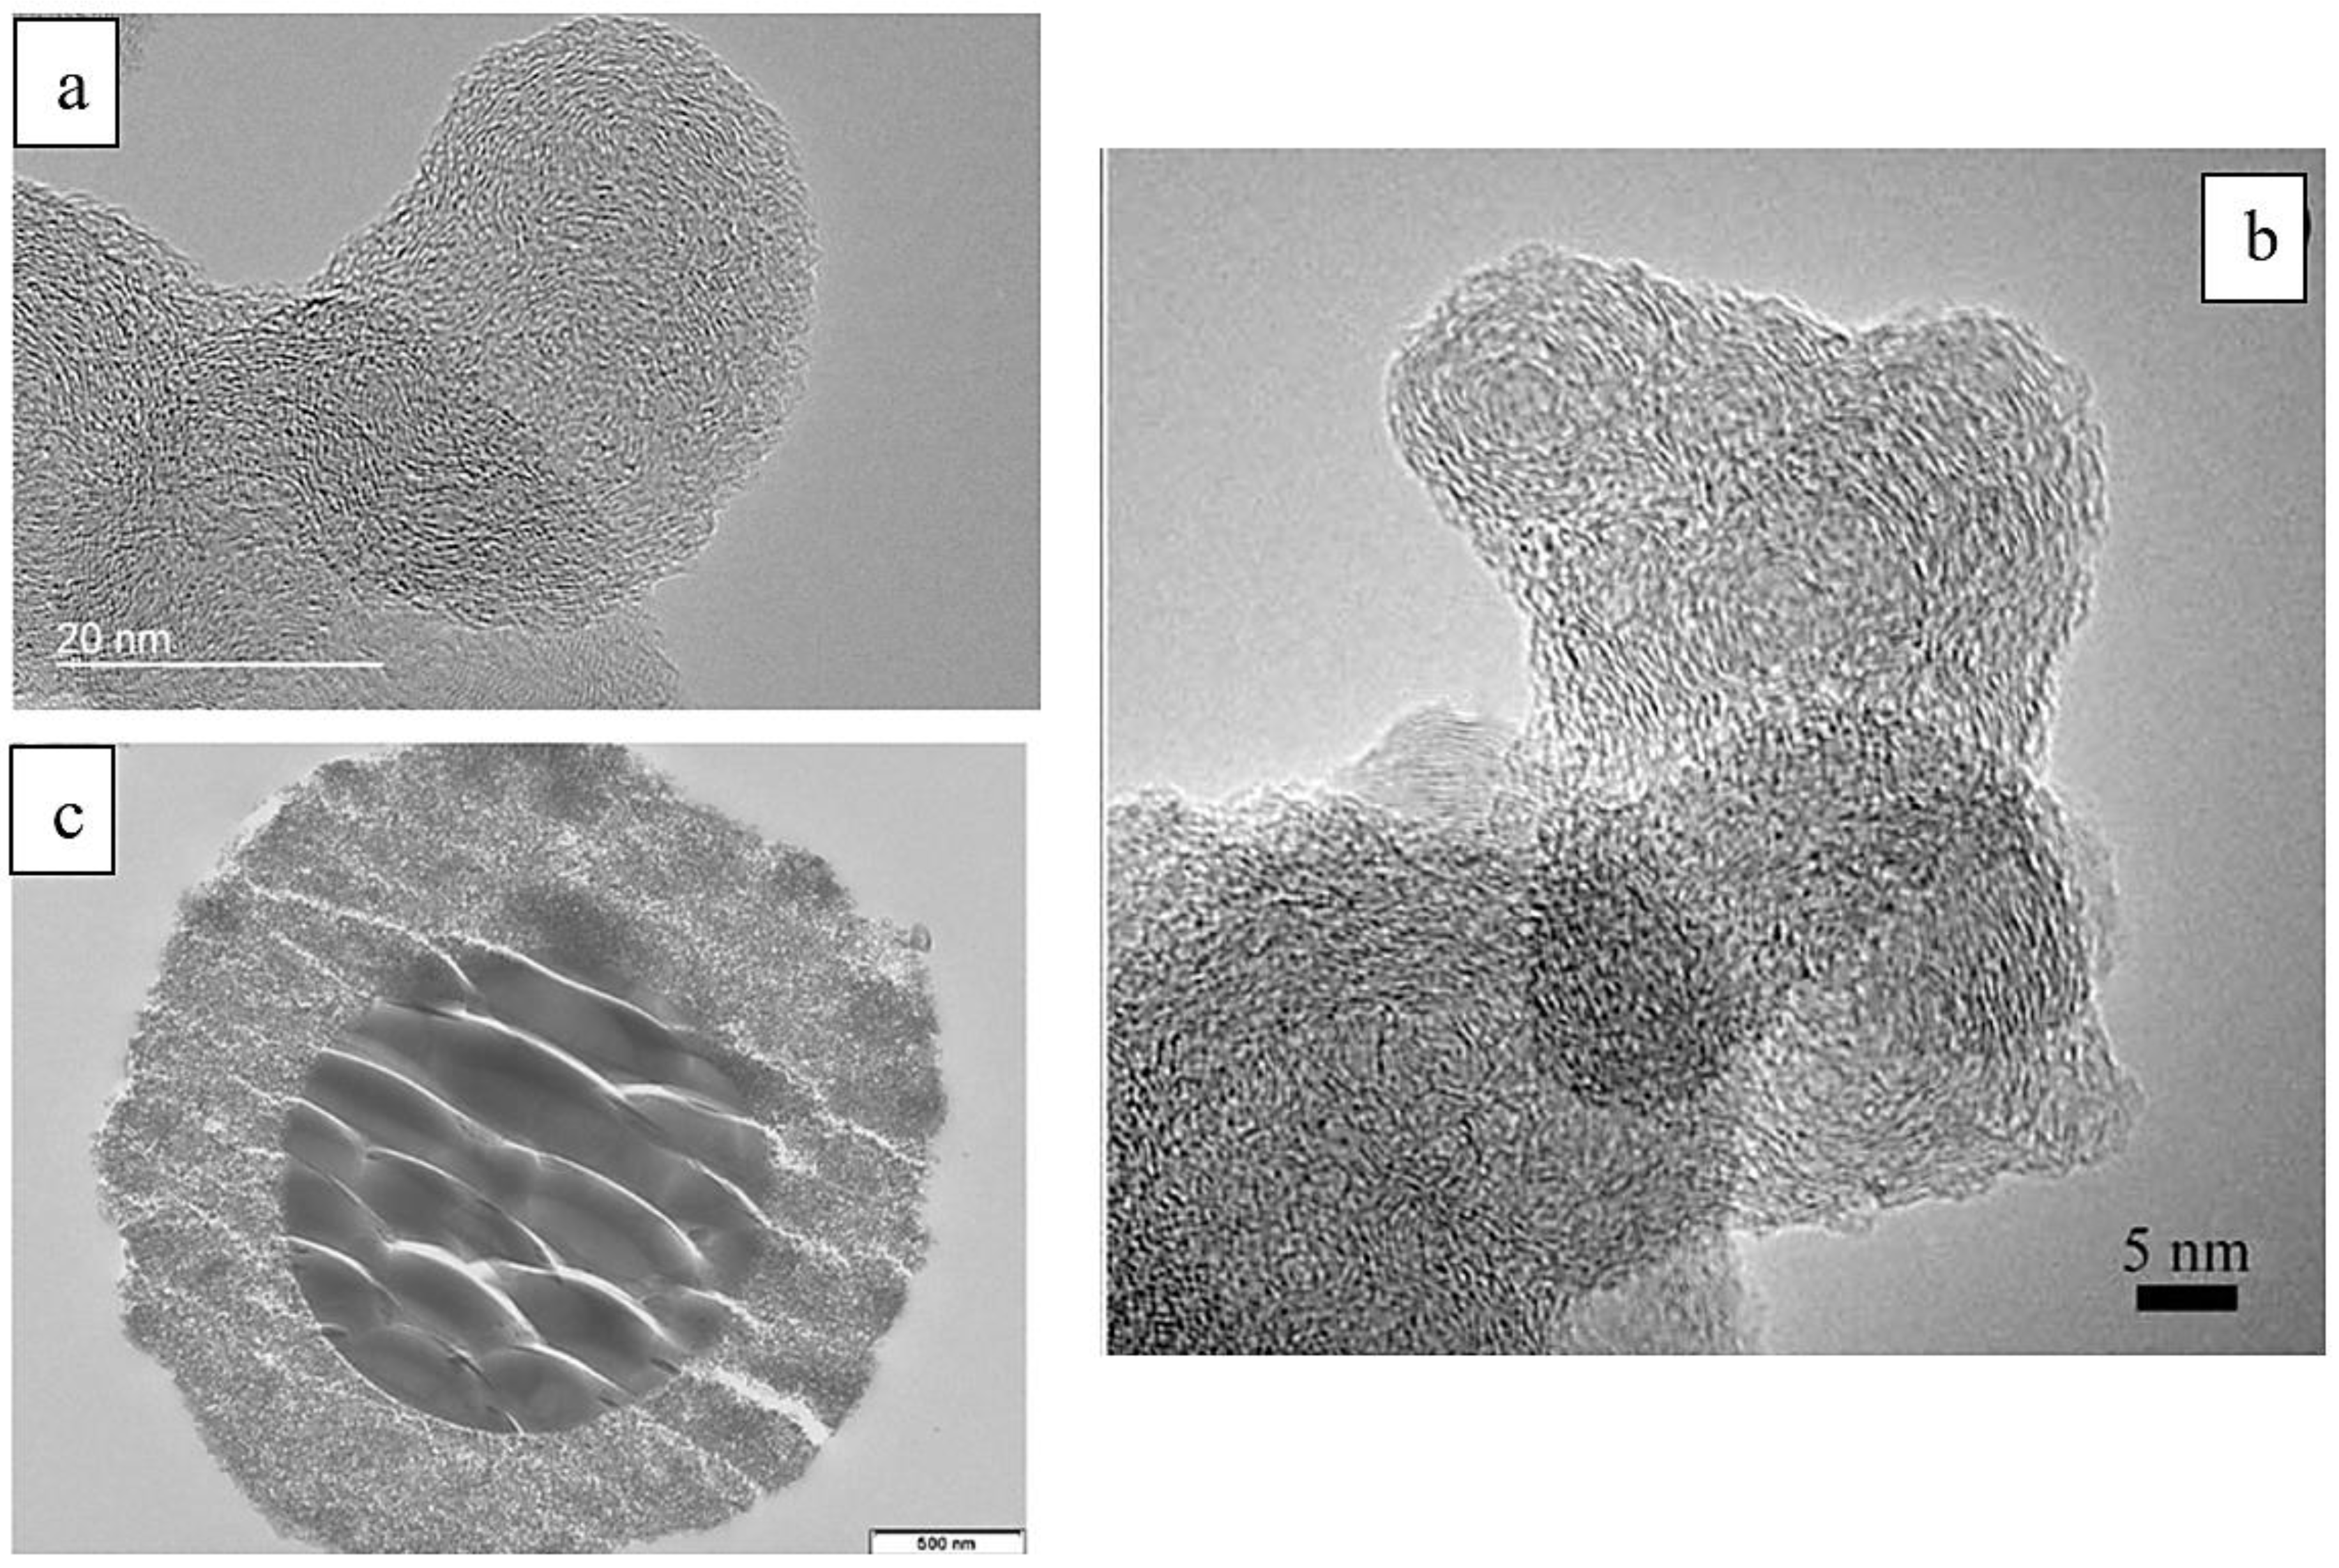
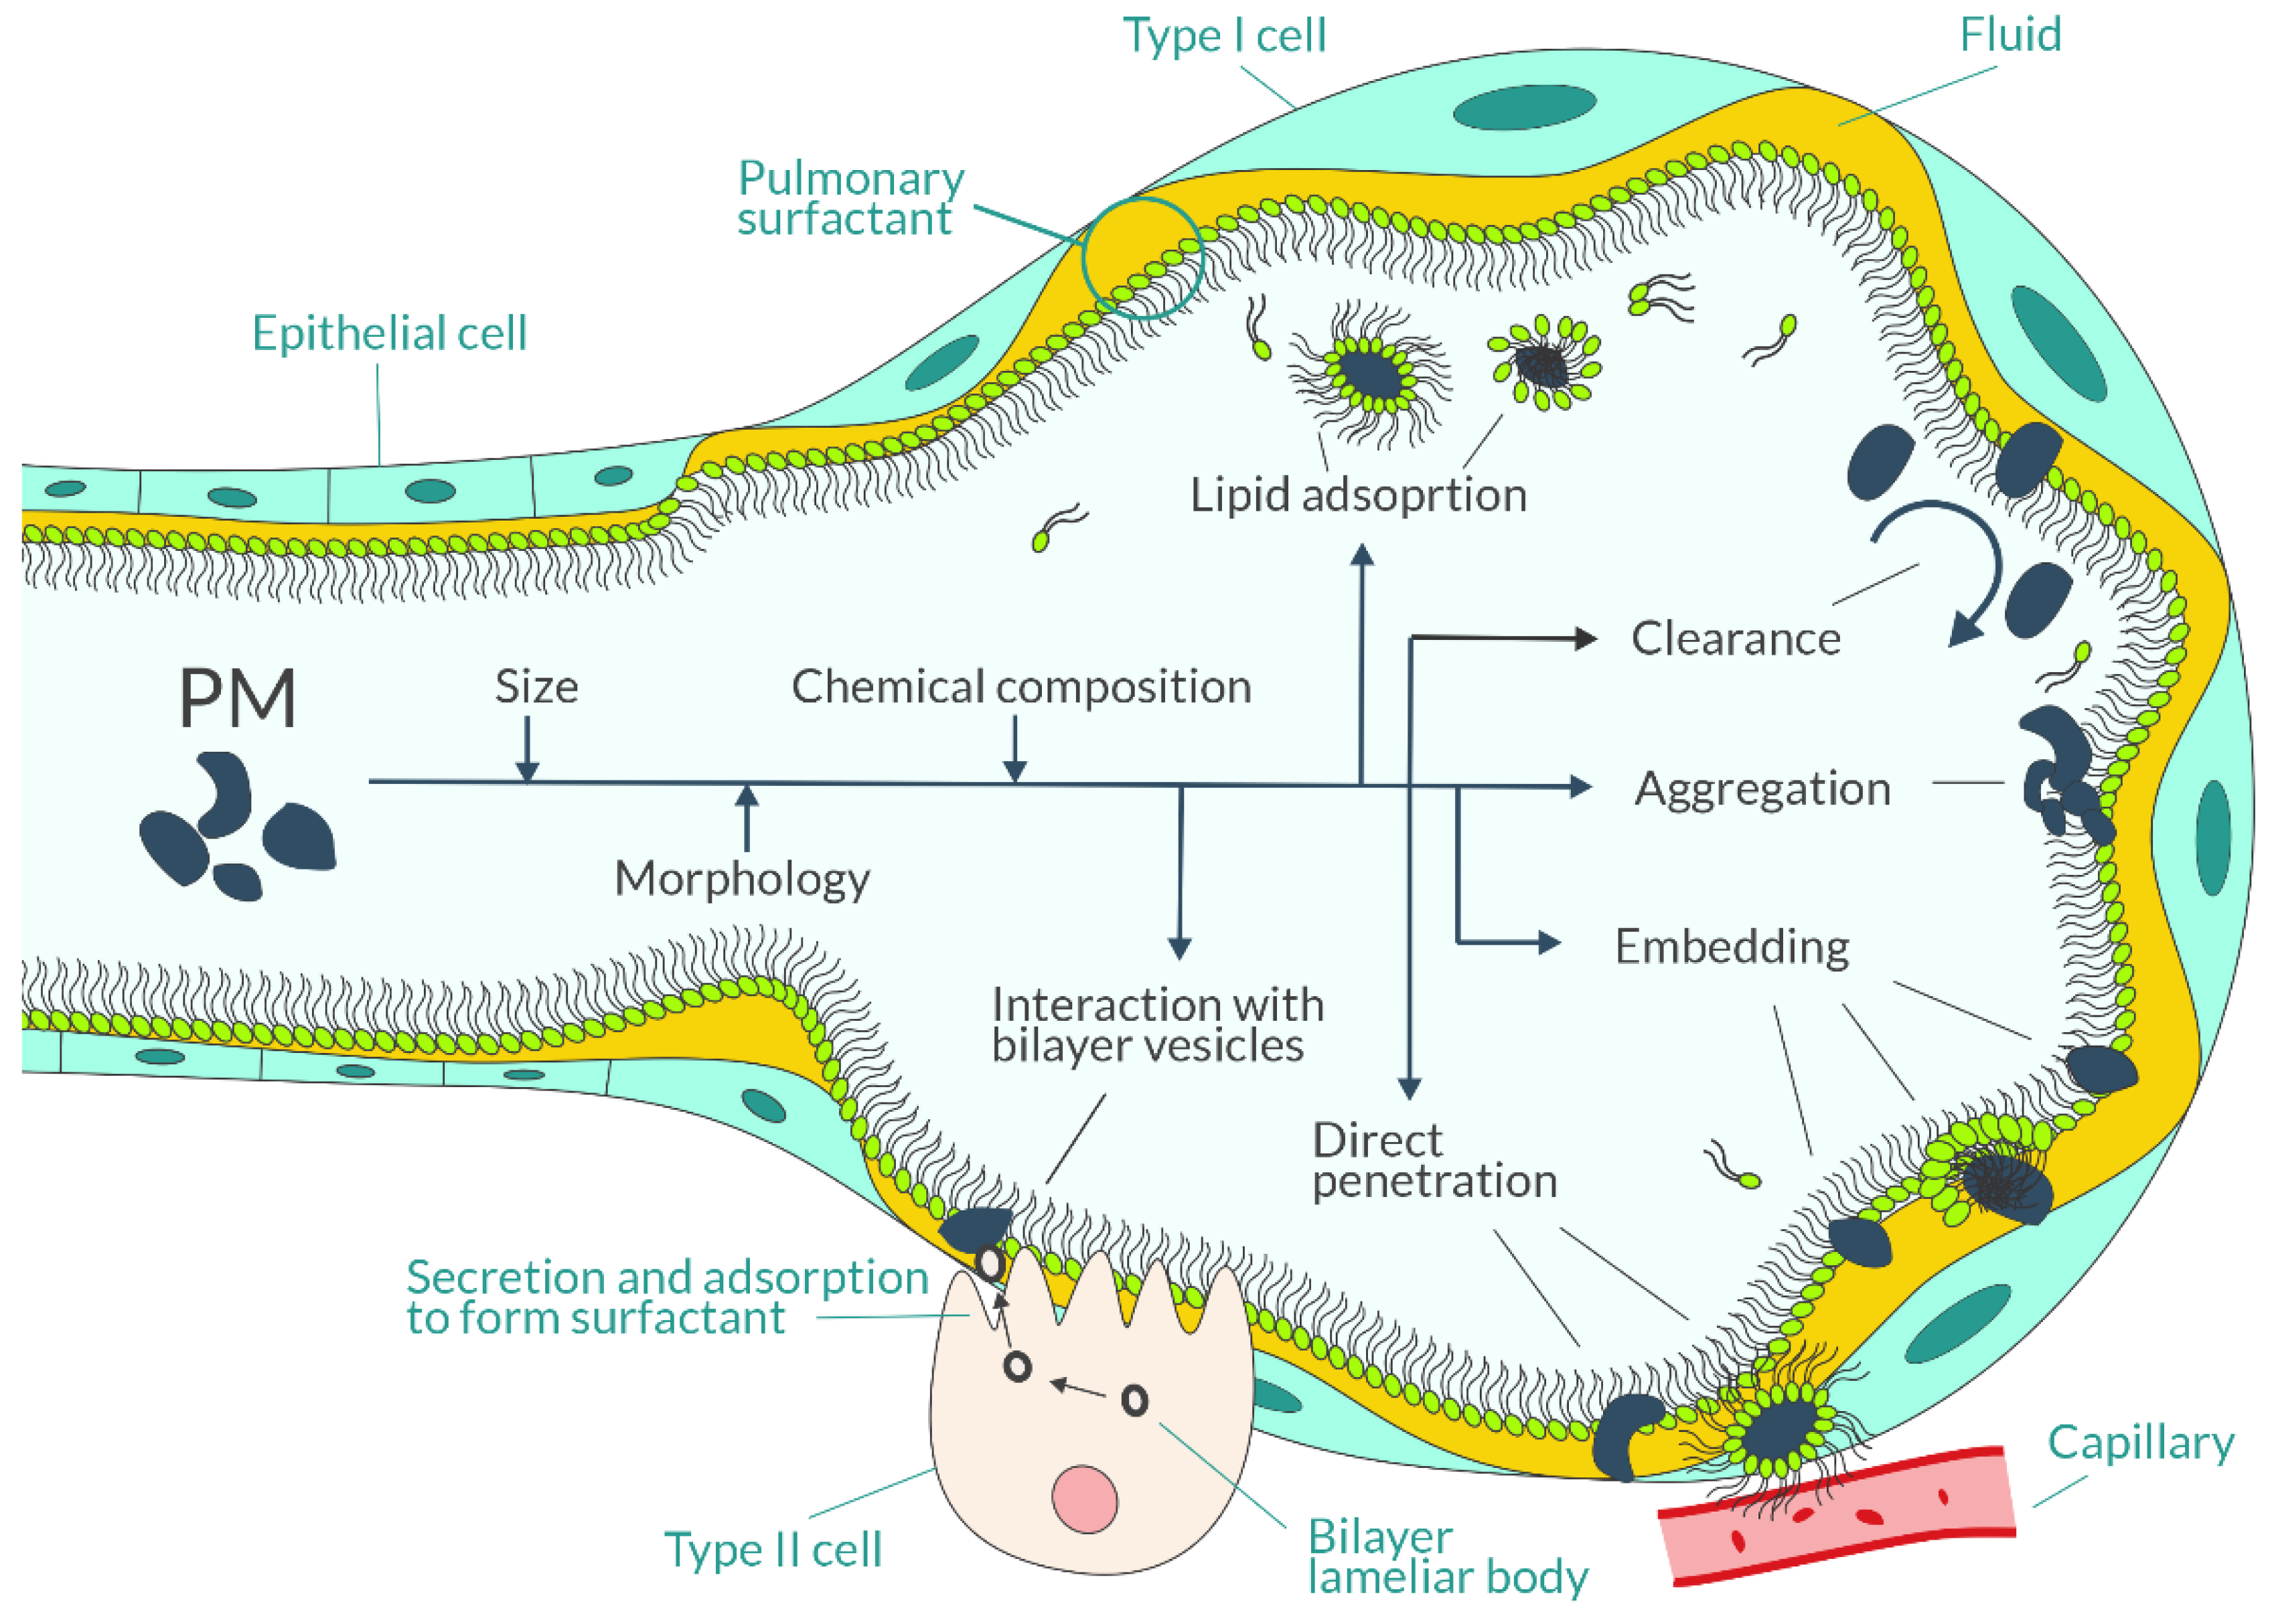
3.2. Particle Morphology as a Modular of PM Toxicity
3.3. Chemical Composition as a Determinant of PM Toxicity
3.3.1. PTEs
3.3.2. PAHs
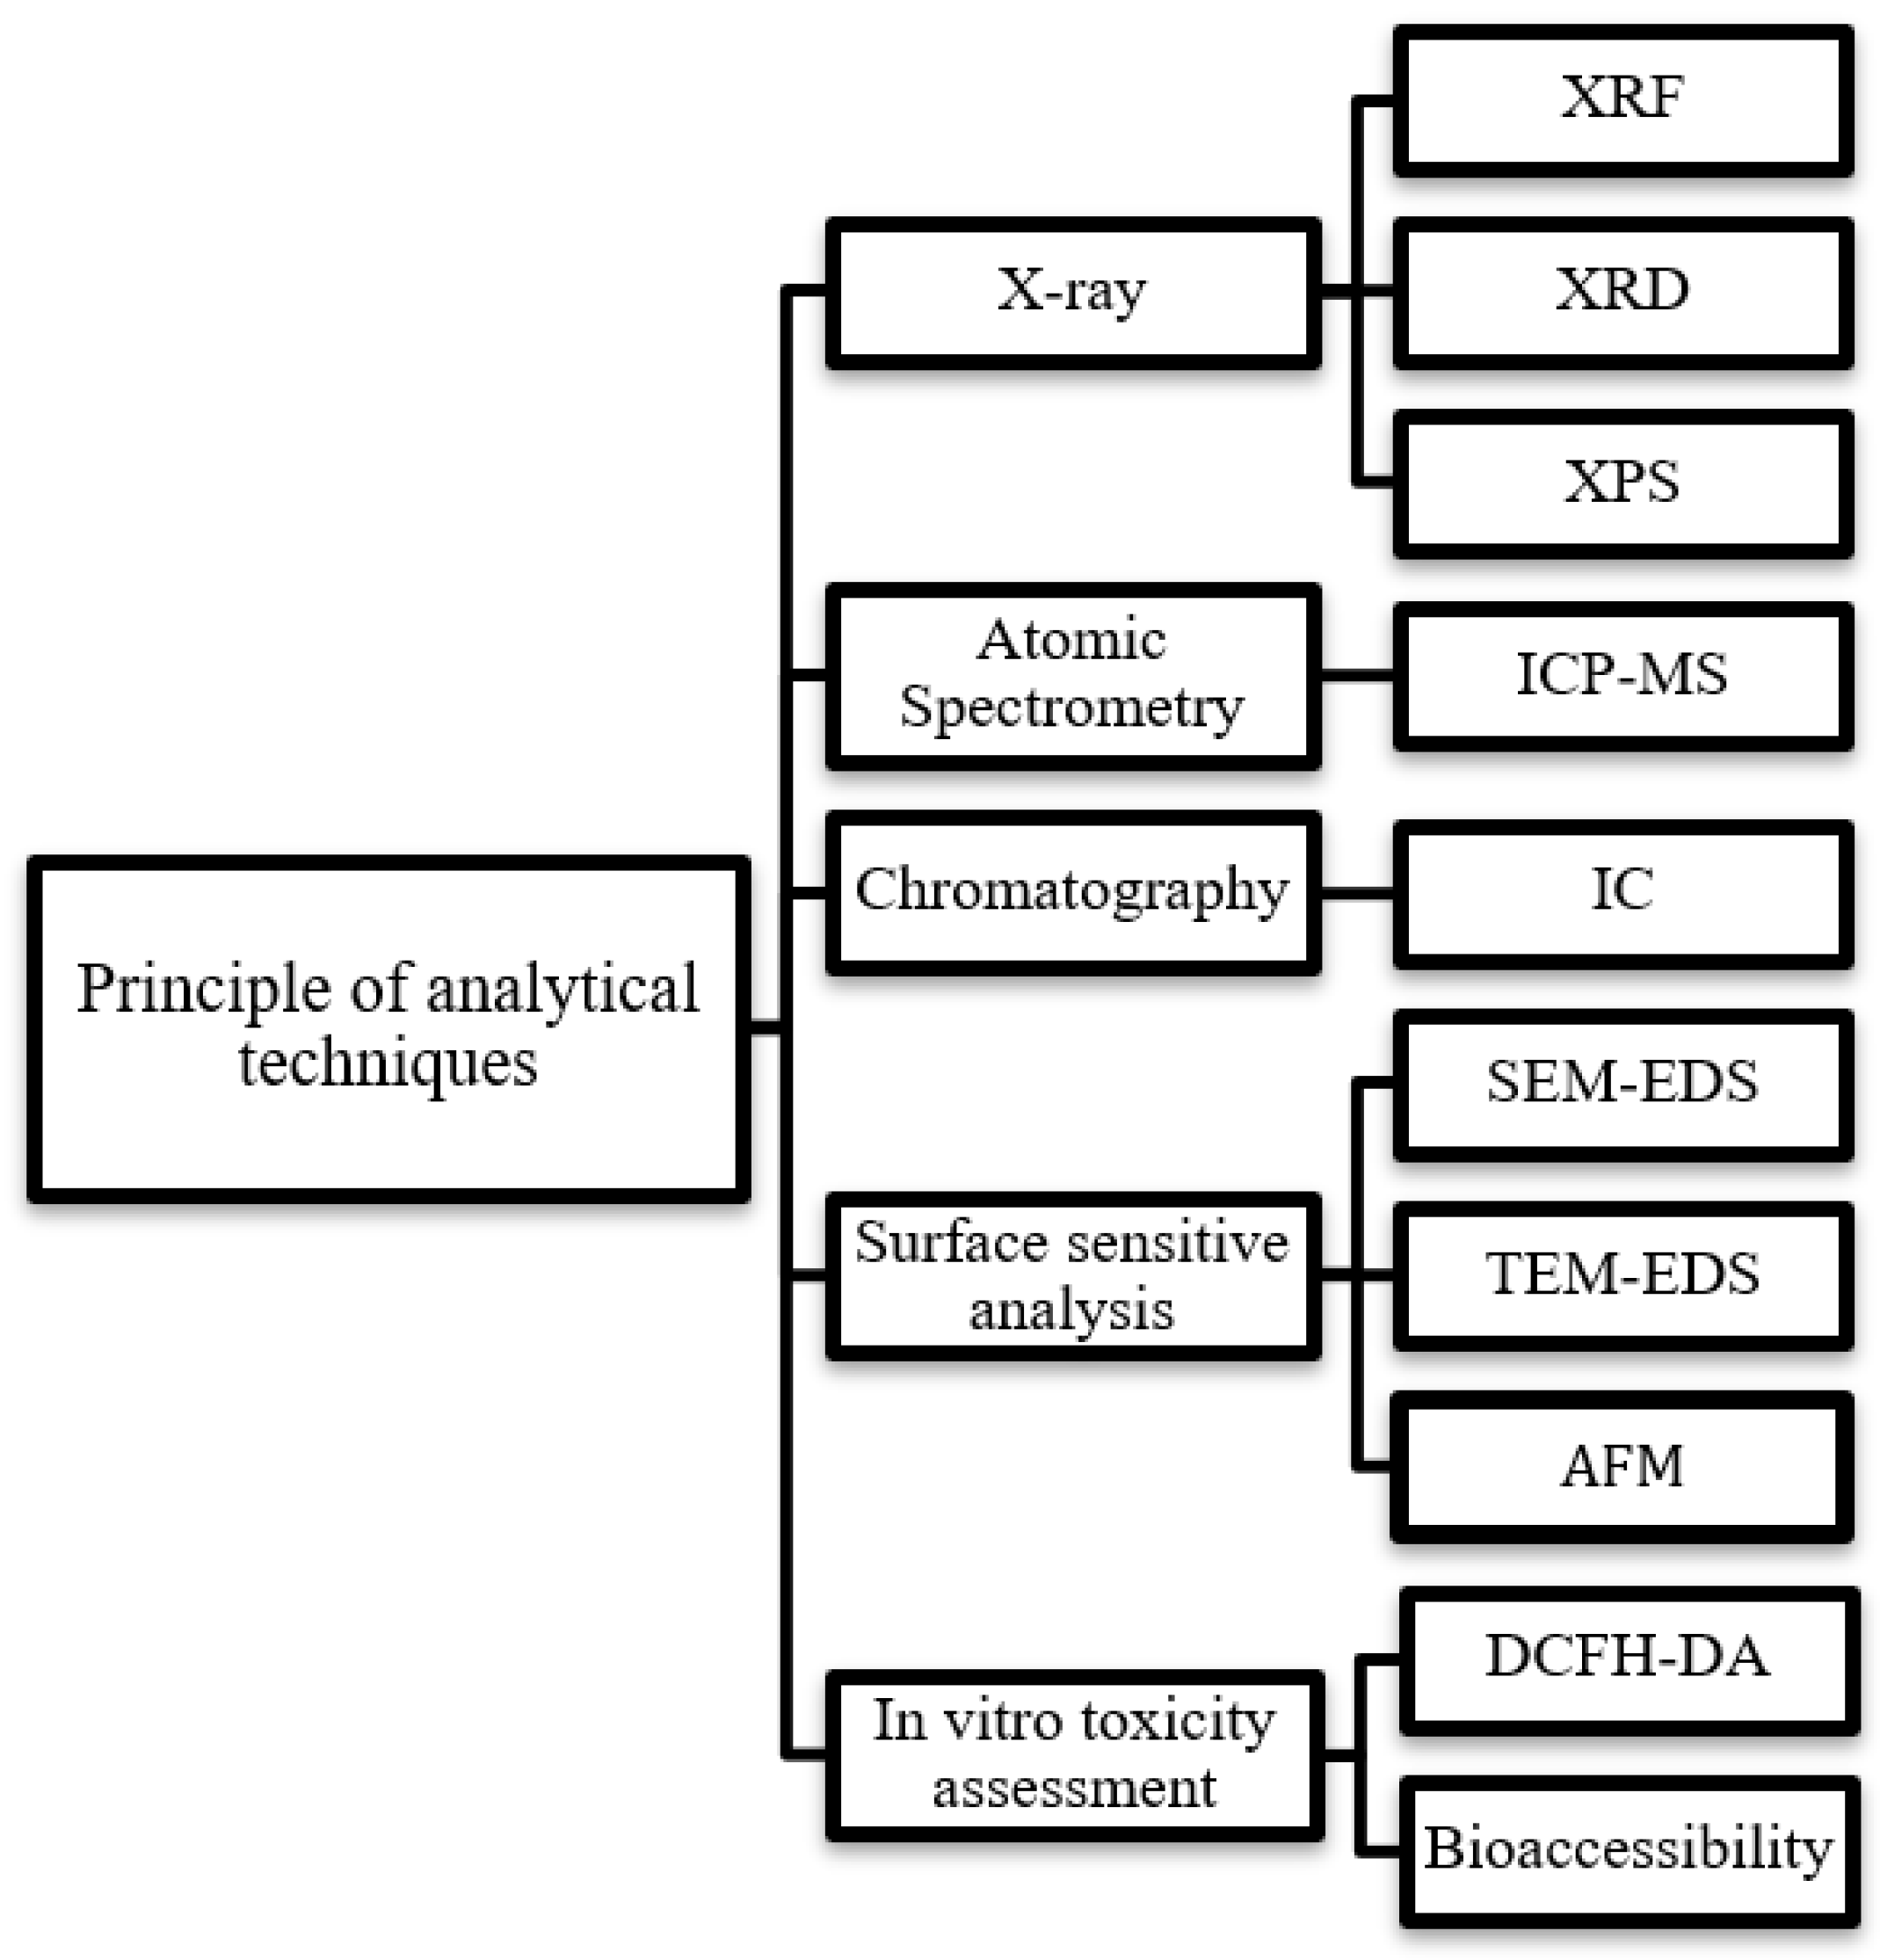
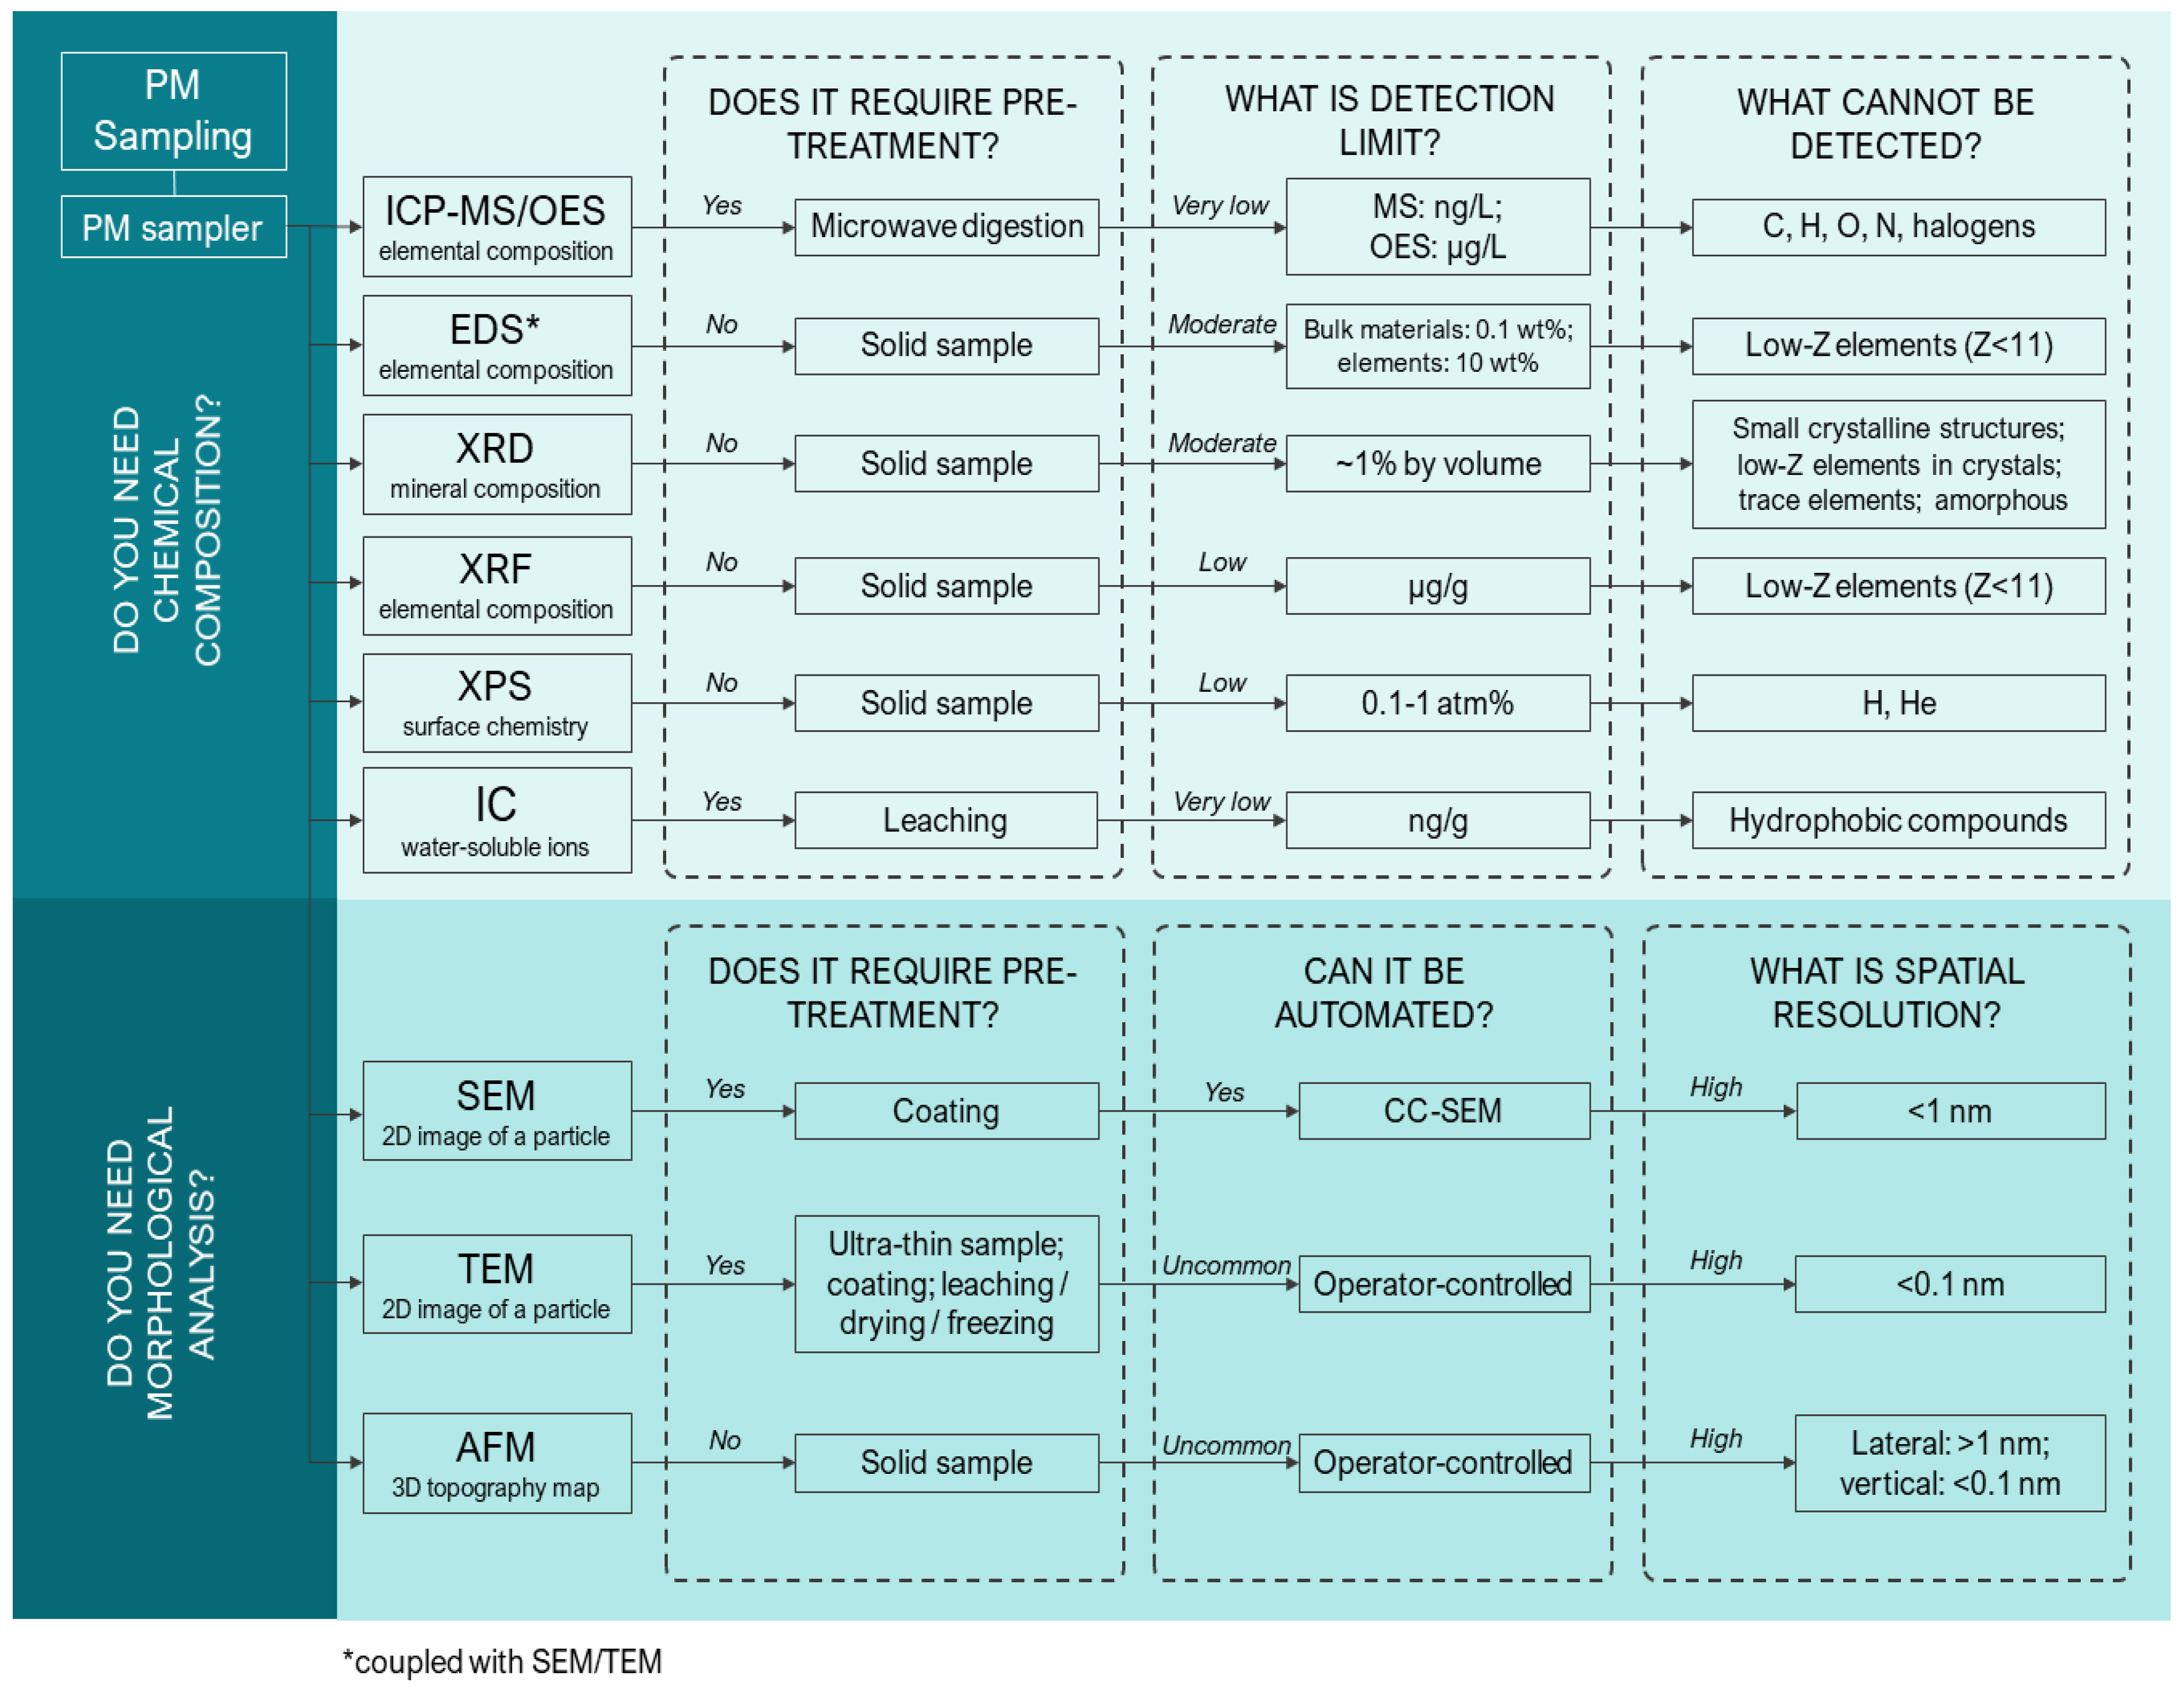
4. Analytical Methods for Physicochemical Characterization of PM
4.1. Destructive Techniques for PM Analysis
4.1.1. ICP
4.1.2. IC
4.2. Non-Destructive Techniques for PM Analysis
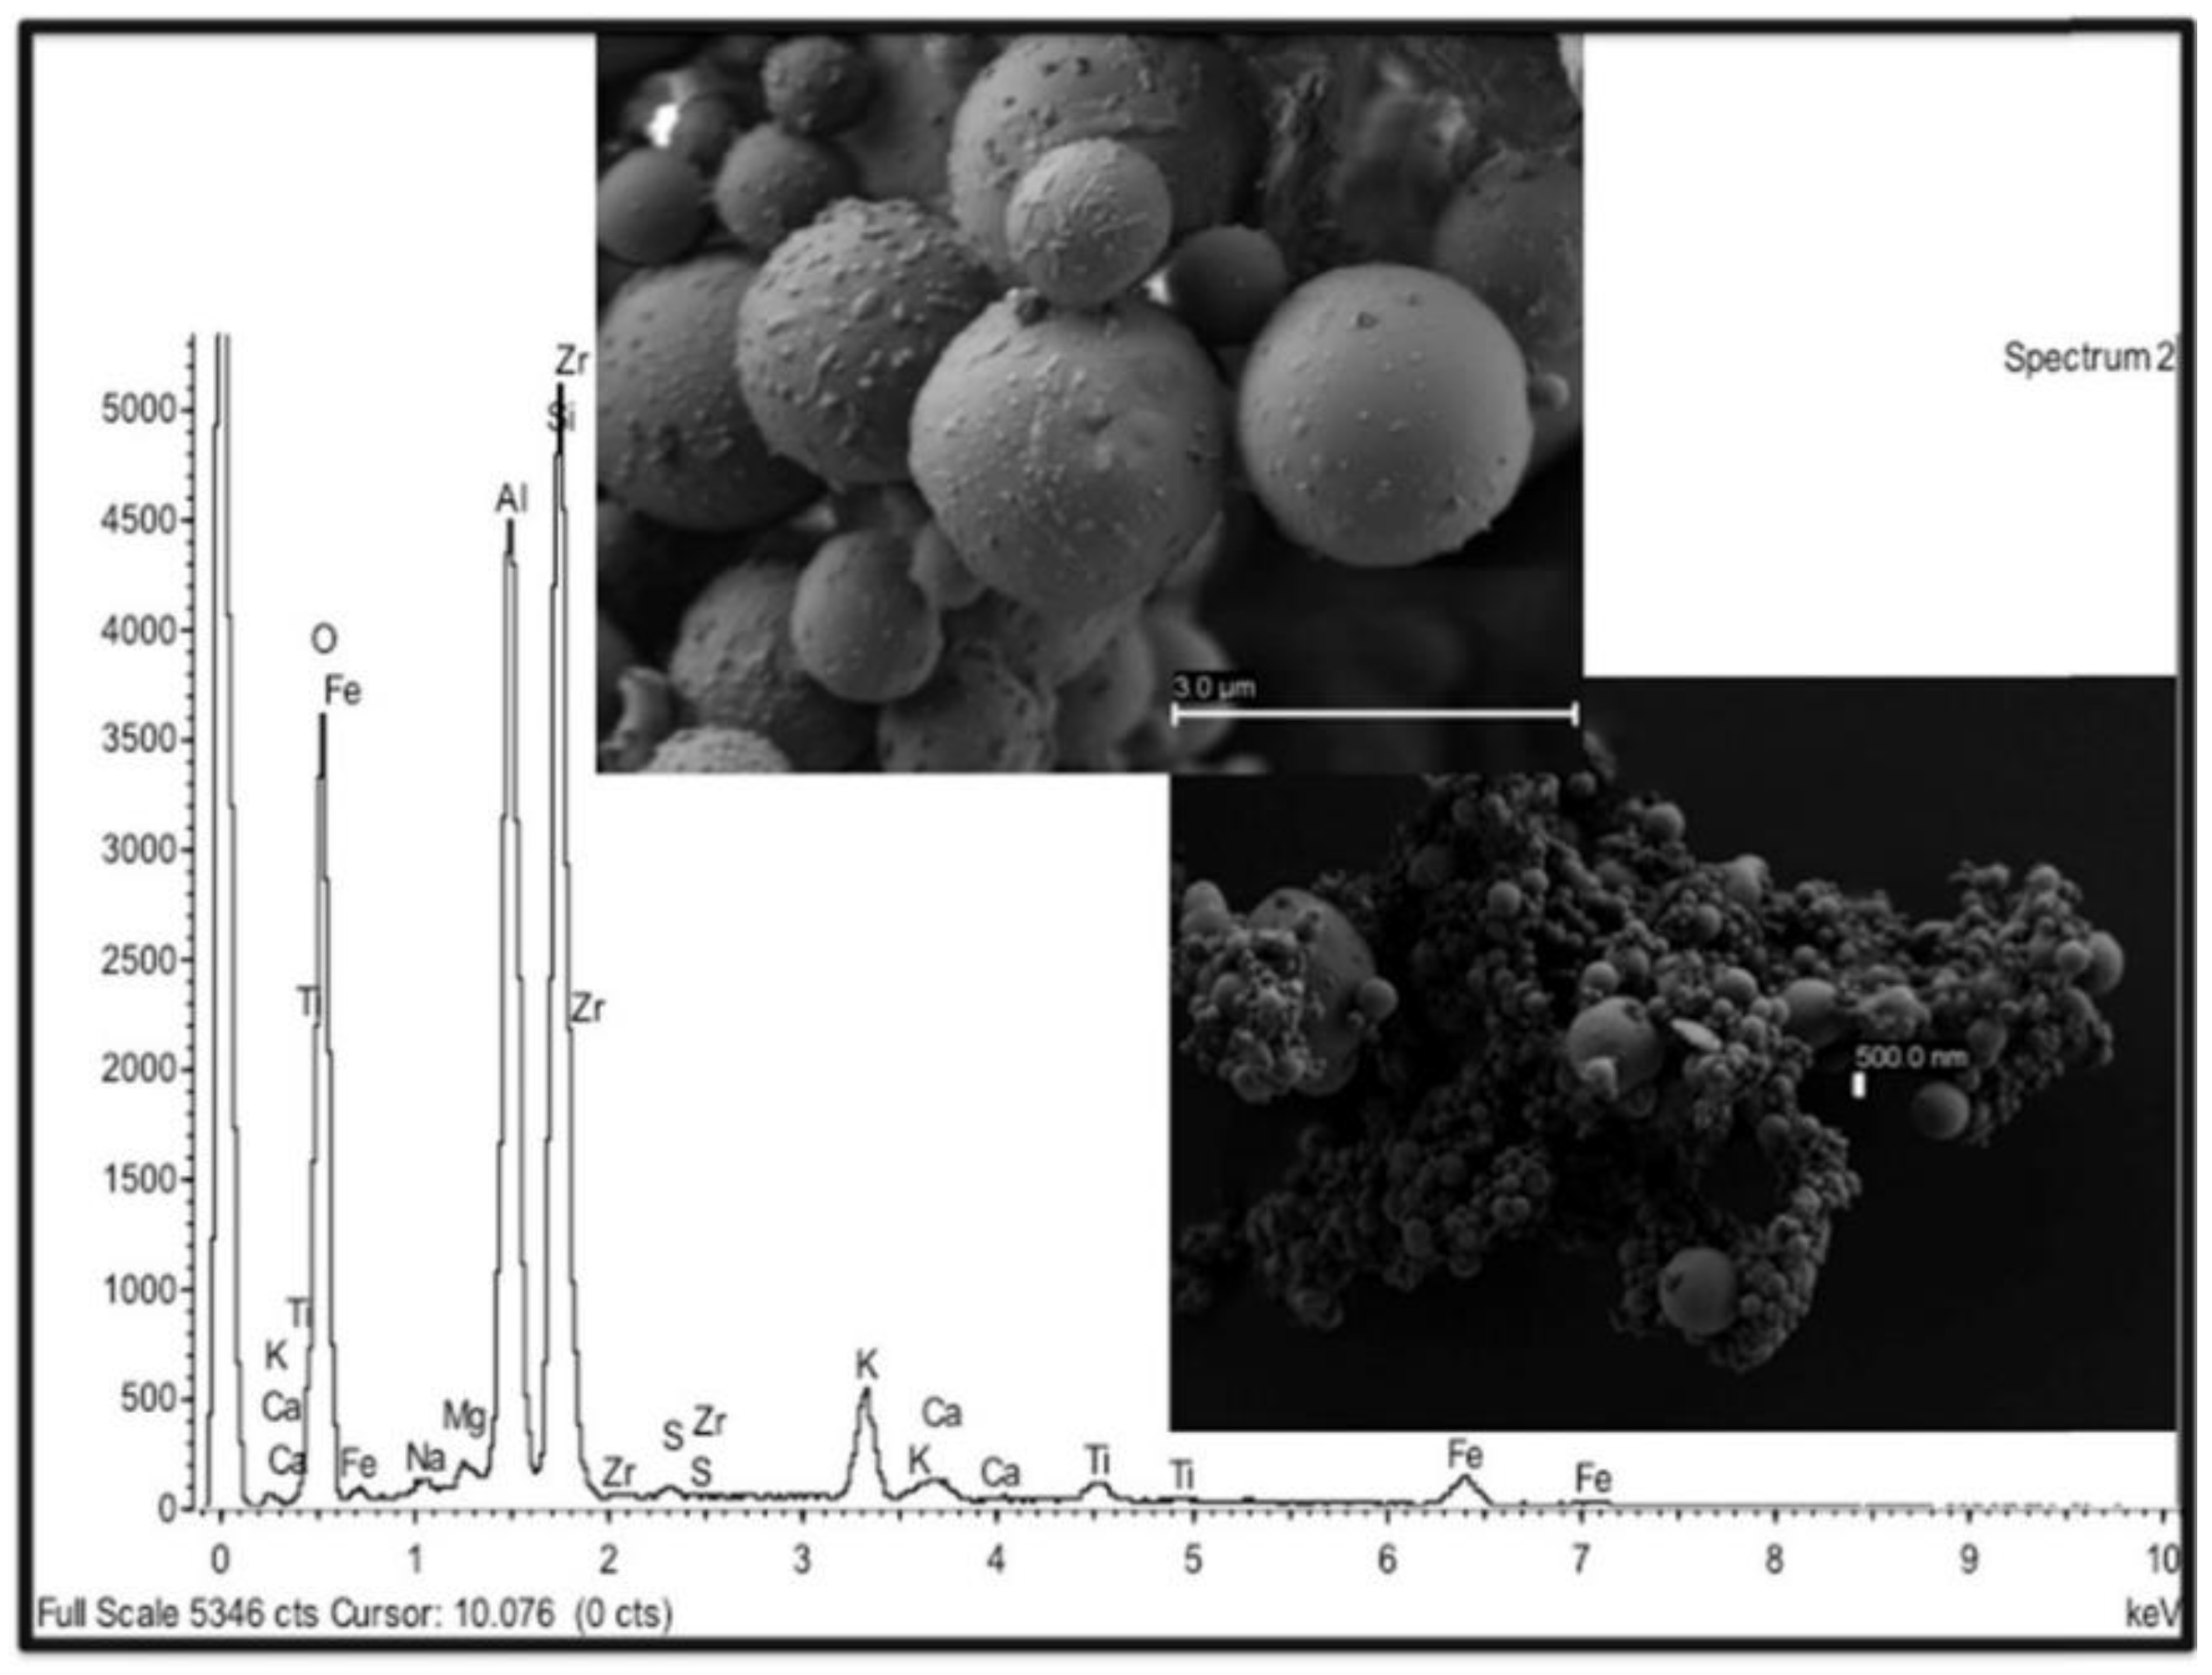
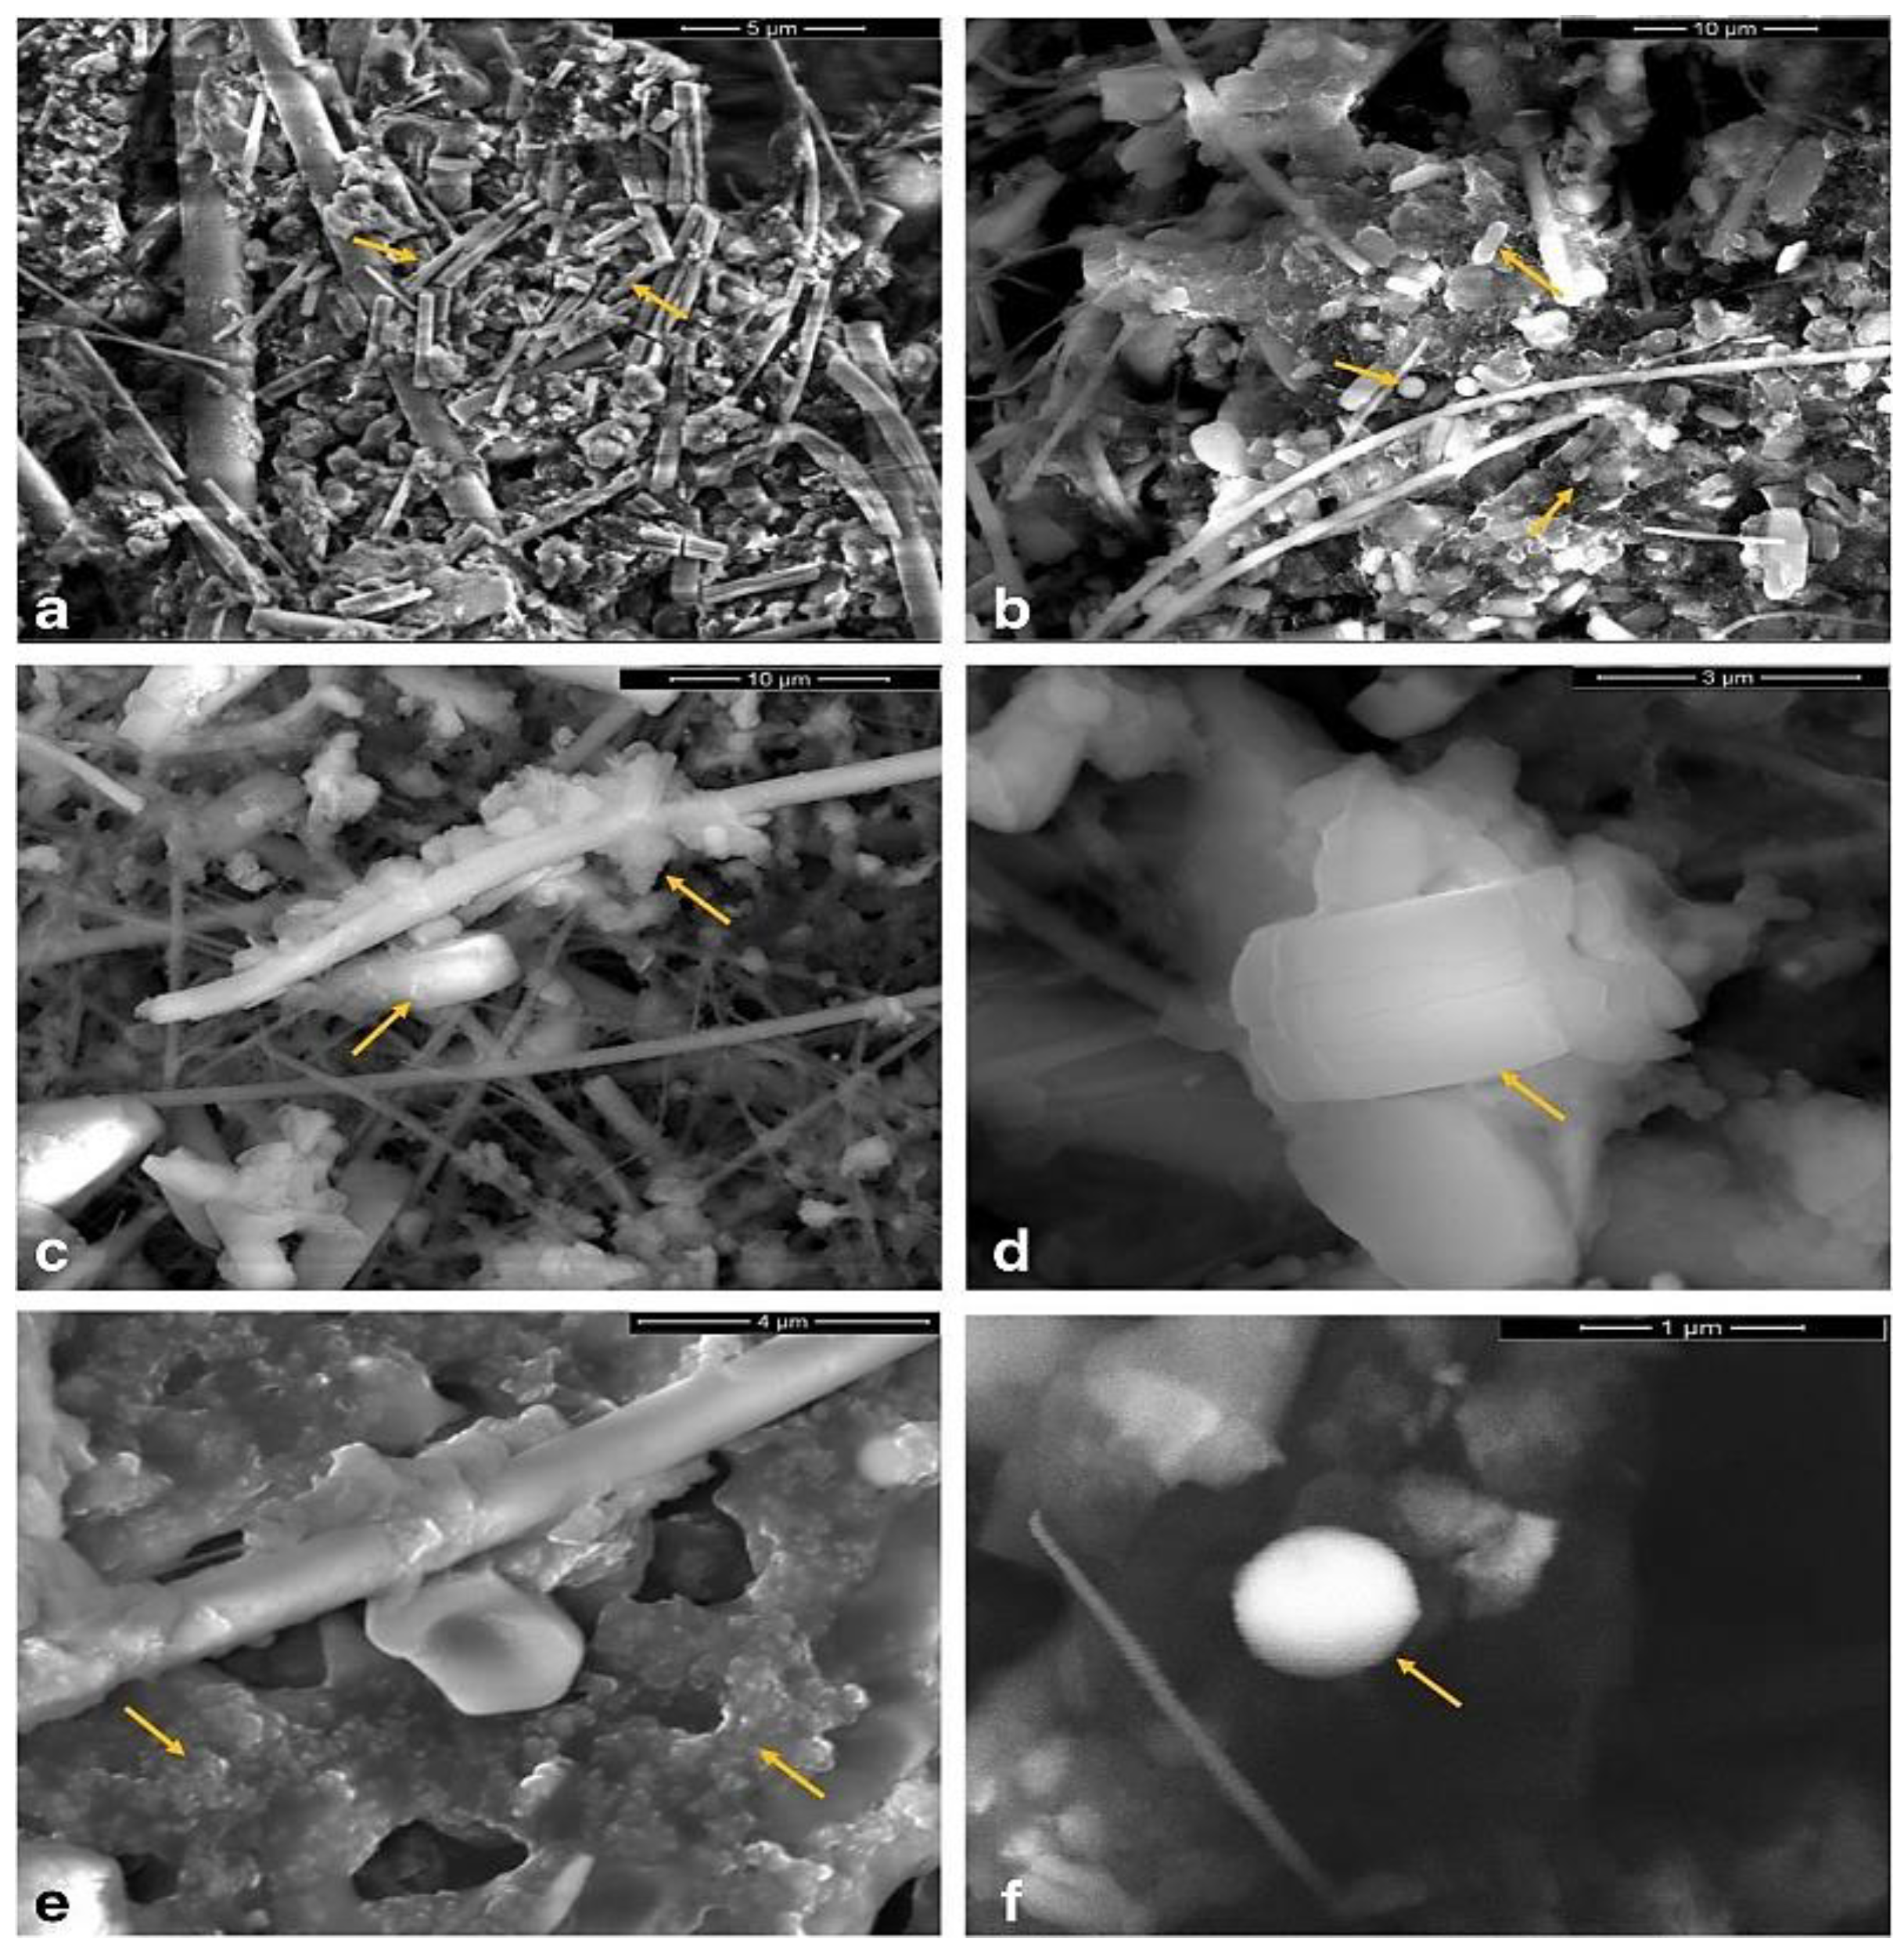
4.2.1. SEM
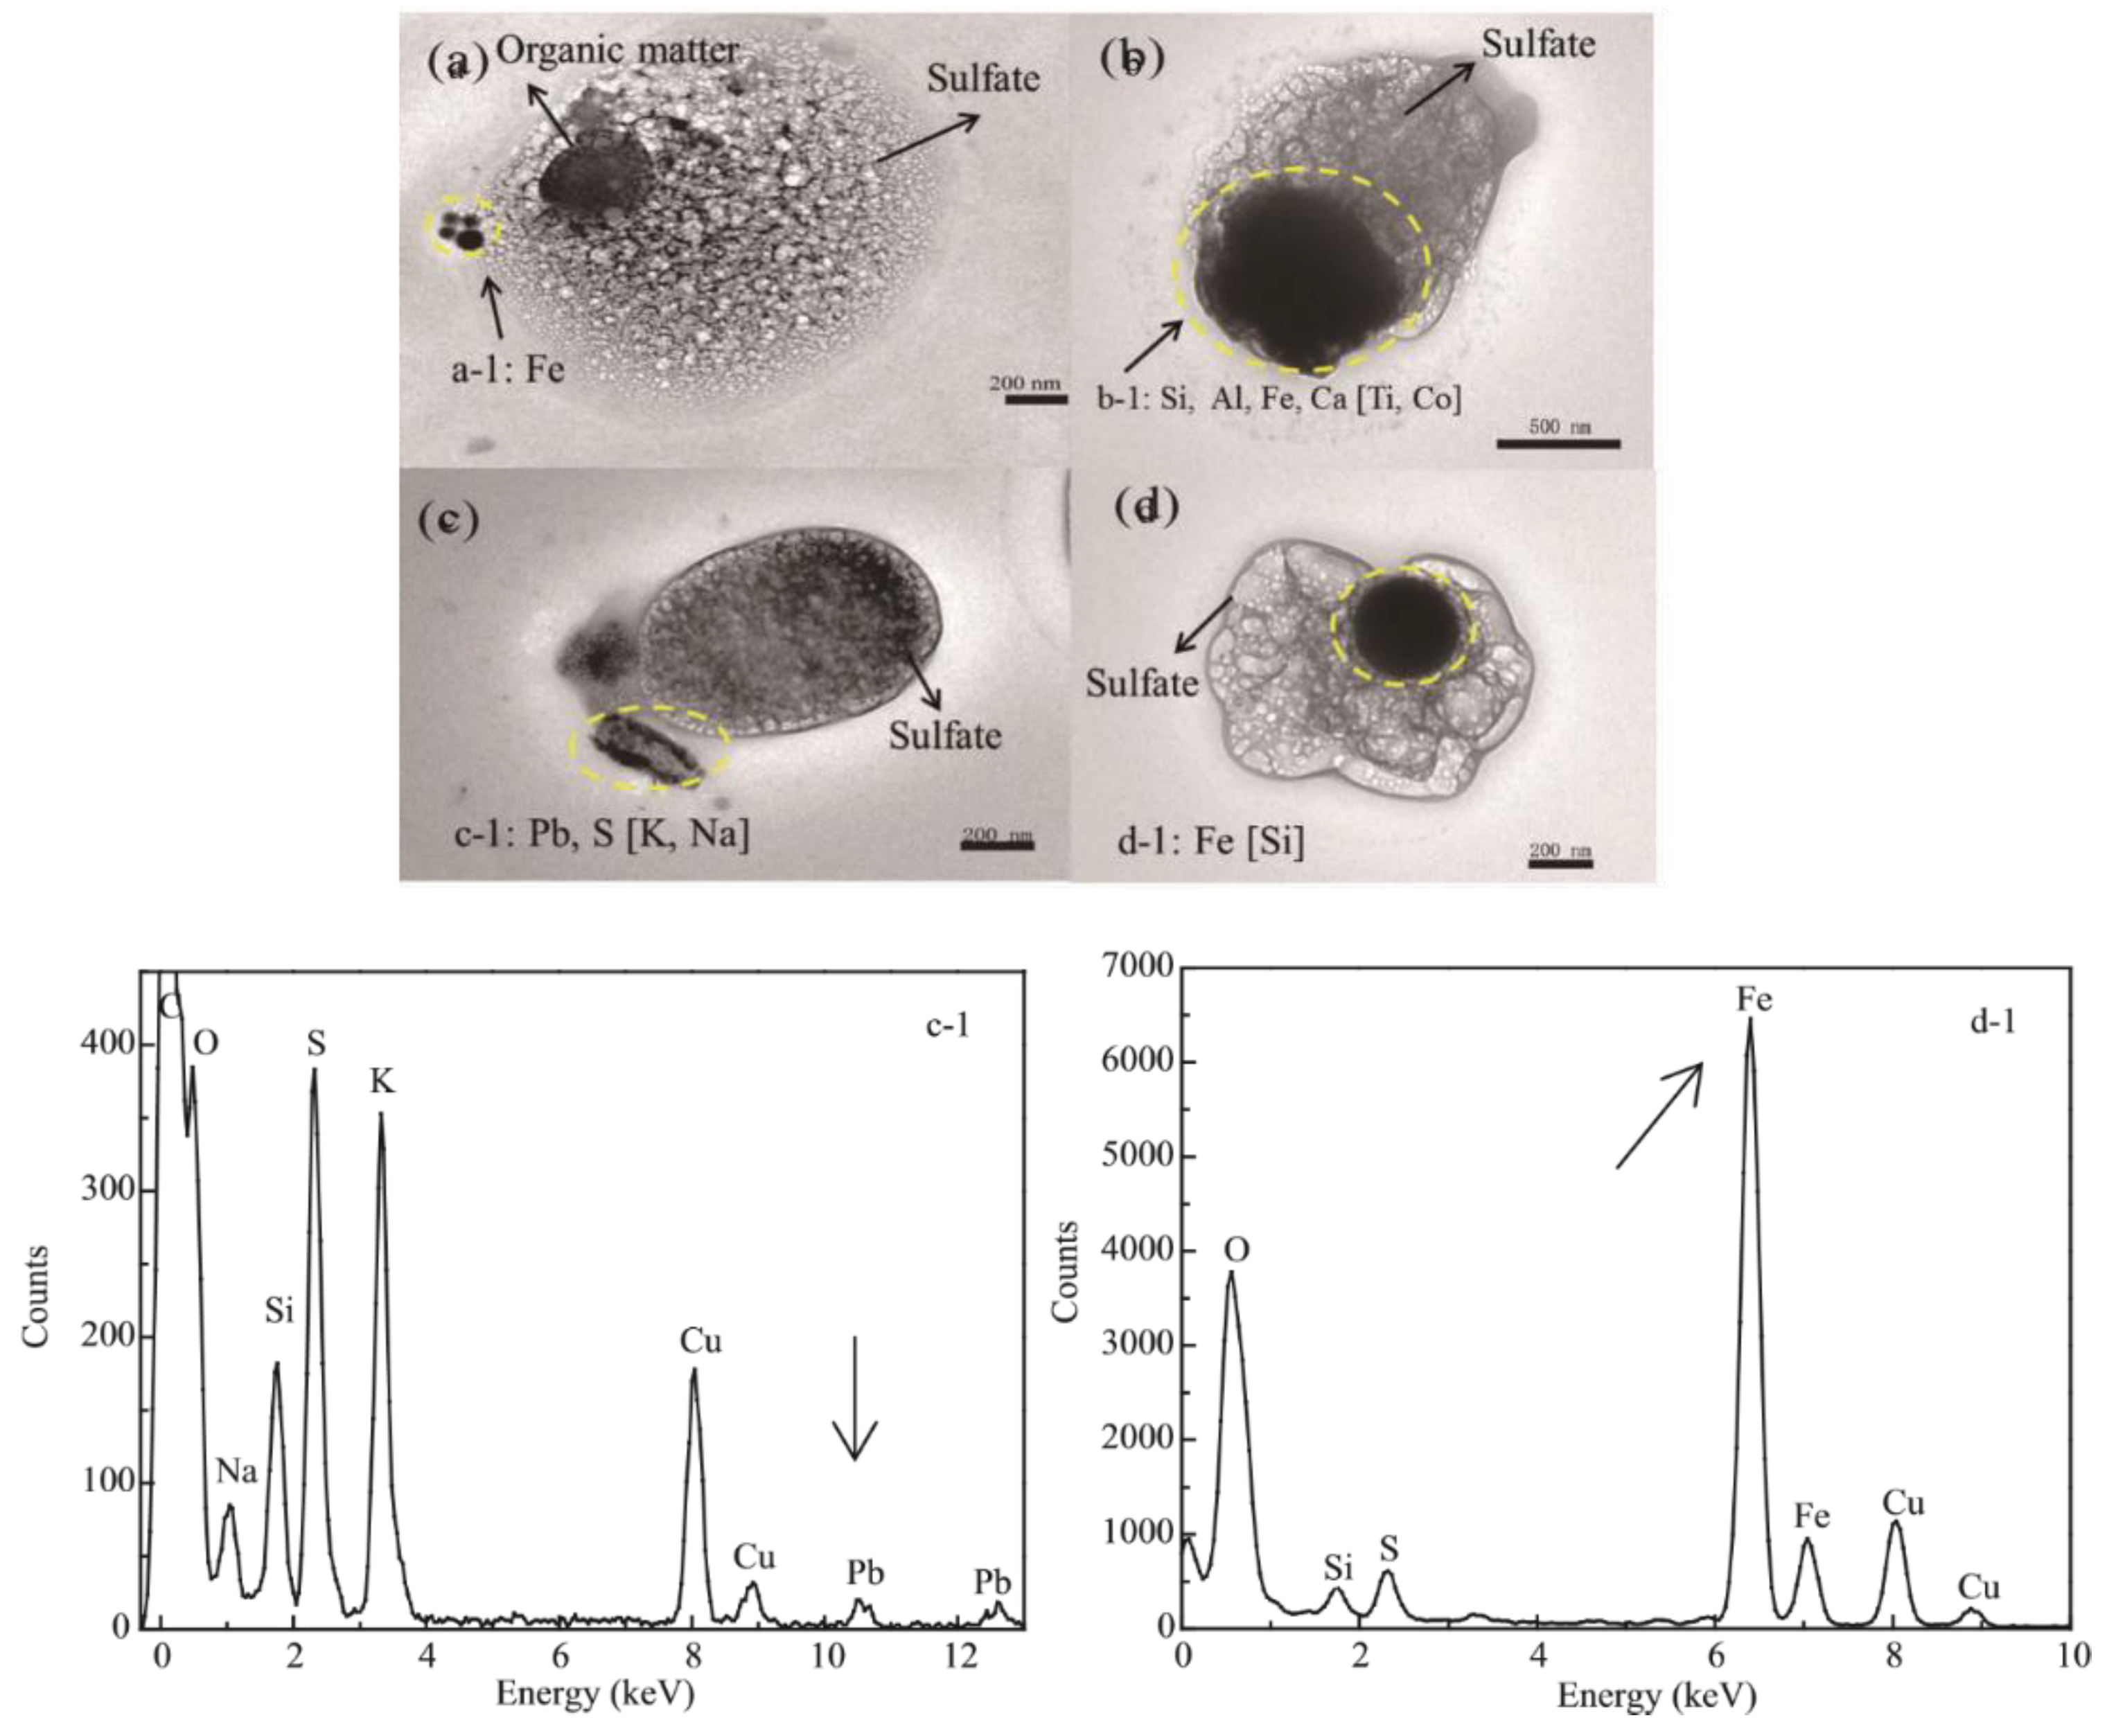
4.2.2. TEM
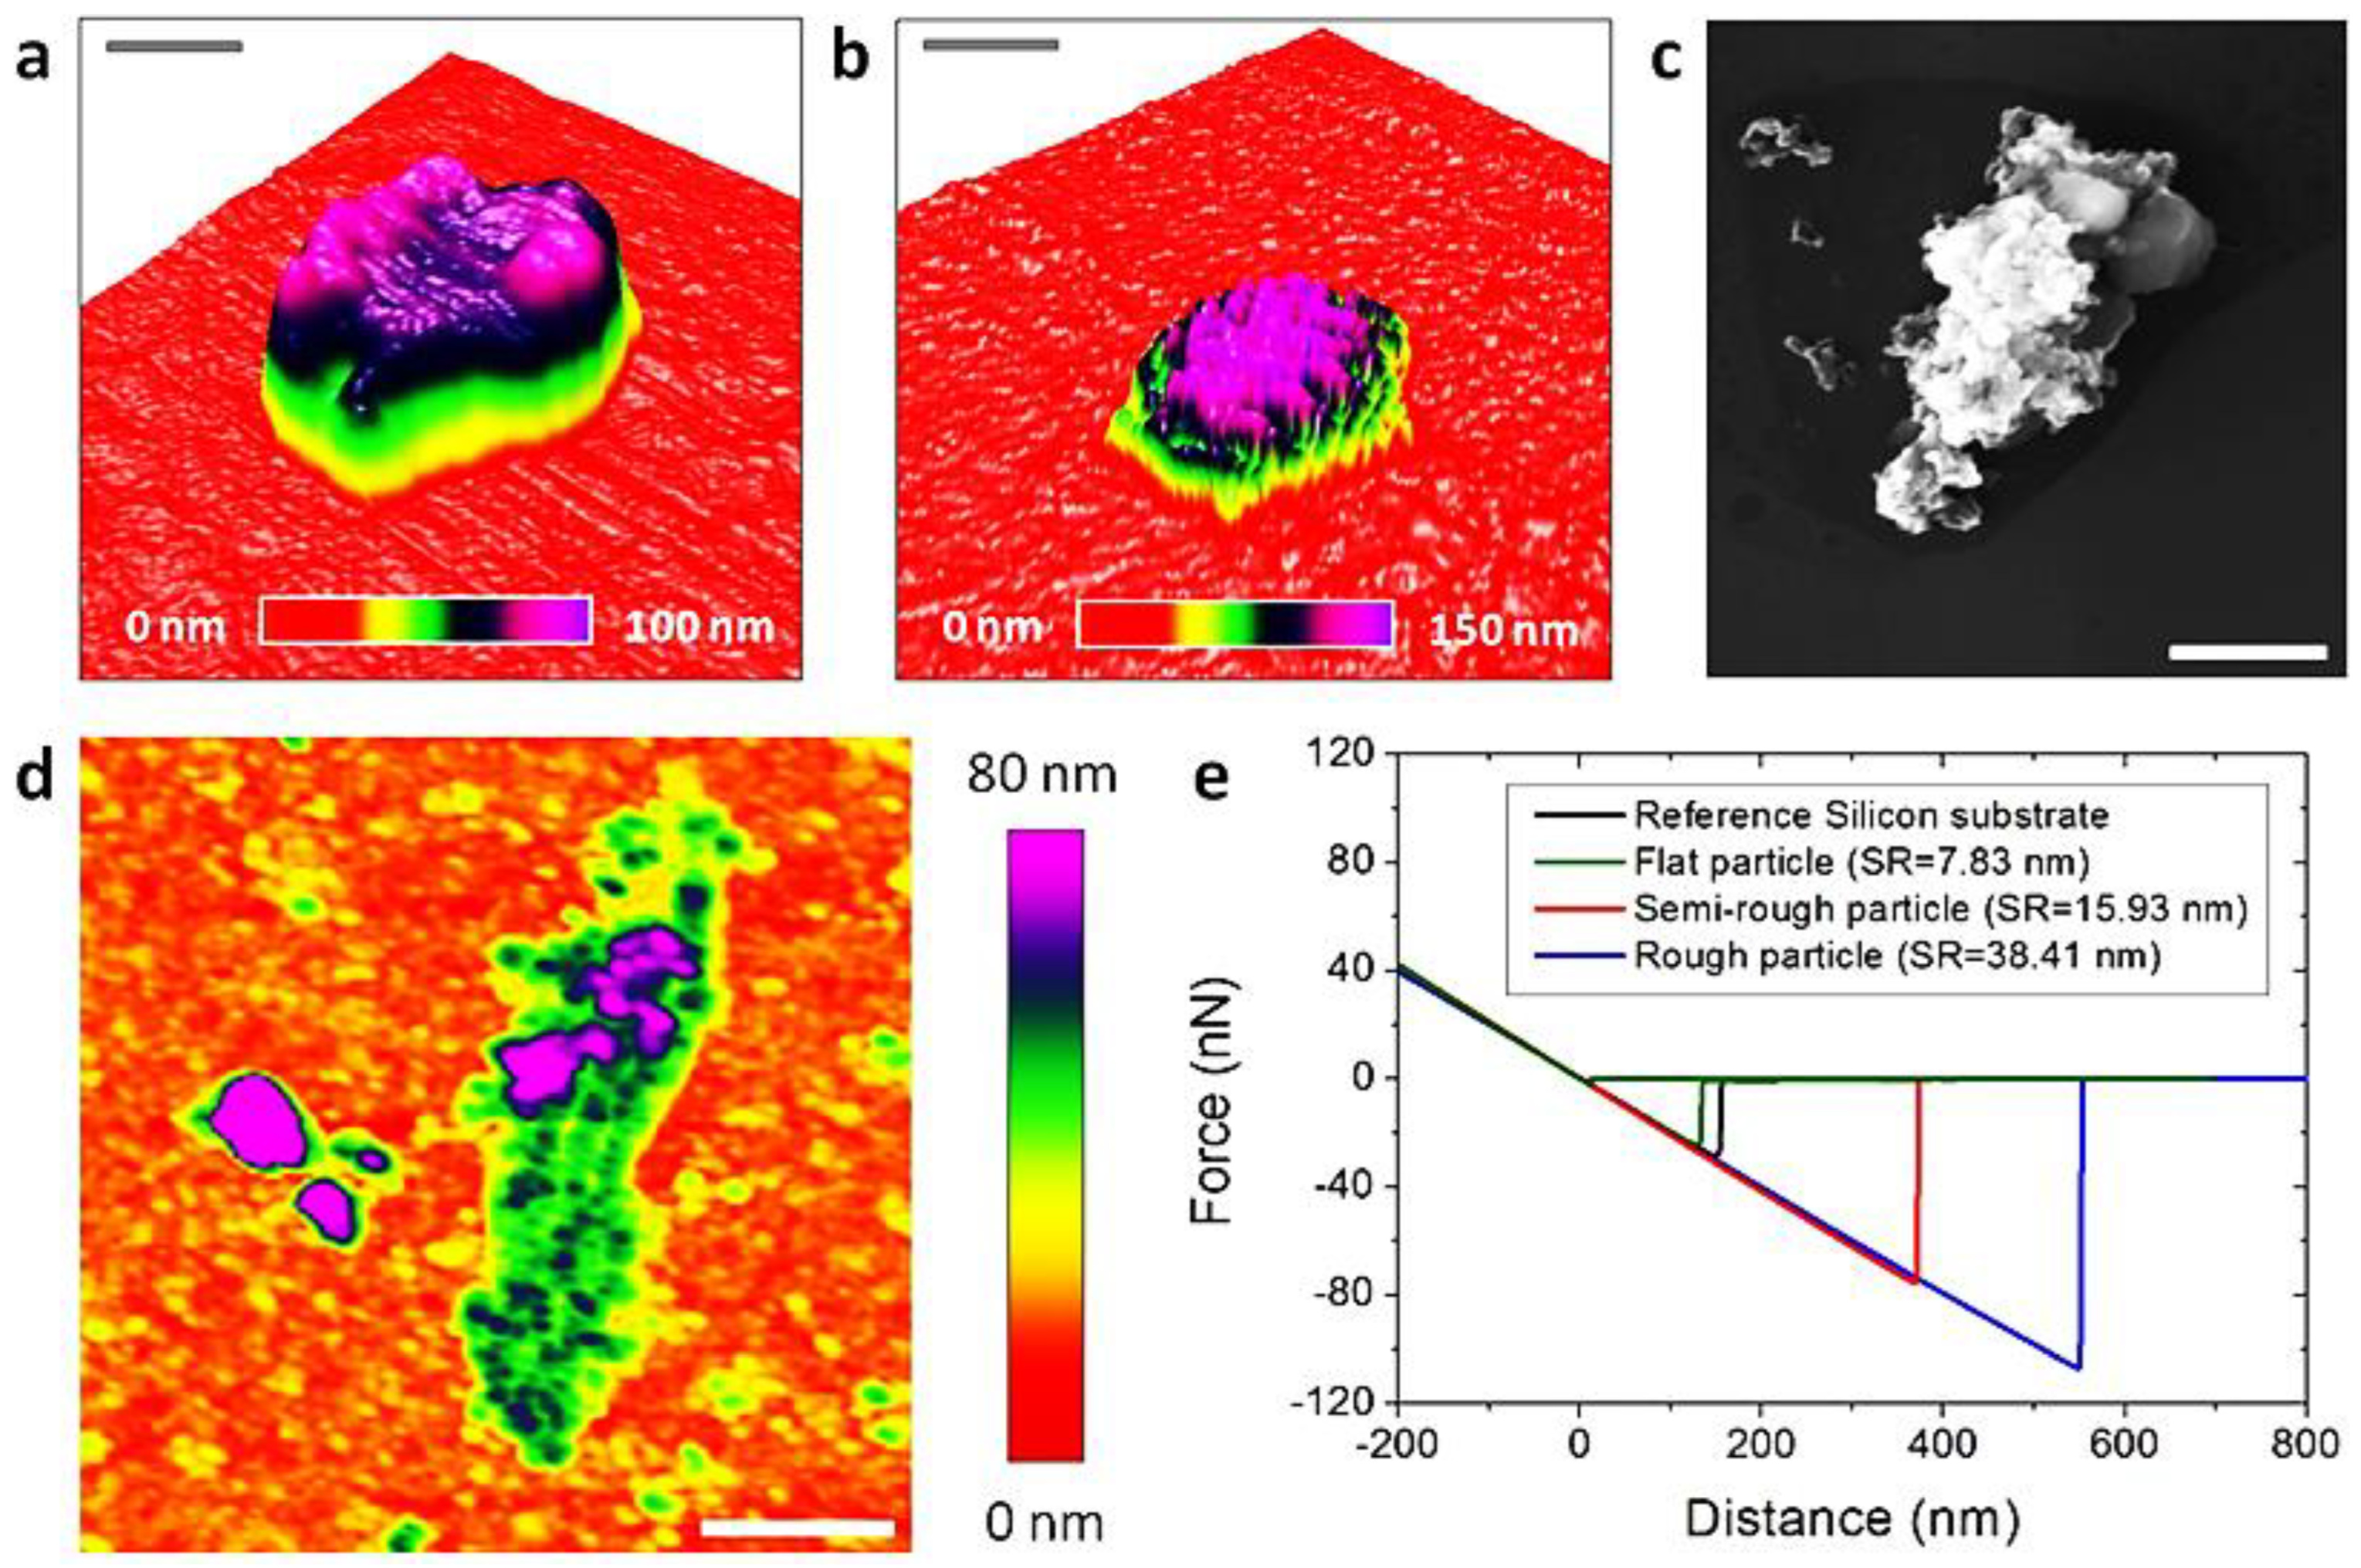
4.2.3. AFM
4.2.4. XRD
4.2.5. XRF
4.2.6. XPS
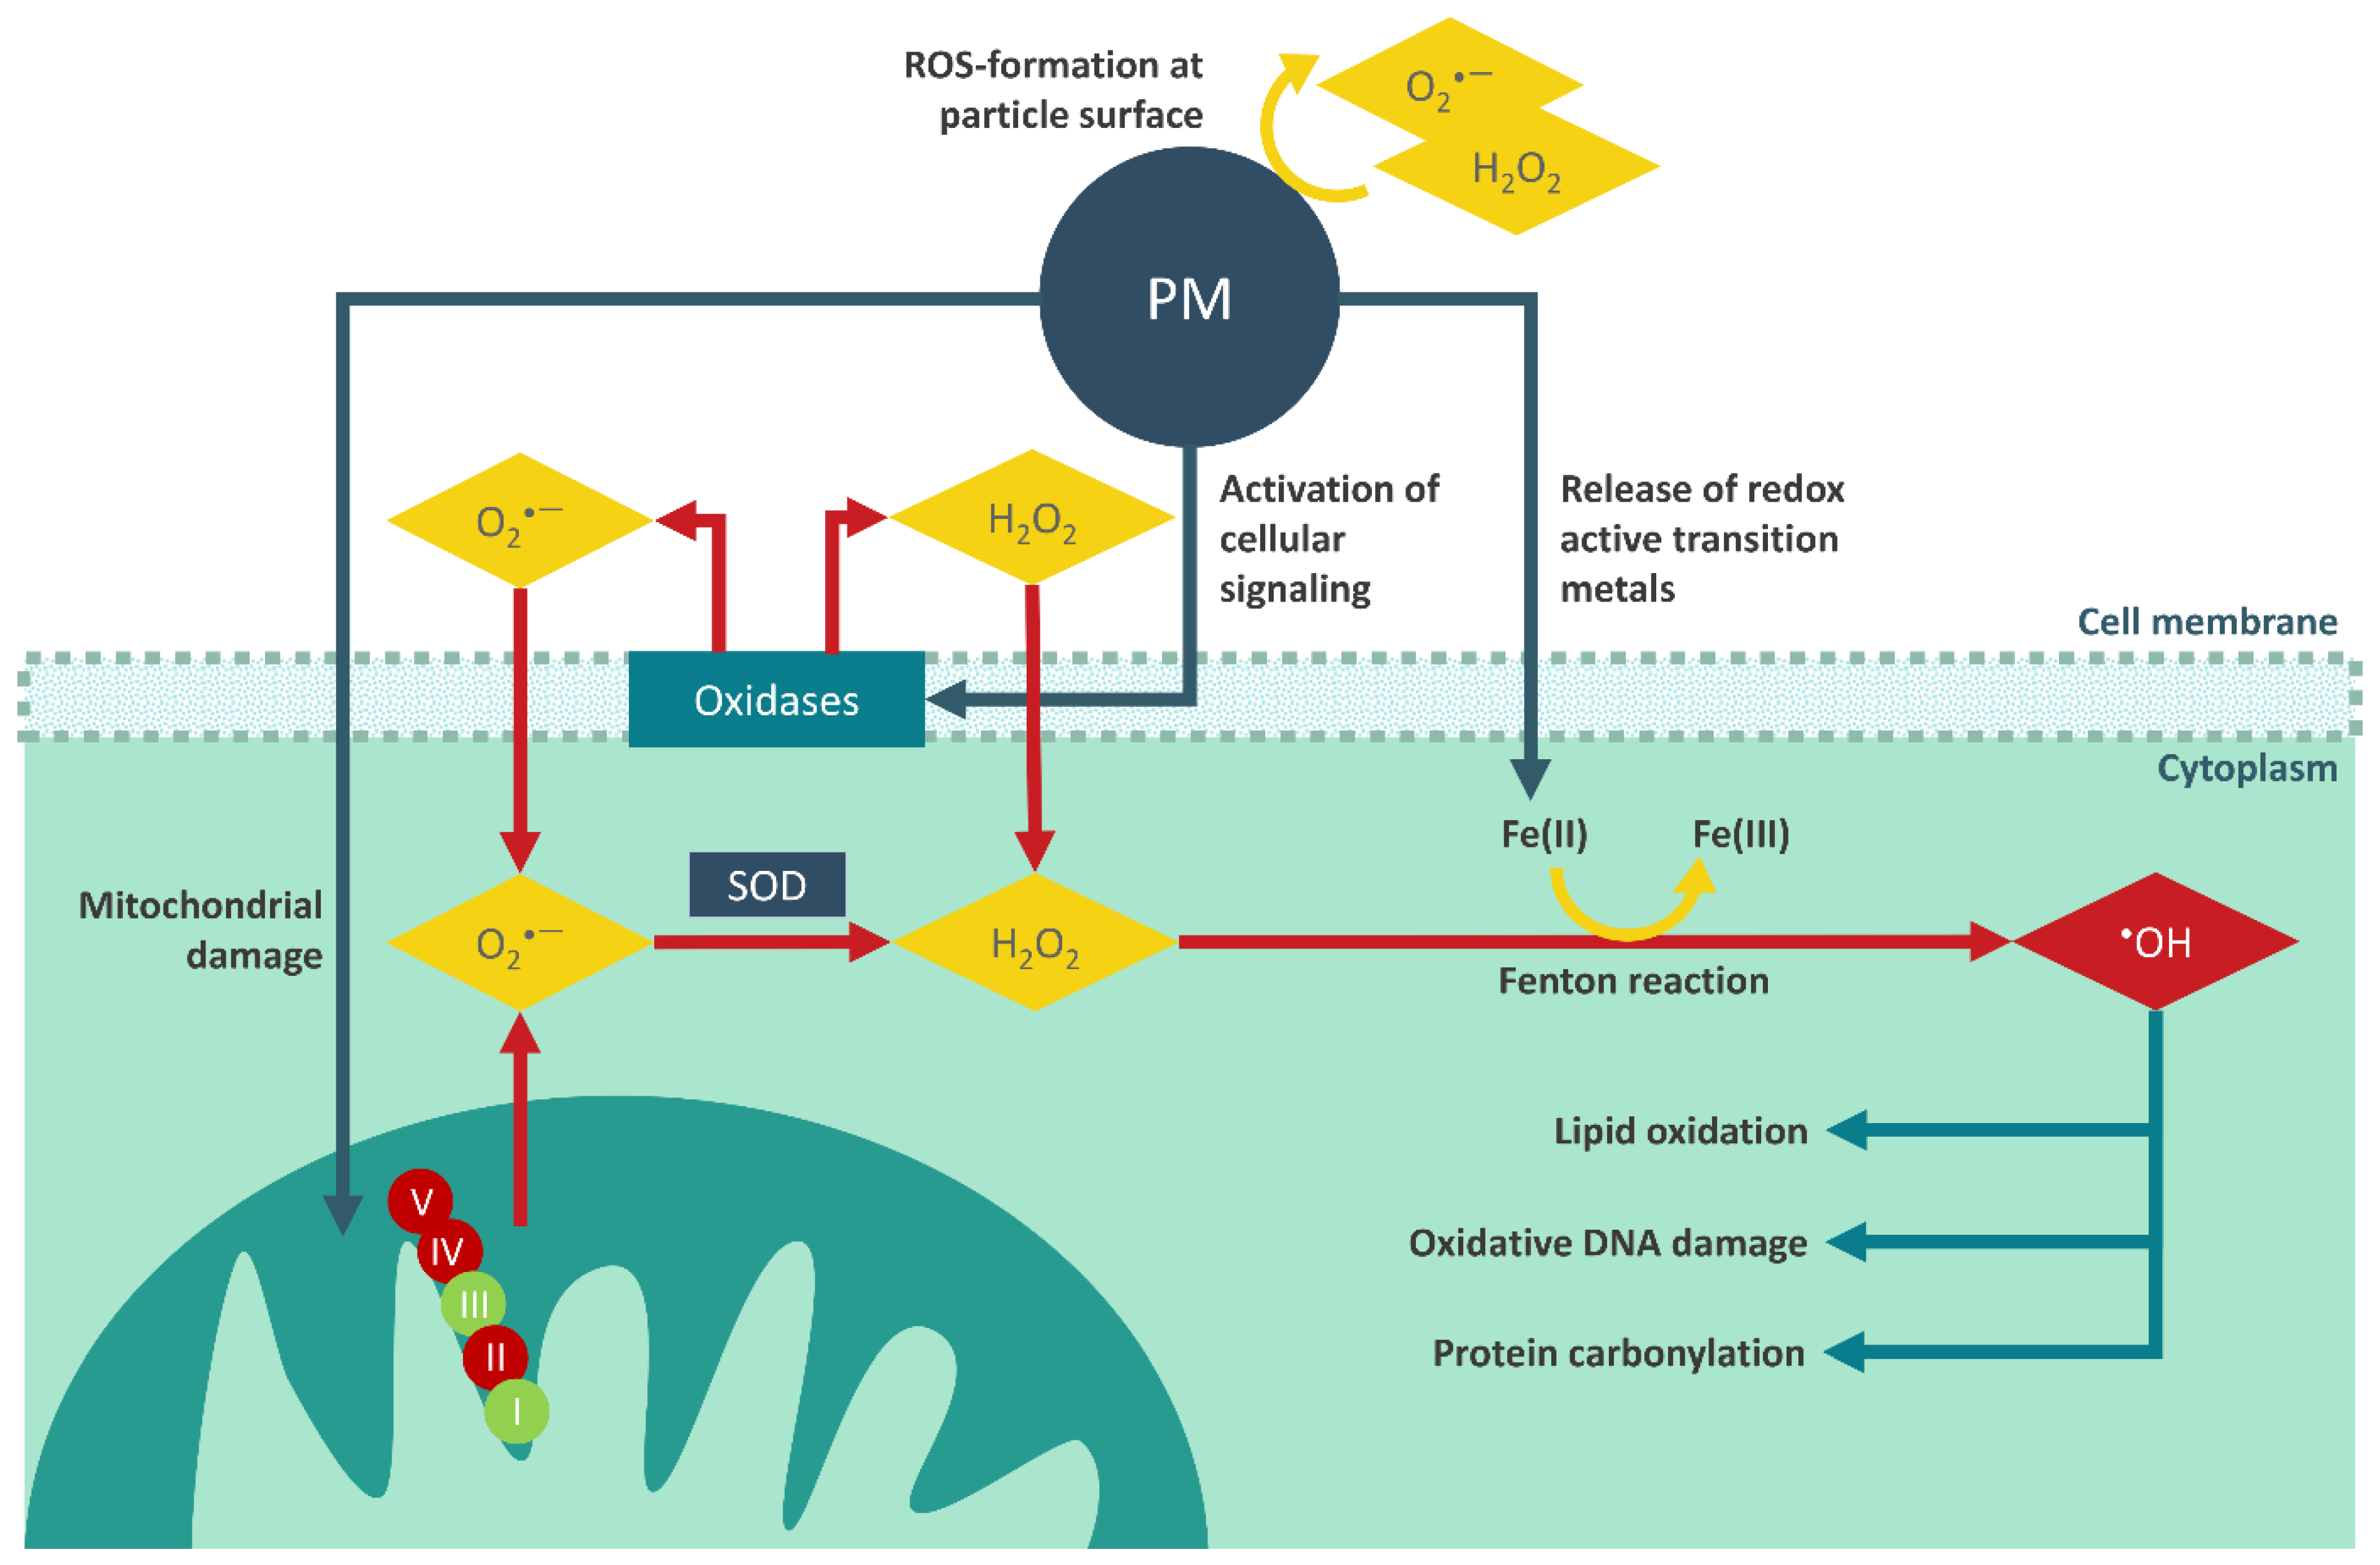
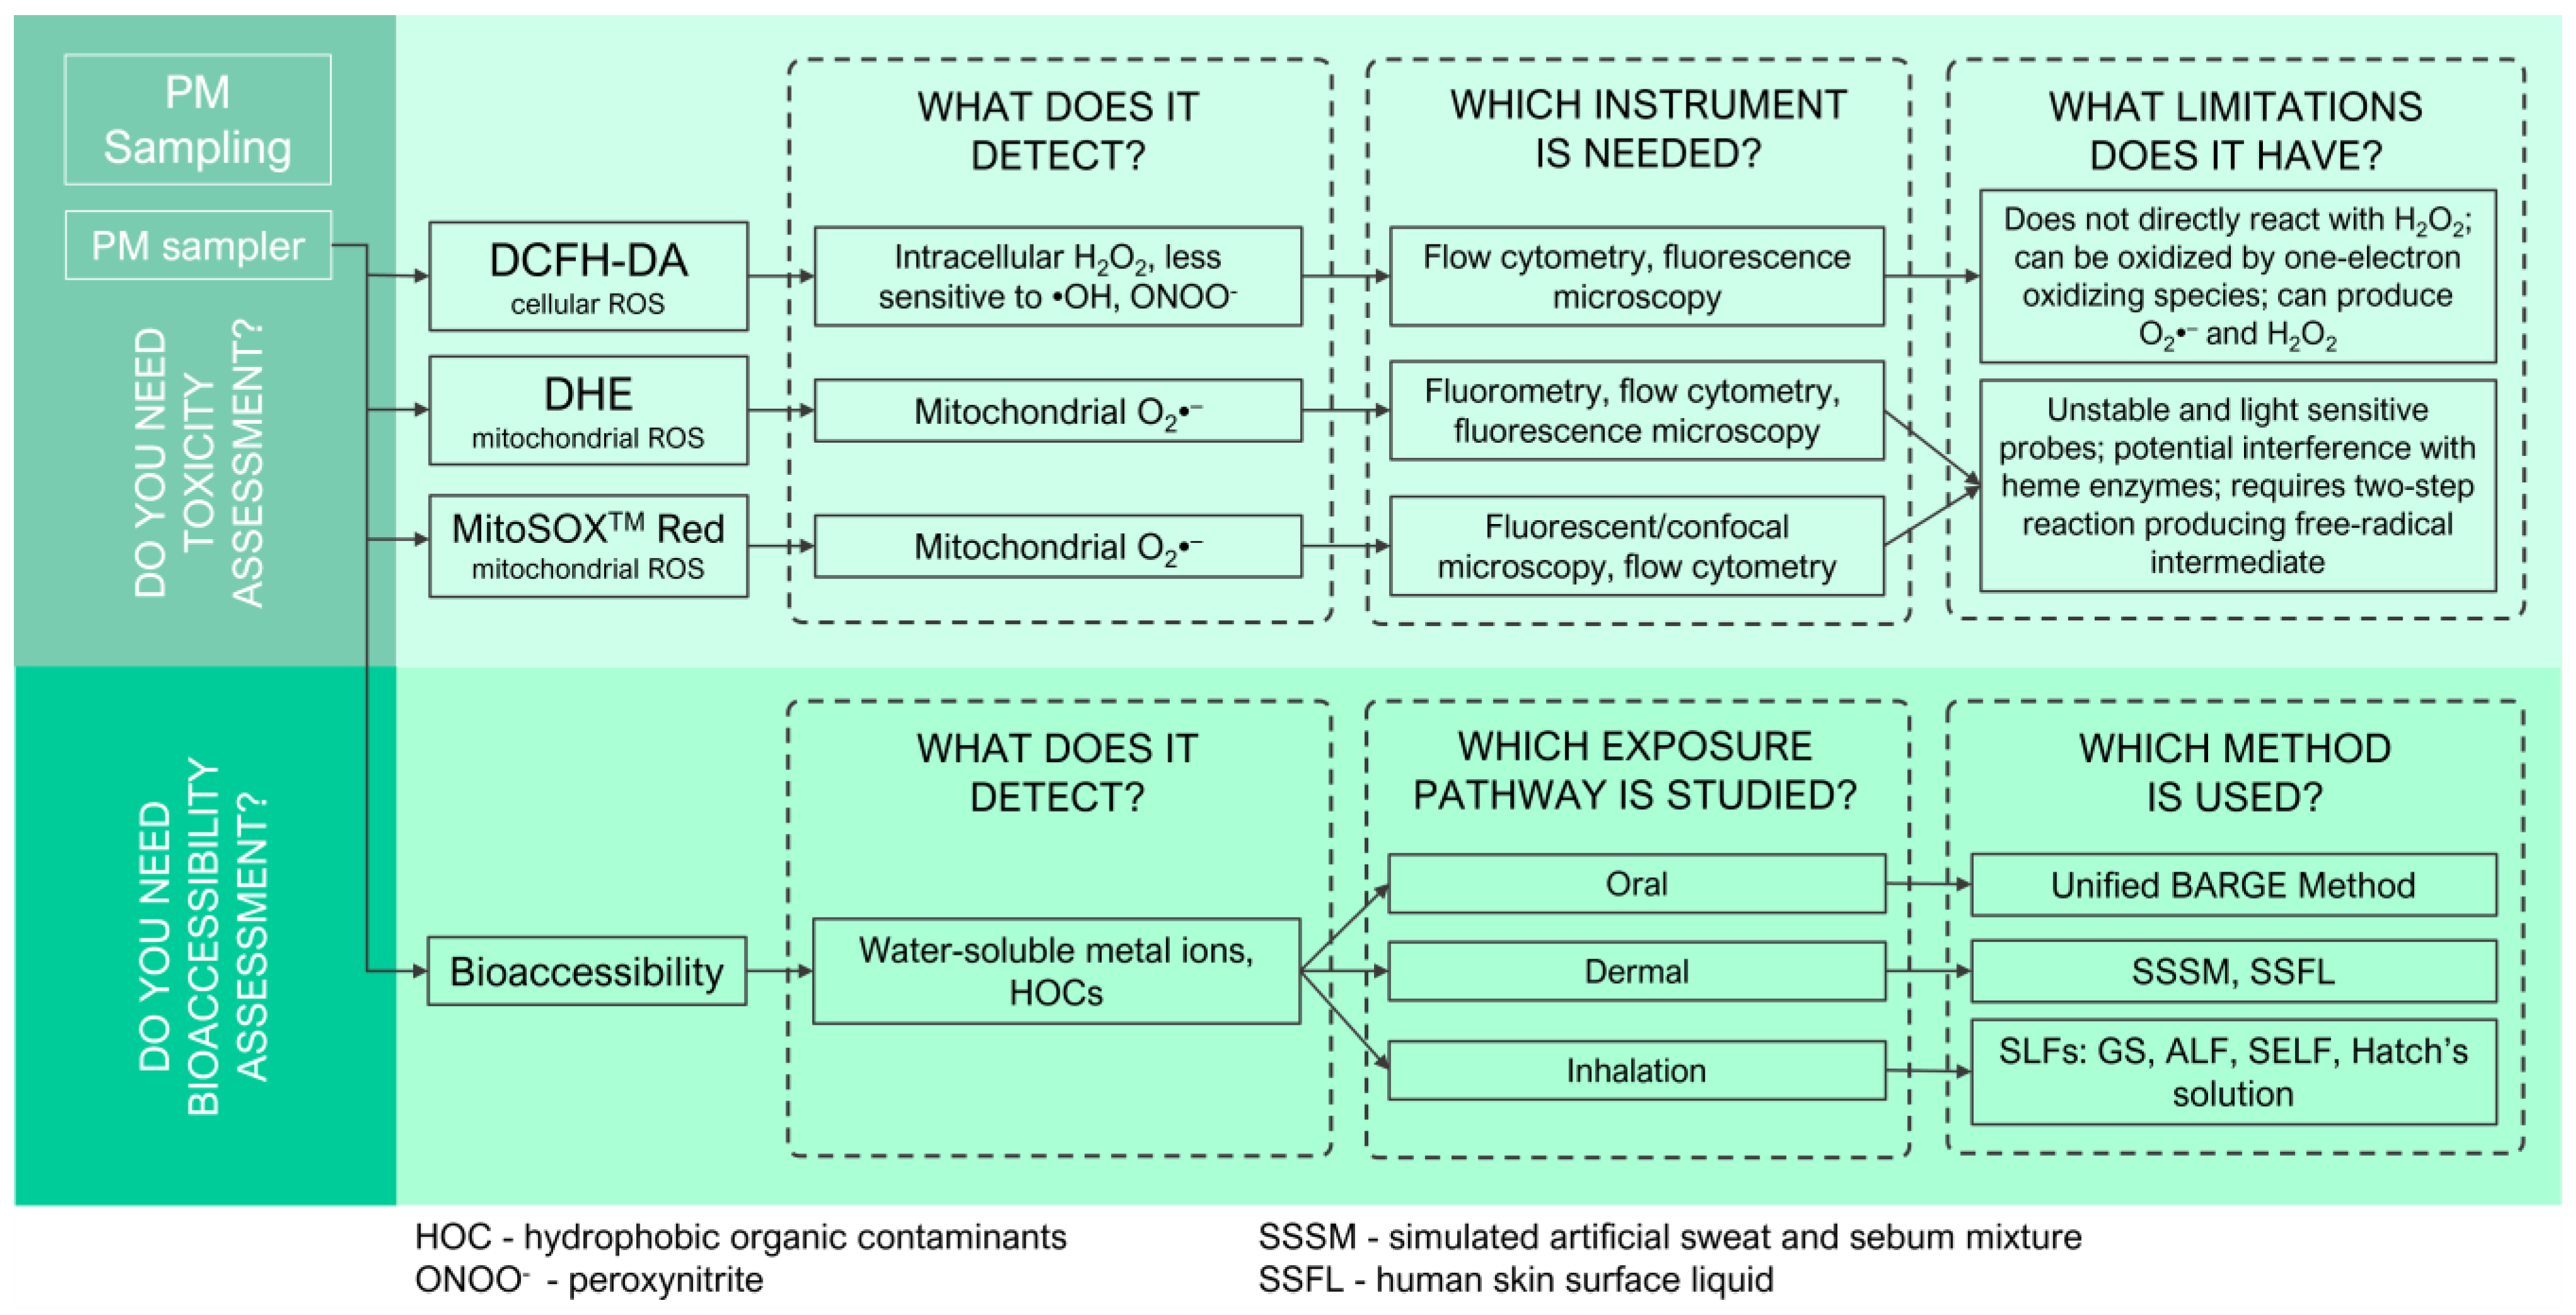
4.3. Determination of Intracellular and Mitochondrial ROS Production
4.4. Assessment of PTE Bioavailability via Bioaccessibility Testing
5. Characterization of Human Health Risks
6. Conclusions and Recommendations
Author Contributions
Funding
Institutional Review Board Statement
Informed Consent Statement
Conflicts of Interest
Abbreviations
| AAS | Atomic absorption spectrophotometry |
| AES | Atomic emission spectrometry |
| AFM | Atomic force microscopy |
| AFS | Atomic fluorescence spectrometer |
| ALF | Artificial lysosomal fluid |
| BC | Black carbon |
| CC-SEM | Computer controlled scanning electron microscopy |
| CE | Capillary electrophoresis |
| CEN | European Committee for Standardization |
| CPF | Conditional probability function |
| DCFH-DA | Dichloro-dihydro-fluorescein diacetate assay |
| DL | Detection limit |
| DPPC | 1, 2-dipalmitoyl-sn-glycero-3-phosphocholine |
| EDS | Energy dispersive X-ray spectroscopy |
| ED-XRF | Energy dispersive X-ray fluorescence |
| EELS | Electron energy-loss spectrometry |
| ESEM | Environmental scanning electron microscopy |
| FEG-SEM-EDS | Field emission gun scanning electron microscopy with an energy dispersive X-ray |
| FTIR | Fourier transform infrared spectroscopy |
| GC | Gas chromatography |
| Gpx | Glutathione peroxidase |
| GS | Gamble Solution |
| DHE | Dihydroethidium |
| HO−1 | Heme oxygenase 1 |
| HRTEM | High-resolution transmission electron microscope |
| IARC | The International Agency for Research on Cancer |
| IC | Ion chromatography |
| ICP-MS | Inductively coupled plasma |
| IL | Interleukin |
| INAA | Instrumental neutron activation analysis |
| JCPDS | Joint Committee of the Powder Diffraction Standard |
| LA-ICP-MS | Laser ablation inductively coupled plasma mass spectrometry |
| LC | Liquid chromatography |
| LMMS | Laser microprobe mass spectrometry |
| MCS | Monte Carlo simulation |
| NMR | Nuclear magnetic resonance spectroscopy |
| NIST | National Institute of Standards and Technology |
| NO | Nitric oxide |
| PC | Polycarbonate |
| OC | Organic carbon |
| PCA | Principal component analysis |
| PEEM | Photoemission electron microscopy |
| PESA | Particle elastic scattering analysis |
| PIGE | Particle-induced γ-ray emission |
| PIXE | Proton-induced X-ray emission |
| PM | Particulate matter |
| PMF | Positive matrix factorization |
| PAH | Polycyclic aromatic hydrocarbons |
| PTE | Potentially toxic elements |
| ROS | Reactive oxygen species |
| SEM-EDS | Scanning electron microscope with an energy dispersive X-ray |
| SIMS | Secondary ion mass spectrometry |
| SE | Secondary electron |
| SELF | Simulated epithelial lung fluid |
| SLF | Simulated lung fluid |
| SPEM | Scanning photoelectron microscopy |
| SPMS | Single-particle mass spectrometry |
| SRM | Standard reference material |
| SR-XRF | Synchrotron radiation X-ray fluorescence |
| STM/AFM | Scanning tunneling microscopy/atomic force microscopy |
| STEM | Scanning transmission electron microscopy |
| TEM | Transmission electron microscopy |
| TM-AFM | Tapping mode atomic force microscopy |
| TNF-α | Tumor necrosis factor-α |
| TOC | Thermal/optical carbon analysis |
| TOR | Thermal/optical reflectance |
| TSP | Total suspended particles |
| UBM | Unified BARGE Method |
| U.S. EPA | United States Environmental Protection Agency |
| VOCs | Volatile organic compounds |
| WD-XRF | Wavelength-dispersive X-ray fluorescence |
| XPS | X-ray photoelectron spectroscopy |
| XRD | X-ray diffraction |
| XRF | X-ray fluorescence |
References
- IPCC. Climate Change 2013: The Physical Science Basis. Contribution of Working Group I to the Fifth Assessment; Report of the Intergovernmental Panel on Climate Change 2013; Cambridge University Press: Cambridge, UK; New York, NY, USA, 2013; p. 1535. [Google Scholar]
- de Kok, T.M.C.M.; Driece, H.A.L.; Hogervorst, J.G.F.; Briedé, J.J. Toxicological assessment of ambient and traffic-related particulate matter: A review of recent studies. Mutat. Res. Rev. Mutat. Res. 2006, 613, 103–122. [Google Scholar] [CrossRef]
- Kim, K.H.; Kabir, E.; Kabir, S. A review on the human health impact of airborne particulate matter. Environ. Int. 2015, 74, 136–143. [Google Scholar] [CrossRef] [PubMed]
- Chuang, K.J.; Yan, Y.H.; Chiu, S.Y.; Cheng, T.J. Long-term air pollution exposure and risk factors for cardiovascular diseases among the elderly in Taiwan. Occup. Environ. Med. 2011, 68, 64–68. [Google Scholar] [CrossRef]
- Loomis, D.; Grosse, Y.; Lauby-Secretan, B.; El Ghissassi, F.; Bouvard, V.; Benbrahim-Tallaa, L.; Guha, N.; Baan, R.; Mattock, H.; Straif, K. The carcinogenicity of outdoor air pollution. Lancet Oncol. 2013, 14, 1262–1263. [Google Scholar] [CrossRef]
- Zauli-Sajani, S.; Rovelli, S.; Trentini, A.; Bacco, D.; Marchesi, S.; Scotto, F.; Zigola, C.; Lauriola, P.; Maria Cavallo, D.; Poluzzi, V.; et al. Higher health effects of ambient particles during the warm season: The role of infiltration factors. Sci. Total Environ. 2018, 627, 67–77. [Google Scholar] [CrossRef]
- Bové, H.; Bongaerts, E.; Slenders, E.; Bijnens, E.M.; Saenen, N.D.; Gyselaers, W.; van Eyken, P.; Plusquin, M.; Roeffaers, M.B.J.; Ameloot, M.; et al. Ambient black carbon particles reach the fetal side of human placenta. Nat. Commun. 2019, 10, 3866. [Google Scholar] [CrossRef]
- Yang, Y.; Ruan, Z.; Wang, X.; Yang, Y.; Mason, T.G.; Lin, H.; Tian, L. Short-term and long-term exposures to fine particulate matter constituents and health: A systematic review and meta-analysis. Environ. Pollut. 2019, 247, 874–882. [Google Scholar] [CrossRef] [PubMed]
- Farina, F.; Sancini, G.; Mantecca, P.; Gallinotti, D.; Camatini, M.; Palestini, P. The acute toxic effects of particulate matter in mouse lung are related to size and season of collection. Toxicol. Lett. 2011, 202, 209–217. [Google Scholar] [CrossRef]
- Kelly, F.J.; Fussell, J.C. Size, source and chemical composition as determinants of toxicity attributable to ambient particulate matter. Atmos. Environ. 2012, 60, 504–526. [Google Scholar] [CrossRef]
- Feng, X.; Shao, L.; Xi, C.; Jones, T.; Zhang, D.; BéruBé, K. Particle-induced oxidative damage by indoor size segregated particulate matter from coal-burning homes in the Xuanwei Lung Cancer epidemic area, Yunnan Province, China. Chemosphere 2020, 256, 127058. [Google Scholar] [CrossRef]
- Figliuzzi, M.; Tironi, M.; Longaretti, L.; Mancini, A.; Teoldi, F.; Sangalli, F.; Remuzzi, A. Copper-dependent biological effects of particulate matter produced by brake systems on lung alveolar cells. Arch. Toxicol. 2020, 94, 2965–2979. [Google Scholar] [CrossRef] [PubMed]
- Pardo, M.; Qiu, X.; Zimmermann, R.; Rudich, Y. Particulate matter toxicity is nrf2 and mitochondria dependent: The roles of metals and polycyclic aromatic hydrocarbons. Chem. Res. Toxicol. 2020, 33, 1110–1120. [Google Scholar] [CrossRef]
- Wu, D.; Li, Q.; Ding, X.; Sun, J.; Li, D.; Fu, H.; Teich, M.; Ye, X.; Chen, J. Primary Particulate Matter Emitted from Heavy Fuel and Diesel Oil Combustion in a Typical Container Ship: Characteristics and Toxicity. Environ. Sci. Technol. 2018, 52, 12943–12951. [Google Scholar] [CrossRef] [PubMed]
- Yang, J.; Huo, T.; Zhang, X.; Ma, J.; Wang, Y.; Dong, F.; Deng, J. Oxidative stress and cell cycle arrest induced by short-term exposure to dustfall PM2.5 in A549 cells. Environ. Sci. Pollut. Res. 2018, 25, 22408–22419. [Google Scholar] [CrossRef] [PubMed]
- Ren, H.; Lu, J.; Ning, J.; Su, X.; Tong, Y.; Chen, J.; Ding, Y. Exposure to fine particulate matter induces self-recovery and susceptibility of oxidative stress and inflammation in rat lungs. Environ. Sci. Pollut. Res. 2020, 27, 40262–40276. [Google Scholar] [CrossRef] [PubMed]
- Jan, R.; Roy, R.; Bhor, R.; Pai, K.; Satsangi, P.G. Toxicological screening of airborne particulate matter in atmosphere of Pune: Reactive oxygen species and cellular toxicity. Environ. Pollut. 2020, 261, 113724. [Google Scholar] [CrossRef] [PubMed]
- Könczöl, M.; Ebeling, S.; Goldenberg, E.; Treude, F.; Gminski, R.; Gieré, R.; Grobéty, B.; Rothen-Rutishauser, B.; Merfort, I.; Mersch-Sundermann, V. Cytotoxicity and genotoxicity of size-fractionated iron oxide (magnetite) in A549 human lung epithelial cells: Role of ROS, JNK, and NF-κB. Chem. Res. Toxicol. 2011, 24, 1460–1475. [Google Scholar] [CrossRef]
- Michael, S.; Montag, M.; Dott, W. Pro-inflammatory effects and oxidative stress in lung macrophages and epithelial cells induced by ambient particulate matter. Environ. Pollut. 2013, 183, 19–29. [Google Scholar] [CrossRef]
- Xiao, Z.; Shao, L.; Zhang, N.; Wang, J.; Chuang, H.C.; Deng, Z.; Wang, Z.; BéruBé, K. A toxicological study of inhalable particulates in an industrial region of Lanzhou City, northwestern China: Results from plasmid scission assay. Aeolian Res. 2014, 14, 25–34. [Google Scholar] [CrossRef]
- Niu, X.; Ho, K.F.; Hu, T.; Sun, J.; Duan, J.; Huang, Y.; Lui, K.H.; Cao, J. Characterization of chemical components and cytotoxicity effects of indoor and outdoor fine particulate matter (PM2.5) in Xi’an, China. Environ. Sci. Pollut. Res. 2019, 26, 31913–31923. [Google Scholar] [CrossRef]
- Vargas Buonfiglio, L.G.; Comellas, A.P. Mechanism of ambient particulate matter and respiratory infections. J. Thorac. Dis. 2020, 12, 134–136. [Google Scholar] [CrossRef] [PubMed]
- Li, Y.; Shao, L.; Wang, W.; Zhang, M.; Feng, X.; Li, W.; Zhang, D. Airborne fiber particles: Types, size and concentration observed in Beijing. Sci. Total Environ. 2020, 705, 135967. [Google Scholar] [CrossRef] [PubMed]
- Elmes, M.; Gasparon, M. Sampling and single particle analysis for the chemical characterisation of fine atmospheric particulates: A review. J. Environ. Manag. 2017, 202, 137–150. [Google Scholar] [CrossRef] [PubMed]
- Galvão, E.S.; Santos, J.M.; Lima, A.T.; Reis, N.C.; Orlando, M.T.D.A.; Stuetz, R.M. Trends in analytical techniques applied to particulate matter characterization: A critical review of fundaments and applications. Chemosphere 2018, 199, 546–568. [Google Scholar] [CrossRef]
- Kumar, P.; Kalaiarasan, G.; Porter, A.E.; Pinna, A.; Kłosowski, M.M.; Demokritou, P.; Chung, K.F.; Pain, C.; Arvind, D.K.; Arcucci, R.; et al. An overview of methods of fine and ultrafine particle collection for physicochemical characterisation and toxicity assessments. Sci. Total Environ. 2020, 756, 143553. [Google Scholar] [CrossRef]
- Maceira, A.; Marcé, R.M.; Borrull, F. Analytical methods for determining organic compounds present in the particulate matter from outdoor air. TrAC Trends Anal. Chem. 2020, 122, 115707. [Google Scholar] [CrossRef]
- Ogrizek, M.; Kroflič, A.; Šala, M. Critical review on the development of analytical techniques for the elemental analysis of airborne particulate matter. Trends Environ. Anal. Chem. 2022, 33, e00155. [Google Scholar] [CrossRef]
- Akhtar, U.S.; Scott, J.A.; Chu, A.; Evans, G.J. In vivo and in vitro assessment of particulate matter toxicology. In Environmental Science and Engineering (Subseries: Environmental Science); Springer: Berlin/Heidelberg, Germany, 2011; pp. 427–449. [Google Scholar] [CrossRef]
- Losacco, C.; Perillo, A. Particulate matter air pollution and respiratory impact on humans and animals. Environ. Sci. Pollut. Res. 2018, 25, 33901–33910. [Google Scholar] [CrossRef]
- Zavala, J.; Freedman, A.N.; Szilagyi, J.T.; Jaspers, I.; Wambaugh, J.F.; Higuchi, M.; Rager, J.E. New approach methods to evaluate health risks of air pollutants: Critical design considerations for in vitro exposure testing. Int. J. Environ. Res. Public Health 2020, 17, 2124. [Google Scholar] [CrossRef]
- Chan, Y.; Wang, B.; Chen, H.; Fai Ho, K.; Cao, J.; Hai, G.; Herbert, C.; Thomas, P.S.; Saad, S.; Gregory George Oliver, B. 2019. Available online: www.physiology.org/journal/ajplung (accessed on 15 May 2021).
- Cáceres, L.; Paz, M.L.; Garcés, M.; Calabró, V.; Magnani, N.D.; Martinefski, M.; Martino Adami, P.V.; Caltana, L.; Tasat, D.; Morelli, L.; et al. NADPH oxidase and mitochondria are relevant sources of superoxide anion in the oxinflammatory response of macrophages exposed to airborne particulate matter. Ecotoxicol. Environ. Saf. 2020, 205, 111186. [Google Scholar] [CrossRef]
- Øvrevik, J.; Refsnes, M.; Låg, M.; Holme, J.; Schwarze, P. Activation of proinflammatory responses in cells of the airway mucosa by particulate matter: Oxidant- and non-oxidant-mediated triggering mechanisms. Biomolecules 2015, 5, 1399–1440. [Google Scholar] [CrossRef] [PubMed]
- Bakand, S.; Hayes, A.; Dechsakulthorn, F. Nanoparticles: A review of particle toxicology following inhalation exposure. In Inhal. Toxicol. 2012, 24, 125–135. [Google Scholar] [CrossRef] [PubMed]
- Wang, X.; Wang, Y.; Guo, F.; Wang, D.; Bai, Y. Physicochemical characteristics of particulate matter emitted by diesel blending with various aromatics. Fuel 2020, 275, 117928. [Google Scholar] [CrossRef]
- Priyan, R.S.; Peter, A.E.; Menon, J.S.; George, M.; Nagendra, S.M.S.; Khare, M. Composition, sources, and health risk assessment of particulate matter at two different elevations in Delhi City. Atmos. Pollut. Res. 2022, 13, 101295. [Google Scholar] [CrossRef]
- U.S. EPA. Guidelines for Human Exposure Assessment Risk Assessment Forum. 2019. Available online: www.epa.gov/risk (accessed on 31 March 2021).
- Cassee, F.R.; Héroux, M.E.; Gerlofs-Nijland, M.E.; Kelly, F.J. Particulate matter beyond mass: Recent health evidence on the role of fractions, chemical constituents and sources of emission. Inhal. Toxicol. 2013, 25, 802–812. [Google Scholar] [CrossRef]
- Wang, X.; Guo, Y.; Cai, M.; Qian, Z.M.; Zhang, S.; Zhang, Z.; Yang, Y.; Vaughn, M.G.; Aaron, H.E.; Wu, F.; et al. Constituents of fine particulate matter and asthma in 6 low- and middle-income countries. J. Allergy Clin. Immunol. 2022, 150, 214–222.e5. [Google Scholar] [CrossRef] [PubMed]
- Aztatzi-Aguilar, O.; Valdés-Arzate, A.; Debray-García, Y.; Calderón-Aranda, E.; Uribe-Ramirez, M.; Acosta-Saavedra, L.; Gonsebatt, M.; Maciel-Ruiz, J.; Petrosyan, P.; Mugica-Alvarez, V.; et al. Exposure to ambient particulate matter induces oxidative stress in lung and aorta in a size- and time-dependent manner in rats. Toxicol. Res. Appl. 2018, 2, 239784731879485. [Google Scholar] [CrossRef]
- Xue, J.; Hu, S.; Quiros, D.; Ayala, A.; Jung, H.S. How do particle number, surface area, and mass correlate with toxicity of diesel particle emissions as measured in chemical and cellular assays? Chemosphere 2019, 229, 559–569. [Google Scholar] [CrossRef]
- He, Y.; Jiang, Y.; Yang, Y.; Xu, J.; Zhang, Y.; Wang, Q.; Shen, H.; Zhang, Y.; Yan, D.; Peng, Z.; et al. Composition of fine particulate matter and risk of preterm birth: A nationwide birth cohort study in 336 Chinese cities. J. Hazard. Mater. 2022, 425, 127645. [Google Scholar] [CrossRef] [PubMed]
- Thomson, E.M.; Breznan, D.; Karthikeyan, S.; MacKinnon-Roy, C.; Charland, J.P.; Dabek-Zlotorzynska, E.; Celo, V.; Kumarathasan, P.; Brook, J.R.; Vincent, R. Cytotoxic and inflammatory potential of size-fractionated particulate matter collected repeatedly within a small urban area. Part. Fibre Toxicol. 2015, 12, 24. [Google Scholar] [CrossRef]
- Guney, M.; Chapuis, R.P.; Zagury, G.J. Lung bioaccessibility of contaminants in particulate matter of geological origin. Environ. Sci. Pollut. Res. 2016, 23, 24422–24434. [Google Scholar] [CrossRef] [PubMed]
- Huang, Y.C.T.; Karoly, E.D.; Dailey, L.A.; Schmitt, M.T.; Silbajoris, R.; Graff, D.W.; Devlin, R. Comparison of gene expression profiles induced by coarse, fine, and ultrafine particulate matter. J. Toxicol. Environ. Health Part A Curr. Issues 2011, 74, 296–312. [Google Scholar] [CrossRef] [PubMed]
- Ghadikolaei, M.A.; Wei, L.; Cheung, C.S.; Yung, K.F.; Ning, Z. Particulate emission and physical properties of particulate matter emitted from a diesel engine fueled with ternary fuel (diesel-biodiesel-ethanol) in blended and fumigation modes. Fuel 2020, 263, 116665. [Google Scholar] [CrossRef]
- Ault, A.P.; Peters, T.M.; Sawvel, E.J.; Casuccio, G.S.; Willis, R.D.; Norris, G.A.; Grassian, V.H. Single-particle SEM-EDX analysis of iron-containing coarse particulate matter in an urban environment: Sources and distribution of iron within Cleveland, Ohio. Environ. Sci. Technol. 2012, 46, 4331–4339. [Google Scholar] [CrossRef] [PubMed]
- Qian, W.; Huang, H.; Pan, M.; Huang, R.; Wei, J.; Liu, J. Analysis of morphology, nanostructure, and oxidation reaction of soot particulates from CI engines with dimethoxymethane–diesel blends under different loads and speeds. Fuel 2020, 278, 118263. [Google Scholar] [CrossRef] [PubMed]
- Zhou, J.H.; Cheung, C.S.; Zhao, W.Z.; Ning, Z.; Leung, C.W. Impact of intake hydrogen enrichment on morphology, structure and oxidation reactivity of diesel particulate. Appl. Energy 2015, 160, 442–455. [Google Scholar] [CrossRef]
- Li, W.; Shao, L. Transmission electron microscopy study of aerosol particles from the Brown Hazes in northern China. J. Geophys. Res. 2009, 114. [Google Scholar] [CrossRef]
- Gritti, F.; Leonardis, I.; Abia, J.; Guiochon, G. Physical properties and structure of fine core–shell particles used as packing materials for chromatography. J. Chromatogr. A 2010, 1217, 3819–3843. [Google Scholar] [CrossRef]
- González, L.T.; Longoria Rodríguez, F.E.; Sánchez-Domínguez, M.; Cavazos, A.; Leyva-Porras, C.; Silva-Vidaurri, L.G.; Askar, K.A.; Kharissov, B.I.; Villarreal Chiu, J.F.; Alfaro Barbosa, J.M. Determination of trace metals in TSP and PM2.5 materials collected in the Metropolitan Area of Monterrey, Mexico: A characterization study by XPS, ICP-AES and SEM-EDS. Atmos. Res. 2017, 196, 8–22. [Google Scholar] [CrossRef]
- Wang, F.; Liu, J.; Zeng, H. Interactions of particulate matter and pulmonary surfactant: Implications for human health. Adv. Colloid Interface Sci. 2020, 284, 102244. [Google Scholar] [CrossRef]
- Fubini, B.; Fenoglio, I. Toxic potential of mineral dusts. Elements 2007, 3, 407–414. [Google Scholar] [CrossRef]
- Chatterjee, N.; Flury, M. Effect of particle shape on capillary forces acting on particles at the air–water interface. Langmuir 2013, 29, 7903–7911. [Google Scholar] [CrossRef] [PubMed]
- Wu, Y.; Lou, J.; Sun, X.; Ma, L.Q.; Wang, J.; Li, M.; Sun, H.; Li, H.; Huang, L. Linking elevated blood lead level in urban school-aged children with bioaccessible lead in neighborhood soil. Environ. Pollut. 2020, 261, 114093. [Google Scholar] [CrossRef] [PubMed]
- Thompson, J.E. Airborne particulate matter: Human Exposure and Health Effects. J. Occup. Environ. Med. 2018, 60, 392–423. [Google Scholar] [CrossRef] [PubMed]
- Kirrane, E.F.; Luben, T.J.; Benson, A.; Owens, E.O.; Sacks, J.D.; Dutton, S.J.; Madden, M.; Nichols, J.L. A systematic review of cardiovascular responses associated with Ambient Black Carbon and Fine Particulate matter. Environ. Int. 2019, 127, 305–316. [Google Scholar] [CrossRef]
- Ramli, N.A.; Md Yusof, N.F.; Shith, S.; Suroto, A. Chemical and biological compositions associated with ambient respirable particulate matter: A Review. Water Air Soil Pollut. 2020, 231, 120. [Google Scholar] [CrossRef]
- Vardoulakis, S.; Giagloglou, E.; Steinle, S.; Davis, A.; Sleeuwenhoek, A.; Galea, K.S.; Dixon, K.; Crawford, J.O. Indoor exposure to selected air pollutants in the home environment: A systematic review. Int. J. Environ. Res. Public Health 2020, 17, 8972. [Google Scholar] [CrossRef]
- Peixoto, M.S.; de Oliveira Galvão, M.F.; Batistuzzo de Medeiros, S.R. Cell death pathways of particulate matter toxicity. Chemosphere 2017, 188, 32–48. [Google Scholar] [CrossRef] [PubMed]
- Li, N.; Champion, W.M.; Imam, J.; Sidhu, D.; Salazar, J.R.; Majestic, B.J.; Montoya, L.D. Evaluation of cellular effects of fine particulate matter from combustion of solid fuels used for indoor heating on the Navajo Nation using a stratified oxidative stress response model. Atmos. Environ. 2018, 182, 87–96. [Google Scholar] [CrossRef]
- Cortese, A.; Lova, L.; Comoli, P.; Volpe, E.; Villa, S.; Mallucci, G.; La Salvia, S.; Romani, A.; Franciotta, D.; Bollati, V.; et al. Air pollution as a contributor to the inflammatory activity of multiple sclerosis. J. Neuroinflamm. 2020, 17. [Google Scholar] [CrossRef] [PubMed]
- Könczöl, M.; Goldenberg, E.; Ebeling, S.; Schäfer, B.; Garcia-Käufer, M.; Gminski, R.; Grobéty, B.; Rothen-Rutishauser, B.; Merfort, I.; Gieré, R.; et al. Cellular uptake and toxic effects of fine and ultrafine metal-sulfate particles in human A549 lung epithelial cells. Chem. Res. Toxicol. 2012, 25, 2687–2703. [Google Scholar] [CrossRef] [PubMed]
- Ma, S.; Ren, K.; Liu, X.; Chen, L.; Li, M.; Li, X.; Yang, J.; Huang, B.; Zheng, M.; Xu, Z. Production of hydroxyl radicals from Fe-containing fine particles in Guangzhou, China. Atmos. Environ. 2015, 123, 72–78. [Google Scholar] [CrossRef]
- Wang, X.; Sato, T.; Xing, B. Size distribution and anthropogenic sources apportionment of airborne trace metals in Kanazawa, Japan. Chemosphere 2006, 65, 2440–2448. [Google Scholar] [CrossRef]
- Geiger, A.; Cooper, J. Overview of Airborne Metals Regulations, Exposure Limits, Health Effects, and Contemporary Research; Environmental Protection Agency: Portland, OR, USA, 2010.
- Pant, P.; Harrison, R.M. Estimation of the contribution of road traffic emissions to particulate matter concentrations from field measurements: A review. Atmos. Environ. 2013, 77, 78–97. [Google Scholar] [CrossRef]
- Landis, M.S.; Patrick Pancras, J.; Graney, J.R.; White, E.M.; Edgerton, E.S.; Legge, A.; Percy, K.E. Source apportionment of ambient fine and coarse particulate matter at the Fort McKay community site, in the Athabasca Oil Sands Region, Alberta, Canada. Sci. Total Environ. 2017, 584–585, 105–117. [Google Scholar] [CrossRef] [PubMed]
- Sharma, S.K.; Mandal, T.K. Chemical composition of fine mode particulate matter (PM2.5) in an urban area of Delhi, India and its source apportionment. Urban Clim. 2017, 21, 106–122. [Google Scholar] [CrossRef]
- de Miranda, R.M.; de Fatima Andrade, M.; Dutra Ribeiro, F.N.; Mendonça Francisco, K.J.; Pérez-Martínez, P.J. Source apportionment of fine particulate matter by positive matrix factorization in the metropolitan area of São Paulo, Brazil. J. Clean. Prod. 2018, 202, 253–263. [Google Scholar] [CrossRef]
- Popoola, L.T.; Adebanjo, S.A.; Adeoye, B.K. Assessment of atmospheric particulate matter and heavy metals: A critical review. Int. J. Environ. Sci. Technol. 2018, 15, 935–948. [Google Scholar] [CrossRef]
- Soleimani, M.; Amini, N.; Sadeghian, B.; Wang, D.; Fang, L. Heavy metals and their source identification in particulate matter (PM2.5) in Isfahan City, Iran. J. Environ. Sci. 2018, 72, 166–175. [Google Scholar] [CrossRef]
- Zhang, R.; Liu, C.; Zhou, G.; Sun, J.; Liu, N.; Hsu, P.C.; Wang, H.; Qiu, Y.; Zhao, J.; Wu, T.; et al. Morphology and property investigation of primary particulate matter particles from different sources. Nano Res. 2017, 11, 3182–3192. [Google Scholar] [CrossRef]
- Almeida, S.M.; Manousakas, M.; Diapouli, E.; Kertesz, Z.; Samek, L.; Hristova, E.; Šega, K.; Alvarez, R.P.; Belis, C.A.; Eleftheriadis, K. Ambient particulate matter source apportionment using receptor modelling in European and Central Asia urban areas. Environ. Pollut. 2020, 266, 115199. [Google Scholar] [CrossRef] [PubMed]
- WHO. Health Risks of Heavy Metals from Long-Range Transboundary Air Pollution; World Health Organization Regional Office Europe: Copenhagen, Denmark, 2007.
- Ramírez, O.; Sánchez de la Campa, A.M.; Sánchez-Rodas, D.; de la Rosa, J.D. Hazardous trace elements in thoracic fraction of airborne particulate matter: Assessment of temporal variations, sources, and health risks in a megacity. Sci. Total Environ. 2020, 710, 136344. [Google Scholar] [CrossRef] [PubMed]
- Peltier, R.E.; Lippmann, M. Spatial and seasonal distribution of aerosol chemical components in New York City: (1) Incineration, coal combustion, and biomass burning. J. Expo. Sci. Environ. Epidemiol. 2011, 21, 473–483. [Google Scholar] [CrossRef]
- Pulles, T.; Denier van der Gon, H.; Appelman, W.; Verheul, M. Emission factors for heavy metals from diesel and petrol used in European vehicles. Atmos. Environ. 2012, 61, 641–651. [Google Scholar] [CrossRef]
- Arhami, M.; Hosseini, V.; Zare Shahne, M.; Bigdeli, M.; Lai, A.; Schauer, J.J. Seasonal trends, chemical speciation and source apportionment of fine PM in Tehran. Atmos. Environ. 2017, 153, 70–82. [Google Scholar] [CrossRef]
- Esmaeilirad, S.; Lai, A.; Abbaszade, G.; Schnelle-Kreis, J.; Zimmermann, R.; Uzu, G.; Daellenbach, K.; Canonaco, F.; Hassankhany, H.; Arhami, M.; et al. Source apportionment of fine particulate matter in a Middle Eastern Metropolis, Tehran-Iran, using PMF with organic and inorganic markers. Sci. Total Environ. 2020, 705. [Google Scholar] [CrossRef] [PubMed]
- Li, R.; Kou, X.; Geng, H.; Xie, J.; Yang, Z.; Zhang, Y.; Cai, Z.; Dong, C. Effect of ambient PM2.5 on lung mitochondrial damage and fusion/fission gene expression in rats. Chem. Res. Toxicol. 2015, 28, 408–418. [Google Scholar] [CrossRef]
- Pehnec, G.; Jakovljević, I.; Godec, R.; Sever Štrukil, Z.; Žero, S.; Huremović, J.; Džepina, K. Carcinogenic organic content of particulate matter at urban locations with different pollution sources. Sci. Total Environ. 2020, 734. [Google Scholar] [CrossRef]
- Kitanovski, Z.; Shahpoury, P.; Samara, C.; Voliotis, A.; Lammel, G. Composition and mass size distribution of nitrated and oxygenated aromatic compounds in ambient particulate matter from southern and central Europe-implications for the origin. Atmos. Chem. Phys. 2020, 20, 2471–2487. [Google Scholar] [CrossRef]
- Akhbarizadeh, R.; Dobaradaran, S.; Amouei Torkmahalleh, M.; Saeedi, R.; Aibaghi, R.; Faraji Ghasemi, F. Suspended fine particulate matter (PM2.5), microplastics (MPs), and polycyclic aromatic hydrocarbons (PAHs) in air: Their possible relationships and health implications. Environ. Res. 2021, 192, 110339. [Google Scholar] [CrossRef]
- Ari, P.E.; Ari, A.; Dumanoğlu, Y.; Odabasi, M.; Gaga, E.O. Organic chemical characterization of size segregated particulate matter samples collected from a thermal power plant area. Environ. Pollut. 2020, 262, 114360. [Google Scholar] [CrossRef] [PubMed]
- Roy, R.; Jan, R.; Gunjal, G.; Bhor, R.; Pai, K.; Satsangi, P.G. Particulate matter bound polycyclic aromatic hydrocarbons: Toxicity and health risk assessment of exposed inhabitants. Atmos. Environ. 2019, 210, 47–57. [Google Scholar] [CrossRef]
- Wilschefski, S.; Baxter, M. Inductively Coupled Plasma Mass Spectrometry: Introduction to Analytical Aspects. Clin. Biochem. Rev. 2019, 40, 115–133. [Google Scholar] [CrossRef] [PubMed]
- U.S. EPA. Method 6020B Update V Final 11-07-14.docx; U.S. EPA: Washington, DC, USA, 2014.
- Paull, B.; Nesterenkp, P.N. New possibilities in ion chromatography using porous monolithic stationary-phase media. Trends Anal. Chem. 2005, 24, 295. [Google Scholar] [CrossRef]
- Wang, W.; Yu, J.; Cui, Y.; He, J.; Xue, P.; Cao, W.; Ying, H.; Gao, W.; Yan, Y.; Hu, B.; et al. Characteristics of fine particulate matter and its sources in an industrialized coastal city, Ningbo, Yangtze River Delta, China. Atmos. Res. 2018, 203, 105–117. [Google Scholar] [CrossRef]
- Agarwal, A.; Satsangi, A.; Lakhani, A.; Kumari, K.M. Seasonal and spatial variability of secondary inorganic aerosols in PM2.5 at Agra: Source apportionment through receptor models. Chemosphere 2020, 242, 125132. [Google Scholar] [CrossRef] [PubMed]
- Kogianni, E.; Kouras, A.; Samara, C. Indoor concentrations of PM2.5 and associated water-soluble and labile heavy metal fractions in workplaces: Implications for inhalation health risk assessment. Environ. Sci. Pollut. Res. 2021, 28, 58983–58993. [Google Scholar] [CrossRef]
- Michalski, R. Principles and Applications of Ion Chromatography. In Application of IC-MS and IC-ICP-MS in Environmental Research; Wiley: Hoboken, NJ, USA, 2016. [Google Scholar]
- Sielicki, P.; Janik, H.; Guzman, A.; Namieśnik, J. The progress in electron microscopy studies of particulate matters to be used as a standard monitoring method for air dust pollution. Crit. Rev. Anal. Chem. 2011, 41, 314–334. [Google Scholar] [CrossRef]
- Li, W.; Sun, J.; Xu, L.; Shi, Z.; Riemer, N.; Sun, Y.; Fu, P.; Zhang, J.; Lin, Y.; Wang, X.; et al. A conceptual framework for mixing structures in individual aerosol particles. J. Geophys. Res. 2016, 121, 13784–13798. [Google Scholar] [CrossRef]
- Wagner, J.; Wang, Z.M.; Ghosal, S.; Wall, S. Source identification on high PM2.5 days using SEM/EDS, XRF, Raman, and windblown dust modeling. Aerosol Air Qual. Res. 2019, 19, 2518–2530. [Google Scholar] [CrossRef]
- Laskin, A.; Moffet, R.C.; Gilles, M.K. Chemical Imaging of Atmospheric Particles. Acc. Chem. Res. 2019, 52, 3419–3431. [Google Scholar] [CrossRef] [PubMed]
- Wang, Y.; Liu, F.; He, C.; Bi, L.; Cheng, T.; Wang, Z.; Zhang, H.; Zhang, X.; Shi, Z.; Li, W. Fractal Dimensions and Mixing Structures of Soot Particles during Atmospheric Processing. Environ. Sci. Technol. Lett. 2017, 4, 487–493. [Google Scholar] [CrossRef]
- Kamšek, A.R. Transmission Electron Microscopy. 2020. Available online: http://matrika.fmf.uni-lj.si/letnik-7/stevilka-2/kamsek.pdf (accessed on 6 March 2022).
- Barkay, Z.; Teller, A.; Ganor, E.; Levin, Z.; Shapira, Y. Atomic force and scanning electron microscopy of atmospheric particles. Microsc. Res. Tech. 2005, 68, 107–114. [Google Scholar] [CrossRef]
- Freedman, M.A.; Baustian, K.J.; Wise, M.E.; Tolbert, M.A. Characterizing the morphology of organic aerosols at ambient temperature and pressure. Anal. Chem. 2010, 82, 7965–7972. [Google Scholar] [CrossRef]
- Tumolva, L.; Park, J.Y.; Park, K. Combination of transmission electron and atomic force microscopy techniques to determine volume equivalent diameter of submicrometer particles. Microsc. Res. Tech. 2012, 75, 505–512. [Google Scholar] [CrossRef] [PubMed]
- Rudolph, M.; Peuker, U.A. Mapping hydrophobicity combining AFM and Raman spectroscopy. Miner. Eng. 2014, 66, 181–190. [Google Scholar] [CrossRef]
- Laskina, O.; Morris, H.S.; Grandquist, J.R.; Estillore, A.D.; Stone, E.A.; Grassian, V.H.; Tivanski, A.V. Substrate-Deposited Sea Spray Aerosol Particles: Influence of Analytical Method, Substrate, and Storage Conditions on Particle Size, Phase, and Morphology. Environ. Sci. Technol. 2015, 49, 13447–13453. [Google Scholar] [CrossRef] [PubMed]
- Shi, Y.; Ji, Y.; Sun, H.; Hui, F.; Hu, J.; Wu, Y.; Fang, J.; Lin, H.; Wang, J.; Duan, H.; et al. Nanoscale characterization of PM 2.5 airborne pollutants reveals high adhesiveness and aggregation capability of soot particles. Sci. Rep. 2015, 5, 1–10. [Google Scholar] [CrossRef]
- Jeong, G.Y. Bulk and single-particle mineralogy of Asian dust and a comparison with its source soils. J. Geophys. Res. Atmos. 2008, 113, 1–16. [Google Scholar] [CrossRef]
- Campos-Ramos, A.; Aragón-Piña, A.; Galindo-Estrada, I.; Querol, X.; Alastuey, A. Characterization of atmospheric aerosols by SEM in a rural area in the western part of México and its relation with different pollution sources. Atmos. Environ. 2009, 43, 6159–6167. [Google Scholar] [CrossRef]
- Song, D.; Yang, C. Geochemistry and source apportionment of atmospheric particulate matter in Jiaozuo City. Appl. Mech. Mater. 2011, 71–78, 2867–2872. [Google Scholar] [CrossRef]
- Dobrzhinsky, N.; Krugly, E.; Kliucininkas, L.; Prasauskas, T.; Kireitseu, M.; Zerrath, A.; Martuzevicius, D. Characterization of desert road dust aerosol from provinces of Afghanistan and Iraq. Aerosol Air Qual. Res. 2012, 12, 1209–1216. [Google Scholar] [CrossRef]
- Satsangi, P.G.; Yadav, S. Characterization of PM2.5 by X-ray diffraction and scanning electron microscopy-energy dispersive spectrometer: Its relation with different pollution sources. Int. J. Environ. Sci. Technol. 2014, 11, 217–232. [Google Scholar] [CrossRef]
- Ahmady-Birgani, H.; Mirnejad, H.; Feiznia, S.; McQueen, K.G. Mineralogy and geochemistry of atmospheric particulates in western Iran. Atmos. Environ. 2015, 119, 262–272. [Google Scholar] [CrossRef]
- Jilani, A.; Hussain, S.Z.; Othman, M.H.D.; Zulfiqar, U.; Shakoor, M.B.; Khan, I.U.; Iqbal, J.; Al-Ghamdi, A.A.; Alshahrie, A. A comprehensive study on the surface chemistry of particulate matter collected from Jeddah, Saudi Arabia. J. Atmos. Chem. 2018, 75, 271–283. [Google Scholar] [CrossRef]
- Canepari, S.; Perrino, C.; Astolfi, M.L.; Catrambone, M.; Perret, D. Determination of soluble ions and elements in ambient air suspended particulate matter: Inter-technique comparison of XRF, IC and ICP for sample-by-sample quality control. Talanta 2009, 77, 1821–1829. [Google Scholar] [CrossRef] [PubMed]
- Mazzei, F.; D’Alessandro, A.; Lucarelli, F.; Nava, S.; Prati, P.; Valli, G.; Vecchi, R. Characterization of particulate matter sources in an urban environment. Sci. Total Environ. 2008, 401, 81–89. [Google Scholar] [CrossRef] [PubMed]
- Cuccia, E.; Bernardoni, V.; Massabò, D.; Prati, P.; Valli, G.; Vecchi, R. An alternative way to determine the size distribution of airborne particulate matter. Atmos. Environ. 2010, 44, 3304–3313. [Google Scholar] [CrossRef]
- Sara, Y.Y.; Rashid, M.; Chuah, T.G.; Suhaimi, M.; Mohamed, N.N. Characteristics of airborne Pm2.5 and Pm2.5-10 in the urban environment of Kuala Lumpur. Adv. Mater. Res. 2013, 620, 502–510. [Google Scholar] [CrossRef]
- Malandrino, M.; Di Martino, M.; Giacomino, A.; Geobaldo, F.; Berto, S.; Grosa, M.M.; Abollino, O. Temporal trends of elements in Turin (Italy) atmospheric particulate matter from 1976 to 2001. Chemosphere 2013, 90, 2578–2588. [Google Scholar] [CrossRef]
- Owoade, K.O.; Hopke, P.K.; Olise, F.S.; Adewole, O.O.; Ogundele, L.T.; Fawole, O.G. Source apportionment analyses for fine (PM2.5) and coarse (PM2.5–10) mode particulate matter (PM) measured in an urban area in southwestern Nigeria. Atmos. Pollut. Res. 2016, 7, 843–857. [Google Scholar] [CrossRef]
- Dourado, T.A.; Gemeiner, H.; Gomes, A.C.F.; Almeida, E.; da Silva, A.C.; Valadão, N.; Menegário, A.A.; Govone, J.S.; Gastmans, D. Elemental Composition of Particulate Matter in the Southeastern Brazilian Ceramic Pole by Synchrotron Radiation X-ray Fluorescence Technique (SR-XRF). J. Braz. Chem. Soc. 2020, 31, 1203–1215. [Google Scholar] [CrossRef]
- Song, J.; Peng, P. Surface characterization of aerosol particles in Guangzhou, China: A study by XPS. Aerosol Sci. Technol. 2009, 43, 1230–1242. [Google Scholar] [CrossRef]
- Cheng, W.; Weng, L.T.; Li, Y.; Lau, A.; Chan, C.K.; Chan, C.M. Surface chemical composition of size-fractionated urban walkway aerosols determined by x-ray photoelectron spectroscopy. Aerosol Sci. Technol. 2013, 47, 1118–1124. [Google Scholar] [CrossRef]
- Xu, P.; Xu, J.; He, M.; Song, L.; Chen, D.; Guo, G.; Dai, H. Morphology and chemical characteristics of micro- and Nano-particles in the haze in Beijing studied by XPS and TEM/EDX. Sci. Total Environ. 2016, 565, 827–832. [Google Scholar] [CrossRef]
- Guascito, M.R.; Cesari, D.; Chirizzi, D.; Genga, A.; Contini, D. XPS surface chemical characterization of atmospheric particles of different sizes. Atmos. Environ. 2015, 116, 146–154. [Google Scholar] [CrossRef]
- Zhu, Y.; Olson, N.; Beebee, T.P. Surface Chemical Characterization of 2.5-μm Particulates (PM2.5) from Air Pollution in Salt Lake City Using TOF-SIMS, XPS, and FTIR. Environ. Sci. Technol. 2001, 35, 3113–3121. [Google Scholar] [CrossRef]
- Atzei, D.; Fermo, P.; Vecchi, R.; Fantauzzi, M.; Comite, V.; Valli, G.; Cocco, F.; Rossi, A. Composition and origin of PM2.5 in Mediterranean Countryside. Environ. Pollut. 2018, 246, 294–302. [Google Scholar] [CrossRef]
- Sánchez-Rodas, D.; de la Campa, A.M.; Alsioufi, L. Analytical approaches for arsenic determination in Air: A critical review. Anal. Chim. Acta 2015, 898, 1–18. [Google Scholar] [CrossRef]
- Shaltout, A.A.; Harfouche, M.; Hassan, F.A.; Eichert, D. Synchrotron X-ray fluorescence and X-ray absorption near edge structure of low concentration arsenic in ambient air particulates. J. Anal. At. Spectrom. 2021, 36, 981–992. [Google Scholar] [CrossRef]
- Deering, K.; Spiegel, E.; Quaisser, C.; Nowak, D.; Schierl, R.; Bose-O’Reilly, S.; Garí, M. Monitoring of arsenic, Mercury and organic pesticides in particulate matter, ambient air and settled dust in natural history collections taking the example of the Museum für Naturkunde, Berlin. Environ. Monit. Assess. 2019, 191. [Google Scholar] [CrossRef] [PubMed]
- Budanovic, M.; Tessensohn, M.; Webster, R. Substantially higher concentrations of mercury are detected in airborne particulate matter when using a preservation agent during sample preparation steps. Environ. Pollut. 2019, 252, 637–643. [Google Scholar] [CrossRef] [PubMed]
- Hellal, J.; Schäfer, J.; Vigouroux, R.; Lanceleur, L.; Laperche, V. Impact of old and recent gold mining sites on Mercury fluxes in suspended particulate matter, water and sediment in French Guiana. Appl. Sci. 2020, 10, 7829. [Google Scholar] [CrossRef]
- Guzmán-Uria, F.; Morales-Belpaire, I.; Achá, D.; Pouilly, M. Particulate Mercury and Particulate Organic Matter in the Itenez Basin (Bolivia). Appl. Sci. 2020, 10, 8407. [Google Scholar] [CrossRef]
- Moreda-Piñeiro, J.; Rodríguez-Cabo, A.; Fernández-Amado, M.; Piñeiro-Iglesias, M.; Muniategui-Lorenzo, S.; López-Mahía, P. Levels and sources of atmospheric particle-bound mercury in Atmospheric Particulate matter (PM10) at several sites of an Atlantic Coastal European Region. Atmosphere 2020, 11, 33. [Google Scholar] [CrossRef]
- Wiederhold, J.G.; Biester, H.; Alten, A.; Hahn, J.; Duester, L. Recent Spatial and Seasonal Variations of Mercury in Suspended Particulate Matter of the Legacy Contaminated River Elbe (Germany); EGU General Assembly: Braunschweig, Germany, 2022. [Google Scholar] [CrossRef]
- U.S. EPA. Compendium of Methods for the Determination of Inorganic Compounds in Ambient Air; U.S. EPA: Washington, DC, USA, 1999.
- Armiento, G.; Inglessis, M.; Tagliani, S.M.; Montereali, M.R.; Nardi, E.; Palleschi, S.; Piga, L.; Sacco, F.; Silvestroni, L.; Gianfagna, A. A comprehensive approach to the investigation of atmospheric particulate PM2.5: Preliminary results. Period. Mineral. 2013, 82, 199–216. [Google Scholar] [CrossRef]
- Tziaras, T.; Pergantis, S.A.; Stephanou, E.G. Investigating the Occurrence and Environmental Significance of Methylated Arsenic Species in Atmospheric Particles by Overcoming Analytical Method Limitations. Environ. Sci. Technol. 2015, 49, 11640–11648. [Google Scholar] [CrossRef]
- You, S.; Yao, Z.; Dai, Y.; Wang, C.H. A comparison of PM exposure related to emission hotspots in a hot and humid urban environment: Concentrations, compositions, respiratory deposition, and potential health risks. Sci. Total Environ. 2017, 599–600, 464–473. [Google Scholar] [CrossRef]
- Celo, V.; Dabek-Zlotorzynska, E.; Mathieu, D.; Okonskaia, I. Validation of a Simple Microwave-Assisted Acid Digestion Method Using Microvessels for Analysis of Trace Elements in Atmospheric PM 2.5 in Monitoring and Fingerprinting Studies. Open Chem. Biomed. Methods J. 2010, 3, 143–152. [Google Scholar]
- Castilho, I.N.B.; Welz, B.; Vale, M.G.R.; De Andrade, J.B.; Smichowski, P.; Shaltout, A.A.; Colares, L.; Carasek, E. Comparison of three different sample preparation procedures for the determination of traffic-related elements in airborne particulate matter collected on glass fiber filters. Talanta 2012, 88, 689–695. [Google Scholar] [CrossRef] [PubMed]
- Ödman, F.; Ruth, T.; Pontér, C. Validation of a field filtration technique for characterization of suspended particulate matter from freshwater. part I. Major elements. Appl. Geochem. 1999, 14, 301–317. [Google Scholar] [CrossRef]
- Guo, W.; Zhang, Z.; Zheng, N.; Luo, L.; Xiao, H.; Xiao, H. Chemical characterization and source analysis of water-soluble inorganic ions in PM2.5 from a plateau city of Kunming at different seasons. Atmos. Res. 2020, 234, 1–9. [Google Scholar] [CrossRef]
- Wu, Y.; Gu, B.; Erisman, J.W.; Reis, S.; Fang, Y.; Lu, X.; Zhang, X. PM2.5 pollution is substantially affected by ammonia emissions in China. Environ. Pollut. 2016, 218, 86–94. [Google Scholar] [CrossRef] [PubMed]
- Jusino-Atresino, R.; Anderson, J.; Gao, Y. Ionic and elemental composition of PM2.5 aerosols over the Caribbean Sea in the Tropical Atlantic. J. Atmos. Chem. 2016, 73, 427–457. [Google Scholar] [CrossRef]
- Chithra, V.S.; Shiva Nagendra, S.M. Chemical and morphological characteristics of indoor and outdoor particulate matter in an urban environment. Atmos. Environ. 2013, 77, 579–587. [Google Scholar] [CrossRef]
- Zhou, S.; Yuan, Q.; Li, W.; Lu, Y.; Zhang, Y.; Wang, W. Trace metals in atmospheric fine particles in one industrial urban city: Spatial variations, sources, and health implications. J. Environ. Sci. 2014, 26, 205–213. [Google Scholar] [CrossRef]
- Choung, S.; Oh, J.; Han, W.S.; Chon, C.M.; Kwon, Y.; Kim, D.Y.; Shin, W. Comparison of physicochemical properties between fine (PM2.5) and coarse airborne particles at cold season in Korea. Sci. Total Environ. 2016, 541, 1132–1138. [Google Scholar] [CrossRef]
- Murari, V.; Kumar, M.; Singh, N.; Singh, R.S.; Banerjee, T. Particulate morphology and elemental characteristics: Variability at middle Indo-Gangetic Plain. J. Atmos. Chem. 2016, 73, 165–179. [Google Scholar] [CrossRef]
- Deng, M.; Chen, D.; Zhang, G.; Cheng, H. Policy-driven variations in oxidation potential and source apportionment of PM2.5 in Wuhan, Central China. Sci. Total Environ. 2022, 853, 158255. [Google Scholar] [CrossRef]
- Mayeen, A.; Shaji, L.K.; Nair, A.K.; Kalarikkal, N. Morphological characterization of nanomaterials. In Characterization of Nanomaterials; Elsevier Ltd.: Kidlington, UK, 2018; pp. 335–364. [Google Scholar] [CrossRef]
- Karaca, F.; Anil, I.; Yildiz, A. Physicochemical and morphological characterization of atmospheric coarse particles by SEM/EDS in new urban central districts of a megacity. Environ. Sci. Pollut. Res. 2019, 26, 24020–24033. [Google Scholar] [CrossRef]
- Morantes, G.; González, J.C.; Rincón, G. Characterisation of particulate matter and identification of emission sources in Greater Caracas, Venezuela. Air Qual. Atmos. Health 2021, 14, 1989–2014. [Google Scholar] [CrossRef]
- Bora, J.; Deka, P.; Bhuyan, P.; Sarma, K.P.; Hoque, R.R. Morphology and mineralogy of ambient particulate matter over mid-brahmaputra valley: Application of sem–EDX, XRD, and Ftir Techniques. SN Appl. Sci. 2021, 3. [Google Scholar] [CrossRef]
- Shalini, V.; Narasimhulu, K.; Raja Obul Reddy, K.; Balakrishnaiah, G.; Rama Gopal, K.; Lokeswara Reddy, T.; Chakradhar Rao, T.; Elijabetthamma, B.; Manjunatha, C.; Ramakrishna Reddy, R. Chemical characterization and source identification of particulate matter at Ballari (15.15°N, 76.93°E), Karnataka over Southern Indian region. J. Atmos. Sol. Terr. Phys. 2020, 200, 105192. [Google Scholar] [CrossRef]
- Silva, L.F.O.; Milanes, C.; Pinto, D.; Ramirez, O.; Lima, B.D. Multiple hazardous elements in nanoparticulate matter from a Caribbean industrialized atmosphere. Chemosphere 2020, 239, 124776. [Google Scholar] [CrossRef] [PubMed]
- Hammer, S.; Ebert, M.; Weinbruch, S. Comparison of operator- and computer-controlled scanning electron microscopy of particles from different atmospheric aerosol types. Anal. Bioanal. Chem. 2019, 411, 1633–1645. [Google Scholar] [CrossRef]
- Oliveira, M.L.S.; Navarro, O.-G.; Crissien, T.J.; Tutikian, B.F.; da Boit, K.; Teixeira, E.C.; Cabello, J.J.; Agudelo-Castañeda, D.M.; Silva, L.F.O. Coal emissions adverse human health effects associated with ultrafine/nano-particles role and resultant engineering controls. Environ. Res. 2017, 158, 450–455. [Google Scholar] [CrossRef]
- Inkson, B.J. Scanning electron microscopy (SEM) and transmission electron microscopy (TEM) for materials characterization. In Materials Characterization Using Nondestructive Evaluation (NDE) Methods; Woodhead Publishing: Sawston, UK, 2016; pp. 17–43. [Google Scholar] [CrossRef]
- Kim, T.-H.; Choi, B.-H.; Yoon, C.-S.; Ko, Y.-K.; Kang, M.-S.; Kook, J. Automated sem-eds analysis of transition metals and other metallic compounds emitted from incinerating agricultural waste plastic film. Atmosphere 2022, 13, 260. [Google Scholar] [CrossRef]
- Mikrut, M.; Macyk, W.; van Eldik, R.; Stochel, G. Physicochemical analysis of water extracts of particulate matter from polluted air in the area of Kraków, Poland. Atmosphere 2021, 12, 565. [Google Scholar] [CrossRef]
- Nasrazadani, S.; Hassani, S. Modern analytical techniques in failure analysis of aerospace, chemical, and oil and gas industries. In Handbook of Materials Failure Analysis with Case Studies from the Oil and Gas Industry; Elsevier Inc.: Amsterdam, The Netherlands, 2016; pp. 39–54. [Google Scholar] [CrossRef]
- Hamdan, N.M.; Alawadhi, H.; Jisrawi, N.; Shameer, M. Characterization of fine particulate matter in Sharjah, United Arab Emirates using complementary experimental techniques. Sustainability 2018, 10, 1088. [Google Scholar] [CrossRef]
- Mărmureanu, L.; Marin, C.A.; Andrei, S.; Antonescu, B.; Ene, D.; Boldeanu, M.; Vasilescu, J.; Viţelaru, C.; Cadar, O.; Levei, E. Orange Snow-A Saharan dust intrusion over Romania during winter conditions. Remote Sens. 2019, 11, 2466. [Google Scholar] [CrossRef]
- Salem, A.A.; El-Haty, I.A.; Al-Gunaid, M.; Al-Balushi, M.; Abu-Hattab, B.Y.; Al-Aidros, A.; Odhiambo, G.O. Assessment and characterization of ambient indoor particulate matters using aerosol monitor, inductively coupled plasma mass spectrometry, and transmission electron microscopy. Air Qual. Atmos. Health 2015, 8, 193–203. [Google Scholar] [CrossRef]
- Akram, W.; Madhuku, M.; Ahmad, I.; Xiaolin, L.; Zhang, G.; Yan, L. Morphology, microstructure and chemical composition of single inhalable particle in Shanghai, China. Environ. Monit. Assess. 2014, 186, 8587–8598. [Google Scholar] [CrossRef] [PubMed]
- Mahmoud, M.E.; Tan, J.C. Metal-organic framework based composites. In Comprehensive Composite Materials II; Elsevier: Amsterdam, The Netherlands, 2017; pp. 525–553. [Google Scholar] [CrossRef]
- Zhai, Y.; Fu, Z.; Wang, L.; Zeng, G.; Li, C.; Chen, H.; Lan, Y.; Lu, P. Characteristic, composition, and sources of TSP investigated by HRTEM/EDS and ESEM/EDS. Environ. Monit. Assess. 2012, 184, 6693–6707. [Google Scholar] [CrossRef] [PubMed]
- Tang, C.Y.; Yang, Z. Transmission Electron Microscopy (TEM). In Membrane Characterization; Elsevier Inc.: Amsterdam, The Netherlands, 2017; pp. 145–159. [Google Scholar] [CrossRef]
- Liu, S.; Wang, Y. Application of AFM in microbiology: A review. Scanning 2010, 32, 61–73. [Google Scholar] [CrossRef] [PubMed]
- Boyd, R.D.; Cuenat, A. New analysis procedure for fast and reliable size measurement of nanoparticles from atomic force microscopy images. J. Nanoparticle Res. 2011, 13, 105–113. [Google Scholar] [CrossRef]
- Tan, C.L.C.; Gao, S.; Wee, B.S.; Asa-Awuku, A.; Thio, B.J.R. Adhesion of dust particles to common indoor surfaces in an air-conditioned environment. Aerosol Sci. Technol. 2014, 48, 541–551. [Google Scholar] [CrossRef]
- Wang, K.; Yu, S.; Wu, Y.; Peng, W. Measurements and analysis of adhesive forces for micron particles on common indoor surfaces. Indoor Built Environ. 2019, 29, 931–941. [Google Scholar] [CrossRef]
- Schulz, F.; Commodo, M.; Kaiser, K.; De Falco, G.; Minutolo, P.; Meyer, G.; D’Anna, A.; Gross, L. Insights into incipient soot formation by atomic force microscopy. Proc. Combust. Inst. 2019, 37, 885–892. [Google Scholar] [CrossRef]
- Magonov, S. Visualization of Polymers At Surfaces and Interfaces With Atomic Force Microscopy. In Handbook of Surfaces and Interfaces of Materials; Academic Press: Cambridge, MA, USA, 2001; Volume 2. [Google Scholar] [CrossRef]
- Sánchez, E.P.; Sánchez-Guijarro, M.; Sánchez-Soberón, F.; Rovira, J.; Sierra, J.; Schuhmacher, M.; Rosell, M.; Soler, A. Particulate matter source apportionment in complex urban and industrial cities: The case of Tarragona, Spain. WIT Trans. Ecol. Environ. 2018, 230, 511–518. [Google Scholar] [CrossRef]
- Roy, D.; Singh, G.; Gosai, N. Identification of possible sources of atmospheric PM10 using particle size, SEM-EDS and XRD analysis, Jharia Coalfield Dhanbad, India. Environ. Monit. Assess. 2015, 187, 680. [Google Scholar] [CrossRef]
- González, L.T.; Rodríguez, F.E.L.; Sánchez-Domínguez, M.; Leyva-Porras, C.; Silva-Vidaurri, L.G.; Acuna-Askar, K. Chemical and morphological characterization of TSP and PM2.5 by SEM-EDS, XPS and XRD collected in the metropolitan are of Monterrey, Mexico. Atmos. Environ. 2016, 143, 249–260. [Google Scholar] [CrossRef]
- Engelbrecht, J.P.; Stenchikov, G.; Jish Prakash, P.; Lersch, T.; Anisimov, A.; Shevchenko, I. Physical and chemical properties of deposited airborne particulates over the Arabian Red Sea coastal plain. Atmos. Chem. Phys. 2017, 17, 11467–11490. [Google Scholar] [CrossRef]
- Lu, S.; Luan, Q.; Jiao, Z.; Wu, M.; Li, Z.; Shao, L.; Wang, F. Mineralogy of inhalable particulate matter (PM10) in the atmosphere of Beijing, China. Water Air Soil Pollut. 2007, 186, 129–137. [Google Scholar] [CrossRef]
- De Berardis, B.; Incocciati, E.; Massera, S.; Gargaro, G.; Paoletti, L. Airborne silica levels in an urban area. Sci. Total Environ. 2007, 382, 251–258. [Google Scholar] [CrossRef] [PubMed]
- Smith, D.K. Evaluation of the detectability and quantification of respirable crystalline silica by X-ray powder diffraction methods. Powder Diffr. 1997, 12, 200–227. [Google Scholar] [CrossRef]
- Petean, I.; Paltinean, G.A.; Mocanu, A.; Muntean, D.F.; Muresan, L.; Arghir, G.; Tomoaia-Cotisel, M. Micro and nano organization of atmospheric particulate matter in grigorescu district of Cluj-Napoca. Stud. Univ. Babes-Bolyai Chem. 2018, 63, 49–57. [Google Scholar] [CrossRef]
- Neupane, B.B.; Sharma, A.; Giri, B.; Joshi, M.K. Characterization of airborne dust samples collected from core areas of Kathmandu Valley. Heliyon 2020, 6, e03791. [Google Scholar] [CrossRef]
- Bontempi, E.; Benedetti, D.; Zacco, A.; Pantos, E.; Boniotti, S.; Saletti, C.; Apostoli, P.; Depero, L.E. Analysis of crystalline phases in airborne particulate matter by two-dimensional X-ray diffraction (XRD2). J. Environ. Monit. 2008, 10, 82–88. [Google Scholar] [CrossRef]
- Mazzei, F.; Prati, P. Coarse particulate matter apportionment around a steel smelter plant. J. Air Waste Manag. Assoc. 2009, 59, 514–519. [Google Scholar] [CrossRef]
- Do Nascimento, F.S.; Losno, R.; Colin, J.L.; De Mello, W.Z.; Da Silva, H.E. Atmospheric total suspended particulate trace element identification by XRF at Ilha Grande, State of Rio de Janeiro, Brazil. Water Air Soil Pollut. 2011, 214, 525–538. [Google Scholar] [CrossRef]
- Kchih, H.; Perrino, C.; Cherif, S. Investigation of desert dust contribution to source apportionment of PM10 and PM2.5 from a southern Mediterranean coast. Aerosol Air Qual. Res. 2015, 15, 454–464. [Google Scholar] [CrossRef]
- Espinosa, A.A.; Miranda, J.; Hernández, E.; Reyes, J.; Alarcón, A.L.; Torres, M.C.; Sosa, R. Temporal variation of suspended particles (TSP, PM10, and PM2.5) and chemical composition of PM10 in a site at the coast of the Gulf of Mexico. Air Qual. Atmos. Health 2019, 12, 1267–1277. [Google Scholar] [CrossRef]
- Gunchin, G.; Manousakas, M.; Osan, J.; Karydas, A.G.; Eleftheriadis, K.; Lodoysamba, S.; Shagjjamba, D.; Migliori, A.; Padilla-Alvarez, R.; Streli, C.; et al. Three-year long source apportionment study of airborne particles in ulaanbaatar using X-ray fluorescence and positive matrix factorization. Aerosol Air Qual. Res. 2019, 19, 1056–1067. [Google Scholar] [CrossRef]
- Lanzaco, B.L.; López, M.L.; Olcese, L.E.; Toselli, B.M. Elemental composition of PM0.25 collected in an urban site of Argentina: A first case study. Spectrochim. Acta Part B At. Spectrosc. 2019, 161, 105712. [Google Scholar] [CrossRef]
- Cuccia, E.; Massabò, D.; Ariola, V.; Bove, M.C.; Fermo, P.; Piazzalunga, A.; Prati, P. Size-resolved comprehensive characterization of airborne particulate matter. Atmos. Environ. 2013, 67, 14–26. [Google Scholar] [CrossRef]
- Liang, L.; Liu, N.; Landis, M.S.; Xu, X.; Feng, X.; Chen, Z.; Shang, L.; Qiu, G. Chemical characterization and sources of PM2.5 at 12-h resolution in Guiyang, China. Acta Geochim. 2018, 37, 334–345. [Google Scholar] [CrossRef]
- Orogade, S.A.; Owoade, K.O.; Hopke, P.K.; Adie, D.B.; Ismail, A.; Okuofu, C.A. Source apportionment of fine and coarse particulate matter in industrial areas of Kaduna Northern Nigeria. Aerosol Air Qual. Res. 2016, 16, 1179–1190. [Google Scholar] [CrossRef]
- Ogundele, L.T.; Owoade, O.K.; Hopke, P.K.; Olise, F.S. Heavy metals in industrially emitted particulate matter in Ile-Ife, Nigeria. Environ. Res. 2017, 156, 320–325. [Google Scholar] [CrossRef]
- Franzin, B.T.; Guizellini, F.C.; de Babos, D.V.; Hojo, O.; Pastre, I.A.; Marchi, M.; Fertonani, F.L.; Oliveira CM, R.R. Characterization of atmospheric aerosol (PM10 and PM2.5) from a medium sized city in São Paulo state, Brazil. J. Environ. Sci. 2020, 89, 238–251. [Google Scholar] [CrossRef] [PubMed]
- Iida, A. Synchrotron Radiation X-ray Fluorescence Spectrometry. Encycl. Anal. Chem. 2000, 1–23. [Google Scholar] [CrossRef]
- IAEA. Sampling, Storage and Sample Prepararation for X ray Fluorescence Analysis of Environmental Materials; IAEA-Tecdoc 950; International Atomic Energy Agency: Vienna, Austria, 1997; Volume 28. [Google Scholar]
- U.S. EPA. Determination of Metals in Ambient Particulate Matter Using X-ray Fluorescence (XRF) Spectroscopy. Compendium of Methods for the Determination of Inorganic Compounds in Ambient Air. 1999; pp. 20–56. Available online: http://www3.epa.gov/ttnamti1/files/ambient/inorganic/mthd-3-3.pdf (accessed on 21 February 2021).
- Research Triangle Institute International. Standard Operating Procedure for the X-ray Fluorescence Analysis of Particulate Matter Deposits on Teflon Filters; US. EPA: Washington, DC, USA, 2009; pp. 1–17.
- Atzei, D.; Fantauzzi, M.; Rossi, A.; Fermo, P.; Piazzalunga, A.; Valli, G.; Vecchi, R. Surface chemical characterization of PM 10 samples by XPS. Appl. Surf. Sci. 2014, 307, 120–128. [Google Scholar] [CrossRef]
- Rella, S.; Malitesta, C. X-ray photoelectron spectroscopy characterization of aerosol particles in Antarctica. Antarct. Sci. 2015, 27, 493–499. [Google Scholar] [CrossRef]
- Klejnowski, K.; Pastuszka, J.S.; Rogula-Kozłowska, W.; Talik, E.; Krasa, A. Mass size distribution and chemical composition of the surface layer of summer and winter airborne particles in Zabrze, Poland. Bull. Environ. Contam. Toxicol. 2012, 88, 255–259. [Google Scholar] [CrossRef] [PubMed]
- Vattanasit, U.; Navasumrit, P.; Khadka, M.B.; Kanitwithayanun, J.; Promvijit, J.; Autrup, H.; Ruchirawat, M. Oxidative DNA damage and inflammatory responses in cultured human cells and in humans exposed to traffic-related particles. Int. J. Hyg. Environ. Health 2014, 217, 23–33. [Google Scholar] [CrossRef]
- Yang, C.; Jiang, L.; Zhang, H.; Shimoda, L.A.; Deberardinis, R.J.; Semenza, G.L. Analysis of hypoxia-induced metabolic reprogramming. Methods Enzymol. 2014, 542, 425–455. [Google Scholar] [CrossRef] [PubMed]
- Dikalov, S.I.; Harrison, D.G. Methods for detection of mitochondrial and cellular reactive oxygen species. Antioxid. Redox Signal. 2014, 20, 372–382. [Google Scholar] [CrossRef] [PubMed]
- He, L.; Zhang, J. Particulate matter (PM) oxidative potential: Measurement methods and links to PM physicochemical characteristics and health effects. Crit. Rev. Environ. Sci. Technol. 2022. [Google Scholar] [CrossRef]
- Lenz, A.G.; Karg, E.; Brendel, E.; Hinze-Heyn, H.; Maier, K.L.; Eickelberg, O.; Stoeger, T.; Schmid, O. Inflammatory and oxidative stress responses of an alveolar epithelial cell line to airborne zinc oxide nanoparticles at the air-liquid interface: A comparison with conventional, submerged cell-culture conditions. BioMed Res. Int. 2013, 2013, 652632. [Google Scholar] [CrossRef]
- Mitkus, R.J.; Powell, J.L.; Zeisler, R.; Squibb, K.S. Comparative physicochemical and biological characterization of NIST Interim Reference Material PM2.5 and SRM 1648 in human A549 and mouse RAW264.7 cells. Toxicol. Vitr. 2013, 27, 2289–2298. [Google Scholar] [CrossRef] [PubMed]
- Swain, R.J.; Kemp, S.J.; Goldstraw, P.; Tetley, T.D.; Stevens, M.M. Assessment of Cell Line Models of Primary Human Cells by Raman Spectral Phenotyping. Biophys. J. 2010, 98, 1703–1711. [Google Scholar] [CrossRef] [PubMed]
- Künzi, L.; Krapf, M.; Daher, N.; Dommen, J.; Jeannet, N.; Schneider, S.; Platt, S.; Slowik, J.G.; Baumlin, N.; Salathe, M.; et al. Toxicity of aged gasoline exhaust particles to normal and diseased airway epithelia. Sci. Rep. 2015, 5. [Google Scholar] [CrossRef]
- Liu, X.; Ouyang, W.; Shu, Y.; Tian, Y.; Feng, Y.; Zhang, T.; Chen, W. Incorporating bioaccessibility into health risk assessment of heavy metals in particulate matter originated from different sources of atmospheric pollution. Environ. Pollut. 2019, 254, 113113. [Google Scholar] [CrossRef]
- Zou, Y.; Jin, C.; Su, Y.; Li, J.; Zhu, B. Water soluble and insoluble components of urban PM2.5 and their cytotoxic effects on epithelial cells (A549) in vitro. Environ. Pollut. 2016, 212, 627–635. [Google Scholar] [CrossRef]
- Oakes, M.; Rastogi, N.; Majestic, B.J.; Shafer, M.; Schauer, J.J.; Edgerton, E.S.; Weber, R.J. Characterization of soluble iron in urban aerosols using near-real time data. J. Geophys. Res. Atmos. 2010, 115. [Google Scholar] [CrossRef]
- Moffet, R.C.; Furutani, H.; Rödel, T.C.; Henn, T.R.; Sprau, P.O.; Laskin, A.; Uematsu, M.; Gilles, M.K. Iron speciation and mixing in single aerosol particles from the Asian continental outflow. J. Geophys. Res. Atmos. 2012, 117. [Google Scholar] [CrossRef]
- Guney, M.; Zagury, G.J. Bioaccessibility and other key parameters in assessing oral exposure to PAH-contaminated soils and dust: A critical review. Hum. Ecol. Risk Assess. Int. J. 2016, 22, 1396–1417. [Google Scholar] [CrossRef]
- Padoan, E.; Romè, C.; Ajmone-Marsan, F. Bioaccessibility and size distribution of metals in road dust and roadside soils along a peri-urban transect. Sci. Total Environ. 2017, 601–602, 89–98. [Google Scholar] [CrossRef]
- Zheng, N.; Hou, S.; Wang, S.; Sun, S.; An, Q.; Li, P.; Li, X. Health risk assessment of heavy metals in street dust around a zinc smelting plant in China based on bioavailability and bioaccessibility. Ecotoxicol. Environ. Saf. 2020, 197, 110617. [Google Scholar] [CrossRef] [PubMed]
- Chaparro Leal, L.T.; Guney, M.; Zagury, G.J. In vitro dermal bioaccessibility of selected metals in contaminated soil and mine tailings and human health risk characterization. Chemosphere 2018, 197, 42–49. [Google Scholar] [CrossRef]
- Guney, M.; Bourges, C.M.-J.; Chapuis, R.P.; Zagury, G.J. Lung bioaccessibility of as, Cu, Fe, Mn, Ni, pb, and Zn in fine fraction (<20 μm) from contaminated soils and mine tailings. Sci. Total Environ. 2017, 579, 378–386. [Google Scholar] [CrossRef] [PubMed]
- Marin Villegas, C.A.; Guney, M.; Zagury, G.J. Comparison of five artificial skin surface film liquids for assessing dermal bioaccessibility of metals in certified reference soils. Sci. Total Environ. 2019, 692, 595–601. [Google Scholar] [CrossRef]
- Kastury, F.; Smith, E.; Juhasz, A.L. A critical review of approaches and limitations of inhalation bioavailability and bioaccessibility of metal(loid)s from ambient particulate matter or dust. Sci. Total Environ. 2017, 574, 1054–1074. [Google Scholar] [CrossRef]
- Julien, C.; Esperanza, P.; Bruno, M.; Alleman, L.Y. Development of an in vitro method to estimate lung bioaccessibility of metals from atmospheric particles. J. Environ. Monit. 2011, 13, 621–630. [Google Scholar] [CrossRef] [PubMed]
- Ren, H.; Yu, Y.; An, T. Bioaccessibilities of metal(loid)s and organic contaminants in particulates measured in simulated human lung fluids: A critical review. Environ. Pollut. 2020, 265, 115070. [Google Scholar] [CrossRef]
- Wiseman, C.L.S. Analytical methods for assessing metal bioaccessibility in airborne particulate matter: A scoping review. Anal. Chim. Acta 2015, 877, 9–18. [Google Scholar] [CrossRef]
- Gamble, J.L. Chemical Anatomy, Physiology and Pathology of Extracellular Fluid: A Lecture Syllabus; Harvard University Press: Cambridge, MA, USA, 1967. [Google Scholar]
- Wiseman, C.L.S.; Zereini, F. Characterizing metal(loid) solubility in airborne PM10, PM2.5 and PM1 in Frankfurt, Germany using simulated lung fluids. Atmos. Environ. 2014, 89, 282–289. [Google Scholar] [CrossRef]
- Hernández-Pellón, A.; Nischkauer, W.; Limbeck, A.; Fernández-Olmo, I. Metal(loid) bioaccessibility and inhalation risk assessment: A comparison between an urban and an industrial area. Environ. Res. 2018, 165, 140–149. [Google Scholar] [CrossRef]
- Tang, Z.; Hu, X.; Chen, Y.; Qiao, J.; Lian, H. Assessment of in vitro inhalation bioaccessibility of airborne particle–bound potentially toxic elements collected using quartz and PTFE filter. Atmos. Environ. 2019, 196, 118–124. [Google Scholar] [CrossRef]
- Weggeberg, H.; Benden, T.F.; Steinnes, E.; Flaten, T.P. Element analysis and bioaccessibility assessment of ultrafine airborne particulate matter (PM0.1) using simulated lung fluid extraction (artificial lysosomal fluid and Gamble’s solution). Environ. Chem. Ecotoxicol. 2019, 1, 26–35. [Google Scholar] [CrossRef]
- Birmili, W.; Allen, A.G.; Bary, F.; Harrison, R.M. Trace metal concentrations and water solubility in size-fractionated atmospheric particles and influence of road traffic. Environ. Sci. Technol. 2006, 40, 1144–1153. [Google Scholar] [CrossRef]
- U.S. EPA. Risk Assessment Guidance for Superfund Volume I: Human Health Evaluation Manual (Part F, Supplemental Guidance for Inhalation Risk Assessment). 2009. Available online: https://www.epa.gov/risk/risk-assessment-guidance-superfund-rags-part-f (accessed on 13 January 2021).
- Wang, W.; Lin, Y.; Yang, H.; Ling, W.; Liu, L.; Zhang, W.; Lu, D.; Liu, Q.; Jiang, G. Internal exposure and distribution of airborne fine particles in the human body: Methodology, current understandings, and research needs. Environ. Sci. Technol. 2022, 56, 6857–6869. [Google Scholar] [CrossRef]
- Fallahzadeh, R.A.; Khosravi, R.; Dehdashti, B.; Ghahramani, E.; Omidi, F.; Adli, A.; Miri, M. Spatial distribution variation and probabilistic risk assessment of exposure to chromium in ground water supplies; a case study in the east of Iran. Food Chem. Toxicol. 2018, 115, 260–266. [Google Scholar] [CrossRef]
- Tacu, I.; Kokalari, I.; Abollino, O.; Albrecht, C.; Malandrino, M.; Ferretti, A.M.; Schins, R.P.; Fenoglio, I. Mechanistic Insights into the Role of Iron, Copper, and Carbonaceous Components on the Oxidative Potential of Ultrafine Particulate Matter. Chem. Res. Toxicol. 2021, 34, 767–779. [Google Scholar] [CrossRef]
- Verdonck, F.A.M.; Jaworska, J.; Janssen, C.R.; Vanrolleghem, P.A. Probabilistic Ecological Risk Assessment Framework for Chemical Substances. In Proceedings of the International Congress on Environmental Modelling and Software, Lugano, Switzerland, 24–27 June 2002. [Google Scholar]
- Tong, R.; Cheng, M.; Zhang, L.; Liu, M.; Yang, X.; Li, X.; Yin, W. The construction dust-induced occupational health risk using Monte-Carlo simulation. J. Clean. Prod. 2018, 184, 598–608. [Google Scholar] [CrossRef]
- Harrison, R.L. Introduction to Monte Carlo simulation. AIP Conf. Proc. 2009, 1204, 17–21. [Google Scholar] [CrossRef]
- Al Garni, H.Z.; Awasthi, A. A monte carlo approach applied to sensitivity analysis of criteria impacts on solar PV site selection. In Handbook of Probabilistic Models; Elsevier: Amsterdam, The Netherlands, 2019; pp. 489–504. [Google Scholar] [CrossRef]
- Fakhri, Y.; Mousavi Khaneghah, A.; Conti, G.O.; Ferrante, M.; Khezri, A.; Darvishi, A.; Ahmadi, M.; Hasanzadeh, V.; Rahimizadeh, A.; Keramati, H.; et al. Probabilistic risk assessment (Monte Carlo simulation method) of Pb and Cd in the onion bulb (Allium cepa) and soil of Iran. Environ. Sci. Pollut. Res. 2018, 25, 30894–30906. [Google Scholar] [CrossRef]
- Ganyaglo, S.Y.; Gibrilla, A.; Teye, E.M.; Owusu-Ansah, E.D.G.J.; Tettey, S.; Diabene, P.Y.; Asimah, S. Groundwater fluoride contamination and probabilistic health risk assessment in fluoride endemic areas of the Upper East Region, Ghana. Chemosphere 2019, 233, 862–872. [Google Scholar] [CrossRef]
- Kaur, L.; Rishi, M.S.; Siddiqui, A.U. Deterministic and probabilistic health risk assessment techniques to evaluate non-carcinogenic human health risk (NHHR) due to fluoride and nitrate in groundwater of Panipat, Haryana, India. Environ. Pollut. 2020, 259, 113711. [Google Scholar] [CrossRef]
| Reference | Major Analytical Techniques Reviewed | Content |
|---|---|---|
| [28] | ICP-MS, XRF, PIXE, LA-ICP-MS, and INAA |
|
| [27] | GS, LC, and CE |
|
| [25] | ICP, AAS, CE, XRF, PIXE, PIGE, PESA, GS, LC, IC, TOC, XPS, XRD, SIMS, SEM, SPEM, PEEM, Raman, Mossbauer, and AES |
|
| [26] | ICP, XRF, XRD, SEM, and TEM |
|
| [24] | ICP, SEM, TEM, XPS, SIMS, EXAFS, EELS, PIXE, LMMS, and SPMS |
|
| The present study | ICP-MS/OES, IC, SEM, TEM, AFM, XRD, XRF, XPS, DCFM-DA, DHE, MitoSOX, and Bioaccessibility |
|
| PTE | Mechanism of Toxicity | Reference Concentration (RfC) by U.S. EPA, IRIS (mg/m3) | Non-Carcinogenic Toxic Effect | Carcinogenic Toxic Effect | Major Sources | References |
|---|---|---|---|---|---|---|
| Arsenic (As) | Induces pro-inflammatory response by production of IL−8, IL−6 Increases level of c-reactive protein (CRP) and vascular endothelial growth factor (VEGH) | 1.5 × 10⁻⁵ | Skin and mucous membrane irritation Increased risk of spontaneous abortion and low birth weight | Association with lung, skin, liver, and bladder cancer Group A human carcinogen | Vehicle emissions Industrial activity Coal and oil combustion | [67,68,69,70,71,72,73,74,75] |
| Lead (Pb) | Induces disruption of cell function by mimicking Ca Inhibits enzyme activity by having a stronger affinity than Zn that acts as an enzyme cofactor Increases level of NO radical | Not provided | Disruption of CNS, blood pressure, kidneys, reproductive system, and vitamin D metabolism Impairment of cognitive development, growth reduction, and hearing loss in children Increased risk of spontaneous abortion and low birth weight | Potential carcinogenic effect Group B probable human carcinogen | Vehicle emissions Industrial activity Tire wear and brake abrasion Power plant emissions | [13,65,68,70,71,73,76] |
| Mercury (Hg) | Induces DNA damage by inhibiting mitotic spindle Decreases immune tumor response Increases accumulation of free radicals | 3 × 10⁻⁴ | Disruption of CNS (e.g., paresthesia, erethism, irritability, tremors, and blurred vision), kidney functions, and reproductive system | Group D not a human carcinogen (elemental Hg) Group C possible human carcinogen (inorganic and methyl Hg) | Fossil fuel combustion Biomass burning Industrial emissions Coal combustion by power plants Incineration of medical waste | [68,77] |
| Cadmium (Cd) | Binds to metallothionein and transported from the liver to the kidneys Induces DNA damage by altering its repairing abilities | 1 × 10⁻⁵ | Accumulation in kidneys causing kidney failure Disruption of liver, lung, immune systems, blood, and nervous system Softening of bones | Association with lung cancer Group B1 probable human carcinogen | Industrial activity Combustion of fossil fuels Incineration of waste Metal smelting and refining | [70,75,78] |
| Chromium (Cr (VI)) | Induces DNA damage by altering its repairing abilities | 1 × 10⁻⁴ | Respiratory conditions (e.g., septum perforations and ulcerations, decreased pulmonary function, and pneumonia, and asthma) Disruption of liver and kidney functions and immune system Increased risk of pregnancy and childbirth complications | Strong association with lung cancer Group A known human carcinogen (inhalation) | Industrial activity Road salt emissions Power plant emissions | [68,71,73,75] |
| Copper (Cu) | Increases expression of pro-inflammatory cytokine genes indicating cellular response to ROS accumulation Increases accumulation of HO−1 | Not provided | Disruption of liver and kidney functions Anemia Wilson’s disease due to accumulation of Cu | Link to carcinogenicity is not fully understood Group D not a human carcinogen | Vehicle emissions Road dust resuspension Industrial activity Tire wear and brake abrasion | [12,63,68,70,71,76] |
| Cobalt (Co) | Disrupts enzymatic activity of catalase, amino levulinic acid synthetase, and P−450 Inhibits Krebs cycle Interferes with Zn and iodine metabolism | 6 × 10⁻⁶ | Respiratory conditions (e.g., coughing, wheezing, asthma, pulmonary fibrosis, and pneumonia) | Link to carcinogenicity is not fully understood due to limited data available | Vehicle emissions Coal and oil combustion | [68,71] |
| Iron (Fe) | Induces cytotoxic and genotoxic effects by disrupting DNA and mitochondrial function, production of NO and OH radicals in lung epithelial cells | Not provided | Eye discoloration Pneumoconiosis (Siderosis) (symptoms include coughing, shortness of breath, structural changes in lungs) | Association with cancer in animal studies | Soil emission and mineral dust Combustion of fossil fuels Tire wear and brake abrasion Road salt emissions Steel manufacturing industries, cement mills | [72,79,80] |
| Zinc (Zn) | Induces pro-inflammatory response by accumulation of IL−8 Disruption in Zn homeostasis is proposed to contribute to destabilization of endosomal membrane and cell apoptosis | Not provided | Anemia Decreased level of HDL cholesterol Anosmia (loss of smell) caused by disruption of nose nerve receptors | Link to carcinogenicity is not fully understood Group D not a human carcinogen | Vehicle emissions Industrial activity Road dust resuspension Tire wear and brake abrasion Coal and oil combustion Combustion of fossil fuels | [19,65,68,70,71,76] |
| Manganese (Mn) | Disrupts DNA by interfering with DNA polymerase Disrupts mitochondrial function Activates MAPK cell signalling cascades increasing likelihood of cancer | 5.00 × 10⁻⁵ | Disruption of CNS Respiratory condition Manganism | Link to carcinogenicity is not fully understood Group D not a human carcinogen | Vehicle emissions Road dust resuspension | [68,71,76] |
| Vanadium (V) | Induces oxidative stress by increased accumulation of 4-hydroxy-2-nonenal (4−HNE) Induces damage of DNA plasmid | 1.00 × 10⁻⁴ | Respiratory conditions (e.g., coughing, wheezing, chest pain, and sore throat) Increased accumulation of neutrophils in nasal mucosa | Association with lung cancer in mice Group D not a human carcinogen | Combustion of fossil fuels Power plant emissions | [68,70,71,74,81,82] |
| Antimony (Sb) | Inhibits enzymes activity (e.g., enzymes involved in cellular respiration and carbohydrate and protein metabolism) Disruption of DNA plasmid | Not provided | Respiratory conditions (e.g., lung inflammation, chronic bronchitis, inactive tuberculosis, and emphysema) Disruption of cardiovascular system | Association with lung tumors in animal studies Group D not a human carcinogen | Vehicle emissions Tire wear and brake abrasion Combustion of fossil fuels | [68,70,71] |
| Nickel (Ni) | Has higher binding capacity in enzymes and proteins Impairs mitochondrial function and induces cell apoptotic mechanisms Increases accumulation of HO−1 Induces DNA damage by altering its repairing abilities | 9.00 × 10⁻⁵ | Respiratory conditions (e.g., asthma, allergy, and breathing difficulties) | Association with lung and nasal cancer Group A known human carcinogen (Ni refinery dust and Ni subsulfide) Group B2 probable human carcinogen (Ni carbonyl) | Vehicle emissions Industrial activity Coal and oil combustion Power plant emissions | [17,63,68,71,73,74,81,82] |
| Nickel (Ni) | Has higher binding capacity in enzymes and proteins Impairs mitochondrial function and induces cell apoptotic mechanisms Increases accumulation of HO−1 Induces DNA damage by altering its repairing abilities | 9.00 × 10⁻⁵ | Respiratory conditions (e.g., asthma, allergy, and breathing difficulties) | Association with lung and nasal cancer Group A known human carcinogen (Ni refinery dust and Ni subsulfide) Group B2 probable human carcinogen (Ni carbonyl) | Vehicle emissions Industrial activity Coal and oil combustion Power plant emissions | [17,63,68,71,73,74,81,82] |
| Technique | Brief Description | Advantages | Disadvantages | Unique Features | Remarks | References |
|---|---|---|---|---|---|---|
| Inductively coupled plasma analysis (ICP) | A method performing simultaneous analysis of a wide range of elements at sub-µg/L elemental concentrations | High sensitivity Wide range of analyzed elements Flexibility in targeting specific elements | Destructive Extensive sample preparation and QA/QC procedure Possible interference from filters and laboratory procedures Accuracy is limited by sample mass if analytes are at trace concentrations | Possibly the most sensitive method for bulk elemental characterization, especially for metals | Invaluable for precise determination of elemental composition and human toxicity studies | [26,89,90] |
| Ion chromatography (IC) | A method used to determine the ambient concentration of gaseous pollutants, anionic, and cationic species | Analysis of several ions simultaneously Relatively quick and simple procedure | Destructive Cannot provide data on constituents other than water-soluble fractions | Speciation of bulk water-soluble compounds | Can play a crucial role in studying secondary aerosol particles and human toxicity Available in most laboratories | [91,92,93,94,95] |
| Scanning electron microscopy (SEM) | A technique emitting electron beams and receiving signals describing surface topography, electrical conductivity, and other characteristics of scanned samples | Provides 2-D images featuring particle shape and surface texture Quick and simple procedure An automated mode may produce statistically significant data, such as size distribution and morphology groups Non-destructive | Cannot provide data on volume or mass Operates under vacuum conditions Possible sample alteration/deterioration at high magnifications The automated mode cannot be reliably applied to particles smaller than 0.1 µm Requires use of conductive substrates or sample coating | Ability to provide statistically significant morphological and, if coupled with chemical analysis instruments, elemental composition data | Often coupled with energy-dispersive X-ray spectroscopy (EDS), which allows rapid elemental data acquisition along with imaging | [23,24,53,96,97,98,99] |
| Transmission electron microscopy (TEM) | A technique passing electron beams through the sample and providing data on morphological structures and mixing state of particles | Provides 2-D images featuring particle shape and cross-sections Can visualize the internal structure of particles revealing their mixing states Higher resolution compared to SEM Non-destructive | Requires particle collection on TEM grids or sample transfer and preparation Cannot provide data on volume or mass Cannot be automated; therefore, it is unsuitable for analysis of a large number of particles Operates under high vacuum conditions Possible sample alteration/deterioration at high magnifications | Ability to provide data on particles’ internal structure at high resolutions | Often coupled with energy-dispersive X-ray spectroscopy (EDS), which allows rapid elemental data acquisition along with imaging | [97,100,101] |
| Atomic force microscopy (AFM) | A technique using a nanoscale cantilever tip traveling across the surface of the sample to map its 3-D topography and used to study mechanical properties of particles | Able to generate 3-D particle models Vertical and lateral resolutions of around 0.1 and several nm, respectively Can operate in ambient conditions Non-destructive Little to no sample preparation | Severely affected by surface roughness of the sample substrate Cannot be automated; thus is unsuitable for analysis of a large number of particles | Ability to generate 3-D models and study properties, such as mass, volume, hygroscopicity, surface roughness, adhesion to other particles and surfaces | Can be coupled with Raman spectroscopy for simultaneous chemical characterization of particles Suitable for analysis of biological samples | [102,103,104,105,106,107] |
| X-ray diffraction (XRD) | A method utilized for bulk chemical speciation of mineral PM by using existing mineral databases | Can identify and quantify chemical compounds in the sample Quick and simple procedure for identification of minerals in PM Direct analysis on substrates, such as PTFE, quartz, and glass fiber filters Non-destructive | Limited to mineral compounds Sophisticated quantification procedure Accuracy affected by sample crystallinity, particle size resolution, and relative abundance of constituents Requires greater sample mass for adequate analysis (>few mg) Requires access to mineral databases Possible background interference from substrates | Bulk chemical speciation of mineral fractions of PM | Cannot be used as a standalone method for PM chemical analysis since it does not provide data on organic fractions Commonly applied to studying materials such as minerals, ores, and soils Available in most laboratories | [108,109,110,111,112,113,114] |
| X-ray fluorescence (XRF) | A technique used for the determination of the bulk elemental composition of PM | Flexibility in targeting specific elements, some even at trace concentrations Relatively high accuracy with detection limits down to 1–2 ng/m3 for specific elements Quick procedure Non-destructive Little to no sample preparation | Difficulties in quantifying elements with small atomic masses or low concentrations Extensive QA/QC and calibration procedure Possible background interference from glass and quartz fiber filters | Rapid acquisition of bulk elemental composition of PM | Recommended as a quick and non-destructive method to detect and quantify elements of interest in PM as an alternative to more tedious techniques such as ICP | [115,116,117,118,119,120,121] |
| X-ray photoelectron spectroscopy (XPS) | A method applied to characterize the surface chemistry of atmospheric particulates by providing the chemical composition of shallow particle regions (<10 nm) | Provides elemental composition and speciation of particle surface Can produce semi-quantitative data with accuracy down to 0.1 at. % Can detect and quantify low-Z elements, such as C, N, and O Quick procedure Non-destructive No sample preparation Can be applied to small sample masses | Requires high vacuum conditions Issues related to sample charging and need in charge compensation Requires access to spectrum databases Possible background interference, especially for studying C content on C-containing substrates | Determination of surface chemistry of particles, especially C-containing compounds, as most of the other techniques struggle to quantify low-Z elements | Cannot be used as a standalone method for PM chemical characterization, but can contribute to studying particle heterogeneity and formation mechanisms | [122,123,124,125,126,127] |
| Reference | Sample | Instruments and Techniques Used | Investigated Features | Remarks |
|---|---|---|---|---|
| [153] | PM samples collected in the Sartenejas Valley, Venezuela | SEM-EDS | Particle morphology and elemental composition (C, O, Si, Na, Mg, Al, Cl, K, Ca, Fe, and Ti) | -PM particles were classified as a function of particle size and elemental composition -Relationships between different PM fractions were analyzes -Morphological features of deposited particles were characterised considering the origin of PM |
| [154] | PM samples collected in rural residential area of Tezpur, India | SEM-EDS | Particle morphology and elemental composition (C, O, Si, Al, Fe, Ca, Na, Ti, Mg, K, S, Fe, Mn, Ni, V, and Zn) | -PM particles we classified based on morphological features considering the origin of PM |
| [155] | PM collected in Ballari, India | SEM-EDS | Particle morphology and elemental composition (C, O, Na, Mg, Al, Si, S, CI, Mo, K, Ca, Ba, Ti, Fe, Zn, Co, Hf, and Br) | -Deposited particles exhibit oval or spherical shape with smooth surfaces containing aluminosilicate group of elements |
| [114] | PM collected in different locations at Jeddah, Saudi Arabia. | FE-SEM-EDS | Particle morphology and elemental composition (C, O, Si, Na, Mg, Al, N, S, Cl, and Ca) | -Particle aggregates are more typical to industrial site than residential areas -Elemental composition determined by EDS analysis was confirmed by XPS results. |
| [53] | TSP and PM2.5 collected in Monterrey, Mexico | SEM-EDS | Particle morphology, elemental composition (Ca, Si, O, Al, K, Fe, Zn, Mn, Cu, Mo, and Pb), and size distribution | PM particles were classified as a function of particle size and elemental composition -Morphological features of deposited particles were characterised considering the origin of PM |
| Reference | Sample | Instruments and Techniques Used | Investigated Features | Remarks |
|---|---|---|---|---|
| [75] | PM10 and PM2.5 samples particles collected from six different sources | TEM | Particle morphology | -PM particles were compared according to size fraction and physicochemical characteristics |
| [100] | Soot particles collected in the North China Plane | TEM-EDS | Particle morphology, elemental composition (C, O, Si, Na, Cl, Al, Ca, Fe, Zn, Pb, Mn, S, and K), and mixing state of soot particles | -PM morphology was investigated -Morphological changes of PM particles in the atmosphere were thoroughly discussed -Fractal dimensions (Df) of ambient soot particles were calculated |
| [97] | PM collected in different locations in China | TEM-EDS | PM morphology and mixing state of particles | -New insights in morphology of mixing structures of individual aerosol particles were provided |
| [165] | PM collected in residential area in Al-Ain city | STEM | Particle morphology | -Health effect from PM was assessed considering MP morphology |
| [147] | PM2.5 in industrial and urban sites in eastern China | TEM-EDS | Particle morphology, elemental composition (Si, Na, K, O, S, Al, Fe, Ca, Ti, Co, and Pb) | -Dependence of PM-induced cytotoxic and mixing state of ambient particles was suggested |
| Reference | Sample | Instruments and Technique Used | Investigated Features | Remarks |
|---|---|---|---|---|
| [173] | Reference material NBG18, by the SGL Carbon Group (Germany) (dust particles) | AFM | Adhesive force between micron size particles and commonly used indoor surfaces | -The adhesive force between dust particles and different surfaces was assessed -Major factors affecting the adhesive force were reviewed |
| [174] | Soot particles collected form the flame at a height above the burner (HAB) | STM/AFM | Molecular and structural composition of soot particles | -Aromatic and non-aromatic compounds contributing to the formation of soot particles were identified -Results of AFM on chemical and structural composition of soot particles were compared with Raman spectroscopy |
| [107] | PM2.5 collected in Beijing, China | AFM | Mechanical properties of fine PM | -Morphological features of PM2.5, such as adhesion, deformation, elasticity, rupture, indentation, diameter, and area were discussed |
| [104] | Candle soot particles produced in a collision atomizer | AFM | Particle morphology | -The heights and particle deformations of sub-µm soot particles were determined |
| [103] | Particles from five different aerosols | TM-AFM | Particle morphology, solubility, and internal structures | -Organic aerosol particles showed mostly shell–core structures with varying solubility |
| Reference | Sample | Instruments and Technique Used | Investigated Features | Remarks |
|---|---|---|---|---|
| [178] | TSP and PM2.5 from Monterrey, Mexico | XRD | Semi-quantitative mineral composition (CaCO3, SiO2, and CaSO4(H2O)2, iron oxides, halite, aluminosilicates, and TiO2) | -PM composition and morphology were assessed by three methods -Potential PM emission sources were identified using PCA |
| [113] | TSP, PM10, and PM2.5 from two meteorological stations, Iran | XRD | Semi-quantitative mineral composition (quartz, calcite, gypsum, hematite, halite, sulfur, barium chlorite, magnetite, biotite, and clay minerals) | -Sample preparation and handling are given in detail -Seasonal variation of PM composition was discussed -Comparison of normal and dusty day impact on PM compositions was provided |
| [112] | PM2.5 from Pune, India | XRD | Semi-quantitative mineral composition (quartz, wollastonite, vermiculite, kaolinite, calcium aluminum silicates, calcium iron oxide, magnetite, wuestite, gypsum, koktaite, magnesium phosphate, silicon phosphates, dolomite, iron-zinc, aenigmatite, and halite) | -20 minerals were identified -Sources of PM emissions were identified incorporating XRD results -Comparison of particle groups found in different studies |
| [108] | Soil and PM10 from Seoul, South Korea | XRD | Quantitative mineral composition (illite-smectite, illite, chlorite, kaolinite, smectite, quartz, plagioclase, K-feldspar, and calcite) | -Description of quantitative XRD analysis of PM using set of assumptions and soil composition -Comparison between bulk and single-particle mineralogy |
| [180] | PM10 from Beijing, China | XRD | Semi-quantitative mineral composition (clay minerals, quartz, plagioclase, K-feldspar, calcite, dolomite, hematite, pyrite, magnesite, gypsum, laumontite, K(NH4)Ca(SO4)2·H2O, NH4Cl, and As2O3·SO3) | -Results of mineral composition -Comparison between semi-quantitative mineral compositions found using XRD and ESEM-EDS as well as between urban and satellite sites |
| Reference | Sample | Instruments and Technique Used | Investigated Features | Remarks |
|---|---|---|---|---|
| [121] | PM10 and PM2.5 from Rio Claro, Brazil | SR-XRF | Elemental composition (Si, S, Ca, K, Ti, Cr, Mn, Fe, Cu, and Zn) | -Emission sources were determined using enrichment factors (EF) and PCA -Effect of precipitation on PM composition was studied |
| [117] | Size-segregated PM (0.05–10 µm) from Genoa, Italy | ED-XRF | Elemental composition (Na, Mg, Al, Si, P, S, Cl, K, Ca, Ti, V, Cr, Mn, Fe, Ni, Cu, Zn, Se, Br, Sr, Zr, Mo, Ba, and Pb) | -Particle chemistry was characterized for size-resolved PM -Size-segregated source apportionment was performed using PMF |
| [120] | PM10 and PM2.5 from Ile-lfe, Nigeria | ED-XRF | Elemental composition (Na, Mg, Al, Si, S, Cl, K, Ca, Ti, V, Cr, Mn, Fe, Ni, Cu, Zn, As, Br, Rb, Sr, and Pb) | -Source apportionment and particulate transport study based on XRF results (PMF, CPF, and backward trajectories) |
| [119] | TSP from Turin, Italy | WD-XRF | Elemental composition (Ba, Br, Ca, Cl, Cr, Cu, Fe, K, Mg, Mn, Ni, Pb, S, Ti, and Zn) | -Temporally extensive PM data (25 years) revealed clear compositional differences in PM and source influences from 1976 and 2001 -Comparison of XRF and ICP-AES results demonstrated higher sensitivity and analysis speed of XRF |
| [116] | PM10, PM2.5, and PM1 from Genoa, Italy | ED-XRF | Elemental composition (Na, Mg, Al, Si, P, S, Cl, K, Ca, Ti, V, Cr, Mn, Fe, Ni, Cu, Zn, As, Se, Br, Rb, Sr, Zr, Mo, Ba, and Pb) | -Extensive daily PM sampling was performed (1600 samples in total) -Sources were identified via PMF |
| Reference | Sample | Instruments and Technique Used | Investigated Features | Remarks |
|---|---|---|---|---|
| [127] | PM2.5 from Sardinia, Italy | XPS | Particle surface chemistry (elements: C, O, N, S, and F; chemical states: C, O, N, and S) | -Detailed quality assurance and control procedure for XPS analysis was provided -A flood gun neutralizer was used to compensate for sample charging -C, O, N, and S species were identified and measured using XPS |
| [124] | Size-segregated PM (0.01–10 µm) from Beijing, China | XPS | Particle surface chemistry (elements: Al, Si, S, Cl, C, Ca, N, and O; chemical states: C, O, N, and S) | -Size-resolved surface elemental composition carried out with data on chemical states of selected elements (S, N, and C) and ammonium |
| [125] | Size-segregated PM (0.05–18 µm) from Lecce, Italy | XPS | Particle surface chemistry (elements: N, S, Cl, Si, Na, Ca, Fe, Cr, Cu, and Mg; chemical states: C, O, N, S, Na, and Cl) | -Detailed XPS analysis procedure including accounting for substrate interferences was provided -Elemental composition and speciation of C, N, S, Na, and Cl were determined |
| [123] | Size-segregated PM (0.05–18 µm) from Hong Kong | XPS | Particle surface chemistry (elements: F, C, O, N, S, Si, Ca, Na, and Mg; chemical states: C, O, N, and S) | -Size-resolved surface elemental composition and speciation of selected elements (C, N, and S) was presented |
| [122] | TSP from Guangzhou, China | XPS | Particle surface chemistry (elements: C, O, N, S, Si, Na, Ca, Cl, Fe, K, Al, and Cu; chemical states: C, O, N, and S) | -Elemental composition and speciation of C, O, S, and N were carried out -Surface chemistry was compared to bulk chemistry obtained using IC and elemental analyzer |
Publisher’s Note: MDPI stays neutral with regard to jurisdictional claims in published maps and institutional affiliations. |
© 2022 by the authors. Licensee MDPI, Basel, Switzerland. This article is an open access article distributed under the terms and conditions of the Creative Commons Attribution (CC BY) license (https://creativecommons.org/licenses/by/4.0/).
Share and Cite
Agibayeva, A.; Guney, M.; Karaca, F.; Kumisbek, A.; Kim, J.R.; Avcu, E. Analytical Methods for Physicochemical Characterization and Toxicity Assessment of Atmospheric Particulate Matter: A Review. Sustainability 2022, 14, 13481. https://doi.org/10.3390/su142013481
Agibayeva A, Guney M, Karaca F, Kumisbek A, Kim JR, Avcu E. Analytical Methods for Physicochemical Characterization and Toxicity Assessment of Atmospheric Particulate Matter: A Review. Sustainability. 2022; 14(20):13481. https://doi.org/10.3390/su142013481
Chicago/Turabian StyleAgibayeva, Akmaral, Mert Guney, Ferhat Karaca, Aiganym Kumisbek, Jong Ryeol Kim, and Egemen Avcu. 2022. "Analytical Methods for Physicochemical Characterization and Toxicity Assessment of Atmospheric Particulate Matter: A Review" Sustainability 14, no. 20: 13481. https://doi.org/10.3390/su142013481
APA StyleAgibayeva, A., Guney, M., Karaca, F., Kumisbek, A., Kim, J. R., & Avcu, E. (2022). Analytical Methods for Physicochemical Characterization and Toxicity Assessment of Atmospheric Particulate Matter: A Review. Sustainability, 14(20), 13481. https://doi.org/10.3390/su142013481


